Monitoring Activities of Daily Living Using UWB Radar Technology: A Contactless Approach


Abstract
1. Introduction
2. Related Work
2.1. Monitoring ADL
2.2. The Potential of UWB Radar Sensing
2.3. Architectural Challenges
3. Methodology
3.1. Participants
3.2. Experimental Apparatus
3.3. Experimental Setup
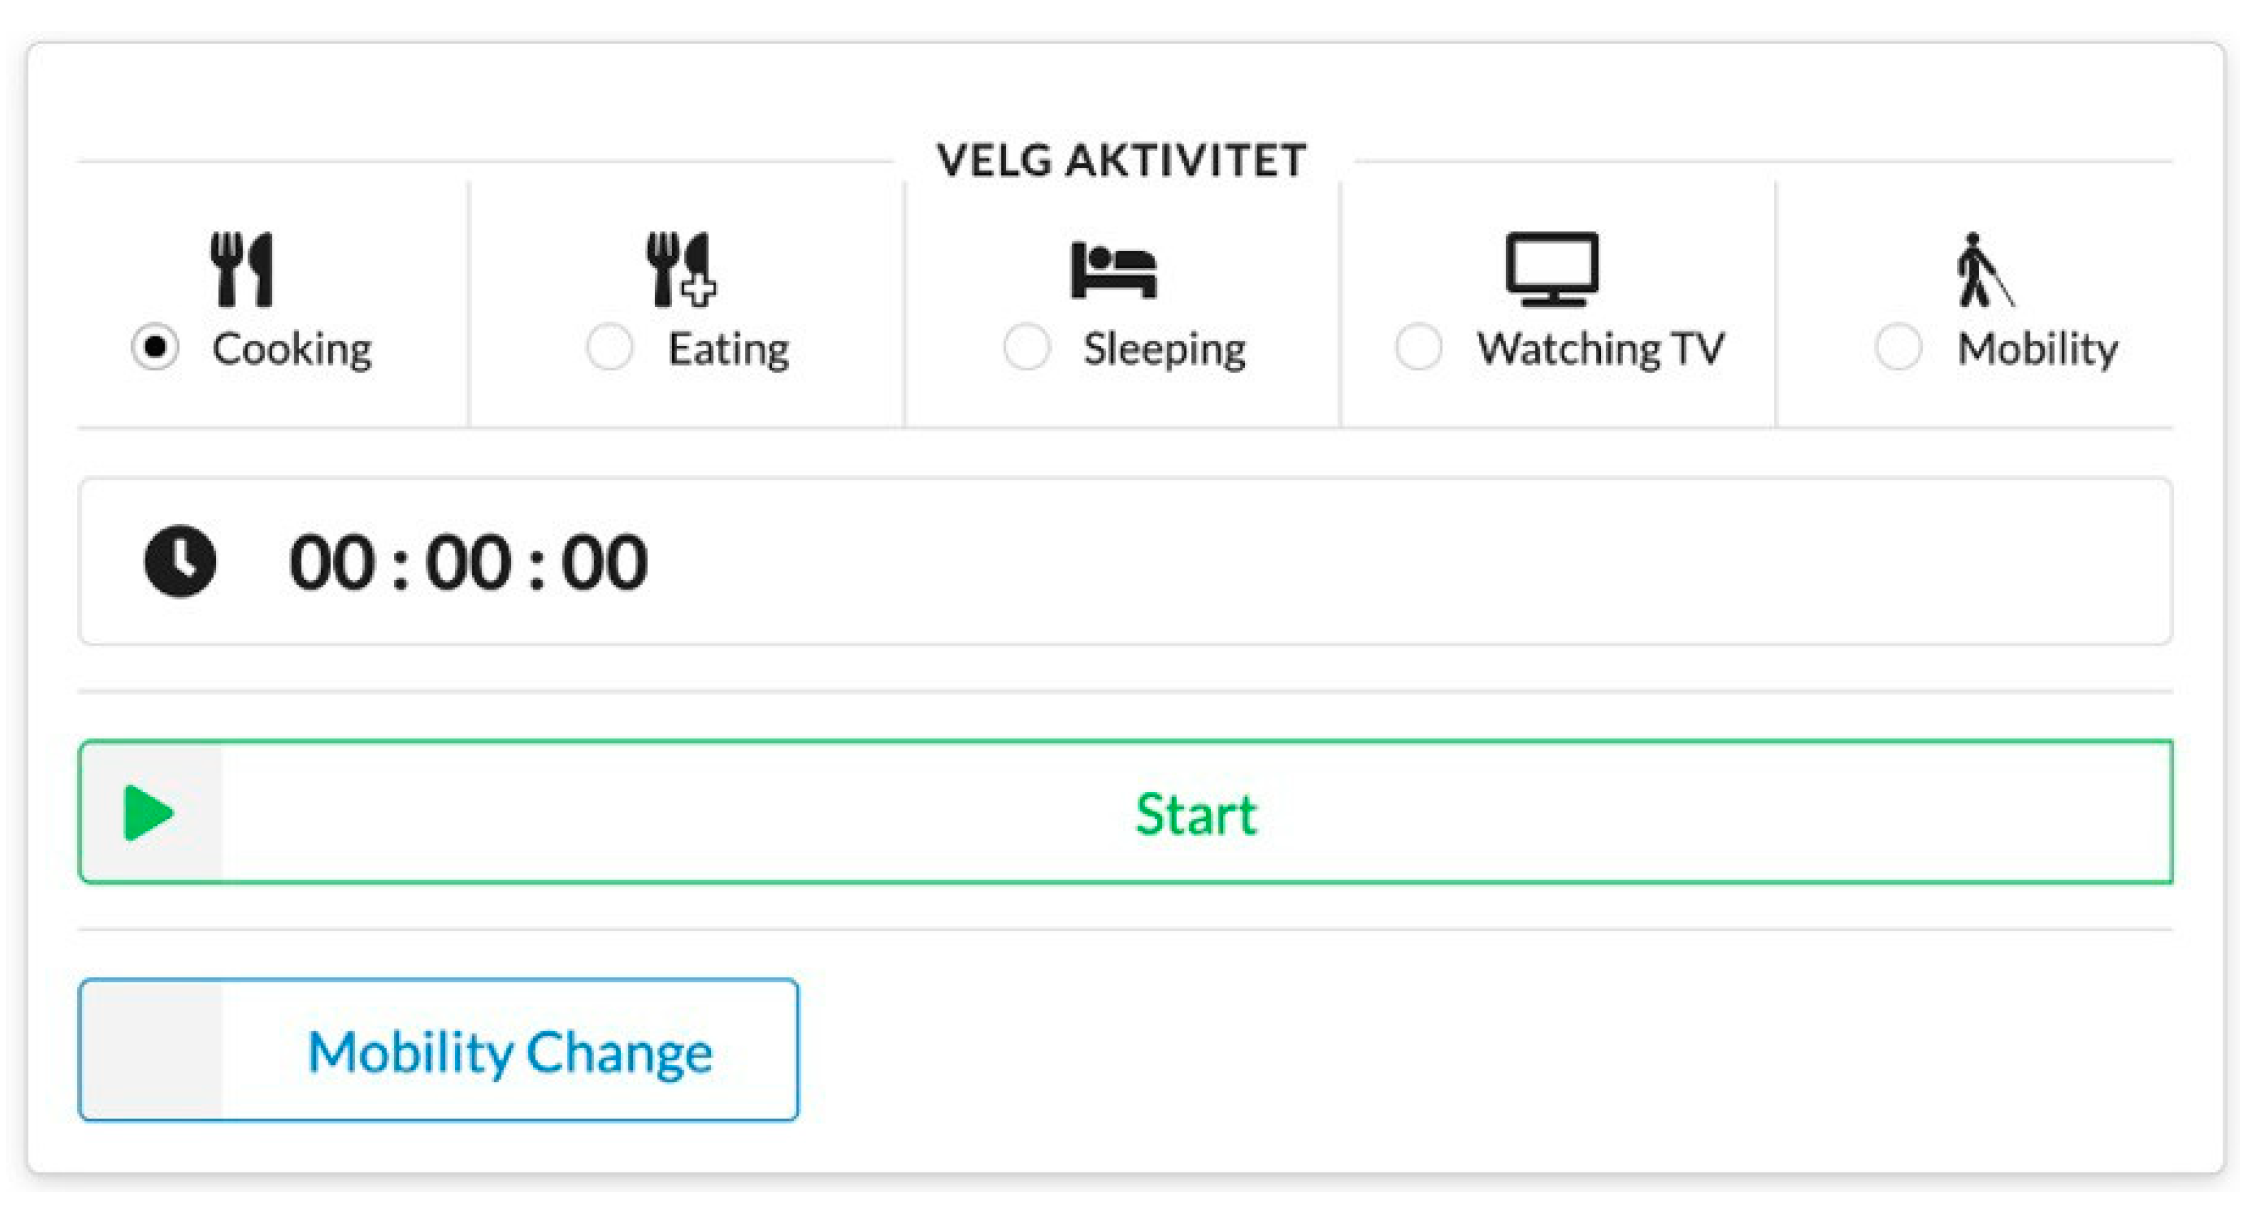
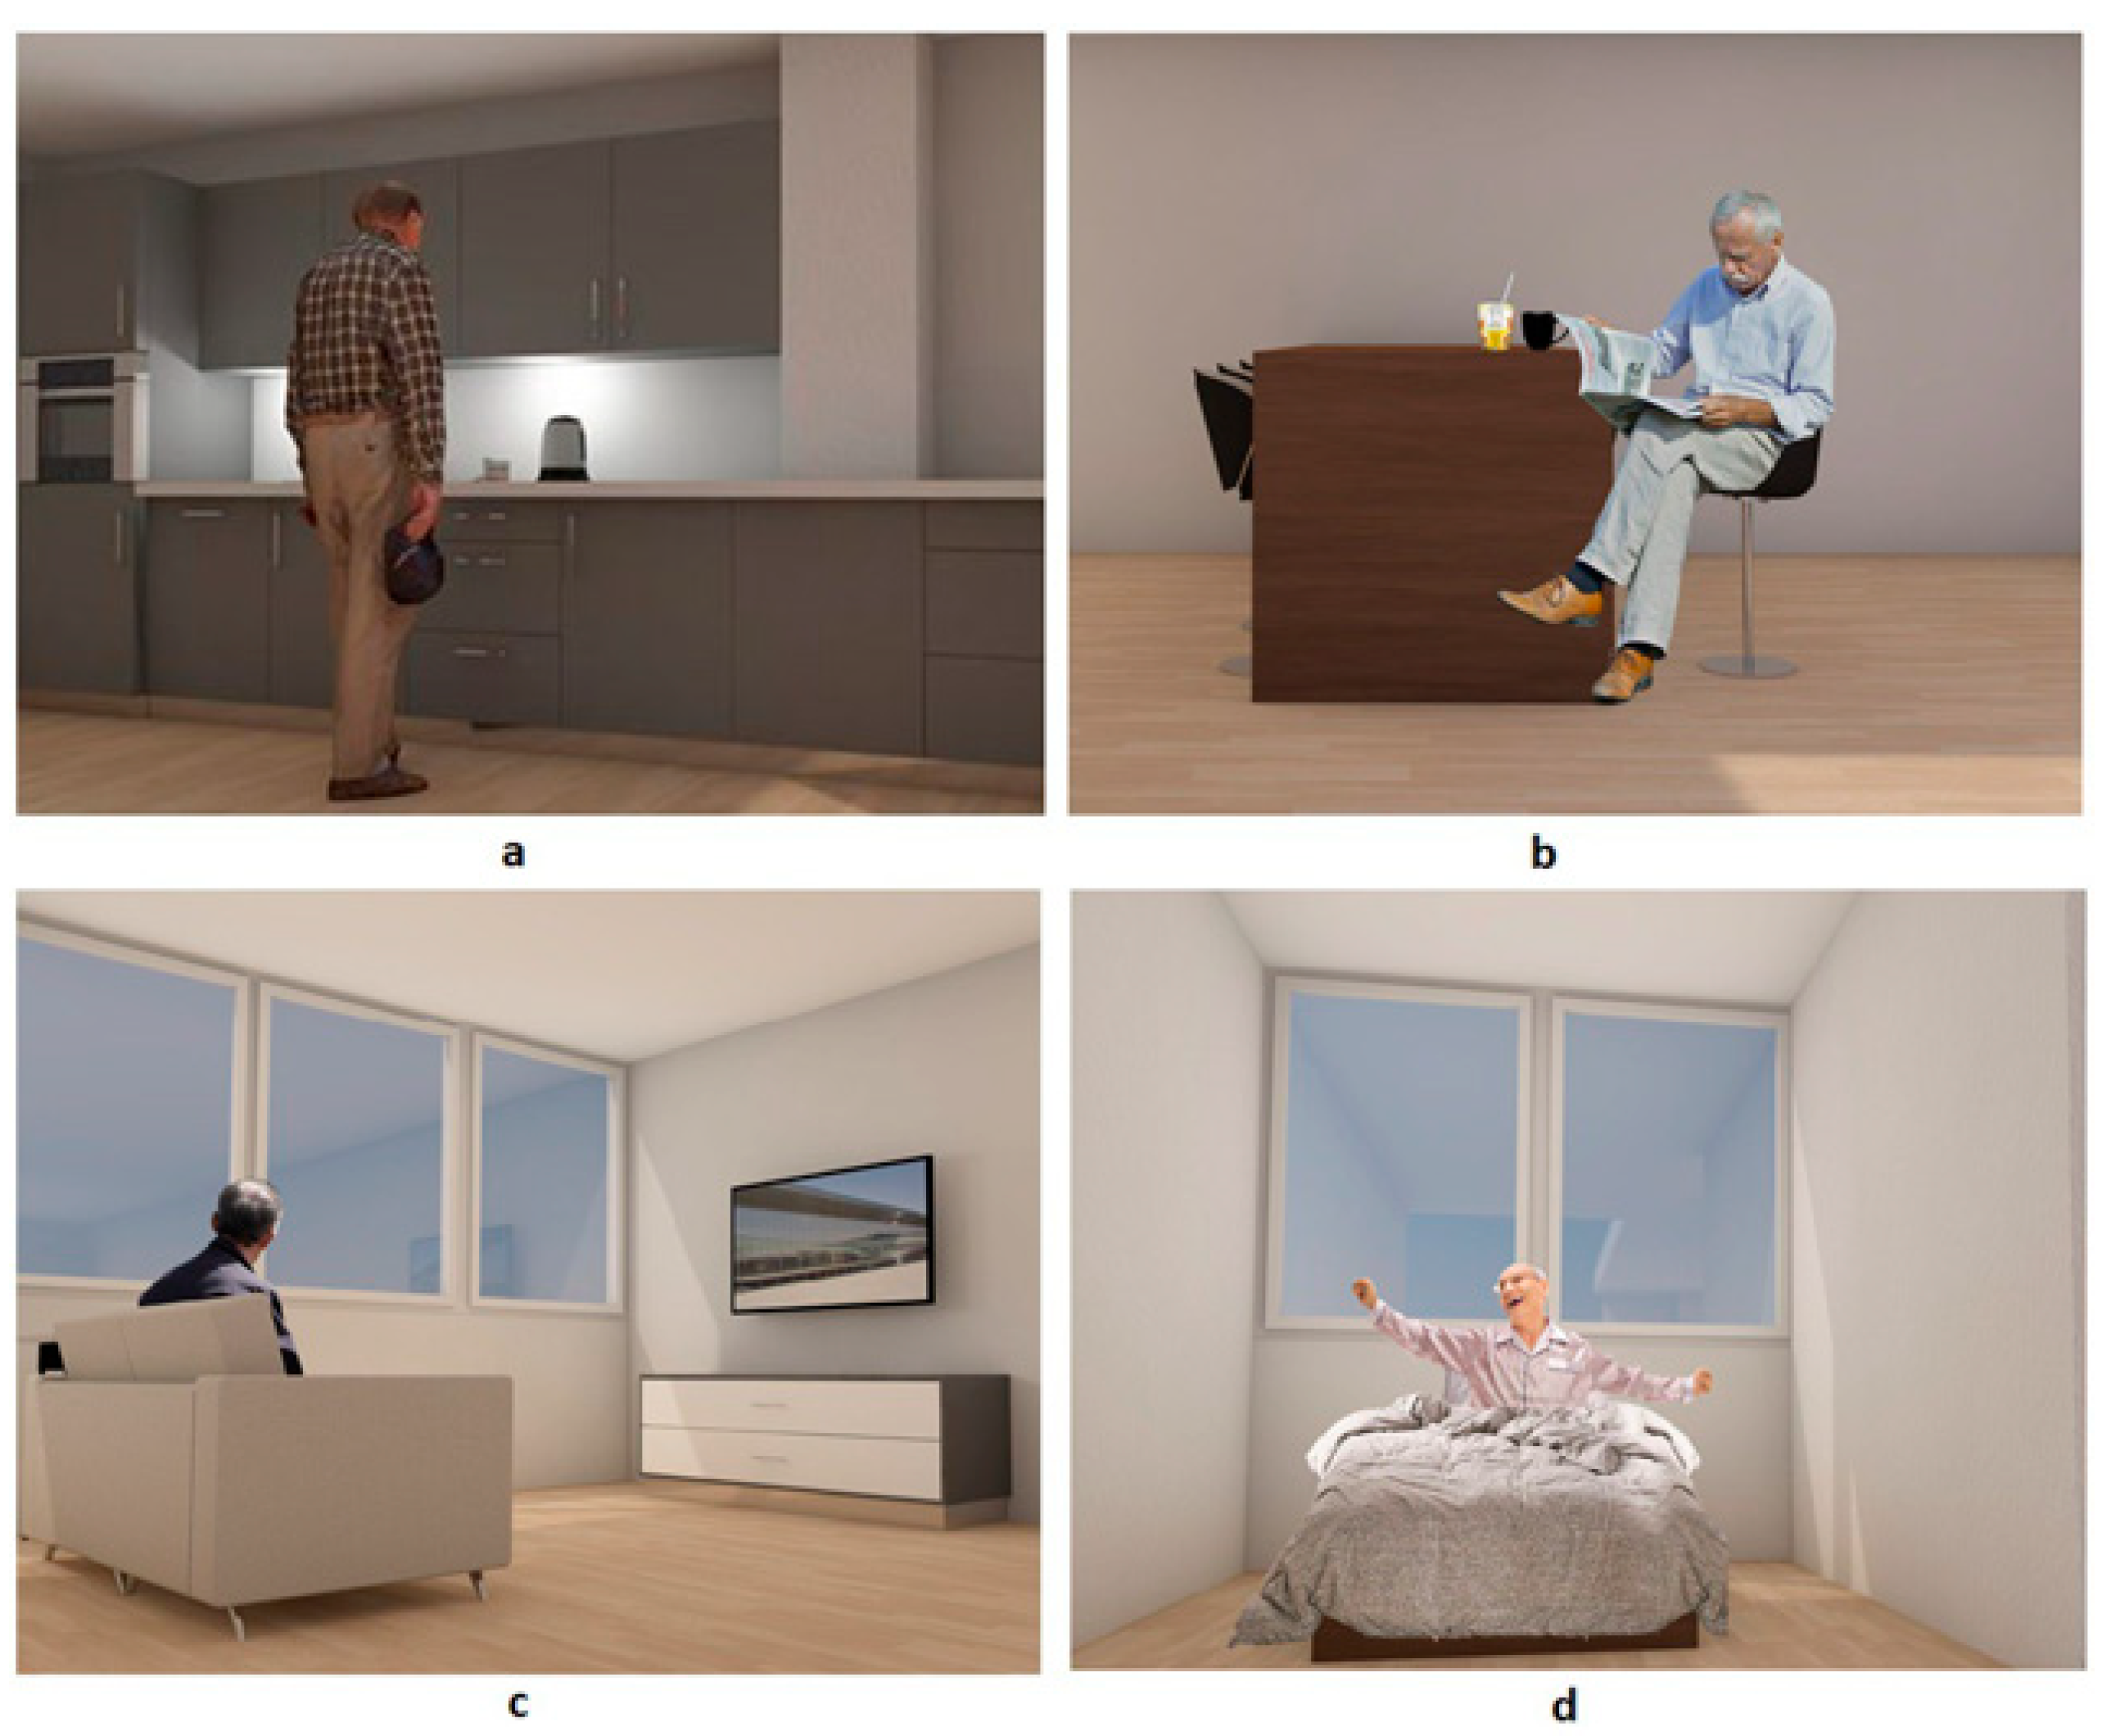
3.4. Scenarios
3.5. Procedure
4. Artifact Design
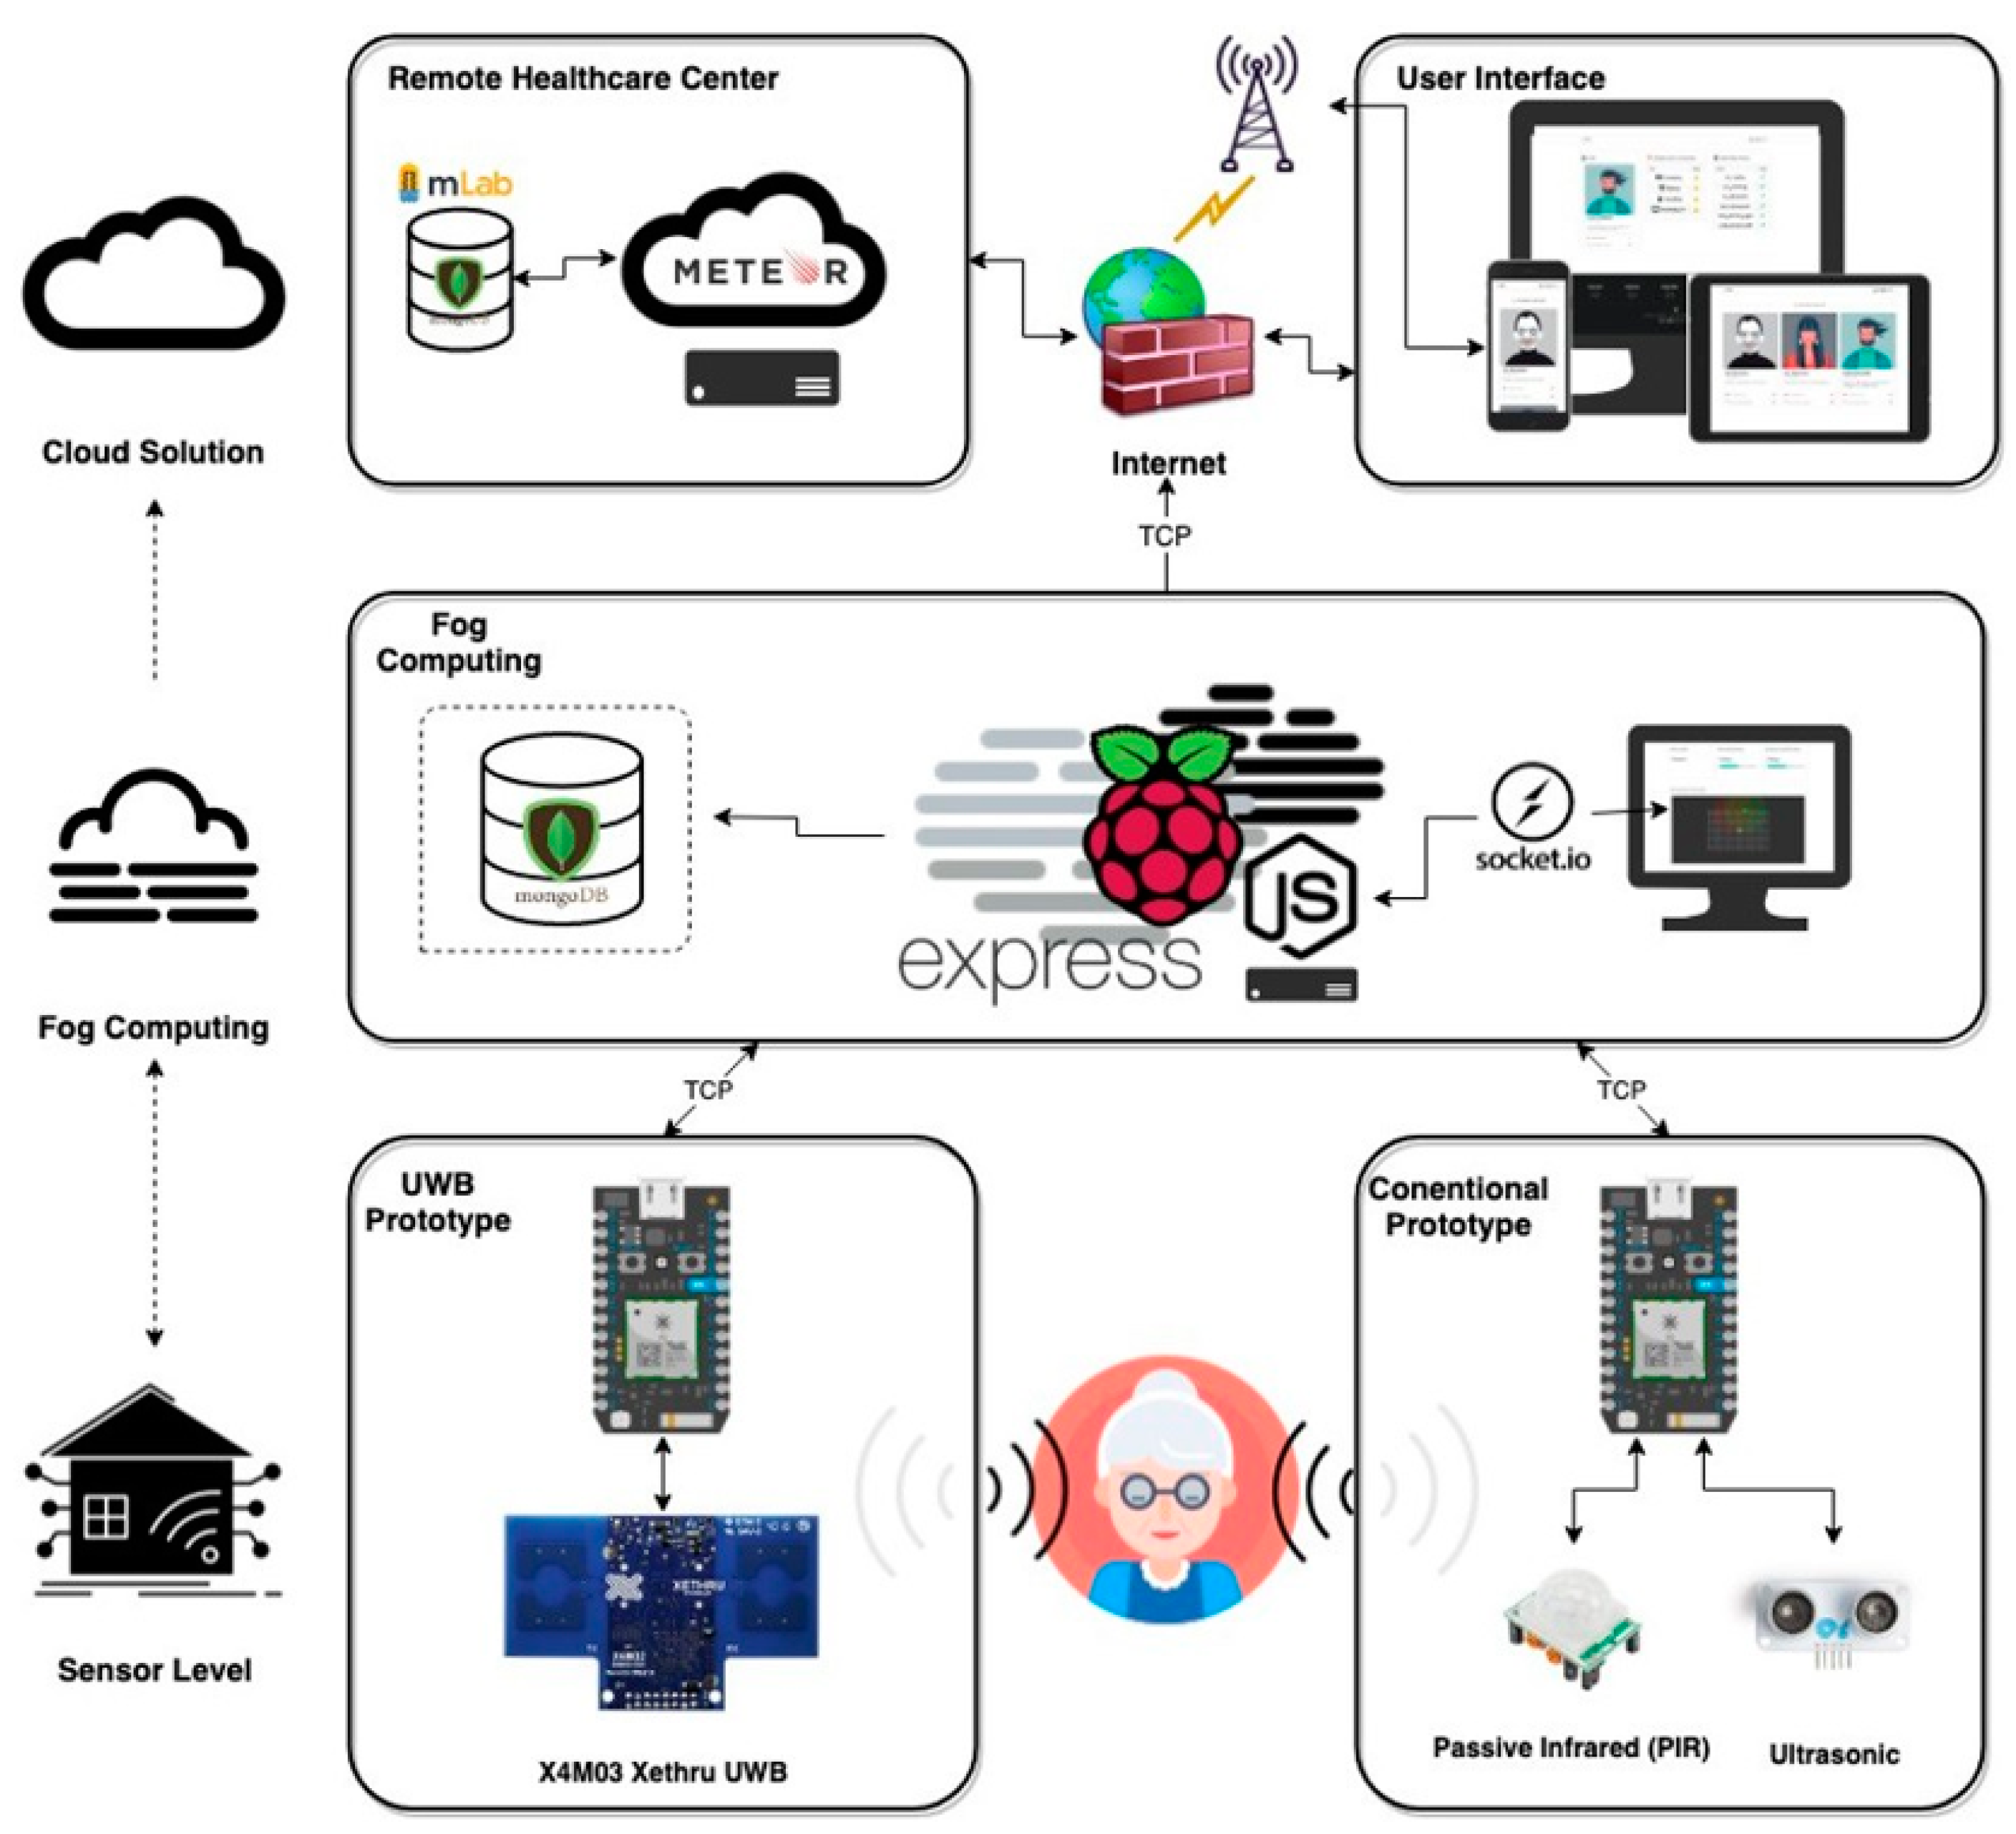
4.1. Architecture
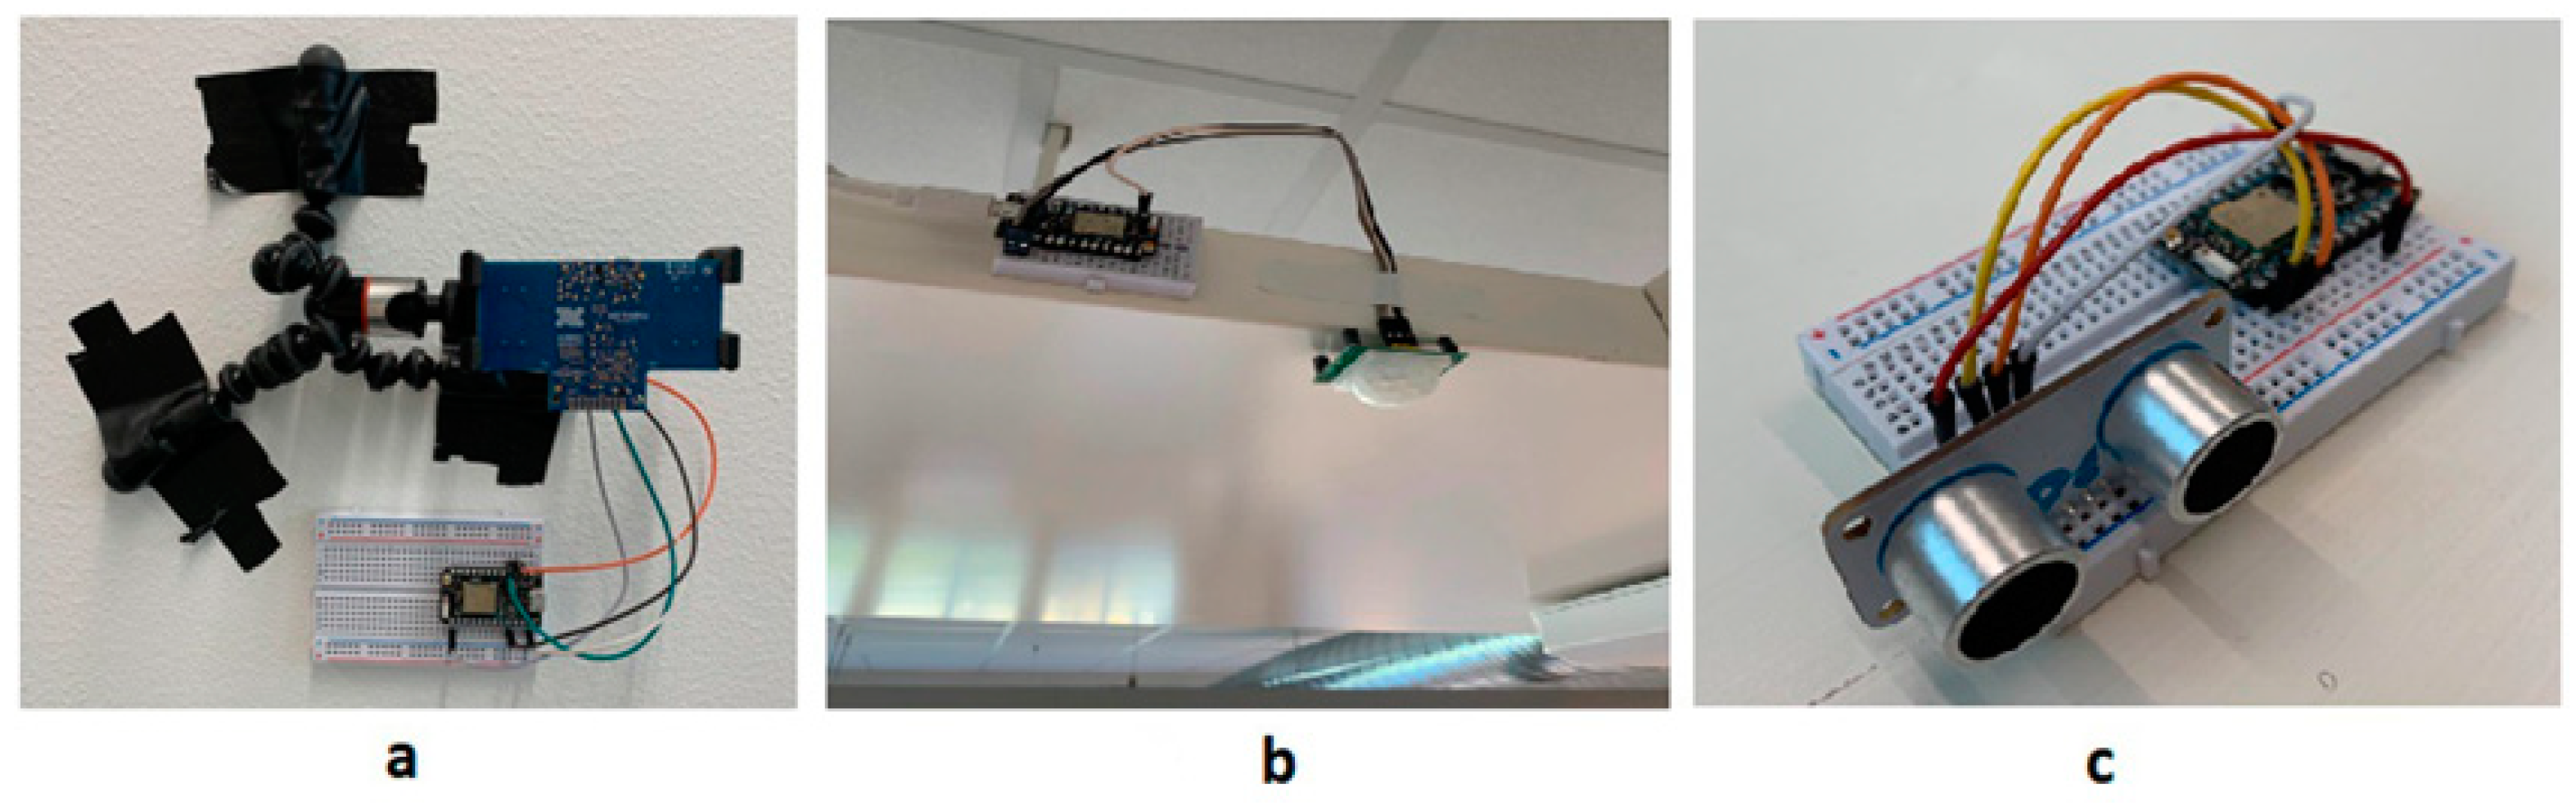
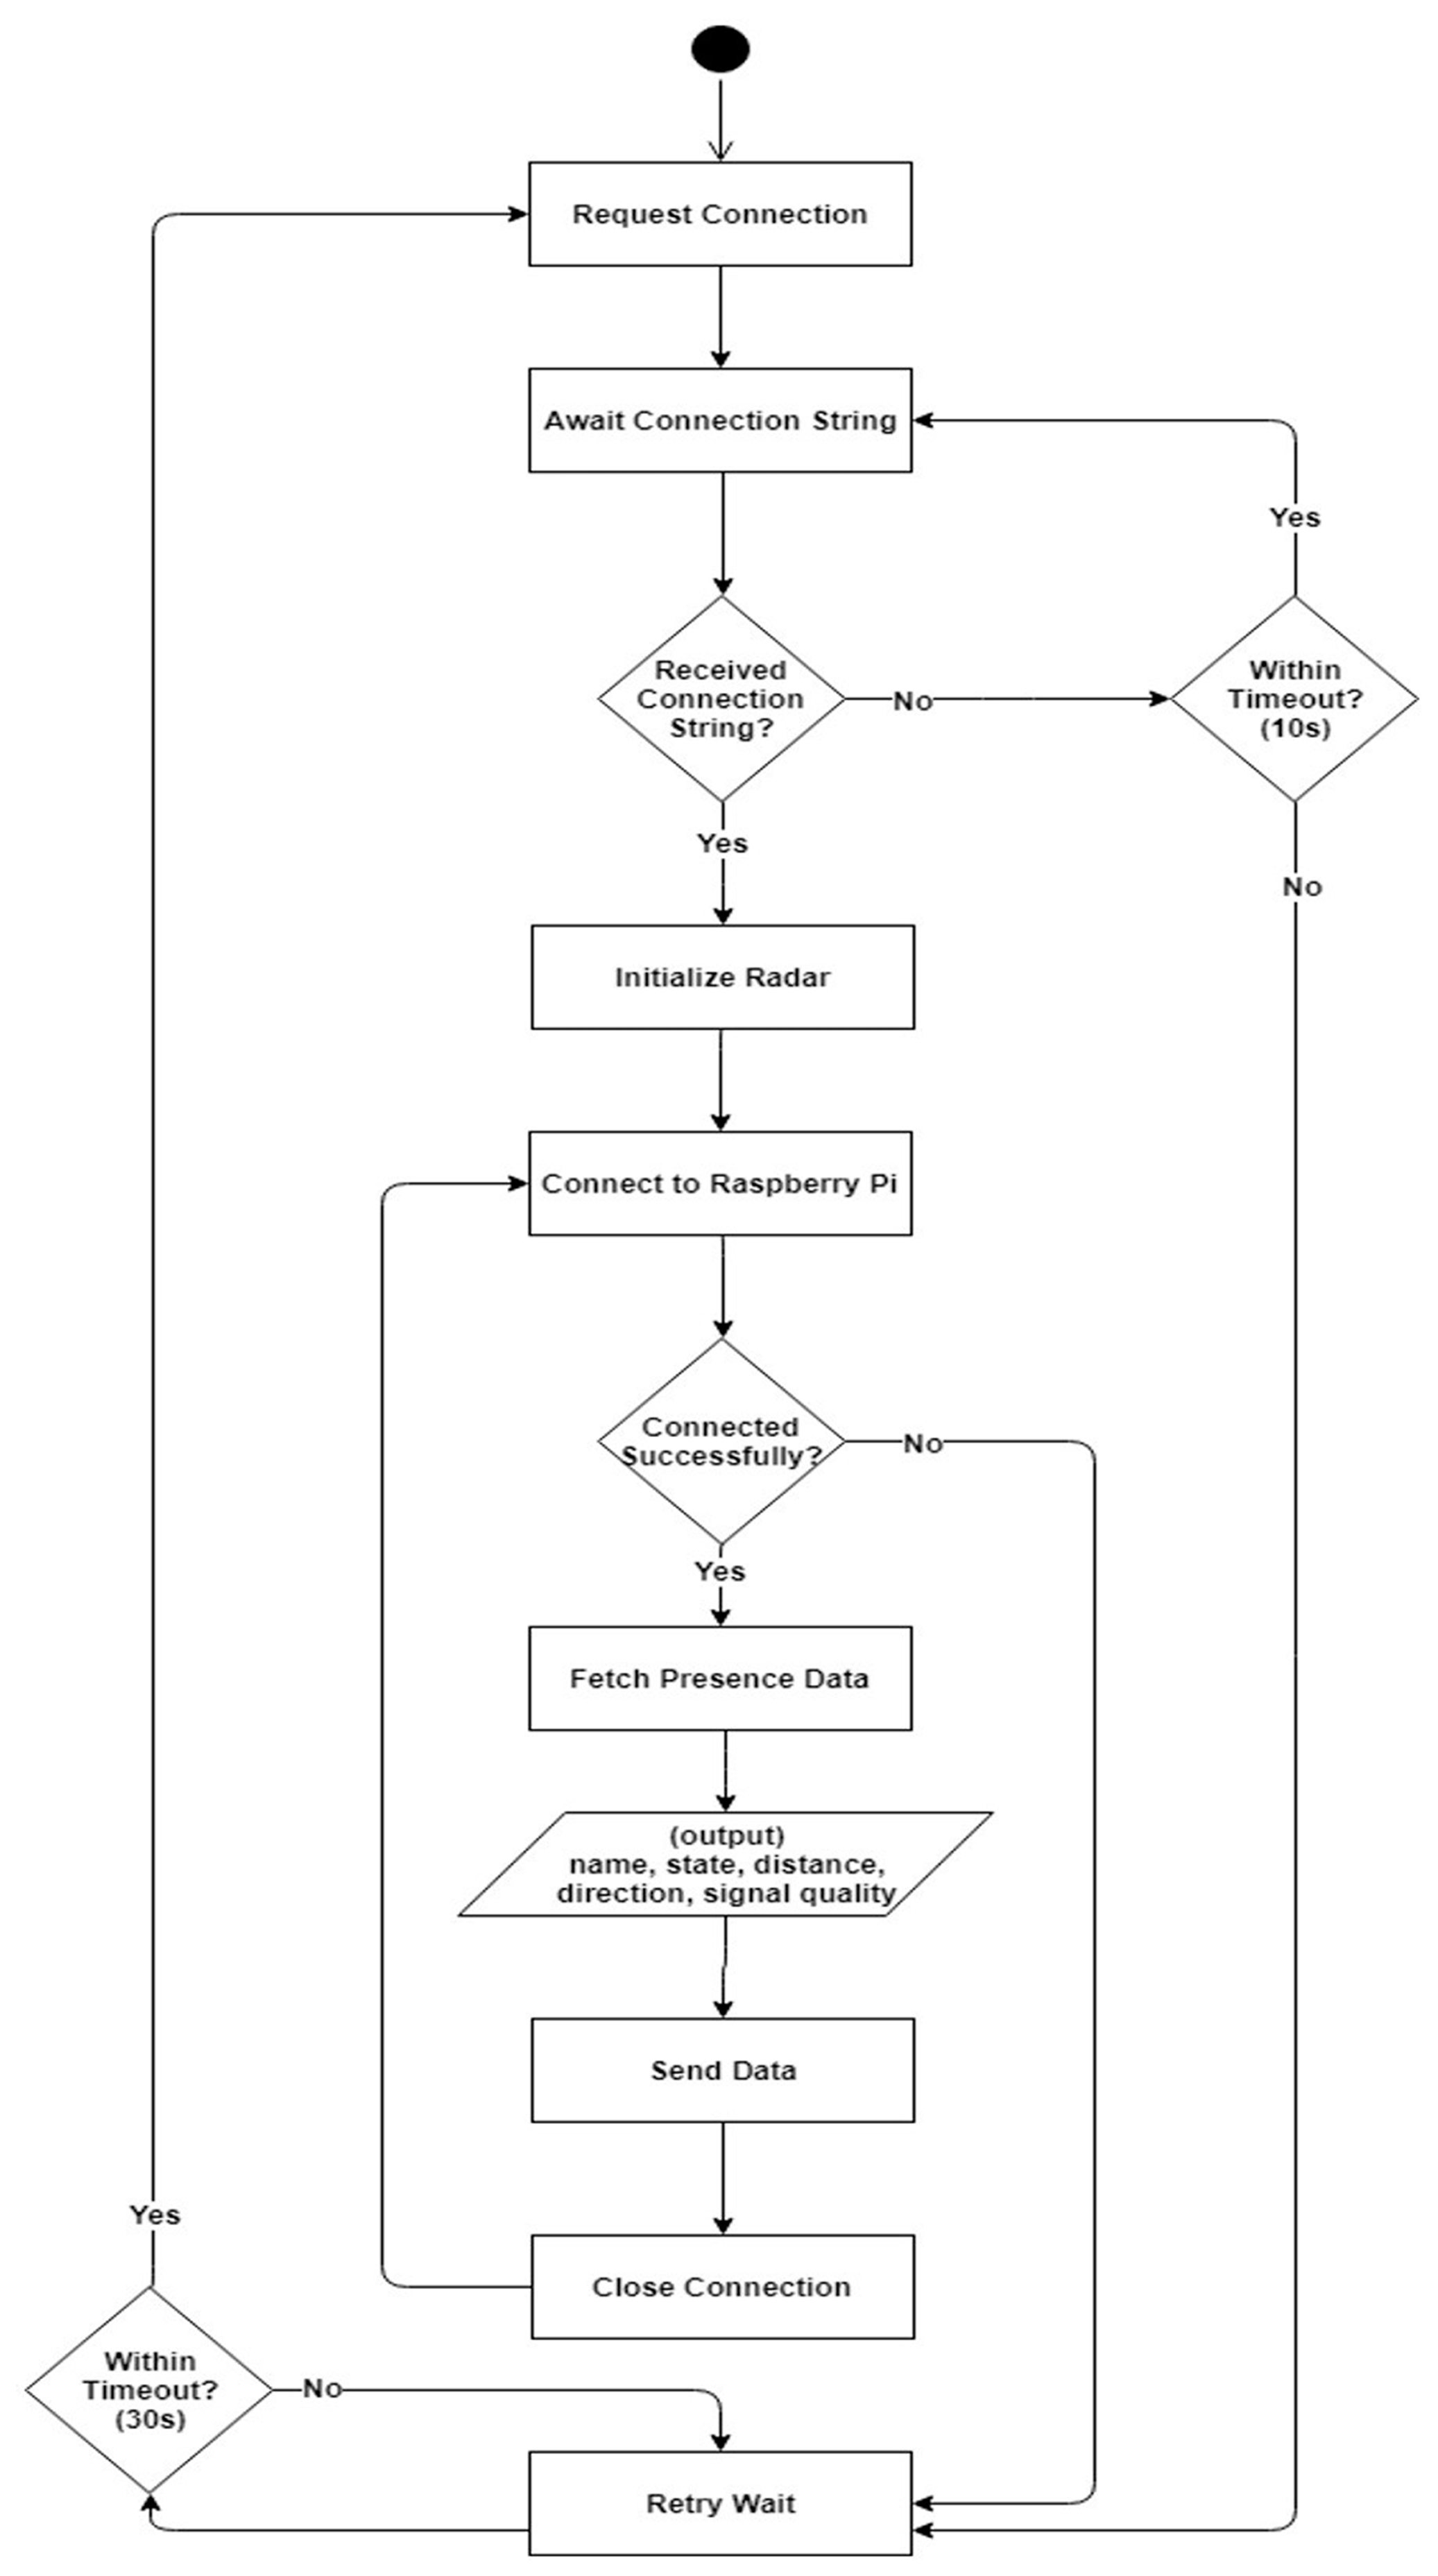
4.2. Sensor Level
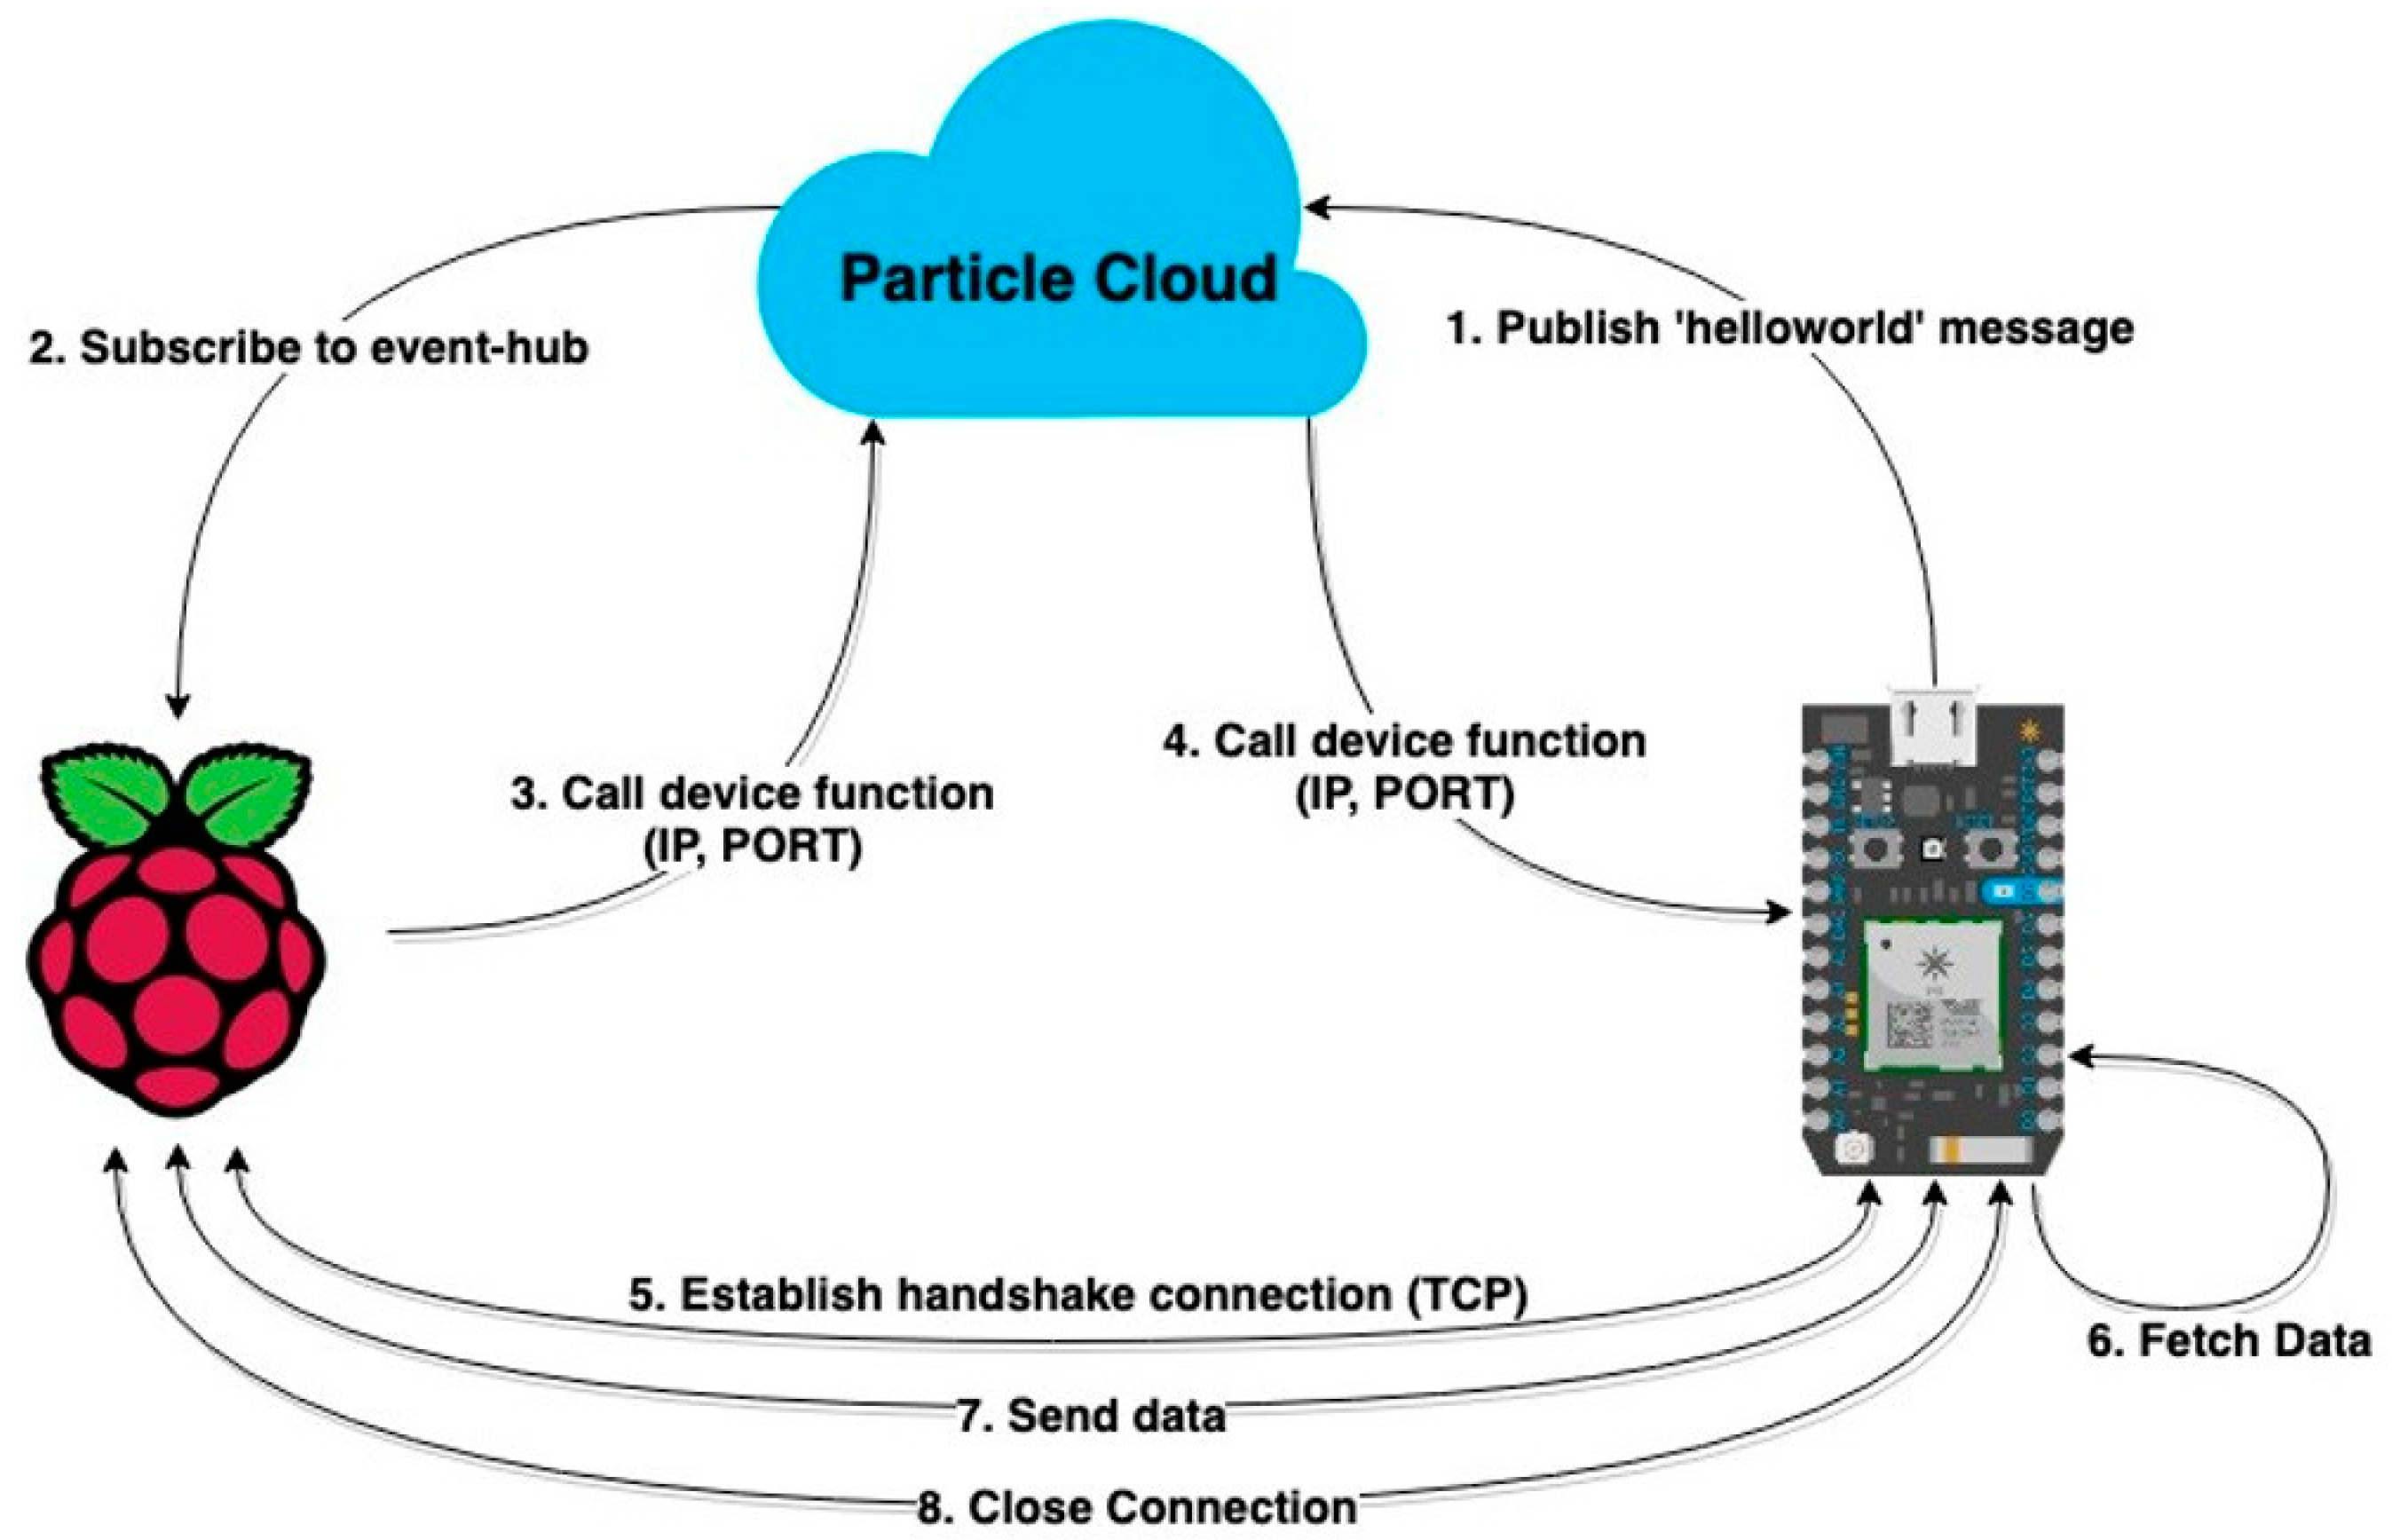
4.3. The Gateway
- <IP>:<Port>/api/event: receives JSON-encoded presence data over TCP.
- <IP>:<Port>/api/experiment: stores performed activities along with the start and stop timestamps.
- <IP>:<Port>/api/mobility: stores timestamp of movements during the mobility scenario.
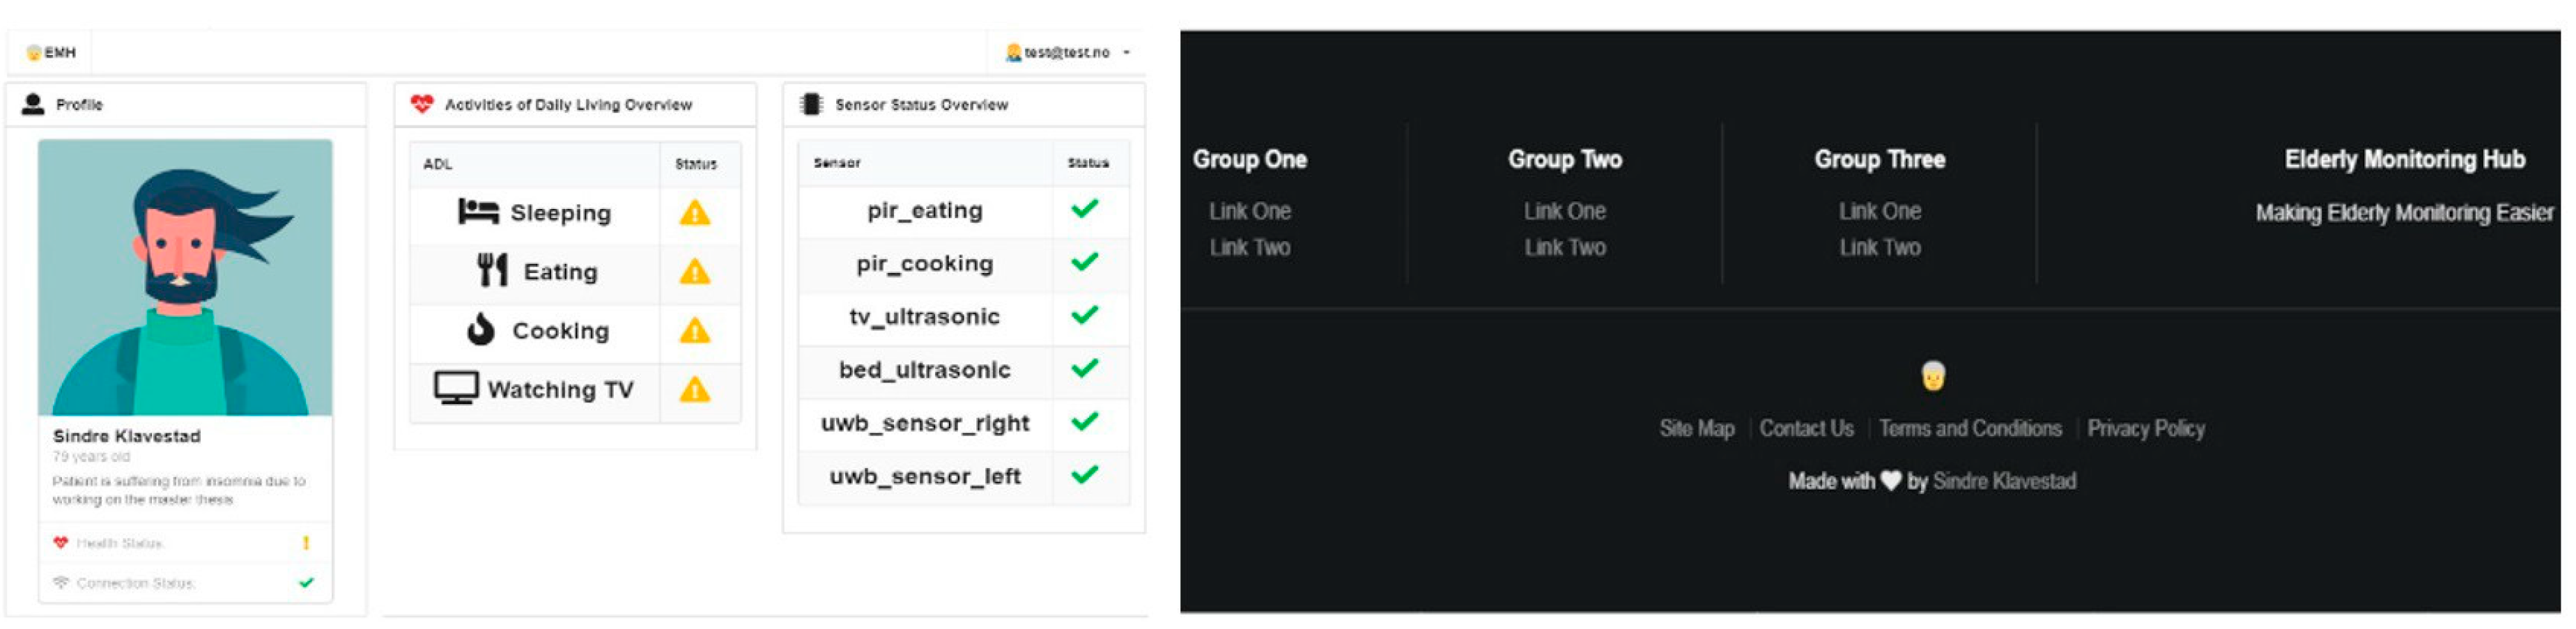
4.4. Integration
5. Results
- Accuracy indicates how often the classification model was able to predict the correct ADL. The accuracy (A) for each scenario is calculated as Ai = (TPi + Tni)/N, where TP and TN are true positive and true negative values, for each scenario (i), and the number of detections (N). The overall accuracy of each category of sensing prototype is ΣAi.
- Specificity, also known as true negative rate, indicates the ratio between when the activity was not conducted and when the activity was not predicted. The specificity (S) for each scenario (i) is determined as Si = TNi/(TNi + FPi), where TN and FP are true negative and false positive values, with total specificity ΣSi.
- Recall or sensitivity, also known as the true positive rate, is the ratio between when the activity was conducted and when the activity was predicted. The recall I for each scenario (i) is calculated as Ri = TPi/(TPi + FNi), where TP and FN are true positive and false negative values, and the total recall is ΣRi.
- The precision levels of the system indicate how often the correct daily activity was predicted. Precision (P) for each scenario is determined as Pi = TPi/(TPi + FPi), where TP and FP are true positive and false positive values, and the total precision is ΣPi.
- The error rate indicates how often the classification model predicted the wrong daily activity. The error (E) for each scenario is calculated as Ei = (FPi + FNi)/N, where FP and FN are false positive and false negative values, for each scenario (i), and the number of detections (N). The overall accuracy of the conventional sensing prototype is ΣEi.
6. Conclusions
Author Contributions
Funding
Acknowledgments
Conflicts of Interest
Abbreviations
| ADLs | Activities of Daily Living |
| AAL | Ambient Assisted Living |
| EMD | Empirical Mode Decomposition |
| IMF | Intrinsic Mode Functions |
| IoT | Internet of Things |
| KF | Kalman Filter |
| MDPI | Multidisciplinary Digital Publishing Institute |
| PCA | Principal Component Analysis |
| QoS | Quality of Service |
| SNR | Signal-to-noise Ratio |
| UWB | Ultra-Wide-Band |
References
- Calvaresi, D.; Cesarini, D.; Sernani, P.; Marinoni, M.; Dragoni, A.F.; Sturm, A. Exploring the ambient assisted living domain: A systematic review. J. Ambient Intell. Humaniz. Comput. 2017, 8, 239–257. [Google Scholar] [CrossRef]
- Giannakouris, K. Ageing characterises the demographic perspectives of the European societies. Stat. Focus 2008, 72, 2008. [Google Scholar]
- Muszyn´ska, M.M.; Rau, R. The old-age healthy dependency ratio in Europe. J. Popul. Ageing 2012, 5, 151–162. [Google Scholar] [CrossRef]
- Kon, B.; Lam, A.; Chan, J. Evolution of smart homes for the elderly. In Proceedings of the 26th International Conference on World Wide Web Companion; International World Wide Web Conferences Steering Committee: Geneva, Switzerland, 2017; pp. 1095–1101. [Google Scholar]
- Diraco, G.; Leone, A.; Siciliano, P. A radar-based smart sensor for unobtrusive elderly monitoring in ambient assisted living applications. Biosensors 2017, 7, 55. [Google Scholar] [CrossRef] [PubMed]
- Farber, N.; Shinkle, D.; Lynott, J.; Fox-Grage, W.; Harrell, R. Aging in Place: A State Survey of Livability Policies and Practices; National Conference of State Legislatures and AARP Public Policy Institute: Denver, CO, USA, 2011. [Google Scholar]
- Vassli, L.T.; Farshchian, B.A. Acceptance of health-related ICT among elderly people living in the community: A systematic review of qualitative evidence. Int. J. Hum. Comput. Interact. 2018, 34, 99–116. [Google Scholar] [CrossRef]
- Narins, B. The Gale Encyclopedia of Nursing and Allied Health; Gale, Cengage Learning: Boston, MA, USA, 2013. [Google Scholar]
- Liu, L.; Stroulia, E.; Nikolaidis, I.; Miguel-Cruz, A.; Rincon, A.R. Smart homes and home health monitoring technologies for older adults: A systematic review. Int. J. Med. Inform. 2016, 91, 44–59. [Google Scholar] [CrossRef]
- Debes, C.; Merentitis, A.; Sukhanov, S.; Niessen, M.; Frangiadakis, N.; Bauer, A. Monitoring activities of daily living in smart homes: Understanding human behavior. IEEE Signal Process. Mag. 2016, 33, 81–94. [Google Scholar] [CrossRef]
- Shit, R.C.; Sharma, S.; Puthal, D.; Zomaya, A.Y. Location of Things (LoT): A review and taxonomy of sensors localization in IoT infrastructure. IEEE Commun. Surv. Tutor. 2018, 20, 2028–2061. [Google Scholar] [CrossRef]
- Plikynas, D.; Žvironas, A.; Budrionis, A.; Gudauskis, M. Indoor Navigation Systems for Visually Impaired Persons: Mapping the Features of Existing Technologies to User Needs. Sensors 2020, 20, 636. [Google Scholar] [CrossRef] [PubMed]
- Ramtohul, A.; Khedo, K.K. Mobile Positioning Techniques and Systems: A Comprehensive Review. Mob. Inf. Syst. 2020, 2020. [Google Scholar] [CrossRef]
- Baird, Z.; Gunasekara, I.; Bolic, M.; Rajan, S. Principal component analysis-based occupancy detection with ultra wideband radar. In Proceedings of the 2017 IEEE 60th International Midwest Symposium on Circuits and Systems (MWSCAS), Boston, MA, USA, 6–9 August 2017; IEEE: Piscataway, NJ, USA, 2017; pp. 1573–1576. [Google Scholar]
- Rana, S.P.; Dey, M.; Ghavami, M.; Dudley, S. Signature inspired home environments monitoring system using ir-uwb technology. Sensors 2019, 19, 385. [Google Scholar] [CrossRef]
- Alarifi, A.; Al-Salman, A.; Alsaleh, M.; Alnafessah, A.; Al-Hadhrami, S.; Al-Ammar, M.A.; Al-Khalifa, H.S. Ultra wideband indoor positioning technologies: Analysis and recent advances. Sensors 2016, 16, 707. [Google Scholar] [CrossRef]
- Bouchard, K.; Maitre, J.; Bertuglia, C.; Gaboury, S. Activity Recognition in Smart Homes using UWB Radars. Procedia Comput. Sci. 2020, 170, 10–17. [Google Scholar] [CrossRef]
- Suryadevara, N.K.; Mukhopadhyay, S.C. Wireless sensor network based home monitoring system for wellness determination of elderly. IEEE Sens. J. 2012, 12, 1965–1972. [Google Scholar] [CrossRef]
- Virone, G.; Alwan, M.; Dalal, S.; Kell, S.W.; Turner, B.; Stankovic, J.A.; Felder, R. Behavioral patterns of older adults in assisted living. IEEE Trans. Inf. Technol. Biomed. 2008, 12, 387–398. [Google Scholar] [CrossRef] [PubMed]
- Dawadi, P.N.; Cook, D.J.; Schmitter-Edgecombe, M. Automated cognitive health assessment from smart home-based behavior data. IEEE J. Biomed. Health Inform. 2015, 20, 1188–1194. [Google Scholar] [CrossRef]
- Khan, F.; Choi, J.W.; Cho, S.H. Vital sign monitoring of a non-stationary human through IR-UWB radar. In Proceedings of the 2014 4th IEEE International Conference on Network Infrastructure and Digital Content, Beijing, China, 19–21 September 2014; IEEE: Piscataway, NJ, USA, 2014; pp. 511–514. [Google Scholar]
- Nguyen, V.H.; Pyun, J.Y. Location detection and tracking of moving targets by a 2D IR-UWB radar system. Sensors 2015, 15, 6740–6762. [Google Scholar] [CrossRef] [PubMed]
- Mokhtari, G.; Zhang, Q.; Hargrave, C.; Ralston, J.C. Non-wearable UWB sensor for human identification in smart home. IEEE Sens. J. 2017, 17, 3332–3340. [Google Scholar] [CrossRef]
- Gubbi, J.; Buyya, R.; Marusic, S.; Palaniswami, M. Internet of Things (IoT): A vision, architectural elements, and future directions. Future Gener. Comput. Syst. 2013, 29, 1645–1660. [Google Scholar] [CrossRef]
- Stojkoska, B.L.R.; Trivodaliev, K.V. A review of Internet of Things for smart home: Challenges and solutions. J. Clean. Prod. 2017, 140, 1454–1464. [Google Scholar] [CrossRef]
- Aazam, M.; Huh, E.N. Fog computing and smart gateway based communication for cloud of things. In Proceedings of the 2014 International Conference on Future Internet of Things and Cloud, Barcelona, Spain, 27–29 August 2014; IEEE: Piscataway, NJ, USA, 2014; pp. 464–470. [Google Scholar]
- Xethru. X4M300: Presence Sensor. Available online: https://www.xethru.com/x4m300-presence-sensor.html (accessed on 23 April 2019).
- Xethru. Xethru-Arduino. Available online: https://github.com/xethru/XeThru-Arduino-Examples (accessed on 23 April 2019).
- Particle.io. Hardware to Bring Your Device Online. Available online: https://www.particle.io/what-is-particle (accessed on 23 April 2019).
- Rahmani, A.M.; Gia, T.N.; Negash, B.; Anzanpour, A.; Azimi, I.; Jiang, M.; Liljeberg, P. Exploiting smart e-Health gateways at the edge of healthcare Internet-of-Things: A fog computing approach. Future Gener. Comput. Syst. 2018, 78, 641–658. [Google Scholar] [CrossRef]
- Atzori, L.; Iera, A.; Morabito, G. The internet of things: A survey. Comput. Netw. 2010, 54, 2787–2805. [Google Scholar] [CrossRef]
- Socket.io. Socket.io Is Here. Available online: https://socket.io/ (accessed on 23 April 2019).
- Meteor. What Is Meteor? Available online: https://guide.meteor.com/ (accessed on 23 April 2019).
- Heroku. What Is Heroku? Available online: https://www.heroku.com/what (accessed on 23 April 2019).
- mLab. Database-as-a-Service for MongoDB. Available online: https://mlab.com/company/ (accessed on 23 April 2019).
- Cordova. Supported Platforms. Available online: https://cordova.apache.org/ (accessed on 23 April 2019).


| Criteria | Ultrasound | IR Sensor | Laser Sensor | BLE | NFC | Passive RFID |
|---|---|---|---|---|---|---|
| Range | 16 m | 6 m | 2200 m | 100 m | 1 m | 12 m |
| Resolution | High | Variable | Very High | Low | High | High |
| Linearity | Linear | Non–linear | Linear | Non–linear | Linear | Non–linear |
| Size | Small | Small | Moderate | Small | Small | Small |
| Mobility | Portable | Portable | Non–portable | Portable | Portable | Portable |
| Weight | Light | Light | Heavy | Light | Light | Light |
| Participant | Ultrawideband | Conventional | ||||||
|---|---|---|---|---|---|---|---|---|
| Cook | Eat | Rest | Sleep | Cook | Eat | Rest | Sleep | |
| 1 | 25 | 29 | 24 | 22 | 27 | 13 | 32 | 33 |
| 2 | 27 | 31 | 12 | 11 | 28 | 19 | 11 | 23 |
| 3 | 22 | 32 | 27 | 12 | 30 | 7 | 33 | 1 |
| 4 | 19 | 31 | 26 | 10 | 31 | 11 | 22 | 0 |
| 5 | 5 | 32 | 27 | 8 | 34 | 1 | 34 | 1 |
| 6 | 28 | 32 | 24 | 8 | 15 | 3 | 25 | 4 |
| 7 | 24 | 32 | 27 | 1 | 25 | 8 | 35 | 35 |
| 8 | 28 | 32 | 29 | 7 | 28 | 5 | 29 | 4 |
| 9 | 23 | 33 | 20 | 3 | 25 | 14 | 23 | 33 |
| Min | 5 | 29 | 12 | 1 | 15 | 1 | 11 | 0 |
| Max | 28 | 33 | 29 | 22 | 34 | 19 | 35 | 35 |
| Median | 24 | 32 | 26 | 8 | 28 | 8 | 29 | 4 |
| Average | 22 | 32 | 24 | 9 | 27 | 9 | 27 | 15 |
| SD | 7.14 | 1.13 | 5.20 | 6.01 | 5.34 | 5.77 | 7.74 | 15.70 |
| Total | 201 | 284 | 216 | 82 | 243 | 81 | 244 | 134 |
| Ultra-Wide Band | Conventional | |
|---|---|---|
| Accuracy | 97.7% | 99.8% |
| Specificity | 99.9% | 99.9% |
| Recall | 97.6% | 99.8 |
| Precision | 99.7% | 99.8% |
| Error Rate | >1% | >1% |
| Detection Frequency | 100/108 | 94/108 |
| Initial Detection Time | 15.95 s | 21.81 s |
| Mobility | 18/18 | 16/18 |
| Participant | Ultrawideband | Conventional | ||||||
|---|---|---|---|---|---|---|---|---|
| Cook | Eat | Rest | Sleep | Cook | Eat | Rest | Sleep | |
| 1 | 10.53 | 11.71 | 23.87 | 29.67 | 12.14 | 31.84 | 12.96 | 11.08 |
| 2 | 15.35 | 10.34 | 40.60 | 39.96 | 6.29 | 11.75 | 10.88 | 14.95 |
| 3 | 6.40 | 8.40 | 24.64 | 39.98 | 6.87 | 26.81 | 9.95 | 139.79 |
| 4 | 6.49 | 7.85 | 23.38 | 80.49 | 9.14 | 9.14 | 14.76 | null |
| 5 | 7.43 | 7.27 | 21.18 | 46.55 | 6.71 | 97.03 | 5.40 | 59.64 |
| 6 | 25.03 | 5.86 | 42.94 | 27.95 | 13.03 | 27.70 | 15.60 | 55.31 |
| 7 | 4.83 | 4.35 | 30.94 | 34.19 | 7.85 | 27.96 | 4.99 | 4.89 |
| 8 | 1.79 | 5.69 | 17.04 | 66.61 | 5.88 | 8.95 | 4.48 | 7.72 |
| 9 | 24.43 | 3.66 | 22.50 | 34.93 | 6.02 | 42.82 | 10.93 | 6.50 |
| Min | 1.79 | 3.66 | 17.04 | 27.95 | 5.88 | 8.95 | 4.48 | 4.89 |
| Max | 25.03 | 11.71 | 42.94 | 80.49 | 13.03 | 97.03 | 15.60 | 139.79 |
| Median | 7.43 | 7.27 | 23.87 | 39.96 | 6.87 | 27.70 | 10.88 | 13.02 |
| Average | 11.36 | 7.24 | 27.45 | 44.48 | 8.21 | 31.56 | 9.99 | 37.49 |
| SD | 8.46 | 2.66 | 8.91 | 17.75 | 2.69 | 27.09 | 4.20 | 46.89 |
Publisher’s Note: MDPI stays neutral with regard to jurisdictional claims in published maps and institutional affiliations. |
© 2020 by the authors. Licensee MDPI, Basel, Switzerland. This article is an open access article distributed under the terms and conditions of the Creative Commons Attribution (CC BY) license (http://creativecommons.org/licenses/by/4.0/).
Share and Cite
Klavestad, S.; Assres, G.; Fagernes, S.; Grønli, T.-M. Monitoring Activities of Daily Living Using UWB Radar Technology: A Contactless Approach. IoT 2020, 1, 320-336. https://doi.org/10.3390/iot1020019
Klavestad S, Assres G, Fagernes S, Grønli T-M. Monitoring Activities of Daily Living Using UWB Radar Technology: A Contactless Approach. IoT. 2020; 1(2):320-336. https://doi.org/10.3390/iot1020019
Chicago/Turabian StyleKlavestad, Sindre, Gebremariam Assres, Siri Fagernes, and Tor-Morten Grønli. 2020. "Monitoring Activities of Daily Living Using UWB Radar Technology: A Contactless Approach" IoT 1, no. 2: 320-336. https://doi.org/10.3390/iot1020019
APA StyleKlavestad, S., Assres, G., Fagernes, S., & Grønli, T.-M. (2020). Monitoring Activities of Daily Living Using UWB Radar Technology: A Contactless Approach. IoT, 1(2), 320-336. https://doi.org/10.3390/iot1020019