In 2008, less than 4% of the electricity meters in the world were smart meters. By 2012, the percentage had grown to over 18% and it is expected to rise to 55% by the end of 2020, which is an estimated 800 million in total [
5]. This advanced IoT network of smart meters provides a novel gateway into the home, opening up emerging areas of innovative research including human activity profiling, home automation, load management, Non-Intrusive Load Monitoring (NILM), appliance efficiency monitoring, and energy theft [
12].
2.1. Smart Meter Data
Smart meters, like many other IoT sensor networks, generate large amounts of data that is often fragmented and complex. In this section, a discussion on smart meter data is put forward using the Irish Commission for Energy Regulation (CER) Gas Smart Meter dataset as an example [
13]. The dataset is granular and has the advantage of being accompanied by a post- and pre-evaluation survey of the consumers during the smart meter rollout trial. In result, the consumption readings can be filtered based on categories such as social class, age, gender, opinion on smart meters, cooker type, etc. The social class definitions are presented in
Table 1. The information displays the official governmental guidance for outlining which class the occupants belong to, founded on the income of the property owner. There are six classes within the dataset, including an
R class, referring to participants who chose to refuse to provide an answer (other existing social science datasets analyse social classes in greater granularity) [
14].
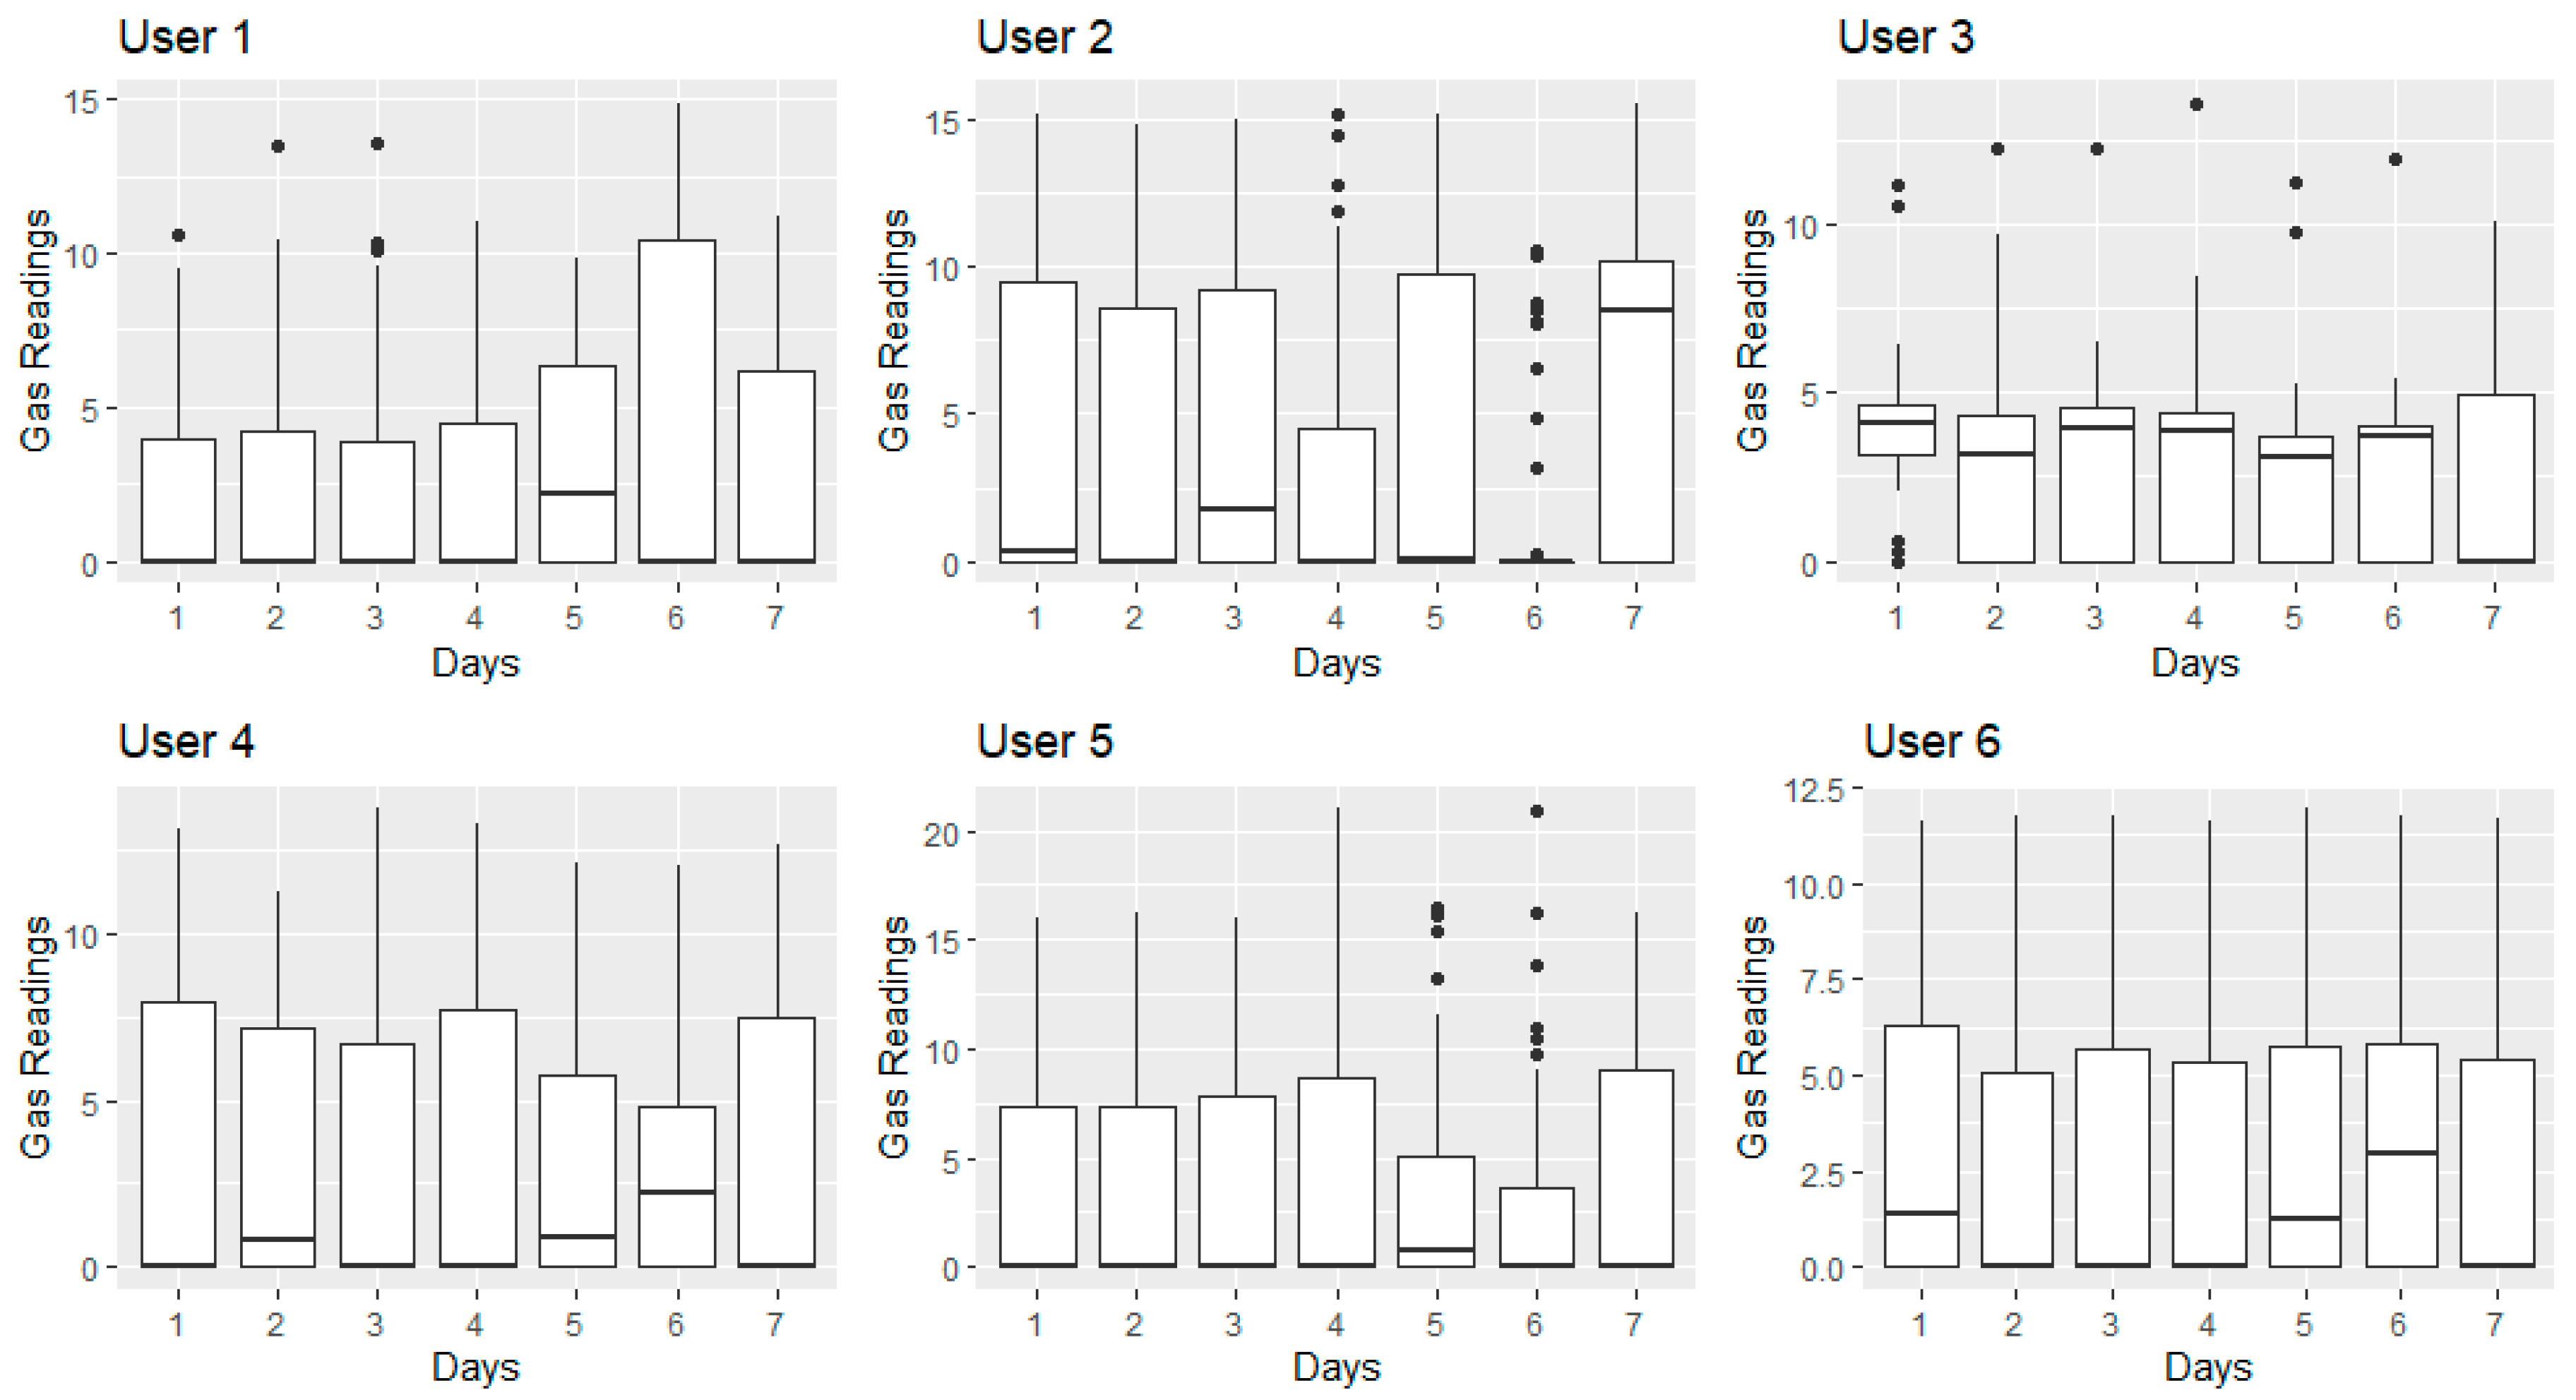
The general supply of gas consumption daily is calculated in kW/h (Kilo Watts per Hour). Gas bills display usage in kWh, despite gas meters measuring cubic metres. In
Figure 1, a visualisation of the gas meter readings for six random users over a seven-day period is demonstrated. The
x-axis displays days of the week and the raw usage reading is displayed on the
y-axis. Although rudimentary, the visualisations demonstrate high-level trends in the data consumption patterns. The boxplots display the variation in the usage trend for each of the users. The spacing refers to the degree of dispersion of the gas consumption. The black dots for each user represent outliers. Yet, in the overall dataset, these outliers may be acceptable, depending on trends of similar socio-demographic types. Detecting anomalies is a challenge, without the use of advanced data analytics (such as density-based classification) as a supporting metric for identifying outliers with any confidence and on a mass scale.
However, there are temporal constraints when proposing an autonomous smart system [
15] based on real-time analytics, particularly with regards to supervised classification algorithms. Supervised learning has feature extraction, training and labelling requirements that can be computationally expensive when operating in a live setting. As of 22 May 2019, there were 15,319,200 smart meters installed in the UK (6,611,900 gas and 8,707,300 electric) [
16]. The vast majority of the devices are domestic [
16], as displayed in
Table 2. Meaning, it is a significant challenge for supervised learning techniques to be able to operate in real time and remain scalable.
However, many related works in this domain do not have real-time requirements, meaning supervised classification techniques are ideal and have been implemented extensively. In the following section, related works are discussed.
2.2. Related Work
To date, anomaly detection strategies have played a key role in identifying energy fraud in smart meters by analysing historical data [
17]. Energy providers identify anomalous consumption patterns and impede energy fraud using consumer’s load profiles, where anomalies are typically classed into three main categories: (1) point anomalies, (2) contextual anomalies and (3) collective anomalies. The first case considers an anomaly when an individual event instance differs when compared with the rest of the data (the approach adopted in this paper). The second type, context anomalies, assume that an event might be considered an anomaly if it occurs in a specific context or circumstances. Finally, collective anomalies represent a collection of different events instances, instead of an individual event as in the two previous cases of anomalies.
For example, energy theft and defective meters have been studied in [
18] by means of an anomaly detection framework, aiming at reducing costs and revenue losses in smart grids. The authors use linear programming to model the amount of stolen energy at a particular smart meter as an anomaly coefficient. This is done by enumerating service areas with a high likelihood of theft based on the anomalies detected (reading discrepancies) at the distribution transformer. The proposed framework is capable of detecting meter anomalies even in cases of the random occurrence of theft or faulty equipment.
Other context aware approaches for anomaly detection used in literature are data mining-based, including clustering and association rule-learning techniques. B. Rossi et al. investigated the detection of anomalous behaviour in smart meter data streams using Association Rule Mining (ARM) and categorical clustering silhouette thresholding [
19]. ARM is an unsupervised technique that identifies relationships between variables, using strong rules and thresholds to prune redundant information. The technique uncovers rules in large series of events (smart meter readings) to predict the occurrence of an item based on the occurrence of others. The proposed approach is based on aspects of collective and contextual anomalies, proving that single point anomaly detection is not sufficient to determine anomalous events. Potential anomalies identified with ARM are then validated using a clustering silhouette.
K-means-based fuzzy clustering was performed in [
20] in order to group consumers with similar Key Performance Indicators (KPI) profiles. This was carried out using 150,000 customers’ energy consumption patterns, where the KPI values were associated using the k-means algorithm. Using their approach, it is possible to identify customers with a high level of use. However, there is a dependence on the use of KPIs to form correlation. K-means is typically a popular k-partitioning clustering algorithm that represents a centroid as the arithmetic mean of the points in a cluster [
21]. Its principle relies on partitioning a given set of observations N into a number of clusters
k, where each observation fit to the cluster with the nearest mean. That is, a point is included in a cluster if it is closer to that cluster’s centroid than any other centroid. Giving a training set
x(1),
…,
x(m), each observation is a d-dimensional vector
x(i) ∈ ℝ
n. Thus, the goal is to predict
k centroids and a label
c(i) for each data point. The k-mean clustering process can be described as follows; (1) Randomly initialise cluster centroids
μ1,
μ2, …,
μk ∈
ℝn and (2) Repeat until convergence: For every
i, set
Despite its popularity, k-means is a non-deterministic algorithm, which means that in every iteration it starts with a random set of centres and converges to a different local minimum each time. K-means is not adopted in this paper during the experimentation. This is because an advantage of density-based clustering is its ability to deal with clusters without assuming that clusters in the data exhibit some type of convex shape naturally, i.e., hyper-spherical or hyper-elliptical, typical from parametric approaches such as nearest-neighbour based. While k-means requires the user to specify the number of clusters to be found, density-based clustering techniques do not assume parametric distributions, are capable of discover arbitrarily-shaped clusters with no previous knowledge about the number of clusters (k), and can handle various amount of noise (anomaly detection). This makes this type of techniques ideal for smart meter data, separating anomalies from what appears to be normal behaviour, especially if there is no further knowledge concerning the nature of the anomalies in the dataset under investigation.
Density-based clustering methods, such as Gaussian Mixture Model (GMM) and density-based spatial clustering of applications with noise (DBSCAN), have been compared in [
17] to detect abnormal electricity patterns to challenge electricity theft. These types of unsupervised algorithms group elements into categories, also known as clusters, based on their similarities. The authors proposed a new density-based abnormal detection technique and compared it against k-means, GMM and DBSCAN for identifying electricity theft via smart meter data. Since data with labelled electricity theft information is challenging to obtain, the authors created their own synthetic dataset using six abnormal load profiles and 5000 normal load profiles from residential and commercial users. The proposed clustering-based technique outperformed the other models and detected electricity theft based on the abnormal profiles. Song et al. however, focused on non-invasive energy-use profiles to categorise households into personalised groups [
2]. There are similarities with the work presented in this paper, as clustering techniques are used for the grouping. However, the techniques in [
2] focus on k-means, hierarchical clustering and self-organising maps, rather than the density-based classification techniques adopted in this paper. An overview of the background research is presented in
Table 3, which outlines the advantages/disadvantages of each approach.


