1. Introduction and Background
Anomaly and intrusion detection approaches in industrial control systems (ICS) vary significantly from traditional designs, given the unique characteristics of ICS traffic and applications. Since an ICS can be large and multifaceted, like Supervisory Control and Data Acquisition (SCADA) systems, they are used in critical infrastructure and industrial environments for the control of physical processes. These systems typically span a large geographic area and provide an interface with physical devices like sensors and actuators. These networks are generally categorized as operational technology (OT). ICS require real-time availability, implying that they must be able to identify, diagnose, and respond appropriately to irregular flows of information as quickly as they appear [
1].
Given the unique applications and needs of ICS networks, traditional anomaly and intrusion detection systems that rely on signature matching will be ineffective when applied to such networks as there are very few known signatures in ICS. Some forms of pattern detection and anomalous behavior can be studied using network traffic features in an ICS environment while keeping in mind the real-time nature of communication and minimal computational overhead and distributed nature of these networks. As more and more ICS applications have started using Modbus over TCP to enable integration with backbone TCP/IP infrastructure, it is of further significance that any anomaly detection technique must use Modbus and TCP/IP NetFlow features to detect malicious behavior. Furthermore, using statistical anomaly, especially measuring randomness in network traffic, poses a promising future in anomaly detection in lightweight applications such as any ICS-specific deployment in manufacturing or other production environments. In this work, the change in entropy or randomness in the communication pattern of an industrial control system is used to identify communication anomalies in ICS. The minimal and maximal values of several features are used to identify values that defy a normal range [
2] for a feature.
When designing a security solution that focuses on traffic anomaly in ICS systems, the primary focus must be given to its architecture and communication characteristics. The levels in a SCADA architecture that need to be secured are as follows [
3]:
Sensors and actuators: These are at the lowest level or basic control level.
Supervisory control: These are Distributed Control Systems (DCS) servers and Programmable Logic Controllers (PLCs) accompanied by the Human–Machine Interface (HMI) and engineering stations. These servers focus on the global view of the system’s control state and operations. The information collected is presented via the HMI for ready accessibility to a user reviewing the systems.
Backbone networks: These are the uppermost levels consisting of servers that are connected to the enterprise IT systems backbone. The IT backbone is used for resource optimization [
3].
Sensors and actuators in ICS settings generate a low volume of data periodically [
3]. The Modbus communication protocol has been designed for the controllers that accompany these nodes, and the Modbus application protocol defines the syntax and semantics of the communication and structure.
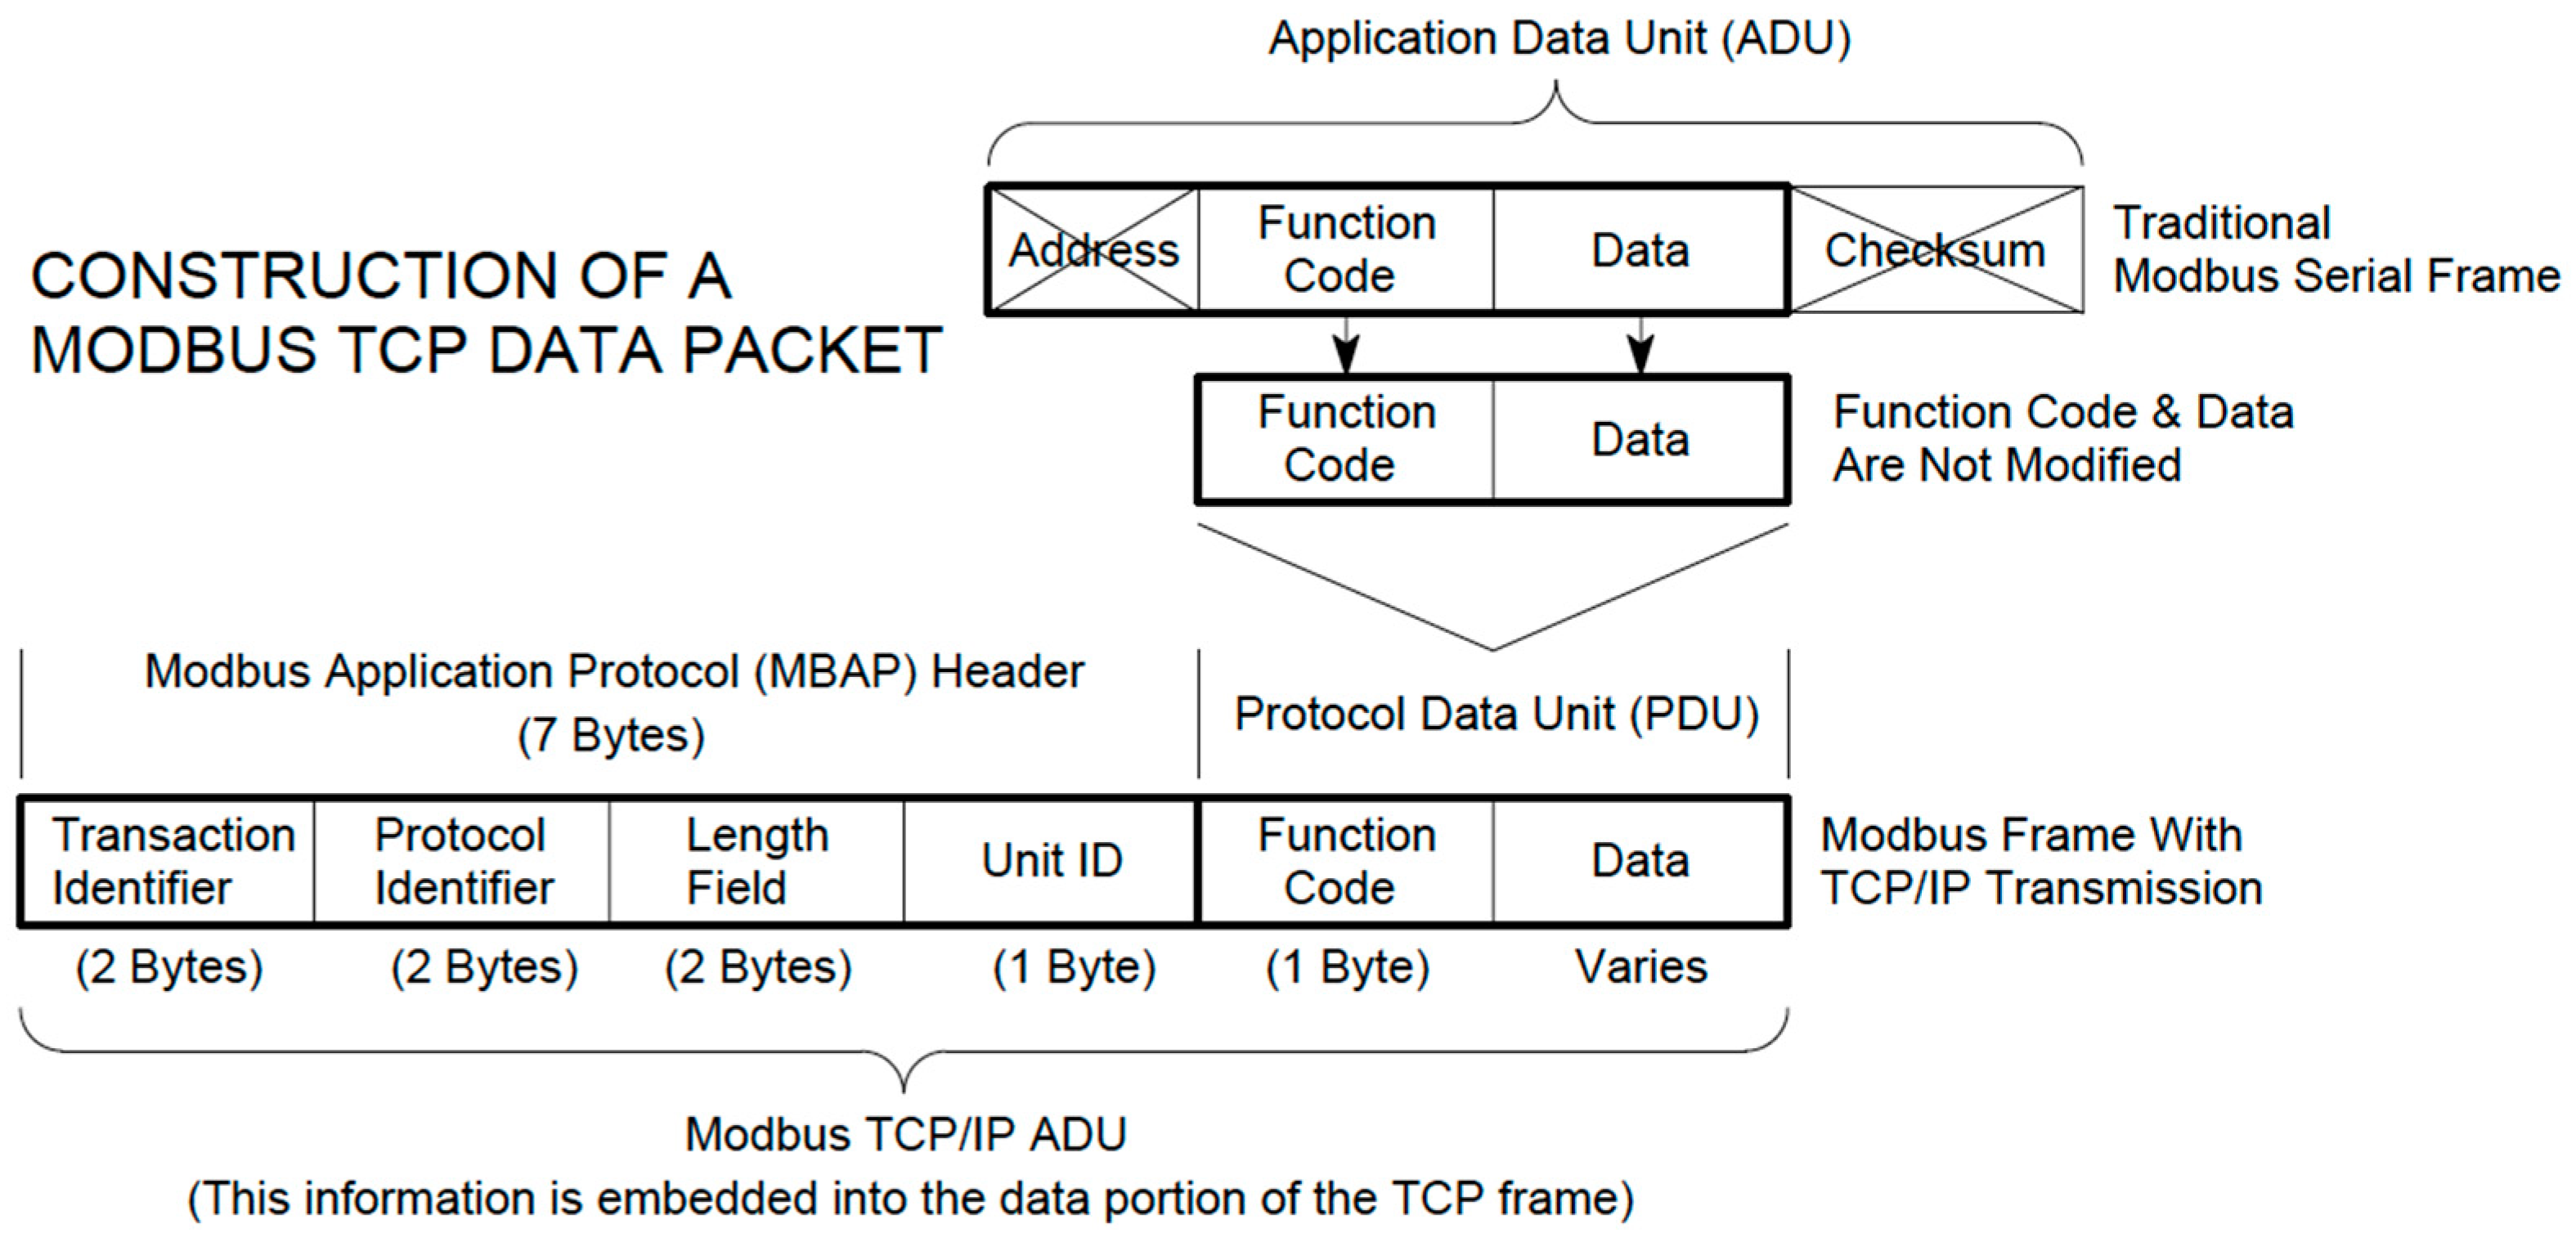
Figure 1 shows the Modbus frame and its encapsulation in the TCP header [
3].
With these constraints in mind, this paper explores whether entropy analysis or a classifier-based approach with certain network traffic features in Modbus over TCP provide insight into network anomaly. To our knowledge, this is the first paper that has presented a detailed entropy and classifier-based analysis using traffic features on Modbus over TCP. For this work, datasets from an HVAC system at the University of Alabama Huntsville research lab [
4] were used.
Our contribution to the ongoing research in industrial control systems anomaly detection using Modbus over TCP is as follows:
This paper presents extended results over our previous work by presenting a detailed cluster-based entropy analysis on selected network traffic features. The entropy analysis is used more so to study particular features than for classifier analysis.
It extends the analysis using a classification-based approach. The results show that, overall, the classification results of the DOS attacks were much higher than the MITM attacks. In terms of classifiers, J48 and random forest had the best classification results.
This is the first work that has used packet cluster-based entropy analysis to detect anomalies using Modbus over TCP.
We wanted to study if two Modbus features, in addition to the three TCP/IP features, can be used to classify DOS and MITM attacks with a high accuracy.
The rest of the paper is organized as follows.
Section 1.1 presents the background necessary to understand this research.
Section 2 discusses the related literature in this area.
Section 3 discusses the data used in this research and our previous work.
Section 4 and
Section 5 discuss methodology and results using entropy analysis and classification analysis, respectively.
Section 6 concludes the paper, and
Section 7 presents the future works.
1.1. Background
1.1.1. Entropy
Suppose a random variable
takes on values
with respective probabilities
. The surprise evoked upon learning that
is defined as
. The entropy of the random variable
, denoted by
, is determined to be the expected (average) amount of surprise evoked by learning all values of
, which is given by
The entropy can also be interpreted as the amount of uncertainty that exists in the random variable or the average amount of information received when all the values of are observed.
1.1.2. Bayesian Network (BayesNet)
Bayesian Network classification learns or trains from belief networks. The network topology can be determined from the data. A Bayesian network represents a probability distribution that can be expressed as
The algorithm uses a two-step process to first learn the network structure and then learn the conditional dependencies of the network based on the connections [
5].
1.1.3. Naïve Bayes
Naïve Bayes [
6] classification is built on the premises of Bayes Theorem, which can be expressed as
The naïve assumption in Naïve Bayes is that the attribute values are conditionally independent, thus mathematically simplifying the collective probability to that of the product of individual conditional probabilities expressed as
with the Naïve Bayes expressed as
1.1.4. J48
J48, or decision tree classification, uses a recursive model to build a decision tree. The feature with the highest information gain is at the root of the tree and is used as the splitting criteria for the branches. The feature with the next highest information gain forms the next level, and so on. The terminal node represents the classification of the predicted attribute [
6].
1.1.5. Simple Logistic
Simple Logistic classification assumes that a linear relationship exists between dependent and independent variables. The algorithm uses linear logistic regression to produce an equation for a line of best fit to describe the relationship between the two variables. Simple Logistic excels at creating associations based on linear relationships and struggles when missing data or outliers could skew the linear line of best fit [
7].
1.1.6. Support Vector Machine (SVM)
Support Vector Machines (SVM) transforms the original data into higher dimensions, and within these higher dimensions, it searches for a linear optimal separating hyperplane or decision boundary that separates one class of tuples from another. SVM aims to have as large of a margin as possible between the support vectors on either side [
6].
1.1.7. Multilayer Perceptron
Multilayer Perceptron classification utilizes a neural network. Each neuron in a layer is connected to neurons in the previous layer. In the forward step, each neuron computes a weighted sum of the inputs it received from the previous layer, then adds a threshold value, and finally applies an activation function to produce an output to send to the next layer of neurons. Once the algorithm has completed the forward step by progressing through every layer, an error is computed as a function of the weights.
In the backward step, or backpropagation, this error propagates backward via the layers to update the weights. The cycle of forward-step and backpropagation continues until the error is sufficiently reduced [
8].
1.1.8. Random Forest
Random forest classification is an ensemble of decision tree classification. Instead of relying on one decision tree, the random forest ensemble generates multiple diverse trees. During the decision tree construction, random features are selected for splitting. As the number of trees grows, the results are better [
6].
1.1.9. Decision Table
Decision Table classification constructs a lookup table for the various labels that are associated with specific attributes. The algorithm consists of the use of effective search algorithms, well-defined conditions, and significant rules to predict the class of output [
9].
2. Related Literature
Anomaly detection approaches for ICS-specific traffic using Modbus over TCP/IP are scarce in the literature. While significant research has been carried out on anomaly detection in TCP/IP environments using the standard TCP and IP header fields as attributes and also in industrial control settings using Modbus features, not much work has been carried out to detect network anomaly with Modbus over TCP traffic, primarily due to lack of labeled datasets. Some researchers have proposed supervised learning techniques to detect malicious traffic in ICS networks [
10,
11,
12,
13,
14,
15,
16]. A supervised learning approach to identify both general and finer-grain attacks evaluated on real industrial gas pipeline traffic was presented in [
10]. Their approach in classifying both general and specific attacks helped identify risks/impacts and better prepare them to respond. A subset of features from the Modbus data were used for classification. In [
11], discrete-time Markov chains were used for the extraction of semantic meanings and modeling of known behaviors. The authors explored the possibility of threat actors deploying “semantic attacks” by utilizing knowledge of processes beyond the targeted systems to maximize the impact of compromise. The authors conveyed how most network intrusion detection systems look for a single or specific abnormal operation to determine a threat, and their paper shows that a series of normal operations with malicious intent can evade traditional detection. In [
12] the authors used Naïve Bayes for anomaly detection. Their results, although preliminary, proved to be highly accurate and even functional for data from real operational plants. With each attack encountered, it would import the attack to the attack model to train the classifier, improving it each time. In [
13], a two-stage anomaly detection technique using a packet-level signature analysis and a time-series analysis using Long Short-Term Memory Neural Network (LSTM-NN) was used. The signature analysis examined packages transmitted between ICS nodes and created a database of the communication patterns. The signature database was then checked using a bloom filter to detect anomalous behavior. The time-series analysis was checked by their proposed stacked Long Short Term Memory (LSTM) network-based softmax classifier to learn the most likely package signatures. The authors evaluated their work on real datasets from a SCADA gas pipeline and achieved high detection performance compared to existing anomaly detection models. In [
14] the authors used a Long Short-Term Memory Recurrent Neural Network (LSTM-RNN) to detect a sequence of patterns for anomaly detection. They were able to identify anomalous traffic and find which sensors were targeted. The paper mentions that they were able to evaluate their methods on complex datasets from a secure water treatment testbed and detect most of the attacks with low false positives. In [
15] the authors used a method to learn the network communication patterns in the process control networks and learn the flow records generated from captured packets. Both the patterns and flows are then checked against the historical norm to identify anomalous traffic. In [
16] the authors proposed an anomaly detection system utilizing an auto-associative kernel regression model (AAKR), a model that mathematically transforms the data (kernel) to associate with what it has learned to predict new information (regress). The authors coupled the model with the statistical probability ratio test (SPRT) to reinforce the model’s prediction and evaluated it on a simulated SCADA system.
Ref. [
17] is among the few works that have been carried out on unsupervised learning to isolate malicious from non-malicious traffic. This work focused on the problem of threshold selection in unsupervised learning algorithms in the context of anomaly detection.
A large body of research in anomaly detection focuses on the specificity in which each research deliberates on a specific technique or specific set of features for a particular environment. In [
18] the authors proposed developing a formal framework using theoretical understanding and information measures to further anomaly detection research away from domain-specific knowledge. The authors explored the effectiveness of various measures such as entropy, conditional entropy, and relative conditional entropy to model anomaly detection thresholds on
sendmail system call data from the University of New Mexico and MIT Lincoln Lab. Although their results were preliminary, they prove the capabilities of theoretical measures to model an IDS without expert domain knowledge.
While using entropy to detect anomalies in network traffic has been shown as an effective technique, not much work has been carried out to analyze the entropy of Modbus network traffic features in a control system environment. Some work has shown promising results using entropy, but they are restricted within the informational technology domain, mostly using TCP/IP stack, and do not extend to the operational technology domain in control systems. A very preliminary study was conducted in 2007 and presented in [
19]. The authors used packet size entropy to detect Denial of Service (DoS) attacks. It emphasizes the adoption of volume-based traffic analysis to detect anomalies. One of the earliest works using entropy is presented in [
20]. The authors used IP address and port feature pairs to analyze entropy behavior. The authors also calculated the correlation between the feature pairs and found a high correlation between IP addresses and port distributions. They concluded that IP addresses and ports are not sufficient in detecting anomalies, and there is a need to look beyond these feature sets. Similar work is presented in [
21] using a packet-size entropy analysis to detect DoS attacks in firewalls. A very preliminary threshold of 1.0 is used as a threshold to detect anomalous traffic over normal.
The works that came close to this paper’s work are described in [
22,
23]. In [
22] the authors proposed an entropy-based network anomaly detector. They discussed various detection approaches and the advantages that feature distribution has on counter-based detection, the precedence being how flexible feature distribution is based on which features are chosen, whereas counter-based detection is heavily correlated with traffic volume. A 2012 study published in
Security and Communication Networks [
23] conducted entropy analysis on network traffic captured on a honeynet. The authors conducted hourly entropy analysis on selected traffic features to detect anomalous activities and used the entropy values to suggest thresholds for network anomaly detection.
Our paper presents extended results over our previous work [
24] by presenting a detailed cluster-based entropy analysis on selected network traffic features using datasets obtained from an HVAC system. It extends the analysis using a classification-based approach with combined TCP/IP and Modbus feature sets. Our initial findings were reported in [
24]. Our detailed entropy analysis in this paper corroborates our earlier findings that, although some degree of anomaly may be detected using univariate and bivariate entropy analysis for Denial of Service (DOS) and Man-in-the-Middle (MITM) attacks, not much information may be obtained for the initial reconnaissance, thus preventing early stages of attack detection in the Cyber Kill Chain. Our classification-based analysis shows that, overall, the classification results of the DOS attacks were much higher than the MITM attacks. In terms of classifiers, J48 and random forest had the best classification results and can be considered comparable. For the DOS attack, no resampling with the 60–40 (training/testing split) had the best results, but for the MITM attack, the 80–20 non-attack vs. attack data with the 75–25 split had the best results.
3. The Data and Previous Work
We based our analysis on Modbus over TCP/IP data collected from an HVAC system at the University of Alabama Huntsville research lab. These data contained both malicious and non-malicious traffic for the various stages of the HVAC operations, that is, auto cool, auto heat, normal, and random. The dataset consists of eight days’ worth of data using Modbus over TCP/IP on an HVAC operation plant. Each day’s data consist of raw network packet capture converted to a CSV file with both Modbus and TCP/IP and NetFlow features. Attacks that have been simulated in the datasets consist of DoS, MITM, Reconnaissance, overheating, overcooling, displaying fake values, simultaneous heating and cooling, system shutdown, and setpoint changing.
For this study, the top three malicious activity families that come up in the literature, namely DOS, MITM, and Reconnaissance, were used.
A review of the literature [
16,
25,
26] shows that attacks in industrial systems are broadly categorized as below:
Interception—Adversaries are able to intercept communications, a classic example of which is the MITM attack.
Interruption—Adversaries are able to disrupt and degrade normal operations, a classic example of which is the DOS attack.
Modification—Adversaries are able to intercept communications and alter instructions and values, a classic example of which is the MITM attack.
Fabrication—Adversaries are able to inject new or altered messages into the communication stream.
Reconnaissance almost always acts as a precursor to all these attacks when adversaries are either actively or passively scanning the networks. These led us to choose the three top attacks, namely MITM, DOS, and Reconnaissance, for this experiment.
Previous Work
In our previous work, we computed univariate and bivariate entropy for three features—packet size, inter-packet delay, and packet process time. Our initial results showed that all three features have higher entropy values under DOS and MITM attacks. We concluded that entropy could be a potential indicator to alert the system of some anomaly, although it would require further investigation to detect the actual nature of the anomaly as such.
Our results from joint entropy analysis with each feature pair showed that bivariate joint entropy analysis with packet process time and inter-packet delay can indicate the presence of malicious activities, while the other feature pairs do not convincingly point toward that direction. Our detailed results and discussion can be found in [
24].
4. Methodology and Detailed Entropy Analysis
This work extends our previous work. In this work, we conducted a detailed entropy analysis using a larger feature set and shorter clusters. We chose seven features—packet size, inter-packet delay, packet process time, Modbus frame length, function code, protocol overhead, and data. The final four features represent the Modbus protocol. Another feature—CRC—that showed high information gain, as presented in [
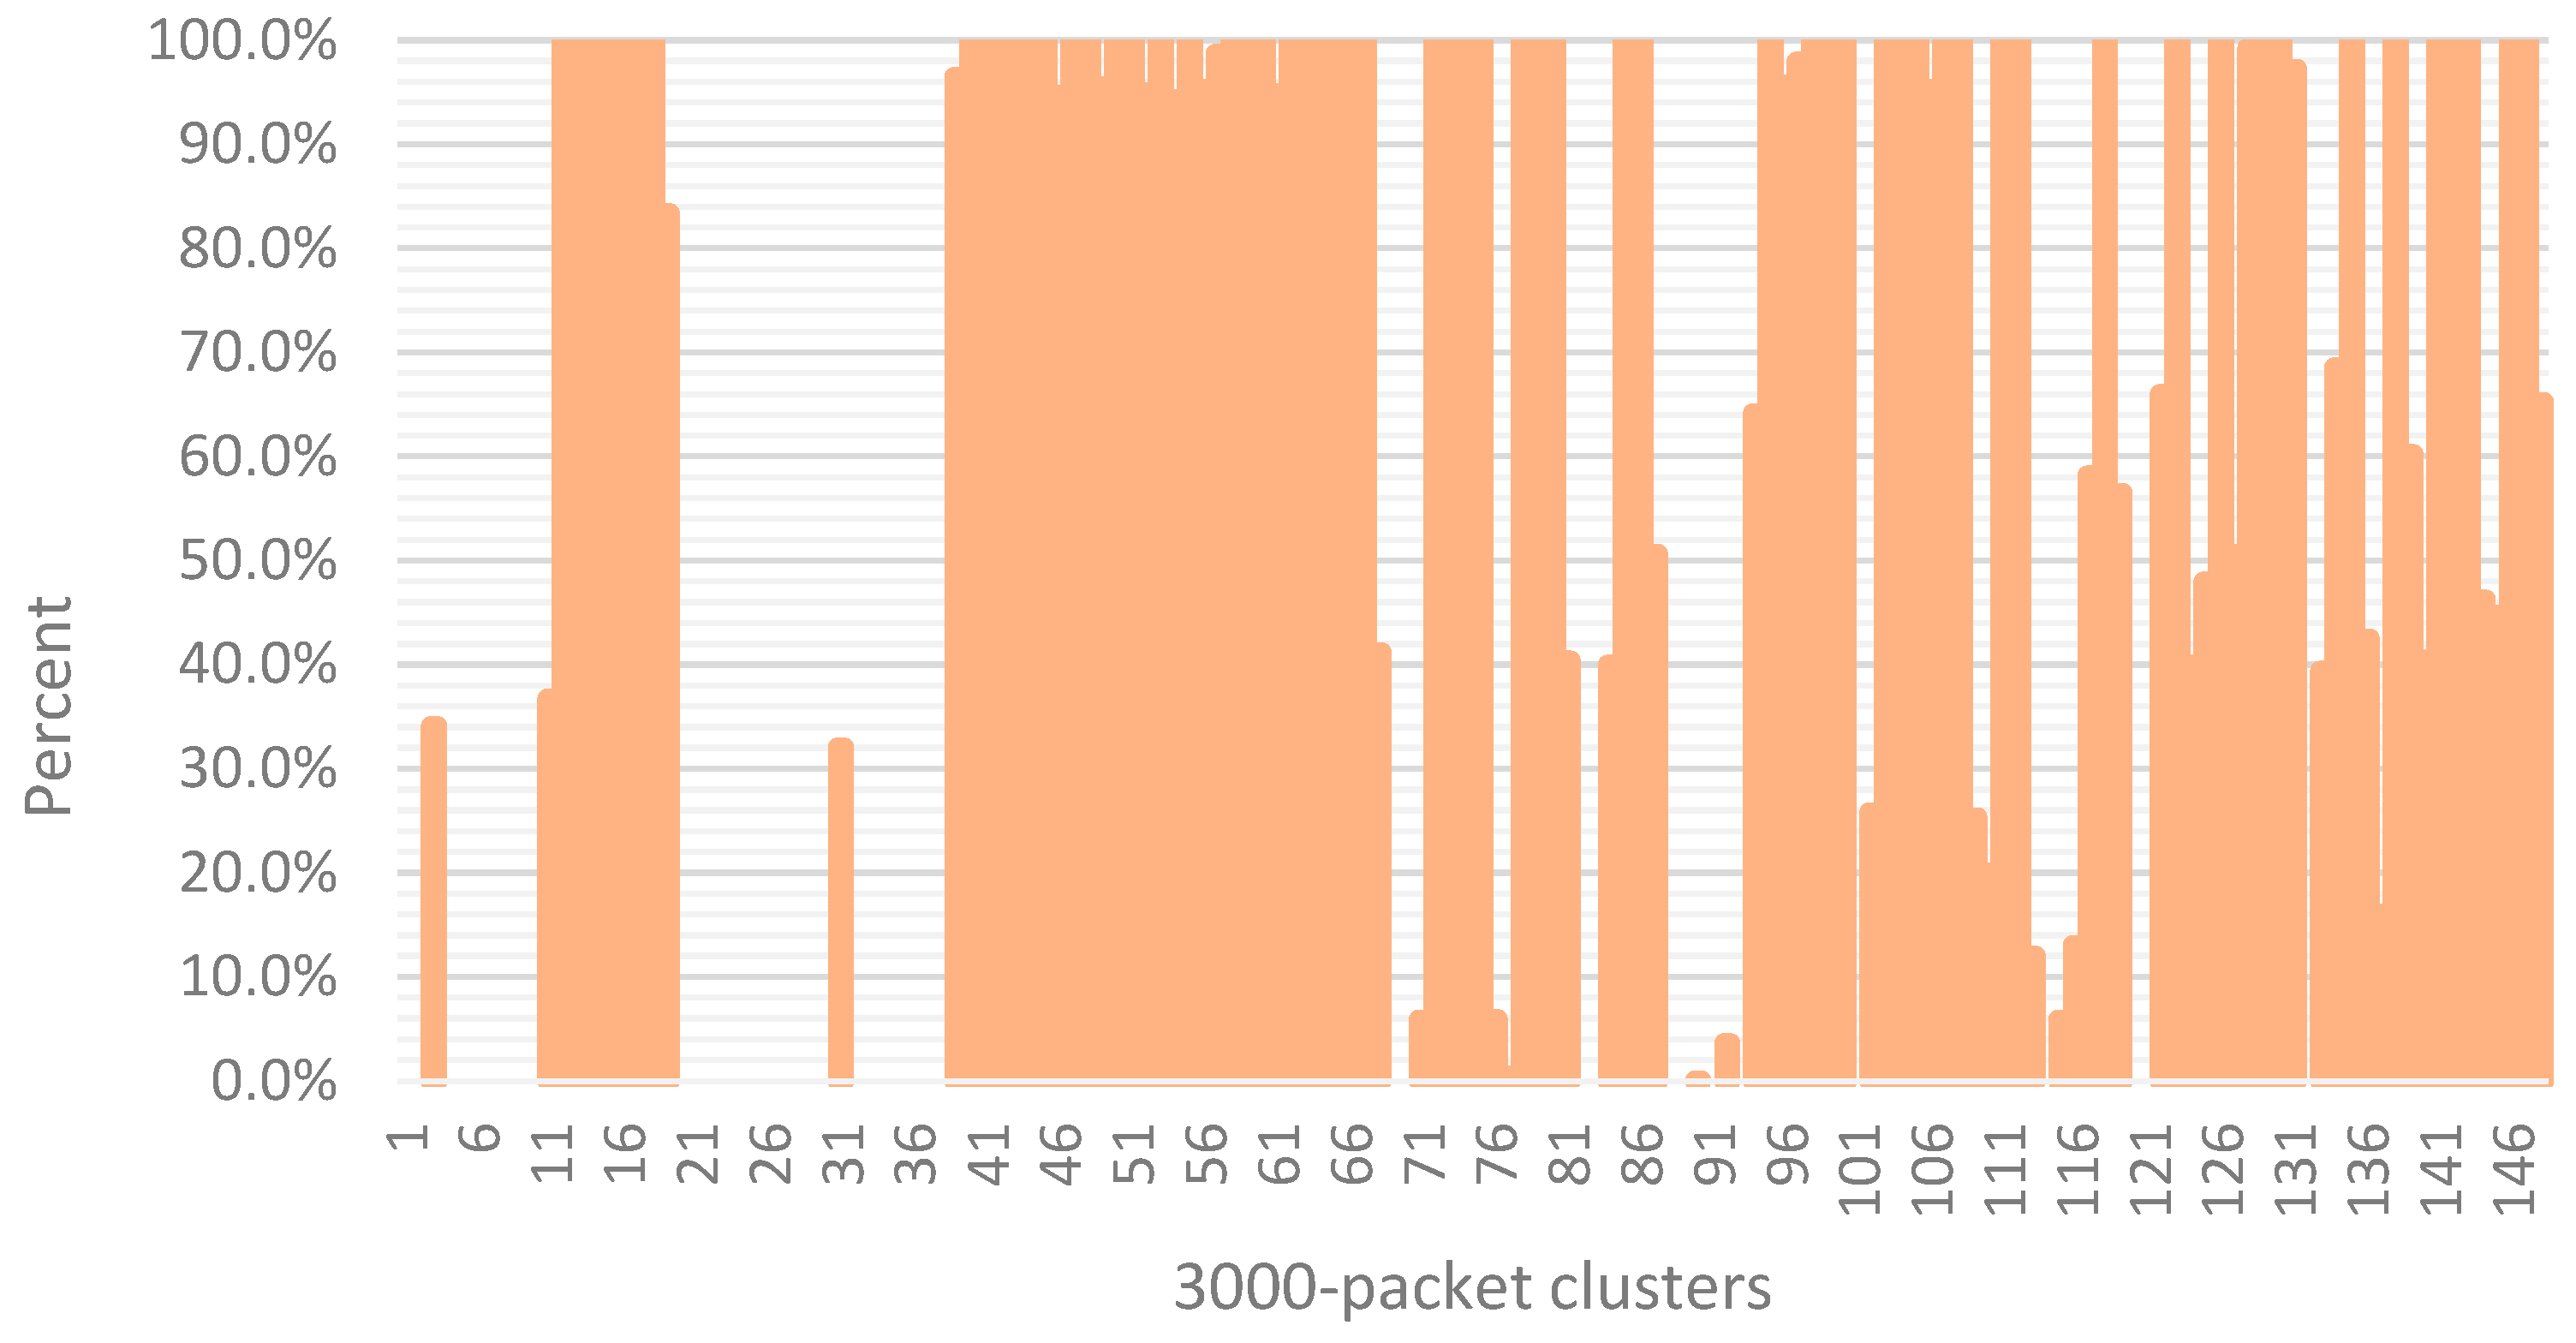
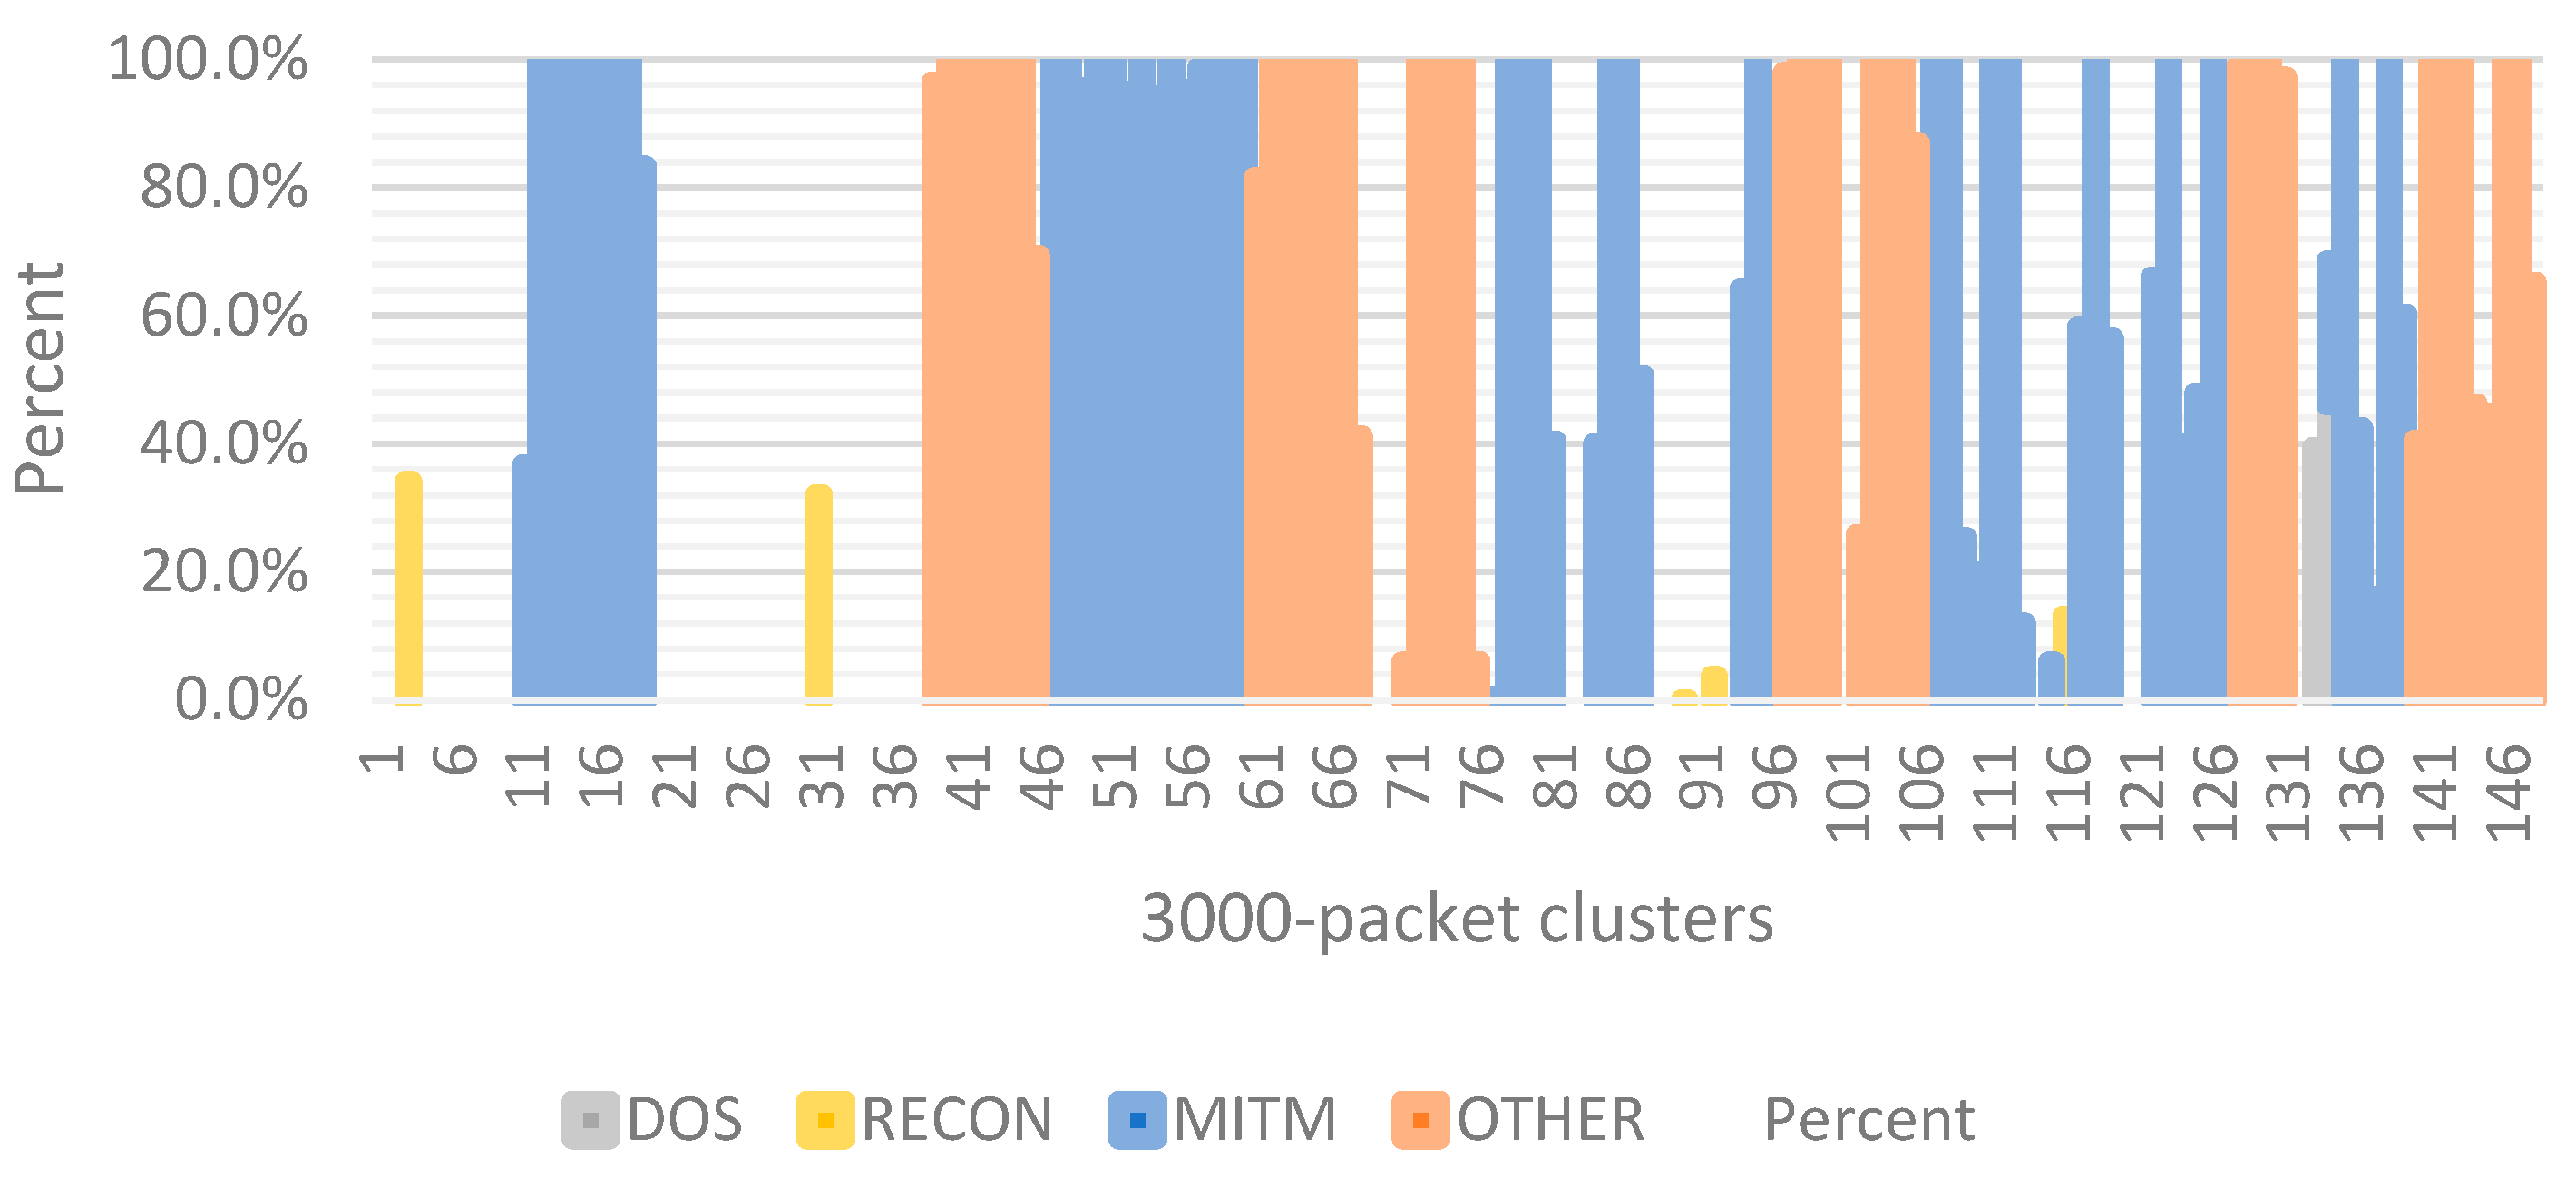
10], was omitted as it does not apply to Modbus over TCP traffic. We chose to use a 3000-packet cluster size to analyze how entropy values change for each feature. We intentionally deviated from using a time-based cluster as network activities in the datasets were inconsistent and would not give us a true picture of entropy changes with malicious activities. We decided to use a 3000-packet cluster after a careful review of the 5000-packet cluster size and 10,000-packet cluster size. Again, we chose to focus on the top three attacks—MITM, DOS, and Reconnaissance.
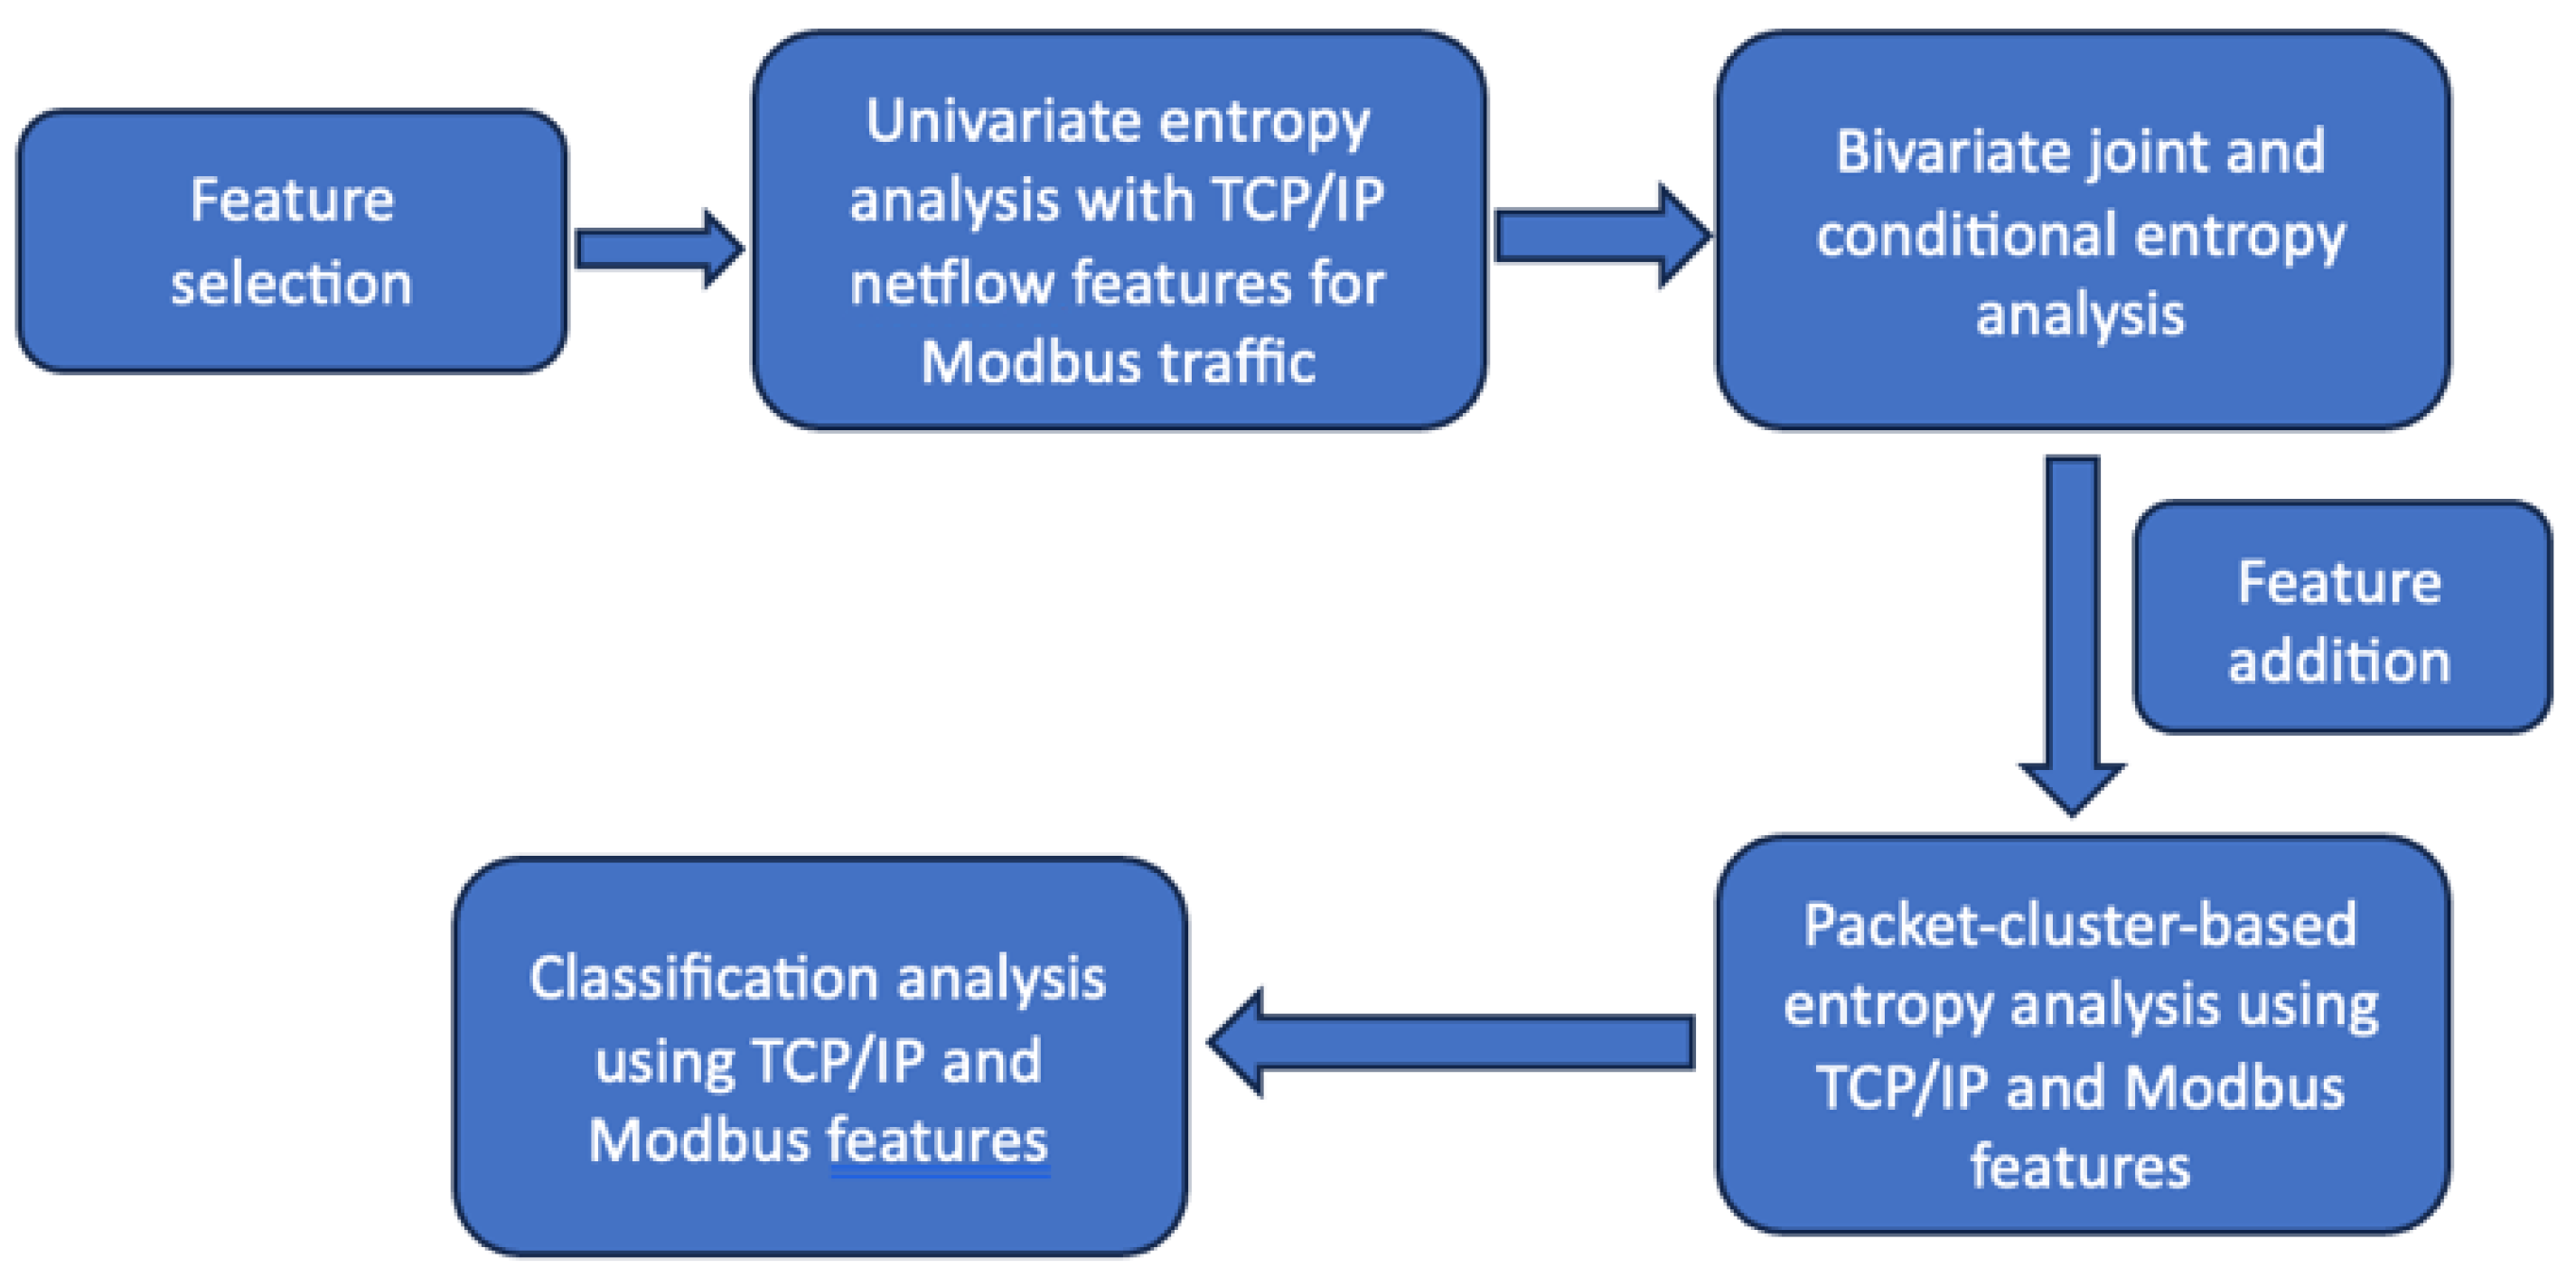
Figure 2 shows a high-level block diagram of our approach.
Figure 3 and
Figure 4 show the percentage of malicious traffic overall and the same with different attack types, respectively.
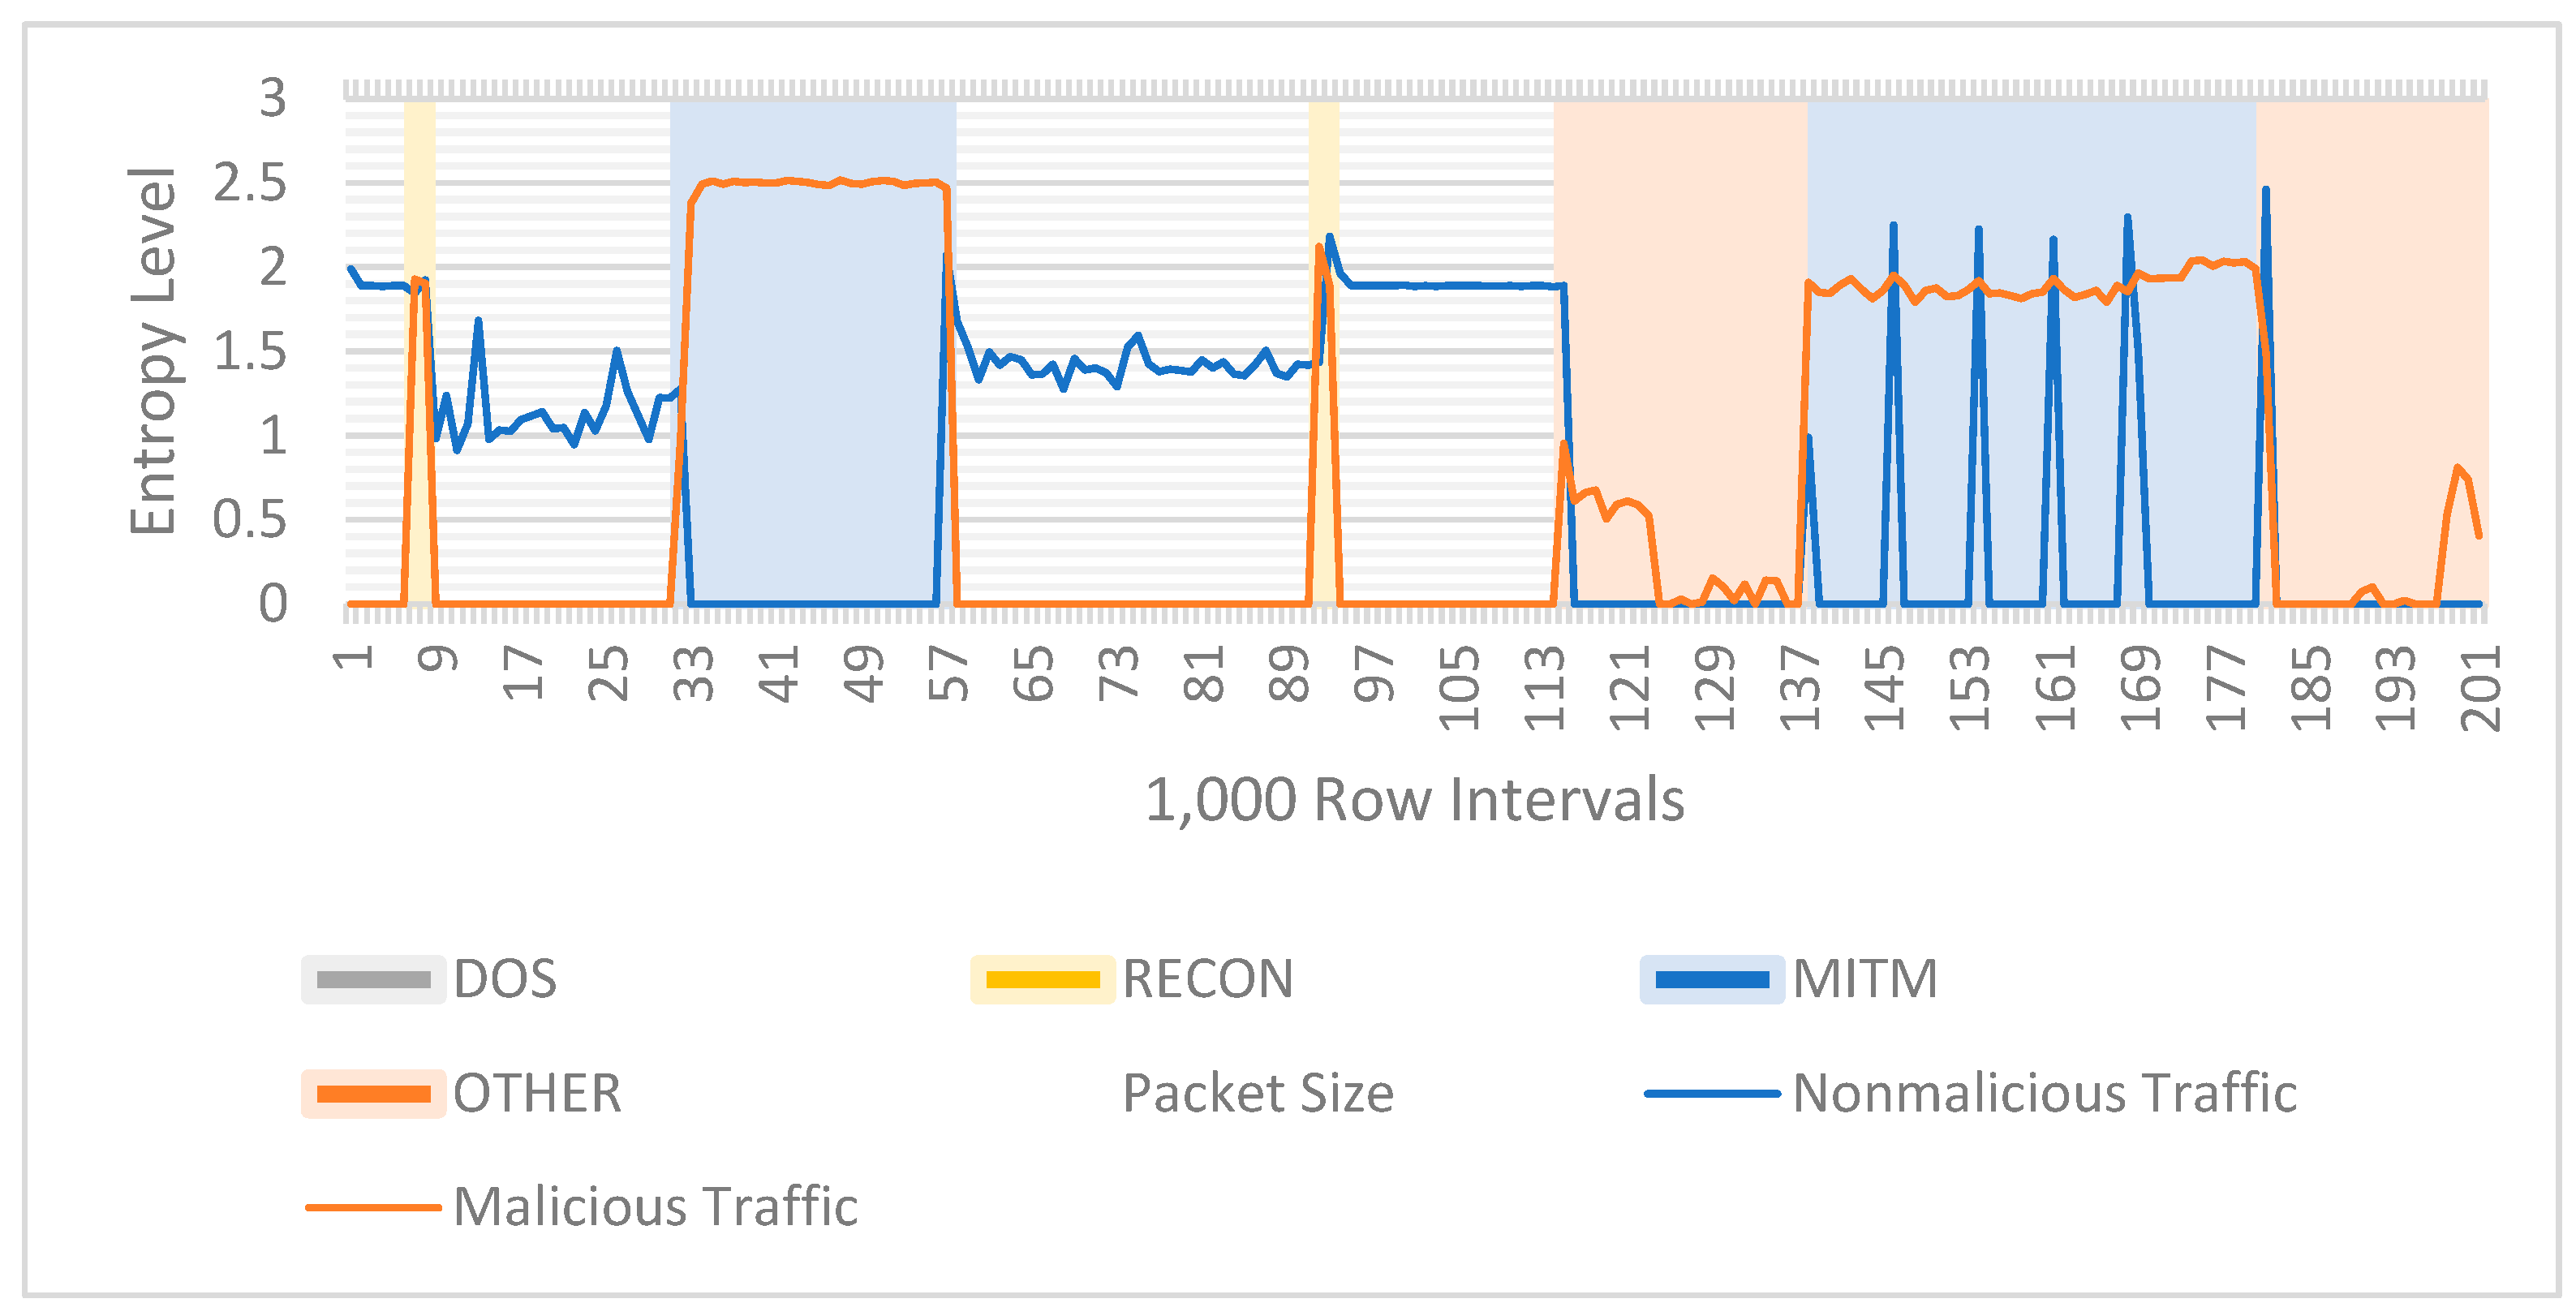
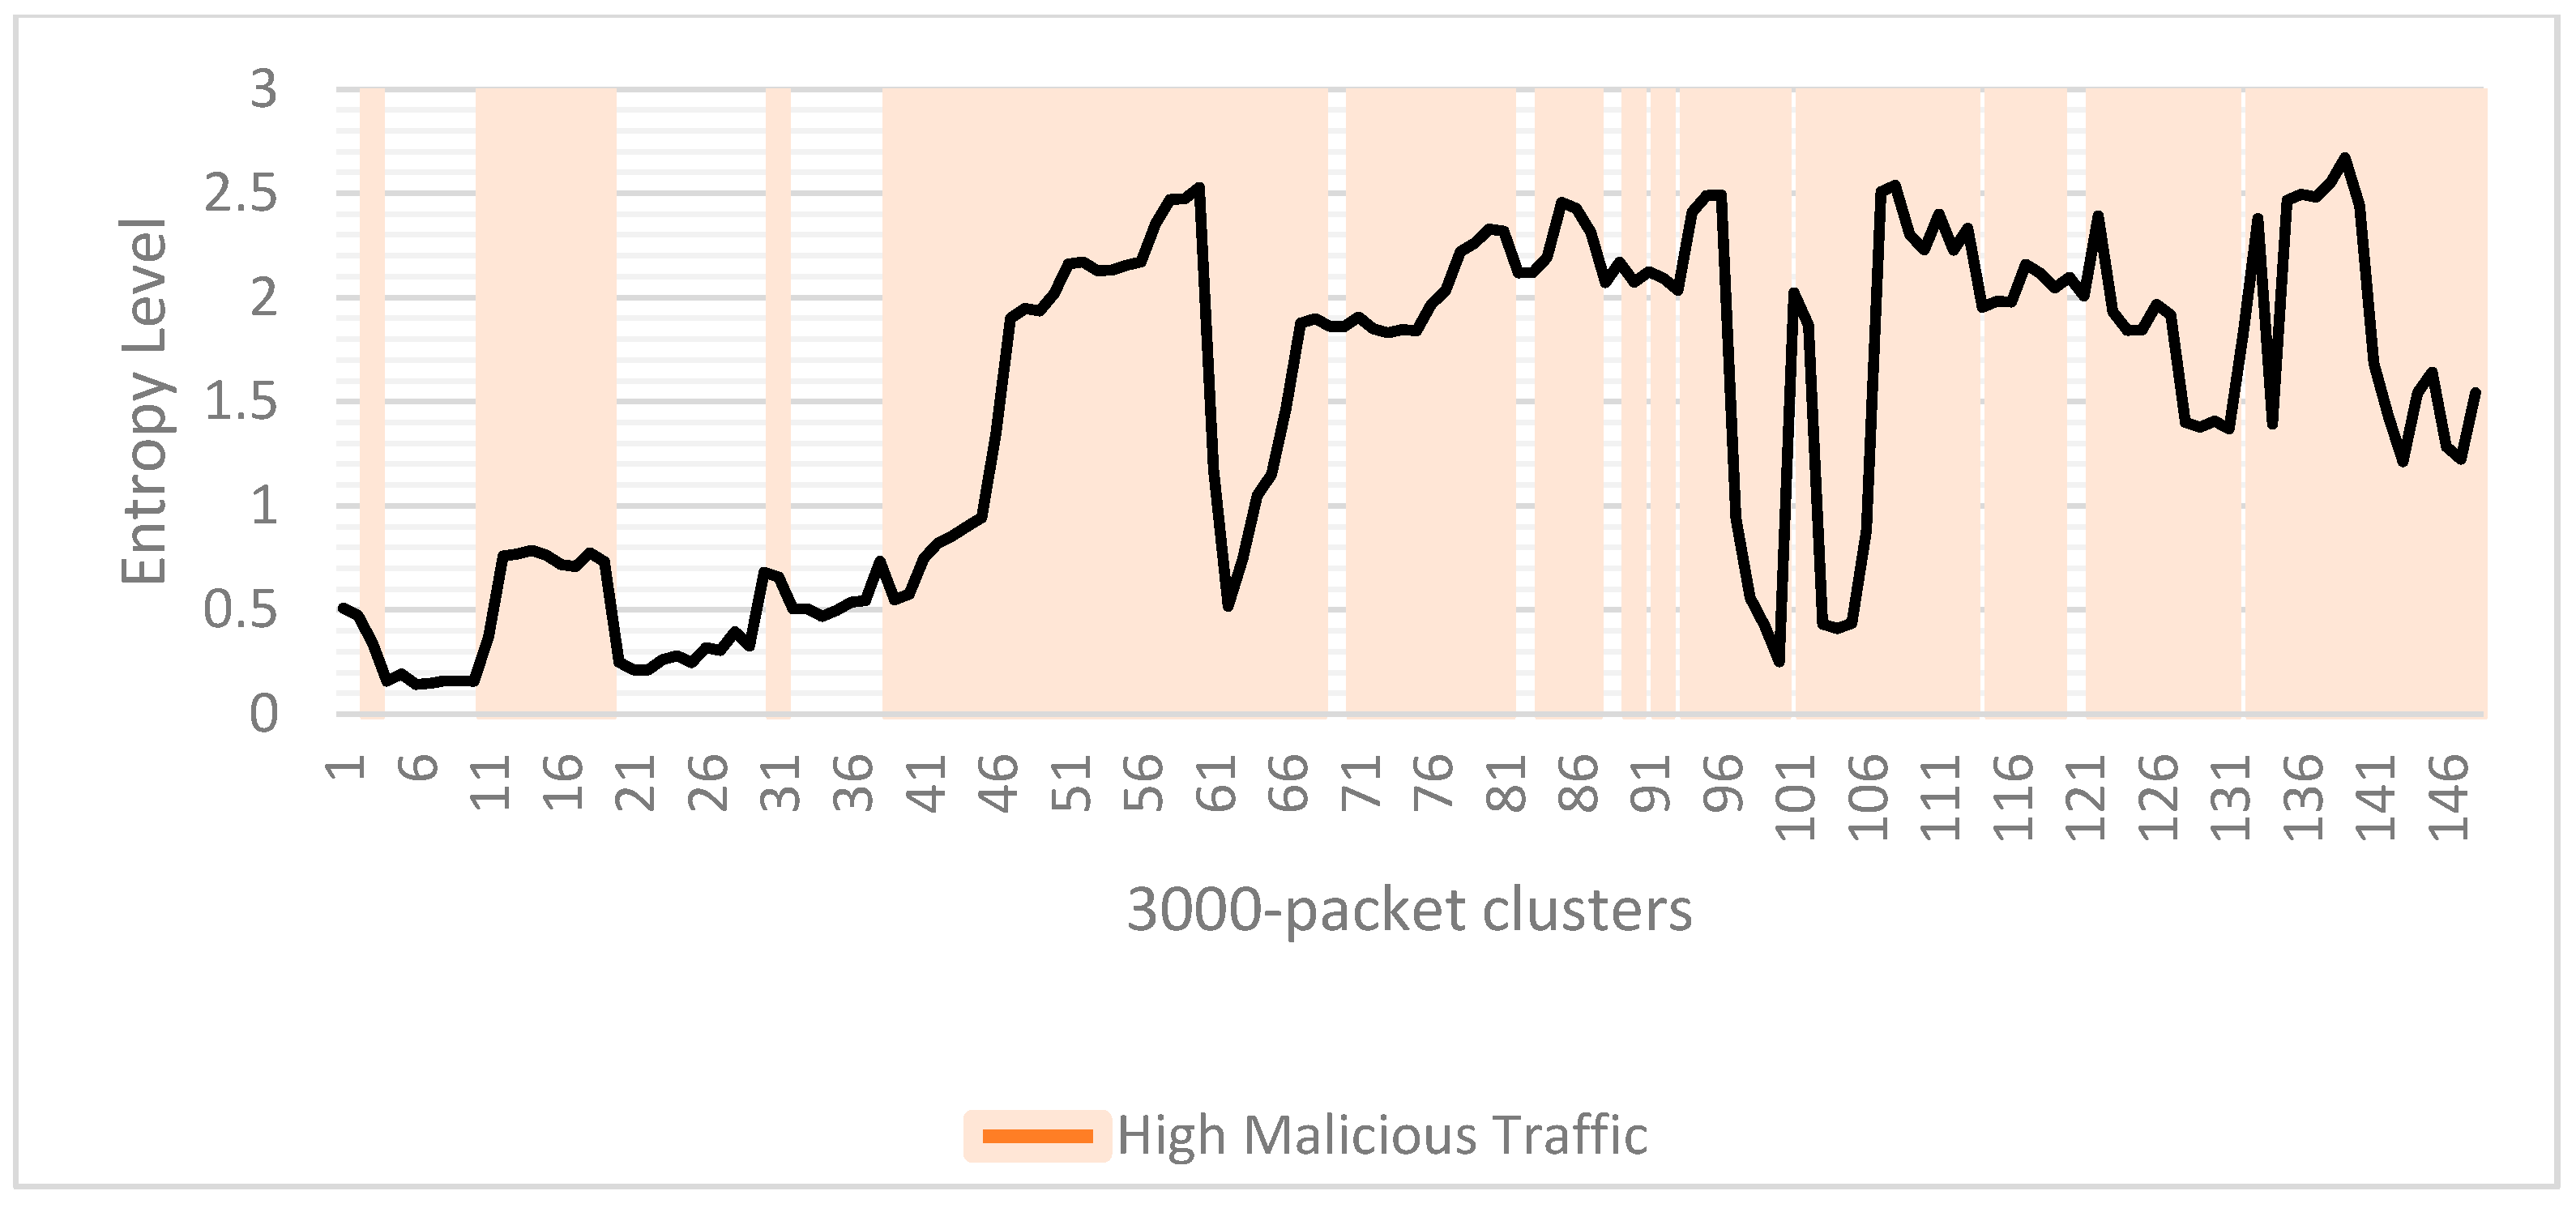
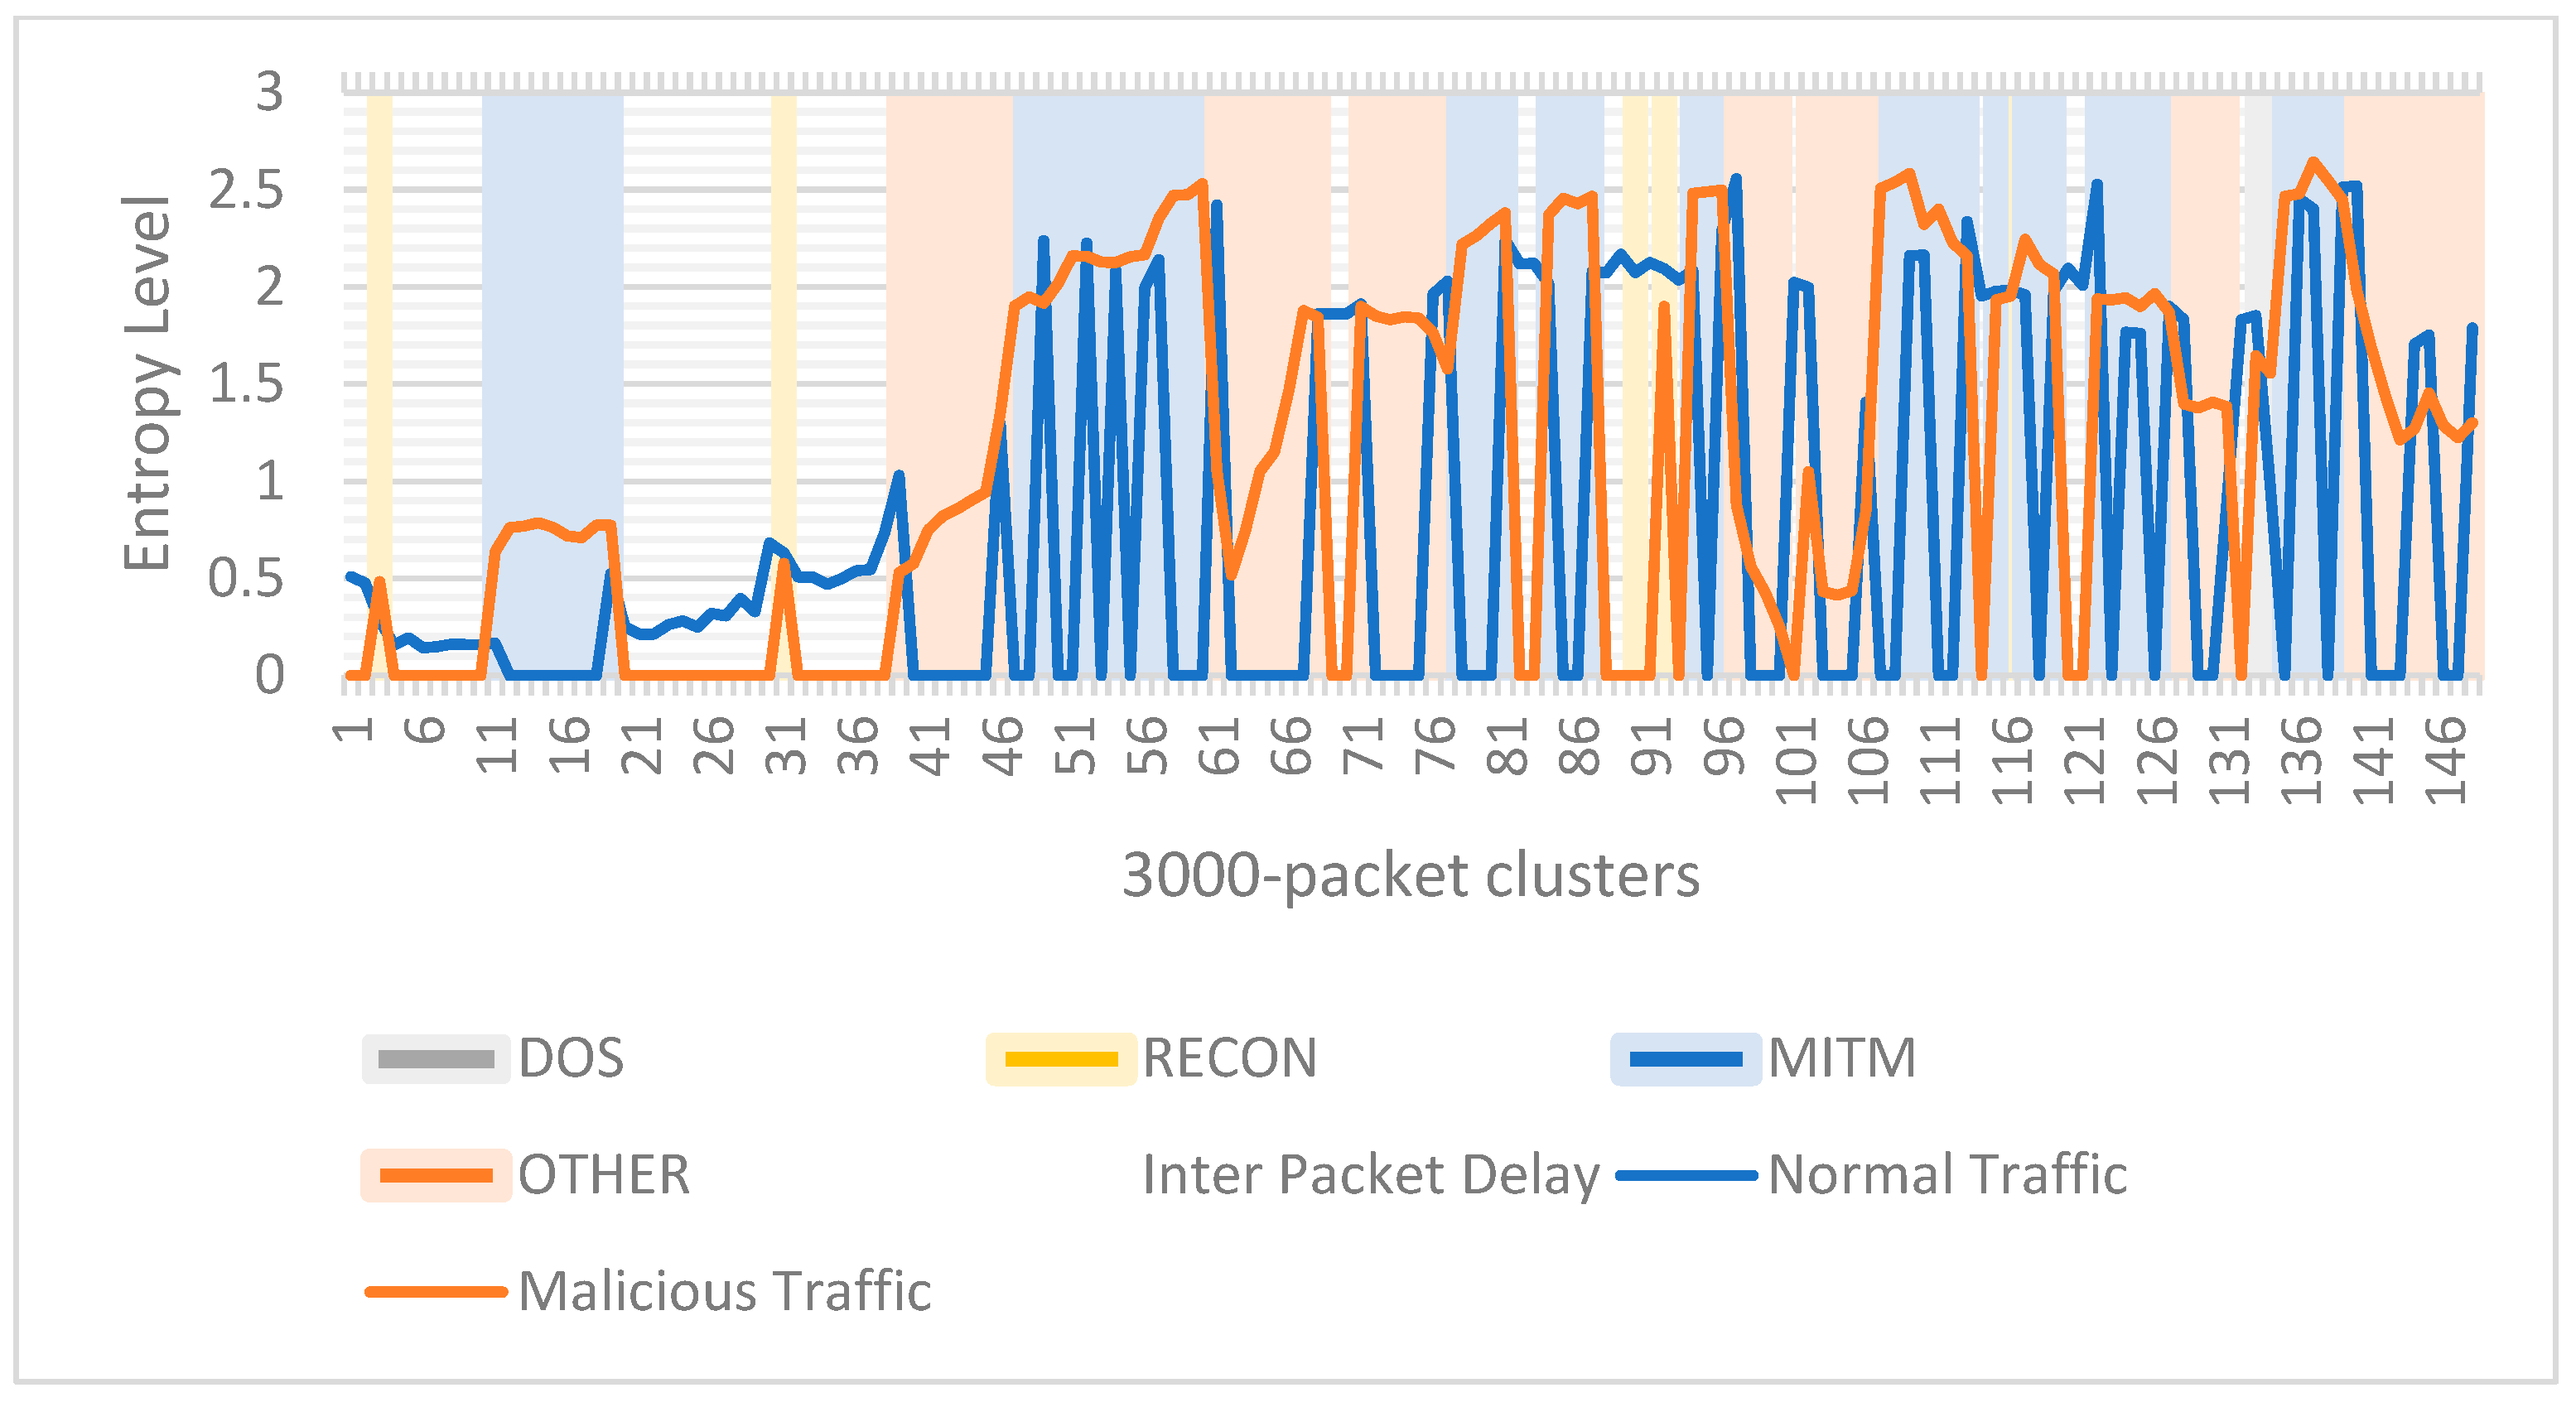
Figure 5 shows packet size entropy per cluster. As entropy reflects the degree of randomness in network traffic, a general expectation is that entropy will be low when network traffic demonstrates similarity in pattern, be it for non-malicious traffic or otherwise. We can observe similar patterns with packet-size entropy except for a few clusters, namely 46–60, 71–74, 106–107, and between 131 and 136. To analyze this behavior, we refer to the entropy analysis graph with attack types in
Figure 6. For clusters 46–60, we see a high percentage of MITM attacks resulting in higher entropy. The same pattern can be seen for 106–107. For clusters 71–74, we see a decrease in MITM traffic, resulting in a decrease in entropy for malicious traffic, and it (entropy) going up again as MITM traffic increases. For clusters 131–136, we can see packet-size entropy for malicious traffic decreasing and then going up, which can be attributed to a rise in MITM, as well as other attacks. Other attacks have been defined in the datasets as “overheat”, “overcool”, “display fake values”, “simultaneous heating and cooling”, “system shutdown”, and “setpoint changing”.
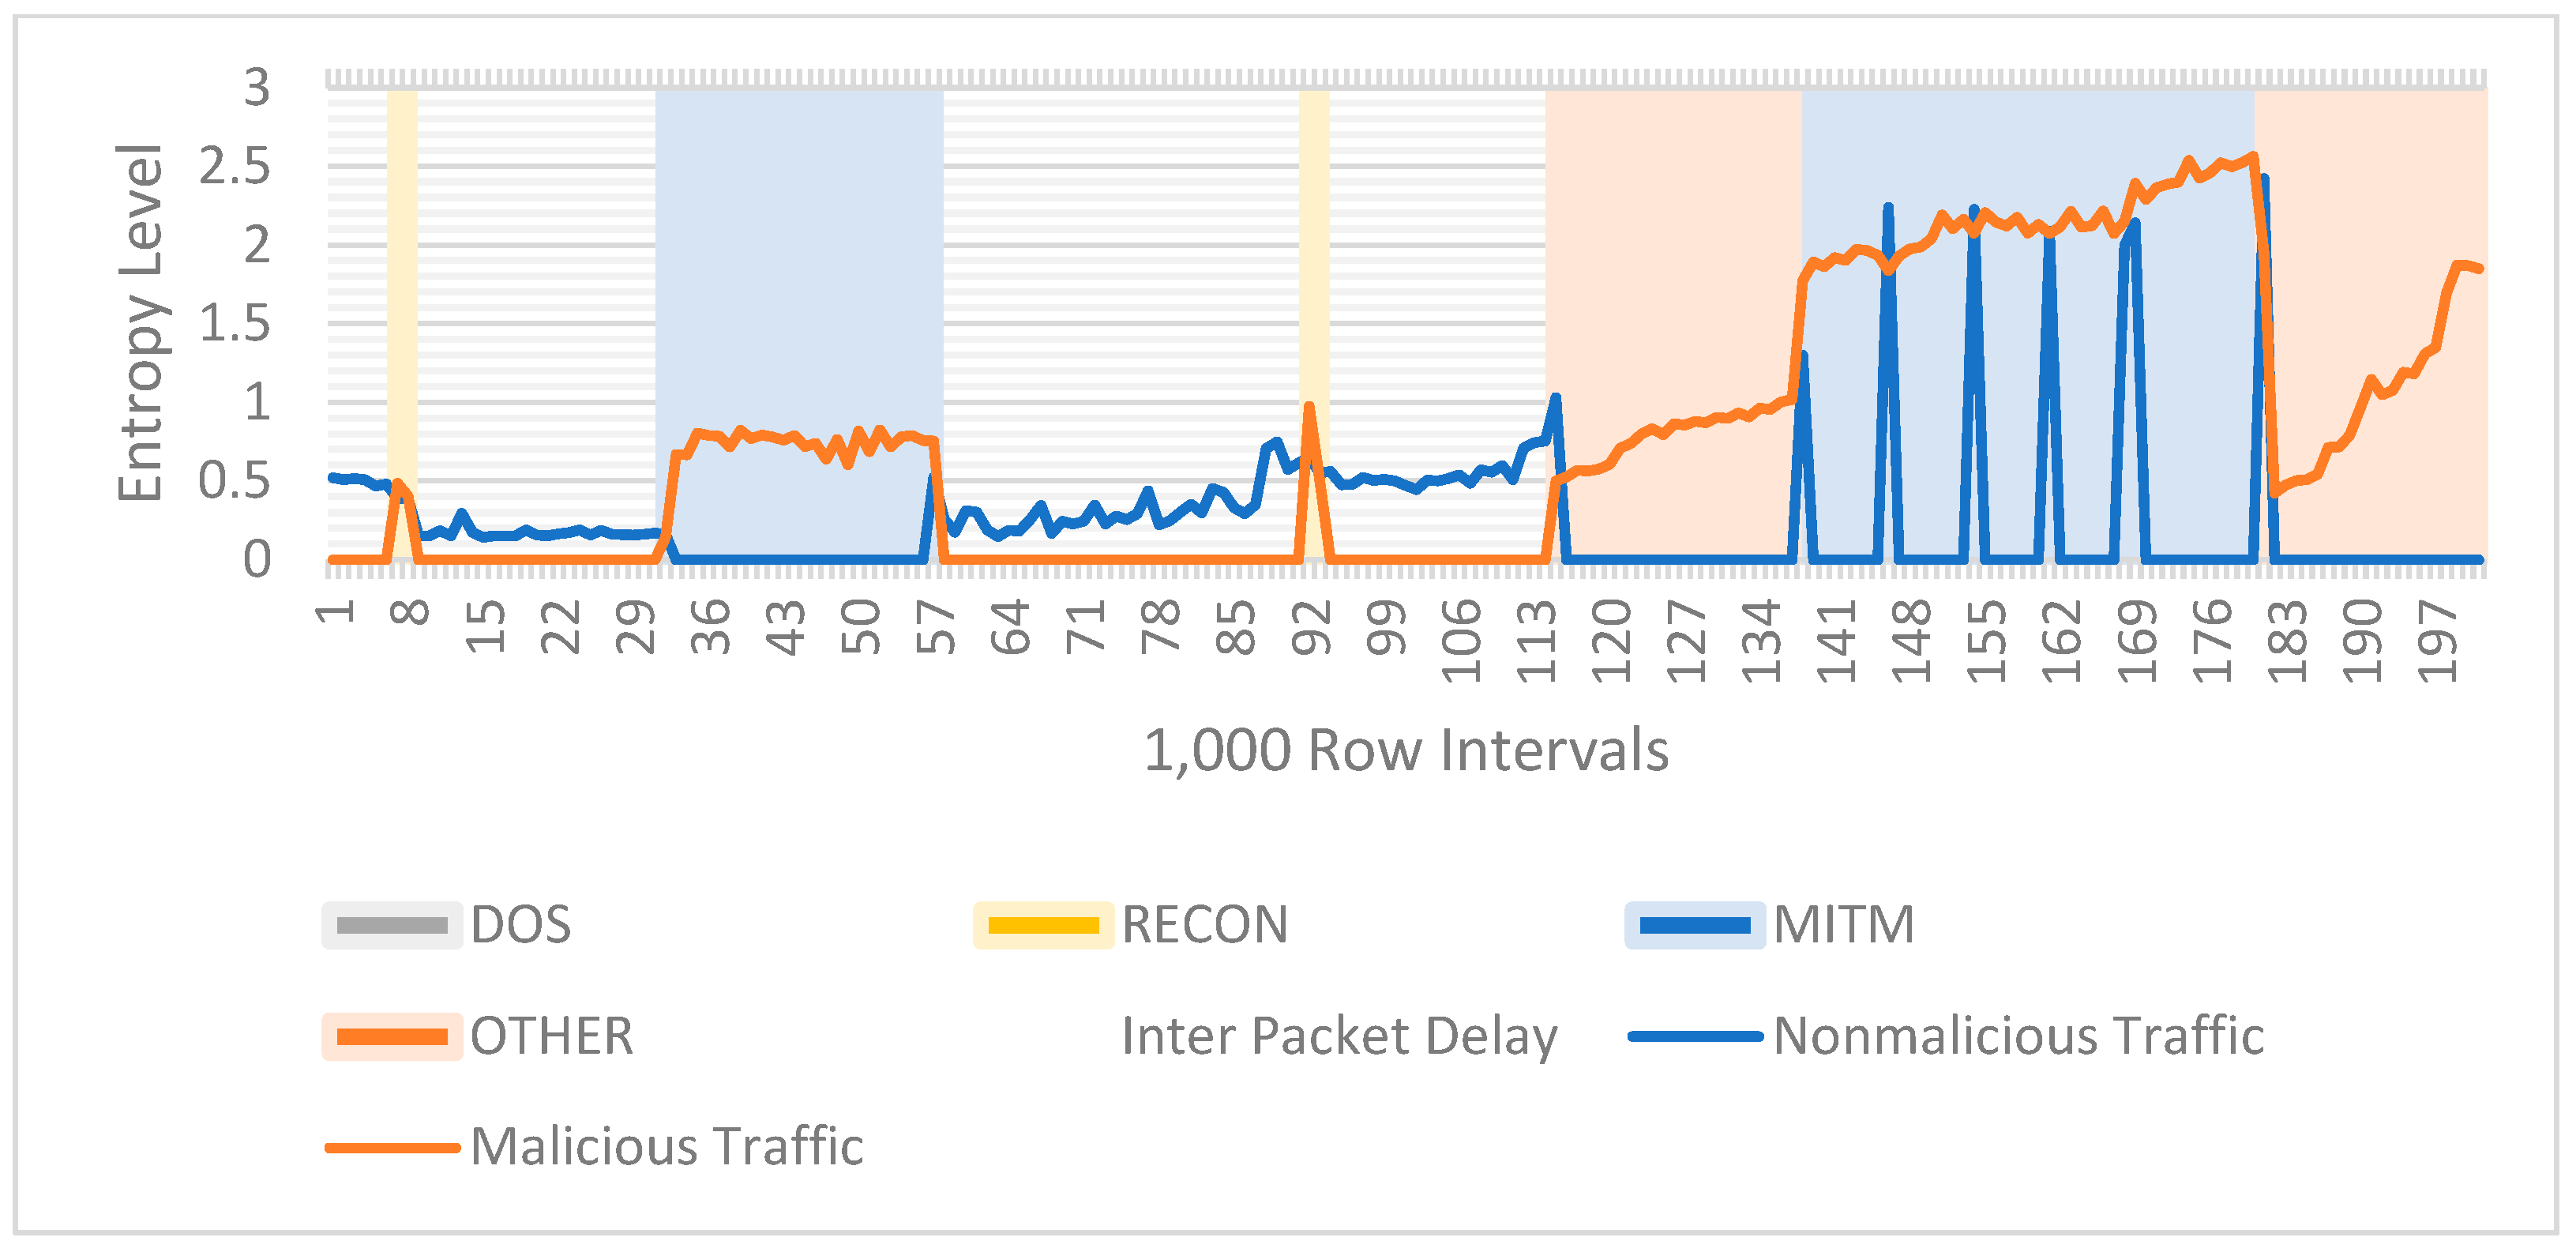
We also see a consistent pattern of higher packet-size entropy for malicious traffic over non-malicious traffic during MITM and DOS attacks. This is evident from
Figure 7, where we have plotted entropy for both malicious and non-malicious traffic with a 1000-packet cluster size.
Inter-Packet Delay (IPD): A similar pattern is observed for IPD in
Figure 8 and
Figure 9, where entropy values, represented by the black line in
Figure 8, move up and down and remain steady for a prolonged period of similar traffic patterns, malicious or otherwise. One outlier observation is noted for clusters 59–61 in
Figure 8, where entropy drops even in the middle of malicious activity, showing less randomness than we anticipated. This can be attributed to high MITM attacks when IPD entropy for malicious traffic is high, which can be observed in
Figure 9. Overall, IPD entropy for malicious traffic shows a consistent pattern of higher values during MITM and DOS attacks, as evident from
Figure 10, showing malicious and non-malicious entropy values with a 1000-packet cluster.
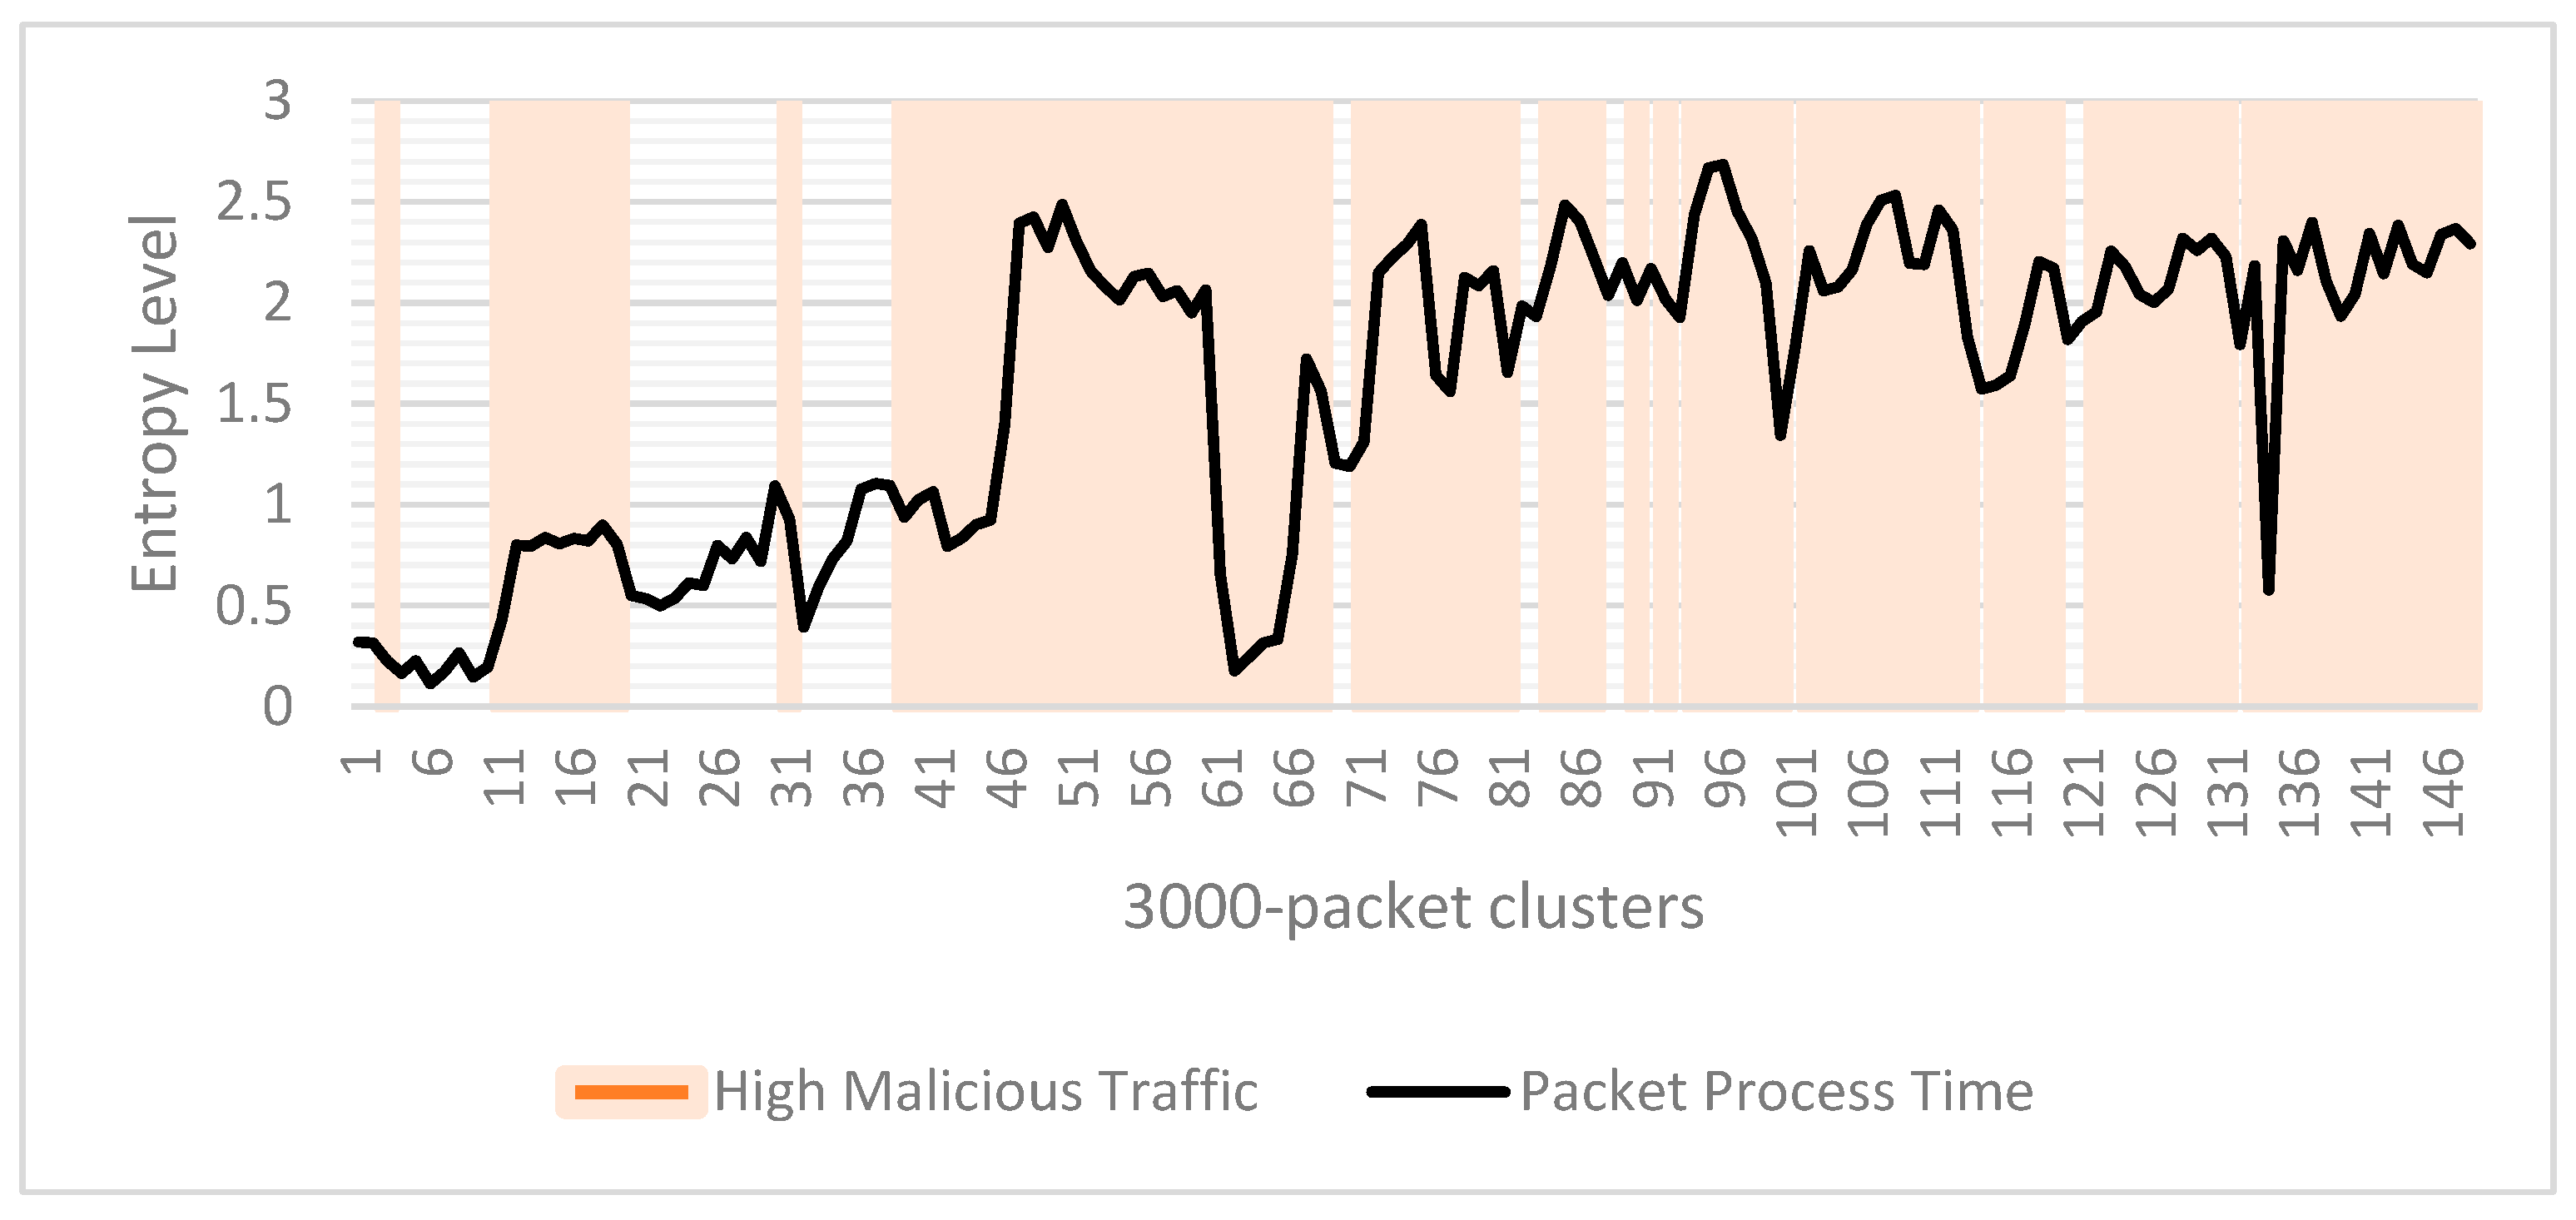
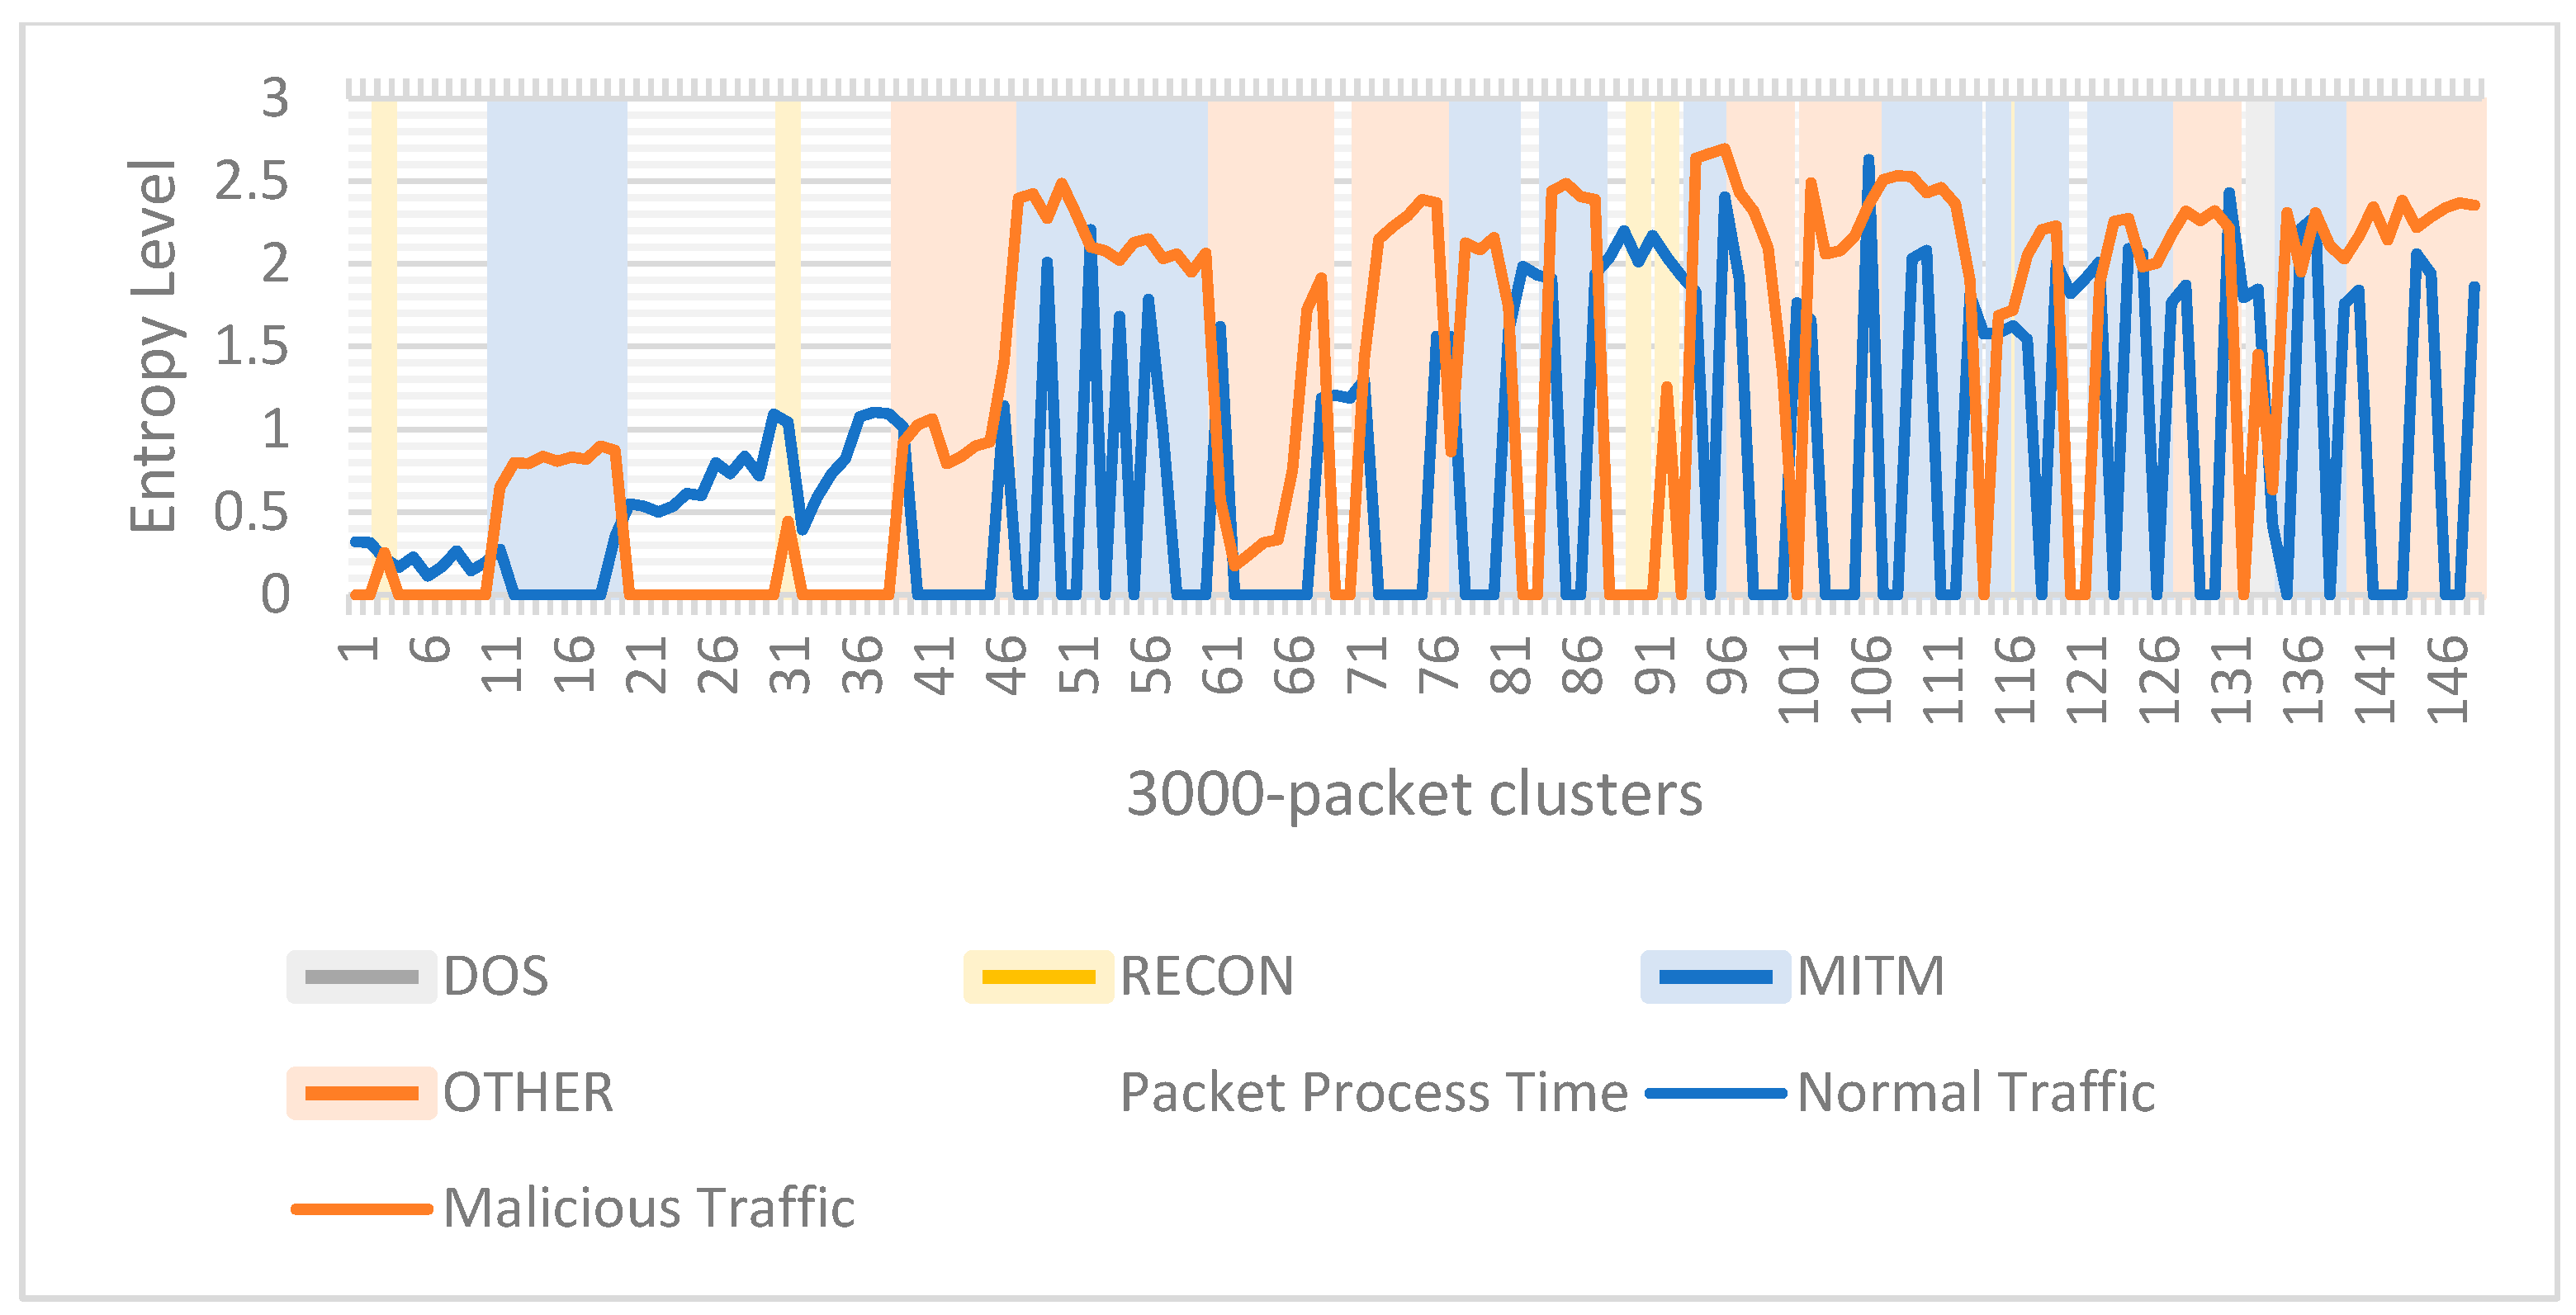
Packet Process Time (PPT): Similar patterns are observed in
Figure 11 and
Figure 12 with outlier clusters 58–61, 96–100, and 132–133. We can use a similar line of reasoning to explain the outliers. PPT entropy consistently shows higher values during MITM and DOS attacks.
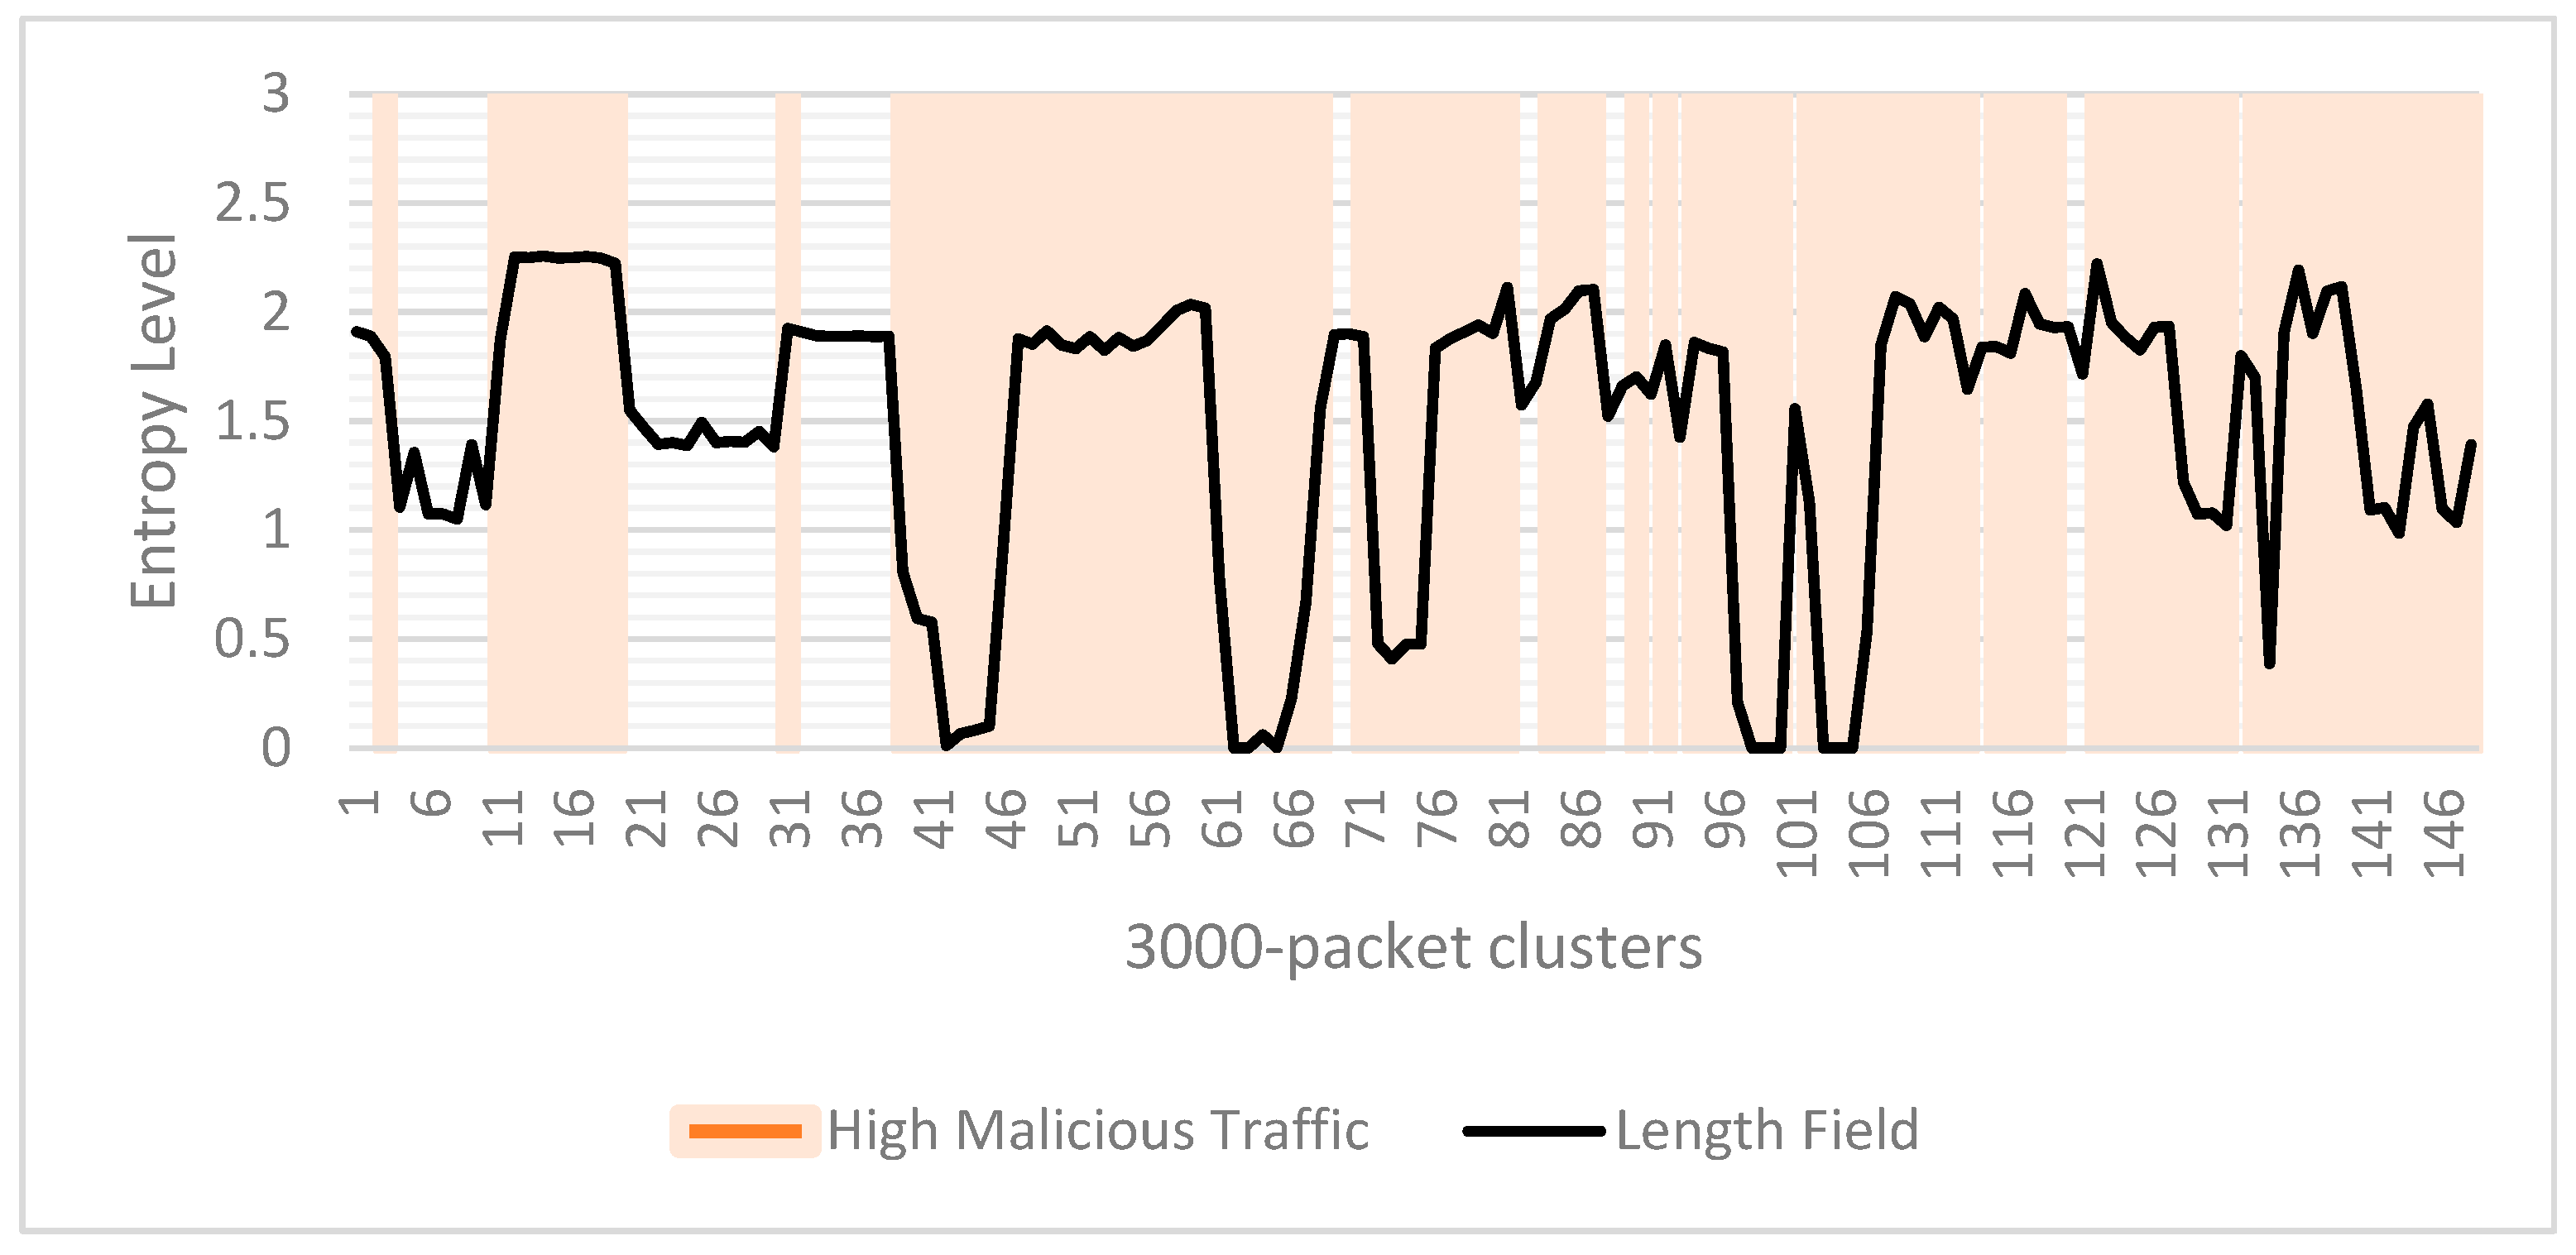
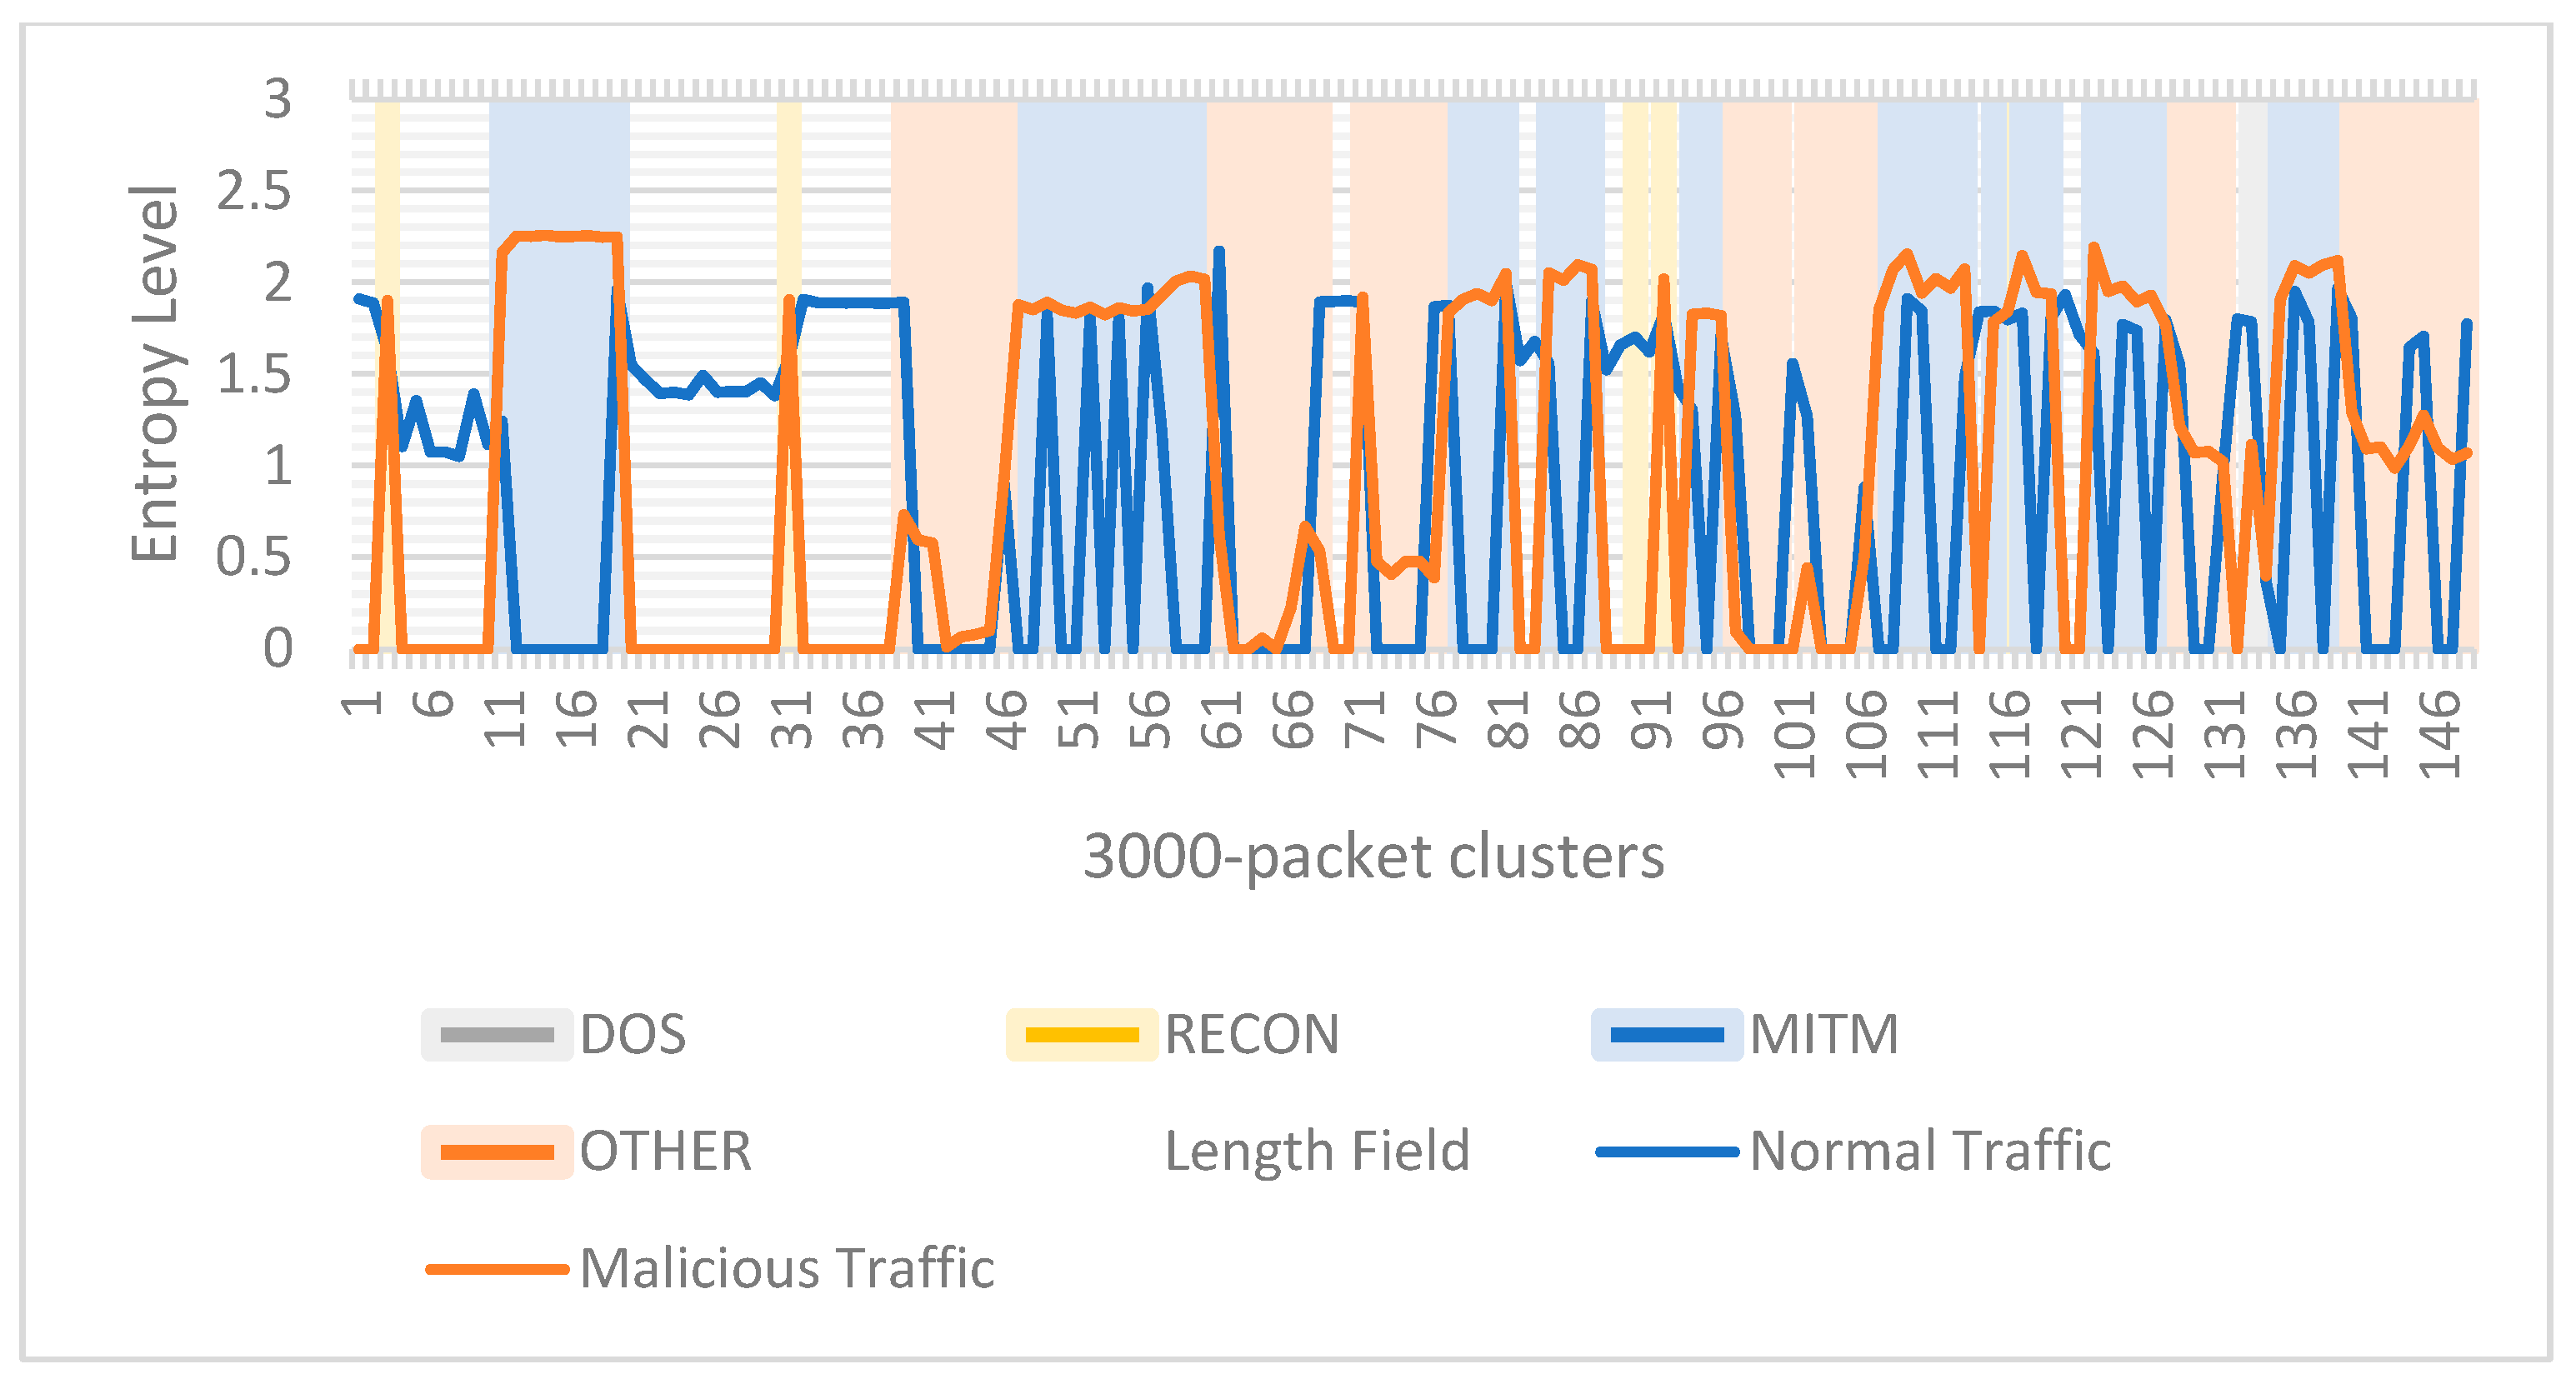
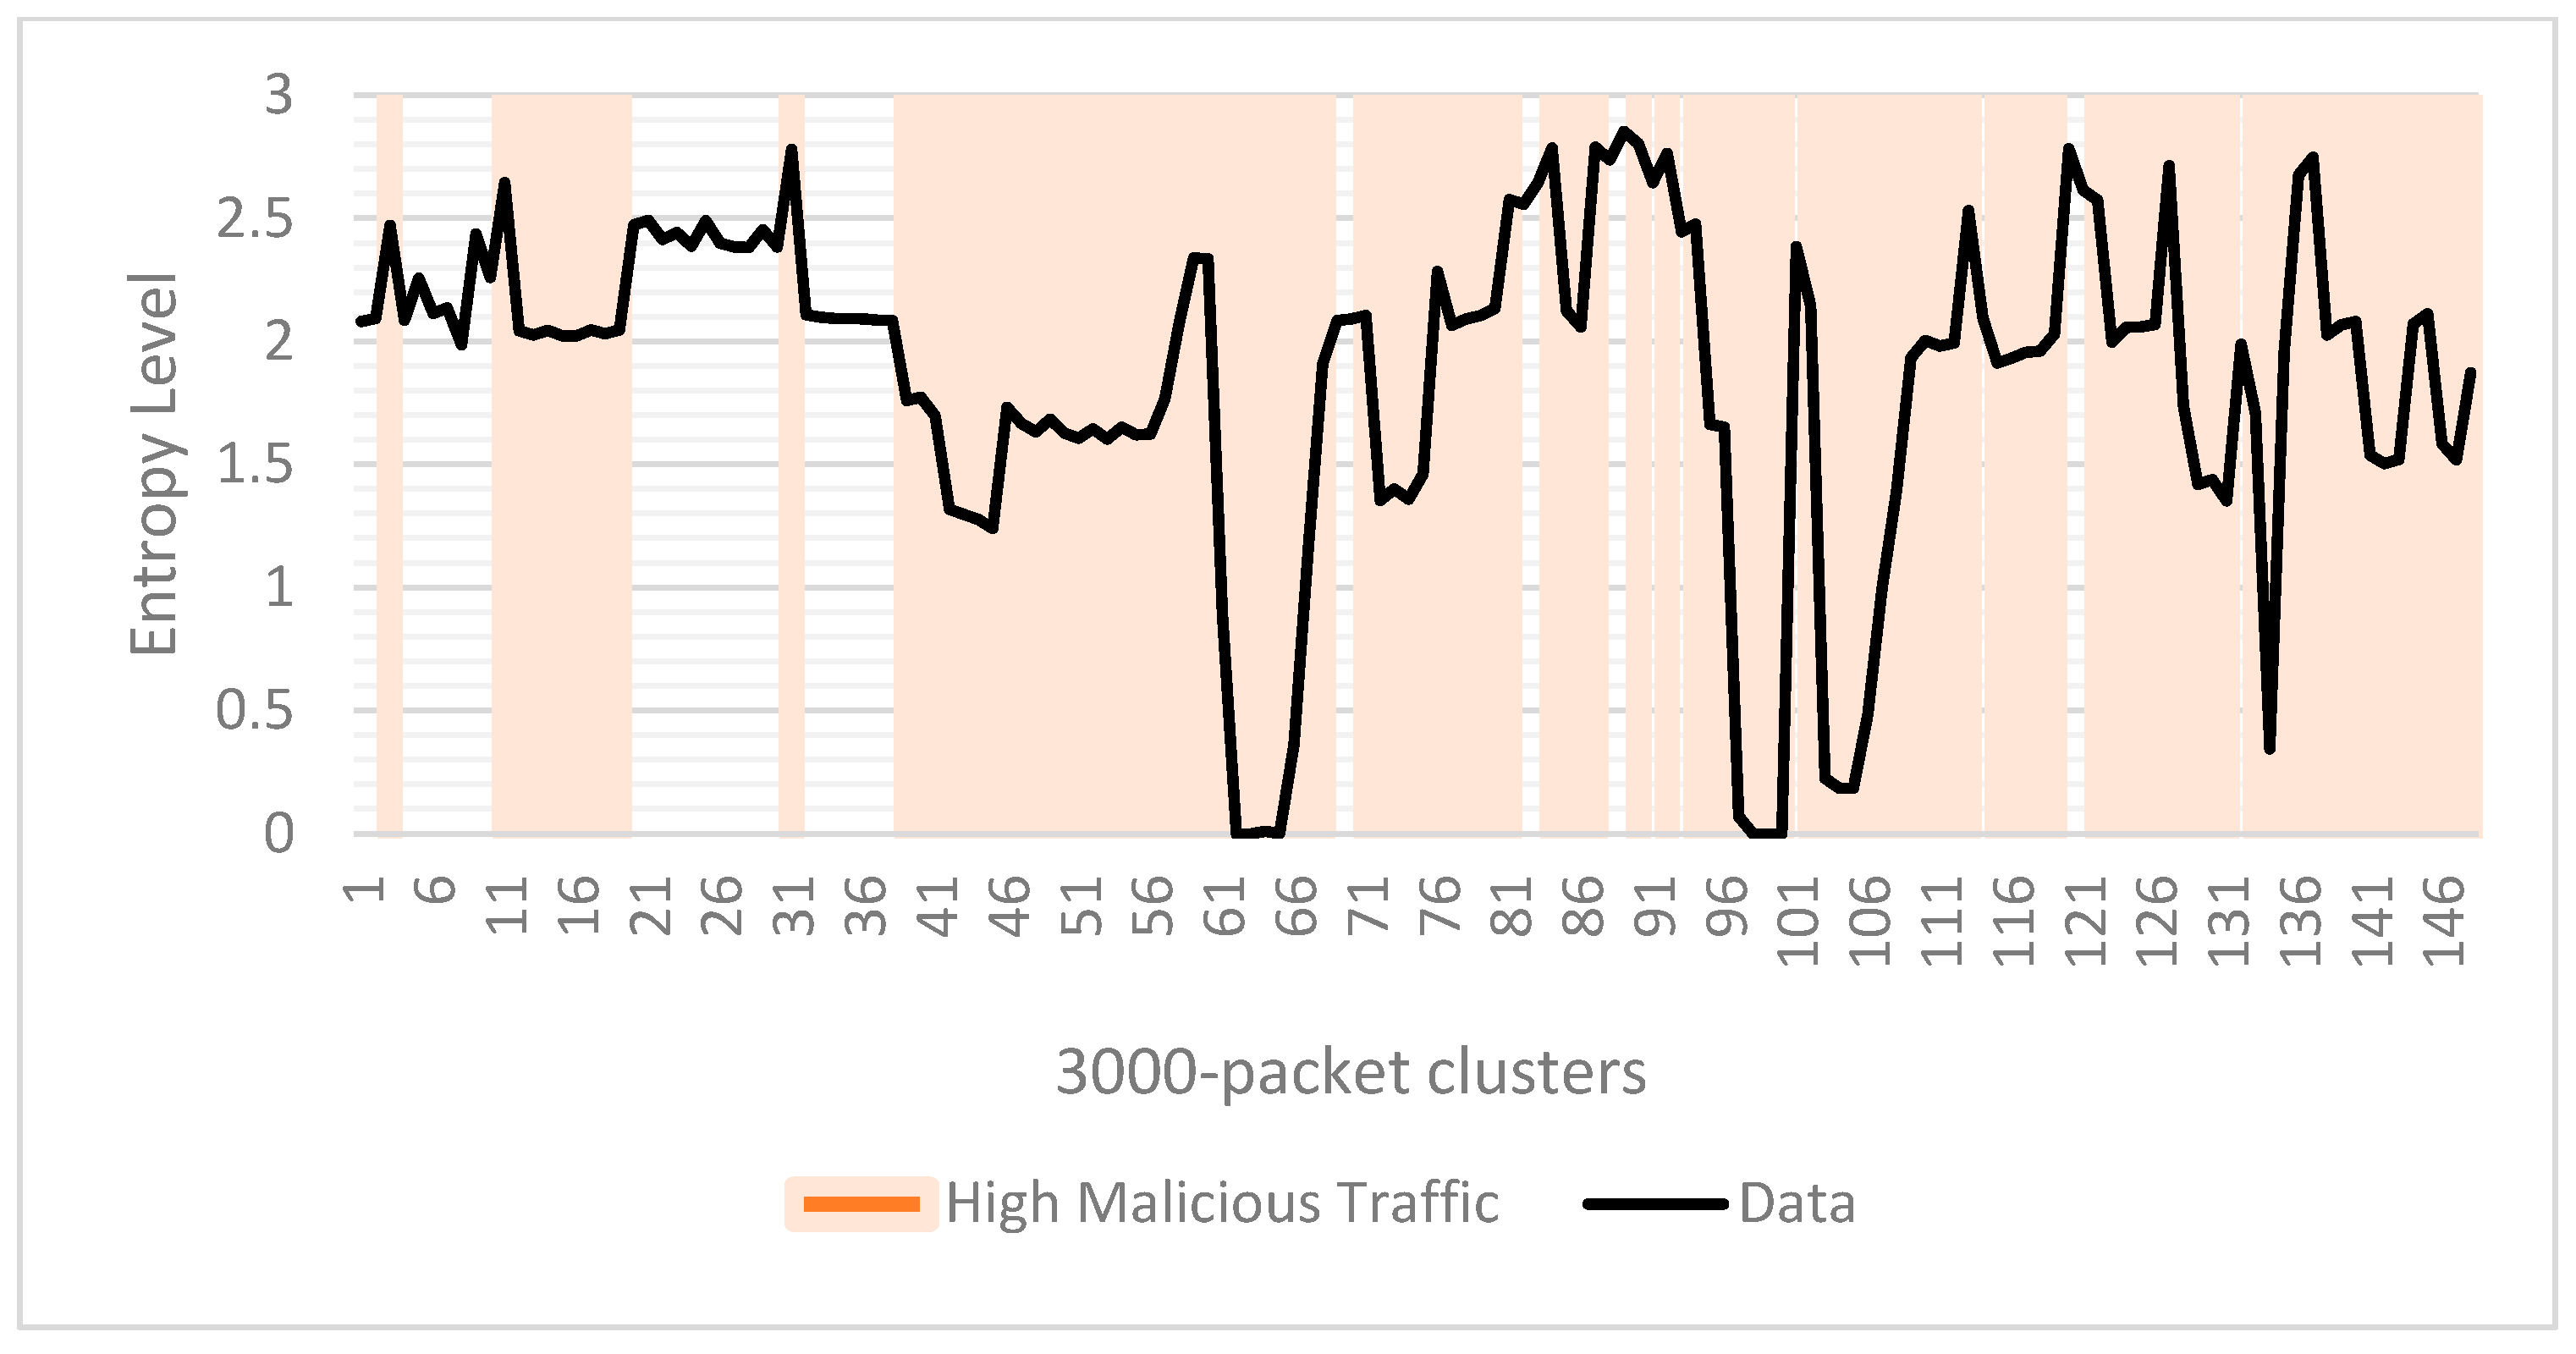
There are some anomalous clusters when analyzing entropy using Length as a feature, and these clusters can be noticed in
Figure 13. We can see that entropy drops in clusters 40–41, 71–72, 95–96, and 131–132, while entropy rises in clusters 46–50, 66–70, 106–109, and 132–134. From
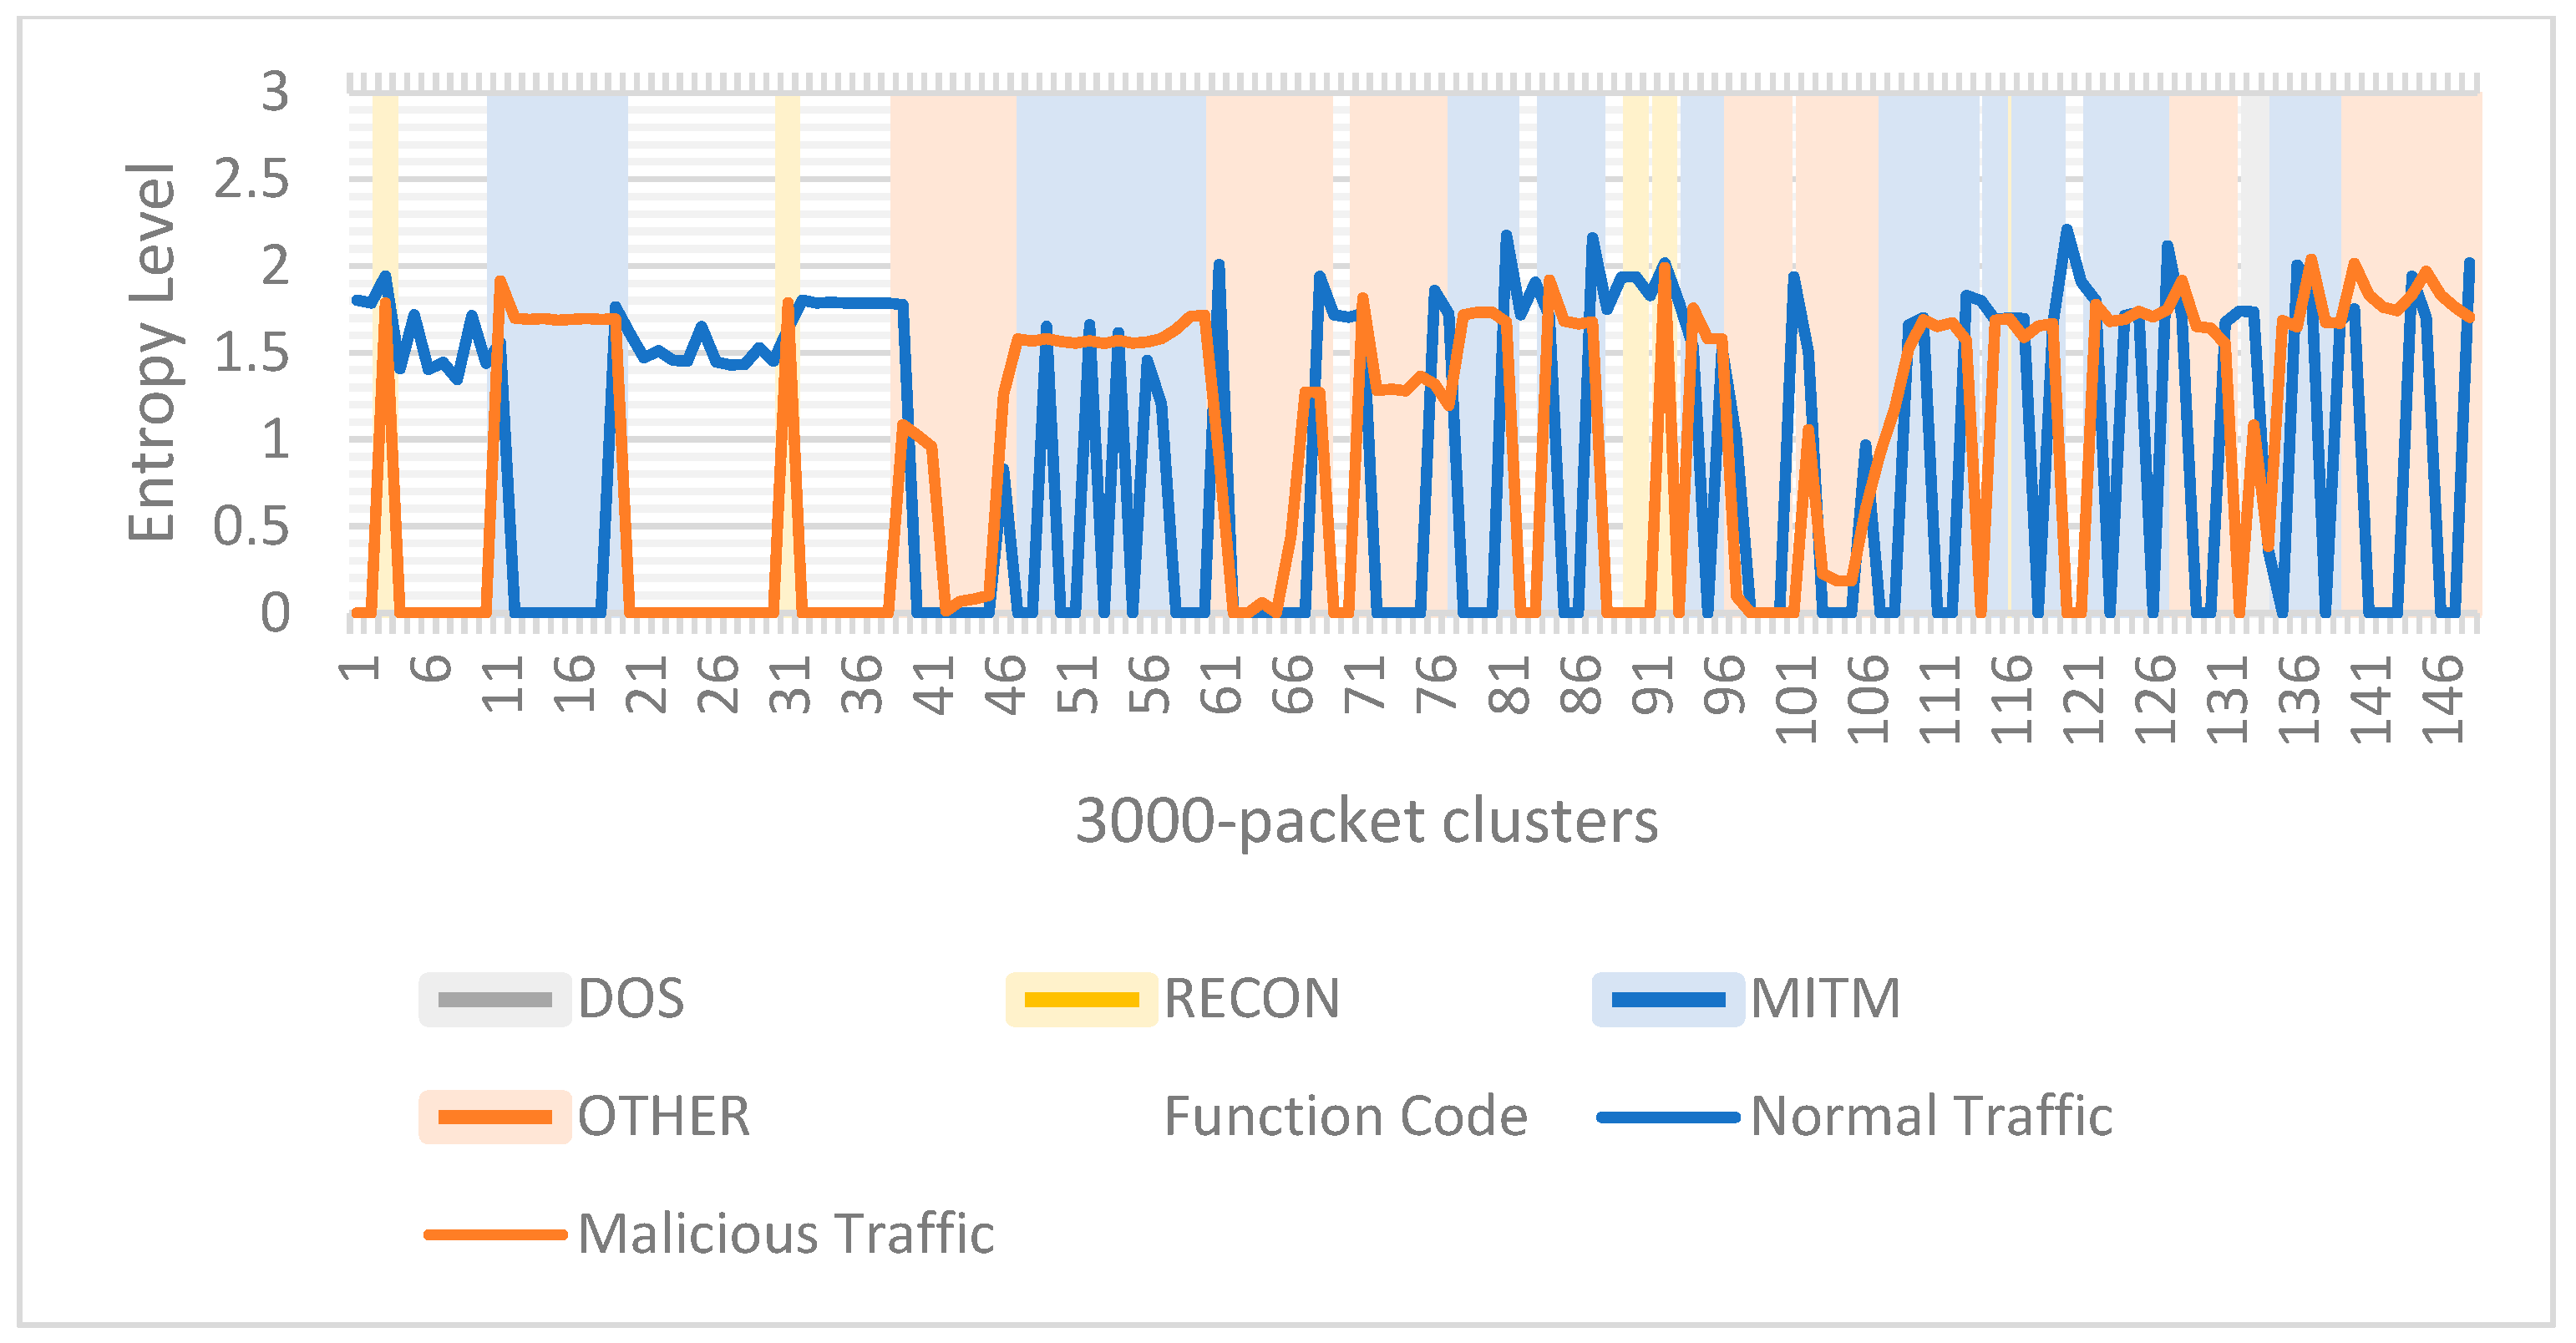
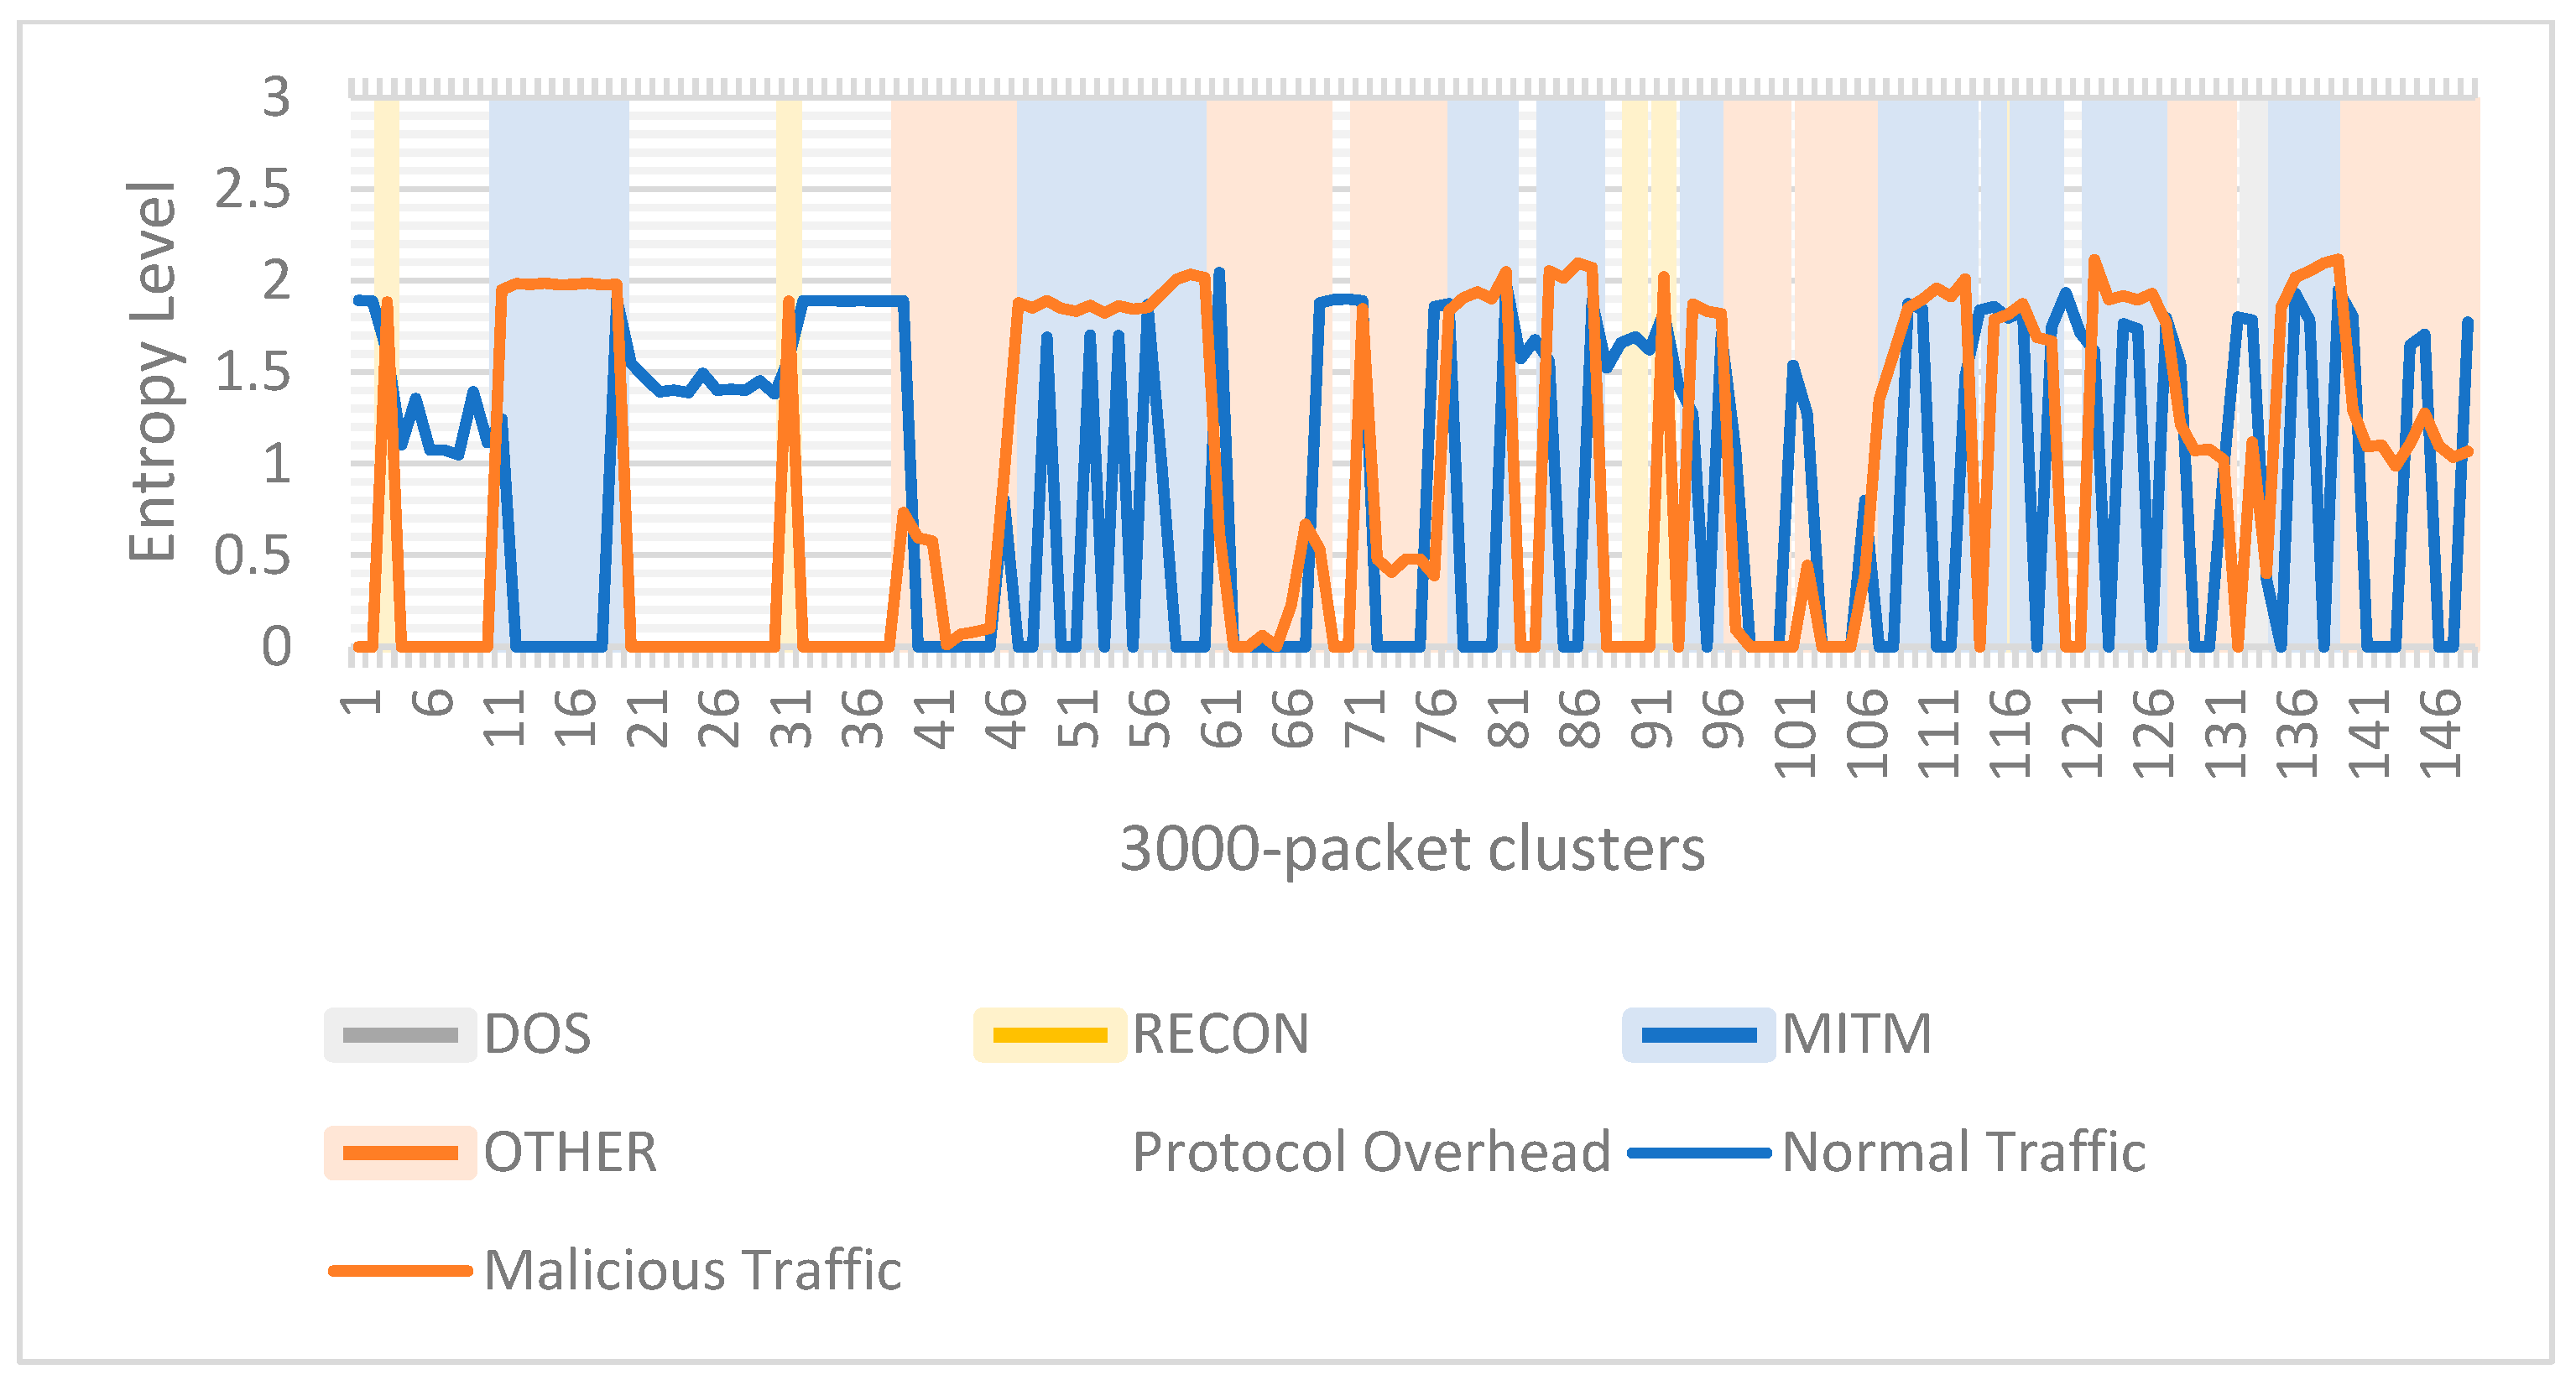
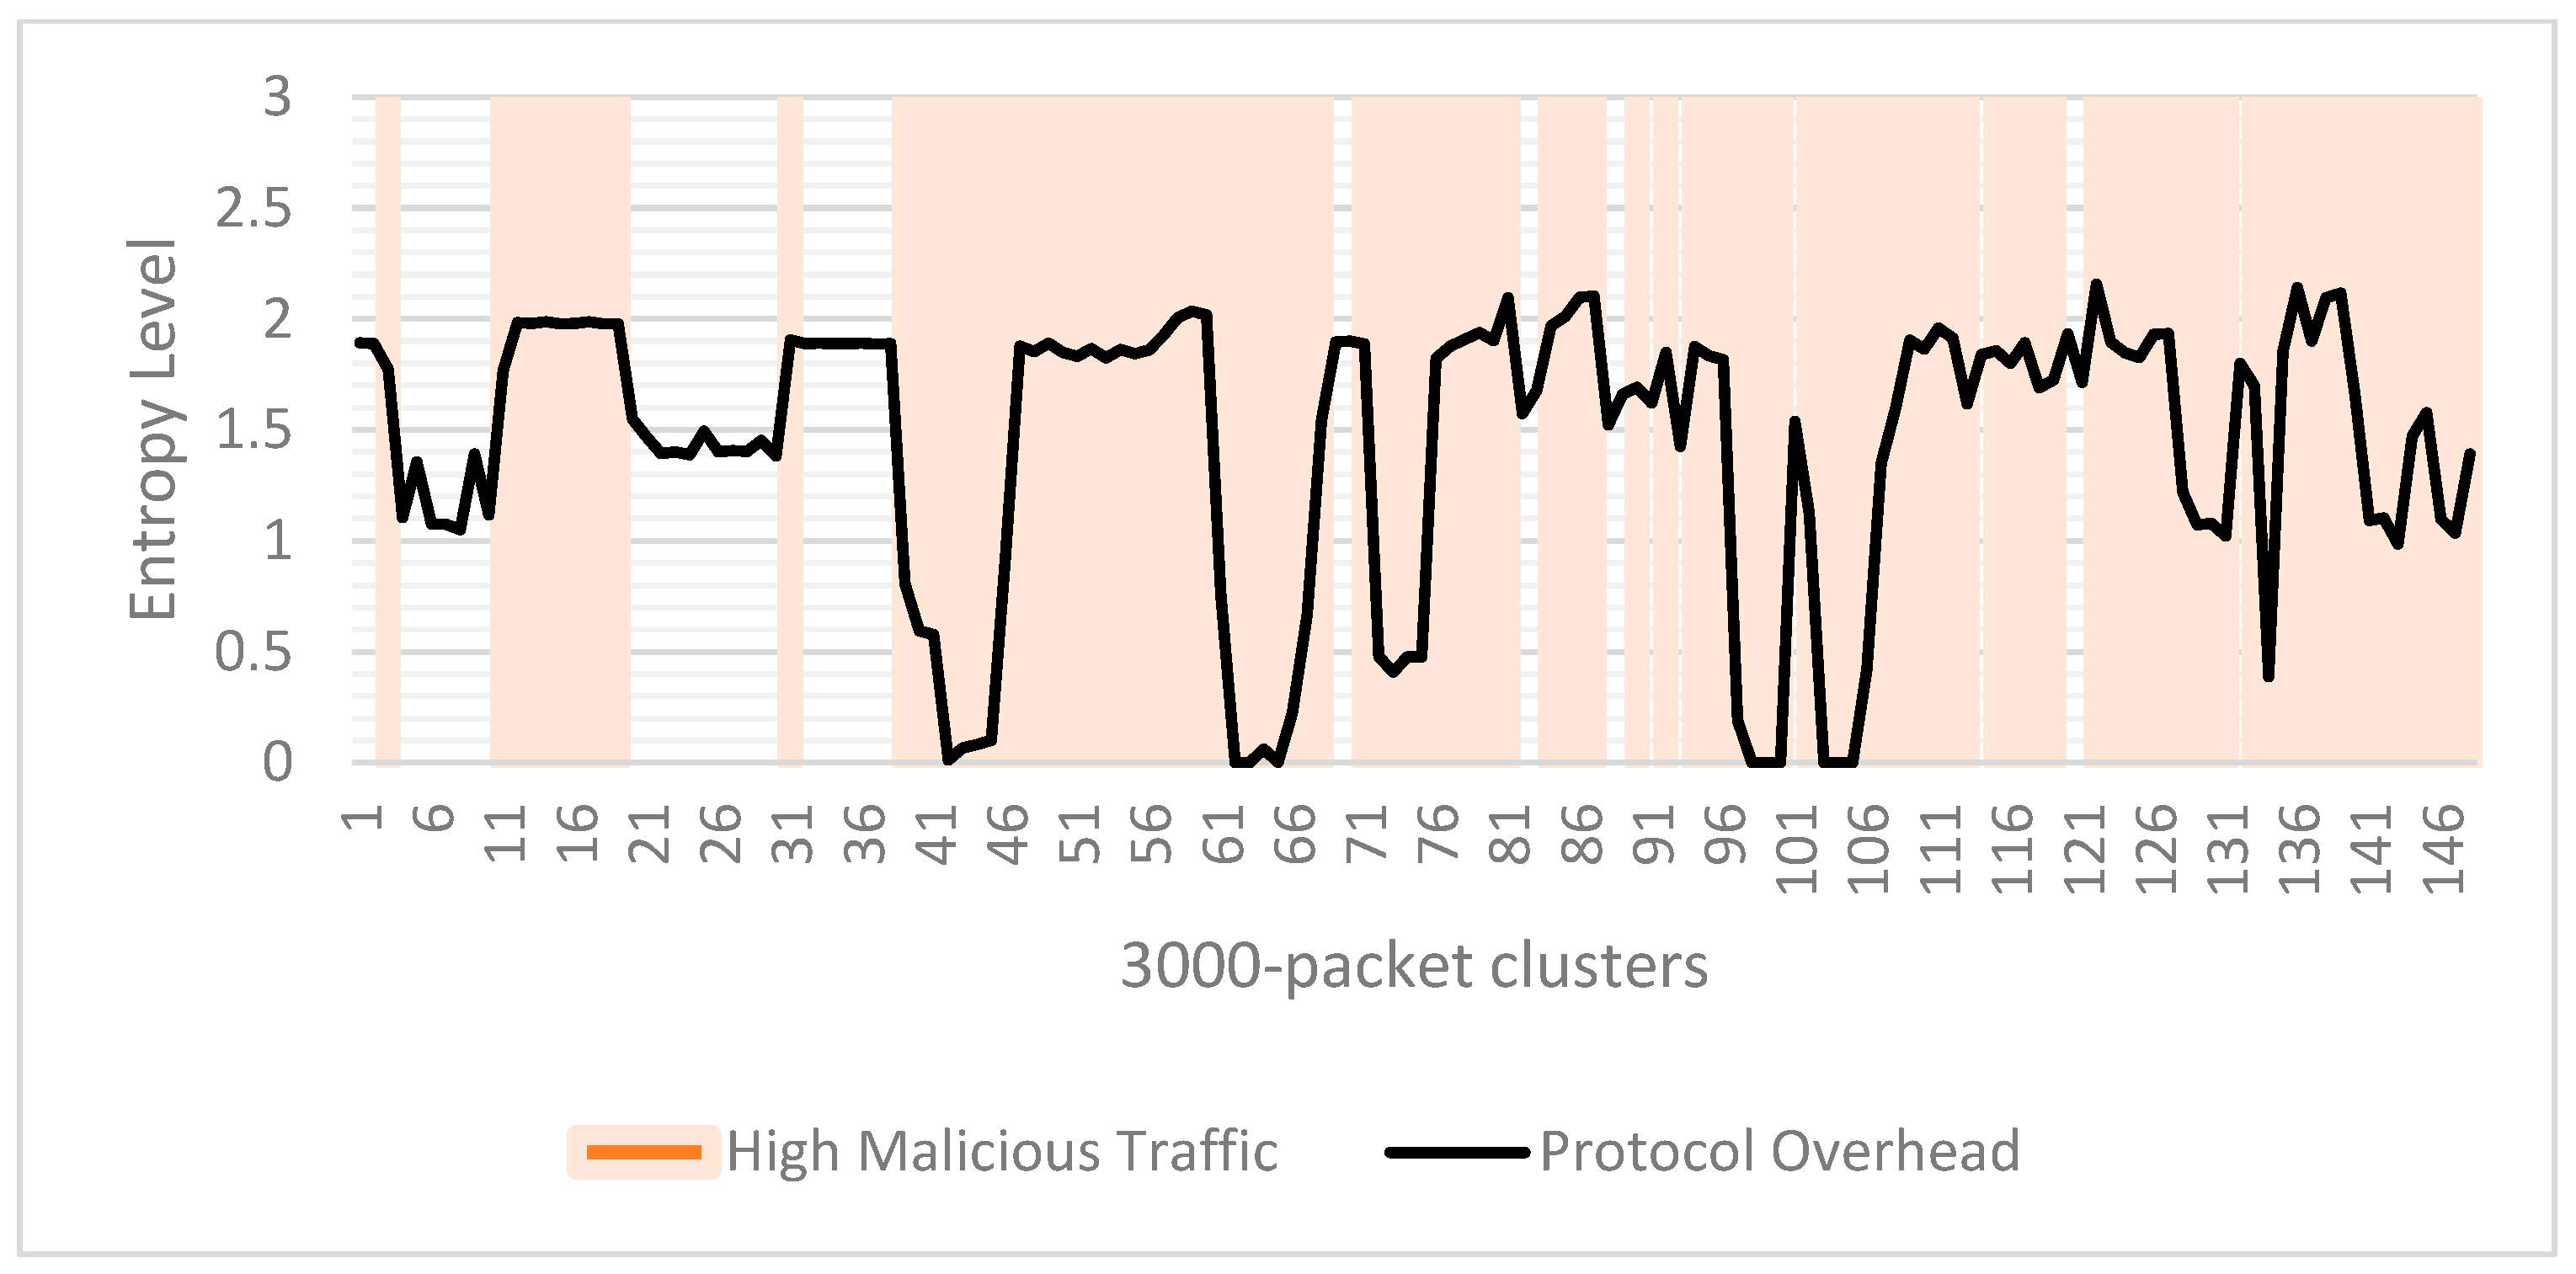
Figure 14, we can observe that clusters 40–41, 71–72, 95–96, and 131–132 all show decreasing activities of MITM traffic, leading to a drop in entropy values. The reverse is seen in the clusters 46–50, 66–70, 106–109, and 132–134, where an increase in MITM results in the rise of entropy. Function code and Protocol overhead show similar patterns of entropy variation that we have observed with Length. The patterns for these two features can be seen in
Figure 15 and
Figure 16 and
Figure 17 and
Figure 18, respectively.
Figure 19 and
Figure 20 show entropy variations per cluster, with attack types and Data as features, respectively. We see a similar pattern there as well.
5. Classification Analysis
After a thorough analysis of the entropy patterns, we decided to use all seven features—packet size, inter-packet delay, packet process time, Modbus frame length, function code, protocol overhead, and data—for classification. We extended our anomaly detection method by conducting a classifier-based analysis of the datasets. Eight different classifiers, including tree-based classifiers, were compared: BayesNet, Naïve Bayes, J48, Simple Logistic, SVM, Multilayer Perceptron, random forest, and Decision Table. Binary classification, performed using Weka’s default values for each classifier, used the features packet size, inter-packet, packet process time, two additional Modbus application protocol header features, Modbus frame length, and function code value. The last two additional features were used since they had high information gain rankings based on the work of [
10].
Due to the imbalanced nature of the data, the classifiers were run using three different data resampling configurations: no resampling; a 50–50 split (50% non-attack data and 50% attack) and an 80–20 split (80% non-attack data and 20% attack). Resampling was conducted using random undersampling and random oversampling. Two different split combinations of the training vs. testing data were used: 60–40% training vs. testing and 75–25% training vs. testing data. For each run combination, the Accuracy, True Positive Rate (TPR), False Positive Rate (FPR), Precision, F-measure, and ROC values were recorded. The objective was to have a lower FPR but higher accuracy, TPR, Precision, F-measure, and ROC.
Accuracy is the number of correct classifications divided by the total number of classifications given by (TP + TN)/(TP + FP + TN + FN).
TPR measures the proportion of actual attacks that were identified as attacks, given by TP/(TP + FN).
FPR, where a non-attack is identified as an attack, is given by FP/(FP + TN).
Precision measures the proportion of positive identification of attacks that were actually attacks, given by TP/(TP + FP).
F-measure is given by 2 × ((Precision × Recall)/(Precision + Recall)).
ROC plots the relation of the TPR vs. FPR.
5.1. Binary Classification Results for the DOS Attack
Since there were more DOS attacks (2.1% of the data) compared to MITM, for the DOS attacks, no resampling performed the best, followed by the 80–20 split. The 50–50 split performed the worst among the three combinations. Although this might sound contrary to intuition [
27] demonstrate how the 50–50 split is not always better. Moreover, since random undersampling and random oversampling were conducted, the results might not have come out as expected.
Comparing the 60–40% training vs. testing split and 75–25% training vs. testing split, both groups performed almost comparably, although the 60–40% results were slightly better. Hence, for the DOS attacks, the results of the unbalanced data with the 60–40% training vs. testing data split are presented in
Table 1.
From
Table 1, it can be noted that, for the DOS data, in terms of accuracy, the best results were obtained by the tree-based classifiers, J48, random forest, and then Decision Table. J48 performed the best in terms of accuracy and precision, but random forest had a higher recall, lower FPR, and higher ROC than J48.
5.2. Binary Classification Results for the MITM Attack
For the MITM attack, the 80–20 split performed the best, followed by no resampling. The 50–50 split performed worse than the other combinations. Comparing the two training/testing splits, both 60–40% and 75–25% performed almost comparably, though the results of 75–25% results were slightly better. Hence, the results for the 80–20 (non-attack vs. attack data) and the 75–25% (training vs. testing split) are presented in
Table 2.
For the MITM attack, too, the tree-based classifiers, J48 Decision Tree, random forest, and Decision Table, performed the best. Although J48 had slightly higher accuracy than random forest, its FPR was slightly higher than random forest, and Precision and ROC were also slightly lower than random forest. So, overall, the J48 and random forest could be considered comparable—it would depend on which statistical measures are being analyzed. Decision Table performed just a little lower than J48 and Random Forest.
Overall, the classification results of the DOS attacks were much higher than the MITM attacks. In terms of classifiers, the J48 and random forest had the best classification results and can be considered comparable. For the DOS attack, no resampling with the 60–40% (training/testing split) had the best results, but for the MITM attack, the 80–20 non-attack vs. attack data with the 75–25% training vs. testing split had the best results.
6. Conclusions
In this article, we presented a detailed entropy analysis using network traffic features followed by a classifier-based analysis to detect anomalies in industrial control systems. We based our work on Modbus over TCP/IP data collected from an HVAC system at the University of Alabama Huntsville research lab. The data had both malicious and non-malicious traffic representing various stages of the HVAC operations (auto cool, auto heat, normal, and random). Of the various attacks that were simulated, we chose the top three that have been discussed in the literature, namely Denial of Service (DOS), Man-in-the-middle (MITM), and Reconnaissance. Our detailed entropy analysis corroborates our earlier findings that, although some degree of anomaly may be detected using univariate and bivariate entropy analysis for DOS and MITM attacks, not much information may be obtained for the initial reconnaissance, thus preventing early stages of attack detection in the Cyber Kill Chain.
We extended our anomaly detection technique using entropy analysis presented in this paper by using a classification-based approach using two Modbus features in addition to the three TCP/IP features selected earlier. Eight different classifiers, including tree-based classifiers, were compared: BayesNet, Naïve Bayes, J48, Simple Logistic, SVM, Multilayer Perceptron, random forest, and Decision Table. Binary classification, performed using Weka’s default values for each classifier, used the features packet size, inter-packet, packet process time, and two additional Modbus application protocol header features: Modbus frame length and function code value. Our results showed that the classification results of the DOS attacks were much higher than the MITM attacks. In terms of classifiers, J48 and random forest had the best classification results and can be considered comparable. For the DOS attack, the unbalanced data with 60–40 (training vs. testing split) had the best results, but for the MITM attack, the 80–20 non-attack vs. attack data with the 75–25% training vs. testing split had the best results.
In conclusion, by using two Modbus features in addition to the three TCP/IP features, the DOS attacks can be classified with a 97.87% average accuracy, no matter which one of the above classifiers is used, using no resampling with 60–40 training vs. testing split. The MITM attack, however, achieved a lower classification accuracy of 82.81% using the same features: an 80–20 split between the non-attack and attack data and a 75–25 training vs. testing split.
7. Future Works
This study is one of the first of its kind to present a detailed entropy analysis of Modbus over TCP traffic to detect anomalies furthered by a classification analysis using Modbus and TCP/IP netflow features. The study can be extended to look at the following:
Using real-life attack datasets to reinforce or confirm our findings;
Using conditional entropy analysis for Modbus and TCP/IP NetFlow features to detect anomalous behavior;
Using Deep Neural Network (DNN) analysis in a cloud environment to detect anomalies on Modbus over TCP ICS network traffic;
Studying whether other attacks can be identified with the same features used in this work.
Author Contributions
Conceptualization, T.G., S.B. (Sikha Bagui) and S.B. (Subhash Bagui); Methodology, T.G., S.B. (Sikha Bagui), S.B. (Subhash Bagui), M.K. and J.B.; Software, M.K. and J.B.; Validation, T.G., S.B. (Sikha Bagui), S.B. (Subhash Bagui), M.K. and J.B.; Investigation, T.G., S.B. (Sikha Bagui), S.B. (Subhash Bagui), M.K. and J.B.; Resources, T.G., S.B. (Sikha Bagui) and S.B. (Subhash Bagui); Data curation, M.K. and J.B.; Writing—original draft preparation, T.G. and S.B. (Sikha Bagui); Writing—review and editing, T.G., S.B. (Sikha Bagui), S.B. (Subhash Bagui), M.K. and J.B.; Supervision and project administration, T.G., S.B. (Sikha Bagui) and S.B. (Subhash Bagui). All authors have read and agreed to the published version of the manuscript.
Funding
This research received no external funding.
Data Availability Statement
The data was obtained from University of Alabama Huntsville Research Lab [
4]. No new data was created.
Conflicts of Interest
The authors declare no conflict of interest.
References
- Cardenas, A.; Amin, S.; Sinopoli, B.; Giani, A.; Perrig, A.; Sastry, S. Challenges for Securing Cyber Physical Systems. In Proceedings of the Workshop in Cyber Physical Systems, Newark, NJ, USA, 22–24 July 2009; pp. 9–25. [Google Scholar]
- Angseus, J.; Ekbom, R. Network-Based Intrusion Detection Systems for Industrial Control Systems. Master’s Thesis, Computer Science, Chalmers University of Technology, Gothenburg, Sweden, 2017. [Google Scholar]
- Koucham, O. Intrusion Detection for Industrial Control Systems. Ph.D. Dissertation, Universite Grenoble Aples, Saint-Martin-d’Hères, France, 2018. Available online: https://theses.hal.science/tel-02108208/file/KOUCHAM_2018_diffusion.pdf (accessed on 7 September 2023).
- Morris, T.; Gao, W. Industrial Control System Traffic Data Sets for Intrusion Detection Research. In Critical Infrastructure Protection VIII, Proceedings of the ICCIP 2014, IFIP Advances in Information and Communication Technology, Arlington, VA, USA, 17–19 March 2014; Butts, J., Shenoi, S., Eds.; Springer: Berlin/Heidelberg, Germany, 2014; Volume 441, p. 441. [Google Scholar] [CrossRef]
- Bouckaert, R. Bayesian Network Classifiers in Weka; University of Waikato, Department of Computer Science: Hamilton, New Zealand, 2004. [Google Scholar]
- Han, J.; Kamber, M.; Pei, J. Data Mining: Concepts and Techniques, 3rd ed.; Morgan Kaufmann Publishers: San Francisco, CA, USA, 2011. [Google Scholar]
- Hussain, Y. Network Intrusion Detection for Distributed Denial of Service (DDoS) Attacks using Machine Learning Classification Techniques. Master’s Thesis, University of Victoria, Victoria, BC, Canada, 2020. [Google Scholar]
- Sebastian, S. Performance Evaluation By Artificial Neural Network Using WEKA. Int. Res. J. Eng. Technol. 2016, 3, 1459–1464. [Google Scholar]
- Almseidin, M.; Alzubi, M.; Kovacs, S.; Alkasassbeh, M. Evaluation of machine learning algorithms for intrusion detection system. In Proceedings of the 2017 IEEE 15th International Symposium on Intelligent Systems and Informatics (SISY), Subotica, Serbia, 14–16 September 2017; pp. 277–282. [Google Scholar]
- Anthi, E.; Williams, L.; Burnap, P.; Jones, K. A three-tiered intrusion detection system for industrial control systems. J. Cybersecur. 2021, 7, tyab006. [Google Scholar] [CrossRef]
- Caselli, M.; Zambon, E.; Kargl, F. Sequence-aware intrusion detection in industrial control systems. In Proceedings of the 1st ACM Workshop on Cyber-Physical System Security, Singapore, 14 April 2015; pp. 13–24. [Google Scholar]
- Eigner, O.; Kreimel, P.; Tavolato, P. Attacks on Industrial Control Systems—Modeling and Anomaly Detection. In Proceedings of the 4th International Conference on Information Systems Security and Privacy, Madeira, Portugal, 22–24 January 2018; pp. 581–588. [Google Scholar] [CrossRef]
- Feng, C.; Li, T.; Chana, D. Multi-level anomaly detection in industrial control systems via package signatures and LSTM networks. In Proceedings of the 2017 47th IEEE International Conference on Dependable Systems and Networks, Denver, CO, USA, 26–29 June 2017; pp. 261–272. [Google Scholar]
- Goh, J.; Adepu, S.; Tan, M.; Lee, Z.S. Anomaly Detection in Cyber Physical Systems Using Recurrent Neural Networks. In Proceedings of the 2017 IEEE 18th International Symposium on High Assurance Systems Engineering (HASE), Singapore, 12–14 January 2017. [Google Scholar] [CrossRef]
- Valdes, A.; Cheung, S. Communication pattern anomaly detection in process control systems. In Proceedings of the 2009 IEEE Conference on Technologies for Homeland Security, Waltham, MA, USA, 11–12 May 2009; pp. 22–29. [Google Scholar] [CrossRef]
- Yang, D.; Usynin, A.; Hines, J. Anomaly-Based Intrusion Detection for SCADA Systems. In Proceedings of the 5th International Topical Meeting on Nuclear Plant Instrumentation Controls and Human Machine Interface Technology, Albuquerque, NM, USA, 12–16 November 2006; pp. 12–16. [Google Scholar]
- Almalawi, A.; Fahad, A.; Tari, Z.; Khan, A.I.; Alzahrani, N.; Bakhsh, S.T.; Alassafi, M.O.; Alshdadi, A.; Qaiyum, S. Add-On Anomaly Threshold Technique for Improving Unsupervised Intrusion Detection on SCADA Data. Electronics 2020, 9, 1017. [Google Scholar] [CrossRef]
- Lee, W.; Xiang, D. Information-Theoretic Measures for Anomaly Detection. In Proceedings of the IEEE Symposium on Security and Privacy, Oakland, CA, USA, 14–16 May 2001. [Google Scholar]
- Ping, D.; Abe, S. Detecting DoS attacks using packet size distribution. In Proceedings of the Bio-Inspired Models of Networks, Information and Computing Systems (Bionetics ’07), Budapest, Hungary, 10–13 December 2007. [Google Scholar]
- Nychis, G.; Sekar, V.; Anderson, D.G.; Kim, H.; Zhang, H. An Empirical Evaluation of Entropy-based Traffic Anomaly Detection. In Proceedings of the 8th ACM SIGCOMM Conference on Internet Measurement, Vouliagmeni, Greece, 20–22 October 2008. [Google Scholar]
- Al-Haidari, F.; Sqalli, M.; Salah, K.; Hamodi, J. An Entropy-based Countermeasure against Intelligent DoS Attacks Targeting Firewalls. In Proceeding of the 10th IEEE International conference on Policies for Distributed Systems and Networks, London, UK, 20–22 July 2009. [Google Scholar]
- Bereziński, P.; Jasiul, B.; Szpyrka, M. An Entropy-Based Network Anomaly Detection Method. Entropy 2015, 17, 2367–2408. [Google Scholar] [CrossRef]
- Squali, M.H.; Firdous, S.N.; Salah, K.; Abu-Amara, M. Classifying malicious activities in Honeynets using entropy and volume-based thresholds. Secur. Commun. Netw. 2012, 6, 567–583. [Google Scholar] [CrossRef]
- Ghosh, T.; Bagui, S.; Bagui, S.; Kadzis, M.; Day, L.; Bare, J. Univariate and Bivariate Entropy Analysis for Modbus Traffic over TCP/IP in Industrial Control Systems. Int. J. Comput. Appl. 2022, 29, 173–181. [Google Scholar]
- Drias, Z.; Serhrouchni, A.; Vogel, O. Taxonomy of attacks on industrial control protocols. In Proceedings of the 2015 International Conference on Protocol Engineering (ICPE) and International Conference on New Technologies of Distributed Systems (NTDS), Paris, France, 22–24 July 2015; pp. 1–6. [Google Scholar]
- Stouffer, K.; Falco, J.; Scarfone, K. Guide to industrial control systems (ICS) security. NIST Spec. Publ. 2011, 800, 16. [Google Scholar]
- Xu, Y.; Goodacre, R. On Splitting Training and Validation Set: A Comparative Study of Cross-Validation, Bootstrap and Systematic Sampling for Estimating the Generalization Performance of Supervised Learning. J. Anal. Test. 2018, 2, 249–262. [Google Scholar] [CrossRef] [PubMed]
Figure 1.
Modbus frame (Acromag Modbus TCP/IP technical reference).
Figure 1.
Modbus frame (Acromag Modbus TCP/IP technical reference).
Figure 2.
Block diagram of our approach.
Figure 2.
Block diagram of our approach.
Figure 3.
Percentage of malicious traffic per cluster.
Figure 3.
Percentage of malicious traffic per cluster.
Figure 4.
Percent of malicious traffic per cluster with attack type.
Figure 4.
Percent of malicious traffic per cluster with attack type.
Figure 5.
Packet size entropy per cluster.
Figure 5.
Packet size entropy per cluster.
Figure 6.
Packet size entropy per cluster with attack type.
Figure 6.
Packet size entropy per cluster with attack type.
Figure 7.
Packet size entropy per cluster with attack type for 1000-packet cluster.
Figure 7.
Packet size entropy per cluster with attack type for 1000-packet cluster.
Figure 8.
Inter-packet delay entropy per cluster.
Figure 8.
Inter-packet delay entropy per cluster.
Figure 9.
Inter-packet delay entropy per cluster with attack type.
Figure 9.
Inter-packet delay entropy per cluster with attack type.
Figure 10.
Inter-packet delay entropy per cluster with attack type for 1000-packet cluster.
Figure 10.
Inter-packet delay entropy per cluster with attack type for 1000-packet cluster.
Figure 11.
Packet process time entropy per cluster.
Figure 11.
Packet process time entropy per cluster.
Figure 12.
Packet process time entropy per cluster with attack type.
Figure 12.
Packet process time entropy per cluster with attack type.
Figure 13.
Length entropy per cluster.
Figure 13.
Length entropy per cluster.
Figure 14.
Length entropy per cluster for attack type.
Figure 14.
Length entropy per cluster for attack type.
Figure 15.
Function code entropy per cluster.
Figure 15.
Function code entropy per cluster.
Figure 16.
Function code entropy per cluster for attack type.
Figure 16.
Function code entropy per cluster for attack type.
Figure 17.
Protocol overhead entropy per cluster.
Figure 17.
Protocol overhead entropy per cluster.
Figure 18.
Protocol overhead entropy per cluster with attack type.
Figure 18.
Protocol overhead entropy per cluster with attack type.
Figure 19.
Data entropy per cluster.
Figure 19.
Data entropy per cluster.
Figure 20.
Data entropy per cluster for attack type.
Figure 20.
Data entropy per cluster for attack type.
Table 1.
Classifier results for DOS No Resampling: 60–40% training vs. testing.
Table 1.
Classifier results for DOS No Resampling: 60–40% training vs. testing.
| DOS: No Resampling |
|---|
| | Accuracy | Recall | FPR | Precision | F-Measure | ROC |
|---|
| BayesNet | 97.54% | 97.50% | 17.00% | 99.30% | 98.39% | 95.30% |
| Naïve Bayes | 96.72% | 96.70% | 17.50% | 99.30% | 97.98% | 90.40% |
| J48 | 99.23% | 99.20% | 18.40% | 99.30% | 99.25% | 92.70% |
| Simple Logistic | 97.03% | 97.00% | 57.20% | 97.90% | 97.45% | 75.20% |
| SVM | 96.83% | 96.80% | 59.00% | 97.80% | 97.30% | 68.90% |
| Multilayer Percep | 97.24% | 97.20% | 36.10% | 98.30% | 97.75% | 91.00% |
| Random Forest | 99.24% | 99.20% | 17.20% | 99.30% | 99.25% | 95.60% |
| Decision Table | 99.14% | 99.10% | 20.60% | 99.20% | 99.15% | 97.00% |
| Average for all classifiers | 97.87% | 97.90% | 30.40% | 98.80% | 98.35% | 88.30% |
Table 2.
MITM Classifier results for 80–20 (non-attack vs. attack): 75–25% training vs. testing split.
Table 2.
MITM Classifier results for 80–20 (non-attack vs. attack): 75–25% training vs. testing split.
| MITM: 80% Non-Attack and 20% Attack |
|---|
| | Accuracy | Recall | FPR | Precision | F-Measure | ROC |
|---|
| BayesNet | 81.80% | 81.80% | 54.70% | 84.90% | 83.32% | 78.40% |
| Naïve Bayes | 79.12% | 79.10% | 77.20% | 80.30% | 79.70% | 55.30% |
| J48 | 86.91% | 86.90% | 43.90% | 87.80% | 87.35% | 84.30% |
| Simple Logistic | 80.34% | 80.30% | 78.40% | 80.30% | 80.30% | 47.10% |
| SVM | 80.34% | 80.30% | 78.40% | 80.30% | 80.30% | 51.00% |
| Multilayer Percep | 82.19% | 82.20% | 70.00% | 82.00% | 82.10% | 65.30% |
| Random Forest | 86.41% | 86.40% | 38.30% | 89.00% | 87.68% | 86.10% |
| Decision Table | 85.35% | 85.30% | 51.20% | 86.00% | 85.65% | 84.20% |
| Average for all classifiers | 82.81% | 82.80% | 61.50% | 83.80% | 83.30% | 69.00% |
| Disclaimer/Publisher’s Note: The statements, opinions and data contained in all publications are solely those of the individual author(s) and contributor(s) and not of MDPI and/or the editor(s). MDPI and/or the editor(s) disclaim responsibility for any injury to people or property resulting from any ideas, methods, instructions or products referred to in the content. |
© 2023 by the authors. Licensee MDPI, Basel, Switzerland. This article is an open access article distributed under the terms and conditions of the Creative Commons Attribution (CC BY) license (https://creativecommons.org/licenses/by/4.0/).


