Abstract
This present study demonstrates the assessment of agricultural drought hazard based on satellite indices for drought risk mapping in part of the South Koel river basin (India) with coverage of (7261 km2). Satellite-based drought indices and NDVI anomalies have been calculated using Moderate Resolution Imaging Spectroradiometer (MODIS) data sets. The variations in vegetation condition from years 2000–2023 for the month of October were examined using additional NDVI and LST products from MODIS data. Vegetation Condition Index (VCI), Temperature Condition Index (TCI), and Vegetation Health Index (VHI) are satellite-based drought indices that were used for agricultural mapping. The study area’s long-term NDVI anomaly demonstrates the negative impact of climate extremes during the past 23 years. Values in drought-prone areas ranged from 10 to 50. The majority of the study area has been severely impacted by drought in 2001, 2005, 2010, and 2023, with water scarcity and mediocre vegetative conditions. Results showed that 59.33% of the study area is in drought risk zone and, among the five districts in the study area, Gumla is in high-risk zone. It covers 610 villages and spans an area of 3275 km2, out of which 2119 km2 with a population of 415,341 are specifically at high risk.
1. Introduction
Drought is one of the world’s most complicated natural phenomena that affect population the most [1]. Sixty percent of the world’s livestock and agriculture industries suffer from drought [2,3].
Due to the wide geographic distribution of dry and semi-arid regions and the scarcity of water resources, drought is one of the most destructive issues and frequent occurrences on the Indian subcontinent, making different regions vulnerable to repeated drought [4,5]. The primary causes of India’s recurring drought are insufficient irrigation water supplies, unpredictable changes in weather patterns, rainfall, excessive runoff, soil erosion, and flash floods, all of which primarily hinder crop growth and lower agricultural land fertility and productivity [6,7,8].
Effective planning for mitigation and adaptation as well as comprehension of climate-induced risks depend on climate risk assessment (CRA) [7,8,9]. The IPCC provides a thorough framework for evaluating climate hazards in its Fifth (AR5) and Sixth (AR6) Assessment Reports [9,10]. This paradigm is essential for understanding the possible effects of climate change and emphasizes the significance of creating effective mitigation and adaptation plans [11]. The World Health Organization (WHO) projects that by 2030, 700 million people could be at risk of being displaced due to drought hazards, and that 55 million people worldwide are impacted by droughts each year [12].
Meteorological, hydrological, agricultural, and socioeconomic are the four main categories of drought [1,13]. Each of these types of drought typically happens in the following order: climatic variability causes a deficit in precipitation, which in turn causes a meteorological drought. This, when coupled with high temperatures and low relative humidity, increases evapotranspiration, which in turn causes an agricultural drought, or a shortage of soil moisture, which lowers crop yield. Long-term precipitation deficits lead to hydrological droughts, which are compounded by human demand placing strain on surface and groundwater supplies [14]. The impact of a limited supply of economic products as a result of hydrological, agricultural, and meteorological drought is associated with socioeconomic drought. Therefore, precipitation deficits, climate change, or meteorological droughts are the causes of all forms of droughts [15].
Using three indices, the Multivariate Drought Index, the Drought Hazard Index, and the Drought Vulnerability Index, ref. [16] evaluated Texas’s overall drought vulnerability [16]. In order to evaluate drought susceptibility, several studies have combined biophysical and socioeconomic aspects [17,18]. Current water-stressed places may be put at risk, and new water-stressed areas may be created, if meteorological drought frequency, severity, or both, increase [19]. In their 2020 study, Vittal et al. examined socioeconomic vulnerability throughout India and linked it to hydro-climatic extremes, such as heat waves, drought, and excessive rainfall [20].
Nowadays, geospatial methods have become essential for identifying and monitoring drought risks [21]. Since the majority of research have demonstrated the effectiveness and precision of geospatial applications in drought monitoring, remote sensing and geospatial applications have become the most effective techniques for monitoring and managing drought-prone areas [22,23]. Data from satellites like Landsat, Sentinel, MODIS, and IRS have been used to map droughts [24], but optical satellite data can be hard to obtain when there are clouds. Hazard maps for Bangladesh were made using GIS and high-resolution information, such as AVHRR. Using Geographic Information Sciences (GIS) and high-resolution (1.1 km) data from sensors like the Advanced Very High Resolution Radiometer (AVHRR), hazard maps for Bangladesh were created [25]. The near real-time data (NRT) product based on MODIS was primarily utilized for mapping the extent of floods and droughts and analyzing their effects across various river basins worldwide [26,27,28].
Several studies have been conducted in India [29,30,31,32] that examined climate change and its impacts on vegetation patterns using satellite-based drought indices, including the Vegetation Condition Index (VCI), Temperature Condition Index (TCI), Vegetation Health Index (VHI), and NDVI anomaly. One of the factors contributing to Jharkhand’s drought, an alteration in vegetation pattern, emerged through these studies [29,33,34,35]. Our research focused on the month of October between the years 2000 and 2017.
In order to detect the onset of drought and measure its severity, length, and impact worldwide, Normalized Differential Vegetation Index, Vegetation Condition Index, and Temperature Condition Index are commonly utilized [23,36]. Numerous earlier studies examined how seasonal and yearly rainfall trends and intensity are affected by climate change and climatic variability [37,38]. Researchers have utilized Vegetation Drought Indices, such as NDVI and VCI, to identify areas that are susceptible to drought [11,12,25]. Singh et al. (2003) [39] monitored the drought in India using the NOAA-AVHRR vegetation and temperature condition indicator. Numerous research studies led to the recognition that index of drought hazard and socioeconomic or environmental vulnerability data sets are essential elements of drought risk assessment [4,40,41,42]. Data sets on population, homes, education (literacy rate), age proportion, labor (agricultural and migrant), family structure, and their social reliance are primarily considered when mapping and examining socioeconomic vulnerability [43,44].
Analysis of the state of Jharkhand revealed that the mean annual temperature increased by 0.57 °C per 100 years between 1881 and 1997 [45,46]. Persistent climatic variability results in a higher rate of extreme events in the study area, a decline in soil moisture, water shortages, and socioeconomic values with extended dry periods, and an increase in evapotranspiration [47,48,49].
Despite Jharkhand’s abundance of precious ores and minerals, the state has many developmental challenges such as a large percentage of marginalized farmers, low per capita income, insufficient irrigation coverage, and a greater rate of vector-borne diseases [50]. Furthermore, Jharkhand is the most climate-vulnerable state in India, according to the DST assessment, and future changes in the state’s climate could cause issues for women, farmers, middle class, tribal people, and the state’s entire biotic and physical ecosystem. To mitigate the adverse impacts of climate change, the state must concentrate and pay attention in order to prepare-climate% vulnerability% assessment accessed on 30 November 2018.
It is crucial to require a micro-level vulnerability assessment because of the state’s high susceptibility and climate fluctuation. Research on vulnerability at the district and block levels will give an accurate indication of the different climate risks, enabling for the creation of resource allocation, adaption planning, development plans, and budget allocation for managing climate hazards and developmental initiatives. The development of a climate adaptable strategy, including district and block-level climate action plans for industries including agriculture, health, forestry, and rural development, will be aided by these findings.
Jharkhand’s massive agrarian population is extremely vulnerable to water scarcity and crop failures due to the state’s high drought risk, irregular rainfall, and inadequate irrigation. According to the above review, Jharkhand is prone to drought, with significant drought research primarily concentrated in the northwestern part of the state [46,50] and the impact of climate change has altered the vegetation pattern. A portion of the Koel river basin in Jharkhand makes up the current study area. Due to unpredictable temperature fluctuations and changing rainfall patterns, the region frequently faced drought, forcing farmers to modify their agricultural practices. Millions of people who live in rural regions are primarily impacted by this drought risk [50,51]. The Koel river basin was not previously taken into consideration for the drought study. Therefore, our work concentrated on mapping drought hazards and risks at the village level using indices for 82 sub-watersheds covering 7261 km2 and 1965 villages. The results of this study will be useful in creating plans for managing drought and setting priorities for sub-watersheds to adapt to climate change, which will help reduce the impact of drought in the area. In order to understand the potential and applicability of each drought index to monitor the drought conditions in the study area, the current study was conducted to assess three drought indices produced from satellites. The current research region is among the twelve districts in the state that are at danger of drought (https://www.downtoearth.org.in). In this context, the current study sought to examine the risk and sensitivity of agricultural drought hazard in the Koel river basin, Jharkhand, using satellite indicators.
2. Study Area
Lohardaga, Ranchi, Gumla, Khunti, and Chakradharpur are the five districts that make up the study area, which is part of the Koel river basin in Jharkhand state. It is situated between 83°57′ E and 86°12′ E longitude and between 22°52′ N and 24°13′ N latitude. With 82 sub-watersheds and an extent of 7261 km2, its topography is undulating. The region’s physiography is gently sloping, and the Koel and Karo rivers receive high flow from the mean annual rainfall of about 1000 mm [46]. There are two types of soil texture: fine-loamy and coarse-loamy. In the study area, summer, the rainy season, and winter are the three primary seasons. March to June is considered the summer season, with May being the hottest month. The winter season lasts from November to February of each year. Mid-June to October is when the rainy season begins. Figure 1 displays the study area location map.
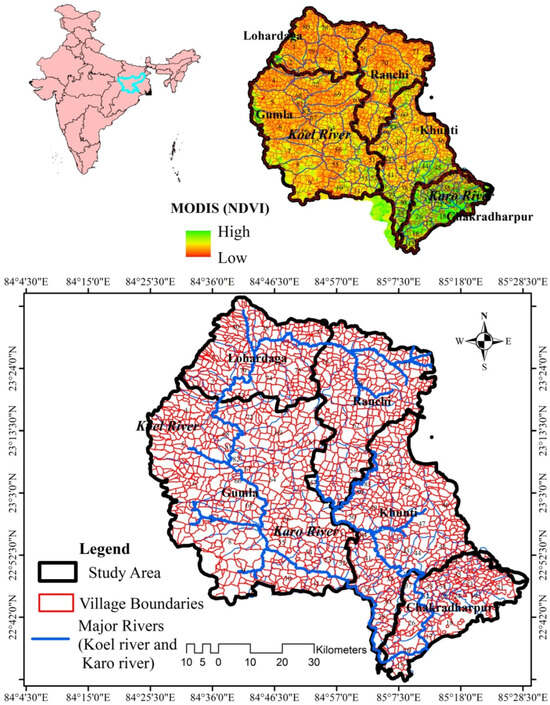
Figure 1.
Distribution of villages in the Koel river basin within the study area.
As the majority of rainfall occurs over the hard rock terrain, water drains off as runoff with minor infiltration, leading to water scarcity and a concomitant reduction in crop quantity and quality. Over the last 40 years, Jharkhand experienced disastrous drought occurrences, which resulted in a reduction in agricultural productivity and increased water scarcity zones [51], and the present study area comes under a high drought risk zone [46,51].
3. Material and Methods
3.1. NDVI Anomaly and Drought Indices
The current study calculated satellite-based drought indices and NDVI anomalies using Moderate Resolution Imaging Spectro Radiometer (MODIS) data sets. The U.S. Geological Survey (https://earthexplorer.usgs.gov.in) and Google Earth Engine (GEE) version 5.3.9 provided the MODIS data sets. The changes in the vegetation condition pattern in the study area during the last 23 years (2000–2023) for the month of October were examined using additional NDVI and LST products from MODIS data. Since the study area crops reach full growth around this period, October was taken into consideration. NDVI MODIS data, MOD13Q1, with a cell size of 1000 × 1000 m, was downloaded at 16-day intervals between 2000 and 2017. All raw NDVI values were scaled by a factor of 0.0001. The NDVI MODIS (MOD13Q1) and MODIS LST (MOD21A1D.061) data sets for the 2018–2023 period were downloaded by GEE. The Vegetation Condition Index and the October NDVI data were compared for additional analysis. It was determined how the Vegetation Condition Index changed for the month of October throughout the previous 23 years (2000–2023). The ArcGIS environment’s Raster Calculator was used to determine the study’s long-term fluctuations in the state of the agricultural patterns. When mapping the socioeconomic vulnerability zones in the study area, Census data factors such as population density, household density, total male population, total female population, and literacy rate were taken into account. Each of the five criteria was extracted from the 2011 Census of India survey database. Methodology adopted for this study has been shown below in Figure 2.
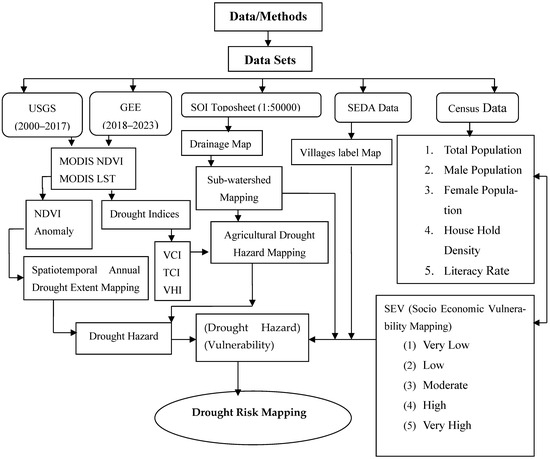
Figure 2.
The methodology chart used in the present study.
3.2. Agricultural Drought Hazard Assessment
The most important and simple NDVI-based method for mapping dry zones is NDVI anomaly. It makes use of a pixel or area’s long-term NDVI mean at a specific moment [52]. A positive NDVI variation denotes normal or conditions free of drought, whereas a negative value denotes severe drought conditions [53].
In order to determine NDVI anomaly, firstly the mean NDVI () of the month of October for each year has first been assessed using Equation (1):
where the mean NDVI value for the month of October in the year is represented by and is the first 16 days NDVI composite to , which is the last 16 days NDVI composite during the month of October of 1 year.
After calculating for each October month of 23 years, the overall mean (NDVI) of entire NDVI means of October month was then assessed by using the expression shown below (Equation (2)):
where n in equation represents the number of years, i.e., 23 years.
The NDVI anomaly for October of 23 years was then calculated for each grid cell located inside the study area using the technique shown in Equation (3) [54].
where is the NDVI anomaly for the month of October of during i years.
The NDVI anomaly classification scheme, which comprises drought, moderate drought, and severe drought zones, is the source of the drought severity classification scheme utilized in this work [54].
3.3. Drought Hazard Based on Indices
Due to its ease of computation, lack of reliance on station observation data, and ability to give improved near-real-time data globally, the Vegetation Condition Index (VCI) is an essential and widely applicable drought index. A pixel’s NDVI value is linearly scaled by the VCI between the historical minimum and maximum values for that time period or month. The range of its values is 0 to 100. Low VCI readings are typically thought to be a sign of drought. NDVI (Normalized Differential Vegetation Index) was used to calculate VCI using Equation (4). The MODIS data products for October were used in this study.
In addition to the maximum and minimum NDVI values of specific data from several years, the VCI for the current month is defined. VCI is a number between 0 and 100; a low value denotes unfavorable or poor vegetation conditions, while a high value denotes optimal and good vegetation conditions.
The LST (land surface temperature) product from MOD11C3 and MOD21A1D.061, which was determined using the following formula, was used to calculate TCI (Equation (5)):
where LSTi, LSTmin, and LSTmax are defined as the LST of the current month and the maximum and minimum LST values in multi-years. TCI value ranges from 0 to 100, where low TCI indicates an unfavorable vegetation condition, and high TCI indicates an optimum vegetation condition.
Compared to using just one drought index indication, the VHI calculated from VCI and TCI offers a more accurate assessment of the occurrence of drought. Equation (6) was used to determine VHI:
VHI = 0.5VCI + 0.5TCI
TCI, VCI, and VHI data were further categorized into severity groups. A drought zone map was made by combining data from drought indices like VCI, TCI, and VHI, showing areas with values under 20 as drought severity zones and areas with values over 50 as no-drought zones [55].
3.4. Village-Wise Socioeconomic Vulnerability (SEV) Mapping
Several previous researchers examined the drought susceptibility in Jharkhand [46,51,56,57]. The susceptibility of a socioeconomic system to natural catastrophes is known as vulnerability. Numerous elements influence it, such as the state of human settlements, infrastructure, and capacity for organization, gender relations, social inequality, and economic trends. The current study employed data sets from Census surveys to determine socioeconomic risk at the village level. Five data sets have been downloaded for this study, i.e., population data from SEDAC and the Census of India, 2011. Data sets were used to compute village area population and demographics (number of male population, number of female population, household density, and literacy rate). Spatial maps of these data sets were prepared in the ArcGIS 10.4 platform (Figure 3 and Figure 4), which helped in the socioeconomic vulnerability (SEV) mapping.
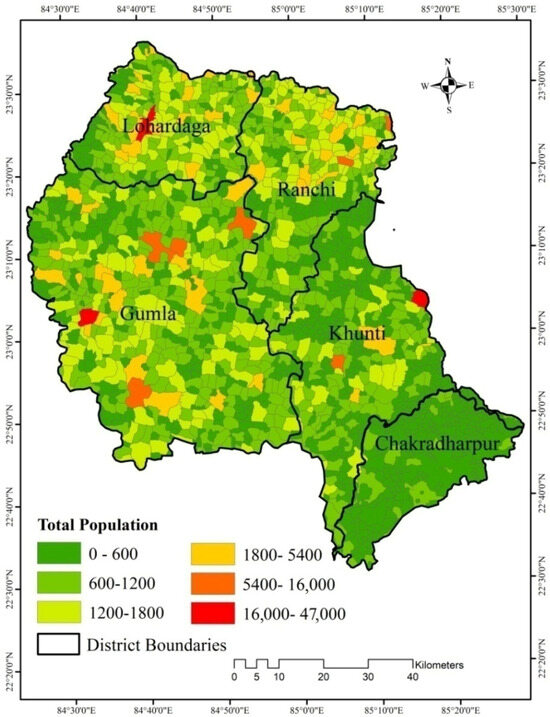
Figure 3.
Population map of the study area (Source-GHLS).
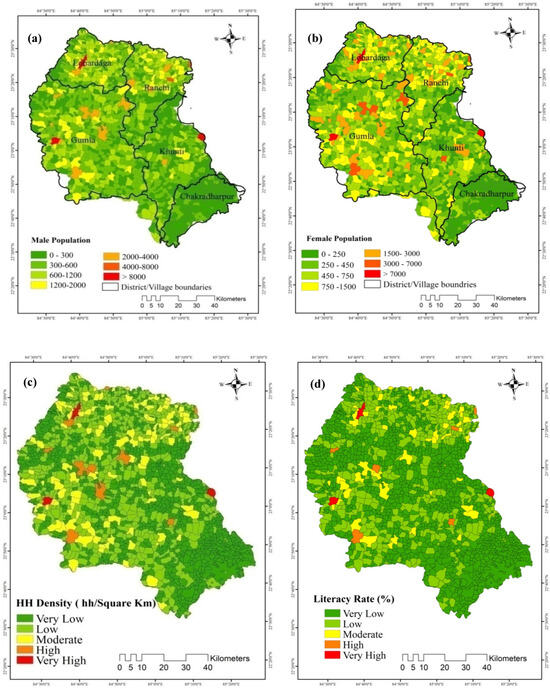
Figure 4.
(a) Male population, (b) female population, (c) household density and (d) literacy rate map of the study area.
To determine the social and physical costs of risk associated with drought at the village level, the current study used the socioeconomic vulnerability (SEV) method, which was created by Cutter [57]. The four main processes used to construct SEV were weighted indexing to all socioeconomic parameters, final integration of all parameters, weighted indexing to geographical and non-geospatial data sets, and integration of these two data sets (spatial and non-spatial). All five socioeconomic variables were integrated to create the final village-level SEV map. Based on the values of each attribute from lowest to highest, there were five classes in the final SEV map created: very low, low, medium, high, and very high (Table 1). This is how the SEV is determined.
where PD = population density; HH = number of households; FM = percentage-wise female ratio; M = percentage-wise male ratio; and LR = percentage population of literates.
SEV = PD + FM + M + LR/Number of Indicators

Table 1.
Economic indicators divided into five different vulnerability categories based on their class values.
3.5. Drought Risk Mapping
Drought risk (R) was computed by multiplying hazard (H) and vulnerability (SEV) as shown below:
where H indicates hazard categories and SEV indicates vulnerability (village-level).
Risk (R) = H × SEV
Drought hazard and vulnerability analysis were conducted using the geospatial tools of ArcGIS program. The prepared village-level drought risk map was categorized in four classes, i.e., high, moderate, low, and very low.
3.6. Drought Hazard and Risk Assessment
Three parameters, including drought-prone zones, population data, and watershed coverage, were used in the assessment of the hazards and risks associated with drought. Parameters for the drought hazard and risk were used for the period of 23 years to generate a drought-prone zone map. Individual parameters, i.e., (A) drought-prone zone, (B) population density, and (C) sub-watersheds, were generated. Further, the drought hazard was generated by overlaying all the parameters. The drought hazard was overlaid with the socioeconomic data to analyze the socioeconomic vulnerability and its impact on the drought hazard.
4. Results and Discussion
4.1. NDVI Anomaly and Drought Indices
NDVI Anomaly
The NDVI anomaly for the month of October over a 23-year period was computed. The study area agricultural pattern has changed over the last 23 years, as indicated by the NDVI anomaly. A more extreme agricultural pattern than normal crop health is reflected in the positive NDVI anomaly values, which show a rise in crop health, while the negative values show a decrease in crop health. Over the past 23 years, the years 2001, 2004, 2005, 2007, 2008, 2010, 2015, 2017, and 2019 have seen the greatest variations in the NDVI anomaly value (Figure 5). A decrease in rainfall, a change in the monsoon season, a rise in the maximum temperature, and a shortage of irrigation water could all lead to poor agricultural practices and lower crop yields in the study area. The northwestern, northern, and central regions of the study area have been examined for variations in agricultural patterns during the past 23 years. The agricultural areas in the states of Jharkhand, notably Ranchi and Gumla, have been particularly affected.
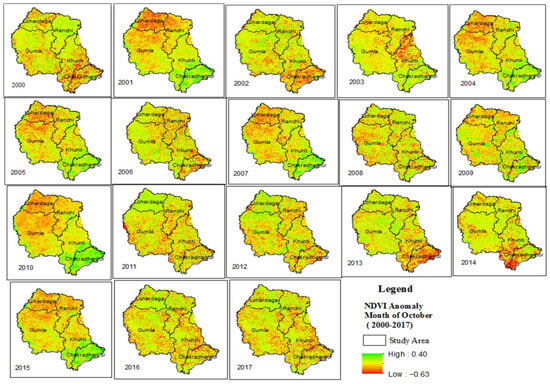
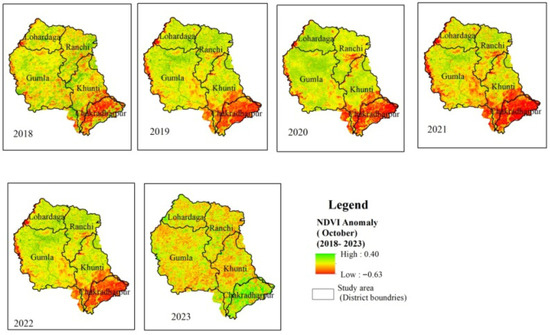
Figure 5.
NDVI anomalies for the month of October across a portion of the Koel basin from 2000–2023.
4.2. Drought Indices
Drought-prone areas were identified using drought indices, specifically the Vegetation Condition Index (VCI), Temperature Condition Index (TCI), and Vegetation Health Index (VHI). The assessment of the Vegetation Condition Index during the stage of peak crop growth revealed the fluctuation in the vegetation condition for the month of October over the previous seventeen years. The Vegetation Condition Index ranges in value from 14 to 78. The results show that the districts of Ranchi, Lohardaga, and Gumla contain the majority of the study area with agricultural fields and poor vegetation conditions (Figure 6), which correspond to areas with significant climate fluctuation. Chakardharpur, which is primarily covered in dense forest regions, has the highest vegetation condition value of 78. The study area vegetation state changed between 2000 and 2023, as seen in Figure 7. Chakardharpur, which is primarily covered in dense forest regions, has the highest vegetation condition value of 78. Figure 7 illustrates how the vegetation condition in the study area changed between 2000 and 2023. Since a high VCI value indicates healthy vegetation and a zone free from drought, a lower VCI value indicates a zone that is prone to drought. This makes VCI one of the indicators used to identify drought-prone areas. The majority of the study areas had low VCI values, indicating that the region was mostly vulnerable to drought.
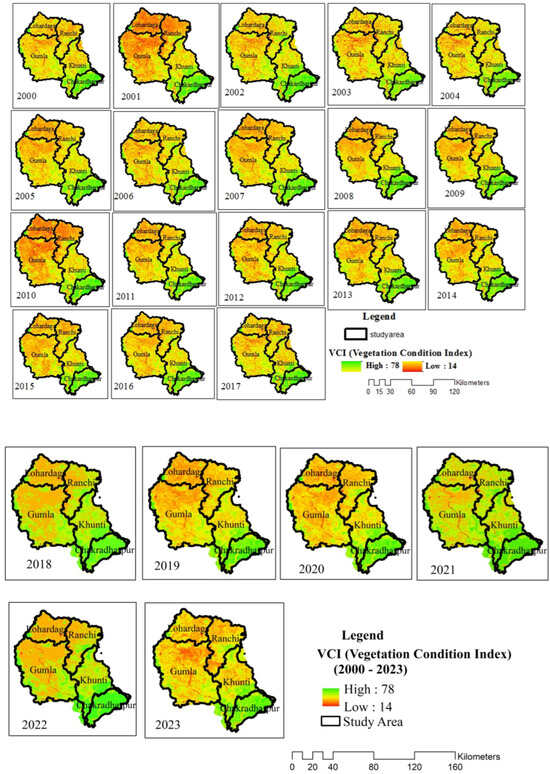
Figure 6.
Vegetation Condition Index during the month of October over a part of the Koel basin using NDVI (MODIS) data from 2000 to 2023.
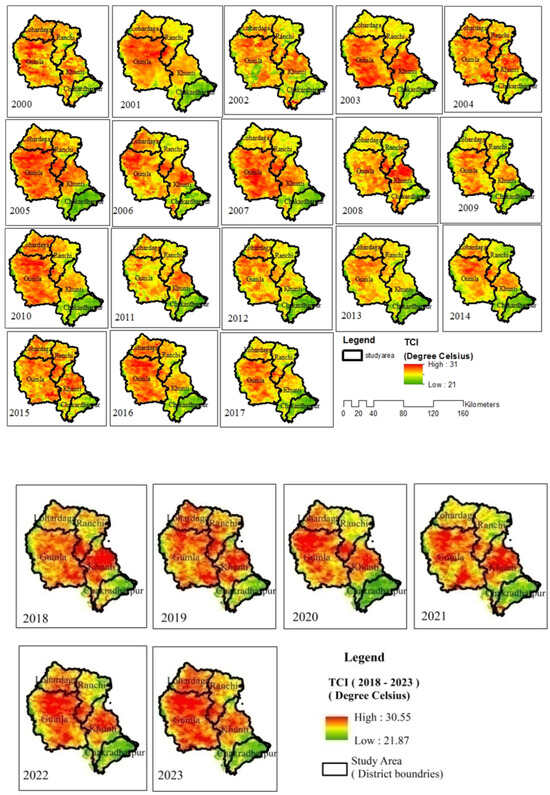
Figure 7.
Temperature Condition Index derived for the month of October in the study area using land surface temperature (LST) during 2000–2023.
The zone with varying land surface temperatures is shown by the Temperature Condition Index. The study area land surface temperature ranges from a high of 31 °C to a low of 21 °C. Over the past 23 years, the Lohardaga, Gumla, and Khunti regions have had high temperatures, according to the region’s overall temperature patterns. In comparison to other districts in the study area, Gumla district was shown to be the warmest zone in the basin in terms of land surface temperature (Figure 7). Any agricultural field’s productivity is impacted by land surface temperature; a high value damages or lowers crop productivity in comparison to a land with a lower land surface temperature.
To provide a more accurate evaluation of the occurrence of drought, the Vegetation Health Index (VHI) combines the two drought indicators, TCI and VCI. In order to emphasize agricultural drought-prone areas, data from the month of October was taken into consideration to illustrate the variance in vegetation pattern during the peak growth phase. The study area VHI values range from a high of 53 to a low of 23 (Figure 8). The Gumla, Lohardaga, and Ranchi regions had the highest Vegetation Health Index values (above 53), while the Khunti and Chakradharpur regions had the lowest below 23.
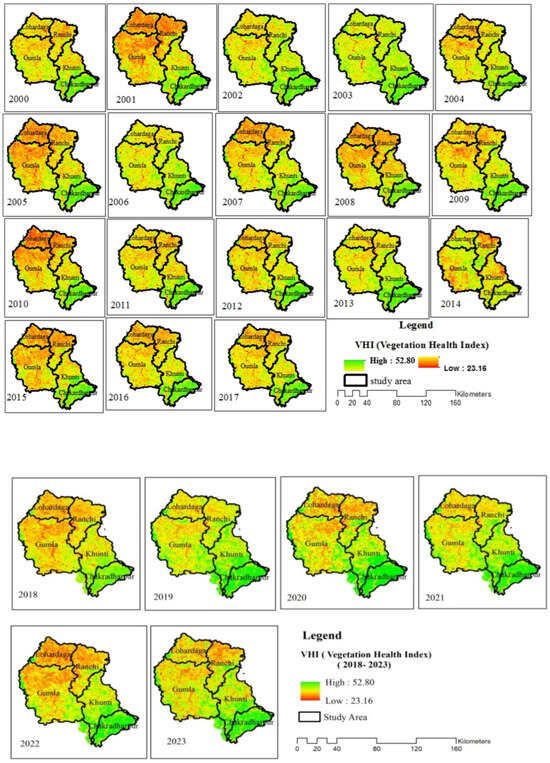
Figure 8.
Vegetation Health Index of the study area for the month of October using NDVI (MODIS) data from 2000 to 2023.
A map of drought-prone zones that splits into classes with values between 10 and 50 was created by superimposing the findings of the VCI, TCI, and VHI over the Arc GIS platform. A number of less than 20 indicates a severe drought zone, a value between 20 and 40 indicates a moderate drought zone, and a value greater than 40 indicates no drought or drought-free zones [54] (Figure 9). These are the three main agricultural drought zones. During the final 23 years of the observation period, drought conditions were present throughout the majority of the study area. The findings indicated that drought conditions were most common in areas with significant climate variance. Major variations in the NDVI anomaly, Vegetation Condition Index, Temperature Condition Index, and low Vegetation Health Index were noted in the years 2001, 2004, 2005, 2007, 2008, 2010, 2012, 2015, 2020, 2022, and 2023, which were primarily considered drought years. The Jharkhand government declared these years to be drought years (https://www.deccanherald.com/india/whole-jharkhand-declared-drought-hit2507170, https://www.thehindu.com/news/national/other-states/Jharkhand-State-declared-as-drought-hit/article16134213.ece), which confirmed the results.
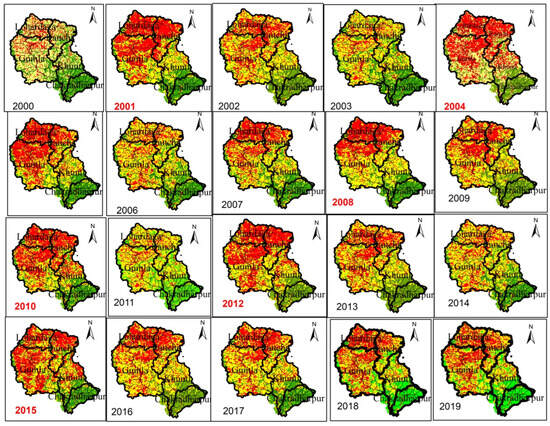
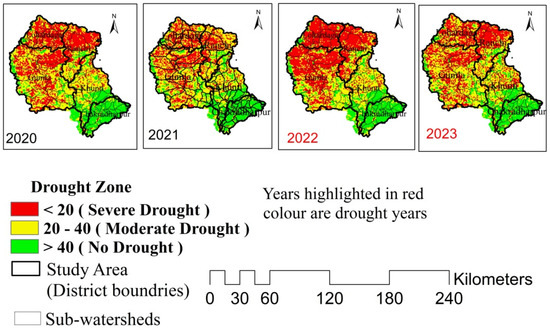
Figure 9.
Agricultural drought areas in the month of October in parts of the Koel basin using drought indices (VCI, TCI, and VHI) during 2000–2023.
The identification of agricultural drought-prone areas has led to positive results using satellite-based drought indices. By combining the findings of drought indices and drought anomalies, it was determined that agricultural drought mostly affected the majority of the study’s region, which was primarily in the districts of Lohardaga, Gumla, and Ranchi. In the meantime, the area’s climate fluctuation may have caused long-term changes in the vegetation’s condition. Crop health may have been impacted by an increase in the maximum temperature or a reduction in the minimum temperature, which would have reduced agricultural production and output [55,56,57]. The study concluded that the study area’s climate variability is responsible for the extent of the drought that has been identified there. Refs. [30,46,58] reported that the study area’s long-term NDVI anomaly demonstrates the negative impact of climate extremes during the previous 18 years (2000 to 2018). The average maximum temperature fluctuated between 1979 and 2017, rising by 0.50 to 0.81 °C and falling by 0.32 to 0.15 °C in different regions of the study area, according to the climatic variability. In a similar vein, rainfall fluctuates, decreasing by 26–90 mm while increasing by 19–230 mm. Similarly, rainfall varies, decreasing by 26–90 mm while increasing by 19–230 mm. This causes a drought effect in the study area, primarily in the districts of Lohardaga, Gumla, and Ranchi.
4.3. Spatio-Temporal Annual Drought Extent Map During 2000–2023
Districts in Jharkhand saw significant drought occurrences in 2001, 2004, 2008, 2010, 2012, 2015, 2022, and 2023 from the previous 20 years (2000–2023). The year-by-year spatio-temporal drought episodes from 2000 to 2023 are displayed in the current study (Figure 10). During the past twenty-three years, similar regions in the study area have primarily experienced recurring drought conditions during 2000–2023. Drought mostly impacted the central and upper regions of the study area, which included portions of the Ranchi district, Gumla, Lohardaga, and Khunti (Figure 10).
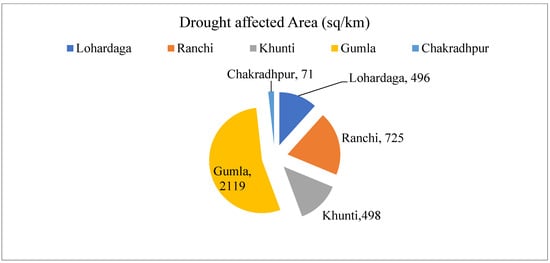
Figure 10.
Drought-affected areas (square kilometers) in different districts of the study.
4.4. Drought Hazard
The drought hazard categories on the basis of drought records during 2001–2023 are presented in Figure 9. Drought frequency ≤ 20 was classified under severe drought, 20 to 40 as moderate drought, and greater than 40 as low drought zones. The red color represents a severe drought hazard zone in comparison to the green color representing low drought zones (Figure 10). Gumla district was facing a high drought extent of 2119 km2, followed by Ranchi with 725 km2 area under drought cover, in comparison to Chakradhpur with only 71 km2 area facing drought. The details are shown below in Figure 11. The agricultural drought hazard map prepared is shown in Figure 12.
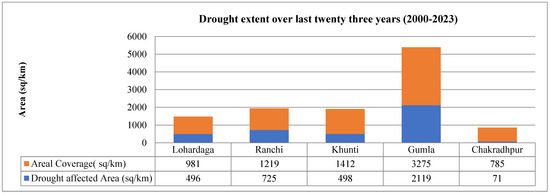
Figure 11.
Drought extent over the last twenty-three years (2000–2023).
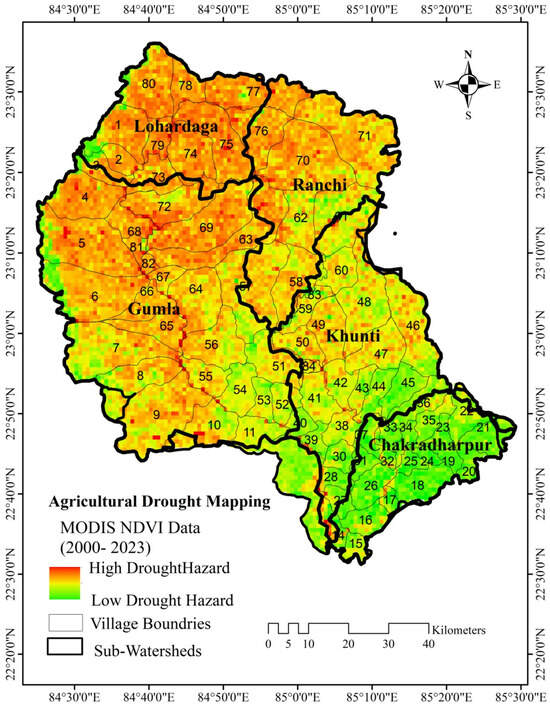
Figure 12.
Agricultural drought hazard map of the study area.
The majority of the sub-watersheds and villages in the upper and central sector, i.e., in the areas of Ranchi, Lohardaga, Gumla, and Khunti, were severely impacted by agricultural drought, according to the study area’s agricultural drought hazards map. Figure 11 illustrates the substantial drought coverage of Ranchi, Gumla, and Khunti among the 981 km2, 496 km2 of Lohardaga affected by the agricultural drought, respectively. As stated by [58], farmers are extremely vulnerable due to their reliance on rain-fed crops. In the states of Jharkhand, frequent crop failure and lower yields are caused by erratic monsoons and diminished soil moisture. Food security and agricultural revenue are affected by this uncertainty [58].
4.5. Socioeconomic Vulnerability (SEV) and Drought Risk Map
The study area’s boundary includes five major districts. Gumla is the most susceptible of the five districts. The contributions of each driver to vulnerability are displayed in Figure 2 and Figure 3. The primary elements that contribute to vulnerability are the total population, the number of males and females, the literacy rate, and the density of households.
Village-level data sets based on socioeconomic variables extracted from India’s 2011 Census data were used to evaluate socioeconomic vulnerability (SEV). Districts in the center region, which includes Khunti and Gumla, were found to be under a very high to high vulnerability zone (Figure 13). According to the analysis, there was high vulnerability over 3475 km2 and 1412 km2, or 610 and 448 communities, respectively. The moderate and low SEV category accounts for 1219 km2 of the area, with 313 villages in parts of Ranchi and Lohardaga districts (981 km2) with 274 villages. Very low categories were found in Chakradharpur, with area coverage of 785 km2 and 284 villages.
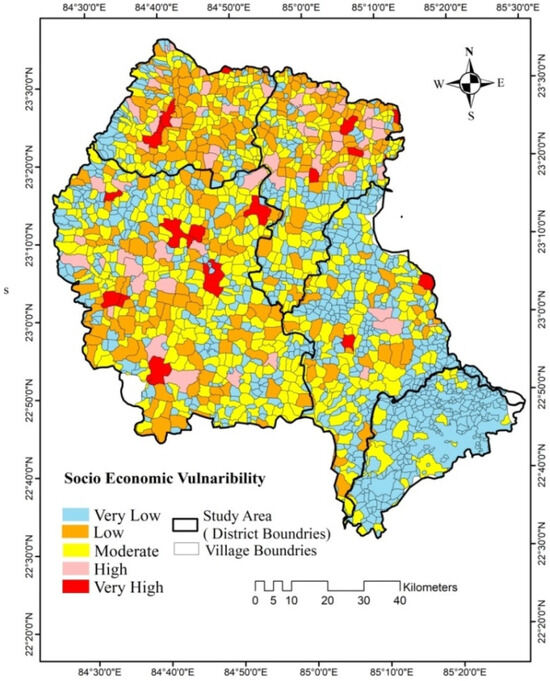
Figure 13.
Socioeconomic vulnerability map of the study area.
The study also revealed that among 82 sub-watersheds, 14 sub-watersheds lie in Gumla and 11 sub-watersheds in Khunti, with areas of 2107 km2 and 513 km2, respectively, seen under very high and high vulnerable zones (Figure 14), whereas 4 sub-watersheds of Ranchi with a 765 km2 area were under a moderately vulnerable zone. Both the Lohardaga and Chakradharpur districts’ five sub-watersheds were categorized as low and extremely low drought sensitive. The results of the current long-term study showed that the villages in the central catchments covering Gumla and Khunti districts were in a high-risk zone in comparison to Ranchi, which lies in a moderate-risk zone, followed by Chakradhpur in a low-risk zone. Table 2 lists the number of impacted villages for each level of drought risk. The total number of drought-affected villages, along with their population under various risk categories, are displayed in Table 2.
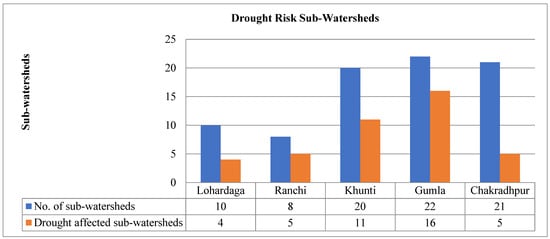
Figure 14.
District-level village map of the study area.
Table 2.
Drought-affected villages and sub-watersheds in the study area.
The findings of the research highlight the necessity of block- and district-specific climate resilience and adaptation initiatives to meet the particular difficulties and risks found. By creating specialized adaptation strategies and more solid facilities throughout the study area, efforts should be focused on reducing the current climate vulnerability across all blocks and districts.
4.6. Drought and Risk Impact on Sub-Watersheds
Population data has been taken from SEDAC (Socioeconomic Data Set). The data sets downloaded (https://sedac.ciesin.columbia.edu) include the number of villages, the areal coverage of villages, and the total population of each village in the study area. A spatial distribution map of the number of villages, a village population map, and an areal coverage of the village map were prepared by using the ArcGIS platform.
A drought risk map has been prepared by overlaying drought hazard and vulnerability in the ArcGIS platform. The study area was bounded by 82 sub-watersheds, in which 38 sub-watersheds covering a population of more than 300,000 persons were in high drought risk zones, which are generally located in the upper and central parts of the study area and are often occupied with higher population density. Integrating drought hazard and vulnerability with village-level population data sets (Figure 15 and Figure 16) helped to demarcate drought risk zones.
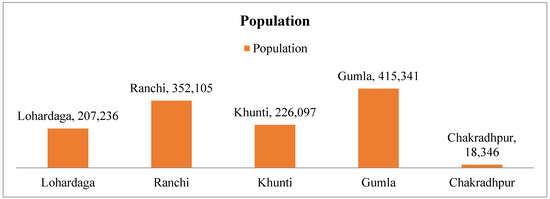
Figure 15.
Population graphs of villages lying in the study area.
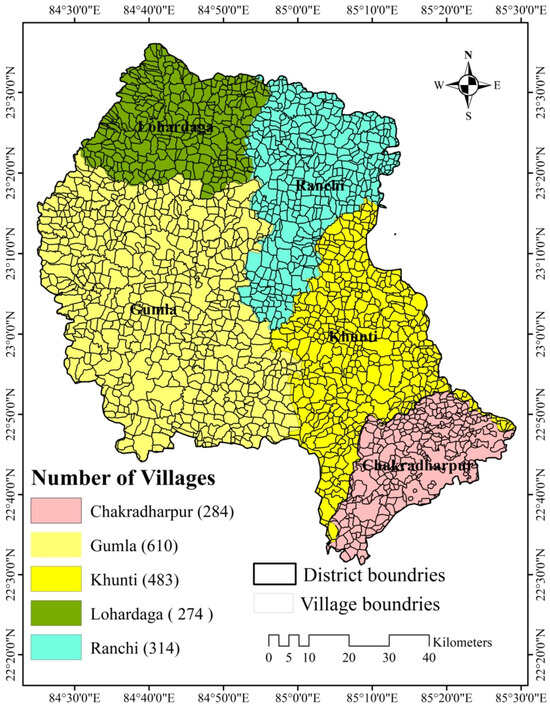
Figure 16.
District-level village distributions in the study area.
The drought risk zones (Figure 8) were divided into four major zones: (1) a very high zone that covered 25 sub-watersheds, among which more than 16 sub-watersheds were lying in the villages of Gumla and Khunti districts; (2) high-risk zone covering 19 sub-watersheds, among which major areas were covered in Lohardaga, Ranchi, and Gumla districts; (3) low-risk zone covering 22 sub-watersheds mainly lying in lower parts of the sub-watersheds with villages of Chakradhpur; (4) very low-risk zone covering 16 sub-watersheds lying mainly in Ranchi and Khunti districts (Figure 17).
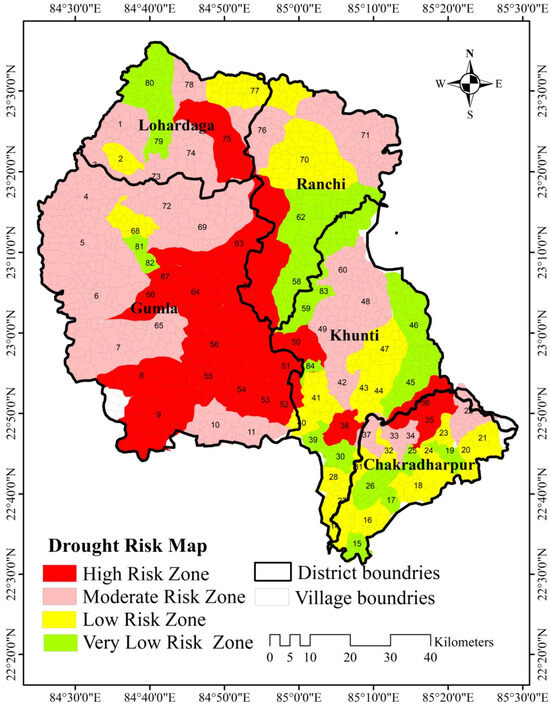
Figure 17.
Drought risk map of the study area.
The drought hazard and risk study highlighted the high drought risk zone, which has prominently faced drought in the past twenty-three years. A significant portion of the study area, i.e., 59.43%, were in danger of drought (Figure 17, Table 2 and Table 3). The likelihood of exposure would rise proportionately with population growth. To increase society’s resistance to drought risks, drought hazard management must be embraced as a key component of watershed management and drought mitigation for agricultural planning.
Table 3.
Number of sub-watersheds facing high drought risk and needed different levels of prioritization.
This study highlights drought frequency ≤ 20, which was defined as severe drought, 20 to 40 as moderate drought, and greater than 40 as low drought zones. The drought hazard classifications are based on drought records from 2001 to 2023. Contrary to the green color which denotes low drought zones, the red color indicates a severe drought hazard zone (Figure 9). In contrast to Chakradhpur, which only had 71 km2 of drought-affected land, Gumla district had a high drought hazard of 2119 km2, followed by Ranchi with 725 km2 of drought-covered land. Figure 12 displays the developed agricultural drought hazard map, highlighting the areas at high risk. Khunti and Gumla are two districts in the center region that were determined to be in a very high to high vulnerability zone (Figure 13). The analysis found that there was high vulnerability in 610 and 448 villages, or 3475 km2 and 1412 km2, respectively. A total of 1219 km2, with 313 villages spread across portions of the Ranchi and Lohardaga districts, and 274 villages spread across 981 km2, fall within the moderate and low SEV category. With a total size of 785 km2 and 284 villages, Chakradharpur was classified as having very low classifications. The 82 sub-watersheds that surrounded the study region included 38 sub-watersheds with a population of over 300,000 people that were in high drought risk zones. These areas are typically found in the upper and central portions of the study area and are frequently inhabited by a greater population density. Delineating drought risk zones was aided by the integration of village-level population data sets with drought hazard and vulnerability.
This drought study provides valuable data and insight for policymakers to develop and implement drought-related policies, such as land-use regulation, water allocation schemes, and disaster relief programs. This study also highlights the need for integrated water resource management, considering the interconnectedness of water, agriculture, and other sectors.
Drought severity map of the study area can be used by govt. as an early warning system which allow governments to prepare for mitigating the impact of drought before it severely affects agricultural production. By using drought severity map, the government can effectively manage the impact of drought on agriculture, ensuring that farmers receive timely and adequate support through crop insurance and other relief measures. Drought severity classification, early warning systems, and insurance claims strategies can be implemented in the Gumla district to enhance community resilience against recurrent drought.
The drought hazard and risk study highlighted the high drought risk zone, which has prominently faced drought in the past twenty-three years. Major parts of the study area, covering 59.43%, were facing drought risk. The likelihood of exposure would rise proportionately with population growth. To increase society’s resistance to drought risks, drought hazard management must be embraced as a key component of watershed management and drought mitigation for agricultural planning.
Ref. [59] conducted a study on the socioeconomic, agricultural, hydrological, and meteorological droughts in the Indian state using vulnerability indices such as principal component analysis (PCA), Shannon entropy weighting, and variance inflation factor (VIF). According to his research, the bulk of Central Indian states, including Jharkhand, are extremely susceptible to droughts caused by weather, agriculture, and water, which is pertinent to the findings of our study. Ref. [46] assessed the climate extremes and its long-term spatial variability over the Jharkhand state of India and her finding explained that the negative impact of climate extremes was observed as delay in transplanting/vegetative phase and reduced crop production. Her findings of this study showed that average maximum temperature during 1984 to 2014 fluctuates from an increase of 1–1.5 °C to a decrease of 0.82–0.14 °C, which results in low crop productivity in entire state of Jharkhand including our study area. Ref. [46] evaluated vegetation health and the socioeconomic dimension of the vulnerability of Jharkhand state of India in climate change scenarios and their likely impact: a geospatial approach and stated most districts of Jharkhand are vulnerable and under drought risk, including our study area. Refs. [60,61] explained PCA-driven watershed prioritization based on runoff modeling and drought severity assessment in parts of Koel river basin, Jharkhand (India), validated our research finding. Our research finding is validated with a similar result to the literature shown above.
5. Conclusions
The Koel river basin was found to be at high risk of drought according to the use of drought hazard and risk mapping in the current study. Using a GIS platform and remote sensing, drought hazards and risk zones were mapped. According to the findings, 59.43% of the study region was at risk. Among the five districts that lie in the study area, Gumla is in a high-risk zone. It covers 610 villages and spans an area of 3275 km2, out of which 2119 km2 with a population of 415,341 are specifically at high risk. A drought study of twenty-three years shows major droughts have been identified in the last 23 years during 2001, 2005, 2010, and 2023. The same area was facing recurrent drought in the past years, mainly lying in the Gumla, Ranchi, Lohardagga, and Khunti areas. Thus, under a future scenario of climate change, the impact of extreme occurrences would be amplified in these locations. The studied area had a gradual increase in climatic variation during the past 23 years, leading to significant changes in the area’s maximum and minimum temperatures as well as its rainfall patterns. As a result, future droughts in the study area may become more severe due to the effects of climate change and global warming. Over the past twenty-three years, the NDVI anomaly showed changes in agricultural patterns in the main parts of the study area, with the most significant changes occurring in areas that experienced the greatest climate variability. The regions most affected by climate variability showed signs of change. The long-term climate variability in the study area may have contributed to the decline in vegetation health and productivity. The areas susceptible to drought and the state of the vegetation health in the region were brought to light by the combination of TCI and VCI in the form of VHI. Significant poor vegetation covered a portion of the study area and was damaged by drought. There were notable weather fluctuations and drought conditions in the districts of Lohardaga, Ranchi, and Gumla. Deficient and unpredictable weather conditions, characterized by rising maximum temperatures and decreasing monsoon rainfall, suggested an increased risk of drought and, as a result, led to a substantial decrease in crop production, which in turn caused exacerbated socioeconomic vulnerability.
The findings of the current study would be helpful in developing action plans for managing droughts and in prioritizing sub-watersheds for climate change adaptation that will reduce droughts’ impact in the region. Furthermore, these findings could help in raising awareness about potential future dangers and the effects of climate change on crop yields among the local community and disaster management authorities. According to the present study, the most dependable and cost-effective method for managing drought and assessing its risk is to employ geospatial technology and its applications.
Author Contributions
All authors contributed to the study conceptualization and design. Material preparation, data collection and analysis were performed by S.C. Supervision, validation and editing performed by A.C.P., and review and editing were performed by C.S.D., B.R.P. and N.K. All authors have read and agreed to the published version of the manuscript.
Funding
This Research was supported by DST INSPIRE Fellowship (DST/INSPIRE/03/2016/002057) from Ministry of Science and Technology and Department of Science and Technology. Stuti Chaudhary received this fellowship.
Data Availability Statement
The original contributions presented in this study are included in the article. Further inquiries can be directed to the corresponding author.
Acknowledgments
The authors would like to thank the United State Geological Survey (USGS) and GEE for providing MODIS data sets. Authors also would like to acknowledge the Census board and SEDAC for providing village-level data sets and are also thankful to Survey of India (SOI) for providing topographical map. The first author acknowledges the receipt of financial support under the DST INSPIRE Fellowship (DST/INSPIRE/03/2016/002057) from the Ministry of Science and Technology and Department of Science and Technology, Government of India.
Conflicts of Interest
The authors declare that they have no competing interests.
Abbreviations
| GDP | Gross Domestic Product. |
| GWP | Ground Water Prospect |
| LST | Land Surface Temperature |
| MODIS | Moderate Resolution Imaging Spectroradiometer |
| GEE | Google Earth Engine |
| SOI | Survey of India. |
| SVE | Socio Economic Vulnerability Index |
| SEDAC | Socio Economic Data and Application Centre |
| SPI | Standardized Precipitation Index |
| TCI | Temperature Condition Index |
| USGS | United States Geological Survey |
| VCI | Vegetation Condition Index |
| VHI | Vegetation Health Index |
References
- Wilhite, D.A.; Glantz, M.H. Understanding: The Drought Phenomenon: The Role of Definitions. Water Int. 1985, 10, 111–120. [Google Scholar] [CrossRef]
- Islam, M.S. Cultivation and Drought Management in Agriculture; Springer: Berlin/Heidelberg, Germany, 2023; ISBN 3-031-35418-4. [Google Scholar]
- Agegnehu, G.; Bass, A.M.; Nelson, P.N.; Muirhead, B.; Wright, G.; Bird, M.I. Biochar and biochar-compost as soil amendments: Effects on peanut yield, soil properties and greenhouse gas emissions in tropical North Queensland, Australia. Agric. Ecosyst. Environ. 2015, 213, 72–85. [Google Scholar] [CrossRef]
- Gupta, A.K.; Tyagi, P.; Sehgal, V.K. Drought disaster challenges and mitigation in India: Strategic appraisal. Curr. Sci. 2011, 100, 1795–1806. [Google Scholar]
- Mohammed-Aslam, M.A.; Rokhmatuloh, R.T.; Salem, Z.E.; Javzandulam, T. Linear mixture model applied to the land-cover classification in an alluvial plain using Landsat TM data. J. Environ. Inform. 2015, 7, 95–101. [Google Scholar] [CrossRef][Green Version]
- Das, S.K.; Gupta, R.K.; Varma, H.K. Flood and drought management through water resources development in India. Bull. World Meteorol. Organ. 2007, 56, 179–188. [Google Scholar]
- Cooley, S.; Schoeman, D.; Bopp, L.; Boyd, P.; Donner, S.; Kiessling, W.; Martinetto, P.; Ojea, E.; Racault, M.F.; Rost, B. Oceans and coastal ecosystems and their services. In Climate Change 2022: Impacts, Adaptation and Vulnerability; Cambridge University Press: Cambridge, UK, 2023. [Google Scholar]
- Tripathi, O.P. Village level inherent vulnerability of Champhai district to climate change: Water Resources Approach. Indian J. Appl. Pure Bio. Vol. 2025, 40, 664–677. [Google Scholar]
- Alam, M.K.; Dasgupta, S.; Barua, A.; Ravindranath, N.H. Assessing climate-relevant vulnerability of the Indian Himalayan Region (IHR): A district-level analysis. Nat. Hazards 2022, 112, 1395–1421. [Google Scholar] [CrossRef]
- Field, C.B.; Barros, V.R. Climate Change 2014–Impacts, Adaptation and Vulnerability: Regional Aspects; Cambridge University Press: Cambridge, UK, 2014; ISBN 1-107-05816-3. [Google Scholar]
- Birkmann, J.; Liwenga, E.; Pandey, R.; Boyd, E.; Djalante, R.; Gemenne, F.; Leal Filho, W.; Pinho, P.; Stringer, L.; Wrathall, D. Poverty, livelihoods and sustainable development. In Climate Change 2022: Impacts, Adaptation and Vulnerability; Cambridge University Press: Cambridge, UK, 2023. [Google Scholar]
- Who, O. Overweight. 2013. Available online: https://www.who.int/en/news-room/fact-sheets/detail/obesity-and-overweight (accessed on 22 September 2022).
- Hao, Z.; Singh, V.P. Drought characterization from a multivariate perspective: A review. J. Hydrol. 2015, 527, 668–678. [Google Scholar] [CrossRef]
- Krueger, E.S.; Ochsner, T.E.; Brorsen, B.W. Soil moisture information improves drought risk protection provided by the USDA livestock forage disaster program. Bull. Am. Meteorol. Soc. 2024, 105, E1153–E1169. [Google Scholar] [CrossRef]
- Wang, Z.; Zhong, R.; Lai, C.; Zeng, Z.; Lian, Y.; Bai, X. Climate change enhances the severity and variability of drought in the Pearl River Basin in South China in the 21st century. Agric. For. Meteorol. 2018, 249, 149–162. [Google Scholar] [CrossRef]
- Rajsekhar, D.; Singh, V.P.; Mishra, A.K. Integrated drought causality, hazard, and vulnerability assessment for future socioeconomic scenarios: An information theory perspective. J. Geophys. Res. Atmos. 2015, 120, 6346–6378. [Google Scholar] [CrossRef]
- Tzanakakis, V.A.; Paranychianakis, N.V.; Angelakis, A.N. Water Supply and Water Scarcity; MDPI: Basel, Switzerland, 2020; Volume 12, ISBN 2073-4441. [Google Scholar]
- Sehgal, V.K.; Dhakar, R. Geospatial approach for assessment of biophysical vulnerability to agricultural drought and its intra-seasonal variations. Environ. Monit. Assess. 2016, 188, 197. [Google Scholar] [CrossRef]
- Rahman, M.R.; Lateh, H. Meteorological drought in Bangladesh: Assessing, analysing and hazard mapping using SPI, GIS and monthly rainfall data. Environ. Earth Sci. 2016, 75, 1026. [Google Scholar] [CrossRef]
- Vittal, H.; Karmakar, S.; Ghosh, S.; Murtugudde, R. A comprehensive India-wide social vulnerability analysis: Highlighting its influence on hydro-climatic risk. Environ. Res. Lett. 2020, 15, 014005. [Google Scholar]
- Bisht, D.S.; Chatterjee, C.; Kalakoti, S.; Upadhyay, P.; Sahoo, M.; Panda, A. Modeling urban floods and drainage using SWMM and MIKE URBAN: A case study. Nat. Hazards 2016, 84, 749–776. [Google Scholar] [CrossRef]
- Dalezios, N.R.; Blanta, A.; Spyropoulos, N.V.; Tarquis, A.M. Risk identification of agricultural drought for sustainable agroecosystems. Nat. Hazards Earth Syst. Sci. 2014, 14, 2435–2448. [Google Scholar] [CrossRef]
- Kogan, F. World droughts in the new millennium from AVHRRbased vegetation health indices. Eos Trans. Am. Geophys. Union 2002, 83, 557–563. [Google Scholar] [CrossRef]
- Alahacoon, N.; Matheswaran, K.; Pani, P.; Amarnath, G. A decadal historical satellite data and rainfall trend analysis (2001–2016) for flood hazard mapping in Sri Lanka. Remote Sens. 2018, 10, 448. [Google Scholar] [CrossRef]
- Islam, M.M.; Sado, K. Development of flood hazard maps of Bangladesh using NOAA-AVHRR images with GIS. Hydrol. Sci. J. 2000, 45, 337–355. [Google Scholar] [CrossRef]
- Belabid, N.; Zhao, F.; Brocca, L.; Huang, Y.; Tan, Y. Near-real-time flood forecasting based on satellite precipitation products. Remote Sens. 2019, 11, 252. [Google Scholar] [CrossRef]
- Sahoo, S.; Jha, M.K.; Kumar, N.; Chowdary, V.M. Evaluation of GIS-based multicriteria decision analysis and probabilistic modeling for exploring groundwater prospects. Environ. Earth Sci. 2015, 74, 2223–2246. [Google Scholar] [CrossRef]
- Tripathi, G.; Parida, B.R.; Pandey, A.C. Spatio-temporal rainfall variability and flood prognosis analysis using satellite data over North Bihar during the August 2017 flood event. Hydrology 2019, 6, 38. [Google Scholar] [CrossRef]
- Bhuiyan, C. Various drought indices for monitoring drought condition in Aravalli terrain of India. In Proceedings of the XXth ISPRS Congress, Istanbul, Turkey, 12–23 July 2004; pp. 12–23. [Google Scholar]
- Chaudhary, S.; Pandey, A.C. Multiple indices based drought analysis by using long term climatic variables over a part of Koel river basin, India. Spat. Inf. Res. 2019, 28, 273–285. [Google Scholar] [CrossRef]
- Heim, R.R., Jr. A review of twentieth-century drought indices used in the United States. Bull. Am. Meteorol. Soc. 2002, 83, 1149–1166. [Google Scholar] [CrossRef]
- Murthy, C.S.; Sesha Sai, M.V.R.; Kumari, V.B.; Roy, P.S. Agricultural drought assessment at disaggregated level using AWiFS/WiFS data of Indian Remote Sensing satellites. Geocarto Int. 2007, 22, 127–140. [Google Scholar] [CrossRef]
- Adeyeri, O.E.; Akinsanola, A.A.; Ishola, K.A. Investigating surface urban heat island characteristics over Abuja, Nigeria: Relationship between land surface temperature and multiple vegetation indices. Remote Sens. Appl. Soc. Environ. 2017, 7, 57–68. [Google Scholar] [CrossRef]
- Ogunjobi, K.O.; Adamu, Y.; Akinsanola, A.A.; Orimoloye, I.R. Spatio-temporal analysis of land use dynamics and its potential indications on land surface temperature in Sokoto Metropolis, Nigeria. R. Soc. Open Sci. 2018, 5, 180661. [Google Scholar] [CrossRef]
- Sruthi, S.; Aslam, M.M. Agricultural drought analysis using the NDVI and land surface temperature data; a case study of Raichur district. Aquat. Procedia 2015, 4, 1258–1264. [Google Scholar] [CrossRef]
- Kogan, F.N. Global drought watch from space. Bull. Am. Meteorol. Soc. 1997, 78, 621–636. [Google Scholar] [CrossRef]
- Parthasarathy, B.; Kumar, K.R.; Munot, A.A. Homogeneous Indian monsoon rainfall: Variability and prediction. Proc. Indian Acad. Sci. Earth Planet. Sci. 1993, 102, 121–155. [Google Scholar] [CrossRef]
- Patra, P.K.; Behera, S.K.; Herman, J.R.; Maksyutov, S.; Akimoto, H.; Yamagata, Y. The Indian summer monsoon rainfall: Interplay of coupled dynamics, radiation and cloud microphysics. Atmos. Chem. Phys. 2005, 5, 2181–2188. [Google Scholar] [CrossRef]
- Singh, R.P.; Roy, S.; Kogan, F. Vegetation and temperature condition indices from NOAA AVHRR data for drought monitoring over India. Int. J. Remote Sens. 2003, 24, 4393–4402. [Google Scholar] [CrossRef]
- Jha, R.K.; Gundimeda, H. An integrated assessment of vulnerability to floods using composite index–A district level analysis for Bihar, India. Int. J. Disaster Risk Reduct. 2019, 35, 101074. [Google Scholar] [CrossRef]
- Singh, G.R.; Jain, M.K.; Gupta, V. Spatiotemporal assessment of drought hazard, vulnerability and risk in the Krishna River basin, India. Nat. Hazards 2019, 99, 611–635. [Google Scholar] [CrossRef]
- Mishra, R.K. Fresh water availability and its global challenge. Br. J. Multidiscip. Adv. Stud. 2023, 4, 1–78. [Google Scholar] [CrossRef]
- Basheer Ahammed, K.K.; Pandey, A.C. Coastal social vulnerability and risk analysis for cyclone hazard along the Andhra Pradesh, East Coast of India. KN-J. Cartogr. Geogr. Inf. 2019, 69, 285–303. [Google Scholar] [CrossRef]
- Phongsapan, K.; Chishtie, F.; Poortinga, A.; Bhandari, B.; Meechaiya, C.; Kunlamai, T.; Aung, K.S.; Saah, D.; Anderson, E.; Markert, K. Operational flood risk index mapping for disaster risk reduction using earth observations and cloud computing technologies: A case study on Myanmar. Front. Environ. Sci. 2019, 7, 191. [Google Scholar] [CrossRef]
- Goswami, B.N.; Venugopal, V.; Sengupta, D.; Madhusoodanan, M.S.; Xavier, P.K. Increasing trend of extreme rain events over India in a warming environment. Science 2006, 314, 1442–1445. [Google Scholar] [CrossRef]
- Tirkey, A.S.; Ghosh, M.; Pandey, A.C.; Shekhar, S. Assessment of climate extremes and its long term spatial variability over the Jharkhand state of India. Egypt. J. Remote Sens. Space Sci. 2018, 21, 49–63. [Google Scholar] [CrossRef]
- Cruz, R.V. Asia. In Climate Change 2007: Impact, Adaptation and Vulnerability; Contribution of Working Group II to the Fourth Assessment Report of the Intergovernmental Panel on Climate Change; Cambridge University Press: Cambridge, UK, 2007; pp. 469–506. [Google Scholar]
- Izrael, Y.; Anokin, Y.; Eliseev, A.D. Final Report of the Russian Country Study on Climate Problem, Russian Federal Service for Hydrometeorology and Environmental Monitoring. In Vulnerability and Adaptation A Ssessments; Roshydromet: Moscow, Russia, 1997; Volume 3, Task 3. [Google Scholar]
- Ramos, M.C.; Balasch, J.C.; Martínez-Casasnovas, J.A. Seasonal temperature and precipitation variability during the last 60 years in a Mediterranean climate area of Northeastern Spain: A multivariate analysis. Theor. Appl. Climatol. 2012, 110, 35–53. [Google Scholar] [CrossRef]
- Pandey, S.; Pandey, A.C.; Nathawat, M.S.; Kumar, M.; Mahanti, N.C. Drought hazard assessment using geoinformatics over parts of Chotanagpur plateau region, Jharkhand, India. Nat. Hazards 2012, 63, 279–303. [Google Scholar] [CrossRef]
- Minj, H.P. Social dimension of climate change on tribal societies of Jharkhand. Int. J. Soc. Sci. Interdiscip. Res. 2013, 2, 34–41. [Google Scholar]
- Anyamba, A.; Tucker, C.J. Historical perspective of AVHRR NDVI and vegetation drought monitoring. Remote Sens. Drought Innov. Monit. Approaches 2012, 23, 20. [Google Scholar]
- Vaani, N.; Porchelvan, P. Monitoring of Agricultural Drought Using Fortnightly Variation of Vegetation Condition Index (vci) for the State of Tamil Nadu, India. Int. Arch. Photogramm. Remote Sens. Spat. Inf. Sci. 2018, 42, 159–164. [Google Scholar] [CrossRef]
- Amalo, L.F.; Hidayat, R. Comparison between remote-sensing-based drought indices in east java. In Proceedings of the IOP Conference Series: Earth and Environmental Science; IOP Publishing: Bristol, UK, 2017; Volume 54, p. 012009. [Google Scholar]
- Saha, S. Groundwater potential mapping using analytical hierarchical process: A study on Md. Bazar Block of Birbhum District, West Bengal. Spat. Inf. Res. 2017, 25, 615–626. [Google Scholar] [CrossRef]
- Koley, S.; Jeganathan, C. Evaluating the climatic and socio-economic influences on the agricultural drought vulnerability in Jharkhand. Environ. Monit. Assess. 2023, 195, 8. [Google Scholar] [CrossRef]
- Cutter, S.L.; Boruff, B.J.; Shirley, W.L. Social vulnerability to environmental hazards. In Hazards Vulnerability and Environmental Justice; Routledge: London, UK; New York, NY, USA, 2012; pp. 115–132. [Google Scholar]
- Pandey, R.; Kumar, P.; Singh, R.K. Socio-economic vulnerability and adaptation in tribal Jharkhand. J. Rural. Stud. 2022, 90, 66–75. [Google Scholar]
- Upadhyay, M.; Sherly, M.A. Multivariate framework for integrated drought vulnerability assessment—An application to India. Int. J. Disaster Risk Reduct. 2023, 85, 103515. [Google Scholar] [CrossRef]
- Chaudhary, S.; Pandey, A.C. PCA driven watershed prioritization based on runoff modeling and drought severity assessment in parts of Koel river basin, Jharkhand (India). Water Supply 2022, 22, 2034–2054. [Google Scholar] [CrossRef]
- Jeet, P.; Singh, K.N.; Kumar, R.R.; Gurung, B.; Singh, A.K.; Upadhyaya, A. Modeling and Trend Analysis of Climatic Variables of Ranchi District, Jharkhand. J. AgriSearch 2000, 8, 120–128. [Google Scholar] [CrossRef]
Disclaimer/Publisher’s Note: The statements, opinions and data contained in all publications are solely those of the individual author(s) and contributor(s) and not of MDPI and/or the editor(s). MDPI and/or the editor(s) disclaim responsibility for any injury to people or property resulting from any ideas, methods, instructions or products referred to in the content. |
© 2025 by the authors. Licensee MDPI, Basel, Switzerland. This article is an open access article distributed under the terms and conditions of the Creative Commons Attribution (CC BY) license (https://creativecommons.org/licenses/by/4.0/).