Abstract
This article proposes a novel methodology based on the 2D hydraulic model of the HEC-RAS software, with a stepped ascending hydrograph that allows determining the maximum capacities of the channel (value at which overflow occurs), identifying potential breaking and overflow points, and the affected areas. This methodology also allows for determining whether the theoretical hydraulic capacities indicated by official agencies correspond to the current capacity of the channel. The areas analyzed correspond to the urban channel sections of the Segura River as it passes through Murcia, Orihuela, Almoradí, and Rojales. The results show that the capacity is much lower than the estimated flows, which explains the overflows of the Segura River in some sections. These results have been compared with the events of the September 2019 flood. The discussion addresses some potential problems identified during the modeling process and how they were resolved. The importance of understanding these capacities for better flood management is also highlighted. It is concluded that the Segura River channel capacity is lower, that it is a method that can be extrapolated to other rivers, and that it allows for more effective management of river floods, reducing the impacts on the population.
1. Introduction
Floods are the natural hazard that cause the highest number of fatalities and economic damage throughout the world [1,2] and, due to the effects of climate change, have increased significantly in terms of both frequency and intensity in many regions of the world [3,4,5].
Within the current context of climate change, since the year 2007, a direct relationship can be established between temperature and rainfall, whereby for every 1 °C of global warming, there has been an estimated increase in the moisture-holding capacity of the atmosphere of 7% [6], implying a higher amount of events with abundant precipitations. Furthermore, an increase in rain intensity is occurring, which is generating historical records of both 24 h and 1 h rainfall, mainly concentrated in coastal and pre-coastal areas, coinciding with the areas of greatest human occupation (residential and industrial uses, facilities, road and rail infrastructures, crop fields…) [7]. These areas are also those in the middle and lower sections of the basins where river overflows are common, generating floods. All of these factors influence the increase in frequency and intensity of floods, that is, the hazard and risk factors.
The increased risk of flooding can be observed in the data of the flood events recorded (river floods, floods on floodplains, and flash floods) in the data of the EM-DAT, updated to September 2025. For the period 2000–2025 (September), on a global scale, a total of 4156 events were recorded, with 138,557 mortal victims and USD 1034.7 billion of material damage. In Europe, there were 186 events, 2512 deaths and USD 234.3 billion worth of material damage. And in Spain, a total of 24 flood events were recorded, with 331 mortal victims, of which 232 deaths corresponded to the flood of October 2024 in Valencia, and economic damage estimated at USD 16.22 billion of which 67.80% corresponded to this event [8].
These data show that, in Spain, floods are the natural phenomenon that cause the highest number of mortal victims and the greatest amount of material damage in the country [9,10,11], particularly due to the fact that floodable areas have been intensely occupied for decades (flood plains, alluvial fans, channels…). This intense occupation took place during the property boom in the period 1990–2007, resulting from the country’s economic growth based on urban growth and the residential construction sector, particularly in pre-coastal and coastal areas, where there is high summer tourism activity. This growth did not take into account the behavior and dynamics of the rivers of the Mediterranean climate or the existing natural risks (floods) [12,13]. This means that the Spanish Mediterranean coast is known as an area that is highly exposed and vulnerable to suffering the negative effects of floods and being a hot spot for the effects and evidence of the current climate change [6].
The basins are unable to absorb these precipitations reinforced by the effect of climate change, generating surface runoff and feeding the flows to the principal channels. During flood events, the waters rise so much that they exceed the hydraulic capacity of the structures, generating catastrophic effects such as mortal victims and economic damage [4,14,15].
Over the last two decades, technological development and geographic information system (GIS) tools have grown considerably and have become essential for managing territory, including the management of emergencies associated with natural phenomena, such as floods [16,17]. This has favored the development of hydrological and hydraulic modeling software that derives basin parameters and the values required for hydraulic calculations and simulations, indicating the extent, depth, and velocity of flooding, among other variables [18,19,20].
Currently, there are numerous hydraulic modeling software packages, such as HEC-RAS, MIKE11, InfoWorks ICM, IBER, TUFLOW, LISFLOOD-FP, ISIS, and TELEMAC, among others [3,21]. Many of these tools enable one-dimensional (1D) and two-dimensional (2D) hydraulic modeling to be carried out, producing flood hazard maps that include parameters such as water depth, flow velocity, flow paths, the product of depth and velocity (v·h), the Froude number, the Courant number, and others [22].
Some authors point out that 2D models are currently achieving significant advances in flood modeling and are considered a more comprehensive alternative to 1D models, although the latter can still be used as an initial approach [23].
The most used hydraulic modeling programs used for elaborating hazard and risk maps include the HEC-RAS developed by the U.S. Army Corps of Engineers. It is one of the most widely used models on an international level as it enables simulations in 1D and 2D of the permanent and non-permanent flow, the transport of sediments and hydraulic interactions [24,25]. There are also other modeling programs such as MIKE (1D and 2D) that overlap to form MIKE FLOOD, used for integrated modeling of urban and coastal areas [26]; the InfoWorks ICM program, for modeling floods in urban areas, riverbeds and, especially, sewer networks [27]; or the IBER program that allows the simulation of free surface flows [28,29]. This program has been used for the development of official cartography of river basin organizations (the National System of Flood Zone Cartography, SNCZI).
For the purpose of this study, the HEC-RAS software has been used because, in terms of predictive analytics, it performs better than more sophisticated models and requires less data. It also obtains the size of the flood with great precision when the water surfaces are superimposed with the precise and high-resolution Digital Elevation Model (DEM) [30].
Within the international context, numerous researchers have used the software program for various purposes. For example, for the reconstruction of historical events that occurred during the Los Llanos de Moxos floods in Bolivia in February 2014, the results obtained are identical to the reality of the event [31]. Another use case was the use of sensorization techniques and satellite images to calibrate the results of a hydraulic model, as in the case of the Mulde River in Germany [32], and to obtain flood hazard maps [33].
It is also used to simulate flash floods in Spain [34], Greece [35], the United States [36], and Pakistan [37]; at the same time, it allows for the modeling of urban floods [38] or sewer networks, including drains and pipes. It also enables rainfall simulation, the incorporation of culverts and bridges, and the modeling of flood wave attenuation within dams or reservoirs, as well as the simulation of dam breaches and the evaluation of their potential catastrophic impacts [39,40].
Recent studies indicate that it is possible to use this program together with HEC-HMS to perform predictive models based on information from weather forecasts or rain radar and the known hydraulic capacity of a channel (natural or artificial) [41,42].
It is fundamental to determine the hydraulic capacity of a watercourse in order to carry out forecasting and prediction tasks and adequate flood management [43,44]. In general, the information related to the hydraulic capacity of a watercourse is provided by the basin authorities, particularly in those sections where works have been carried out (channeling or piping) associated with a maximum annual flow based on a period of return. However, sometimes, the works executed differ from those originally planned and hydraulic works with a lower capacity are built. Furthermore, the passage of time in basins with constant flows and periodical floods, together with the growth of the vegetation (reeds and accumulation of sediment), favors the reduction in the hydraulic capacity of these channels.
The HEC-RAS software is a good tool for obtaining the hydraulic capacity of a channel or watercourse (natural or artificial) depending on the section, both in 1D and 2D models [25]. In fact, the majority of previous studies usually obtain the hydraulic capacity of the channel with a 1D simulation in the channel and use a linked 2D simulation for the surrounding floodplains [45]. Other authors have obtained the hydraulic capacity of channels by simulating floods of maximum annual capacity associated with a specific return period (T10, T50, T100, and T500 years) and comparing the overflow levels [45].
In Spain, since 2010, numerous intense or torrential rain events have occurred, causing flooding, significant economic damage, and fatalities. Events such as those in September 2012, December 2016, and September 2019 in the Segura River basin [46,47,48,49]; or those in March 2017 in Alicante [50]; in 2018 in Manacor (Mallorca) [30]; and the recent floods in Valencia in 2024 [51,52], highlight the lack of knowledge about the hydraulic capacity of waterways, which serve as a factor to consider for effective emergency management.
This study presents a methodology used with HEC-RAS to verify whether the hydraulic capacity of the Segura River as it passes through several sections meets the design hydraulic capacity of the channelization or if it is less than this capacity. This information is important because it helps determine the maximum allowable flow or threshold of the channelization where overtopping waters would occur, generating flooding.
According to information from the river basin authority, the average hydraulic capacity of the Segura River (channeled section) is 450 m3/s. However, numerous historical rainfall events since its construction have called into question the capacity of the Segura River’s channel in various sections.
The objectives of this study are as follows:
- To establish a new methodology for obtaining maximum allowable flows in a watercourse.
- To obtain the capacities or thresholds at which the River Segura begins to overflow at different points in its course.
- To validate the results, comparing real situations occurring in September 2019 and using data provided by the basin authority.
Meeting these objectives will result in a methodology applicable to calculating the maximum hydraulic capacity of a riverbed in different sections using 2D hydraulic simulations, allowing for the identification of thresholds where river overflow occurs. As mentioned above, this methodology can be extrapolated to other studies in any region of the world and constitutes a tool for adequate flood emergency management.
2. Materials and Methods
2.1. Area of Study
The area of study is located in the south-east of Spain, specifically in the middle-lower section of the Segura river basins (Figure 1).
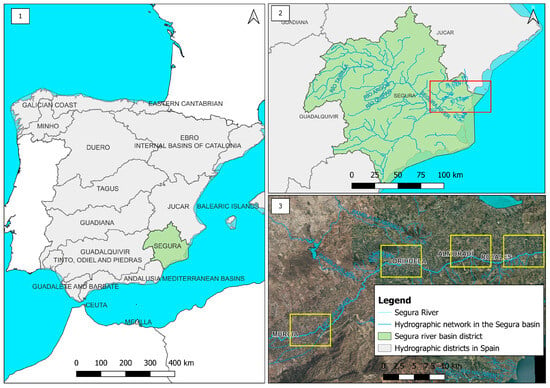
Figure 1.
Location of the Segura river basin and study areas for the channeling of the Segura river in urban areas. Source: Own elaboration.
The four areas of study selected correspond to urban environments and the River Segura passes through their urban center or surrounding area: Murcia, Orihuela, Almoradí, and Rojales. The course of the river narrows as it passes through or close by the urban center in the latter three towns, leading to overflows due to a lower capacity (Orihuela) or ruptured channel walls (Almoradí). In the case of Rojales, if the river had not overflowed due to the rupture of several channel walls along its course, this town would also have suffered the effects of flooding, so it is considered necessary to include it in the study, particularly due to the presence of the Carlos III bridge, constructed on the riverbed and drastically reducing the capacity of the course as it passes through the town (Figure 2).
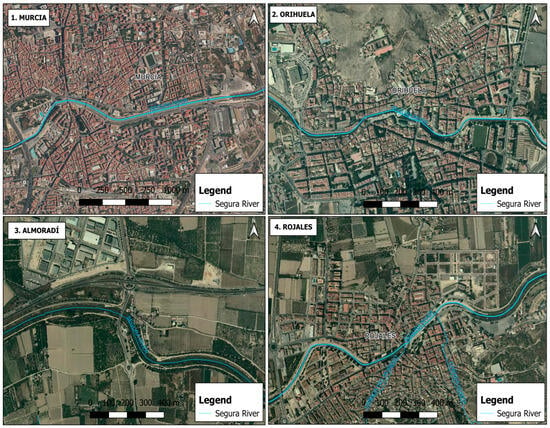
Figure 2.
Sections analyzed for the capacity of the Segura River channel in the towns of Murcia (1), Orihuela (2), Almoradí (3) and Rojales (4). Source: Own elaboration.
2.2. Information Requested from the River Basin Authority and Application of the Statiscal Method to the Maximum Annual Flows of the Segura River (1996–2023)
Many sources of information have been consulted for this study. First, the Segura Basin Flood Defence Plan has been analyzed. This proposes a channeling of the River Segura for a capacity of 800 m3/s and return period of 25 years or a capacity of 1000 m3/s for a return period of 50 years [53].
It should be noted that this plan was elaborated in 1977 after the floods of October 1973 and the majority of the data for annual maximum flows of the River Segura of the available series of almost 50 years correspond to flows recorded prior to the construction of the Cenajo and Camarilas reservoirs (1960) that regulate the River Segura and its principal tributary, the River Mundo, indicating that they could be slightly lower.
Although the plan was drafted and developed in 1977, this document remained ineffective until the floods of November 1987 (10 years later), when it was approved as an urgent action for flood protection in the Segura basin. This year, some of the actions were reviewed and minor modifications were made to the hydraulic capacity of some dams. However, these changes are not significant enough to reduce the estimated flood channeling capacity of between 800 and 1000 m3/s to a channel with an average hydraulic capacity of 450 m3/s. In fact, in the case of the city of Orihuela, the construction of a canal with a capacity of 300 m3/s in the city center was proposed, as was a secondary canal as a “by-pass” with a capacity of 700 m3/s, to obtain a protection level of 1000 m3/s [53].
The environmental impact of this canal, with a capacity of 800 and 1000 m3/s, would likely require changes to urban development and existing buildings in various locations (Murcia, Orihuela, Benejúzar, Almoradí, Formentera del Segura, and Rojales). The decision would likely be to channel the canal sufficiently to evacuate the water as quickly as possible, while relying on dams to retain the water for as long as possible.
Regarding channeling, to create the straightest channel possible, meander cutting is proposed. This involves cutting a bend in the river, joining both sides of the channel through a new artificial channel to make the channel as uniform as possible and prevent flooding, as meanders promote flooding. In this way, a total of 56 meanders are cut from La Contraparada to Guardamar del Segura, representing a reduction of approximately 10 km. The length of the Segura River channel in its natural state was 45.8 km, and after the meander cutting and channeling, it is reduced to 35.4 km from La Contraparada to Guardamar del Segura, giving a steeper slope, higher velocity, and shallower depth [54].
For decades, the information provided by the basin authority to the citizens established a hydraulic capacity of 950 m3/s in Murcia, and 450 m3/s in Orihuela [53]. However, the rising flows of the Segura River and the overflows that caused flooding in September 2019 called these capacities into question, as the records from the measuring stations did not reflect these flows, which were about to overflow or touch the lower decks of the bridges, especially in the towns of Murcia, Orihuela, Almoradí, and Rojales.
Therefore, the data for the annual maximum flows recorded in the different gauging stations of the River Segura were requested from the Segura Hydrographic Confederation for the period 1996–2023. Of all the gauging stations, only the La Contraparada station has data in complete series for 27 years, although these data are still insufficient. Furthermore, in this data series it should be noted that in the period 1991–1995, Spain experienced a severe drought, similar to the years 2004–2007 and from 2011 to 2017, which could have altered the annual maximum flow data. However, the method presupposes that the sample is representative of the flood population (Table 1).

Table 1.
Maximum annual flows recorded at La Contraparada (Murcia) (1996–2023).
By applying the statistical method and conducting the Kolmogorov–Smirnov test, we can observe that the distribution adjustments that have the highest correlation with the data observed are: (1) Log Pearson III with 99.9986%, (2) GEV-Max (L-Moments) with 99.9909%, (3) Log Normal with 99.6800% and 3) EV-Max (L-Moments). These data have been obtained from the Hydrognomon 4 program (Figure 3).
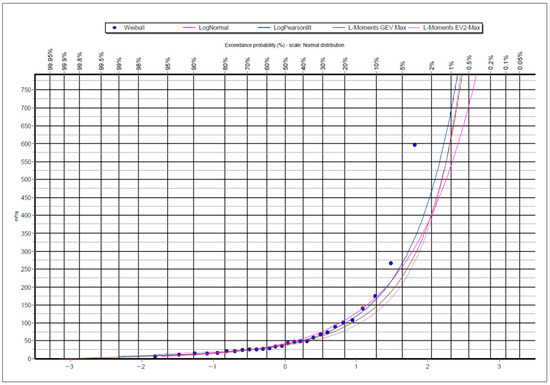
Figure 3.
Distribution adjustment with greater affinity to the flows observed in the Segura River as it passes through the gauging station at La Contraparada (Murcia) for the period 1996–2023. Source: Hydrognomon. Own elaboration.
Although the distribution adjustments show a high percentage of refinement, this occurs at low and medium values, and their curves separate at the most extreme flow values.
The annual maximum flows associated with different return periods have been calculated so as to determine the maximum flood that the River Segura could experience with the most updated information (1996–2023) and after the completion of the works contemplated in the Flood Defence Plan of the Segura basin (Table 2).

Table 2.
Maximum annual flows associated with return periods based on each of the distribution settings.
As we can observe, all of the distribution adjustments have fairly high flows for return periods of between 25 and 50 years, which increase further for higher return periods of 100, 200, and 500 years, true by definition of the method.
A total of 32 years elapsed between the flood of November 1987 and that of September 2019. This would place the flood within a return period of between 25 and 50 years, probably closer to 30 years. And, considering that the maximum flow rate during the September 2019 flood as it passed through La Contraparada was 267,167 m3/s, it seems to fit the GEV-Max (L-Moments) model better, which is more conservative than the Log Pearson III model, although both cases account for an increase in the aforementioned return periods.
Moreover, the five-minute data of all of the gauging stations in the Segura river basin were requested so as to determine the rise in the Segura river and its tributaries during the aforementioned event in September 2019, and these have been used in the results section.
2.3. Data Preprocessing and 2D Modeling in the HEC-RAS Software to Obtain the Maximum Capacity of a Channel or Maximum Allowable Flow Rate
First, high-resolution (0.5 m) LiDAR points were obtained for the area of study from the National Geographic Institute (IGN). Subsequently, a Digital Elevation Model (DEM) was obtained, which includes the information referring to the land, buildings or constructions, road, and rail infrastructures. No elements related to vegetation were selected so as not to create interferences in the riverbed. After obtaining the DEM, the flood plain in the area of study was delimited using a GIS (QGIS v.3.42), from La Contraparada to Guardamar del Segura.
Next, the DEM obtained was introduced into the HEC-RAS software (v. 6.6). After analyzing several points related to the watercourse and channel walls, a series of openings were identified by way of triangulation carried out in the formation of the DEM where the water overflowed in the model. In response to this problem, it was decided to fill in these openings by modifying the terrain with the tool (Raise Terrain tool in HEC-RAS) and channeling the River Segura along its course from La Contraparada to Guardamar del Segura. This resolved the problem, preventing overflows through non-existent holes in the walls, although leading to overflows due to exceedance of channel capacity.
Third, more modifications were made to the DEM related to obstructed openings, cross-drainage structures (CDS) on roads and railway lines, the repair of drainage channels (azarbes), and even repairs in sections of the Segura River, particularly in Murcia and Orihuela (Figure 4).
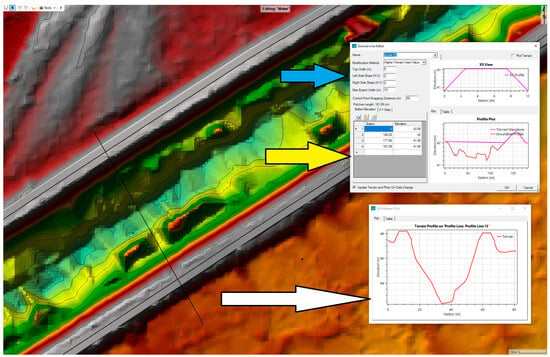
Figure 4.
Repairs to the embankments of the channel, trapezoidal section, and cross-section of the channel once the embankments have been repaired. Source: HEC-RAS. Own elaboration.
As can be seen in the image, the result of the modification of the Segura River channelization ridges (gray ridges) can be observed in detail. When a DEM is created based on LiDAR points, the filling used to connect one point to another can generate different elevations. These altitudinal differences can occur in the ridge, generating gaps relative to the actual height it should have. The graph with the yellow arrow shows a precise example of the gaps that form between elevations 42 and 42.5 m. The purple line shows the corrected height of the ridge to cover the gap below, avoiding unrealistic overflows. The blue arrow shows the characteristics applied to the section of the channelization ridge (trapezoidal) and its shape in a frontal view. Finally, the white arrow represents the longitudinal cut or profile (black line) that crosses the channel, showing the result of the shape of the river dykes once corrected.
In the case of rectangular section channels (vertical banks), the slope (H:V) is equal to 0, and the width of the base is equal to the width of the upper area. Likewise, the image shows the modifications and specific repairs made to the bank, the walkway, and the interior of the channel. The white arrow shows the profile cut made in this section and the result of the modifications to the terrain (Figure 5).
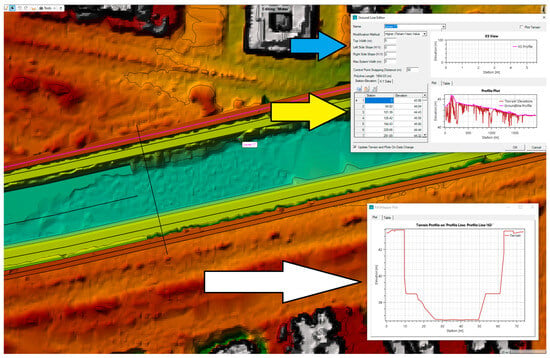
Figure 5.
Repairs to the embankments of the channel, rectangular section, and cross-section of the channel once the embankments have been repaired. Source: HEC-RAS. Own elaboration.
These modifications are those that have been used to completely repair the embankments of the Segura River from La Contraparada to its mouth in Guardamar del Segura.
Fourth, a first 1D hydraulic simulation was conducted in order to obtain a preliminary estimate of the capacity of the River Segura in each section. To do this, several floods were simulated with different increasing flows (200, 250, 300, 350, 400, and 450 m3/s) for the majority of the sections. In the case of Murcia, the CHS informed that the estimated theoretical capacity in the event of September 2019 established Murcia with a capacity of 600 m3/s, so the flows introduced for this section increased in the same way up to 650 m3/s. However, the 1D modeling understands these circulating flows as being stable over time and along the whole course and unidirectional. Therefore, it does not reliably represent the reality, characterized by unstable and turbulent flows. For this reason, it was decided to conduct a 2D modeling.
For the 2D modeling, a mesh was drawn with 50 × 50 m cells for each area. This is justified because when performing the calculations, we do not want to spend so much time on the floodplains (which are not the subject of this study). Yet, they provide considerable storage, reducing the channel flow you are trying to model, unless the water flows rapidly back into the channel, which depends mainly on floodplain roughness. What matters is achieving greater precision in the riverbed and on the banks in order to obtain points and overflow flows of the river when it reaches a certain flow rate.
Then, breaklines were drawn along the channel walls and a fixed size of 5 × 5 m was established as the mesh should be adapted as best as possible to the retaining wall of the modified DEM, so that there are no jumps between one cell and another or any unrealistic overflows. In this way, the overflows occurring in channel walls of the trapezoidal section are due to an overcapacity. Furthermore, more breaklines were drawn with a size of 10 × 10 m for roads and rail infrastructures and other elevated areas that can act as walls along the course of the overflowed waters. Also, a series of computational points were added at the beginning of the course to improve the calculation of the entry of flows (Figure 6).
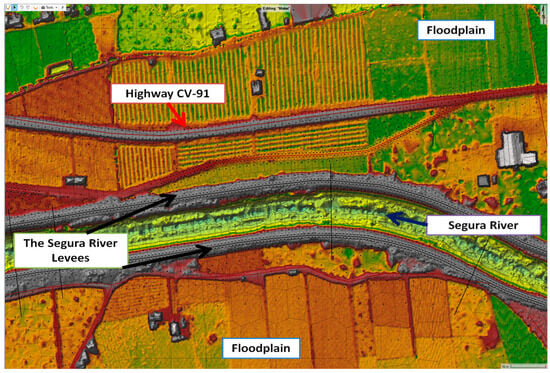
Figure 6.
Modifications to the terrain, mesh, and breaklines used as an example in a section of the Segura River channel as it passes through Orihuela. Source: HEC-RAS. Own elaboration.
With regard to the opening of cross drainage works in road and rail infrastructure, the example of the Alicante-Murcia railway line, which has multiple ODTs, has been chosen. In this case, the ‘Channel’ terrain modification option has been used to create openings that simulate the passage of water from an ODT. They do not represent real ODTs but they allow the model to function, especially in surface runoff (Figure 7).
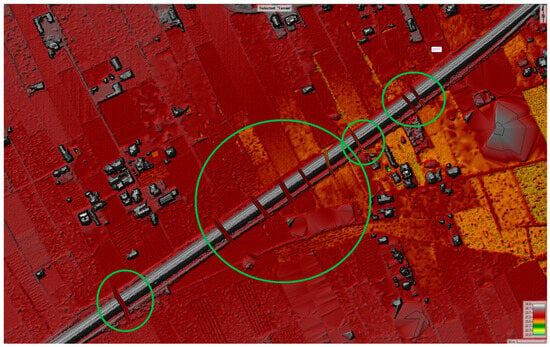
Figure 7.
Modification of the terrain to simulate existing ODTs in road and rail infrastructure. Source: HEC-RAS. Own elaboration.
The next step consisted of using the layer of information of the System of High Resolution Information on Land Occupation in Spain (SIOSE AR) (scale 1:5.000) in vector format. In this layer, it contains a total of 45 different land uses, each of which has been assigned a Manning ‘n’ (roughness) value as specified in the guidelines of the National Floodplain Mapping System (SNCZI) in Spain [55] and Standard 5.2 of Road Instruction in Spain [56] (Table 3).

Table 3.
Land use and Manning’s coefficient assigned to each land use.
Despite these values being introduced based on land use mapping in Spain, it is possible to vary some Manning values, for example in the riverbed, depending on whether it has a greater or lesser amount of riparian vegetation or reeds that can reduce the flow velocity, or depending on the type of channeling, whether it is concrete, earth mounds, or masonry walls, among others.
For example, according to the SNCZI Guide in Spain, watercourses (rivers) are assigned a Manning’s roughness coefficient (n) of 0.04. Depending on whether the riverbed has abundant vegetation, a value of 0.05 could be assigned, or in the case of less vegetation due to reed clearing, a value between 0.03 and 0.035. In this particular case, the value designated by the guide of 0.04 has been used throughout the channel in order to consider the channel to be in the same state in the different sections analyzed.
Manning’s value was fundamental to obtaining the maximum allowable flow rate, since the roughness of the terrain allows the water to circulate faster or slower and allows us to understand how the flood expands as well as the affected areas (Figure 8).
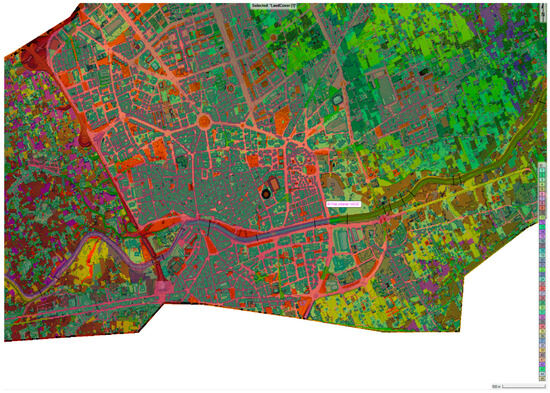
Figure 8.
Land use (SIOSE AR) used with an N Manning value included. Source: SIOSE AR. HEC-RAS. Own elaboration. Note: The colors represent a Manning value based on land use. As can be seen, there are 45 classifications, corresponding to the same order number as those in Table 3.
Next, the flood hydrograph is introduced. The method used for the flood hydrograph is based on a staircase-shaped increase in flow, assigning a flow value and maintaining that value for 2 h, throughout a total simulation of 36 h. There are several reasons for using this stepped hydrograph: (1) the first reason is that it simulates a rise in flow from low to high levels, so at the simulation level we are generating water turbulence during the filling process; and (2) because of the way HEC-RAS calculates with 2D mesh simulation.
This approach and type of hydrograph are justified due to the way in which the cells of the mesh established in HEC-RAS have been calculated. This program works by filling in the cells from the bottom to the top, and until a similar level of the adjacent cell has been reached, the water does not pass from one cell to another and depends on the precision of the mesh created in the DEM. This justifies the need to fill the channel with different flows that are rising constantly for 2 h in order to stabilize the calculation of the model. Furthermore, it has been found that the overflows are due to the exceeding of the river’s capacity, obtaining the exact flow value in the hydrograph for each overflow point in a particular section.
The initial value of the models is 10 m3/s, reaching a maximum value of 450 m3/s for the Orihuela, Almoradí, and Rojales sections (maximum capacity determined by the basin authority), and 650 m3/s in Murcia, as the canal in this section has a greater capacity. Maintaining the maximum flow constant for 19 h is related to achieving the maximum possible extent of flooding when the river overflows due to exceeding the capacity of the riverbed (Figure 9).
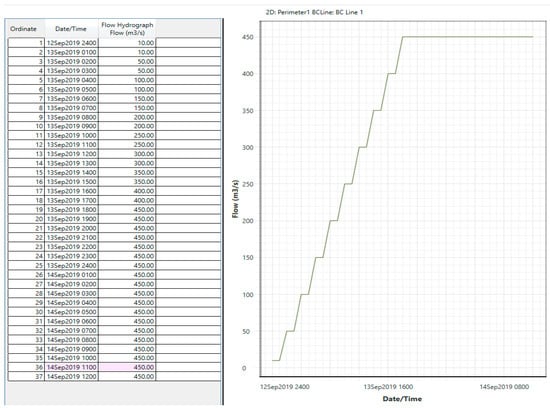
Figure 9.
Flood hydrograph entered into the HEC-RAS software. Source: HEC-RAS. Own elaboration.
It is important to note that this type of hydrograph does not accurately represent the actual flow increase of the Segura River. Generally, according to hydrograph data from the river basin authority, the Segura River experiences a gradual and steady rise, as shown in a traditional hydrograph, until it reaches its peak flow, which can last for several hours if it continues to rain. If the rain stops, the flow of the Segura decreases again over the course of hours or days until it reaches its base flow of 5 m3/s.
The step hydrograph method allows a flood to be simulated up to its theoretical maximum hydraulic capacity, maintaining a constant, ascending flow rate, ensuring actual capacity is reached until its overflow at any flow level.
Using a constant flow hydrograph would be erroneous because it generates instability at the start of the model and could produce unrealistic results, even flooding at the model’s input, distorting the real effects. Using a synthetic hydrograph of maximum annual flow associated with a return period can be used to understand the behavior of a river flood, its overflow, and affected areas, as well as to obtain flood hazard and risk maps.
However, this is not the objective of this article. Rather, it aims to establish a methodology that allows the hydraulic capacity of a channel to be determined in any section, allowing for the determination of sensitive overflow thresholds.
It should also be noted that upstream overflows have a significant attenuation effect on the downstream flood wave. Therefore, despite introducing high flows, it is possible that at several points constant flows are maintained over time, due to this laminating effect if overflows occur upstream.
It should be noted that these hydraulic simulations by sections are carried out for several reasons: (1) To facilitate and reduce the calculation time of the hydraulic simulation, (2) to avoid the laminating effect of upstream overflows that could prevent overflows at the most sensitive points of the studies, and (3) to obtain a detailed analysis of the sections of interest (urban areas).
Another aspect worth noting is that during floods, rivers transport large amounts of sediment both in suspension and as bed load. This aspect is very important because, according to Archimedes’ principle, sediment transport causes an increase in water depth, with lower flow rates. This means that if sediments are included in the hydraulic simulation, the channel capacity may be lower than that obtained in the HEC-RAS software calculation using only water (flow).
However, in this study, the objective is to model only water (flow) as an initial study to determine the actual hydraulic capacities. There are two reasons for not including sediments in the model: (1) the authors’ limited knowledge of how to incorporate sediments into the HEC-RAS software at present, and (2) most of the hydraulic simulations carried out by basin and official bodies in Spain that configure or determine hazard maps are based on water models without including sediments, which justifies this methodology, although it can be improved and complemented by incorporating sediments.
In relation to the parameters entered for the model calculation, a simulation lasting 36 h (1 day and 12 h) was assigned, starting at 00:00 a.m. hours on 13 September 2019 and ending at 12:00 p.m. hours on 14 September 2019. The selection of the date is justified by the rainfall and flooding events, as well as the duration of the rainfall and the most severe flooding event.
The calculation interval was set at 1 s, and the results were obtained in maps and hydrographs every 5 min. These parameters indicate the calculation time and the obtaining of results from graphs such as the hydrograph or the visualization of the results of depth, velocity, depth*velocity, and other results offered by HEC-RAS once the model has been calculated.
The calculation equation to resolve complete Sain-Venant equations is the Shallow Water Equation–Explicit Linear Method (SWE-ELM (original/faster), as it considers (continuity + moment in 2D), representing complex flows, changes in direction, shock waves and whirlpools very well. It applies continuity equations with moment (x) and moment (y), interchanging x and y so as to calculate speeds, depth, gravity, slope, and friction. It is the most complete hydraulic calculation method. Moreover, in order to ensure a greater stability in the calculations of unstable flows, the Courant number has been determined. The Courant number (CFL) is a value that indicates whether the numerical calculation in HEC-RAS is stable for the size of the mesh and the passing of time that has been chosen. It is necessary to assign the Courant number in the calculation of the SWE-ELM method (original/faster) in order to fulfill the Courant condition to avoid fluctuations and failures, limiting the speed of the calculation.
The data entered are a maximum Courant value of 1 and a minimum value of 0.45. These values are determined for a stable calculation according to the HEC-RAS developers’ user manual. The data entered are a maximum Courant value of 1 and a minimum value of 0.45. These values are determined for a stable calculation according to the HEC-RAS developers’ user manual. However, for the third parameter, a value of 0 has been assigned instead of 4 to speed up the calculations, as it is not necessary to repeat the calculation four times for the purpose of this research.
As for the fourth and fifth parameters, a value of 10 has been assigned, allowing a value of 0 to be entered in the fifth parameter, with the aim of stabilizing the calculation with 1 s of calculation. This last value also corresponds to that indicated in the HEC-RAS user manual (Figure 10).
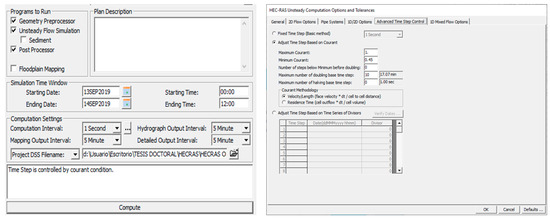
Figure 10.
Parameters entered for the hydraulic simulation in the sections analyzed for the channeling of the River Segura (left) and established Courant number (right). Source: HEC-RAS. Own elaboration.
As observed in Figure 7, do not enter sediment parameters without activating the “sediment” option.
3. Results
The results obtained of the hydraulic capacity or maximum allowable flow in the Segura River channel in the sections of Murcia, Orihuela, Almoradí, and Rojales are shown below. It should be indicated that the position of the flow labels indicates whether the flooding took place on the left or right bank.
3.1. Hydraulic Capacity in the Segura River Channel: Urban Section of Murcia
For the hydraulic simulation in Murcia, modifications had to be made in the course, adjusting the retention walls and the side channels to reflect the channel section as it passes through Murcia as reliably as possible (Figure 11).
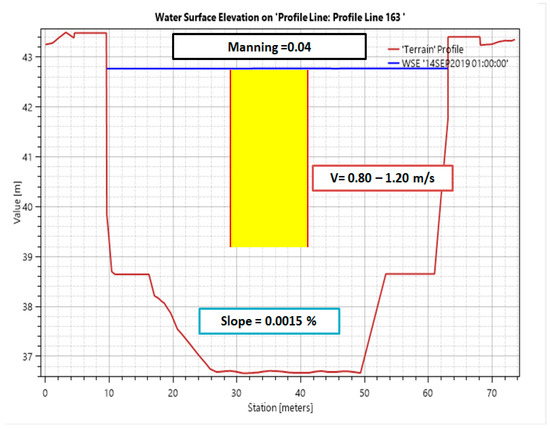
Figure 11.
Cross-section Murcia: Result of the channel section in Murcia obtained after modifications in HEC-RAS. Source: HEC-RAS. Own elaboration. Note: The yellow stripe represents the area of highest velocity in the channel.
The results obtained in the 2D hydraulic simulation with HEC-RAS show different capacities depending on the section. When the River Segura channel passes through a trapezoidal section and a rectangular section and penetrates Murcia’s urban center it overflows with a flow of 208.30 m3/s, both on its left and right banks, due to the existence of a low structure that crosses the A-30. The left bank overflow is due to a former meander of the River Segura and the whole of this area is flooded until the so-called Paseo del Malecón, which is a wall constructed in Murcia centuries ago in order to protect the city from floods. Downstream, at the point of the Puente or Pasarela de Manterola it overflows again on its left side with a flow of 250 m3/s.
As the River Segura passes beneath the Puente Viejo and the Puente de los Peligros, the channel widens and increases its conveyance capacity, preventing flooding within the urban center. This behavior results from the attenuation of the flood wave as the river enters the city of Murcia, although overtopping occurs behind the Museo Hidráulico Los Molinos del Río Segura, on the right bank, at a discharge of 371 m3/s.
From this point, the River Segura does not overflow in the rest of the urban area of Murcia until it reaches its final section close to the Vistabella Park and downstream from the Puente de la Ficha, with a flow of 235.35 m3/s, flooding this whole section, where the Victor Villegas Auditorium and Conference Center and Murcia’s Exhibition Center are located. The whole of this sector corresponds to a former meander of the River Segura in medieval times, which has been completely urbanized and forms part of Murcia’s urban fabric, which explains why the river overflows at this point. The overflowed waters at this point begin to flood the hamlet of Puente Tocinos.
Taking these aspects into account, we can establish that in the urban center of Murcia, the river has a maximum hydraulic capacity of 400 m3/s, with overflow points between 210 and 235 m3/s as it enters and leaves the city. In fact, downstream from the, the capacity of the channel is between 230 and 250 m3/s, on its left and right banks, respectively. If there is sediment in the hydraulic simulation, it is very likely that the capacity of the canal will be lower than the water and increase the roughness (Figure 12).
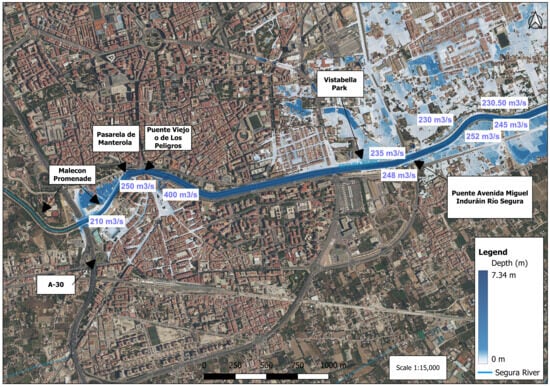
Figure 12.
Hydraulic capacity or maximum permissible flow at which overflow occurs in Murcia Orihuela due to overcapacity in the channeling of the River Segura. Source: HEC-RAS. Own elaboration.
In order to corroborate these results in relation to the floods of September 2019, they have been compared with the data of the gauging stations of the CHS and images of the event (Figure 13).
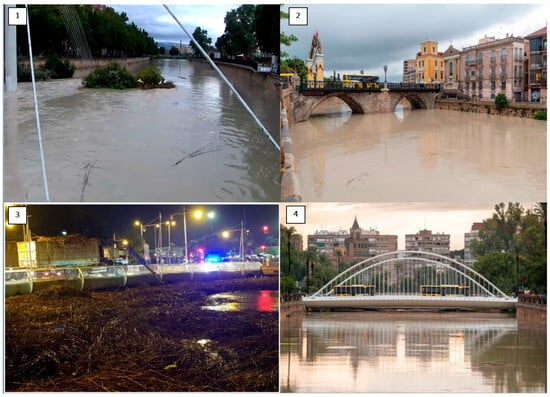
Figure 13.
Flooding of the River Segura on 13 September 2019 as it passes through Murcia at the Manterola bridge or footbridge (1), the Puente Viejo or Puente Los Peligros bridge (2), the Miguel Caballero bridge (3) and the Hospital General bridge in Murcia. Source: ABC (1), Antena3 (2), CHS (3) and RTVE (4).
It should be noted that there is no gauging station in the urban center of Murcia, the closest being located in La Contraparada. The maximum flow recorded in the La Contraparada station was 267.18 m3/s, at 11:05 on13 September 2019. Some occasional overflows could have favored the reduction in flows between 250–260 m3/s as the river passes through Murcia, which explains why in the first section the flow was on the verge of overtopping but, subsequently, the channel contained the flood as it passes through the urban center.
3.2. Hydraulic Capacity in the Segura River Channel: Urban Section of Orihuela
For the hydraulic simulation in Orihuela, modifications also had to be made in the course, adjusting the retention walls and the side channels to reflect the most realistic channel possible (Figure 14).
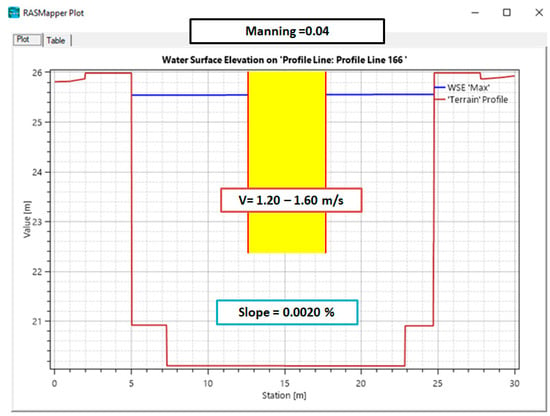
Figure 14.
Cross-section Orihuela: Result of the channel section in Orihuela obtained after modifications in HEC-RAS. Source: HEC-RAS. Own elaboration. Note: The yellow stripe represents the area of highest velocity in the channel.
It should first be noted that the slope of the Orihuela section is 0.0020, the Manning’s N value in the channel is 0.04, and the values obtained for water velocity range between 1.20 and 1.60 m/s along the section analyzed.
The results obtained in the 2D hydraulic simulation with HEC-RAS show different capacities depending on the section. The case of Orihuela is special as it is subdivided into two parts: from the river’s entry into Orihuela to the Puente de Levante; and from the Puente de Levante to its exit from Orihuela.
In the first section, the channel of the River Segura is characterized by having a trapezoidal section with an approximate capacity of 200–205 m3/s, until it enters Orihuela. In fact, with 205 m3/s, overflows occur on its left and right banks, due to the narrowing and change from a trapezoidal to rectangular section.
When the rectangular channel begins in the urban center of Orihuela, the river narrows considerably and its capacity is reduced to 200 m3/s, overtopping on its left bank with a flow of 138 m3/s in the Salesas and Malecón streets.
Downstream, the channel reaches a sector that narrows even more due to the existence of terraced housing built along the banks backing onto the river in the Río and Mancebería streets. This is the case until the Puente de Poniente. In this sector, the narrowing reduces the capacity to 155 m3/s, with overflows in some streams on the right bank and the left bank before it reaches the Puente de Poniente. If there is sediment in the hydraulic simulation, it is very likely that the capacity of the canal will be lower than the water and increase the roughness (Figure 15).
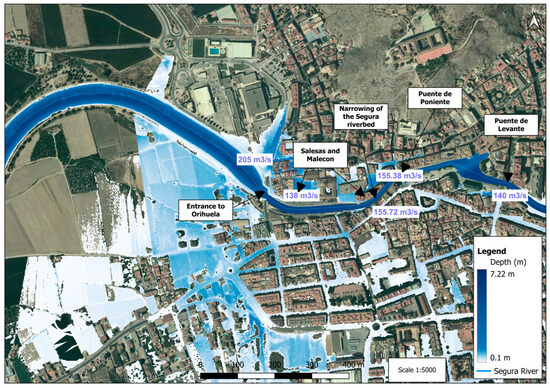
Figure 15.
Hydraulic capacity or maximum permissible flow at which overflow occurs in the first sector of Orihuela due to overcapacity in the channeling of the River Segura. Source: HEC-RAS. Own elaboration.
From the Puente de Levante, the Segura river channel narrows considerably again, reducing the hydraulic capacity of the river a little more. This section has a special characteristic as the first overspill occurs as the river leaves the town of Orihuela. The first overflow occurs with a flow of 108 m3/s on the left bank in the neighborhood of San Pedro. Subsequently, it overflows on the right bank at the same point when the flow reaches 111.33 m3/s. The overtopping generates backwater effect and causes flooding a few meters upstream on the left and right banks with a flow of 123 m3/s. This leads to more backwater effect of waters and the Segura overflows at the point of the San Pedro neighborhood with a flow of 135.83 m3/s. Therefore, the whole of this sector on the left bank of the River Segura in the San Pedro neighborhood is the first point at which the waters overflow.
These overspills generate more backwater effect against the water coming from upstream, also generating more flooding of the river on both its left and right banks between the and the Los Arcos municipal football stadium of Orihuela with flows of between 136 and 138 m3/s. And, from the football stadium to the Puente de Levante, the River Segura overflows on both of its banks when it reaches flows of 138–140 m3/s. If there is sediment in the hydraulic simulation, it is very likely that the capacity of the canal will be lower than the water and increase the roughness (Figure 16).
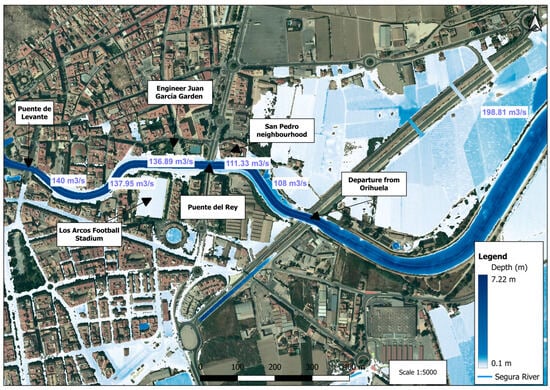
Figure 16.
Hydraulic capacity or maximum permissible flow at which overflow occurs in the first sector of Orihuela due to overcapacity in the channeling of the River Segura. Source: HEC-RAS. Own elaboration.
These flows reach a depth of 5.90 m, touching the bottom of the Puente de Levante (Figure 17).
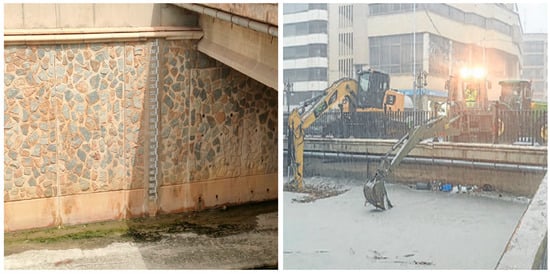
Figure 17.
Water level gauge at the Levante Bridge (left) and flooding of the Segura River on 13 September 2019 (right). Source: Pedro José Gómez Cascales and CHS.
These data coincide with the depth values obtained in the HEC-RAS simulation.
The result is the overtopping of the River Segura and the flooding of the adjacent sector, showing the capacity needed to be able to assume the rise in the level of the Segura as it passes through the urban center of Orihuela (Figure 18).
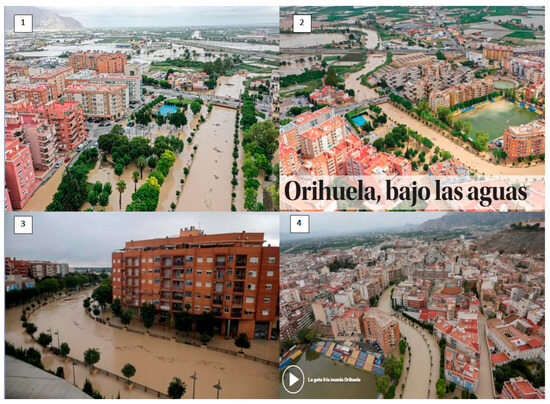
Figure 18.
Overtopping of the River Segura from the Levante Bridge to its exit from the city of Orihuela. Source: Diario Información, Emergencias 112 and EL PAÍS. Note: overtopping of the Segura River in the Ingeniero Juan García Garden (1), overtopping of the Segura River between the aforementioned garden and the municipal football field (2), overtopping of the river in the bend upstream between the aforementioned garden and the Orihuela football field (3) and view of the failure of two flood walls of the Segura River from downstream to upstream (4).
In this case, the town of Orihuela does have a gauging station at the last bridge before the river leaves the urban center, called the Puente del Rey. However, the gauging station recorded a maximum value of 111 m3/s at 07:50 and ceased to make recordings due to the flooding of the Segura (Figure 19).
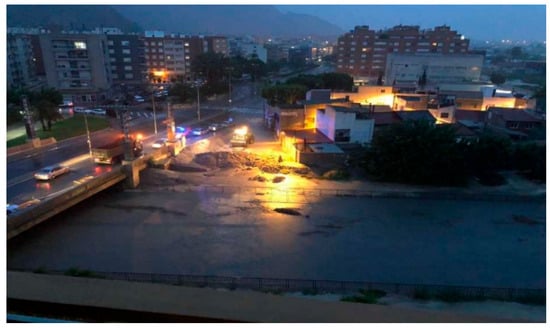
Figure 19.
Initial overtopping of the River Segura as it passes through the San Pedro neighborhood, downstream from the Puente del Rey bridge in Orihuela. Source: CHS.
This coincided with the moment of the initial overflow in the San Pedro neighborhood. In the hours that followed, the flow of the River Segura increased until it covered the whole of the above images. We can estimate that values of between 135 and 140 m3/s were reached, coinciding with the results obtained in HEC-RAS. It is possible that, considering the last record of the water body and the results obtained from the hydraulic model, if it includes the sediments and the roughness increases, the hydraulic capacity of the water body will decrease, estimated between 120 and 130 m3/s.
3.3. Hydraulic Capacity in the Segura River Channel: Urban Section of Almoradí
It should be noted that in this section the River Segura does not pass through the urban center, as in the case of Murcia and Orihuela, but runs between two municipalities: Almoradí and Algorfa (Figure 20).
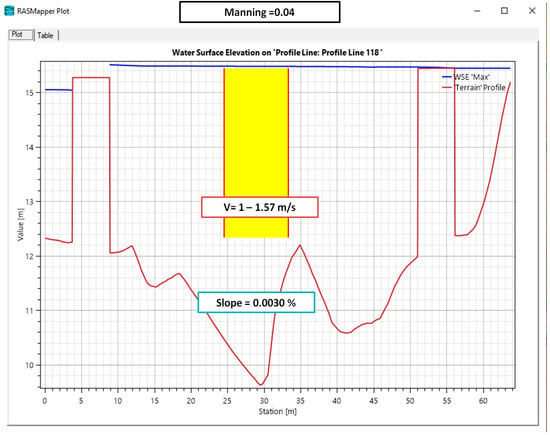
Figure 20.
Cross-section Almoradí-Algorfa: cross-section at the time of overflow on its left margin. Source: CHS. Note: The yellow stripe represents the area of highest velocity in the channel.
This section has been included due to the importance of the flood of September 2019, with the rupture of two channel walls and the complete flooding of the left side of its floodplain (Figure 21).
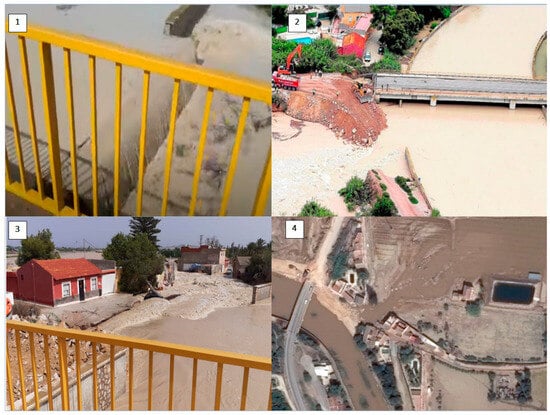
Figure 21.
First breach of the Segura River channel embankment and plugging works (13 September 2019) (1,2) and second breach of the Segura River channel embankment and plugging works (15 September 2019) (3,4). Source: CHS.
The results obtained in the modeling conducted with HEC-RAS show the flooding of the River Segura in these two points where the wall ruptures occurred, revealing that this sector is prone to overflows and that it was foreseeable and could have been avoided with actions taken before the event.
From the weir of Alfeytamí, where some overflows occur when flows of 120 m3/s (in the weir) are reached and 185 m3/s at its retaining wall on the left bank, a maximum capacity of 200 m3/s can be estimated until the river reaches the bend where the two ruptures in the retaining wall occurred in September 2019.
Furthermore, at this sharp bend and change in direction there is also a considerable narrowing of the channel with rectangular channel walls. The maximum capacity in the narrowest area of the bend is 140 m3/s, and it gradually recovers capacity to 150 m3/s in the rectangular section. Subsequently, the rectangular section reverts to a trapezoidal section and the capacity increases to almost 200 m3/s, which is maintained until the river reaches the town of Formentera del Segura. If there is sediment in the hydraulic simulation, it is very likely that the capacity of the canal will be lower than the water and increase the roughness (Figure 22).
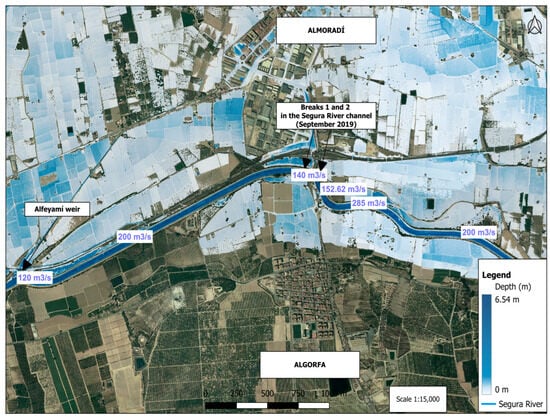
Figure 22.
Hydraulic capacity or maximum permissible flow at which overflow occurs between Almoradí and Algorfa due to overcapacity in the channeling of the River Segura. Source: HEC-RAS. Own elaboration.
The total areas affected by the overtopping of the River Segura, either due to the ruptures in the weir of Alfeytamí or those in the bend and the narrowing of the channel in Almoradí, largely coincide with the areas affected in September 2019, confirming the results obtained in HEC-RAS.
3.4. Hydraulic Capacity in the Segura River Channel: Urban Section of Rojales
Finally, one of the most conflictive points is in the town of Rojales. The cross-section of the Rojales riverbed upstream of the Carlos III bridge has been extracted (Figure 23).
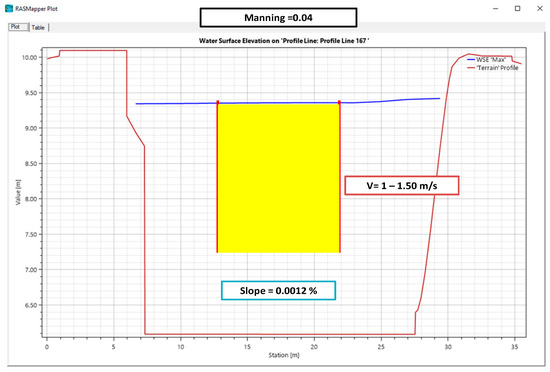
Figure 23.
Cross-section Rojales: upstream from the Carlos III bridge in Rojales. Source: CHS. Note: The yellow stripe represents the area of highest velocity in the channel.
The estimated capacity of the River Segura as it passes through Formentera del Segura reaches 200 m3/s and reduces to values of between 140 and 160 m3/s before it enters the urban center of Rojales.
In this section, there is a rectangular sector in the course of the River Segura. It runs along the course without any problems until it starts to reach a flow of 110 m3/s. The presence of the Puente de Carlos III, characterized by being a masonry structure built on the riverbed and with three arches under which the water passes, also acts as a barrier, slowing the speed of the water and generating a backwater effect. This backwater effect, together with the rapid waters arriving from upstream, generates an accumulation and overtopping of the River Segura with a flow of between 111 and 120 m3/s, on both the left and right banks in the last meander of the river before it reaches this bridge, located in the town center. Furthermore, this also generates a backwater effect at the beginning of the first meander, causing it to overspill with a flow of 137.07 m3/s.
Subsequently, the water reaches the Rojales Bridge, which has the following characteristics: a length of 24.5 m; a width of 7 m; the bridge spans are in the form of a pointed arch or basket arch; a central arch of 7.5 m, and the lateral arches of 5.5 m; and a rectangular cross-section. All these parameters have been entered into the HEC-RAS software to construct a bridge (modeled as a culvert), with a similar morphology (Figure 24).
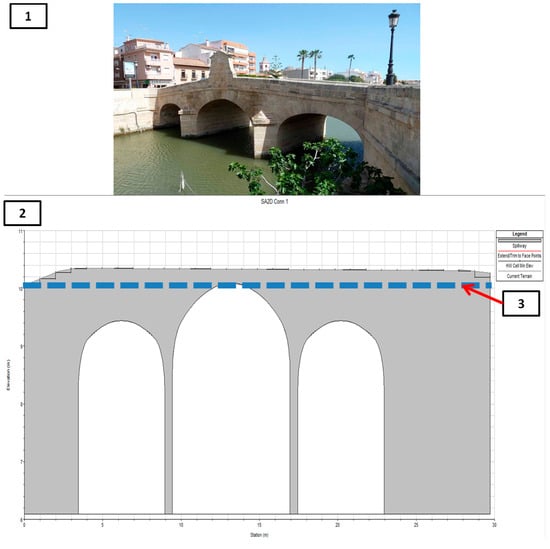
Figure 24.
Rojales Bridge (1), design of the Carlos III Bridge in Rojales for hydraulic simulation in HEC-RAS (2) and water height reached at the aforementioned bridge (10.16 m) (3). Source: HEC-RAS. Own elaboration.
In order to find the hydraulic capacity of the Puente de Carlos III, a detailed modeling of only this section has been carried out with the same hydrograph of the River Segura up to 450 m3/s. The results obtained show that the capacity of the channel or maximum allowable flow of the River Segura channel as it passes under the Puente Carlos III in Rojales is 200 m3/s, with the bridge arches completely blocked.
In fact, in the case of culverts, the simulation indicates that from 202.70 m3/s, the waters overspill the capacity of the culvert (Total Flow) (left table) or from the lower green line (Weir Flow), when values of 0.01 begin to appear, reaching up to 5.42 m3/s in the full simulation with flows of 450 m3/s (Figure 25).
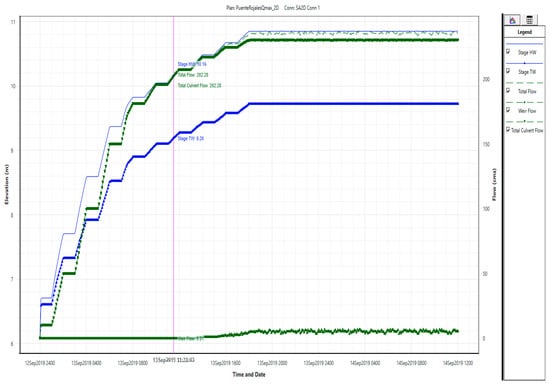
Figure 25.
Graph of the flow rate through the three culverts (bridge openings) designed in HEC-RAS. Source: HEC-RAS. Own elaboration.
These results are highly similar to the reality of the event in September 2019 (Figure 26).
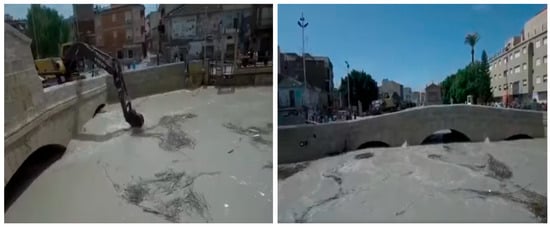
Figure 26.
Flooding of the Segura River as it passes under the Carlos III Bridge (Rojales) during the September 2019 flood. Source: Rojales Town Hall.
Downstream from the Puente Carlos III, the channel of the River Segura widens, increasing its capacity to 200 m3/s until it leaves the town center and changes from a rectangular section to a trapezoidal section, increasing its capacity to over 200 m3/s (Figure 27).
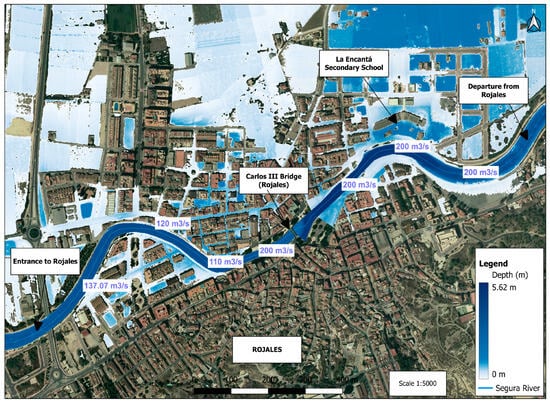
Figure 27.
Hydraulic capacity or maximum permissible flow at which overflow occurs in Rojales due to overcapacity in the channeling of the River Segura (full view). Source: HEC-RAS. Own elaboration.
It is very probable that the hydronic capacity of the river Segura sea was less likely to result in the introduction of sediments. Therefore, it is very likely that the hydraulic capacity of the three ojos of the Rojales bridge will have a capacity lower than 200 m3/s if it includes the sediments and the alterations that could cause the roughness values. You can estimate a value between 190 and 200 m3/s.
4. Discussion
This section discusses aspects related to the methodology, the results obtained, the current information available in Spain related to river basin organizations regarding hydrological warnings, and possible future proposals for new research, as well as its possible extrapolation to other areas of analysis of any river course.
The manual modifications made to the DEM (Digital Elevation Model) are justified by the need for the hydraulic simulation to be as realistic as possible. This involved correcting the “openings” or “gaps” that formed along the levee of the Segura River channel, causing overflows as if the river were “breaking through the levee wall,” thus failing to reflect a realistic situation. Repairing these levees ensures that overflows occur solely due to the river exceeding its capacity. This allows for the determination of an overflow threshold in the flow rate (m3/s), thus defining its capacity. Another important aspect is that, in a real-world event, a natural or artificial dam is very likely to break or collapse, consequently causing flooding without reaching its maximum hydraulic capacity.
The modifications to the DEM (Digital Elevation Model) in the riverbed were due to irregularities caused by the presence of reeds that were altering the DEM’s formation. For this reason, corrections were made to the riverbed to eliminate these irregularities and obstacles that could cause flooding due to channel obstruction.
The modifications to the DEM regarding cross-drainage structures (CDW) are justified because these structures actually exist and allow water to pass through linear barriers such as roads or railways. The terrain modification aims to simulate the presence of these structures and the flow of water, so that the model can continue its flood expansion.
Some modifications have also been made related to some water passages, with irrigation ditches or canals that contribute to the expansion of the flood in the Segura River floodplain, whose capacity characteristics are reduced, and in the formation of the DEM it may appear as continuous soil, and not as an existing ditch or channel.
Regarding the hydraulic model, there may be several uncertainties not quantified in this work, but we will now refer to and list them.
Regarding breaklines, as mentioned, the objective of this study is to determine the hydraulic capacity of the Segura River in the analyzed sections. This approach requires greater precision in the riverbed, especially in the levees. To achieve this, the breakline drawn at the center of the levees allows for the creation of a detailed 5 × 5 m grid for the levees, which fits them perfectly, preventing any part of the grid cell from entering the riverbed and causing unintended flooding. In this particular case, the levee of the Segura River is fitted to a 5 × 5 m grid, and linear infrastructure such as roads or main railway lines are fitted to a 10 × 10 m breakline. The results of these simulations justify the correct functioning of the grid size chosen for the river levees and linear infrastructure.
There may also be uncertainties regarding the Manning values assigned to land uses and the channel itself. Although this study has used data from official bodies, such as the SNCZI guide [55] and Standard 5.2 of the Highway Instruction (IC) [56], variations in the Manning value are possible. In this study, a value of 0.04 has been assigned to the entire channel to maintain a homogeneous Manning value. However, this value may vary depending on whether the channel bed is natural (earth) or channeled (concrete). This could result in lower Manning values.
If the degree of vegetation in the riverbed is also taken into account in the analyzed section, different Manning’s constant values could be determined. These variations could modify values associated with water depths, velocities, flow rates, and flood thresholds. Regarding the stepped rising hydrograph used in this work, it is worth noting that this method allows for greater model stability and fills the channel from bottom to top with the incoming flow, where water turbulence is calculated by the program without generating instabilities or calculation errors.
This type of hydrograph is considered more appropriate with respect to the main objective of the research: to determine the capacity of the channel by sections and to know the overflow threshold.
In a hydrograph with constant flow, this can lead to instability and calculation errors, especially at the beginning of the model. Excessive water inflow in a short period can cause unrealistic and undesirable overflows in the reach analysis, resulting in high water turbulence and wave attenuation effects. This can cause the river to fail to overflow at points where it is known to be likely to, or to overflow in areas where it does not typically occur.
A flood hydrograph, that is, a flow rate associated with a return period, can also fulfill this function, although with certain nuances. It would require modeling long return periods (T100, T200, or T500 years) [45], so that the flood wave is sufficiently high to generate overflows at different points, allowing for the determination of the overflow threshold.
However, the fact that the hydrograph subsequently experiences a decrease makes it impossible to know the true extent of any flow increases that may occur over time. Furthermore, this hydrograph could generate overflows for the creation of a flood hazard map, but it would not be entirely reliable due to the potential effects of runoff at some points, which would reduce downstream flows, potentially obscuring overflow points and the thresholds at which they would occur.
Regarding the Carlos III Bridge in Rojales, the culvert tool of HEC-RAS version 6.6 was used. Although HEC-RAS version 6.7 exists, which allows the inclusion of the bridge’s shape and the visualization of the water level over the bridge during a 2D flood, as this software is in beta, HEC-RAS recommends against using this tool in official studies at this time [39]. This justifies the use of the “culvert” tool, rather than the bridge itself, to obtain the maximum flow capacity as water passes through the three arches of the bridge.
Another aspect to consider is that the hydraulic model only takes into account the water flow, that is, it does not include sediments.
The main reason sediments were not included in the hydraulic simulation is due to the authors’ limited knowledge of how to incorporate them into the model. However, future research will attempt to include sediments to obtain even more realistic values for the potential flood thresholds of the Segura River and its actual capacity in the channeled sections.
Another reason why modeling is performed solely considering flow rate (water) is that most official flood hazard maps based on hydraulic simulations only use flow rate values without incorporating sediment. Sediment is generally included in analyses and studies for channel modifications, erosion zones, and sedimentation zones in natural channels.
However, it is important to consider sediment in these models, since the amount of sediment flowing through the channel influences water depth and velocity, potentially resulting in channel capacity values lower than those obtained in this study. Therefore, future research will include sediment to obtain more accurate and reliable results.
Regarding the results obtained, it should be noted that the hydraulic simulation achieved is completely identical to the floods of September 2019, and the capacities handled by the river.
Regarding the Murcia section, the results obtained are similar to the Segura River flood in September 2019, and the overflow thresholds obtained demonstrate that the current capacity of the channel is less than the 950 m3/s historically estimated [53], or the 600 m3/s estimated by the basin authority after the floods of September 2019 [48]. The results show a capacity of 400 m3/s through the center of the urban area, and upstream and downstream of the urban center, localized overflows may occur on its left and right banks with lower capacities.
In the Orihuela section, the results show a situation very similar to what happened in September 2019 in terms of flow rates, overflow points, and affected areas. The data recorded by the river basin authority’s flow meter registered a maximum flow rate of 111 m3/s before it stopped recording. According to the results obtained, this value marks the beginning of flooding downstream of the Puente del Rey (King’s Bridge), confirming the model’s accurate prediction of the amount and extent of the flooding. However, upstream, flooding occurred with slightly higher flow rates (130–140 m3/s), inundating areas that were flooded in September 2019. The 111 m3/s reading was recorded at 7:50 a.m., so it is possible that the river reached the flow rates predicted by the hydraulic simulation in the following hours. At this point, it should be noted that the theoretical capacity of the Segura River as it flows through the urban center of Orihuela was estimated at 450 m3/s [57].
The Orihuela section is channeled with concrete, so this is one of the cases where the Manning value could be modified. Also, as mentioned previously, including sediments in the modeling could reduce the threshold flow rate, affecting the depth and velocity of the water.
In the Almoradí section, the hydraulic simulation also reflects what happened in September 2019. As previously mentioned, during the September 2019 flood event, two levee breaches occurred in the bend of the river channel on the left bank, causing overflows and flooding in the Segura River floodplain, affecting numerous towns. The resulting hydraulic model shows overflows with flow rates between 140 and 150 m3/s, a consequence of the narrowing and the bend. The force of the water impacts the points where the breaches occurred before it can properly turn and adapt to the channel. This caused these points to be the first to overflow due to excess capacity. It also perfectly reflects the impact on some towns when the water flows across their floodplain.
In the case of the Rojales section, it should be noted that the hydraulic simulation obtained resembles what occurred in September 2019 only in terms of flow rates and channel capacity, especially at the Carlos III Bridge. However, it does not reflect the reality of what happened in September 2019 because the two levee breaches in Almoradí “saved” the town of Rojales from the Segura River overflowing its banks. These breaches acted as a relief for the municipalities downstream from Almoradí, notably Formentera del Segura and Rojales. Therefore, although some water continued to flow through the river, the maximum flow in Rojales would have been between 180 and 200 m3/s, enough to pass between the three arches of the afore mentioned bridge. At this point, it should be noted that the estimated hydraulic capacity of the canal as it passes through Rojales was estimated at 400 m3/s [57].
The culvert analysis and modeling have shown that the maximum hydraulic capacity across the three arches of the Rojales bridge is 200 m3/s. Beyond this point, the water would collide with the bridge deck, causing flash floods and inundating Rojales, Formentera del Segura, and sections upstream.
As mentioned in the Segura River Basin Flood Defense Plan (1987), there is a significant difference in expected peak flows between Orihuela and Rojales, a consequence of the river overflows that occur along its course to Rojales [53]. This does not preclude the possibility that, on rare or specific occasions, overflows may occur at other points, and that Rojales may be affected by the flood wave, as the simulation shows, due to the insufficient hydraulic capacity of the bridge arches in Rojales.
Despite uncertainties regarding the methodology, the model, and the results obtained, this methodology can be extrapolated to other watercourses to determine their hydraulic capacity. Entire reaches of watercourses can be modeled, although this is not advisable for several reasons: (1) the HEC-RAS calculation time will be longer, (2) calculation errors and instabilities may occur, (3) overflows can have a flood wave attenuation effect, potentially causing overflows at unusual points and preventing them from occurring in areas that have historically overflowed, and (4) the accuracy of the threshold flow at which overflowing begins will be lost. Therefore, it is advisable to first perform complete simulations of reaches to identify overflow points, overflow thresholds, and affected areas; and then attempt to corroborate the results with a global model of an entire reach. In this case, only the segment model has been chosen since the accuracy of the data and the model are prioritized.
Although this issue has already been mentioned, the possibility of incorporating sediments into the hydraulic simulation is advocated in future research to achieve a more realistic and accurate result of the actual hydraulic capacity of the Segura River, or of any river that one wishes to analyze in other parts of the world.
Knowing the hydraulic capacity of a watercourse is vital for understanding the evolution of flooding, potential overflow points, areas susceptible to inundation, and the magnitude and extent of the flooding. Furthermore, knowing the maximum hydraulic capacity allows for the issuance of hydrological warnings based on reservoir levels. In Spain, the Segura River Basin Authority (CHS), through its Automatic Hydrological Information System (SAIH), maintains a basic diagram of the basin’s main watercourses and reservoirs. While information on channel capacity is not displayed, a series of hydrological warnings are issued based on the percentage of watercourse filling. The problem is that without knowing the actual hydraulic capacity of the watercourse, this percentage cannot be determined from recorded flow data. The only way to obtain this information is through real-time monitoring in the field. This explains why, during the September 2019 flood event, the Segura Hydrographic Confederation (CHS) did not issue any hydrological warnings when the river was about to overflow, when it was overflowing in some areas, or when the levees broke in Almoradí. It only reported the filling of the Santomera reservoir and the opening of floodgates to relieve flow and prevent a possible dam break after the first levee breach had already occurred in Almoradí, and there were overflows and flooding in Orihuela and other locations.
For its part, the Jucar River Basin Authority (CHJ), following the catastrophic floods in Valencia in October 2024, which resulted in 229 deaths, did issue a hydrological alert that morning for the Poyo river. However, they stopped monitoring the Poyo river and focused on the possibility of a breach at the Forata reservoir, which was at emergency level 3 (possibility of imminent dam break) [51,52].
Unlike the CHS, the hydrological warning thresholds established by the CHJ refer to flow rates. In this way, a traffic light color is assigned based on a specific flow rate for each watercourse, which differs from other watercourses.
This is why it is important to analyze the hydraulic capacity of each watercourse in the basin in order to determine thresholds and issue hydrological warnings to the population to prevent the loss of human lives.
Within a context of climate change with a trend of precipitations concentrated in short time intervals and more intense and abundant rainfall [58] and an increase in floods and economic damage due to the occupation of floodable areas, it is fundamental to determine the hydraulic capacity of the whole river or a specific section of it in order to manage a flood event.
First, knowing the maximum capacity of a river at any of its points enables a better management of flood risk in a basin [59,60,61,62,63,64]. It enables us to know that if the real capacity of a watercourse is 140 m3/s and has a flow of 150 m3/s, it is highly likely that the river will overflow, affecting people and constructions, as in the case of the flooding of the River Segura in the urban center of Orihuela. Another issue is that flooding is also caused by overcapacity or the rupture of channel walls, as in the case of the two ruptures in Almoradí in September 2019 [50].
Second, it allows us to establish hydrological hazard thresholds. A flow at a certain speed represents a critical threshold for people and vehicles, which can be dragged away by the river. Analyzing the sections of a river and establishing the thresholds can give rise to more realistic hydrological warnings and help to improve the management of a flood event. Effective early hydrological alert systems usually require the division of the watercourse into river sections (‘reaches’) with specific warning thresholds as different sections have different hydraulic characteristics and response times. This allows the emission of more precise alerts and the reduction in risk [65,66,67].
Furthermore, it improves our understanding of the speed and level of the rising flow and the hydrological alerts issued by the basin authorities. For example, in a river with a maximum capacity of 300 m3/s, if the notifications mark 50/300 m3/s, 100/300 m3/s, or 250/300 m3/s in 3 h, this implies that the flow is growing and reaching the river’s capacity for this section. Although this is evident for hydraulic science, this is not the case for the decision makers and emergency managers.
A good example is the latest catastrophic flood event in Spain on 29 October 2024 in the province of Valencia. In addition to the gross negligence and poor decisions that were taken too late, those responsible were unable to understand that in a watercourse (El Poyo river) with a maximum capacity of 800 m3/s, the fact that values of 2500 m3/s were being recorded implied an enormous overflow towards the towns downstream as the watercourse crosses urban centers and is constrained by buildings or narrowing or sharp bends. This flow was one of the principal causes that generated the highest number of mortal victims in the episode with a total of 229 deaths [68,69].
This is because the professionals responsible for managing the emergency or taking decisions are not supported by technical experts from the basin authority who inform and interpret the flow values or specialists in the field, such as geographers, engineers, forest agents, among others. They are engaged in emergency management and have no hydraulic knowledge, being incapable of understanding the meaning of flow values. This can generate late warnings and, in the worst of cases, mortal victims. Having a knowledge of these factors would allow them to issue timely hydrological warnings, evacuations, and rescue actions.
They would also be able to visualize possible points of overflow or ruptures as the calculations of the simulations depend on physical elements and mathematical equations that take gravity into account, for example. The overflows always occur in favor of gravity and the slope; therefore, reinforcement or repair can be identified before possible flood events.
Finally, a precise knowledge of the hydraulic capacity of a river leads to improved communication and coordination between the different administrations, particularly the municipal authorities. Local governments are the first to respond to an emergency with the resources and means that they have available. When the emergency becomes a catastrophe, regional or national resources and means are required to address the consequences. Therefore, timely and up-to-date information on real flows and a knowledge of the maximum hydraulic capacity enables the population to be warned as early as possible of flooding in the higher and middle sections and that of the municipalities located in the lower sections of a river, knowing whether the section of the watercourse is able to support the increased flow or not and whether a flood will occur. This is fundamental for safeguarding human life and improving confidence in the institutions in emergency situations as they have the necessary scientific information to manage the emergency.
In light of the results obtained in this study, hydrological alert systems would need to be installed that integrate immediate modeling of river sections based on the circulating flow and the real capacity of evacuation of the river in question. In the area of study, it is necessary to offer this type of information in three sections: (1) city of Murcia-Orihuela, (2) Orihuela-Rojales, and (3) Rojales-mouth of the River Segura. The data provided in this study enable this type of precise modeling to be carried out and a hydrological alert for civil protection to be generated, if necessary.
Flooding events in the lower section of the Segura with discharges exceeding 400 m3/s will inevitably cause flooding of the Vega Baja, in light of the events recorded since 2000. This is why the reduction in flood hazard in this district should contemplate hydraulic works to increase the conveyance capacity either through a widening of the current channel or the design of a new evacuation channel (by-pass) from downstream of Beniel, through the Mayor de Hurchillo azarbe and back to converge with the River Segura. Alternatively, a central green corridor could be created, taking advantage of the Mayayo azarbe to collect the overflowed water and reduce the impact on other spaces.
These types of possible actions could mitigate the overtopping of the River Segura with instant flows above 200 m3/s, particularly in Orihuela, Almoradí, and Rojales. Complementary actions could include the recovery of the river space, using the former meanders as flood storage areas (FSA) to attenuate the flood waves and prevent overtopping in urban centers. Moreover, it is necessary to implement risk education programs so that the population knows how to act in crisis situations [70,71].
5. Conclusions
Within the current context of climate change in which there is a trend of increased convective precipitations in many regions around the world, such as the Mediterranean, floods are increasing in frequency and size, generating extraordinary events that are catastrophic in terms of loss of human life and material damage. It is necessary to establish methodologies to determine the hydraulic capacity or maximum allowable flows in certain sections, both in natural and artificial watercourses, enabling their limit to be determined before they overflow. This will give rise to a more efficient management of emergencies with the establishment of action protocols such as evacuation or the reinforcement of channel walls.
The results obtained using the HEC-RAS software through 2D hydraulic modeling in the field of study has enabled several fundamental conclusions to be drawn: (1) the theoretical capacity estimated by the public authorities is incorrect; (2) the thresholds at which overtopping occurs can be determined; (3) the points of overflow or ruptures where the river floods can be known; (4) the areas affected and flooded over time can be identified; and (5) the behavior of the overflowed waters on the flood plain can be determined.
The proposal contemplated can be extrapolated to other watercourses or channels (natural or artificial), as the maximum capacity by section can be known and, therefore, the management of the emergencies in the case of flooding can be improved. Finally, the proposed methodology paves the way for new fields of research and future publications related to the combination of flood prevention software.
Author Contributions
Conceptualization, A.O. and J.O.; methodology, A.O.; software, A.O.; validation, A.O. and J.O.; formal analysis, A.O. and J.O.; investigation, A.O. and J.O.; resources, A.O.; data curation, A.O.; writing—original draft preparation, A.O. and J.O.; writing—review and editing, A.O. and J.O.; visualization, A.O. and J.O.; supervision, A.O. and J.O. All authors have read and agreed to the published version of the manuscript.
Funding
This research received no external funding.
Data Availability Statement
The original contributions presented in this study are included in the article. Further inquiries can be directed to the corresponding author.
Acknowledgments
The authors would like to thank the Segura River Hydrographic Confederation for providing the maximum flow data recorded on the Segura River. We also thank Antonio J. López Espinazo for his assistance and supervision of the hydraulic models used to determine the hydraulic capacity of the Segura River channel from La Contraparada to Guardamar del Segura.
Conflicts of Interest
The authors declare no conflicts of interest.
References
- Vignesh, K.; Anandakumar, I.; Ranjan, R.; Borah, D. Evaluación de la vulnerabilidad a las inundaciones mediante un enfoque integrado de modelo de toma de decisiones multicriterio y técnicas geoespaciales. Model. Sist. Terr. Medio Ambiente 2021, 7, 767–781. [Google Scholar] [CrossRef]
- Sami, G.; Abdelwahhab, F.; Yahyaoui, H.; Abdelghani, F. Flood risk in the city of Chemora (Algeria). Analele Univ. Oradea Ser. Geográfica 2021, 31, 22–27. [Google Scholar] [CrossRef]
- González-Cao, J.; Barreiro-Fonta, H.; Fernández-Nóvoa, D.; García-Feal, O. Enhancing Flood Risk Management: A Review on Numerical Modelling of Past Flood Events. Hydrology 2025, 12, 133. [Google Scholar] [CrossRef]
- Intergovernmental Panel Climate Change. Special Report: Global Warming 1.5 °C (Full Report). Intergovernmental Panel on Climate Change, World Meteorological Organisation and United Nations Environment Programme (UNEP). 2018. Available online: https://www.ipcc.ch/reports/ (accessed on 13 September 2025).
- IPCC. AR6 Climate Change 2021–2022: The Physical Science Basis; Impacts, Adaptation and Vulnerability; Mitigation of Climate Change (Full Report). Intergovernmental Panel on Climate Change, World Meteorological Organisation and United Nations Environment Programme (UNEP). 2021–2022. Available online: https://www.ipcc.ch/reports/ (accessed on 13 September 2025).
- IPCC. AR4 Climate Change 2007: The Physical Science Basis; Impacts, Adaptation and Vulnerability; and Mitigation of Climate Change (Full Report). Intergovernmental Panel on Climate Change, World Meteorological Organisation and United Nations Environment Programme (UNEP). 2007. Available online: https://www.ipcc.ch/reports/ (accessed on 13 September 2025).
- Olcina Cantos, J. Evidencias e incertidumbres del cambio climático y de los riesgos asociados al litoral mediterráneo español. Boletín Real Soc. Geográfica 2019, 154, 9–34. [Google Scholar]
- EM-DAT. EM-DAT The International Disaster Data Base Center for Research on the Epidemology of Disasters. Available online: https://www.emdat.be/ (accessed on 13 September 2025).
- Ministerio para la Transición Ecológica y Reto Demográfico (MITERD). Inundaciones y Cambio Climático; Ministerio para la Transición Ecológica y Reto Demográfico: Madrid, Spain, 2018; 106p. Available online: https://www.miteco.gob.es/content/dam/miteco/es/agua/temas/gestion-de-los-riesgos-de-inundacion/libro-cambio-climatico-inundaciones-web-06092019_tcm30-499367.pdf (accessed on 13 September 2025).
- MITERD. Impactos y Riesgos Derivados del Cambio Climático en España; Ministerio para la Transición Ecológica y Reto Demográfico: Madrid, Spain, 2021; 212p. Available online: https://adaptecca.es/sites/default/files/documentos/impactosyriesgosccespanawebfinal_tcm30-518210_0.pdf (accessed on 13 September 2025).
- Ministerio del Interior. Anuario Estadístico del Ministerio del Interior; Ministerio del Interior, Secretaria General Técnica: Bilbao, Spain, 2022; 708p. Available online: https://www.interior.gob.es/opencms/es/archivos-y-documentacion/documentacion-y-publicaciones/anuarios-y-estadisticas/ (accessed on 13 September 2025).
- Olcina Cantos, J.; Saurí Pujol, D.; Hernández-Hernández, M.; Ribas Palom, A. Flood policy in Spain: A review for the period 1983–2013. Disaster Prev. Manag. Int. J. 2016, 25, 41–58. [Google Scholar] [CrossRef]
- Pérez-Morales, A.; Gil-Guirado, S.; Quesada García, A. ¿Somos todos iguales ante una inundación? Análisis de la vulnerabilidad social en el litoral mediterráneo español. Boletín Asoc. Geogr. Española 2021, 88, 1–39. [Google Scholar] [CrossRef]
- Olcina Cantos, J.; Oliva Cañizares, A. Medidas estructurales vs cartografía de inundación en la valoración del riesgo en áreas urbanas: El caso del barranco de las Ovejas (Alicante, España). Cuad. Geográficos 2020, 59, 199–220. [Google Scholar] [CrossRef]
- Pérez-Morales, A. Actuaciones de carácter estructural para la mitigación y prevención de los efectos de las riadas e inundaciones en los municipios del sur de la región de Murcia. Boletín Asoc. Geogr. Española 2010, 53, 267–285. [Google Scholar]
- Wang, X.; Xie, H. A Review on Applications of Remote Sensing and Geographic Information Systems (GIS) in Water Resources and Flood Risk Management. Water 2018, 10, 608. [Google Scholar] [CrossRef]
- Leeonis, A.N.; Ahmed, M.F.; Mokhtar, M.B.; Halder, B.; Lim, C.K.; Majid, N.A.; Scholz, M. Importance of Geographic Information System (GIS) Application to Reduce the Impact of Flood Disasters in Malaysia: A Meta-Analysis. Water 2025, 17, 181. [Google Scholar] [CrossRef]
- El-Bagoury, H.; Gad, A. Integrated Hydrological Modeling for Watershed Analysis, Flood Prediction, and Mitigation Using Meteorological and Morphometric Data, SCS-CN, HEC-HMS/RAS, and QGIS. Water 2024, 16, 356. [Google Scholar] [CrossRef]
- Ferreira, R.G.; Dias, R.L.S.; de Siqueira Castro, J.; dos Santos, V.J.; Calijuri, M.L.; da Silva, D.D. Performance of hydrological models in fluvial flow simulation. Ecol. Inform. 2021, 66, 101453. [Google Scholar] [CrossRef]
- Sidek, L.M.; Jaafar, A.S.; Majid, W.H.A.W.A.; Basri, H.; Marufuzzaman, M.; Fared, M.M.; Moon, W.C. High-Resolution Hydrological-Hydraulic Modeling of Urban Floods Using InfoWorks ICM. Sustainability 2021, 13, 10259. [Google Scholar] [CrossRef]
- Iroume, J.Y.-A.; Onguéné, R.; Djanna Koffi, F.; Colmet-Daage, A.; Stieglitz, T.; Essoh Sone, O.; Bogning, S.; Olinga Olinga, J.M.; Ntchantcho, R.; Ntonga, J.-C. The flood of 21 August 2020 in Duala (Cameroon): A major urban flood investigated using 2D HEC-RAS modelling. Water 2022, 14, 1768. [Google Scholar] [CrossRef]
- Djafri, S.A.; Cherhabil, S.; Hafnaoui, M.A.; Madi, M. Flood modeling using HEC-RAS 2D and IBER 2D: A compartive study. Water Supply 2024, 24, 3061–3076. [Google Scholar] [CrossRef]
- Pérez-Montiel, J.I.; Cárdenas-Mercado, L.; Montero, A.G. Modelación de Inundaciones en una Zona Urbana: Caso de Estudio Riohacha, Ciudad Costera al Norte de Colombia Comparando los Modelos MODCEL e IBER; una Localidad Costera del Norte de Colombia: Comparación Entre MODCEL e IBER; Universidad de la Guajira: Riohacha, Colombia, 2022; Available online: https://repositoryinst.uniguajira.edu.co/handle/uniguajira/1541 (accessed on 13 September 2025).
- Brunner, G.W. HEC-RAS River Analysis System: Hydraulic Reference Manual. U.S. Army Corps of Engineers. Available online: https://www.hec.usace.army.mil/software/hec-ras/documentation/HEC-RAS%205.0%20Reference%20Manual.pdf (accessed on 13 September 2025).
- Najwa Zainal, N.; Abu Talib, S.H. Review paper on applications of the HEC-RAS model for flooding, agricultura, and water quality simulation. Water Pract. Technol. 2024, 19, 2883–2900. [Google Scholar] [CrossRef]
- Danish Hydraulic Institute. MIKE FLOOD User Manual. 2017. Available online: https://es.scribd.com/document/333681449/Mike-Flood-Usermanual (accessed on 13 September 2025).
- Innovyze. InfoWorks ICM Technical Review. 2017. Available online: https://boards.autodesk.com/icm (accessed on 13 September 2025).
- Bladé, E.; Cea, L.; Corestein, G.; Escolano, E.; Puertas, J.; Vázquez-Cendón, E.; Dolz, J.; Coll, A. Iber: Herramienta de simulación numérica del flujo en lámina libre en dos dimensiones. Rev. Iberoam. Agua 2014, 1, 41–49. [Google Scholar] [CrossRef]
- Cea, L.; Bladé, E. A simple and efficient unstructured finite volume scheme for solving the shallow water equations in overland flow applications. Water Resour. Res. 2015, 51, 5464–5486. [Google Scholar] [CrossRef]
- Lorenzo-Lacruz, J.; Amengual, A.; Garcia, C.; Morán-Tejeda, E.; Homar, V.; Maimó-Far, A.; Hermoso, A.; Ramis, C.; Romero, R. Hydro-meteorological reconstruction and geomorphological impact assessment of the October 2018 catastrophic flash flood at Sant Llorenç, Mallorca (Spain). Nat. Hazards Earth Syst. Sci. 2019, 19, 2597–2617. [Google Scholar] [CrossRef]
- Quiroga, V.M.; Kure, S.; Udo, K.; Mano, A. Application of 2D numerical simulation for the analysis of the February 2014 Bolivian Amazonia flood: Application of the new HEC-RAS version 5. Rev. Iberoam. Agua 2016, 3, 25–33. [Google Scholar] [CrossRef]
- Cerri, M. Flood Simulation Using HEC-RAS Model Calibrated with Remotely Sensed Water Mask: A Case Study of Mulde River, Germany. Ph.D. Thesis, Technical University of Munich, Munich, Germany, 2017. [Google Scholar]
- Huţanu, E.; Mihu-Pintilie, A.; Urzica, A.; Paveluc, L.E.; Stoleriu, C.C.; Grozavu, A. Using 1D HEC-RAS Modeling and LiDAR Data to Improve Flood Hazard Maps Accuracy: A Case Study from Jijia Floodplain (NE Romania). Water 2020, 12, 1624. [Google Scholar] [CrossRef]
- Ruiz-Villanueva, V.; Bodoque, J.M.; Díez-Herrero, A.; Eguibar, M.A.; Pardo-Igúzquiza, E. Reconstruction of a flash flood with large wood transport and its influence on hazard patterns in an ungauged mountain basin. Hydrolical Process. 2013, 27, 3424–3437. [Google Scholar] [CrossRef]
- Papaioannou, G.; Loukas, A.; Vasiliades, L.; Aronica, G.T. Flood inundation mapping sensitivity to riverine spatial resolution and modelling approach. Nat. Hazards 2016, 83, 117–132. [Google Scholar] [CrossRef]
- Knebl, M.R.; Yang, Z.-L.; Hutchison, K.; Maidment, D.R. Regional scale flood modeling using NEXRAD rainfall, GIS, and HEC-HMS/RAS: A case study for the San Antonio River Basin Summer 2002 storm event. J. Environ. Manag. 2005, 75, 325–336. [Google Scholar] [CrossRef]
- Khattak, M.S.; Anwar, F.; Saeed, T.U.; Sharif, M.; Sheraz, K.; Ahmed, A. Floodplain Mapping Using HEC-RAS and ArcGIS: A Case Study of Kabul River, Arab. J. Sci. Eng. 2016, 41, 1375–1390. [Google Scholar] [CrossRef]
- Rangari, V.; Umamahesh, N.; Bhatt, C.M. Assessment of inundation risk in urban floods using HEC RAS 2D. Model. Earth Syst. Environ. 2019, 5, 1839–1851. [Google Scholar] [CrossRef]
- HEC-RAS. HEC-RAS River Analysis System: Hydraulic Reference Manual. U.S. Army Corps of Engineers. Available online: https://www.hec.usace.army.mil/software/hec-ras/documentation.aspx (accessed on 13 September 2025).
- Zeiger, S.J.; Hubbart, S.I. Measuring and modeling event-based environmental flows: An assessment of HEC-RAS 2D rain-on-grid simulations. J. Environ. Manag. 2021, 285, 112125. [Google Scholar] [CrossRef]
- Varlas, G.; Papaioannou, G.; Papadopoulos, A.; Markogianni, V.; Vardakas, L.; Dimitriou, E. Flash Flood Forecasting Using Integrated Meteorological–Hydrological–Hydraulic Modeling: Application in a Mediterranean River. Environ. Sci. Proc. 2023, 26, 35. [Google Scholar] [CrossRef]
- Milišić, H.; Hadžić, E.; Šuvalija, S.; Jahić, E. Floodplain mapping using HEC-RAS and Lidar data: A case study of the Bistrica River (Vrbas River Basin in B&H). In New Technologies, Development and Application IV; Lecture Notes in Networdks and Systems, 233; Springer: Cham, Switzerland, 2021. [Google Scholar] [CrossRef]
- Yazdan, M.M.S.; Ahad, M.T.; Kumar, R.; Mehedi, M.A.A. Estimating Flooding at River Spree Floodplain Using HEC-RAS Simulation. J 2022, 5, 410–426. [Google Scholar] [CrossRef]
- Yustiana, F.; Ridwanullah, M.H.; Kurniadi, Y.N.; Wardhani, E.; Widyaningsih, E. HEC-RAS model for drainage capacity analysis and peak discharge simulation of Cimande River. Geomate J. 2024, 27, 30–37. Available online: https://geomatejournal.com/geomate/article/view/4594 (accessed on 13 September 2025). [CrossRef]
- Anggista, D.; Alifia Zahra, F.; Mariani, N.; Winasis, A. Capacity analysis of downstream Cijangkelok River using HEC-RAS Software. Indones. J. Adv. Res. 2025, 4, 1543–1558. [Google Scholar] [CrossRef]
- Confederación Hidrográfica del Segura (CHS). Cronología de Riadas en la Cuenca del Segura. 2025. Available online: https://www.chsegura.es/es/confederacion/unpocodehistoria/cronologia-de-riadas-en-la-cuenca-del-Segura/ (accessed on 13 September 2025).
- Olcina Cantos, J. Inundaciones de septiembre de 2019 en la Vega Baja del Segura. La oportunidad del Plan Vega Renhace. Geographicalia 2021, 73, 243–271. [Google Scholar] [CrossRef]
- CHS. Jornada Técnica Sobre la DANA de Septiembre de 2019. Available online: https://www.chsegura.es/es/confederacion/unpocodehistoria/jornada-tecnica-sobre-la-dana-de-septiembre-de-2019/ (accessed on 13 September 2025).
- Oliva Cañizares, A.; Olcina Cantos, J. Floods and Emergency Management: Elaboration of Integral Flood Maps Based on Emergency Calls (112)—Episode of September 2019 (Vega Baja del Segura, Alicante, Spain). Water 2023, 15, 2. [Google Scholar] [CrossRef]
- Olcina Cantos, J. Incremento de episodios de inundación por lluvias de intensidad horaria en el sector central del litoral mediterráneo español: Análisis de tendencias en Alicante. Sémata Cienc. Sociais Humanidades 2017, 29, 143–163. [Google Scholar] [CrossRef]
- Castro-Melgar, I.; Falaras, T.; Basiou, E.; Parcharidis, I. Assessment of the October 2024 Cut-Off Low Event Floods Impact in Valencia (Spain) with Satellite and Geospatial Data. Remote Sens. 2025, 17, 2145. [Google Scholar] [CrossRef]
- García, E. Después de la Barrancà, la gran inundación en València, España: Algunas tareas de la sociología. Rev. Española Sociol. 2025, 34, a256. [Google Scholar] [CrossRef]
- CHS. Plan de Defensa Contra Avenidas en la Cuenca del Segura. 1987. Available online: https://www.chsegura.es/es/confederacion/unpocodehistoria/el-Plan-de-Defensa-de-1987/ (accessed on 13 September 2025).
- Gil Olcina, A.; Canales Martínez, G. Concausas y Tipos de Inundaciones en la Vega Baja del Segura; Universidad de Alicante: San Vicente del Raspeig, Spain, 2022; 472p. [Google Scholar]
- Ministerio de Medio Ambiente y Medio Rural y Marino. Guía Metodológica para el Desarrollo del Sistema Nacional de Cartografía de Zonas Inundables (SNCZI). Available online: https://www.miteco.gob.es/es/agua/temas/gestion-de-los-riesgos-de-inundacion/snczi/guia-metodologica-determinacion-zonas-inundables.html (accessed on 13 September 2025).
- Ministerio de Fomento. Serie Normativas. Norma 5.2-IC de la Instrucción de Carreteras. Drenaje Superficial. Available online: https://www.transportes.gob.es/carreteras/normativa-tecnica/drenaje/normativa-tecnica (accessed on 31 October 2025).
- Generalitat Valenciana. Encauzamiento del Río Segura y Nuevo Puente Reina Sofía en Rojales. Available online: https://biblioesp.gva.es/publicos/tcop/documentos/mig/folletos/OP/1993/1993OP20.pdf (accessed on 13 September 2025).
- Agencia Estatal de Meteorología (AEMET). Proyecciones Climáticas para el Siglo XXI. Available online: https://www.aemet.es/es/serviciosclimaticos/cambio_climat (accessed on 13 September 2025).
- Bohorquez, P.; Del Moral-Erencia, J.D. 100 Years of Competition between Reduction in Channel Capacity and Streamflow during Floods in the Guadalquivir River (Southern Spain). Remote Sens. 2017, 9, 727. [Google Scholar] [CrossRef]
- Ahrendt, S.; Horner-Devine, A.R.; Collins, B.D.; Morgan, J.A.; Istanbulluoglu, E. Channel conveyance variability can influence flood risk as much as changes in flow. Water Resour. Res. 2022, 58, e2021WR031890. [Google Scholar] [CrossRef]
- Sofia, G.; Nikolopoulos, E.I. Floods and rivers: A circular causality perspective. Sci. Rep. 2020, 10, 5175. [Google Scholar] [CrossRef]
- Zeng, F.; Jin, S.; Ye, L.; Gu, X.; Guo, J. Analysis of flood conveyance capacity of small- and medium-sized river and flood managements. Nat. Hazards 2022, 116, 447–467. [Google Scholar] [CrossRef]
- Slater, L.J.; Singer, M.B.; Kirchner, J.W. Hydrologic versus geomorphic drivers of trends in flood hazard. Geophys. Res. Lett. 2015, 42, 370–376. [Google Scholar] [CrossRef]
- Klijn, F.; Asselman, N.; Wagenaar, D. Room for Rivers: Risk Reduction by Enhancing the Flood Conveyance Capacity of The Netherlands’ Large Rivers. Geosciences 2018, 8, 224. [Google Scholar] [CrossRef]
- Fraga, I.; Cea, L.; Puertas, J. MERLIN: A flood hazard forecasting system for coastal river reaches. Nat. Hazards 2020, 100, 1171–1193. [Google Scholar] [CrossRef]
- Smith, P.; Beven, K.; Horsburgh, K. Data-based mechanistic modelling of tidally affected river reaches for flood warning purposes: An example on the River Dee, UK. Q. J. R. Meteorol. Soc. 2013, 139, 340–349. [Google Scholar] [CrossRef]
- Cranston, M.D. Flood Forecasting and Warning—A Retrospesctive. Available online: https://floodresilienceblog.wordpress.com/2018/11/09/flood-forecasting-and-warning-a-retrospective/ (accessed on 13 September 2025).
- MITERD. Plan para la Recuperación y Mejora de la Resiliencia Frente a las Inundaciones en el Territorio Afectado por la DANA en la Comunidad Valenciana. 2025. Available online: https://www.miteco.gob.es/content/dam/miteco/es/agua/participacion-publica/inundaciones/Propuesta%20plan%20resiliencia%20DANA%20CV%20consulta%20pública.pdf (accessed on 13 September 2025).
- GVA. Plan de Recuperación Económica y Social de la Comunitat Valenciana (Plan Endavant). 2025. Available online: https://planendavant.gva.es/documents/393406936/393408958/20250729_Plan+Endavant_vCastellano.pdf/6f324454-4001-1ebe-b983-ab16d9fe023b?t=1753875615359 (accessed on 13 September 2025).
- Morote-Seguido, A.F.; Olcina Cantos, J. La enseñanza de los riesgos naturales. Un análisis desde la Didáctica de la Geografía española (1980–2022). Estud. Geográficos 2024, 85, 297. [Google Scholar] [CrossRef]
- Zaragoza Sáez, Á.; Morote Seguido, A.F.; Hernández Hernández, M. ¿Cómo actuar ante una inundación? Percepción y experiencias del alumnado sobre la educación preventiva. Papeles Geogr. 2025, 70, 154–169. [Google Scholar] [CrossRef]
Disclaimer/Publisher’s Note: The statements, opinions and data contained in all publications are solely those of the individual author(s) and contributor(s) and not of MDPI and/or the editor(s). MDPI and/or the editor(s) disclaim responsibility for any injury to people or property resulting from any ideas, methods, instructions or products referred to in the content. |
© 2025 by the authors. Licensee MDPI, Basel, Switzerland. This article is an open access article distributed under the terms and conditions of the Creative Commons Attribution (CC BY) license (https://creativecommons.org/licenses/by/4.0/).