Article

Geohazard Assessment of Historic Chalk Cavity Collapses in Aleppo, Syria

1
LUSAS, Forge House, 66 High Street, Kingston upon Thames KT1 1HN, UK
2
College of Science and Engineering, University of Derby, Markeaton Street, Derby DE22 3AW, UK
3
Indian Institute of Technology Bombay, Powai, Mumbai 400076, Maharashtra, India
*
Author to whom correspondence should be addressed.
GeoHazards 2025, 6(4), 75; https://doi.org/10.3390/geohazards6040075
Submission received: 31 August 2025 / Revised: 15 October 2025 / Accepted: 23 October 2025 / Published: 1 November 2025

Abstract

Over the past five decades, the Tallet Alsauda district of Aleppo (Syria) has experienced multiple catastrophic collapses, attributed to a network of subsurface chalk cavities formed through historic quarrying and possible natural karstification. Yet, no comprehensive investigation has previously been conducted to characterise the cavities or clarify the governing failure mechanisms. Such assessments are particularly difficult in historic urban environments, where void geometries are irregular, subsurface data scarce, and underground access limited. This study addresses these challenges through an integrated programme of fourteen boreholes, laboratory testing, and inverse-distance interpolation to reconstruct subsurface geometry and overburden thickness. These data-informed three-dimensional finite element simulations are designed to test the hypothesis that chalk deterioration, driven by both natural and anthropogenic processes, controls the instability of cavity roofs. Rock mass parameters, particularly the Geological Strength Index (GSI), were progressively reduced and evaluated against the site’s documented collapse history. The simulations revealed that a modest decline in GSI from ~53 to 47 precipitated abrupt displacements (>300 mm) and upward-propagating plastic zones, consistent with field evidence of past collapses. These results confirm that instability is governed by threshold reductions in material strength, with sewer leakage identified as a principal trigger accelerating chalk softening and roof destabilisation.

1. Introduction

Urban areas constructed over soluble rocks or abandoned man-made cavities face a persistent threat from sudden ground collapse, most commonly in the form of sinkholes [1,2]. These occur when overburden material loses support and rapidly subsides into an underlying void, producing deformation that ranges from shallow sags to catastrophic vertical-sided pits [3]. In cities, where population density and infrastructure concentration amplify the consequences, such events can result in loss of life, severe damage to property and services, economic disruption, and long-term restrictions on land use [4,5].
In chalk terrains, sinkhole formation typically results from long-term degradation combined with short-term triggering events. Chalk’s high porosity, low tensile strength, and sensitivity to moisture fluctuations make it prone to progressive weakening through dissolution and softening, particularly under variable groundwater conditions or sewer leakage [6,7]. In abandoned man-made cavities, such as those left by room-and-pillar mining, gradual deterioration of roofs and pillars can reduce load-bearing capacity until a progressive roof collapse migrates upwards [8]. Intense rainfall, broken water mains, construction vibrations, or heavy surface loads can then precipitate failure in cavities already near their stability limit [9,10]. The resulting upward collapse may produce tensile cracks, sagging troughs, or steep-walled cover-collapse sinkholes [11].
Documented events from different regions highlight the severity of this hazard. In Clamart, France, the collapse of an abandoned chalk mine in 1961 caused multiple fatalities and extensive property loss [12]. In Malogne, Belgium, stability assessments of shallow chalk mines have shown that even minor degradation in rock mass quality can sharply increase collapse susceptibility [13]. In rapidly urbanising karst regions, such as parts of China and the Middle East, sinkhole clusters have been linked to changes in groundwater levels driven by human activity [14,15]. The financial costs of remediation and the risk of sudden collapse often deter redevelopment in sinkhole-prone districts, leaving derelict land and economic stagnation [8].
Detection and assessment of hidden cavities are, therefore, critical steps in managing sinkhole hazard. Established investigation tools include exploratory boreholes, downhole imaging, microgravity, electrical resistivity tomography, and ground-penetrating radar [16,17,18]. Borehole and geophysical data can be interpolated to produce 2D and 3D subsurface models that map cavity networks [19]. In more advanced approaches, these geological models inform numerical simulations [20], typically finite-element or discrete-element methods, of cavity stability under varying material properties, loading, and water-infiltration scenarios [21,22]. Recent studies [23,24,25,26] have also applied machine learning to identify and map areas susceptible to sinkholes, although these methods remain limited by data quality and availability and often require site-specific validation.
Although finite element stability analyses of underground cavities are widely used in geotechnical engineering, they typically involve idealised cavity geometries and material parameters derived from laboratory testing or empirical charts [27,28,29]. There is comparatively little published work that integrates borehole-derived mapping of irregular voids, geostatistical interpolation of cavity geometry, and analysis calibrated against observed collapse events. This gap is especially significant in historic urban environments, where underground access is restricted, subsurface data are sparse, and the preservation of centuries-old urban fabric complicates large-scale interventions.
The Tallet Alsauda district of Aleppo, Syria, exemplifies this challenge. A combination of historic chalk quarrying and possible natural karst processes has created a complex network of subsurface cavities beneath one of the world’s oldest continuously inhabited cities. Decades of unregulated construction, coupled with ageing and damaged drainage infrastructure, have heightened the risk of collapse. Multiple sinkhole incidents in recent years have caused severe structural damage and resident displacement, yet no integrated hazard assessment has been undertaken. The lack of systematic investigation, despite repeated incidents, represents a critical knowledge gap.
This study addresses that gap through an integrated programme of field investigations, laboratory testing, geostatistical modelling, and finite-element analysis at the Tallet Alsauda site. It tests the hypothesis that progressive chalk deterioration—accelerated by water ingress and anthropogenic activity—controls cavity roof instability. Specifically, the objectives are to: (i) reconstruct the geometry, dimensions, and overburden conditions of subsurface chalk cavities; (ii) analyse the mechanisms and triggers that have led to recent collapse events; and (iii) assess the implications of these processes for hazard mapping, risk mitigation, and future urban planning.
The contribution of this work lies in demonstrating how these methods can be combined to generate a realistic subsurface stability model in a historic urban environment where direct underground investigation is limited. The resulting framework provides both a means of understanding past failures and a practical basis for assessing and monitoring cavity-related hazards in Aleppo and other heritage cities facing similar constraints.
The paper is structured as follows: after this introduction, Section 2 describes the study area and background. Section 3 presents the materials and methods, including site description, geotechnical investigation, geological modelling, geotechnical parameters, material models, and the numerical modelling and validation procedure. Section 4 reports the results. Section 5 discusses the findings. Section 6 provides the conclusions.

2. Study Area and Background

2.1. Location and Historical Context

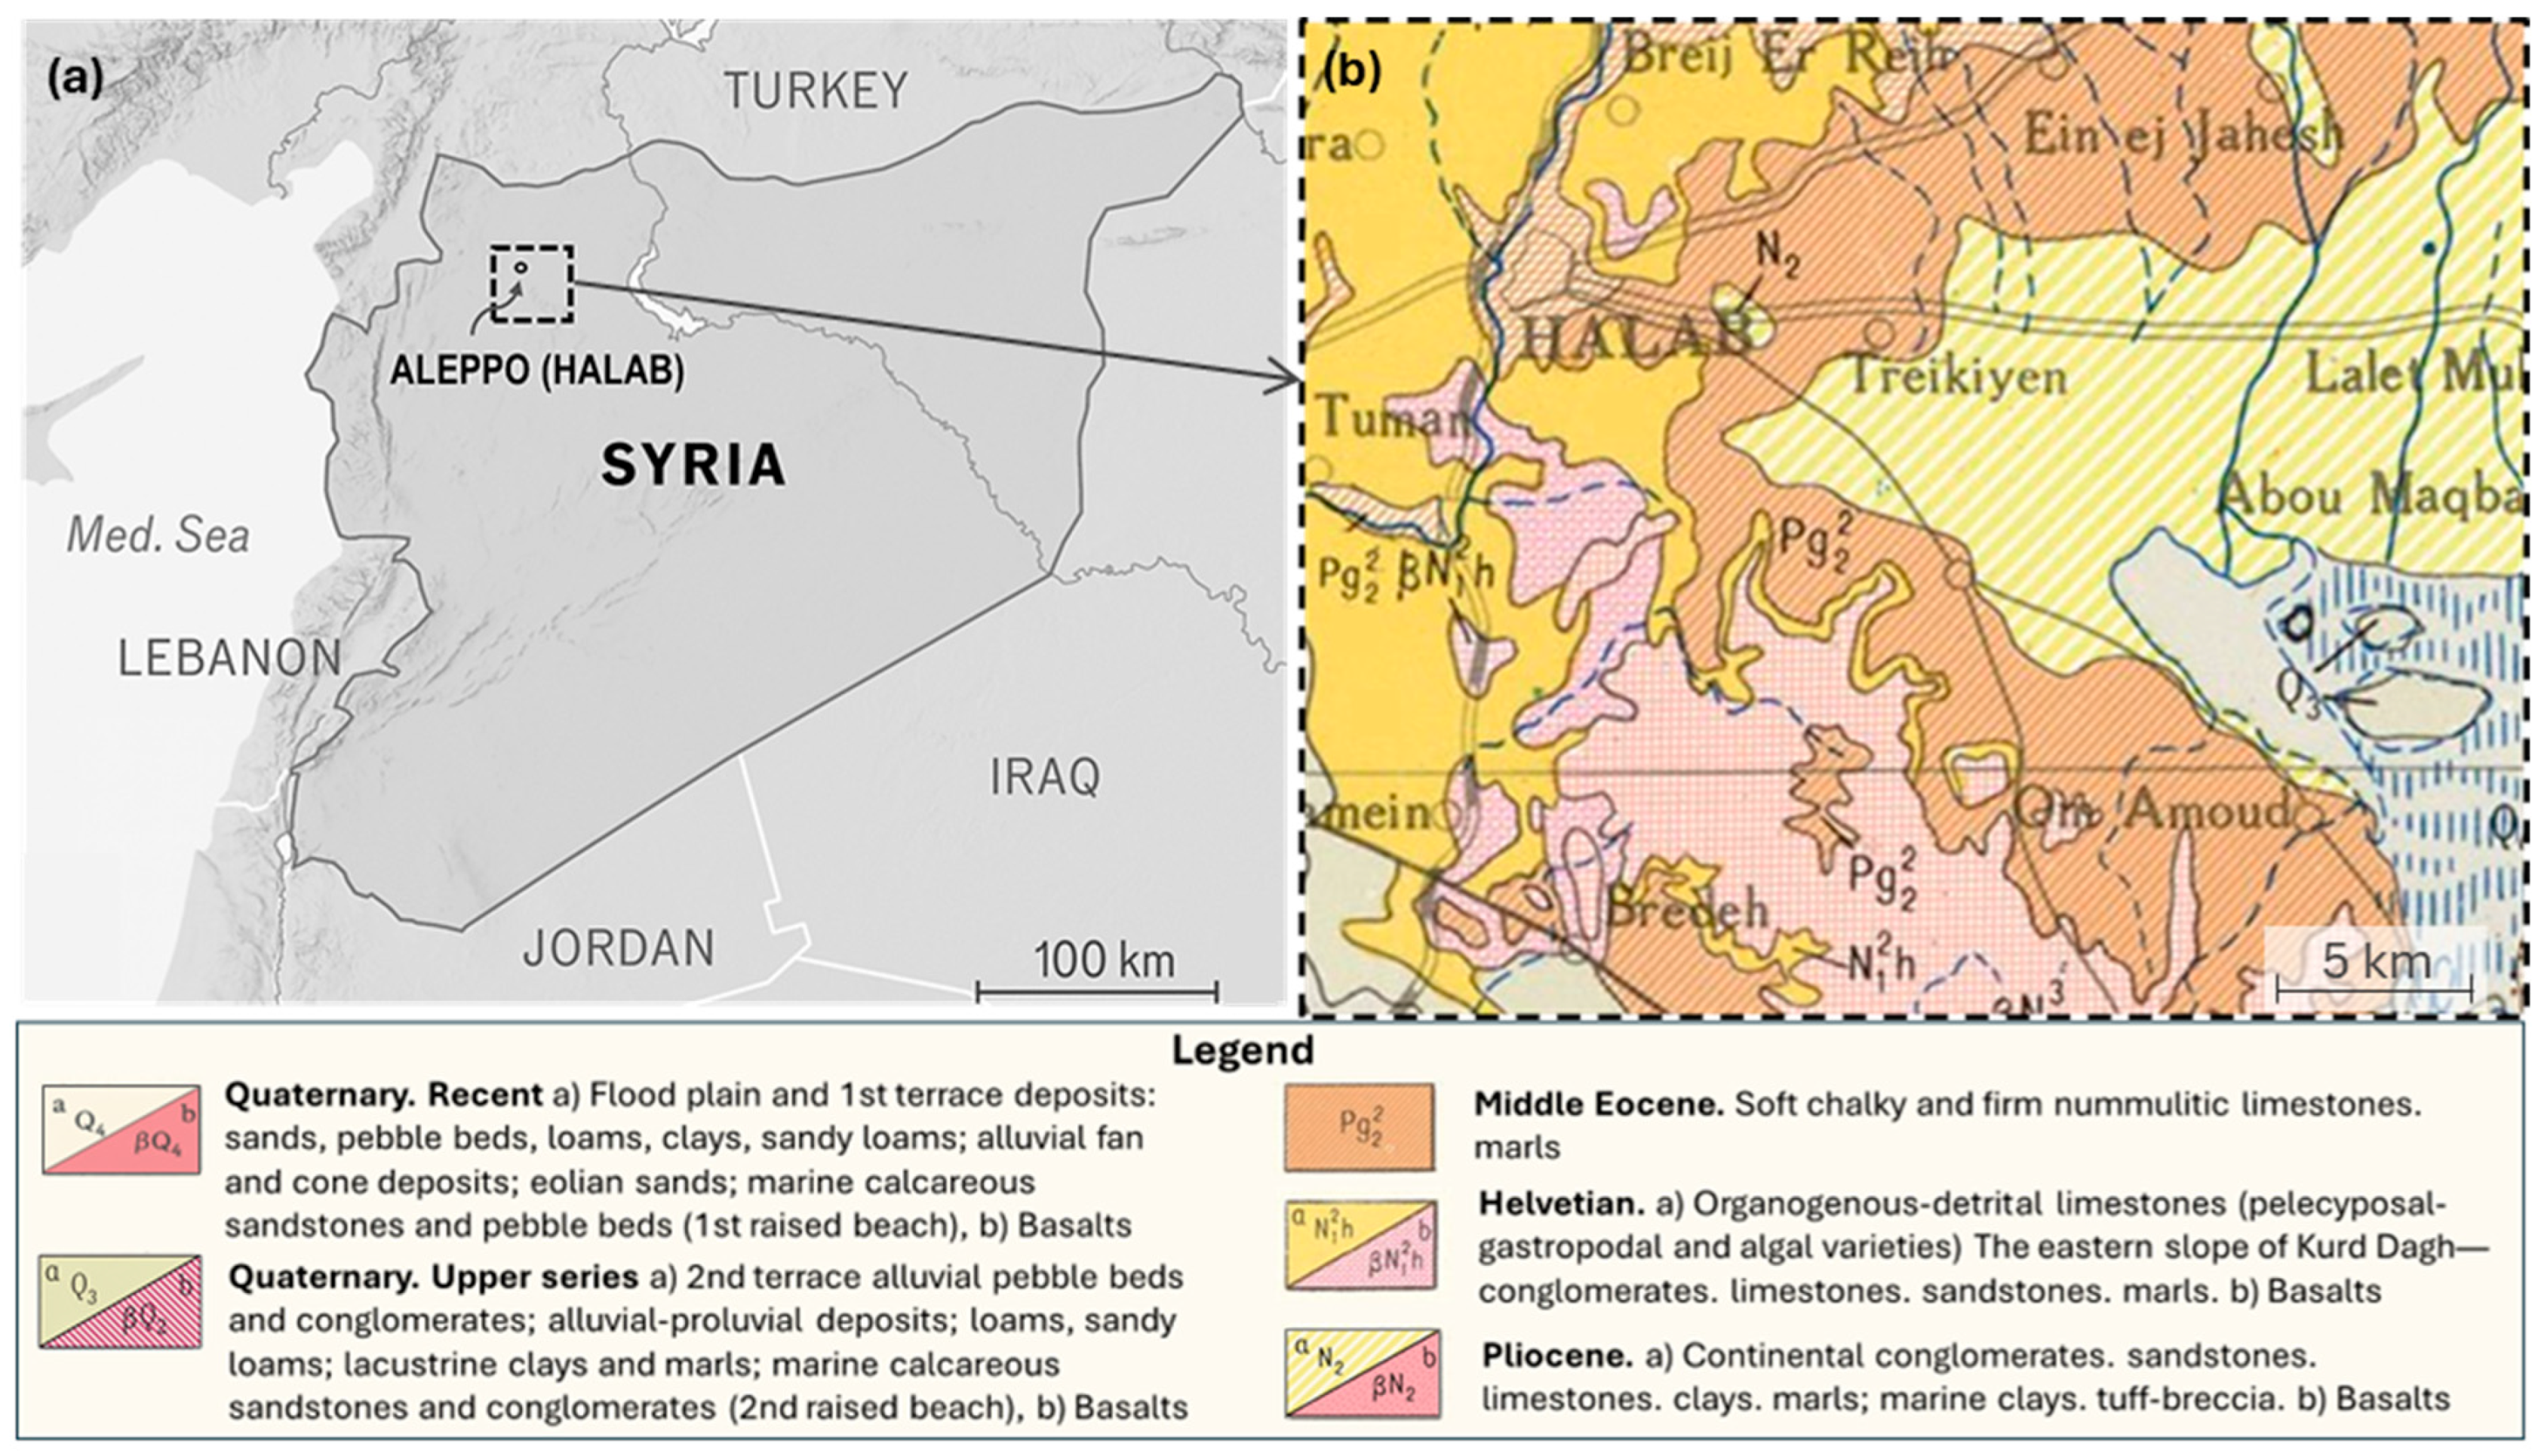
Aleppo, the largest city in northern Syria (see Figure 1a), is one of the world’s oldest continuously inhabited centres and is designated a UNESCO World Heritage Site [30]. The city has a long history of using locally quarried chalky limestone for construction. Much of this stone was extracted from shallow underground workings, some of which extended directly beneath or adjacent to present-day urban areas [31]. The Tallet Alsauda district, located immediately south of the historic city wall, is one such area, known locally for its subsurface cavities. Oral accounts and field inspections, including measurements obtained during the 2008 site visit [32], suggest a network of voids extending more than 50 m, with roof spans up to 10 m and heights exceeding 4 m, likely representing a combination of ancient quarry workings and natural karst features.
Over the past five decades, Tallet Alsauda and nearby districts such as Haydaria and Kalasa have experienced several collapses (see Figure 2). In Tallet Alsauda, a major event in 2019 caused subsidence over roughly 200 m2, with vertical displacement of up to 5 m, severely damaging or destroying multiple structures. In Haydaria, severe structural cracking has occurred in residential buildings, while in Kalasa, widespread instability has forced the demolition of approximately 20 residential buildings [34]. These events emphasise the vulnerability of Aleppo’s built environment to subsurface collapse and highlight the lack of systematic geohazard mitigation.

2.2. Regional Geological Setting, Urban Development, and Hazard Context

The Aleppo Basin is geologically characterised by Upper Cretaceous and Tertiary sedimentary formations, primarily composed of dolomitised limestone, chalk, marl, and basalt (see the geological map of the region in Figure 1b). According to existing information [35,36], the southern and western parts of the Aleppo Plateau are dominated by Campanian and Maastrichtian deposits with an average thickness of approximately 300 m.
The Campanian and Maastrichtian units consist of chalky to clayey limestones, locally dolomitised, with interbedded flint and marl [35]. The Campanian chalk in particular is soft, porous, and fractured, making it prone to dissolution and mechanical degradation [6,7]. The Helvetian limestones in the eastern region are aphanitic in structure and exhibit karstic features. These rocks are interbedded with conglomerates and marls and overlain by Miocene basalts. These basaltic layers and alluvial deposits are found in the highlands and urban settings, sometimes in contact with chalk units, adding complexity to the subsurface profile.
Historical borehole data from Tallet Alsauda [37] reveal a sequence of made ground (construction debris and fill) overlying silty clay, with chalk encountered at depths from the surface to more than 10 m [32]. The chalk encountered corresponds to the Campanian–Maastrichtian boundary unit of the Upper Cretaceous sequence dominating the southern Aleppo Plateau. The chalk roofs above cavities are often thin and fractured, making them highly susceptible to failure under load or when weakened by water ingress [7].
Urban development has intensified these risks. Many buildings in Tallet Alsauda are constructed without engineered foundations, and some rest directly over known or suspected voids [32]. Deficient drainage and ageing sewer infrastructure contribute further: water leakage and infiltration from heavy rainfall can accelerate chalk dissolution, reduce shear strength, and trigger roof collapse [5,10]. Similar combinations of weak chalk, anthropogenic loading, and water ingress have been documented in other urban settings, such as the Clamart collapse in France [12] and the Malogne mine instability in Belgium [13].
Despite repeated incidents and local awareness of cavity presence, no integrated geotechnical and numerical assessment has been carried out for Tallet Alsauda. This represents a critical knowledge gap, as studies in comparable environments have shown that detailed geological modelling and stability analysis are essential for accurate hazard mapping and effective mitigation [15,18,21]. The present study therefore seeks to fill this gap by applying a comprehensive investigative and modelling framework tailored to the constraints of Aleppo’s historic urban setting.

3. Materials and Methods

The methodological framework was designed in line with established protocols for sinkhole risk assessment in karstic and post-mining terrains [4,18] but adapted to the constraints of sparse borehole data and limited subsurface access at the Tallet Alsauda site.

3.1. Site Description: Tallet Alsauda, Aleppo

Tallet Alsauda is a historically significant area located in the southern part of the ancient city of Aleppo, Syria. The site spans approximately 150,000 m2 and has been identified as particularly susceptible to sinkhole activity. It has experienced multiple subsidence events, the most recent in 2019, which caused severe damage to buildings and infrastructure over an area of approximately 200 m2 and a subsidence depth of nearly 5 m.
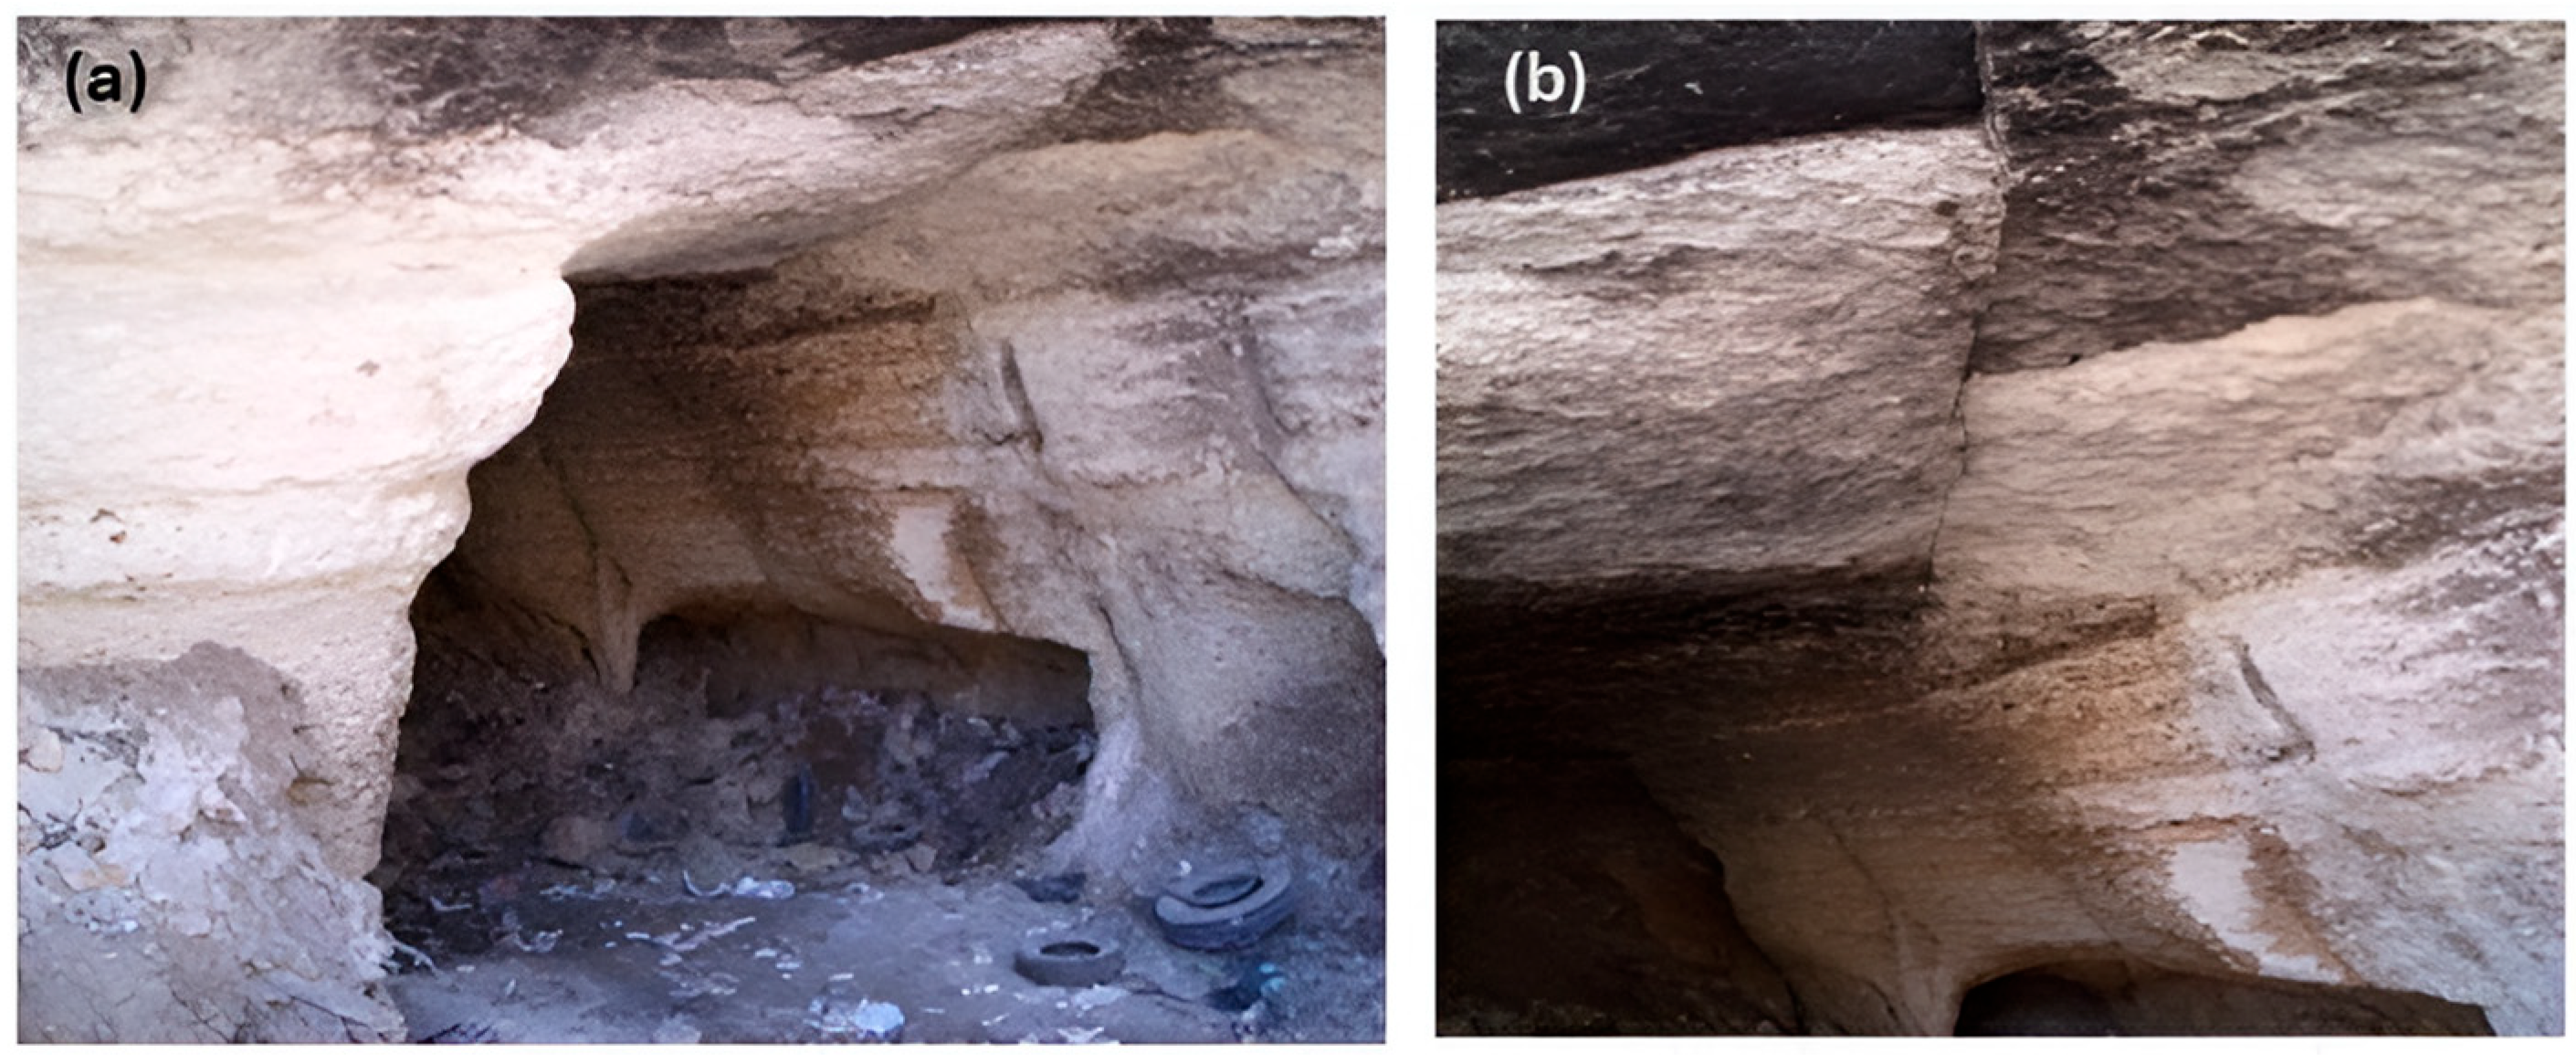
In recent years, despite the recognised hazard, the site was repurposed as a public park. During a site walk-through in 2008, a visible cavity with an accessible height of over 4 m and approximately 5 m in width was observed. This cavity, now sealed with a concrete barrier, exhibited clear signs of roof instability and intersecting cracks, indicating structural degradation (Figure 3).

3.2. Geotechnical Investigation

The site investigation was structured to obtain baseline data regarding the lithostratigraphy and potential voids beneath the Tallet Alsauda district. A grid-based borehole campaign was designed to enable spatially representative sampling of the subsurface and to support construction of a three-dimensional geological model.
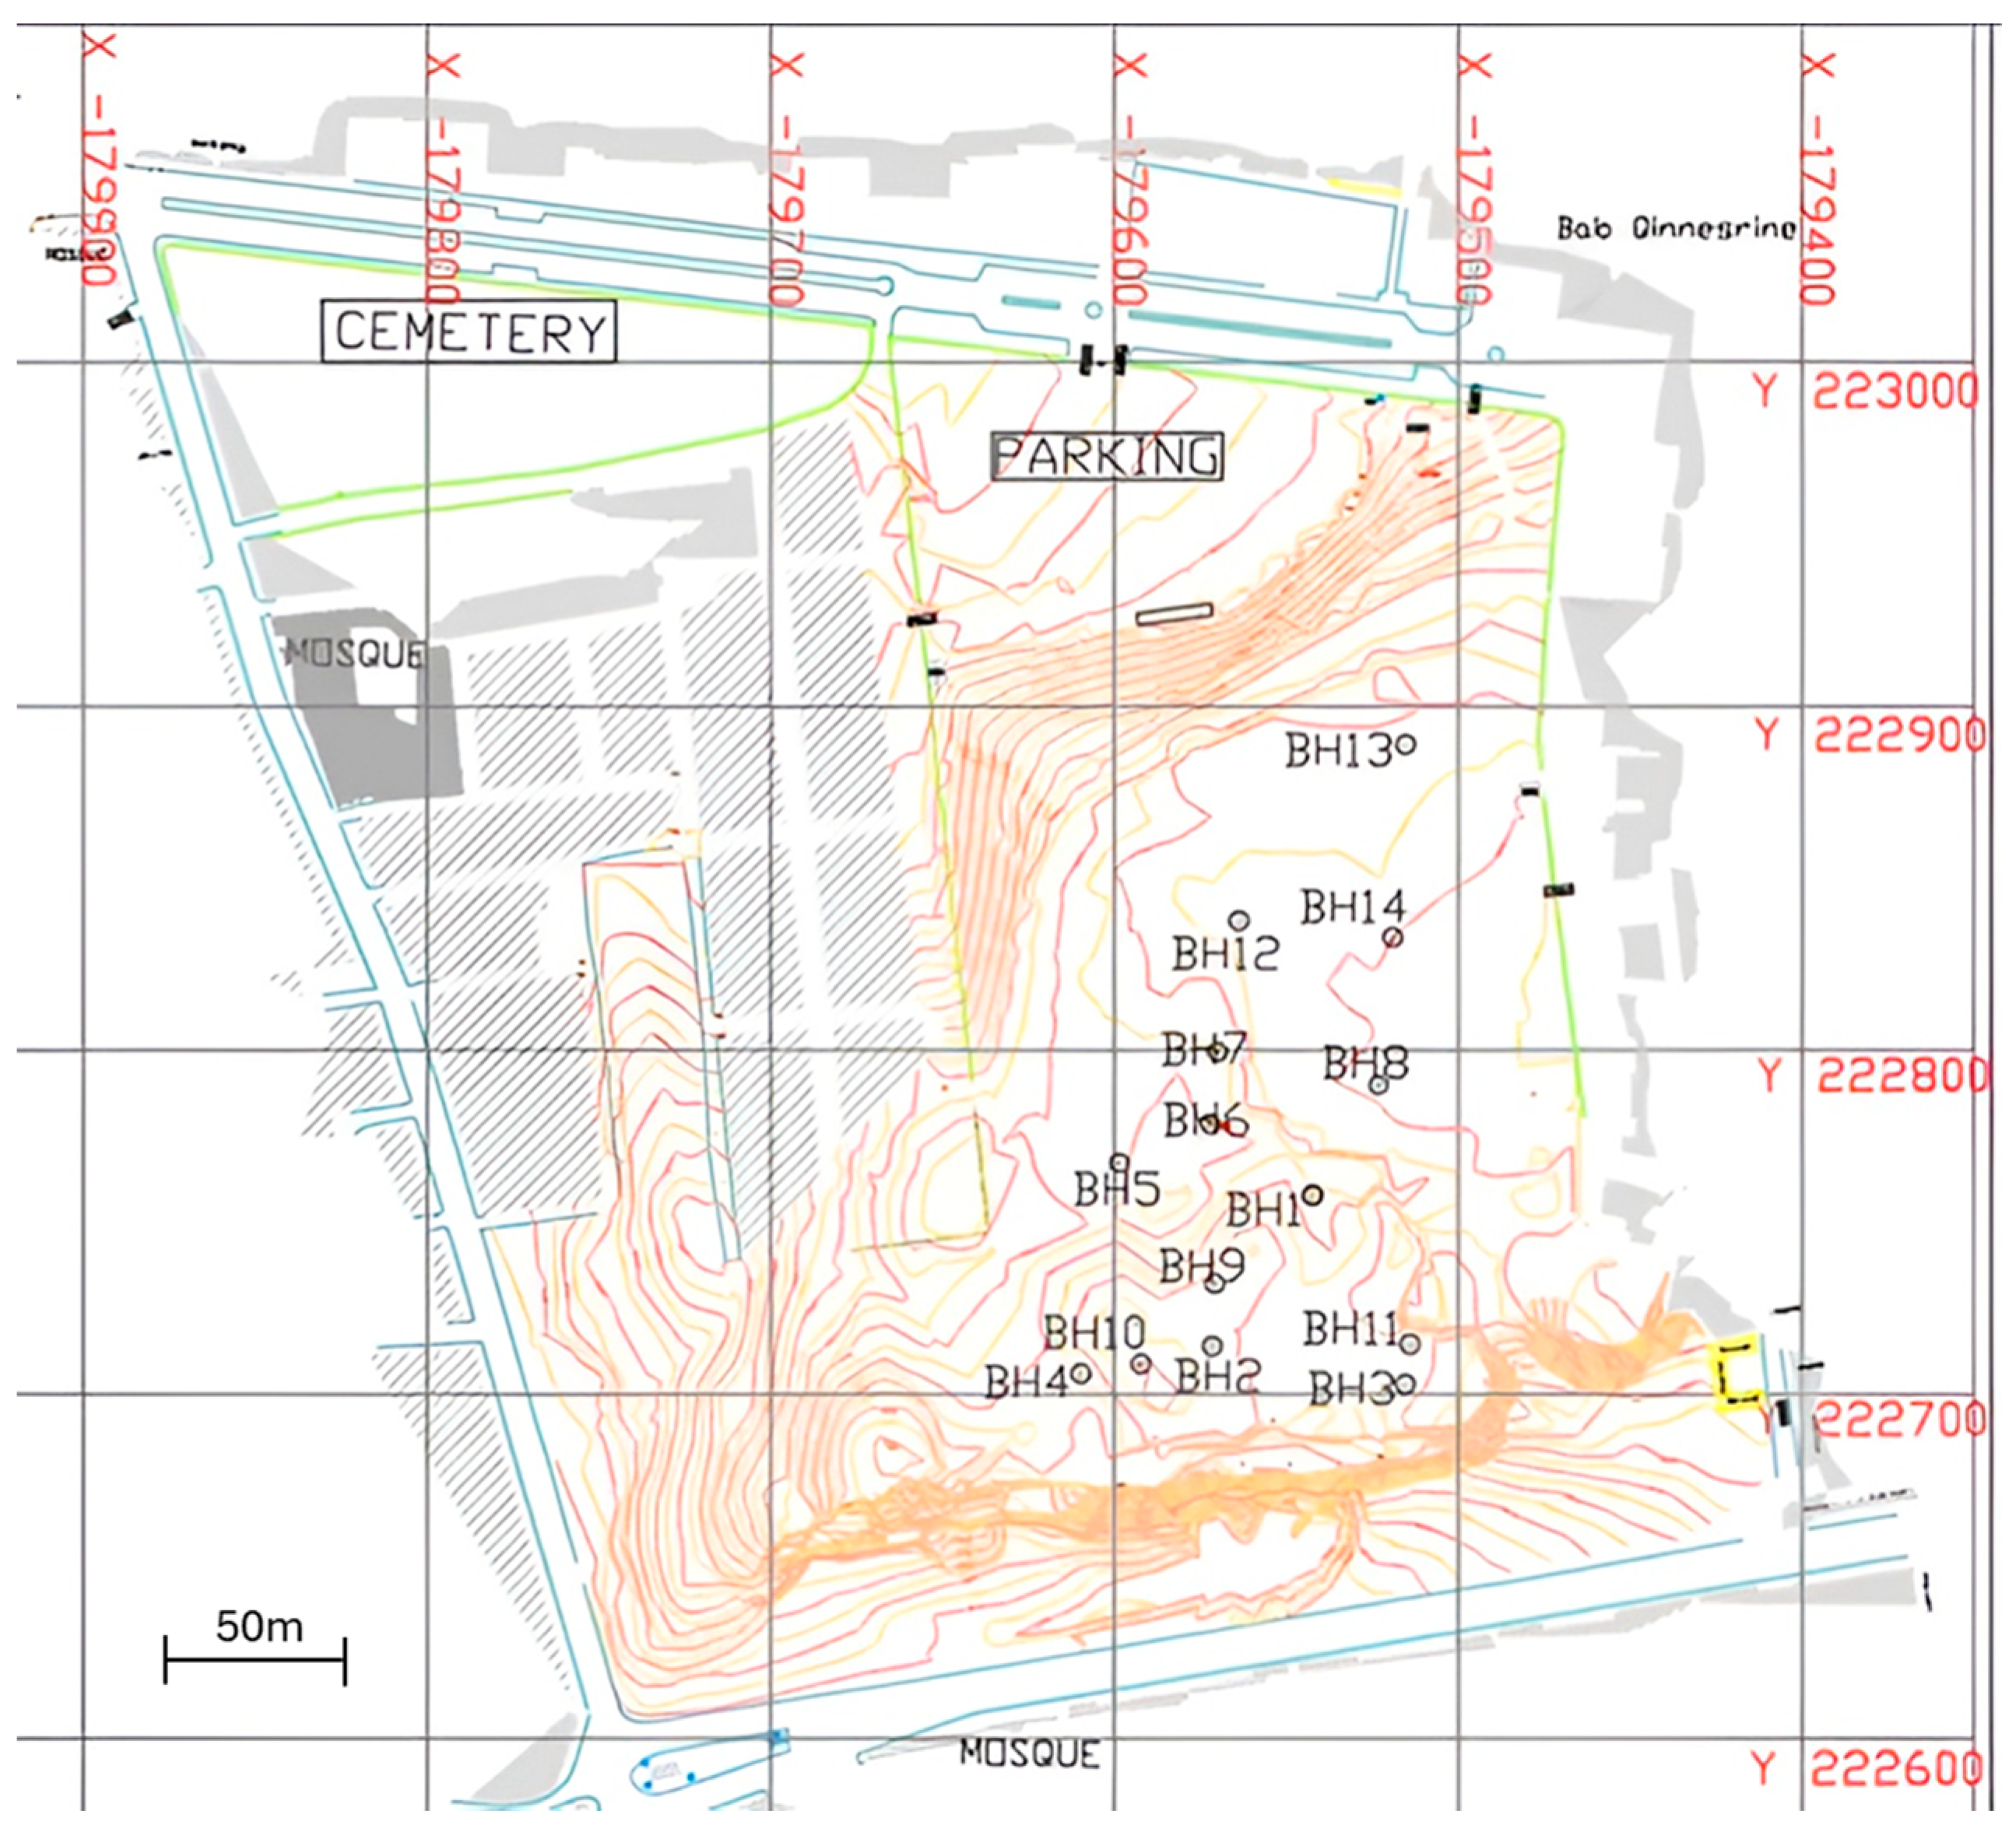
A total of 14 boreholes (see Figure 4) were drilled across a 100 m × 200 m section of the site using a downhole hammer technique. This method allowed rapid penetration and efficient identification of voids, as the drill rods could drop freely into cavities.
Each borehole was logged systematically for depth, lithostratigraphy, and the presence or absence of open voids. Representative soil and rock specimens were recovered for subsequent geomechanical characterisation of the encountered units. The logs delineate a consistent succession of made ground (random fill) over silty clay, underlain by fractured chalk. As shown in Figure 5, the cores recovered from BH3 and BH10 exhibit intense jointing and a blocky to very blocky structure, indicative of a highly compromised rock mass.
Rock Quality Designation (RQD) values varied widely across the site, ranging from as low as 16% near an area previously affected by a sinkhole. Such low values indicate severely fractured chalk with poor geomechanical integrity and a high risk of deformation and roof instability. The average RQD was about 47.8 ± 29.7%.

3.3. Geological Modelling

The borehole data were used to construct a three-dimensional geological model of the subsurface using RockWorks V2020 [38]. This model was critical for visualising the distribution and geometry of voids, identifying the relative positions of fill, silty clay, and chalk layers, and guiding the development of numerical meshes.
The Inverse Distance Method (IDM) was employed for spatial interpolation of geological surfaces. IDM was chosen because it provides robust performance with sparse and irregularly spaced data, which characterise the present site [38]. The method calculates values for interpolation nodes as a function of the weighted average of nearby sample values, with weights decreasing with distance according to a user-defined exponent. The IDM interpolation follows the equation:
V ( x ) = i 1 n V i d i p i 1 n d i p
where V(x) is the interpolated value at location x, Vi is the value at sample point i (borehole), di is the distance from the sample point i to location x, and p is the weighting exponent. A value of 3 was used for the weighting exponent, based on standard practice for localised geological variation [39].
The effect of the weighting exponent p on the influence of each borehole can be visualised in Figure 6. The left panel illustrates the spatial distribution of control points (boreholes) used in the interpolation, while the right panel shows how the relative weight of each point decays with distance. The curve shows that with p = 3, the influence of distant points rapidly diminishes, ensuring that interpolation is strongly biased towards local geological variations. This choice is particularly important in the heterogeneous ground conditions of Tallet Alsauda, where voids and layer thickness change abruptly over short distances.

3.4. Geotechnical Parameters

Material properties for the three principal strata—random fill, silty clay, and chalk—were derived primarily from laboratory testing on specimens recovered from the boreholes. A total of 55 specimens were tested, comprising approximately 10 from the random fill (0–2 m depth), 20 from the underlying silty clay (2–10 m), and 25 from the chalk layer (below 10 m). This distribution ensured that all major lithological units were adequately represented.
The laboratory tests included direct shear box tests on the soils and unconfined compressive tests on the chalk. All tests were carried out at the natural moisture content of the materials. For the soils, this corresponded to near-dry conditions, while the chalk samples had an average moisture content of about 23%. Table 1 summarises the results.
For the soils, long-term drained shear strength parameters (ϕ, c) and bulk unit weight (γ) are reported; for the chalk, strength is represented by the intact unconfined compressive strength (UCS). Values are means, with standard deviation shown in parentheses. Elastic moduli for the fill and silty clay were not reliably measurable from the available tests. They were therefore taken from published ranges for comparable materials and verified by sensitivity checks.
The lower-bound parameter values for chalk were concentrated in samples taken adjacent to previously affected areas (i.e., sinkhole footprints). Several specimens exhibited clear signs of moisture-induced softening, most plausibly related to infiltration from leaking sewer infrastructure. This field–laboratory correspondence provided a basis for defining realistic lower-bound input parameters in subsequent numerical modelling.

3.5. Material Models

For the numerical modelling, the random fill and silty clay were simulated using the Mohr–Coulomb failure criterion, which adequately represents their plastic behaviour under loading. In contrast, the chalk was represented using the Generalised Hoek–Brown failure criterion [42,43], which accounts for stress-dependent strength in fractured rock masses. This approach assumes isotropic behaviour in rock masses with closely spaced discontinuities of similar surface characteristics. Hoek–Brown strength parameters were derived from the following expressions [44]:
σ 1 = σ 3 + σ c i   m b σ 3 σ c i + s a
where σci = UCS of intact rock; mb, s, a = constants given as follow:
m b = m i   exp G S I 100 28 14 D
s = exp G S I 100 9 3 D
a = 1 2 + 1 6 e G S I / 15 e 20 / 3
where GSI is the Geological Strength Index [45] and D is disturbance factor. Following Hoek’s guidelines [44], D = 0.7 was adopted to represent a moderately disturbed rock mass affected by historic excavation and weathering but not active construction. This assumption reflects the fact that old quarry workings and boreholes intersect chalk roof but experiences no current blasting or heavy construction.
As for the GSI, this can be estimated from empirical relationships involving RQD and joint condition ratings, as shown in Equation (6):
G S I = 0.5   R Q D + 1.5   J c
where Jc = joint condition rating, and RQD = Rock Quality Designation (%).
GSI was estimated using both field observations of the rock mass and quantitative data from borehole samples, including RQD values. This combined method reduces subjectivity and provides a more consistent classification of rock mass quality. The analysis yielded a GSI of 53 ± 14.85, with upper and lower bounds of 67.85 and 38.15, respectively.

3.6. Numerical Modelling and Validation Procedure

Several commercially available numerical software packages exist, including Midas, Plaxis, Lusas, and others, each with capabilities suited for different civil and geotechnical applications. For this study, numerical modelling was performed using Plaxis-3D V2024.3 [46], a geotechnical finite element software capable of simulating complex soil–structure interactions in a short time. The geological model developed in RockWorks-v2020 [39] was transferred into the numerical environment through a structured workflow to preserve the accuracy of layer boundaries and cavity geometry.
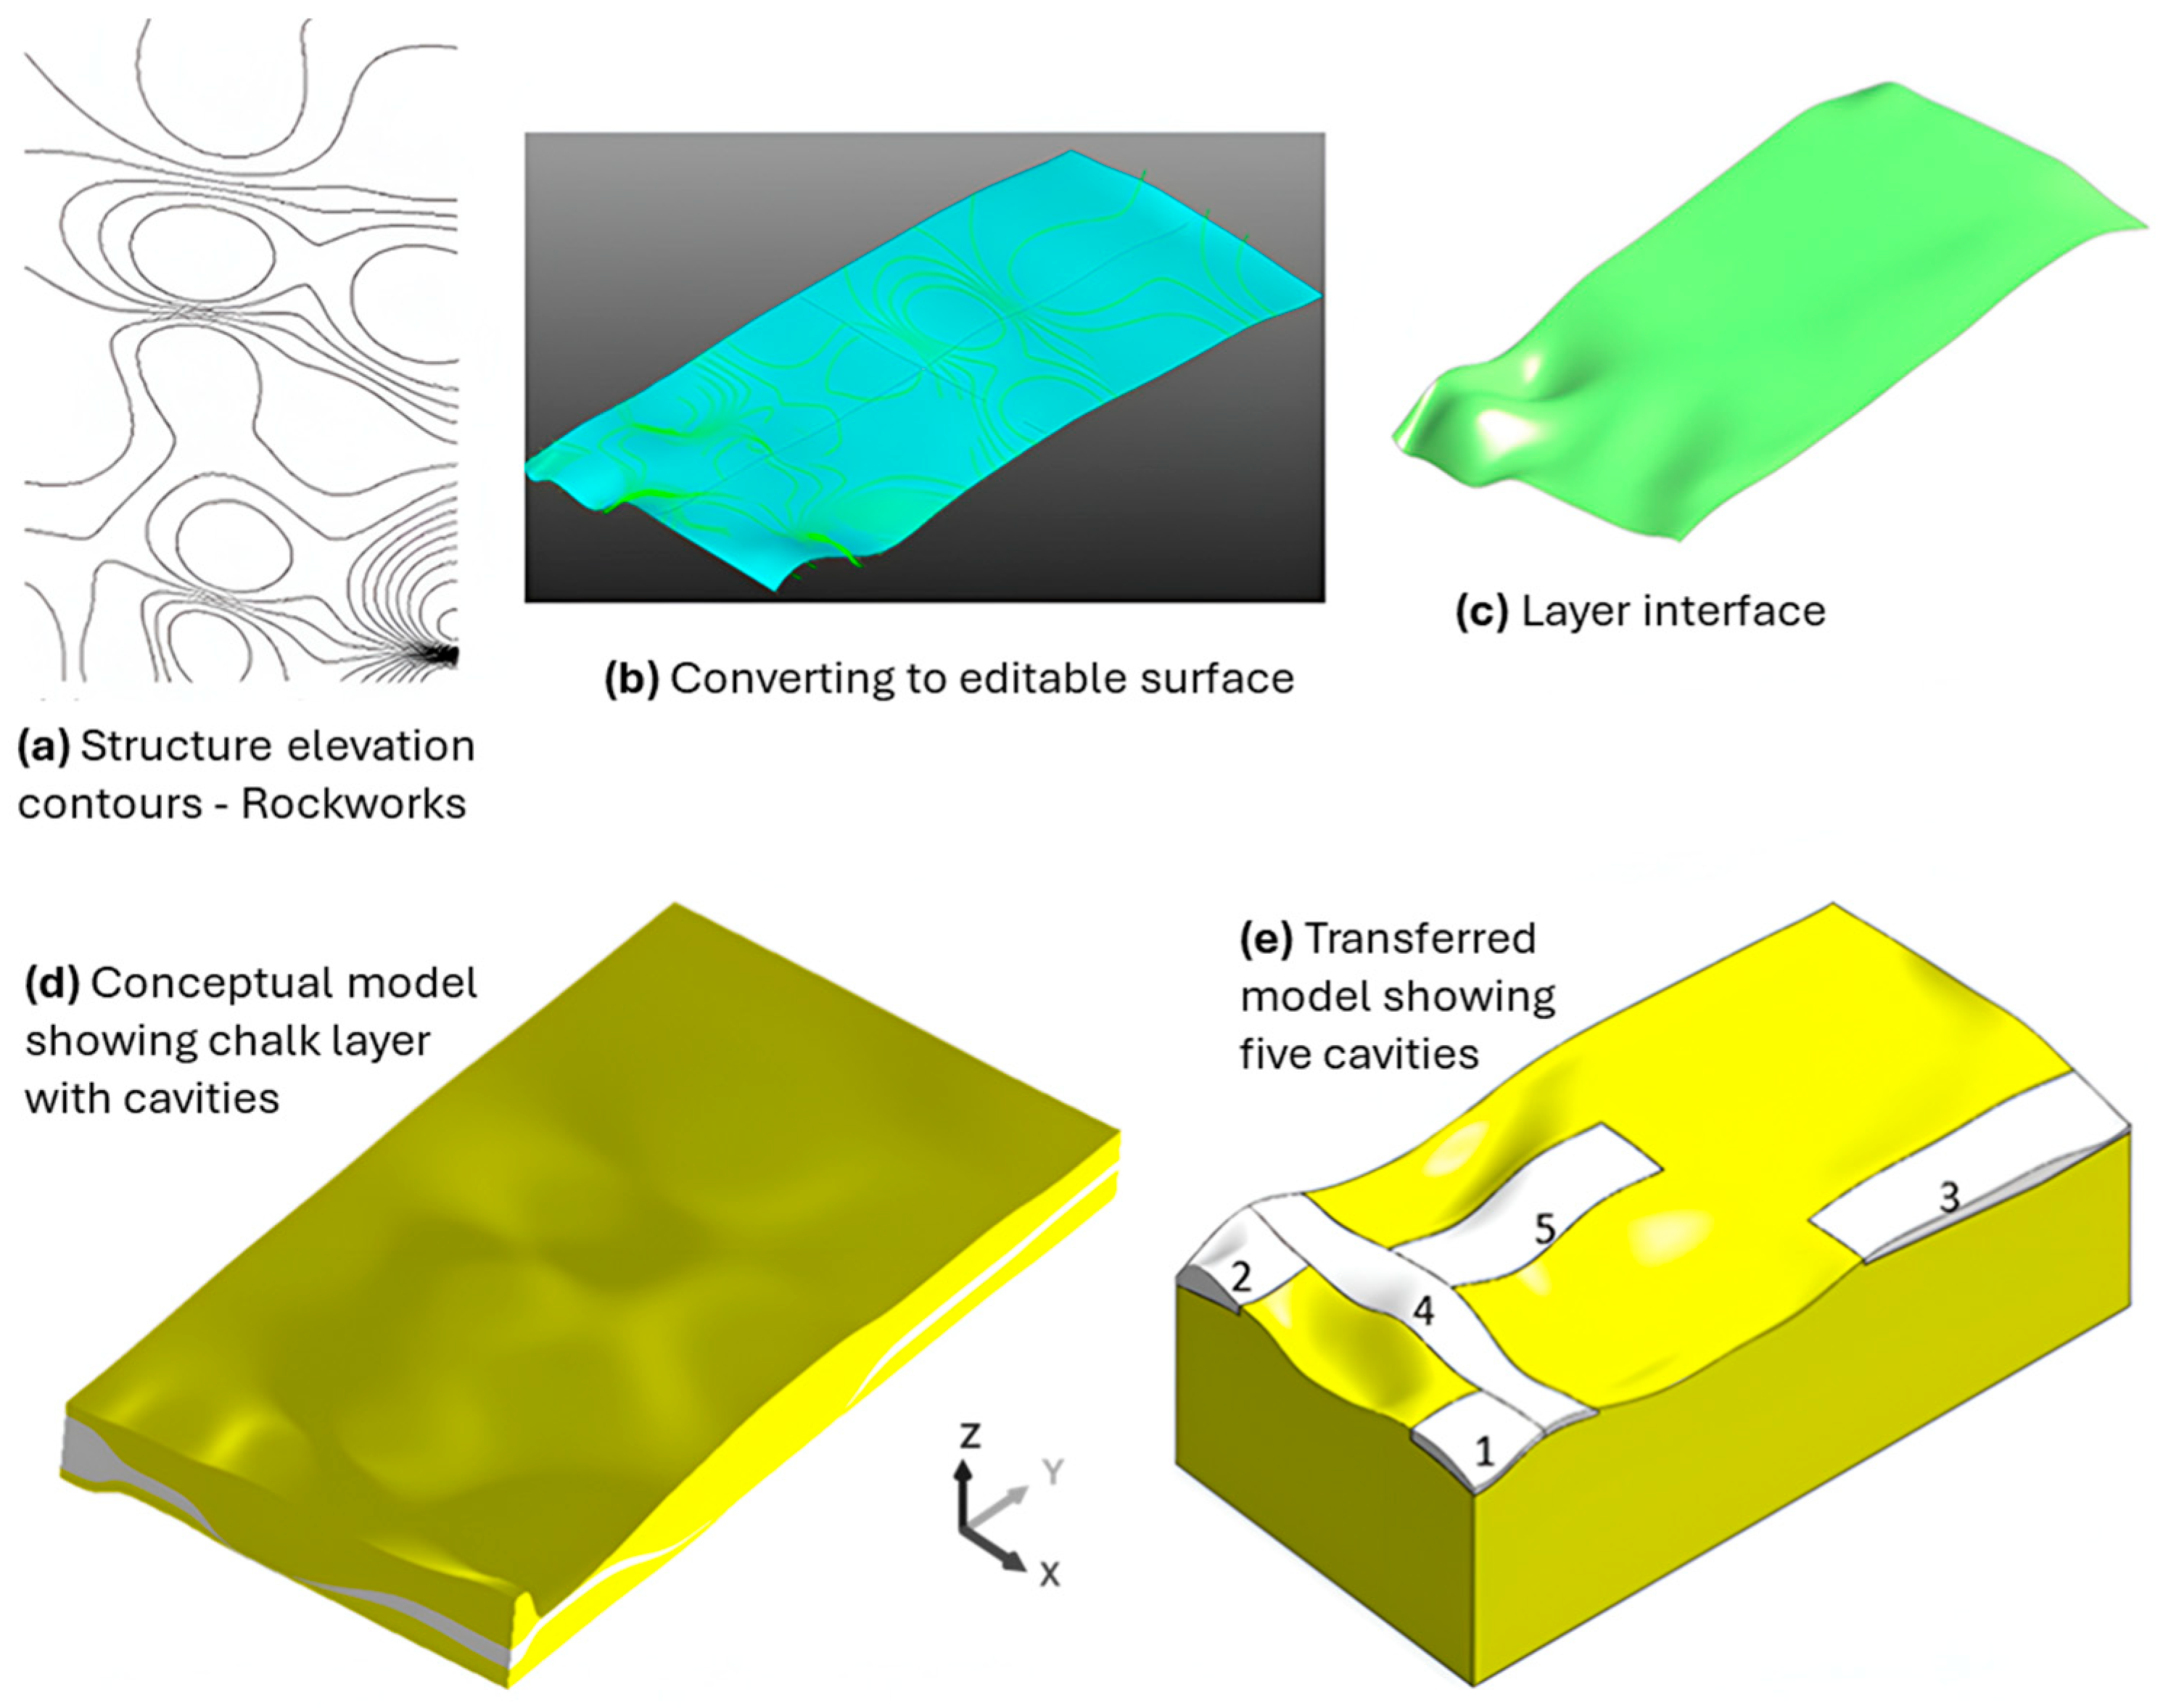
The transfer of the geological model into the numerical environment followed a structured workflow designed to maintain geometric accuracy and topological consistency (see Figure 7). Structural elevation contours generated in RockWorks V2020 [39] were first exported to AutoCAD V2019 for geometric refinement and surface editing. The refined surfaces were then used to define lithological boundaries and construct a conceptual three-dimensional chalk model incorporating the mapped cavities. The resulting solid geometry was subsequently imported into Plaxis-3D V2024.3 [46], where it was discretised into a finite-element mesh for analysis. This integrated process ensured that both the spatial configuration of cavities and the stratigraphic relationships derived from the borehole data were faithfully preserved in the numerical simulations.
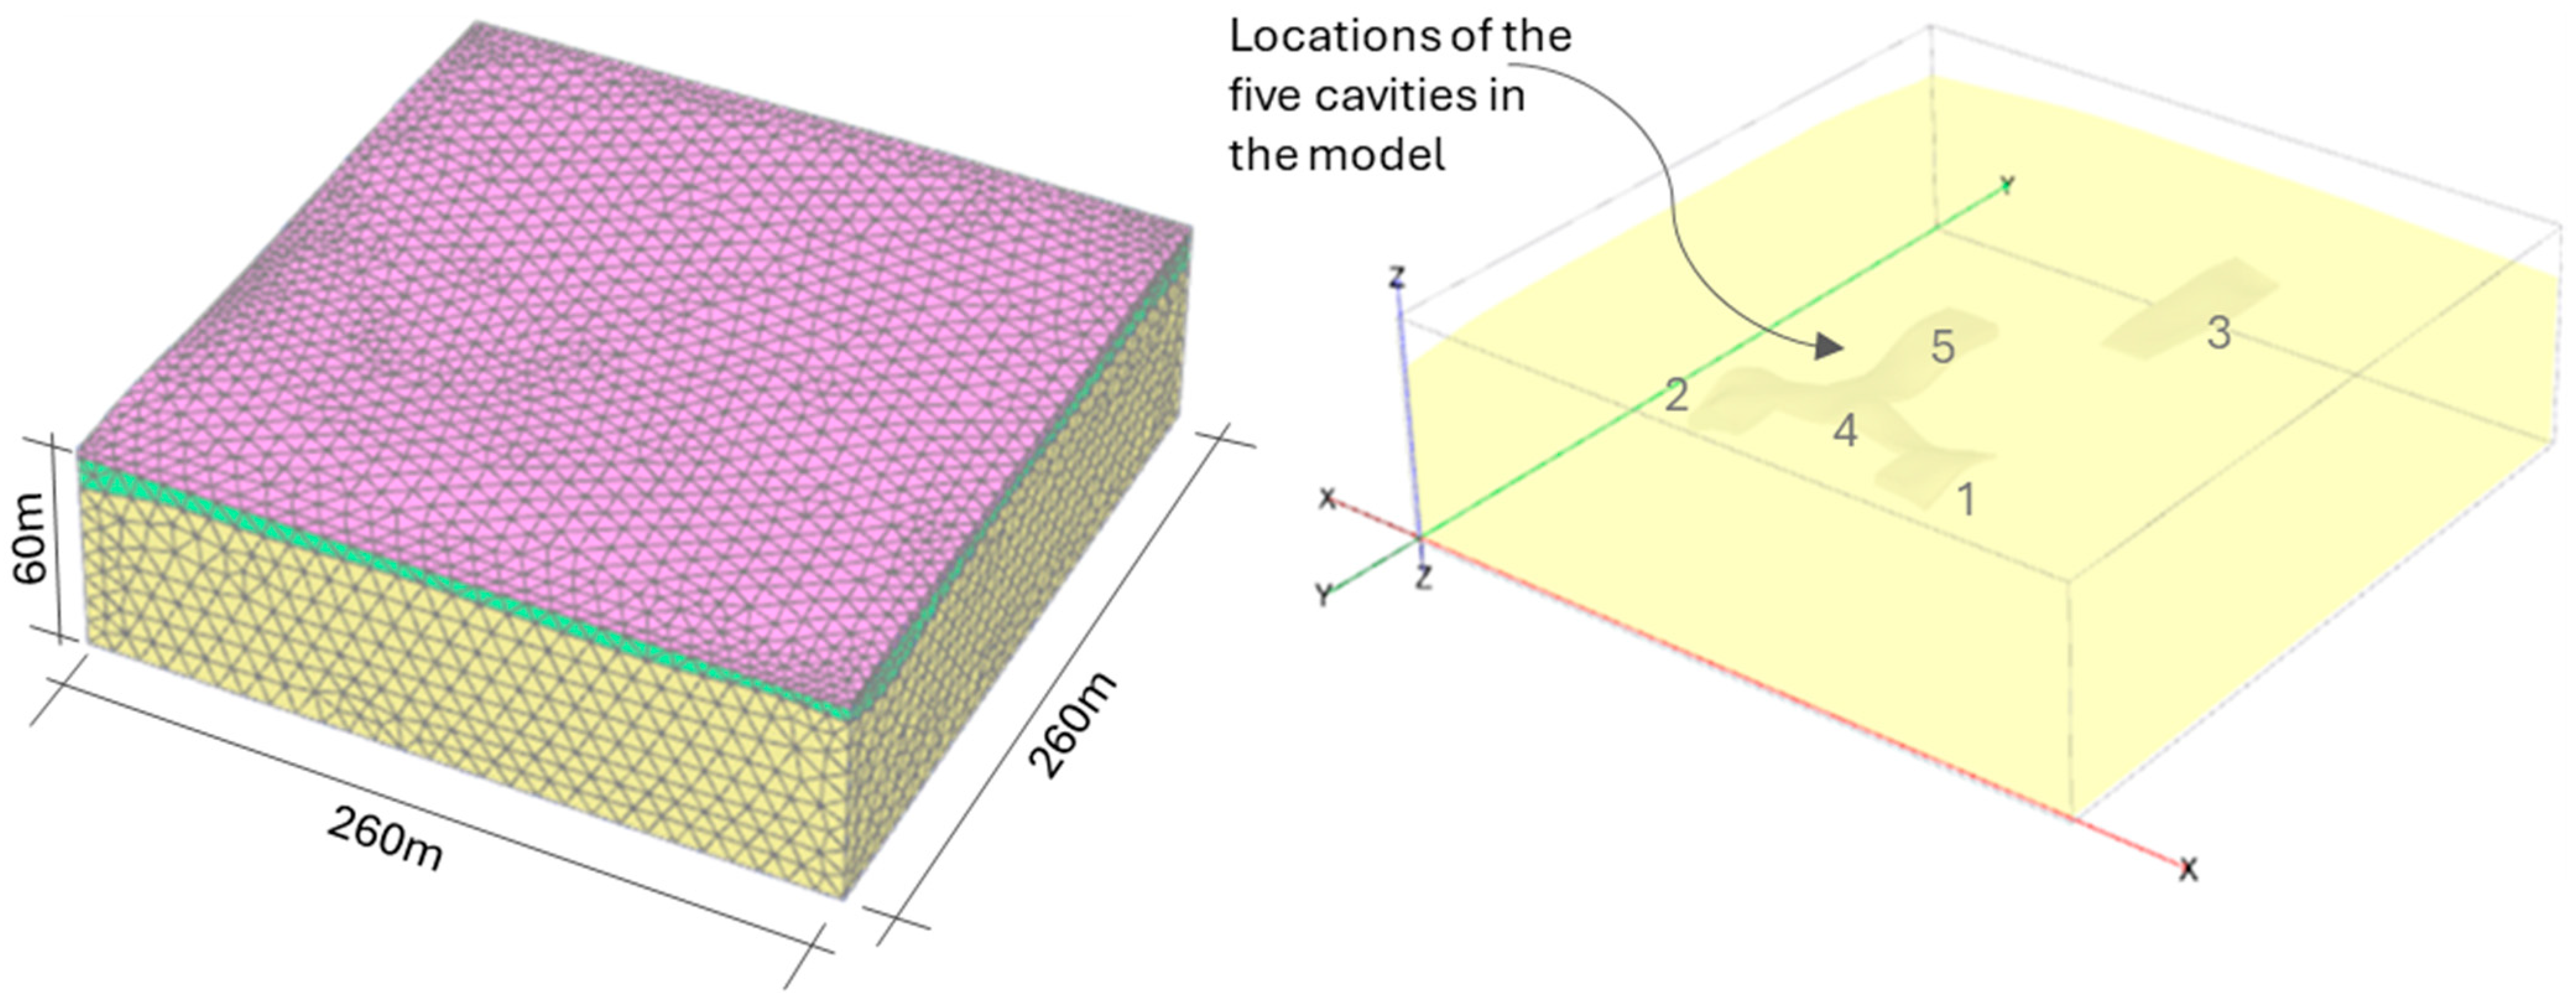
The resulting 3D finite element model is shown in Figure 8. The complete model incorporated the geological layering and cavity geometries derived from the RockWorks model. The model domain extended 260 m × 260 m laterally to minimise boundary effects. Mesh refinement was applied near voids and areas of interest, with minimum element sizes of 0.084 m in the central zone (at cavities) and coarser mesh up to 24 m at the model boundaries. The total final model comprised 43,764 tetrahedral elements and 65,874 nodes. Boundary conditions fixed vertical displacements at the model base and restricted lateral movements along the side boundaries.
Due to the large model extent, mesh refinement was concentrated around the zones of greatest interest, particularly above and around the cavities, while a coarser mesh was applied further away to optimise computational efficiency. Several mesh configurations were tested, and the final model domain (260 × 260 m) was deliberately extended well beyond the outermost voids to ensure that boundary effects did not influence stress redistribution near the cavities. The base boundary was fixed in all directions to represent the competent underlying chalk, whereas the lateral boundaries were constrained horizontally but allowed vertical displacement to prevent artificial confinement. As mesh density can affect local deformation patterns, a mesh sensitivity check was conducted. The comparison between the original and refined meshes showed negligible (<3%) differences in both displacement magnitudes and collapse thresholds, confirming that the adopted mesh resolution and boundary conditions yield stable, reliable numerical results.
The simulation included seven stages:
  • Initial stress field generation, in which the model was subjected to self-weight loading to simulate in situ stress conditions.
  • Sequential excavation of five representative cavities (Figure 8).
  • Gradual strength reduction in chalk to simulate material degradation.
This staged analysis enabled assessment of time-dependent failure mechanisms and their correspondence with observed sinkhole events [21,47].
To simulate collapse scenarios, a strength reduction method was applied. The chalk was initialised with upper-bound values of UCS and GSI to represent the best-case stable current state of the rock mass. These parameters were then progressively reduced—primarily by decreasing UCS and GSI toward their lower-bound values—to reflect plausible moisture-induced softening and capture deterioration of rock-mass structure and joint conditions expected in the long term. Progressive parameter reduction enabled observation of displacement and plastic zone development within the model. Collapse was defined as the point at which sudden increases in deformation and the formation of failure zones occurred [11,22,48].
The simulation outputs at collapse were subsequently compared with lower-bound parameter values derived from samples collected adjacent to previously failed sites (i.e., sinkhole footprints) within the area. These specimens displayed pronounced signs of moisture-induced weakening, most plausibly caused by infiltration from leaking sewer infrastructure. This comparison calibrated the numerical model against field evidence, linking predicted collapse thresholds to measured GSI and UCS values. The approach thus identified critical parameter ranges governing instability and allowed direct comparison with observed subsidence patterns in the field.

4. Results

4.1. Subsurface Stratigraphy and Cavity Identification

The borehole investigation revealed a heterogeneous subsurface profile across the Tallet Alsauda site. Stratigraphic layers encountered generally included an upper zone of random fill, underlain by silty clay, and, further down, a fractured chalk layer hosting the cavities. The depth and thickness of these layers varied significantly across the site.
Cavities were identified in 9 out of the 14 boreholes, with highly variable depths and geometries. For example, BH4 recorded a cavity height of 11 m, while others, such as BH11, revealed no voids. The thickness of the chalk layer above the cavities ranged from over 10 m (BH3) to 0 m (BH11), highlighting the irregularity and unpredictability of cavity occurrence. These findings confirm that cavity collapse risk is highly localised and strongly dependent on site-specific geostructural conditions. Table 2 presents the layer depths, cavity presence, and total borehole depths.
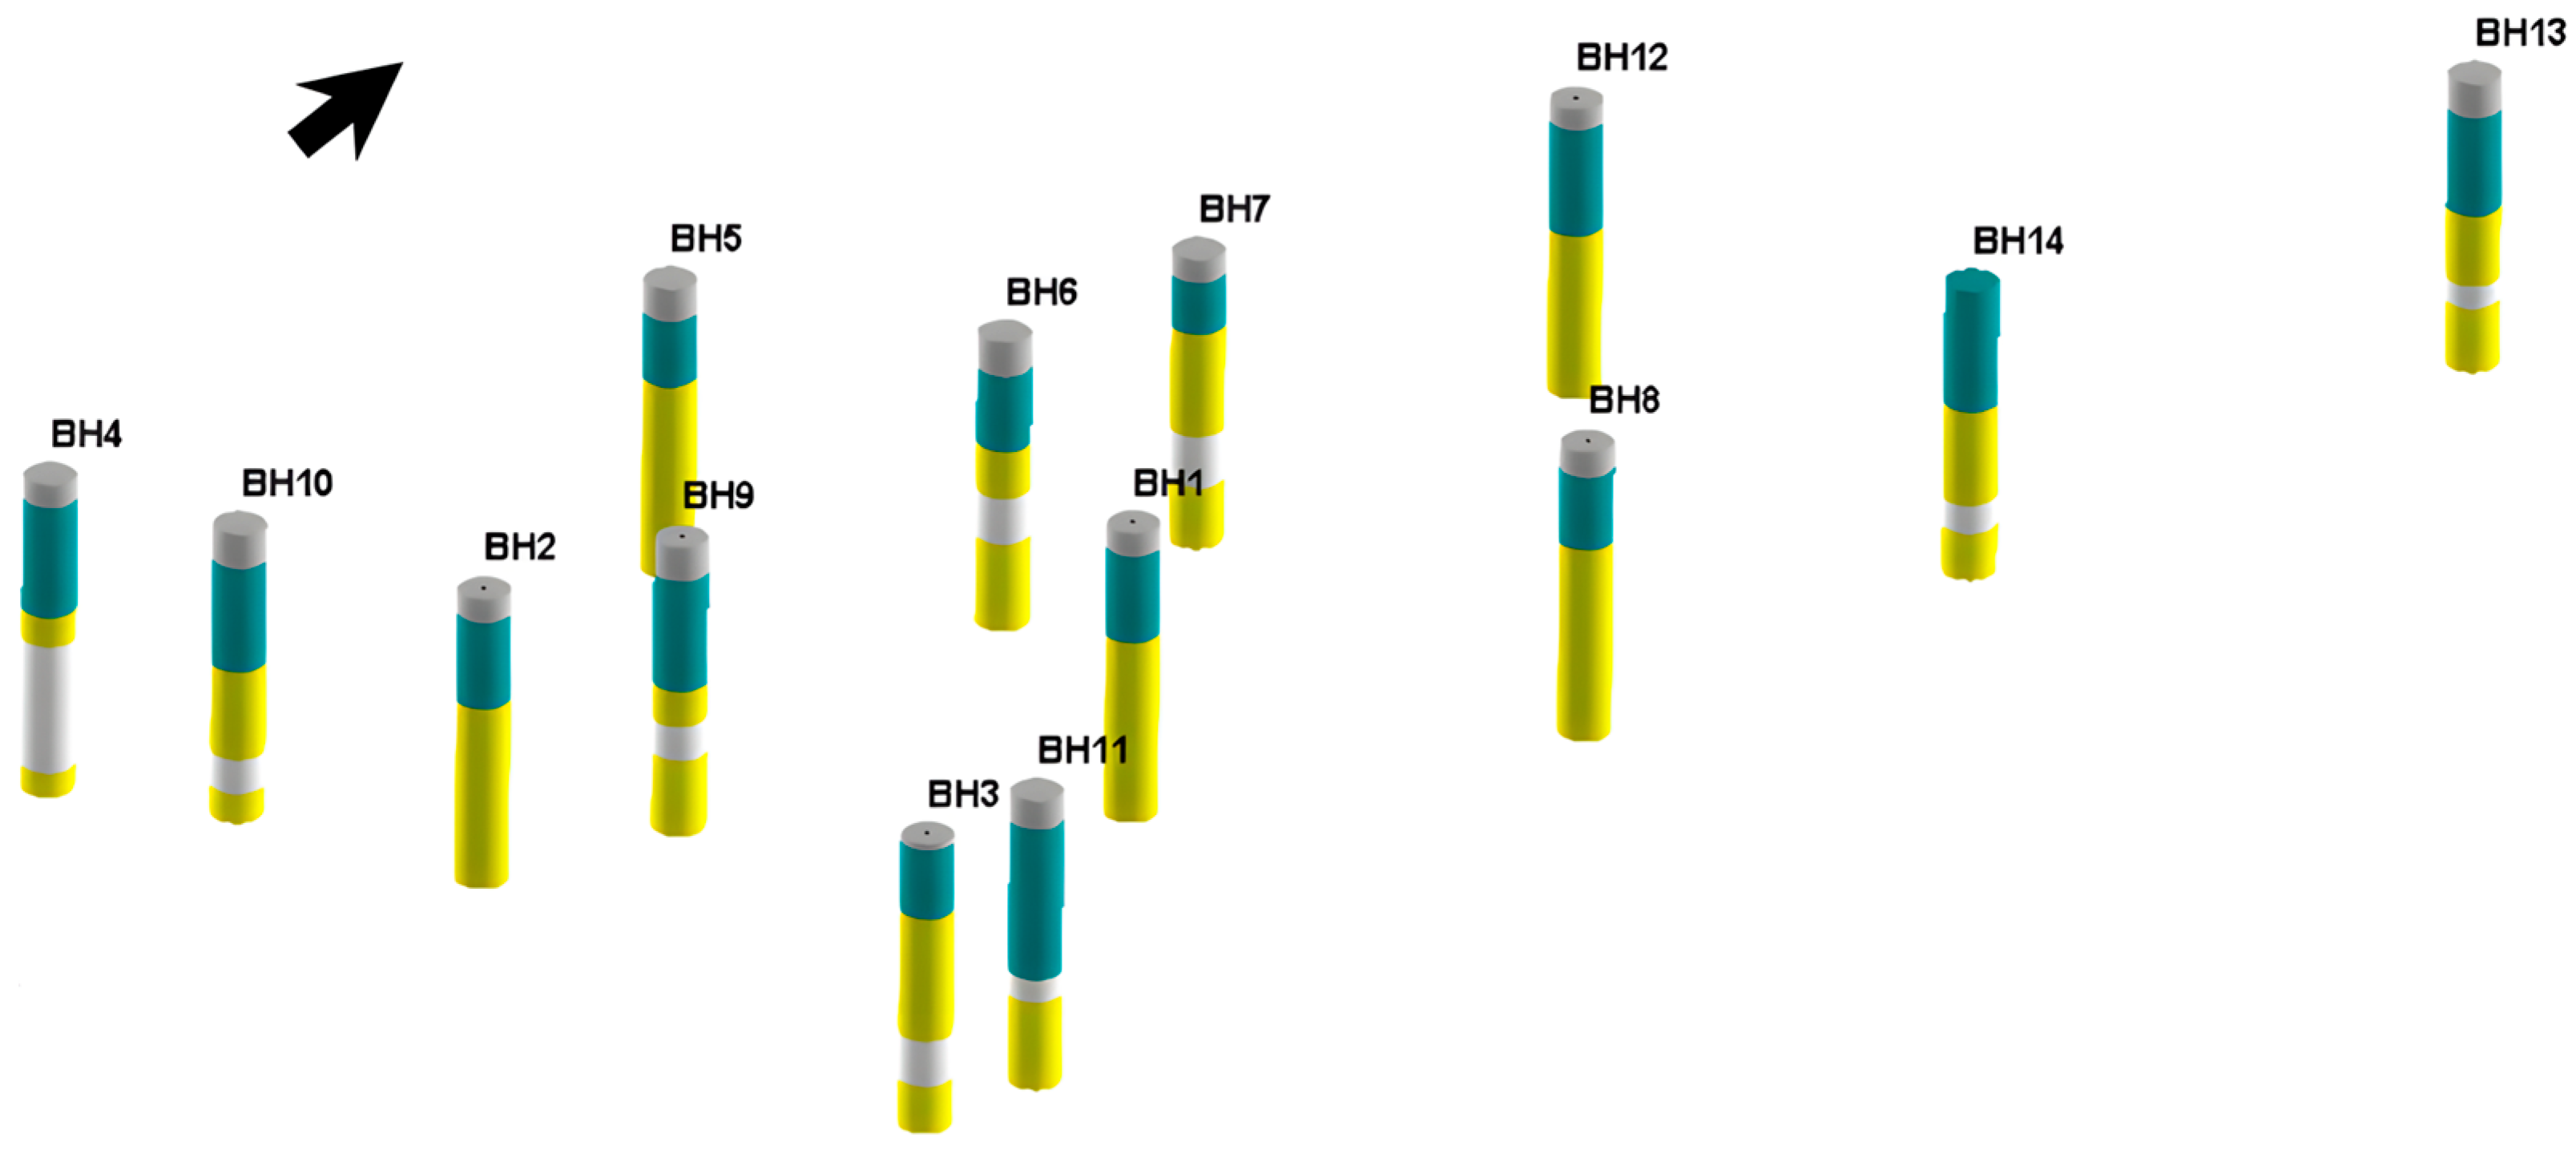
A visual synthesis of the borehole data is shown in Figure 9, which depicts the presence or absence of voids (in white), and the stratigraphy comprising chalk (yellow), silty soil (blue), and made ground (grey). The figure illustrates the pronounced spatial heterogeneity of the subsurface, including the irregular elevation of cavity roofs and bases.

4.2. Geological Model Output

The 3D geological model developed in RockWorks effectively interpolated stratigraphic and cavity data from boreholes. The Inverse Distance Method (IDM) captured the localised variability of cavity placement and chalk layer thickness, resulting in a continuous but non-uniform representation of the subsurface.
Figure 10 presents the conceptual model of the study area. It shows cavities unevenly distributed both horizontally and vertically. Some occur just beneath the made ground, while others extend deeper into the chalk. The irregular geometry suggests both human excavation and natural karst processes contributed to cavity formation. This model provided the input for generating the finite element mesh used in numerical simulations.
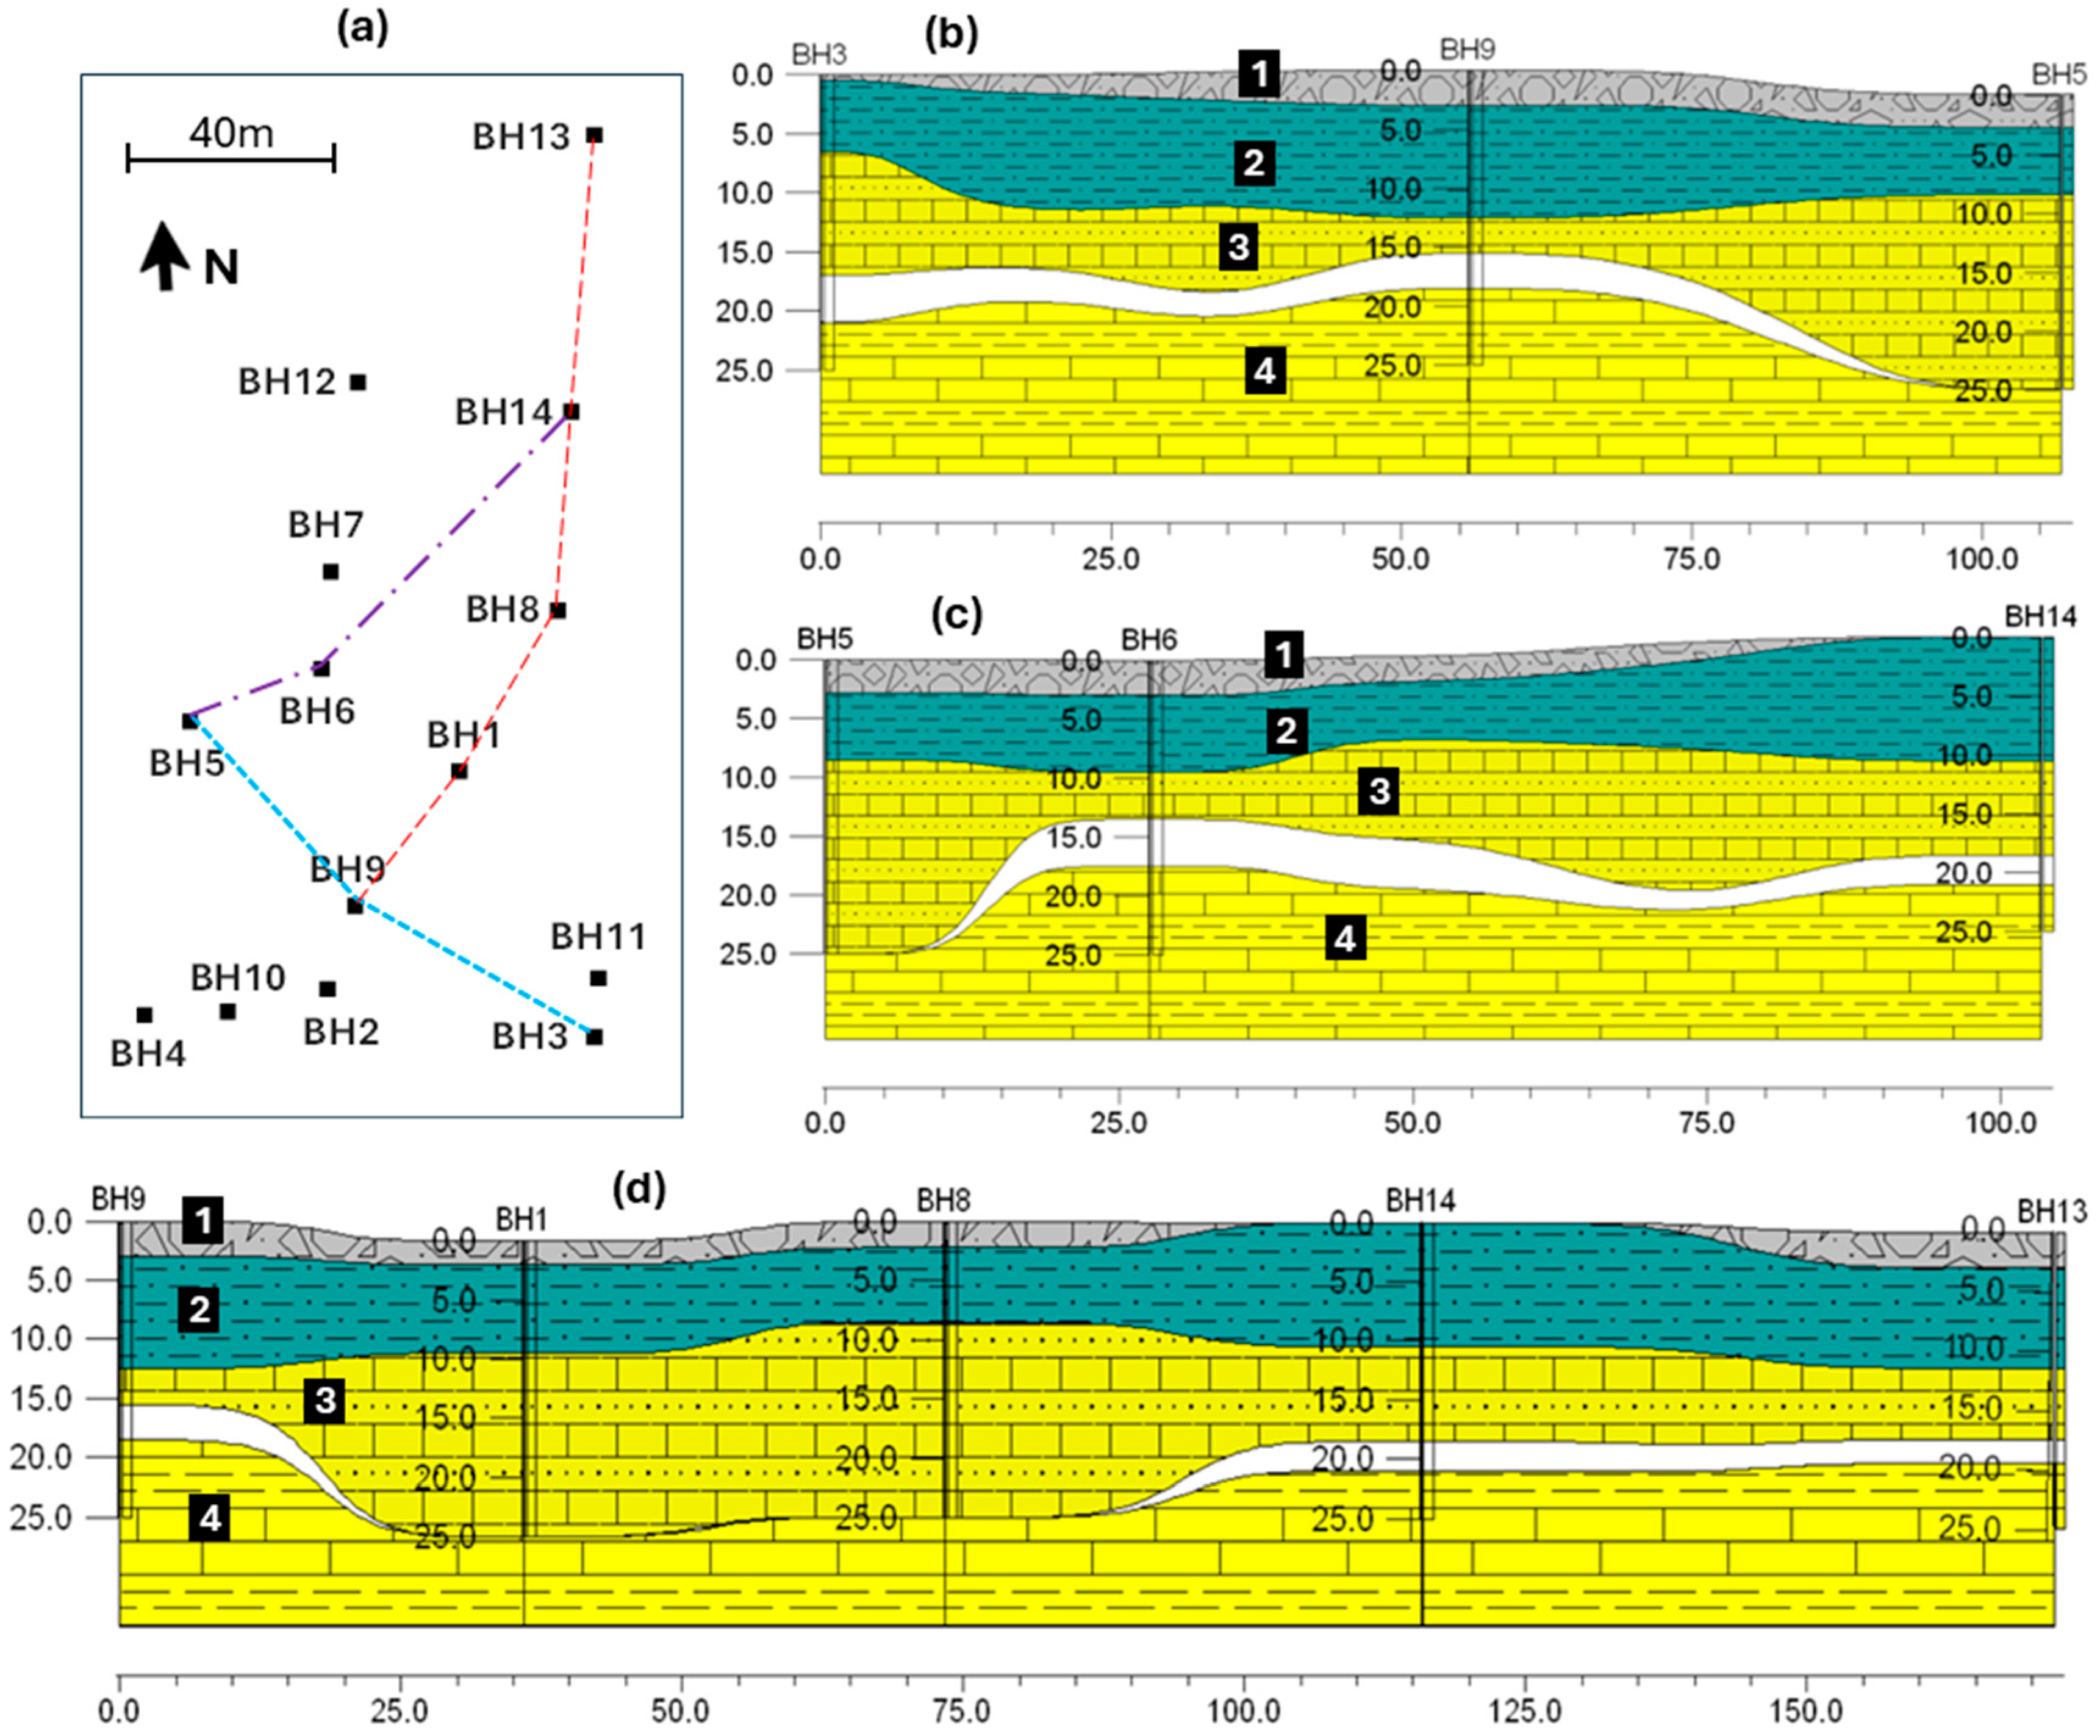
A geological cross-section (Figure 11) created from the model and borehole data highlights variation in cavity depth, overburden thickness, void geometry, and chalk roof height. These factors strongly influence collapse potential. In general, five cavity zones were mapped as illustrated in Figure 7e. Zones with minimal overburden were identified as high-risk areas. These correspond with documented sinkhole incidents and with local reports of surface depressions, reinforcing the validity of the model. These critical zones were prioritised in the numerical model for stability analysis.

4.3. Numerical Simulation Results and Collapse Mechanisms

Finite element simulations were conducted using the 3D geological model to examine the stability of representative chalk cavities under progressive material degradation. The chalk’s Geological Strength Index (GSI) and unconfined compressive strength (UCS) were reduced in staged increments to simulate long-term deterioration.
The Hoek–Brown parameters used in the simulations for the chalk layer are summarised in Table 3. These include the initial values derived from laboratory and site investigation, and the reduced values correspond to the onset of collapse in the analysis. The simulations showed that a reduction in GSI from the upper bound value of 67.85 to 47.06 (approximately a 30% decline in rock mass quality), together with a 27% reduction in UCS, was sufficient to trigger failure of cavity roofs.
The relationship between GSI reduction and total settlement is presented in Figure 12. The relationship is shown for Cave 5, which was representative of the most failure-prone cavity. Displacements remained modest until GSI fell below the mean value (~53), after which settlement increased sharply, peaking at over 300 mm when GSI reached 47. This abrupt acceleration illustrates the threshold-dependent behaviour of the chalk mass. This behaviour reflects the highly non-linear mechanical response of the chalk mass to degradation.
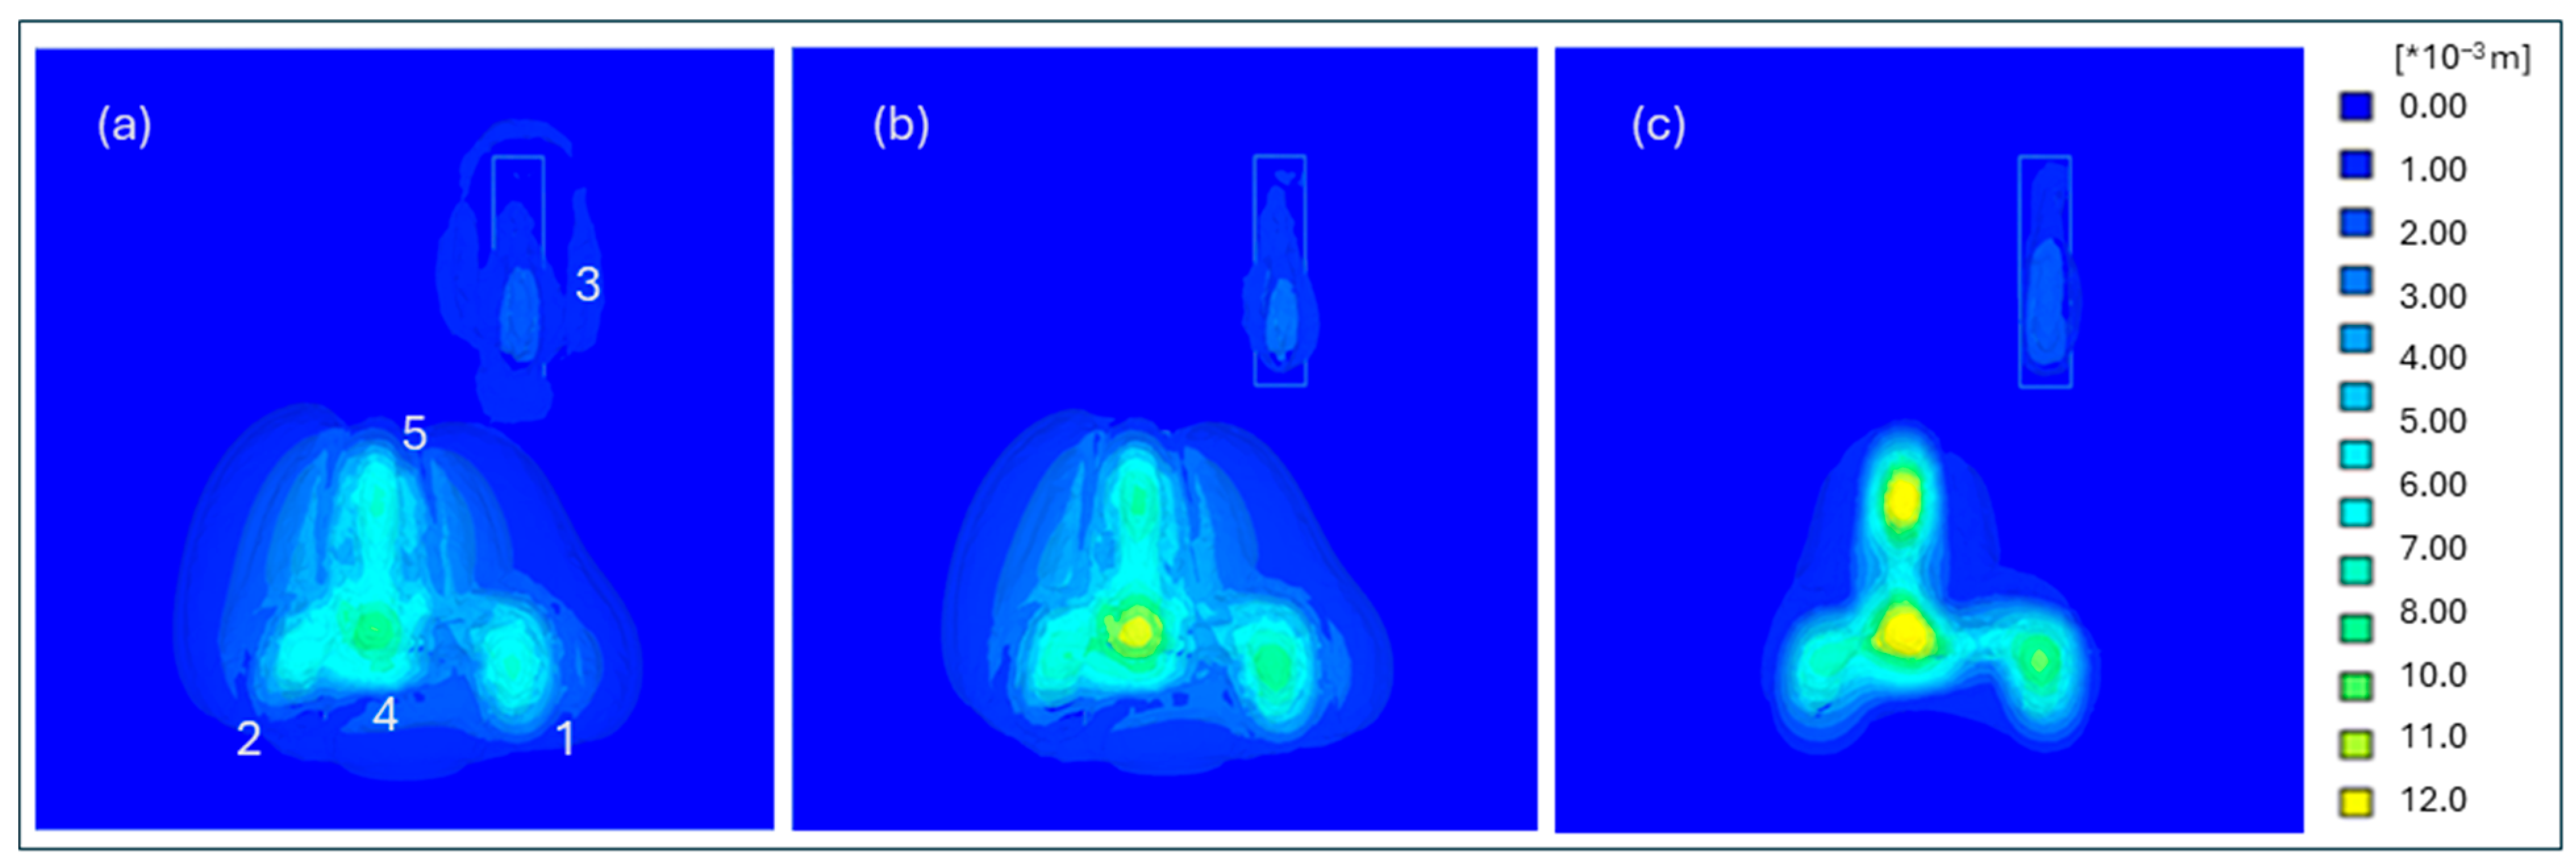
Figure 13 illustrates a plan view of the development of total displacement contours over three selected early stages, where the GSI was reduced from 61.91 to 55.97. The colour scale indicates displacement magnitude, with cooler colours (blue) representing low values and warmer colours (yellow) representing higher values. Results show that Caves 4 and 5 experienced the most significant displacements, whereas Cave 3 remained largely stable, indicating a lower susceptibility to collapse. The onset of instability was most evident in Cave 5.
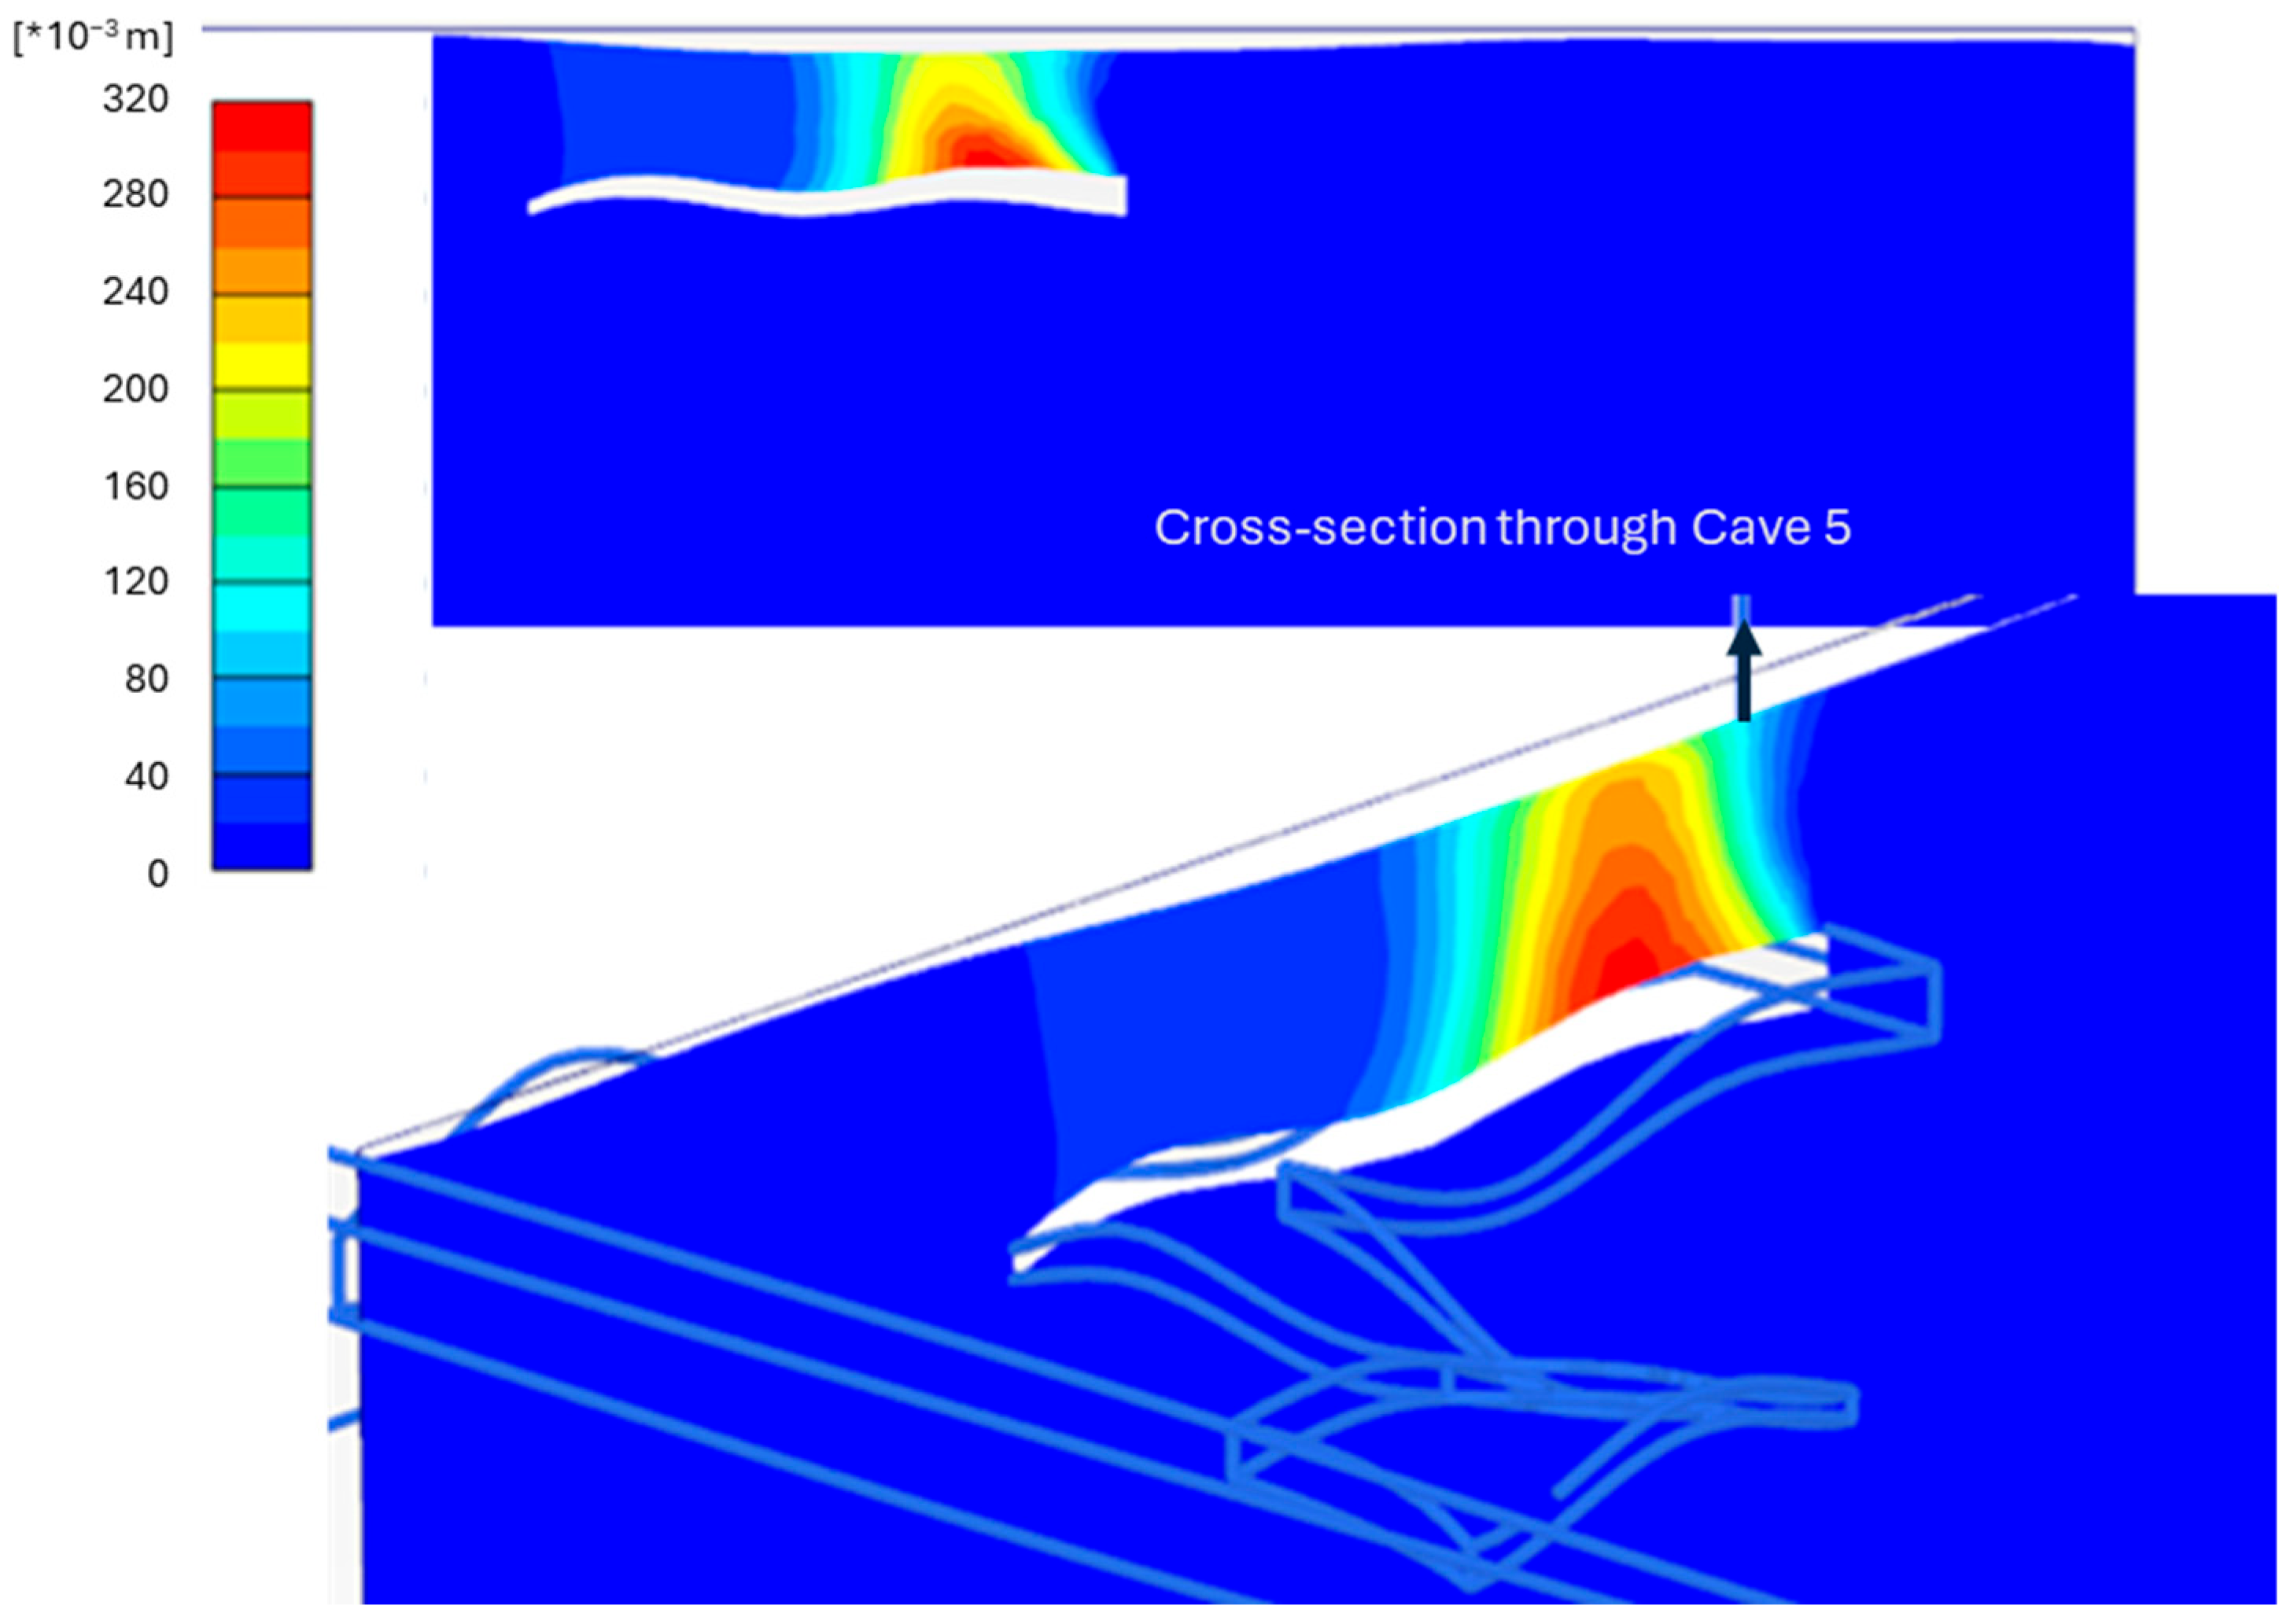
Figure 14 shows the total displacement contours through Cave 5 in the final stage, which was the first to exhibit signs of collapse. Collapse initiated at Cave 5, where failure propagated vertically from the cavity roof to the ground surface, producing a depression consistent with sinkhole morphologies observed in previous Tallet Alsauda events.
The combined interpretation of borehole data, geological modelling, and finite-element simulation indicates that the areas above Caves 4 and 5 constitute the highest-risk zones within the study site. These zones are characterised by minimal overburden (<3 m), cavity spans exceeding 8 m, and flat roof geometries that concentrate tensile stresses. Caves 2 and 3 display moderate stability due to thicker, more arched roofs and better confinement, whereas Cave 1 lies outside the principal failure influence zone and shows negligible deformation. This classification provides a concise summary of the most collapse-prone locations, aiding prioritisation for monitoring and remedial action.

5. Discussion

5.1. Mechanisms and Triggers of Collapse

The integration of borehole observations, geological modelling, and numerical simulations identifies progressive deterioration of chalk strength—accelerated by water ingress—as the primary collapse mechanism in Tallet Alsauda. The analysis revealed a distinct threshold effect: a reduction in the Geological Strength Index (GSI) from the mean of approximately 53 to 47, leading to a sudden increase in vertical displacement from ~7 mm to over 300 mm. This abrupt, non-linear behaviour indicates that the chalk mass was near its stability limit before failure occurred. The significant variation of Rock Quality Designation (RQD) values recorded in core samples, with very low values of ~16%, supports this conclusion and reflects pre-existing fracturing.
Water ingress plays a decisive role in advancing chalk degradation. Fractured roof strata, combined with leaking sewer lines and the absence of engineered stormwater drainage, allow continuous infiltration. Heavy rainfall imposes additional wetting–drying cycles that weaken the chalk through chemical dissolution and mechanical softening. Comparable mechanisms have been observed in the Clamart chalk mine collapse in France, where prolonged rainfall and infiltration through defective drainage were identified as immediate triggers [12], and in the Malogne mine instability in Belgium, where moisture-driven weakening of large roof spans (>8–10 m) ultimately led to catastrophic failure [13]. In UK chalk terrains, even small hydrological changes, such as sewer leakage, have been shown to precipitate sinkhole formation [1,3].
The evidence from Aleppo therefore aligns with international experience, emphasising that while fractures and low rock mass quality define the long-term predisposition to collapse, hydrological triggers act as the immediate catalysts that transform latent instability into sudden failure.
Although quantitative field measurements of displacement are not yet available, qualitative correspondence between simulated deformation and observed surface subsidence provides confidence in the modelled mechanisms. The upward-propagating failure pattern and surface sagging morphology predicted by the simulations closely match those recorded in the 2019 collapse event. Future research should incorporate satellite-based InSAR monitoring and detailed post-collapse damage surveys to establish a quantitative basis for model validation as urban accessibility improves.

5.2. Influence of Cavity Geometry and Overburden Thickness

The early failure at Cave 5, despite its similar depth to Cave 4 and lower cavity height than Cave 2, demonstrates that cavity geometry and roof characteristics govern collapse behaviour more strongly than depth or height alone. The roof at Cave 5 is notably flatter, which causes it to behave like a beam under vertical loading, attracting tensile stresses. Chalk has very low tensile strength, making such configurations susceptible to bending failure. By contrast, the more curved roofs of Caves 2 and 4 allowed stress redistribution through arching, generating compressive stresses that chalk can sustain more effectively. This geometric difference explains the greater stability of those cavities compared to those in Cave 5.
Borehole and model data from the wider Tallet Alsauda area confirm that roof thickness varies significantly—from over 10 m in some areas to complete absence in others—while cavity spans can reach up to 10 m. The resulting span-to-thickness ratios fall within ranges shown to be critical for roof stability. In weak carbonate rocks, such ratios strongly influence failure risk, with thresholds beyond which collapse likelihood increases exponentially [21,27]. At Cave 5, the estimated roof thickness of 8.9 m above a cavity height of 4.4 m appears insufficient relative to span, especially given the lack of curvature and the associated stress concentrations at geometric transitions.
The irregular shapes of the cavities suggest a hybrid genesis. Large initial chambers were likely excavated through historical quarrying, later modified by natural dissolution. This mixed origin adds structural complexity, generates unpredictable stress concentrations, and makes failure mechanisms harder to anticipate. Similar hybrid origins have been identified in southern England [49] and in Castanar Cave, Spain [18], where anthropogenic modifications to natural voids reduced long-term roof stability.
In several borehole locations, thin or absent overburden further reduces load distribution capacity and allows upward migration of failure. The finite element models confirmed that these local conditions result in higher displacement rates for a given level of material degradation. This explains why instability initiated at Cave 5 and why other cavities, with more favourable geometry and confinement, remained comparatively stable.

5.3. Implications for Hazard Assessment and Urban Planning

This study highlights several priorities for managing sinkhole hazards in historic urban areas. Numerical simulation proved effective in detecting zones and specific cavities prone to failure, with the earliest signs of instability aligning with observed geometric weaknesses. When combined with borehole data, even if sparse, geological modelling and calibrated geomechanical simulations can identify collapse-prone areas with reasonable accuracy. Such models should underpin hazard zoning and sinkhole susceptibility mapping, as demonstrated in other karst and post-mining terrains [4,15].
Drainage infrastructure rehabilitation remains a critical first step. Upgrading sewer and stormwater systems in high-risk areas will reduce infiltration into fractured chalk and slow degradation rates. Immediate mitigation measures can include:
  • Replacement of fractured clay sewer pipes with HDPE (High-Density Polyethylene) lines equipped with welded joints to minimise leakage.
  • Establishing a minimum vertical clearance of ≥3 m between buried drainage conduits and known cavity roofs, verified by borehole probing prior to installation.
In parallel with these measures, the numerical findings offer a quantitative basis for early warning and monitoring strategies. The observed reduction in Geological Strength Index (GSI) from approximately 53 to 47 marks a threshold beyond which rapid deformation is likely. Observable field indicators—such as increased moisture, chalk softening, or early surface cracking—should therefore be treated as precursors of instability. Periodic borehole inspections and non-destructive tests (e.g., ultrasonic velocity or Schmidt hammer) can be used to track changes in rock mass quality. In zones showing pronounced weakening, low-pressure grouting using cement–bentonite or microfine-cement mixtures can reinforce chalk roofs while minimising disturbance to surface structures. The combined application of drainage control, monitoring, and targeted reinforcement provides a practical, low-intrusion approach to hazard management in Aleppo and other historic environments.
Complementary detection and monitoring tools further strengthen this framework. Non-invasive geophysical surveys—such as electrical resistivity tomography (ERT), microgravity, and ground-penetrating radar (GPR)—are well-suited for mapping cavities prior to redevelopment [2,16,19,50,51]. Long-term observation using satellite-based InSAR and distributed fibre-optic sensing can detect subtle ground movements and serve as an early-warning system [14,52,53]. Together, these techniques enable the transition from reactive intervention to proactive risk reduction, forming the foundation of a sustainable collapse-mitigation strategy for data-limited heritage cities such as Aleppo.

5.4. Limitations and Future Research Directions

The present study is limited by its borehole coverage, 14 points over 50,000 m2, leaving uncertainty in the exact extent and geometry of cavities between sampling locations. The interpolation of cavity geometry using the Inverse Distance Method (IDM) introduces additional uncertainty, particularly in areas distant from boreholes where data control is weakest. Sensitivity checks varying the weighting exponent (p = 2–4) showed that the general configuration of major cavities remained stable, although local roof elevations varied by up to ±1.5 m. Alternative approaches such as kriging could be explored in future studies if sufficient spatial data become available, enabling a more rigorous quantification of interpolation uncertainty.
Although the interpolated geological model provides a continuous representation of subsurface geometry, confidence in cavity position and overburden thickness decreases markedly in areas remote from boreholes where data control is weakest. These regions may be regarded as uncertainty zones within the present model. Future work should seek to visualise such uncertainties explicitly, for example, through confidence maps or probability envelopes, once a denser borehole and geophysical dataset is available.
Similarly, the finite element models were based on simplified cavity geometries and homogeneous material properties. In reality, chalk strength and fracture patterns vary markedly due to historical excavation methods, localised weathering, and heterogeneous moisture conditions. The assumption of isotropic rock mass behaviour under the Hoek–Brown framework also introduces simplification, as anisotropy associated with joint orientation and discontinuity persistence was not explicitly modelled.
The assumption of isotropic chalk behaviour was based on borehole and field evidence showing closely spaced, variably oriented fractures without a dominant joint direction, allowing the rock mass to be treated as mechanically isotropic at the scale of analysis. This simplification is appropriate for the current data resolution but does not capture possible directional variations in stiffness or strength that could affect localised failure mechanisms. Future analyses incorporating detailed joint-orientation data should consider anisotropic constitutive models to assess the influence of structural fabric on cavity stability.
The numerical analyses were performed under quasi-static assumptions, with time-dependent deterioration represented indirectly through staged reductions in GSI and UCS. Although this approach captures the mechanical threshold behaviour associated with chalk weakening, it does not explicitly model visco-plastic creep or coupled hydraulic–mechanical processes such as progressive dissolution or piping. Future work should incorporate such mechanisms, for example, through time-dependent constitutive models or coupled hydro-mechanical simulations, to better represent long-term degradation and failure progression.
Future research should incorporate high-resolution geophysical mapping to improve spatial resolution, in situ monitoring of deformation and moisture variations within chalk roofs, and probabilistic modelling approaches that explicitly account for uncertainty in geological and geotechnical parameters. Future site characterisation could also benefit from deeper-penetrating methods such as the Transient Electromagnetic Method (TEM), which allows imaging of lithological contrasts to depths of several hundred metres and could enhance understanding of the deeper hydro-geological framework beneath Aleppo. Embedding such advances within hazard management frameworks would align Aleppo with the best international practice and provide a transferable model for risk management in other heritage cities built over weak, cavity-prone rocks.

6. Conclusions

This study delivered the first integrated geotechnical, geological, and numerical assessment of historic chalk cavity collapses in Aleppo, Syria, providing a rare case study from a conflict-affected heritage city where subsurface access and data availability are severely constrained.
Borehole investigations confirmed a highly irregular cavity geometry, with roof thickness varying from over 10 m to complete absence, and significantly variable Rock Quality Designation (RQD) values. The 3D geological model, derived from sparse borehole data using the Inverse Distance Method, successfully delineated major cavities and collapse-prone zones, despite limited data coverage.
Three-dimensional numerical simulations based on this model linked chalk degradation to plausible mechanisms, such as water ingress and long-term weathering. The strength-reduction approach proved particularly effective, with the simulations identifying the specific zones and cavities most prone to failure. The results demonstrated that progressive degradation of chalk strength, particularly a reduction in the Geological Strength Index (GSI) from ~53 to ~47, precipitates abrupt, severe displacements—often exceeding 300 mm—and the formation of upward-propagating plastic zones, delineating collapse-prone zones. These findings are consistent with thresholds identified in the nearby chalk terrains of previous collapse events.
Site inspection confirmed sewer leakage as the principal trigger, while rainfall-driven infiltration and long-term moisture fluctuations are inferred to be additional factors accelerating chalk softening and roof destabilisation. These processes parallel collapse mechanisms documented in other urban settings, such as over soluble rocks and abandoned mines, where drainage failures and hydrological changes act as immediate catalysts for instability.
The methodology applied here offers a transferable framework for hazard assessment in data-limited urban settings. It can be readily adapted to other heritage cities characterised by similar weak-rock and cavity-prone geological settings. Despite the insights gained, the study is limited by the sparse borehole coverage and the use of simplified cavity geometries in numerical models. Future work should incorporate high-resolution geophysical surveys to refine cavity mapping, in situ monitoring to track degradation rates, and probabilistic modelling to account for uncertainty in material properties and geometry explicitly. Integrating these advances into municipal planning frameworks will improve resilience against sudden ground collapse in historic urban environments.
Author Contributions

Conceptualisation, A.K. and O.H.; methodology, A.K. and O.H.; software, H.M.B.A.-H.; validation, A.K. and O.H.; formal analysis, H.M.B.A.-H.; investigation, A.K. and O.H.; data curation, A.K. and O.H.; writing—original draft preparation, A.K. and O.H.; writing—review and editing, O.H.; visualisation, O.H. and A.K.; supervision, O.H. All authors have read and agreed to the published version of the manuscript.

Funding

The site investigation was funded by Aleppo Local Council (project number AL370-98).

Data Availability Statement

The original contributions presented in this study are included in the article. Further inquiries can be directed to the corresponding author.

Conflicts of Interest

The authors declare no conflicts of interest.

References

  1. McDowell, P.W.; Coulton, J.; Edmonds, C.N.; Poulsom, A.J. The Nature, Formation and Engineering Significance of Sinkholes Related to Dissolution of Chalk in SE Hampshire, England. Q. J. Eng. Geol. Hydrogeol. 2008, 41, 279–290. [Google Scholar] [CrossRef]
  2. Hussain, Y.; Uagoda, R.; Borges, W.; Prado, R.; Hamza, O.; Cárdenas-Soto, M.; Havenith, H.-B.; Dou, J. Detection of Cover Collapse Doline and Other Epikarst Features by Multiple Geophysical Techniques, Case Study of Tarimba Cave, Brazil. Water 2020, 12, 2835. [Google Scholar] [CrossRef]
  3. Edmonds, C.N. Karst and Mining Geohazards with Particular Reference to the Chalk Outcrop, England. Q. J. Eng. Geol. Hydrogeol. 2008, 41, 261–278. [Google Scholar] [CrossRef]
  4. Gutiérrez, F.; Parise, M.; De Waele, J.; Jourde, H. A Review on Natural and Human-induced Geohazards and Impacts in Karst. Earth-Sci. Rev. 2014, 138, 61–88. [Google Scholar] [CrossRef]
  5. Youssef, A.M.; Al-Harbi, H.M.; Gutiérrez, F.; Zabramwi, Y.A.; Bulkhi, A.B.; Zahrani, S.A.; Bahamil, A.M.; Zahrani, A.J.; Otaibi, Z.A.; El-Haddad, B.A. Natural and Human-induced Sinkhole Hazards in Saudi Arabia: Distribution, Investigation, Causes and Impacts. Hydrogeol. J. 2015, 24, 625–644. [Google Scholar] [CrossRef]
  6. Lafrance, N.; Labiouse, V.; Souley, M. Aging-induced Deformation of Chalk Rocks in Underground Quarries. In Proceedings of the ISRM Congress 2015 Proceedings—Int’l Symposium on Rock Mechanics, Montreal, QC, Canada, 10–14 May 2015; p. 11. [Google Scholar]
  7. Souley, M.; Auvray, C.; Lafrance, N.; Watelet, J.M.; Renaud, V. Long Term Behavior of a Chalk: Effect of Hygrometry and Flooding. In Proceedings of the 14th International Congress of Rock Mechanics (ISRM 2019), Foz do Iguaçu, Brazil, 13–18 September 2019. [Google Scholar]
  8. Bell, F.G.; Stacey, T.R.; Genske, D.D. Mining Subsidence and Its Effect on the Environment: Some Differing Examples. Environ. Geol. 2000, 40, 135–152. [Google Scholar] [CrossRef]
  9. Tharp, T.M. Mechanics of Upward Propagation of Cover-collapse Sinkholes. Eng. Geol. 1999, 52, 23–33. [Google Scholar] [CrossRef]
  10. Sahu, P.; Lokhande, R. An Investigation of Sinkhole Subsidence and Its Preventive Measures in Underground Coal Mining. Procedia Earth Planet. Sci. 2015, 11, 63–75. [Google Scholar] [CrossRef]
  11. Augarde, C.E.; Lyamin, A.V.; Sloan, S.W. Prediction of Undrained Sinkhole Collapse. J. Geotech. Geoenviron. Eng. 2003, 129, 197–205. [Google Scholar] [CrossRef]
  12. Al Heib, M.; Duval, C.; Theoleyre, F.; Watelet, J.M.; Gombert, P. Analysis of the Historical Collapse of an Abandoned Chalk Mine in 1961 in Clamart (Paris, France). Bull. Eng. Geol. Environ. 2015, 74, 1001–1018. [Google Scholar]
  13. Georgieva, T.; Descamps, F.; Gonze, N.; Vandycke, S.; Ajdanlijsky, G.; Tshibangu, J.P. Stability Assessment of a Shallow Abandoned Chalk Mine of Malogne (Belgium). Eur. J. Environ. Civ. Eng. 2023, 27, 2358–2372. [Google Scholar] [CrossRef]
  14. Xu, J.; He, B.; Zhang, L. Collapse Prediction of Karst Sinkhole via Distributed Brillouin Optical Fiber Sensor. Measurement 2017, 100, 68–71. [Google Scholar] [CrossRef]
  15. Orhan, O.; Yakar, M.; Ekercin, S. An Application on Sinkhole Susceptibility Mapping by Integrating Remote Sensing and Geographic Information Systems. Arab. J. Geosci. 2020, 13, 886. [Google Scholar] [CrossRef]
  16. Liu, R.; Sun, H.; Qin, J.; Zheng, Z. A Multi-Geophysical Approach to Assess Potential Sinkholes in an Urban Area. Eng. Geol. 2023, 318, 107100. [Google Scholar] [CrossRef]
  17. Puzzilli, L.M.; Ruscito, V.; Madonna, S.; Gentili, F.; Ruggiero, L.; Ciotoli, G.; Nisio, S. Natural Sinkhole Monitoring and Characterization: The Case of Latera Sinkhole (Latium, Central Italy). Geosciences 2024, 14, 18. [Google Scholar] [CrossRef]
  18. Jordá-Bordehore, L.; Martín-García, R.; Alonso-Zarza, A.M.; Jordá-Bordehore, R.; Romero-Crespo, P.L. Stability Assessment of Shallow Limestone Caves through an Empirical Approach: Application of the Stability Graph Method to the Castanar Cave Study Site (Spain). Bull. Eng. Geol. Environ. 2016, 75, 1469–1483. [Google Scholar] [CrossRef]
  19. Fasani, G.B.; Bozzano, F.; Cardarelli, E.; Cercato, M. Underground Cavity Investigation within the City of Rome (Italy): A Multi-Disciplinary Approach Combining Geological and Geophysical Data. Eng. Geol. 2013, 152, 109–121. [Google Scholar] [CrossRef]
  20. Miola, M.; Cabiddu, D.; Pittaluga, S.; Mortara, M.; Zuccolini, M.V.; Imitazione, G. A Computational Approach for 3D Modeling and Integration of Heterogeneous Geo-Data. Comput. Graph. 2022, 105, 105–118. [Google Scholar] [CrossRef]
  21. Lollino, P.; Martimucci, V.; Parise, M. Geological Survey and Numerical Modeling of the Potential Failure Mechanisms of Underground Caves. Geosyst. Eng. 2013, 16, 100–112. [Google Scholar] [CrossRef]
  22. Trigueros, E.; Cánovas, M.; Arzúa, J.; Alcaraz, M. Stability of an Abandoned Siderite Mine: A Case Study in Northern Spain. Open Geosci. 2021, 13, 359–376. [Google Scholar] [CrossRef]
  23. Alrabayah, O.; Caus, D.; Watson, R.A.; Schulten, H.Z.; Weigel, T.; Rüpke, L.; Al-Halbouni, D. Deep-Learning-Based Automatic Sinkhole Recognition: Application to the Eastern Dead Sea. Remote Sens. 2024, 16, 2264. [Google Scholar] [CrossRef]
  24. Taheri, K.; Shahabi, H.; Chapi, K.; Shirzadi, A.; Gutiérrez, F.; Khosravi, K. Sinkhole Susceptibility Mapping: A Comparison between Bayes-based Machine Learning Algorithms. Land Degrad. Dev. 2019, 30, 730–745. [Google Scholar] [CrossRef]
  25. Muili, O.; Babaie, H.A. Sinkhole Susceptibility Analysis Using Machine Learning for West Central Florida. Appl. Comput. Geosci. 2025, 27, 100262. [Google Scholar] [CrossRef]
  26. Zhu, J.; Nolte, A.M.; Jacobs, N.; Ye, M. Using Machine Learning to Identify Karst Sinkholes from LiDAR-Derived Topographic Depressions in the Bluegrass Region of Kentucky. J. Hydrol. 2020, 588, 125049. [Google Scholar] [CrossRef]
  27. Perrotti, M.; Lollino, P.; Fazio, N.L.; Pisano, L.; Vessia, G.; Parise, M.; Fiore, A.; Luisi, M. Finite Element–Based Stability Charts for Underground Cavities in Soft Calcarenites. Int. J. Geomech. 2018, 18, 4018071. [Google Scholar] [CrossRef]
  28. Perrotti, M.; Lollino, P.; Fazio, N.L.; Parise, M. Stability Charts Based on the Finite Element Method for Underground Cavities in Soft Carbonate Rocks: Validation through Case-Study Applications. Nat. Hazards Earth Syst. Sci. 2019, 19, 2079–2095. [Google Scholar] [CrossRef]
  29. Fazio, N.L.; Perrotti, M.; Lollino, P.; Parise, M.; Vattano, M.; Madonia, G.; Di Maggio, C. A three-dimensional back-analysis of the collapse of an underground cavity in soft rocks. Eng. Geol. 2017, 228, 301–311. [Google Scholar] [CrossRef]
  30. UN-Habitat. City Profile Aleppo: Multi Sector Assessment; UN-Habitat: Damascus, Syria, 2014; Available online: https://unhabitat.org/sites/default/files/documents/2019-05/aleppo_city_profile.pdf (accessed on 20 April 2025).
  31. Alex, R. The Natural History of Aleppo, 1st ed.; G.G. and J. Robinson: London, UK, 1794. [Google Scholar]
  32. Ali, E. Studying the Effect of Underground Cavities on the Stability of Buildings in Aleppo; University of Aleppo: Aleppo, Syria, 2015. [Google Scholar]
  33. Ministry of Petroleum and Mineral Resources (Syria). Geological Map of Syria. Available online: https://catalog.library.cornell.edu/catalog/1034488 (accessed on 20 April 2025).
  34. Almohamad, H.H.; Knaack, A.; Habib, B. Assessing Spatial Equity and Accessibility of Public Green Spaces in Aleppo City, Syria. Forests 2018, 9, 706. [Google Scholar] [CrossRef]
  35. Brew, G.; Barazangi, M.; Khaled Al-Maleh, A.; Sawaf, T. Tectonic and Geologic Evolution of Syria. GeoArabia 2001, 6, 573–616. [Google Scholar] [CrossRef]
  36. Abo, R.; Merkel, B. Hydrostratigraphic Modeling of the Central and Southwestern Part of Aleppo Basin, Al Zebra Catchment Area, Syria. Freib. Online Geosci. 2015, 41, 1–32. [Google Scholar]
  37. Abo, R.; Merkel, B. Comparative estimation of the potential groundwater recharge in Al Zerba catchment of Aleppo basin, Syria. Arab. J. Geosci. 2015, 8, 1339–1360. [Google Scholar] [CrossRef]
  38. Strzałkowski, P. Sinkhole Formation Hazard Assessment. Environ. Earth Sci. 2018, 78, 9. [Google Scholar] [CrossRef]
  39. RockWare. RockWorks User Manual; RockWare Inc.: Golden, CO, USA, 2020. [Google Scholar]
  40. Das, B.M.; Sobhan, K. Principles of Geotechnical Engineering; Nelson Engineering: Merritt Island, FL, USA, 2006. [Google Scholar]
  41. Terzaghi, K.; Peck, R.B.; Mesri, G. Soil Mechanics in Engineering Practice; John Wiley & Sons: Hoboken, NJ, USA, 1996; ISBN 0471086584. [Google Scholar]
  42. Hoek, E.; Carranza-Torres, C.; Corkum, B. Hoek-Brown Failure Criterion, 2002 Edition. Proc. NARMS-Tac 2002, 1, 267–273. [Google Scholar]
  43. Singh, B.; Goel, R.K. Tunnelling in Weak Rocks; Elsevier Geo-Engineering Book Series; Elsevier: Amsterdam, The Netherlands, 2011; Volume 5. [Google Scholar]
  44. Hoek, E. Surface and Underground Project Case Histories: Comprehensive Rock Engineering Studies; Elsevier: Oxford, UK, 2017. [Google Scholar]
  45. Hoek, E.; Marinos, P.; Benissi, M. Applicability of the Geological Strength Index (GSI) Classification for Very Weak and Sheared Rock Masses. The Case of Athens Schist Formation. Bull. Eng. Geol. Environ. 1998, 57, 151–160. [Google Scholar] [CrossRef]
  46. Bentley Systems. PLAXIS 3D, Version V2024.3; Bentley Systems International Ltd.: Dublin, Ireland, 2024. [Google Scholar]
  47. Peck, W.A.; Sainsbury, D.P.; Lee, M.F. The Importance of Geology and Roof Shape on the Stability of Shallow Caverns. Aust. Geomech. 2013, 48, 51–60. [Google Scholar]
  48. Hamza, O.; Bellis, A. Gault Clay Embankment Slopes on the A14—Case Studies of Shallow and Deep Instability. In Advances in Transportation Geotechnics; CRC Press: London, UK, 2008; pp. 307–316. [Google Scholar]
  49. Sartain, N.; Mian, J.; O’Riordan, N.; Storry, R. Case Study on the Assessment of Sinkhole Risk for the Development of Infrastructure over Karstic Ground. In Proceedings of the Third International Symposium on Geotechnical Safety and Risk (ISGSR 2011), Munich, Germany, 2–3 June 2011; pp. 635–642. [Google Scholar]
  50. Hussain, Y.; Campos, J.E.G.; Borges, W.R.; Uagoda, R.E.S.; Hamza, O.; Havenith, H.-B. Hydrogeophysical Characterization of Fractured Aquifers for Groundwater Exploration in the Federal District of Brazil. Appl. Sci. 2022, 12, 2509. [Google Scholar] [CrossRef]
  51. Hussain, Y.; Hussain, S.M.; Martino, S.; Cardenas-Soto, M.; Hamza, O.; Rodriguez-Rebolledo, J.F.; Uagoda, R.; Martinez-Carvajal, H. Typological Analysis of Slidequakes Emitted from Landslides: Experiments on an Expander Body Pile and Sobradinho Landslide (Brasilia, Brazil). REM-Int. Eng. J. 2019, 72, 453–460. [Google Scholar] [CrossRef]
  52. Ferentinou, M.; Grobler, M.; Malinowska, A.; Farina, P.; Yumba, J. Smart Monitoring & Early Warning System of Sinkhole with Fibre Optic Sensors and InSAR; Water Research Commission: Pretoria, South Africa, 2023. [Google Scholar]
  53. Zhukabayeva, T.; Zholshiyeva, L.; Mardenov, Y.; Buja, A.; Khan, S.; Alnazzawi, N. Real-Time Detection and Response to Wormhole and Sinkhole Attacks in Wireless Sensor Networks. Technologies 2025, 13, 348. [Google Scholar] [CrossRef]
Figure 1. (a) Map of Syria showing the location of Aleppo, where the site is located—based on OpenStreetMap; (b) geological map of the city— redrawn from the geological map of Syria [33].
Geohazards 06 00075 g001
Figure 2. Photos taken for some of the sites affected by sinkholes in Aleppo over the last three decades: (a) building collapse at Tallet Alsauda following a sinkhole event; (b) excavation leading to one of the caves in Haydaria; (c) ground cavity and cracking developed along a street surface in Kalasa; (d) subsidence affecting residential buildings near the old city wall.
Geohazards 06 00075 g002
Figure 3. Cavities in Tallet Alsauda: (a) the southern inlet of one of the existing cavities and (b) cracks in the cavity roof.
Geohazards 06 00075 g003
Figure 4. Borehole layout and topography of the Tallet Alsauda study area, Aleppo. Contour lines (orange–red) indicate ground-surface elevation; green and blue lines represent property and drainage boundaries, respectively. Grey areas show existing buildings and paved surfaces. “BH” marks borehole locations (BH1–BH14) drilled for lithological logging, cavity detection, and sampling.
Geohazards 06 00075 g004
Figure 5. Samples from boreholes BH3 and BH10 illustrating a low RQD index in the chalk layer.
Geohazards 06 00075 g005
Figure 6. Conceptual illustration of the Inverse Distance Method (IDM). (Left) Spatial arrangement of control points (red symbols) and grid nodes (black dots): red symbols indicate borehole locations used as input for interpolation, while black dots mark nodes where interpolated values are calculated. (Right) decay curve showing the reduction in influence (weight) of each point with increasing distance when p = 3.
Geohazards 06 00075 g006
Figure 7. Workflow for transferring the geological model into the numerical modelling environment. Note: The figure shows the transfer process to create one geological layer.
Geohazards 06 00075 g007
Figure 8. Three-dimensional numerical model configuration: (Left)—overall model domain showing element density; (Right)—the five cavity zones within the model.
Geohazards 06 00075 g008
Figure 9. Borehole schematic showing voids (in white colour), chalk (in yellow), silty clay (blue), and made ground/random fill (grey). “BH” denotes borehole identification numbers used in the site investigation.
Geohazards 06 00075 g009
Figure 10. Conceptual geology model of the studied area based on the boreholes (model rescaled). “BH” refers to borehole numbers assigned during the site investigation.
Geohazards 06 00075 g010
Figure 11. (a) Borehole (BHs) positions and section alignments shown in (bd) and illustrating variation in chalk thickness and cavity geometry. Colours show units: grey—random fill; green—silty clay; yellow—chalk; white—cavity. Numbers 1–4 indicate the lithological units: (1) random fill, (2) silty clay, (3) chalk top, (4) chalk bottom. Note: All axes are in meters. The vertical axis represents elevation (m), and the horizontal axis represents distance (m) along the section.
Geohazards 06 00075 g011
Figure 12. Relationship between the maximum total displacement (recorded above Cave 5) and GSI reduction. Blue circles represent simulation results. The dashed line shows the general trend of increasing displacement with decreasing GSI. Arrows highlight key GSI thresholds where behaviour changes e.g., predicted cavity collapse at GSI = 47.
Geohazards 06 00075 g012
Figure 13. Total displacement contours development in the five cavity zones over three selected stages as the GSI was reduced: (a) 61.91, (b) 58.94, and (c) 55.97.
Geohazards 06 00075 g013
Figure 14. Total vertical displacement (m) through Cave 5 at the collapse threshold (GSI = 47). The arrow marks the cross-section location through Cave 5 shown in the upper inset.
Geohazards 06 00075 g014
Table 1. Geotechnical properties of the three principal strata.
Materialγ (kN/m3)ϕ (°)c (kPa)E (MPa)UCS (MPa)RQD (%)
Random Fill17.6 (0.61)36 (1.82)2.6 (0.92)21 *
Silty Clay18.0 (0.36)19 (1.63)5.8 (0.87)32 *
Chalk21.2 (0.65)913 (271)11.68 (2.98)47.9 (29.7)
* estimated from previous studies of similar types of soils [40,41].
Table 2. Borehole stratigraphy and cavity details across the Tallet Alsauda site.
Thickness (m)BH1BH2BH3BH4BH5BH6BH7BH8BH9BH10BH11BH12BH13BH14
Random Fill22.10.522.8322.2332.51.83
Silty Clay7.57.569.55.76.54.56.39.59139.28.510.5
Chalk-Top15.515.510.52.516.548.816.537.501468
Cavity41144.533222.5
Chalk-Bottom427.55.26.52.57.55.54
Borhole depth25.424.925.226.925.125.025.025.225.025.124.925.225.325.1
Table 3. The reduced parameters used in Hoek–Brown model for the chalk.
Reduced ParameterUpper Bound (Initial Value)Mean ValueLower Bound *Reduced Value (at Collapse) Reduction Ratio
UCS (MPa)14.6611.688.7210.6927%
GSI67.8553.0038.1547.0630%
* The lower-bound properties are concentrated near the previous sinkhole event.
Disclaimer/Publisher’s Note: The statements, opinions and data contained in all publications are solely those of the individual author(s) and contributor(s) and not of MDPI and/or the editor(s). MDPI and/or the editor(s) disclaim responsibility for any injury to people or property resulting from any ideas, methods, instructions or products referred to in the content.