Article

MiMapper: A Cloud-Based Multi-Hazard Mapping Tool for Nepal

1
Department of Geography and Earth Sciences, Aberystwyth University, Aberystwyth SY23 3DB, UK
2
Reynolds Geo-Solutions Ltd., Mold CH5 3XP, UK
3
Department of Environmental Science and Engineering, Kathmandu University, Dhulikhel P.O. Box 6250, Nepal
*
Author to whom correspondence should be addressed.
GeoHazards 2025, 6(4), 63; https://doi.org/10.3390/geohazards6040063
Submission received: 31 July 2025 / Revised: 23 September 2025 / Accepted: 24 September 2025 / Published: 3 October 2025

Abstract

Nepal is highly susceptible to natural hazards, including earthquakes, flooding, and landslides, all of which may occur independently or in combination. Climate change is projected to increase the frequency and intensity of these natural hazards, posing growing risks to Nepal’s infrastructure and development. To the authors’ knowledge, the majority of existing geohazard research in Nepal is typically limited to single hazards or localised areas. To address this gap, MiMapper was developed as a cloud-based, open-access multi-hazard mapping tool covering the full national extent. Built on Google Earth Engine and using only open-source spatial datasets, MiMapper applies an Analytical Hierarchy Process (AHP) to generate hazard indices for earthquakes, floods, and landslides. These indices are combined into an aggregated hazard layer and presented in an interactive, user-friendly web map that requires no prior GIS expertise. MiMapper uses a standardised hazard categorisation system for all layers, providing pixel-based scores for each layer between 0 (Very Low) and 1 (Very High). The modal and mean hazard categories for aggregated hazard in Nepal were Low (47.66% of pixels) and Medium (45.61% of pixels), respectively, but there was high spatial variability in hazard categories depending on hazard type. The validation of MiMapper’s flooding and landslide layers showed an accuracy of 0.412 and 0.668, sensitivity of 0.637 and 0.898, and precision of 0.116 and 0.627, respectively. These validation results show strong overall performance for landslide prediction, whilst broad-scale exposure patterns are predicted for flooding but may lack the resolution or sensitivity to fully represent real-world flood events. Consequently, MiMapper is a useful tool to support initial hazard screening by professionals in urban planning, infrastructure development, disaster management, and research. It can contribute to a Level 1 Integrated Geohazard Assessment as part of the evaluation for improving the resilience of hydropower schemes to the impacts of climate change. MiMapper also offers potential as a teaching tool for exploring hazard processes in data-limited, high-relief environments such as Nepal.

1. Introduction

As climate change intensifies, the severity and frequency of geological hazards (e.g., landslides and earthquakes) and hydrological hazards (e.g., flooding and Glacial Lake Outburst Floods (GLOFs)), collectively referred to as ‘natural hazards’ hereafter, are predicted to rise in high mountain environments such as in Nepal [1]. Vulnerability to such natural hazards will also be exacerbated by social and economic instability in Nepal, most notably due to poorly developed infrastructure, widespread poverty, marginalisation, and high population density in physically vulnerable areas [2].
Nepal is a landlocked Himalayan country bordered by India to the east, west and south, and the Tibetan region of China to the north. It spans the Terai plains, Siwalik Hills, Middle and High Mountains, and the High Himalaya, rising from ~100–200 m to >8000 m and including eight of the world’s ten highest peaks (Everest 8848 m) [3]. A summer monsoon (June–September) delivers about 70–85% of annual rainfall with strong windward–leeward and east–west gradients; winter westerly disturbances add snow and rain, especially in the northwest. The country has 6000+ perennial rivers; the Mahakali, Karnali, Gandaki and Koshi basins are snow- and glacier-fed, carry ~75% of annual discharge during the monsoon, and drain to the Ganges [3,4]. Deglaciation is expected to alter river hydrology, enlarge glacial lakes and increase outburst-flood risk [1,5,6,7]. Most people live in rural areas with livelihoods centred on agriculture and tourism [2]; irrigation covers only a small area, and large hydropower potential (~83,000 MW) remains mostly undeveloped (~620 MW installed) [3].
Nepal is physically susceptible to a wide variety of natural hazards, and this study focuses on three of the most physically disruptive and lethal: flooding, earthquakes, and landslides [8,9]. While Glacial Lake Outburst Floods (GLOFs) can be extremely devastating and cause loss of life, they occur infrequently. The location of Nepal within the Himalayan Mountain belt, on an active convergent plate boundary between the Indian and Eurasian tectonic plates, results in a highly river unstable geological setting conducive to frequent and sometimes high-magnitude earthquake events [10,11]. An example of a high-magnitude earthquake that caused widespread damage in addition to loss of life and infrastructure was the 7.8 magnitude Gorkha Earthquake in April 2015 [12,13], which also triggered numerous landslide events (e.g., Langtang landslide, [14,15]). Furthermore, high uplift rates and erosion rates, unstable topography, and steep terrain make the country highly vulnerable to landslides [16], with more than 10% of global rainfall-triggered landslides with fatalities occurring in Nepal [17].
Alongside the geological setting of Nepal, the country also experiences intense rainfall during the monsoon season (June to September annually), which results in frequent heavy precipitation and cloud-burst events that cause river flooding and trigger landslides [18]. Whilst monsoon precipitation is integral to the economy through hydropower energy generation and crop irrigation, the intense precipitation can also overwhelm the hydrological network of Nepal and cause severe flooding. Such events can damage or destroy infrastructure and crops, and pose a threat to livelihoods, homes, and businesses [2]. An example of such an event was the Bagmati flooding event in September 2024, which impacted 2.59 million people and caused economic losses exceeding 1% of Nepal’s GDP [19].
Societal vulnerability to natural hazards is also high in Nepal due to widespread poverty and poorly developed infrastructure [20], highlighted by Nepal’s status as one of the Least Developed Countries (LDC) according to the United Nations. This societal vulnerability is exacerbated by factors including land use change, population growth in vulnerable areas (mountain populations grew by 16% between 2000 and 2012), and a lack of settlement planning [21,22]. Spatial overlap between societal vulnerability and physical vulnerability in Nepal is common, which leads to regions with extensive risk from natural hazards [21]—though it should be noted that risk is referring only to mapping where both societal and physical exposure have been considered.
One physical event (such as a cloudburst) can trigger other physical processes (such as landslides) into a cascade of multi-phase interconnected processes, referred to as a multi-hazard event [6]. For example, glacial retreat caused by climate change, coupled with thawing permafrost, may increase the likelihood of a Glacial Lake Outburst Flood (GLOF) through the formation of proglacial lakes and debuttressing of adjacent hill slopes. As landscapes are destabilised by glacier recession, this can also trigger landslides and exacerbate downstream flooding [5,23]. Despite clear evidence for cascading natural hazard events (e.g., the 2015 Gorkha earthquake, triggering landslides and avalanches), and a developed understanding of the mechanisms by which natural hazards are interlinked, the majority of natural hazard research predominantly focuses on exploring the potential of single events (e.g., an individual flood event) in a localised region (e.g., [15]). Where multi-hazards are explored, local studies (e.g., [21,22]) have been valuable for explaining processes within single valleys and catchments—including well-documented earthquake–landslide cascades such as the 2015 Gorkha event—but their restricted footprints limit inference to the regional scales at which such cascades often operate [10,20,23]. Whilst multi-hazard mapping has been completed for some regions of Nepal (e.g., [21]), current country-wide hazard maps [16,24] provide useful coverage of individual hazards (e.g., flooding or landslides) but, unlike the local multi-hazard work (e.g., Gorkha-type cascades), they do not represent cascading or coincident interactions.
One notable exception is the METEOR Explorer project, which provided the first nationwide multi-hazard overview for Nepal through the Modelling Exposure Through Earth Observation Routines project, funded by the UK Space Agency [24]. METEOR is easy to access and uses a colour coding system for hazard intensity. However, its requirement for a login, non-transparent input layers, and lack of self-explanatory maps make interpretation more challenging and limit its audience. The absence of accessible documentation further reduces its intuitive use. MiMapper partially addresses these limitations by using an intuitive method and focuses on developing its users’ understanding on the topic of hazards and aggregated hazards. Additionally, it does not require anything except the URL to access all layers and the documentation, enabling all users to compare hazards spatially at a pixel level across Nepal.
This type of mapping can contribute to components of a Level 1 overview Integrated Geohazard Assessment of entire river basins to help identify hazard scenarios involving multi-phase physical processes [7].
Hazard and multi-hazard maps often rely on closed-source data, or they require software or computer power for development or use (e.g., [25]). Many such maps also require a stable, high-speed internet connection that enables downloading or real-time visualisation of high-resolution data (e.g., [26,27]). Where online multi-hazard tools do exist, they often require supporting information to apply them effectively (e.g., [24]). These factors are often barriers to people in low-income countries, such as Nepal, accessing and interrogating hazard and multi-hazard information. However, with an ever-growing hydropower sector and a rapidly developing infrastructure throughout the country, such access by planning and engineering professionals is critical to the safe and resilient development of the country.
MiMapper looks to provide a solution to the acute need for multi-hazard information through exclusively open-access data and an easy-to-access interface with no downloading or login requirements. Such an approach allows researchers and professionals to undertake concurrent multi-hazard analysis autonomously.

2. Materials and Methods

2.1. Data Sources and Preprocessing
MiMapper uses Google Earth Engine (GEE), an online Geospatial Information Service (GIS) platform (accessed October 2024–July 2025). The platform contains a large catalogue of freely available satellite imagery and geospatial datasets that are freely available for interrogation. GEE enables geospatial processing at scale, powered by the Google Cloud Platform. It provides an interactive platform for geospatial algorithm development, to enable high-impact, data-driven science and make substantive progress on global challenges that involve large geospatial datasets.
MiMapper uses the processing power provided by Google so that individual users do not need their own local processing power. It uses datasets that are freely available in GEE, in addition to other freely available datasets added specifically for the tool. Datasets were collected and pre-processed using one of three methods that were dictated by the size, source, and availability of the dataset. Data were either: (a) imported directly into the Google Earth Engine (GEE) environment from the GEE data catalogue and processed using the method outlined in Figure 1; (b) imported into GEE from either the data catalogue or an external source for preprocessing before being put through the method; or (c) imported into the GIS programme QGIS for preprocessing before being imported into GEE.
MiMapper consists of four main hazard maps: (1) Earthquake hazard; (2) Landslide hazard; (3) (Pluvial) flooding hazard; and (4) Aggregated hazard (earthquake, landslide, and flooding hazard combined). Each hazard map comprises multiple datasets, which are each formed of ‘layers’. Each layer has been processed to provide hazard-specific information, with each layer being sourced and pre-processed using one of the four methods outlined previously. The source, date of data acquisition, and method of pre-processing for each layer are outlined in Table A1.
The earthquake hazard, earthquake vulnerability, physical exposure, and the earthquake risk layers were sourced from [28,29]. All remaining layers were sourced and processed following the method outlined by [30], which focused on the Kathmandu Valley, and consequently applied to the full extent of Nepal.
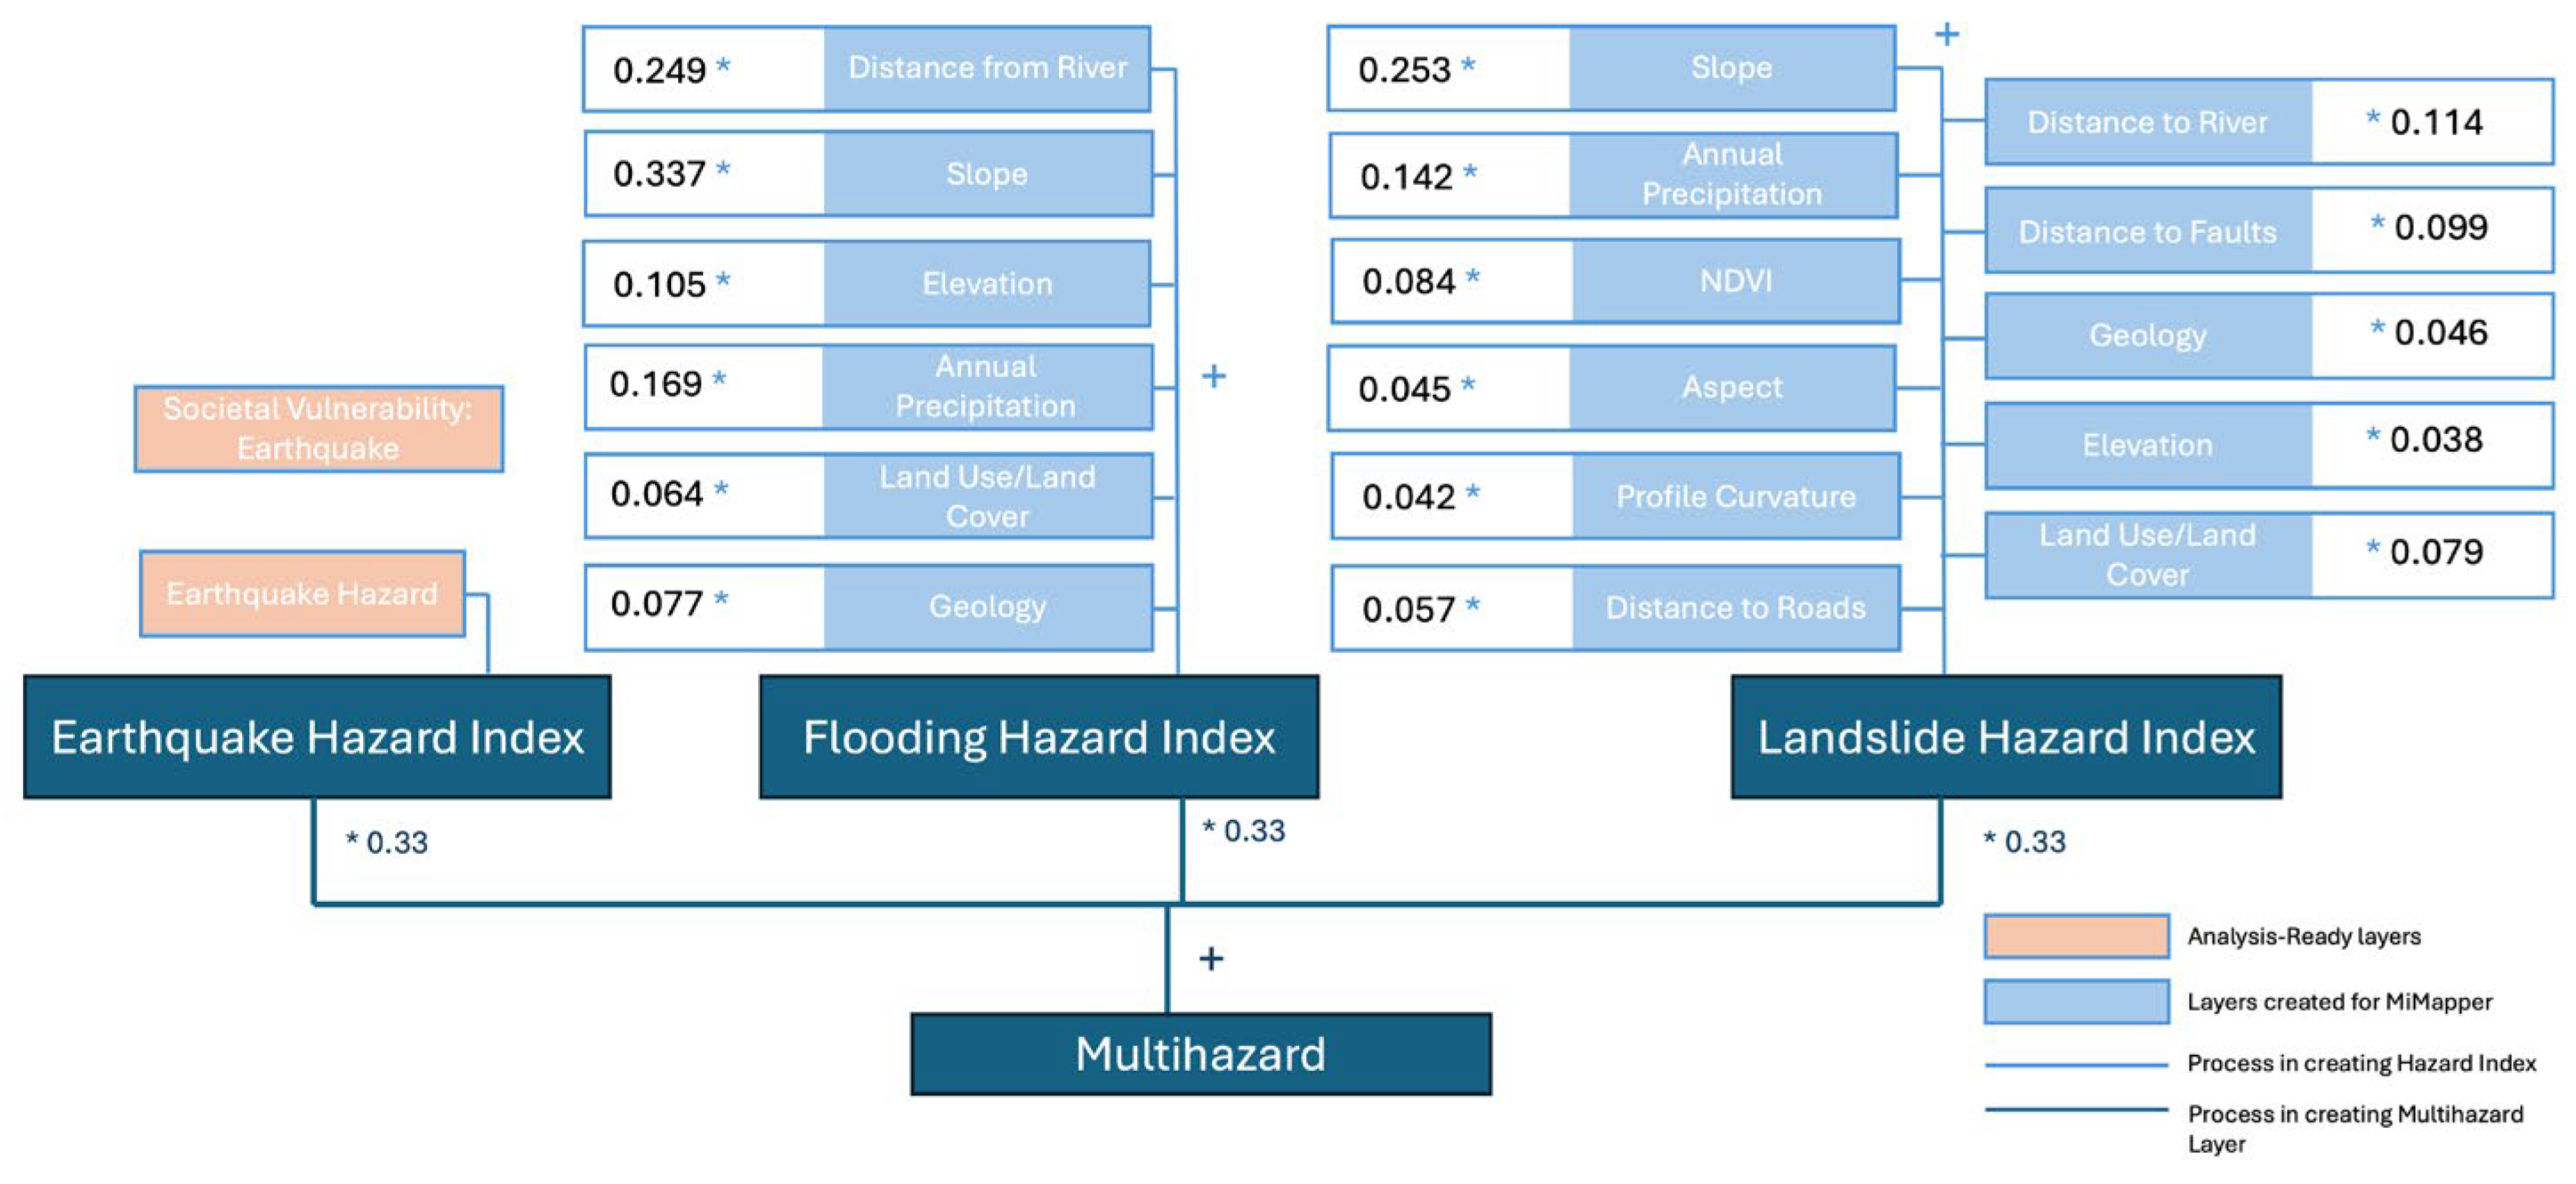
Figure 1. MiMapper’s Analytical Hierarchy Process, with input factor layers at the top, leading to the final multi-hazard layer at the bottom. The layers used to produce the hazard maps/indexes are shown in light blue alongside their respective hazard weightings. The resulting hazard weightings are subsequently aggregated to produce the Hazard maps/indexes in dark blue. Each of these maps/indexes is multiplied (*) by 0.33 and summed (+) to create a Multi-hazard Map/Aggregated Hazard Index. Earthquake Hazard and Social Vulnerability were both Analysis-Ready layers derived from [29] and so are classified differently in this schematic.
Geohazards 06 00063 g001
Landcover and elevation were imported from the GEE data catalogue in the form of the European Space Agency’s WorldCover 10 m dataset from 2021 and the Shuttle Radar Topography Mission (SRTM) digital elevation model at 30 m resolution, respectively. These data were imported into MiMapper with no need for additional processing.
The layers: slope, aspect, profile curvature, and annual precipitation required minor preprocessing prior to use. This involved importing the SRTM DEM dataset from GEE’s repository, extracting elevation from this, and calculating the slope and aspect from the elevation dataset using GEE’s inbuilt algorithms before clipping the layers to Nepal’s extent. Profile Curvature was first calculated by applying a smoothing Gaussian filter to the elevation dataset, and the Terrain Analysis in Google Earth Engine (TAGEE) library (which holds custom GEE functions) was then used to calculate the vertical curvature. Annual Precipitation was added from the Climate Hazards Center InfraRed Precipitation with Station (CHIRPS) data sourced through GEE’s data repository with the precipitation values per pixel summed to give total precipitation for 2023. Whilst multi-year climatological averages are often used, we focused on 2023 to provide consistency with other hazard predictors (e.g., elevation, NDVI) that were also represented as single-snapshot indices rather than long-term climatology.
The Normalised Difference Vegetation Index (NDVI) was produced by the authors. The Landsat 9 Analysis Ready archive (30 m resolution) within GEE was first filtered for data collected between the 1 January 2023 and 1 January 2024, and for images covering at least part of Nepal. The data was then filtered for Cloud Cover, scaled, and the images with the least cloud cover were used. A total of 372 images were used for complete coverage of Nepal. Each pixel was stacked, and the median value of each pixel (and each band) were taken and used to create an image composite. The minimum and maximum number of pixels from which a median was taken were 18 and 68, respectively. From the median composite, the Near-Infrared (NIR) and red wavelength bands were isolated and the NDVI was calculated using Equation (1).
NDVI = (NIR − Red)/(NIR + Red)
NDVI results were set between −1 and 1, with −1 being no vegetation, and 1 being abundant healthy vegetation. NDVI thresholds were set conservatively. NDVI > 0.6 [31] was assigned to Low hazard (0.25) rather than Very Low because NDVI is a proxy for vegetation density that saturates in closed canopies and does not capture rooting depth, stand age, or soil anchorage [32,33]. This approach avoids overstating stability where dense vegetation co-occurs with steep, thin soils or disturbed terrain. The resulting NDVI layer was then used within the landslide hazard map.
The Distance to Road and Distance to River layers did not exist in GEE’s data catalogue. Thus, these were sourced externally from OpenStreetMap and processed in QGIS using buffer and simplify algorithms before uploading into the GEE environment. A series of buffers of 100–200 m intervals up to 600 m were applied to the Distance to Road layer, following the methodology of [30]. A series of buffers of 100 m intervals up to 400 m were applied to the Distance to River layer, following the methodology of [30].
Geology and Distance to Faults were also not available within GEE’s data catalogue, so were sourced externally from the United States Geological Society (USGS) compiled geological map of Nepal, initially developed for the purpose of the World Energy Project [34]. Initially, the USGS-derived dataset was visually compared with the Department of Mines and Geology, Government of Nepal’s comparable dataset, which is not publicly available for download, for validation. Upon confirmation that the fault placement and geological boundaries were consistent between maps, the USGS-derived dataset was interrogated in QGIS. The categories used in the USGS-derived map (e.g., Quaternary, Neogene, Triassic Metamorphic Sedimentary Rocks) were reclassified into 3 categories: Hard Rock, Consolidated Rock, and Unconsolidated Sediments, following the method outline by [30]. Igneous and metamorphic rock types were reclassified as Hard Rock, sedimentary rock types as Consolidated Rock, and Neogene and Quaternary Sediments as Unconsolidated Sediments. Distance to Faults was also manually extracted from the USGS-derived dataset in QGIS using the select and buffer tools, with buffers of 200 m up to 800 m applied following the methodology of [30]. Both layers were then exported from QGIS and imported into GEE. Finally, all datasets were clipped to the geographical border of Nepal, as defined by the Government of Nepal [35].

2.2. Analytical Hierarchy Process (AHP)

Analytical Hierarchy Process (AHP) is a multi-criteria decision-making method. It was deployed in MiMapper due to its systematic handling of multiple interrelated factors to determine the weighting of each input factor (‘layer’) to produce the hazard-specific maps for earthquake, flooding, and landslides (also referred to as hazard indexes hereafter). AHP has been widely used in environmental hazard modelling (e.g., [36,37,38]). The AHP was used for MiMapper to follow the methodology outlined by [21]. The study undertook concurrent multi-hazard mapping analysis for Kathmandu Valley, which focused on flooding, landslides, fires, and earthquakes. Their approach was used for the landslide and flooding indexes within MiMapper by applying the same AHP to the entirety of Nepal, with variables adjusted to match the full Nepal-wide value ranges to ensure thresholds reflected national rather than local conditions. The ranges used in MiMapper can be seen in Table A1.
Figure 1 illustrates the methodological workflow of the AHP used for MiMapper, beginning at the top with the input factors (light blue boxes) and respective weighting values, and ending at the bottom with the final concurrent multi-hazard index. MiMapper uses the weightings from [21]’s study. The weightings (see Figure 1) describe the extent to which the factor is known to contribute to the occurrence of the hazard in question, with the weighting gathered using the AHP. In [21], input factors were initially compared for interrelated relationships, then factors were ranked and assigned numerical values based on pair-wise comparisons. Finally, the weightings were normalised using a comparison matrix to ensure consistency across all factors. The AHP method also evaluated the consistency of judgments using the consistency ratio (CR), which validates the reliability of the weightings, and required a CR of less than 0.1 for use.
The weightings derived by [30] were adopted across Nepal to provide a consistent and transparent basis for hazard index construction. Whilst AHP is inherently subjective, it has the advantage of being interpretable and reproducible [37]—a requirement for MiMapper. The transfer of weights beyond Kathmandu Valley is acknowledged as a simplification, but many of the same hazard drivers (slope, precipitation, land cover) operate at the national scale. To further assess the robustness of these adopted weights, we validated each hazard index against independent event datasets (Section 3). The alignment between MiMapper classifications and observed hazard occurrence indicates that the weighting scheme, while transferred from Kathmandu Valley, performs consistently at the national scale.

2.2.1. Landslides and Flooding Indexes

To produce the landslide and flooding hazard indexes (maps), each factor (layer) influencing the potential occurrence of a given hazard was normalised in MiMapper to a value between 0 and 1. A value of 0 indicates Very Low hazard potential for a given factor, whereas a value of 1 signifies a Very High hazard potential. Intermediate values (0.25, 0.5, 0.75) represent Low, Medium, and High hazard levels, respectively.
Hazard rating thresholds were determined for each layer by the authors, based on experience and published research, and assigned to the raw data value of each pixel within each layer to produce a hazard rating layer (e.g., [21,39]). Deviated from the values used within [30] was required as the range of values found within the study area was greater due to the country-wide approach being taken. To ensure broad coverage across Nepal’s topography, elevation histograms were produced and used to define approximately equal distribution bands, which were then aligned with general trends in landslide and flood susceptibility. The distribution histogram can be seen in Figure 2, which shows how the elevation data used in the landslide layers was split into the five hazard rating values. Elevations of 4800–6000 m were deemed to pose the greatest contribution to a potential landslide and so pixels with a value between 4800 m and 6000 m were classified as 1. Pixels with a value between 3600 m and 4800 m were classified as 0.75; 2400 m to 3600 m were classified as 0.5; values of 1200 m to 2400 m were classified as 0.25; values over 6000 m were classified as 0.25; values under 1200 m were classified as 0. The hazard indices assigned here closely align with work undertaken by [39].
Although the input datasets varied in native resolution, all final hazard layers were exported at 30 m × 30 m resolution. This was achieved by specifying a 30 m scale parameter during export from GEE, ensuring consistency across all layers. Lower resolution inputs were resampled to match using GEE’s nearest-neighbour interpolation. Each hazard rating layer was then multiplied by the corresponding weight of that input factor, as given in Figure 1, to produce the hazard indexes. The hazard indexes produced then showed a likelihood for each hazard on a pixel-by-pixel basis, using the categories of hazard potential outlined earlier, with numbers ranging from 0 (Very Low likelihood of hazard occurrence) to 1 (Very High likelihood of hazard occurrence).

2.2.2. Earthquake Hazard Index

Due to the limited spatial availability of the input data needed to replicate the earthquake hazard index from [30] across the entirety of Nepal, an alternate end-product dataset was sourced from Bhochhibhoya and Maharjan (2022) [28], who produced a nationwide earthquake risk map for Nepal. As part of the methodology to produce this, they also produced the earthquake hazard layer and a societal vulnerability layer that are combined to produce the total risk from earthquakes. The inclusion of socioeconomic factors within the earthquake index mean that this is the only index within MiMapper that presents risk in addition to hazard. These layers were all imported directly into MiMapper and used without further processing.
It should be noted that some societal vulnerability polygons were unavailable at the time of processing due to incomplete data within the source repository. These gaps remain present in the current MiMapper earthquake societal vulnerability dataset, and efforts to obtain the full layer from the original author are ongoing.

2.3. Multi-Hazard Index

Once all three hazard indexes were produced (earthquake, landslide, and flooding) these indexes were assigned equal weightings of 0.33 to avoid bias towards any single hazard type. The hazard indexes were then added together using these weightings to give a multi-hazard index, subsequently referred to as Aggregated hazard, which uses the same hazard potential scale as all previous input factors and hazard indexes. The consistency in hazard potential scale was used to make the results for input factors, hazard indexes, and the multi-hazard index easy to understand for the user.
We aggregated the three hazard indices using an equal-weight mean (0.33 each) to provide a transparent, conservative baseline suitable for Level 1 national screening. To assess sensitivity to aggregation choice, we also produced a per-pixel maximum (“Max”) variant, where the highest hazard potential among the three inputs is selected. Previous studies have shown that the aggregation method can substantially influence classification outcomes and introduce uncertainty (e.g., [40]). Including both schemes allows us to explicitly evaluate the sensitivity of MiMapper outputs to aggregation and is considered further in the discussion.

2.4. MiMapper Validation

The hazard maps produced for MiMapper aim to represent the likelihood of physical exposure to the hazard in question. Rather than mapping individual events, MiMapper highlights areas with physical and environmental conditions conducive to hazard occurrence, thus providing a proxy for natural hazard vulnerability across Nepal.
To determine the efficacy of MiMapper’s outputs, a spatially explicit categorical validation was undertaken for the landslide, flooding, and earthquake hazard maps. Validation was undertaken using a confusion matrix analysis approach, following an approach similar to [41,42,43]. For both the flooding, landslide layers, validation was completed through comparison between previous known events and the MiMapper output.
Validation was conducted at both coarse and fine event scales, using multiple independent datasets available for each hazard type. These included police-reported flood incidents (2010–2025), the ISC-GEM earthquake catalogue, national-scale landslide inventories, and UNOSAT Sentinel-1 flood extents. Depending on data availability, different approaches were applied, including confusion matrices, spatial overlap within buffered zones, and summary statistics of hazard class proportions. This multi-source design reduces reliance on any single dataset and enables consistency checks across different reporting mechanisms and spatial resolutions. While fully independent cross-validation was not possible due to the scarcity of consistent, validated hazard records in Nepal, the convergence of results across these datasets provides a pragmatic substitute and increases confidence in the robustness of validation outcomes.
Within the validation for both flooding and landslides, hazard presence was defined as cells with values ≥ 0.5 on the 0–1 scale. This threshold was chosen to reflect at least an averaged Medium hazard potential, determined to be a balanced cutoff. Beyond this fixed threshold of ≥0.5, we also generated Receiver Operating Characteristic (ROC) curves and Area Under the Curve (AUC) values for each hazard layer. These provide a threshold-independent measure of predictive performance. In addition to the fixed ≥0.5 threshold used for reporting primary validation results, we also identified optimal thresholds using Youden’s J statistic [44] and ran supplementary fine-scale event validations. These results are reported in Table A2.

2.4.1. Validation: Landslide Hazard Layer

To validate the landslide hazard layer, a hex-based (hexagonal grid cell) of past landslide inventories in Nepal compiled by [45,46] was used for comparison with the MiMapper output. This dataset aggregates reported landslide event counts (date from—date to) from the literature and maps them to a uniform hex grid. Due to the relatively large spatial scale of the hexes (10 km2), a mean MiMapper hazard rating for each hex was calculated and then compared to the validation dataset, which allowed for the production of a confusion matrix.
To complement the hex-based national validation, a fine-resolution case study was conducted using a polygon inventory of 183 co-seismic and climate-triggered landslides mapped in the Langtang Valley [47]. As the polygons only represent mapped landslide extents (true positives), we defined the bounding geometry of the polygon inventory as the sampling extent. Pixels inside polygons were coded as Class 1, and pixels outside as Class 0. A balanced random stratified sample of 15,000 points (7500 per class) was then drawn at 30 m resolution across this extent. For each point, the continuous MiMapper landslide hazard potential was extracted from the pixel the point fell within, along with threshold flags (≥0.25, ≥0.50, ≥0.75). The resulting dataset was exported for analysis, enabling the calculation of the summary statistics (mean, maximum, minimum, standard deviation), the proportion of each polygon covered by the five MiMapper hazard classes, confusion metrics and ROC/AUC assessment [41,42].
We also assessed convergent validity by comparing mean per-hex landslide susceptibility from MiMapper with the mean per-hex susceptibility from [21,45,46], computing Pearson’s r, Spearman’s ρ, an OLS fit (slope/intercept, R2), and bias/MAE/RMSE across the national hex grid.

2.4.2. Validation: Flooding Hazard Layer

A coarse scale validation was undertaken using police-reported flood incidents from 2010–2025 aggregated by ward, with reported incidents sources from [48]. The dataset was first joined with a spatial ward dataset for Nepal and the count of incidents per ward was taken. To account for the large variation in ward size, incident counts were also normalised per km2 for analysis. The MiMapper Flood Hazard Index was then sampled to withdraw the maximum, minimum, standard deviation, mean, and proportion of each ward covered by each MiMapper hazard class (0.25, 0.5, 0.75, 1.0). These results then enabled a confusion matrix to be produced.
Two flood events detected via Sentinel-1 radar imagery were used to validate the MiMapper flood hazard layer alignment with mapped flood extents, which were sourced from [49]. The case study by United Nations Satellite Centre (UNOSAT) contained data collected on the 27 September 2024 and 1 October 2024 and represented a distinct inundation episode in Nepal detected through radar-derived water classification. While both events remain unvalidated in the field and are temporally close, they offer a valuable finer scale initial comparison with MiMapper’s hazard predictions. MiMapper’s flooding hazard potential values were sampled for each of the case study locations using the spatial extent set out by the UNOSAT dataset in the form of a series of polygons. As the polygons only represent mapped flooding extents (true positives) and not regions that were noted as having not flooded, we defined the bounding geometry of the polygon inventory as the sampling extent. Pixels inside polygons were coded as Class 1, and pixels outside as Class 0. A balanced random stratified sample of 15,000 points (7500 per class) was then drawn at 30 m resolution across this extent. For each point, the continuous MiMapper flooding hazard value was extracted from the pixel the point fell within, along with threshold flags (≥0.25, ≥0.50, ≥0.75). The resulting dataset was exported for analysis, enabling the calculation of the summary statistics (mean, maximum, minimum, standard deviation), the proportion of each polygon covered by the five MiMapper hazard classes, confusion metrics and ROC/AUC assessment.

2.4.3. Validation: Earthquake Hazard Layer

Earthquake hazard validation was conducted using the International Seismological Centre Global Earthquake Monitoring (ISC-GEM) Global Instrumental Earthquake Catalogue [50,51,52]. Earthquakes within 100 km of Nepal were buffered proportional to their magnitude (10 km per Mw), clipped to the national boundary, and compared to the Earthquake Hazard layer taken from [28]. While alternative buffer sizes could be explored in future work, here we retain a single proportional rule to avoid over-interpreting limited validation data.
For each buffered area, summary statistics (mean, min, max, standard deviation) and hazard class proportions were calculated from the hazard layer. The proportion of each buffer falling into Medium or High hazard zones (≥0.5) was also computed. MiMapper’s value at each epicentre (where these fell inside Nepal) were extracted separately to examine local hazard accuracy. Epicentre locations from ISC-GEM were used without applying additional uncertainty adjustments, as our analysis focuses on hazard-layer comparison at the national scale.

2.5. MiMapper Use and Application

To test the application of MiMapper to the intended audience, the authors undertook a series of in-person and online workshops to introduce the methodology and results of MiMapper to potential users of the tool. The in-person workshop was undertaken in November 2024 in Kathmandu, Nepal, and included 15 delegates from organisations such as hydropower engineering companies and Nepal Electricity Authority. The in-person workshop enabled user-led developments of MiMapper, including the inclusion of more relevant or newer open-source datasets, prior to the official launch of the tool in March 2025. A series of six online workshops in May 2025 introduced MiMapper to a wider global audience, which enabled further refinement of the validation process for the tool.

3. Results

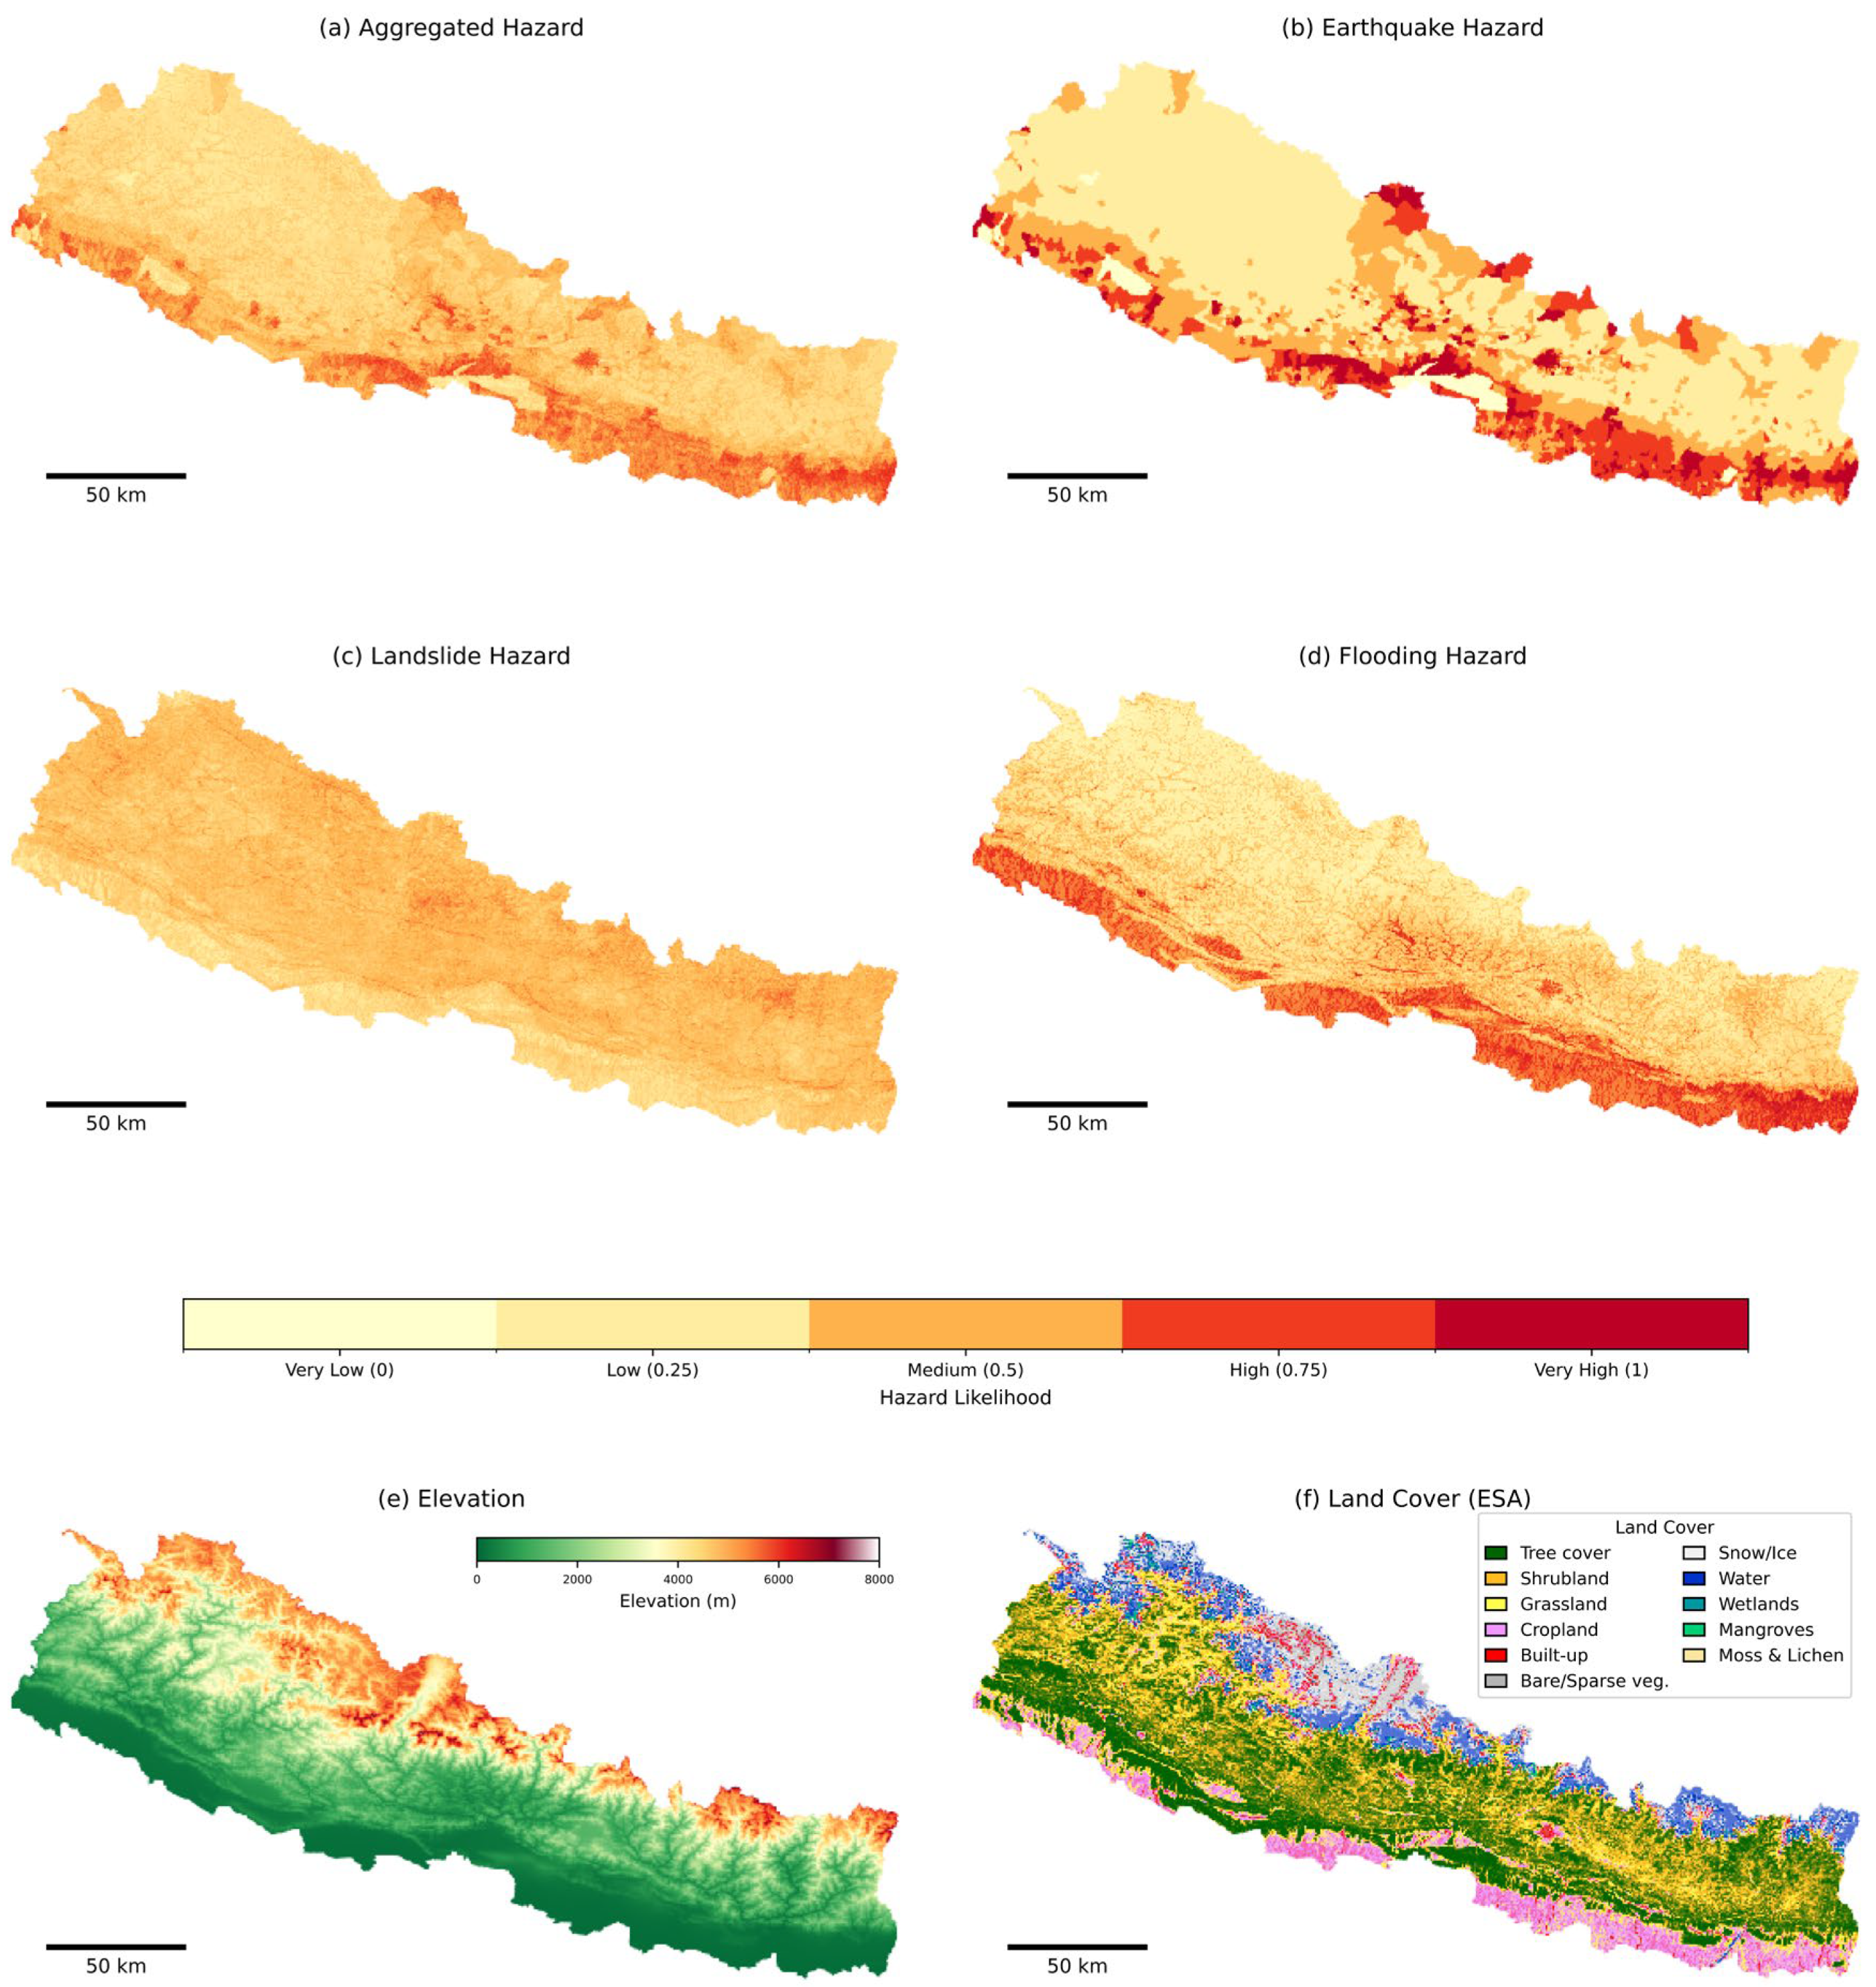
MiMapper shows spatial variation in total, earthquake, flooding, and landslide hazard potential across Nepal (Figure 3). An overview of the percentage cover of each hazard category for the four main hazard maps is shown in Table 1. The modal and median hazard types for the Aggregated hazard layer were Low (47.66% of pixels) and Medium (45.61% of pixels), respectively.
Each of the individual hazard maps show spatial variability, with the greatest spatial variability occurring in the earthquake hazard map and the least in the landslide hazard map (Figure 3). The spatial variability for the earthquake and flooding hazard layers is largely influenced by elevation and climatic zones within Nepal. Earthquake and flooding hazard potential are highest in the lowland areas of Nepal, in a ~50 km band along the southwestern border. Landslide hazard potential is less spatially variable but has the opposite pattern to the other two input layers, with the lowest hazard potential in the lowlands of Nepal. The second order control on spatial variability in hazard potential for flooding and landslides is distance to river, with the highest hazard potential (Very high) along river channels and channel banks. Flooding hazard is Very High—specifically across the area of Kathmandu, which corresponds to the high-density river network and low slope across the area.
Each of the individual hazard layers has input factors that control the spatial variability for each hazard. For earthquakes, the ambient applied (physical factors) layer more closely aligns with the overall earthquake map, with a value between the two layers, in terms of hazard category pixels with 92.7% of valid pixels assigned the same hazard class (agreement across 0–1 classes at 0.25 intervals), whilst the societal vulnerability layer matched 34.8%.
Equal weighting produced a smoother distribution of hazard classes, with most areas concentrated in the Medium range, whereas Max aggregation emphasised local extremes and increased the share of High and Very High classes (see Table A3). This contrast highlights how averaging dampens hotspots, while Max preserves them.
The Analytical Hierarchy Process (AHP) identified the most influential input factors for calculating flooding and landslide hazard. For flooding hazard, the most influential input factors were identified as Distance to river (0.249), Slope (0.337), and Annual precipitation (0.169). For landslide hazard, the most influential layers were identified as Slope (0.253), Annual precipitation (0.142), and Distance to river (0.114).
It should be noted that, at the scale of this tool, the landslide hazard layer does not capture localised geological controls on slope instability, as detailed geological mapping in Nepal is limited. Slope therefore acts as a proxy for these effects rather than a direct representation of the underlying structure.

3.1. Validation Results

Validation was key in determining the extent to which MiMapper is useful for the intended users. The results of the validation for each of the hazard layers are summarised in Table 2, with details of the landslide validation and flooding validation, undertaken by the authors, outlined in subsequent sections. Optimised thresholds [44] and additional fine-scale case studies are reported in Table A2 and Table A4. These supplementary analyses are presented separately to distinguish fixed-threshold performance (Table 2) from optimised or localised cases.

3.1.1. Landslide Hazard Layer Validation

To validate the landslide hazard layer, MiMapper values were sampled for the 1641 hexes that defined Nepal’s extent in [45]. Of these, 1324 (80.7%) were classified as Medium hazard (0.5) and 317 (19.3%) as Low hazard (0.25). None of the sample hexes aligned to MiMapper’s Very Low (0), High (0.75), or Very High (1.0) categories, likely due to the smoothing effect of averaging hazard values at the hex scale.
The average number of reported landslide events per hex varied substantially by hazard class. Low hazard hexes (0.25) contained an average of 0.44 events per hex, while Medium hazard hexes (0.5) averaged 3.70 events per hex. These results suggest the MiMapper hazard scores meaningfully distinguish between areas of Low and Medium landslide activity, despite the absence of values at the extremes. This interpretation is further supported by the Hazard Alignment Index, which adjusts for the differing spatial extents of each class by measuring average events per km2. The Low hazard class (0.25), which covered 79.4% of the area, contributed a score of 0.035, whereas the Medium hazard class (0.5), which covered 19.4% of the area, contributed a score of 4.97. These values indicate that the higher the MiMapper hazard classification, the more likely a landslide was to have been reported.
Validation against the national landslide dataset produced a precision of 0.627, sensitivity of 0.898, F1 of 0.738, accuracy of 0.668, specificity of 0.419, and an AUC of 0.719, indicating moderate discriminative ability. The model performed strongly in capturing reported landslide locations (high sensitivity), but specificity was limited, reflecting a tendency to over-assign hazard where no landslides were recorded. This likely arises from the conservative weighting scheme, where few variables score zero across Nepal’s terrain, so many hexes accumulate hazard values even in areas without recorded failures.
All hexes in the study area contained a mix of hazard values, with no hex uniformly assigned to a single hazard category. On average, 50.4% of each hex’s area was rated as Medium hazard potential (0.5), 11.6% as Low (0.25), and 0.7% as High (0.75). Very Low (0) and Very High (1.0) categories were essentially absent (0.000015% and 0% of total hex area, respectively). This skew towards the middle classes highlights two weaknesses: first, the smoothing effect of aggregation dilutes extremes, reducing the model’s ability to capture Very High hazard zones; second, the absence of Very Low classes reflects Nepal’s environmental context, where steep slopes and high rainfall are widespread, meaning most cells accumulate some hazard contribution even when other factors are low. Together, these patterns indicate that while MiMapper is effective at distinguishing broad gradients in landslide susceptibility, it may underrepresent both the safest areas and the most hazardous hotspots.
Using mapped landslide extents in the Langtang Valley from the British Geological Survey (2025), a finer-scale analysis showed that 99.5% of polygons in the study (183 total) had a mean hazard value of Medium hazard (0.5) or greater, with an average of 98.6% of polygon area above this threshold. This dataset was limited to areas where failures were large and visible in the landscape between 2017–2018, which may have contributed to the strong spatial correspondence observed between MiMapper hazard values and mapped landslide locations.
At the fixed 0.5 threshold, the model achieved a precision of 0.627, sensitivity of 0.898, specificity of 0.419, F1 of 0.738, accuracy of 0.668, and an AUC of 0.719. When optimising the threshold to 0.692, the balance of the metrics improves, yielding a precision of 0.668, a sensitivity of 0.804, specificity of 0.567, F1 of 0.730, and an accuracy of 0.690. These results demonstrate that on a case study scale, MiMapper meaningfully distinguishes between landslide and non-landslide areas at fine scales, with strong ability to identify true positives and robust overall discrimination (AUC > 0.7). However, specificity remained lower even after optimisation, indicating a tendency to overpredict hazard in non-landslide areas. This reflects the conservative weighting scheme, where few variables ever score 0 across Nepal, meaning most locations accumulate some hazard contribution. As a result, false positives are common, especially in steep or high-rainfall terrain where landslides did not occur historically, but hazard drivers remain present. This suggests that, although MiMapper is reliable for screening and prioritising at-risk zones, it should not be used as a fine-resolution predictive tool without incorporating additional local controls such as geology, soil depth, or land use change.

3.1.2. Flooding Hazard Layer Validation

MiMapper values were sampled across 6803 administrative wards, which cover the full extent of Nepal, for the validation of the flooding hazard layer. Of these, 431 (6.3%) were classified as Low hazard (0.25), 488 (7.2%) as Medium (0.5), 1056 (15.5%) as High (0.75), and 24 (0.4%) as Very High (1.0). No polygons were assigned to the Very Low hazard class (0), likely due to the hazard calculation method.
The number of reported flood incidents varied across hazard classes. Low hazard polygons (0.25) contained a total of 111 incidents, averaging 0.26 per polygon. In contrast, Medium hazard polygons (0.5) averaged 0.37 incidents per polygon, High hazard (0.75) averaged 0.33, and Very High hazard (1.0) averaged 0.08. These differences were more clearly distinguished when accounting for the area of each class. After normalising by total area, the rate of incidents per km2 was lowest in the 0.25 class (0.0014) and highest in the 1.0 class (0.0116), suggesting that higher MiMapper hazard classifications are broadly associated with higher reported flood activity.
As with the landslide layer validation, an area-weighted hazard alignment score was calculated. The Low hazard class (0.25), which covered 54.8% of the total area, contributed a hazard alignment score of 0.207. The Medium class (0.5), covering 30.8%, contributed 0.594. The High class (0.75), covering 14.3%, contributed 2.456—the highest alignment score across all classes. Although the Very High class (1.0) covered only 0.1% of the area, it contributed a score of 2.0 due to the concentration of incidents in that zone. These results indicate that the MiMapper flooding layer generally assigns higher hazard values to areas with higher observed incident density, particularly in the High (0.75) and Very High (1.0) classes. However, the Medium class shows the greatest contribution overall when considering both incident density and spatial extent.
As seen in Table 2, the flooding hazard layer had a precision of 0.116, a sensitivity of 0.637, a F1 score of 0.196, and an accuracy of 0.412. The specificity was 0.383, indicating that floods were frequently assigned where no incident was reported. However, the moderate sensitivity suggests that the majority of known flood locations were captured. The ROC analysis produced an AUC of 0.470, reflecting weak threshold-independent predictive ability at the national scale, consistent with the coarser resolution of flood reporting data. This indicates that while MiMapper is effective at capturing most known flood locations (minimising false negatives), it does so at the cost of substantial false positives, likely reflecting both reporting biases in flood incident data and the difficulty of modelling highly localised (and complex) fluvial dynamics at national resolution.
After normalising by polygon area, incident density increased systematically with hazard class, confirming that observed relationships were not an artefact of differing ward sizes.
As with landslides, all polygons were non-uniform in their hazard value composition. On average, 33.9% of each polygon’s area was classified as Low hazard (0.25), 36.9% as Medium (0.5), 25.6% as High (0.75), and 3.5% as Very High (1.0). Very Low hazard (0) was nearly absent, accounting for only 0.00028% of the total polygon area. When aggregated, an average of 66.0% of each polygon’s area was rated as having a hazard potential of Medium or higher (≥0.5). These proportions indicate greater variation across the hazard scale compared to landslides, with all four main classes (0.25 to 1.0) represented in measurable amounts. Higher hazard classes were more prevalent in this case, and the within-polygon variability suggests that spatial averaging alone does not fully account for MiMapper’s performance characteristics. Instead, these results suggest that MiMapper is broadly capable of highlighting flood-prone areas at a ward level, but its predictive performance is constrained by the mismatch between coarse incident records and the finer-scale hydrological processes that drive flooding.
To complement the national-scale and area-weighted validation results, two flood extents from the Koshi Madhesh region were analysed using UNOSAT (United Nations Satellite Centre) data captured via radar on 27 September and 1 October 2024. Both extents represent the same flood event, mapped using consistent methods on different days. The 27 September polygon had a mapped area of 12,249.8 ha and a mean MiMapper hazard value of 0.775 [49], while the 1 October polygon was slightly larger, at 12,653.4 ha, with a mean hazard value of 0.760 [49]. In both cases, 43.4% of the area was classified as having Medium or higher hazard potential (≥0.5), indicating consistent hazard classification across both stages of the flood event. Distributions within the polygons were also comparable: the 27 September polygon included 28.4% of its area in class 0.75 and 11.2% in class 1.0, while the 1 October polygon included 30.1% in class 0.75 and 9.0% in class 1.0. Minimum hazard values were 0.26 and 0.28, respectively, and the standard deviation of hazard values was 0.121 for both dates. These results suggest that MiMapper consistently assigned High hazard values to flooded areas during this event, with low intra-event variability and strong agreement between hazard classification and mapped flood extents.
Validation metrics reinforced this correspondence. For the 27 September flood extent, sensitivity was extremely high (0.997), precision moderate (0.561), and specificity lower (0.219), yielding an F1 score of 0.718 and an AUC of 0.737. The 1 October polygon produced similar values, with sensitivity of 0.995, precision of 0.570, specificity of 0.582, F1 score of 0.725, and an AUC of 0.704. Accuracy for both cases was moderate (0.608 and 0.623). Taken together, these metrics suggest that MiMapper was able to identify flooded areas with very few false negatives, but the trade-off was variable false positive rates depending on event timing and extent.
The fine-scale validation highlights both the strengths and weaknesses of MiMapper’s flood mapping. The near-perfect sensitivity demonstrates its robustness in capturing inundated zones, while the moderate AUC values (0.704–0.737) indicate reasonable but not exceptional discrimination power. The relatively low and inconsistent specificity underscores the challenge of distinguishing flood-prone areas from nearby non-flooded land, a limitation likely tied to the coarser scale of hazard predictors compared to the highly localised dynamics of flood propagation. This means that while MiMapper is reliable at highlighting broad flood exposure, it is less precise in defining flood boundaries at the event scale.

3.1.3. Earthquake Hazard Layer Validation

For the validation of the earthquake hazard layer, hazard values were extracted from buffers surrounding events listed in the ISC-GEM Global Instrumental Earthquake Catalogue [50,51,52]. Across all buffers, the average hazard value was 0.460, with a minimum average of 0.257, a maximum average of 0.967, and a mean standard deviation of 0.217. These values indicate that MiMapper assigned a wide range of hazard scores across seismically active regions, from Low (0.25) to Very High hazard (1.0), with low intra-buffer variability, suggesting overall consistency in assigned values.
The total buffered area used for validation was approximately 1,663,954 km2. No part of the validation area was assigned a Very Low hazard classification (0). Low hazard zones (0.25) accounted for 49.7% of the total area, while Medium (0.5), High (0.75), and Very High (1.0) hazard classes accounted for 24.7%, 18.0%, and 7.6% of the area, respectively. Taken together, 50.3% of the total buffered area was classified as having a Medium or higher hazard potential (≥0.5), indicating that High-hazard earthquake zones were consistently identified across the validation set.
Aggregating these figures, 50.3% of the total buffered area fell within the Medium or a higher hazard class (≥0.5). This indicates that while hazard values within earthquake buffers tended toward moderate values, MiMapper successfully identifies higher hazard levels across a substantial proportion of the earthquake-affected zones. The distribution is consistent with the smooth gradient observed across the layer, but the relatively high share of Medium, High, and Very High categories suggests alignment between mapped hazard and seismically active regions.
ROC/AUC analysis was not undertaken for the earthquake hazard layer, as MiMapper adopts an externally published national-scale hazard model without modification.

4. Discussion

Overall, MiMapper achieves the objectives set for the project of producing a concurrent multi-hazard map for the full spatial extent of Nepal that was user friendly with low internet and processing requirements. MiMapper’s strengths lie in the easy-to-use interface, clear instructions, and the ability to explore the contribution of individual input factors, helping users understand how hazard values are derived.

4.1. Validation Discussion

4.1.1. Landslide Validation

The landslide validation shows a strong overall performance. High sensitivity (0.898) indicates that MiMapper captures most known landslide-active areas. Hazard class proportions confirm that polygons classified as higher hazard contained substantially more reported events per km2, supporting the validity of MiMapper’s spatial predictions.
A notable feature of the results is the dominance of the Medium class and the near absence of “Very Low” or “Very High” zones. This reflects both the AHP weighting structure, where some variables (e.g., NDVI > 0.6) were conservatively assigned a minimum contribution of 0.25, and Nepal’s terrain context, where steep slopes and high rainfall mean that most locations accumulate some hazard. While this reduces the risk of underestimating unstable terrain, it also limits the model’s ability to represent either the most hazardous hotspots or erosion-dominated low-risk areas.
It is likely that the validation results were also affected by the reporting bias in reporting of landslides (thus affecting the datasets MiMapper validates against). Reporting bias refers to landslide incidents being more likely to be reported if they occur near settlements or infrastructure, while events in remote or inaccessible areas often go unrecorded [46,53]. This can make modelled hazards appear less accurate in sparsely populated regions (such as the Himalaya) even when spatial predictions are potentially correct.
In addition to reporting bias, the scale of the validation also shaped the results. At a national hex scale, smoothing effects dilute extremes and contribute to false positives, whereas at finer scales (e.g., Langtang Valley), MiMapper more reliably distinguishes landslide from non-landslide areas, with higher AUC and improved accuracy. Specificity remained moderate even after optimisation, reflecting a conservative design that flags hazard in many locations where failures have not been recorded. Together, these results suggest the landslide layer of MiMapper is well-suited for national-scale screening and prioritisation, while local application likely requires incorporation of finer-scale controls such as finer-scale geology, soil depth, or land use change.
To complement event-based validation, we assessed convergent validity by comparing the mean per-hex landslide susceptibility from MiMapper with the mean per-hex susceptibility derived from [21,45,46], i.e., whether independent methods rank space similarly (this is not ground-truth validation). Across the national hex grid the indices show moderate agreement (Spearman ρ = 0.69; Pearson r = 0.67; R2 = 0.44). MiMapper assigns a higher baseline on average (bias = 0.17) and exhibits a compressed dynamic range (slope = 0.36; intercept = 0.33), consistent with its conservative, Medium-class-dominant design. These results indicate that MiMapper reproduces broad susceptibility patterns seen in an external product while maintaining a precautionary baseline; local applications may therefore benefit from threshold tuning or regional recalibration.

4.1.2. Flooding Validation

The results of the flood validation suggest that MiMapper’s flood hazard layer captures broad-scale exposure patterns but may lack the resolution or sensitivity to fully represent real-world flood events. This limitation is thought to be the case due to model design and remote sensing limitations. It is thought that the MiMapper Flooding appears to prioritise riverine corridors and long-term hydrological exposure over rapid-onset or highly localised surface flooding, likely due to the high weights assigned to slope (0.337), distance from river (0.249), and annual precipitation (0.169) in the flood hazard index. While radar-based flood mapping can underrepresent inundation beneath dense vegetation or within urban shadow zones, distorting measured overlap, this may result in underestimation of MiMapper’s true sensitivity in these areas—particularly relevant given the model’s relatively strong sensitivity score (0.637). By contrast, the ROC analysis produced a weak AUC of 0.470 at the national scale, highlighting limited threshold-independent predictive ability when flood incidents are aggregated at ward level.
The process of hazard mapping and validation are also thought to have affected the quality of the validation results. The discrete hazard classes in the flooding hazard map may not capture the full complexity of surface hydrology or local terrain-induced flood variability. For example, layers detailing flow accumulation and rainfall intensity (e.g., HAND, TWI) are not included, thus creating a lack of consideration for the effect hydrodynamics have on flood occurrence. Additionally, the validation results are inevitably shaped by the spatial granularity of the validation framework. Nepal’s municipalities vary widely in size and topographical complexity, and averaging hazard values at this scale introduces smoothing effects (even when the differences in size of municipality are adjusted for). This may mask finer spatial mismatches between predicted hazard and true flood extent, limiting sensitivity. Consequently, some misalignment is likely due to the coarseness of the validation data rather than systematic model limitations.
The finer-scale UNOSAT case studies provide a counterpoint, showing that MiMapper performs far better when compared directly to mapped flood extents. For the September–October 2024 Koshi Madhesh flood, sensitivity was nearly perfect (>0.99), with F1 scores above 0.70 and AUC values of 0.704–0.737. These results indicate robust detection of inundated zones with relatively low false negatives, although specificity remained variable (0.219–0.582), reflecting continued overprediction in adjacent non-flooded areas. However, it should also be noted that the case studies datasets have not been validated, and the method by which these data were collected (radar) is hindered by the presence of water under trees—common during flooding.
Overall, MiMapper’s flood hazard predictions show moderate correspondence with both mapped flood extents and reported incidents, particularly at fine scales. The use of MiMapper’s flood layer is most effective as a first pass estimate, particularly in operational contexts where topography or land use strongly influence flood dynamics.

4.1.3. Earthquake Validation

The earthquake hazard layer validation confirmed broad agreement with seismically active zones, with half of all buffered epicentral areas classified as ≥0.5 hazard. ROC/AUC analysis was not applied, but threshold-based summaries suggest moderate-to-strong consistency. A key limitation remains sensitivity to buffer assumptions (10 km × Mw), which may either over- or under-estimate the spatial extent of shaking. Evaluating alternatives would require re-labelling earthquake positives and recomputing all metrics under multiple rules, which was beyond the scope of this release.
Overall, the earthquake layer provides consistent coverage and is valuable as a baseline hazard input, but its reliance on external datasets rather than a bespoke national model limits flexibility and resolution. These results suggest it is best interpreted as a screening tool for highlighting earthquake-prone regions, rather than detailed site-level hazard predictions.

4.2. MiMapper’s Strengths and Limitations

4.2.1. Methodology

MiMapper’s methodology was adapted from [21], providing a structured framework for implementing AHP-based multi-hazard mapping. However, applying weightings and classification thresholds developed for Kathmandu Valley to a national-scale context introduces significant limitations. Environmental variables such as elevation and precipitation span a much broader range across Nepal, meaning regional binning schemes could not be directly transferred—and when this was the case, expert opinion was used to redefine these. Even with some thresholds redefined, outputs remain sensitive to discretisation, potentially obscuring finer hazard variation. The AHP weights themselves were also derived from a regional study rather than developed through national-level expert consultation, which may distort the relative influence of key variables across different hazard zones. Addressing these limitations would require either regional recalibration or a fully national AHP framework built on fresh expert input, improving responsiveness to spatial heterogeneity and enabling more locally nuanced hazard mapping.
Equal weighting of hazards (0.33 each) was adopted as a neutral choice to avoid biasing towards any one hazard and to ensure transparency for users. However, sensitivity testing showed that the aggregation method (e.g., mean vs. max operator) influences the distribution of multi-hazard scores, consistent with prior studies that highlight aggregation choice as a major source of uncertainty in vulnerability mapping. Future iterations could provide alternative aggregation options on the interface so users can tailor outputs to context.

4.2.2. Current Strengths and Limitations

The largest limitations of MiMapper lie in the input data, and thus the hazard potential values calculated. MiMapper’s input layers were all sourced from open-access datasets to maximise transparency and replicability, but this introduced several known data limitations.
The earthquake hazard layer was adopted from [28,29], ensuring national coverage and internal consistency. However, reliance on external datasets limits flexibility, and developing a bespoke national model would require more comprehensive Nepal-wide data on seismicity, liquefaction, and geological vulnerability. In particular, liquefaction assessment would likely require fieldwork, or at least greater detail in open-source geological maps [54,55,56] to identify regions of susceptibility—both of which would entail significant research costs.
Environmental layers such as geology, land cover, precipitation, and topography were based on national or global-scale products for uniformity across the region but had their own limitations. The 1998 geological map was the only available national product including fault information but lacks smaller faults and is subject to reporting bias. Further work would look to incorporate a more detailed geology map using information published by [57], but digitising the geological context in [57] was beyond the scope of this project. Precipitation data were drawn from daily averages, offering useful baseline patterns in its original form but lacking the temporal granularity in its end form (annual average) required to capture intense rainfall events that often trigger floods and landslides. While a three-year average might mitigate concerns about relying on a single annual value, it could also obscure the extremes most relevant for triggering landslides. NDVI was calculated from a 2023–2024 year-long Landsat composite, limiting the model’s ability to detect seasonal vegetation changes relevant to slope stability. Additionally, the conservative thresholding may result in underestimation of vegetation’s stabilising role in some contexts. While any temporal averaging risks flattening the short-term variability most relevant for slope stability, future iterations could explore higher-resolution or more frequently updated indices (e.g., Sentinel-2) to better capture seasonal vegetation dynamics. ESA WorldCover for land cover introduced further limitations, including the misclassification of agricultural terraces and difficulty distinguishing small settlements—issues that can affect hazard predictions in populated or cultivated regions. Elevation and terrain derivatives, including slope, aspect, and profile curvature, were calculated from globally derived digital elevation models (SRTM), which, while consistent, lack the fine-scale topographic detail necessary for accurate local-scale hazard assessments. These limitations are cumulative and compound the challenge of capturing sub-national variability within hazard surfaces. Incorporating more recent or higher-resolution national datasets, such as rainfall intensity maps, real-time river gauge records, updated geological surveys, or LiDAR-derived terrain models, would significantly improve the spatial accuracy and hazard classification power of MiMapper in future iterations.
Additionally, MiMapper’s layers were calculated using data from fixed points in time with the methodology, processing, and temporal cover of the datasets restricting future iterations to manual reproduction for updates. Thus, this study represents MiMapper as calculated in 2024, which reflects the datasets available at the time of analysis and the versions of those datasets available at that time (see Table A1).
MiMapper’s validation is constrained by limitations in both data quality and methodology. Across all hazards, validation relied on datasets that were spatially coarse, temporally inconsistent, or unverified, reducing confidence in performance metrics. Reported landslide and flood incidents are particularly prone to underreporting and spatial generalisation, skewing precision and specificity scores. Averaging hazard values over large units (e.g., hexes or wards) further suppresses extremes and masks finer-scale variation. For flooding, discrepancies between reported incidents and hazard scores likely reflect uneven reporting and the mismatch between national-scale predictors and highly localised hydrological processes. Beyond fixed ≥0.5 thresholds, accuracy improved when optimised thresholds were applied (Table A2), highlighting that MiMapper’s performance is partly threshold-dependent. The earthquake validation depended on buffered epicentres and assumed spatial influence zones, which may misrepresent actual hazard exposure and oversimplify complex ground-shaking dynamics. While finer-scale case studies improve spatial resolution, they are few in number and not independently validated, limiting generalisability. Together, these factors mean that reported validation metrics should be treated as indicative rather than definitive. As a practical next step, short “what-if” sensitivity checks in 2–3 representative subregions—e.g., substituting OSM rivers with HydroRIVERS or MERIT Hydro, and replacing the 1998 geology with updated local maps—could quantify the % of pixels changing hazard class and the shift in AUC/F1/sensitivity; this was beyond the scope of the present study.
Nevertheless, the validation undertaken here demonstrates that MiMapper is a reasonable tool for assessing hazard potential at scale. For more localised mapping, additional detail is required. However, such detailed multi-hazard studies remain sparse in Nepal: for example, Ref. [55] provides an in-depth assessment for the Rapti Valley, but with intensive field requirements unsuited to national application. Consequently, the most practical approach for a country such as Nepal is to use MiMapper to screen hazard-prone areas, then target detailed, data-intensive assessments to specific catchments and regions identified as priorities.

4.3. Further Developments of MiMapper

Further development of MiMapper should prioritise the transition from single to multi-hazard mapping, with particular emphasis on capturing cascading hazard processes rather than treating hazards as coincidental events such as the Melamchi 2021 flood [58]. Nepal’s complex topography and hazard profile make it particularly susceptible to sequences such as earthquake-triggered landslides or flood-induced erosion, which are not adequately represented by current static layers. Incorporating a cascading hazard framework would allow for a more realistic depiction of hazard exposure and improve the utility of MiMapper for hazard preparedness and planning.
Revisiting the AHP framework at a national scale is also recommended. The current weightings, derived from a study focused on Kathmandu Valley, may not reflect the relative importance of hazard drivers across Nepal. Developing a nationally calibrated AHP, informed by updated expert consultation, would enhance spatial relevance and reduce the misclassification in underrepresented areas. Alternatively, artificial intelligence–based approach, such as that demonstrated by [59], could be explored.
Expanding MiMapper to include additional hazards- such as GLOFs, fire, and drought—would further broaden its coverage, particularly in underrepresented areas. GLOF inclusion is contentious due to ongoing debate about assessment methods, and separately, how they could be included within MiMapper. The current coverage of three hazard types provides already provides an important overview for Integrated Geohazard Assessment. Such assessments are increasingly being recommended in Nepal for hydropower development and have been adopted by the World Bank for infrastructure screening [7].
Developing MiMapper into a broader risk model would enhance its scope and potential applications, particularly in contexts where population or infrastructure intersects with hazard zones.
Finally, addressing the model’s static nature by enabling periodic updates to input layers is essential. This is particularly important in the context of climate change, where hazard dynamics are shifting over time. Supporting more temporally responsive hazard mapping would allow MiMapper to reflect emerging trends and maintain its relevance for long-term planning. However, as with all the points raised in Section 4.2, such a development as this is possible using the GEE platform and a methodology similar to MiMapper. MiMapper, therefore, provides a key development for understanding natural hazard risk in Nepal.

5. Conclusions

MiMapper offers a reproducible and openly accessible framework for national-scale concurrent multi-hazard mapping in Nepal, developed using Google Earth Engine and open datasets. Its design facilitates hazard screening across earthquakes, floods, and landslides, with a focus on transparency, interpretability, and ease of use in low-resource contexts.
Validation indicates that MiMapper captures broad-scale hazard trends, particularly for landslides, though spatial accuracy is constrained by the resolution and quality of available input data, as well as the reuse of AHP weights derived from a regional study. The tool’s flood and earthquake layers show weaker performance at finer spatial scales, reflecting both methodological limitations and the coarse granularity of validation datasets.
While not intended for site-specific risk assessments, MiMapper is effective for identifying areas warranting further investigation. Its greatest utility lies in Level 1 screening, supporting decisions on where in-depth analysis is needed, particularly as part of an Integrated Geohazard Assessment. It is not intended for site-specific or local decision-making. However, caution is required when extrapolating to data-scarce regions, as underlying geological datasets may be incomplete or biased toward mapped transects (e.g., along roads and trekking trails). Future improvements should prioritise hazard aggregation scenarios (to assess their impact on class distribution), a nationally calibrated AHP framework with sensitivity testing, resampling correction, extension of predictors for floods, integration of dynamic and higher-resolution datasets, and expansion toward cascading hazard processes and risk-based outputs.
MiMapper contributes a generalisable template for concurrent multi-hazard mapping that can be adapted and refined for other contexts, supporting the broader goal of accessible and scalable hazard assessment.

Author Contributions

Conceptualization, N.F.G., M.J., J.M.R., R.B.K. and C.A.P.; methodology, C.A.P.; software, C.A.P.; validation, C.A.P. and M.J.; formal analysis, M.J. and C.A.P.; writing—original draft preparation, C.A.P.; writing—review and editing, M.J., N.F.G., J.M.R. and R.B.K.; visualisation, C.A.P.; supervision, M.J. and N.F.G.; project administration, M.J.; funding acquisition, N.F.G. and M.J. All authors have read and agreed to the published version of the manuscript.

Funding

This research was funded by the UK International Science Partnership Fund (HEFCW) and an Aberystwyth University Impact Grant.

Data Availability Statement

The datasets used in this study are hosted on the Google Earth Engine (GEE) platform and are accessible through the MiMapper web application (https://ee-multihazardmapping.projects.earthengine.app/view/mimapper accessed on 1 September 2025). These datasets are not available as direct downloads; however, they can be viewed and explored via the application. Requests for code access, guidance or clarification regarding the data can be directed to the corresponding author. [Google Earth Engine (GEE) platform] [https://ee-multihazardmapping.projects.earthengine.app/view/mimapper accessed on 1 September 2025].

Conflicts of Interest

Author John M. Reynolds was employed by the company Reynolds Geo-Solutions Ltd. The remaining authors declare that the research was conducted in the absence of any commercial or financial relationships that could be construed as a potential conflict of interest.

Appendix A

Table A1. Descriptive information on each factor going into the Flooding and Landslide Hazard Layers of the MiMapper Tool.
Hazard LayerInput LayerSourceMethod
FloodingDistance to RiverOpenStreetMap (Rivers)

Accessed: 30 September 2024 (https://www.arcgis.com/home/item.html?id=aee12b4062af478fab2832b49fdeb1df)
  • Processed in QGIS as exceeded GEE’s limits. The ‘Buffer’ tool is used to create buffering polygons 100 m, 200 m, 300 m and 400 m from each watercourse.
  • These are ‘Simplified’ to 20 m accuracy to reduce the dataset size—allowing for loading into GEE (avoiding exceeding the number of vertices).
  • Pixels that fall within the 100 m polygon are given a value of 1, pixels within the 200 m polygon are given a value of 0.75, pixels within the 300 m polygon are given a value of 0.5, pixels within the 400 m polygon are given a value of 0.25, and those pixels that do not fall within any of the polygons (>400 m) are given a value of 0. This is then rasterised.
SlopeShuttle Radar Topography Mission (SRTM) digital elevation model (DEM) (through GEE)—30 m resolution dataset

Last Date Calculated: 16 December 2024

Data Dates: N/A
  • The elevation data from the SRTM DEM is inputted into GEE’s slope algorithm (held under ‘Terrain’ tools) to produce the slope. This method uses the 4-connected neighbouring pixels values of each pixel to calculate slope in degrees.
  • The resulting dataset is then classified and rasterised into 5 values relating to whether flooding likelihood is increased at those degrees of slope.
≤3 degrees is classified as 1—very high
>3–7 degrees is classified as 0.75—high
>7–13 degrees is classified as 0.5—medium
>13–20 degrees is classified as 0.25—low
>20 degrees is classified as 0—very low
ElevationShuttle Radar Topography Mission (SRTM) digital elevation model (DEM) (through GEE)—30 m resolution dataset

Last Date Calculated: 16 December 2024

Data Dates: N/A
As the dataset contains a direct measurement of elevation, this data is used directly.
The resulting dataset is then classified and rasterised into 5 values relating to whether flooding likelihood is increased at those elevations.
≤1200 m is classified as 1—very high
>1200–2400 m is classified as 0.75—high
>2400–3600 m is classified as 0.5—medium
>3600–4800 m is classified as 0.25—low
>4800–6000 m is classified as 0—very low
>6000 m is classified as 0—very low
Annual PrecipitationClimate Hazards Center InfraRed Precipitation with Station data (CHIRPS) Daily

Last Date Calculated: 2 December 2024

Data Dates: 2023
The precipitation band of CHIRPS data is brought into the model, limited to that from 2023, and the data summed per pixel. This dataset is then limited spatially to the extent of Nepal—as defined by the Nepali Government.
The resulting dataset is then classified using a histogram of the annual precipitation and rasterised into 5 values relating to whether flooding likelihood is increased throughout the gradient of annual precipitation.
≤500 mm/y is classified as 0—very low
>500–1000 mm/y is classified as 0.25—low
>1000–1400 mm/y is classified as 0.5—medium
>1400–1800 mm/y is classified as 0.75—high
>1800 mm/y is classified as 1—very high
Land Cover/Land Use European Space Agency’s WorldCover 10 m 2021 land cover map based on Sentinel 1 and 2 data.
Zanaga, D., Van De Kerchove, R., Daems, D., De Keersmaecker, W., Brockmann, C., Kirches, G., Wevers, J., Cartus, O., Santoro, M., Fritz, S., Lesiv, M., Herold, M., Tsendbazar, N.E., Xu, P., Ramoino, F., Arino, O., 2022. ESA WorldCover 10 m 2021 v200. https://doi.org/10.5281/zenodo.7254221

Data date: 2021

Date Accessed: 10 December 2024
The WorldCover dataset is accessed through GEE, and limited to the spatial extent of Nepal—as defined by the Nepali Government.
This dataset is then reclassified into 5 values relating to whether flooding likelihood is increased in regions covered by different landcovers (0 being very low, 1 being very high) and rasterised.
Tree Cover is classified as 0.25
Shrubland is classified as 0.5
Grassland is classified as 0.5
Cropland is classified as 0.75
Built Up is classified as 1
Bare/Sparse Vegetation is classified as 1
Snow/Ice is classified as 0.75
Permanent Water Bodies are classified as 1
Herbaceous Wetlands are classified as 0.25
Mangroves are classified as 0.25
Moss/Lichen is classified as 0.5
The similar values of cropland, grassland and Moss/Lichen negates some inaccuracy relating to the original model.
Geology Geologic map of South Asia
Wandrey, C.J., 1998, Geologic map of South Asia (geo8ag): U.S. Geological Survey data release, https://doi.org/10.5066/P9YC1C8G

Data date: 1998

Date Accessed: 10 December 2024
The Geological Map is first loaded into QGIS, limited to the spatial extent of Nepal—as defined by the Nepali Government—and the different polygons are assessed in comparison to a partial Department of Mines and Geology dataset published by ICIMOD.
From this, we classify the layers into 3 categories from their original designation: Hard Rock, Consolidated Rock, Unconsolidated Sediments (Khatakho, R.; Gautam, D.; Aryal, K.R.; Pandey, V.P.; Rupakhety, R.; Lamichhane, S.; Liu, Y.-C.; Abdouli, K.; Talchabhadel, R.; Thapa, B.R.; et al. Multi-Hazard Risk Assessment of Kathmandu Valley, Nepal. Sustainability 2021, 13, 5369. https://doi.org/10.3390/su13105369). This is done by classifying any igneous or metamorphic rock as Hard Rock, sedimentary rock as Consolidated Rock, and Neogene and Quaternary Sediments as Unconsolidated.
This dataset is then reclassified into 5 values relating to whether flooding likelihood is increased in regions covered by different geologies (0 being very low, 1 being very high) and rasterised.
Unconsolidated is given the value of 0.5
Consolidated is given the value of 0.75
Hard Rock is given the value of 1
LandslideSlopeShuttle Radar Topography Mission (SRTM) digital elevation model (DEM) (through GEE)—30 m resolution dataset

Last Date Calculated: 16 December 2024

Data Dates: N/A
The elevation data from the SRTM DEM is inputted into GEE’s slope algorithm (held under ‘Terrain’ tools) to produce the slope. This method uses the 4-connected neighbouring pixels values of each pixel to calculate slope in degrees.
The resulting dataset is then classified and rasterised into 5 values relating to whether landslide likelihood is increased at those degrees of slope.
≤5 degrees is classified as 0—very low
>5–15 degrees is classified as 0.25—low
>15–30 degrees is classified as 0.5—medium
>30–45 degrees is classified as 0.75—high
>45 degrees is classified as 1—very high
Distance to RiverOpenStreetMap (Rivers)

Accessed: 30 September 2024 (https://www.arcgis.com/home/item.html?id=aee12b4062af478fab2832b49fdeb1df)
Processed in QGIS as exceeded GEE’s limits.
The ‘Buffer’ tool is used to create buffering polygons 100 m, 200 m, 300 m and 400 m from each watercourse.
These are ‘Simplified’ to 20 m accuracy to reduce the dataset size—allowing for loading into GEE (avoiding exceeding the number of vertices).
Pixels that fell within the 100 m polygon are given a value of 1, pixels within the 200 m polygon are given a value of 0.75, pixels within the 300 m polygon are given a value of 0.5, pixels within the 400 m polygon are given a value of 0.25, and those pixels that do not fall within any of the polygons (>400 m) are given a value of 0. This is then rasterised.
Annual PrecipitationClimate Hazards Center InfraRed Precipitation with Station data (CHIRPS) Daily

Last Date Calculated: 2 December 2024

Data Dates: 2023
The precipitation band of CHIRPS data is brought into the model, limited to that from 2023, and the data summed per pixel. This dataset is then limited spatially to the extent of Nepal—as defined by the Nepali Government.
The resulting dataset is then classified using a histogram of the annual precipitation and rasterised into 5 values relating to whether landslide likelihood is increased throughout the gradient of annual precipitation.
≤500 mm/y is classified as 0—very low
>500–1000 mm/y is classified as 0.25—low
>1000–1400 mm/y is classified as 0.5—medium
>1400–1800 mm/y is classified as 0.75—high
>1800 mm/y is classified as 1—very high
Distance to FaultsGeologic map of South Asia
Wandrey, C.J., 1998, Geologic map of South Asia (geo8ag): U.S. Geological Survey data release, https://doi.org/10.5066/P9YC1C8G

Data date: 1998

Date Accessed: 10 December 2024
Accessed and downloaded on the 4 December 2024.
The ‘Buffer’ tool in QGIS is used to create buffering polygons 200 m, 400 m, 600 m and 800 m from each faults.
Pixels that fell within the 200 m polygon are given a value of 1, pixels within the 400 m polygon are given a value of 0.75, pixels within the 600 m polygon are given a value of 0.5, pixels within the 800 m polygon are given a value of 0.25, and those pixels that did not fall within any of the polygons (>800 m) are given a value of 0. This is then rasterised.
NDVILandsat 9-Analysis Ready Data

Last Date Calculated: 16 December 2024

Data Dates: 1 January 2023 to 1 January 2024
The Landsat 9 Analysis Ready archive within GEE is first filtered for data collected between the 1 January 2023 and 1 January 2024 and regions covered at least part of the spatial extent of Nepal—as defined by the Nepali Government. The data is then filtered for Cloud Cover, scaled, and the images with the least cloud cover are used. Each pixel is stacked, and the median value of each pixel (and each band) is taken and used to create a median composite.
From this median composite, the Near-Infrared (NIR) band is isolated, as is the red band. Using the below equation:
(NIR − Red)/(NIR + Red) = NDVI
NDVI produces a number between −1 and 1, with −1 being no vegetation, and 1 being lots of healthy vegetation.
Each pixel is then classified automatically in accordance with 5 values (0, 0.25, 0.5, 0.75, 1).
NDVI values of ≤0.05 (including negative values) are classified as having a value of 1.
NDVI values of >0.05–0.30 are classified as having a value of 0.75
NDVI values of >0.30–0.45 are classified as having a value of 0.5.
NDVI values of >0.45–0.6 are classified as having a value of 0.25
NDVI values over 0.6 are classified as having a value of 0.25.
GeologyGeologic map of South Asia
Wandrey, C.J., 1998, Geologic map of South Asia (geo8ag): U.S. Geological Survey data release, https://doi.org/10.5066/P9YC1C8G

Data date: 1998

Date Accessed: 10 December 2024
The Geological Map is first loaded into QGIS, limited to the spatial extent of Nepal—as defined by the Nepali Government—and the different polygons are assessed in comparison to a partial Department of Mines and Geology dataset published by ICIMOD.
From this, we classify the layers into 3 categories from their original designation: Hard Rock, Consolidated Rock, Unconsolidated Sediments (Khatakho, R.; Gautam, D.; Aryal, K.R.; Pandey, V.P.; Rupakhety, R.; Lamichhane, S.; Liu, Y.-C.; Abdouli, K.; Talchabhadel, R.; Thapa, B.R.; et al. Multi-Hazard Risk Assessment of Kathmandu Valley, Nepal. Sustainability 2021, 13, 5369. https://doi.org/10.3390/su13105369). This is done by classifying any igneous or metamorphic rock as Hard Rock, sedimentary rock as Consolidated Rock, and Neogene and Quaternary Sediments as Unconsolidated.
This dataset is then reclassified into 5 values relating to whether landslide likelihood is increased in regions covered by different geologies (0 being very low, 1 being very high) and rasterised.
Unconsolidated is given the value of 0.75
Consolidated is given the value of 1
Hard Rock is given the value of 0.5
AspectShuttle Radar Topography Mission (SRTM) digital elevation model (DEM) (through GEE)—30 m resolution dataset

Last Date Calculated: 16 December 2024

Data Dates: N/A
The elevation data from the SRTM DEM is inputted into GEE’s aspect algorithm (held under ‘Terrain’ tools) to produce the aspect. This method uses the 4-connected neighbouring pixels of each pixel to calculate aspect in degrees.
The resulting dataset is then classified and rasterised into 5 values relating to whether landslide likelihood is increased at those degrees of aspect.
0–25 are classified as 0.25—low hazard
>25–65 are classified as 0.25—low hazard
>65–115 are classified as 0.5—medium hazard
>115–155 are classified as 0.75—high hazard
>155–205 are classified as 1—very high hazard
>205–250 are classified as 0.75—high hazard
>250–300 are classified as 0.5—medium hazard
>300–335 are classified as 0.25—low hazard
>335–360 are classified as 0.25—low hazard
ElevationShuttle Radar Topography Mission (SRTM) digital elevation model (DEM) (through GEE)—30 m resolution dataset

Last Date Calculated: 16 December 2024

Data Dates: N/A
As the dataset contains a direct measurement of elevation, this data is used directly.
The resulting dataset is then classified and rasterised into 5 values relating to whether landslide likelihood is increased at those elevations.
≤1200 m is classified as 0—very low
>1200–2400 m is classified as 0.25—low
>2400–3600 m is classified as 0.5—medium
>3600–4800 m is classified as 0.75—high
>4800–6000 m is classified as 1—very high
>6000 m is classified as 0.25—low
Profile CurvatureShuttle Radar Topography Mission (SRTM) digital elevation model (DEM) (through GEE)—30 m resolution dataset.

Last Date Calculated: 16 December 2024

Data Dates: N/A
A Guassian filter (radius: 4 pixels, sigma: 1.5) is applied to the SRTM 30 m DEM to apply a weighted smoothing to the region.
The TAGEE library (custom Earth Engine functions) is then used to calculate the vertical curvature from the smoothed DEM. This is extracted and classified into three categories: less than −0.0005 (convex), equal to −0.0005 to equal to 0.0005 (planar), and more than 0.0005 (concave). Areas covered by the former are given a rating of 0.25, the middle 0.75, and the latter 1.
Land Use/Land Cover European Space Agency’s WorldCover 10 m 2021 land cover map based on Sentinel 1 and 2 data.
Zanaga, D., Van De Kerchove, R., Daems, D., De Keersmaecker, W., Brockmann, C., Kirches, G., Wevers, J., Cartus, O., Santoro, M., Fritz, S., Lesiv, M., Herold, M., Tsendbazar, N.E., Xu, P., Ramoino, F., Arino, O., 2022. ESA WorldCover 10 m 2021 v200. https://doi.org/10.5281/zenodo.7254221

Data date: 2021
The WorldCover dataset is accessed through GEE, and limited to the spatial extent of Nepal—as defined by the Nepali Government.
This dataset is then reclassified into 5 values relating to whether landslide likelihood is increased in regions covered by different landcovers (0 being very low, 1 being very high) and rasterised.
Tree Cover is classified as 0.25
Shrubland is classified as 0.5
Grassland is classified as 0.5
Cropland is classified as 0.75
Built Up is classified as 1
Bare/Sparse Vegetation is classified as 1
Snow/Ice is classified as 0.75
Permanent Water Bodies are classified as 1
Herbaceous Wetlands are classified as 0.25
Mangroves are classified as 0.25
Moss/Lichen are classified as 0.5
The similar values of cropland, grassland and Moss/Lichen negates some inaccuracy relating to the original model.
Distance to RoadsOpenStreetMap (Roads)

Accessed: 30 September 2024 (https://www.arcgis.com/home/item.html?id=33838bfa2c08419484f87590cda59f6c)
Processed in QGIS as exceeded GEE’s limits.
The ‘Buffer’ tool is used to create buffering polygons 100 m, 200 m, 400 m and 600 m from each watercourse.
These are ‘Simplified’ to 20 m accuracy to reduce the dataset size—allowing for loading into GEE (avoiding exceeding the number of vertices).
Pixels that fall within the 100 m polygon are given a value of 1, pixels within the 200 m polygon are given a value of 0.75, pixels within the 400 m polygon are given a value of 0.5, pixels within the 600 m polygon are given a value of 0.25, and those pixels that did not fall within any of the polygons (>600 m) are given a value of 0. This is then rasterised.

Appendix B

Table A2. Key validation statistics for each hazard layer at the best threshold (Youden J) against both localised and coarse scale Nepal validation data including Sensitivity, Specificity, Precision, F1 Score and Accuracy and AUC.
DataBest ThresholdPrecisionSensitivitySpecificityF1Accuracy
Nepal-wide Landslide0.6920.6680.8040.5670.7300.690
Langtang Landslide0.5090.6400.6290.6460.6350.638
Nepal-wide Flooding0.5020.1160.6370.3850.1960.414
Flooding (Event 1)0.6680.6560.7670.5980.7070.682
Flooding (Event 2)0.6660.6530.7880.5820.7140.685

Appendix C

Table A3. Proportion coverage of Nepal for both methods of calculating the Aggregated Hazard—the first (Equal Weights (0.33) averages the inputs from the three hazards considered, the second (Max Aggregation) takes the max value from the three hazards for each pixel.
Hazard ClassEqual Weights (0.33)Max Aggregation
Very Low (0)00
Low (0.25)45.3402.16
Medium (0.5)48.4474.25
High (0.75)06.6518.11
Very High (1)005.91
Table A4. Key validation statistics for each hazard layer at a 0.5 or above threshold against localised Nepal validation data including Sensitivity, Specificity, Precision, F1 Score and Accuracy and AUC.
Validation MetricFlooding (27 September 2024)Flooding (1 October 2024)Landslide (Langtang)
Sensitivity0.9970.9950.665
Specificity0.2190.5820.601
Precision0.5610.5700.625
F1 Score0.7180.7250.645
Accuracy0.6080.6230.633
AUC0.7370.7040.682

References

  1. Dimri, A.P.; Allen, S.; Huggel, C.; Mal, S.; Ballesteros-Cánovas, J.A.; Rohrer, M.; Shukla, A.; Tiwari, P.; Maharana, P.; Bolch, T.; et al. Climate Change, Cryosphere and Impacts in the Indian Himalayan Region. Curr. Sci. 2021, 120, 774–790. [Google Scholar] [CrossRef]
  2. Dewan, T.H. Societal Impacts and Vulnerability to Floods in Bangladesh and Nepal. Weather Clim. Extrem. 2015, 7, 36–42. [Google Scholar] [CrossRef]
  3. Shrestha, A.B.; Aryal, R. Climate Change in Nepal and Its Impact on Himalayan Glaciers. Reg. Environ. Change 2011, 11, 65–77. [Google Scholar] [CrossRef]
  4. Hannah, D.M.; Kansakar, S.R.; Gerrard, A.J.; Rees, G. Flow Regimes of Himalayan Rivers of Nepal: Nature and Spatial Patterns. J. Hydrol. 2005, 308, 18–32. [Google Scholar] [CrossRef]
  5. Richardson, S.D.; Reynolds, J.M. An Overview of Glacial Hazards in the Himalayas. Quat. Int. 2000, 65–66, 31–47. [Google Scholar] [CrossRef]
  6. Xu, J.; Grumbine, R.E.; Shrestha, A.; Eriksson, M.; Yang, X.; Wang, Y.; Wilkes, A. The Melting Himalayas: Cascading Effects of Climate Change on Water, Biodiversity, and Livelihoods. Conserv. Biol. 2009, 23, 520–530. [Google Scholar] [CrossRef]
  7. Reynolds, J.M. The Role of Integrated Geohazard Assessments in Disaster Risk Management. Int. J. Hydropower Dams 2023, 30, 43–56. [Google Scholar]
  8. Ministry of Home Affairs (MoHA); Disaster Preparedness Network Nepal (DPNet Nepal). Nepal Disaster Report 2013; Ministry of Home Affairs: Kathmandu, Nepal, 2013. [Google Scholar]
  9. Koirala, M.; Rai, M.R.; Maskey, R.; Tribhuvana Viśvavidyālaya, United Nations Development Programme (Nepal) (Eds.) Disaster Risk Management: Concept, Policy and Practices in Nepal; Central Department of Environmental Science, Tribhuvan University: Kirtipur, Nepal, 2015; ISBN 978-9937-2-9764-6. [Google Scholar]
  10. Chaulagain, H.; Rodrigues, H.; Silva, V.; Spacone, E.; Varum, H. Seismic Risk Assessment and Hazard Mapping in Nepal. Nat. Hazards 2015, 78, 583–602. [Google Scholar] [CrossRef]
  11. Wesnousky, S.G.; Kumahara, Y.; Chamlagain, D.; Pierce, I.K.; Karki, A.; Gautam, D. Geological Observations on Large Earthquakes along the Himalayan Frontal Fault near Kathmandu, Nepal. Earth Planet. Sci. Lett. 2017, 457, 366–375. [Google Scholar] [CrossRef]
  12. Goda, K.; Kiyota, T.; Pokhrel, R.M.; Chiaro, G.; Katagiri, T.; Sharma, K.; Wilkinson, S. The 2015 Gorkha Nepal Earthquake: Insights from Earthquake Damage Survey. Front. Built Environ. 2015, 1, 153814. [Google Scholar] [CrossRef]
  13. Fujita, K.; Inoue, H.; Izumi, T.; Yamaguchi, S.; Sadakane, A.; Sunako, S.; Nishimura, K.; Immerzeel, W.W.; Shea, J.M.; Kayastha, R.B.; et al. Anomalous Winter-Snow-Amplified Earthquake-Induced Disaster of the 2015 Langtang Avalanche in Nepal. Nat. Hazards Earth Syst. Sci. 2017, 17, 749–764. [Google Scholar] [CrossRef]
  14. Lacroix, P. Landslides Triggered by the Gorkha Earthquake in the Langtang Valley, Volumes and Initiation Processes. Earth Planets Space 2016, 68, 46. [Google Scholar] [CrossRef]
  15. Mani, P.; Allen, S.; Evans, S.G.; Kargel, J.S.; Mergili, M.; Petrakov, D.; Stoffel, M. Geomorphic Process Chains in High-Mountain Regions—A Review and Classification Approach for Natural Hazards Assessment. Rev. Geophys. 2023, 61, e2022RG000791. [Google Scholar] [CrossRef]
  16. Dahal, B.K.; Dahal, R.K. Landslide Hazard Map: Tool for Optimization of Low-Cost Mitigation. Geoenviron. Disasters 2017, 4, 8. [Google Scholar] [CrossRef]
  17. Froude, M.J.; Petley, D.N. Global Fatal Landslide Occurrence from 2004 to 2016. Nat. Hazards Earth Syst. Sci. 2018, 18, 2161–2181. [Google Scholar] [CrossRef]
  18. Pangali Sharma, T.P.; Zhang, J.; Koju, U.A.; Zhang, S.; Bai, Y.; Suwal, M.K. Review of Flood Disaster Studies in Nepal: A Remote Sensing Perspective. Int. J. Disaster Risk Reduct. 2019, 34, 18–27. [Google Scholar] [CrossRef]
  19. Lamichhane, K.; Karki, S.; Sharma, K.; Khadka, B.; Acharya, B.; Biswakarma, K.; Adhikari, S.; Kc, R.; Danegulu, A.; Bhattarai, S.; et al. Unraveling the Causes and Impacts of Increasing Flood Disasters in the Kathmandu Valley: Lessons from the Unprecedented September 2024 Floods. Nat. Hazards Res. 2025, S2666592125000435. [Google Scholar] [CrossRef]
  20. Moktan, S.; Kafle, K.R.; Chapagain, S. Social Vulnerability Assessment to Natural Hazards in Western Nepal. In Sustainable Cities and Resilience; Lecture Notes in Civil Engineering; Pal, I., Kolathayar, S., Eds.; Springer: Singapore, 2022; Volume 183, pp. 103–114. ISBN 978-981-16-5542-5. [Google Scholar]
  21. Kincey, M.E.; Rosser, N.J.; Swirad, Z.M.; Robinson, T.R.; Shrestha, R.; Pujara, D.S.; Basyal, G.K.; Densmore, A.L.; Arrell, K.; Oven, K.J.; et al. National-Scale Rainfall-Triggered Landslide Susceptibility and Exposure in Nepal. Earth’s Future 2024, 12, e2023EF004102. [Google Scholar] [CrossRef]
  22. Shrestha, M.; Noppradit, P.; Shrestha, R.P.; Dahal, R.K. Understanding Livelihood Insecurity Due to Landslides in the Mid-Hill of Nepal: A Case Study of Bahrabise Municipality. Int. J. Disaster Risk Reduct. 2024, 104, 104399. [Google Scholar] [CrossRef]
  23. Gariano, S.L.; Guzzetti, F. Landslides in a Changing Climate. Earth-Sci. Rev. 2016, 162, 227–252. [Google Scholar] [CrossRef]
  24. METEOR Project Consortium. METEOR Explorer-Nepal Multihazard Map, version 1.0. Available online: https://maps.meteor-project.org/map/npl-mhz/#7/28.022/84.014 (accessed on 30 July 2025).
  25. Han, L.; Zhang, J.; Zhang, Y.; Ma, Q.; Alu, S.; Lang, Q. Hazard Assessment of Earthquake Disaster Chains Based on a Bayesian Network Model and ArcGIS. ISPRS Int. J. Geo-Inf. 2019, 8, 210. [Google Scholar] [CrossRef]
  26. Bhattarai, M.K. Information and Communication Technology Scenario of Nepal: Assessing Policy Environment and Challenges. Nep. Pub. Pol. Rev. 2021, 1, 201–211. [Google Scholar] [CrossRef]
  27. Karn, N.K.; Hongli, Z.; Shafiq, M. Measuring Broadband Internet Performance in Nepal: A Comparative Study. Procedia Comput. Sci. 2017, 107, 64–69. [Google Scholar] [CrossRef]
  28. Bhochhibhoya, S.; Maharjan, R. Integrated Seismic Risk Analysis—Nepal (Outputs); Zenodo: Geneva, Switzerland, 2022. [Google Scholar]
  29. Bhochhibhoya, S.; Maharjan, R. Integrated Seismic Risk Assessment in Nepal. Nat. Hazards Earth Syst. Sci. 2022, 22, 3211–3230. [Google Scholar] [CrossRef]
  30. Khatakho, R.; Gautam, D.; Aryal, K.R.; Pandey, V.P.; Rupakhety, R.; Lamichhane, S.; Liu, Y.-C.; Abdouli, K.; Talchabhadel, R.; Thapa, B.R.; et al. Multi-Hazard Risk Assessment of Kathmandu Valley, Nepal. Sustainability 2021, 13, 5369. [Google Scholar] [CrossRef]
  31. Dahigamuwa, T.; Yu, Q.; Gunaratne, M. Feasibility Study of Land Cover Classification Based on Normalized Difference Vegetation Index for Landslide Risk Assessment. Geosciences 2016, 6, 45. [Google Scholar] [CrossRef]
  32. Huang, S.; Tang, L.; Hupy, J.P.; Wang, Y.; Shao, G. A Commentary Review on the Use of Normalized Difference Vegetation Index (NDVI) in the Era of Popular Remote Sensing. J. For. Res. 2021, 32, 1–6. [Google Scholar] [CrossRef]
  33. Xue, J.; Su, B. Significant Remote Sensing Vegetation Indices: A Review of Developments and Applications. J. Sens. 2017, 2017, 1353691. [Google Scholar] [CrossRef]
  34. Wandrey, C.J. Geologic Map of South Asia (Geo8ag); U.S. Geological Survey: Reston, VA, USA, 1998. [Google Scholar]
  35. Nepal National Spatial Data Center. National Geoportal–Nepal Boundary Layer. Available online: https://admin.nationalgeoportal.gov.np/layers/geonode:nepal (accessed on 15 November 2024).
  36. Das, S.; Sarkar, S.; Kanungo, D.P. GIS-Based Landslide Susceptibility Zonation Mapping Using the Analytic Hierarchy Process (AHP) Method in Parts of Kalimpong Region of Darjeeling Himalaya. Environ. Monit. Assess. 2022, 194, 234. [Google Scholar] [CrossRef]
  37. Bhat, I.A.; Ahmed, R.; Bhat, W.A.; Ahmed, P. Application of AHP Based Geospatial Modeling for Assessment of Landslide Hazard Zonation along Mughal Road in the Pir Panjal Himalayas. Environ. Earth Sci. 2023, 82, 336. [Google Scholar] [CrossRef]
  38. Sar, N.; Chatterjee, S.; Das Adhikari, M. Integrated Remote Sensing and GIS Based Spatial Modelling through Analytical Hierarchy Process (AHP) for Water Logging Hazard, Vulnerability and Risk Assessment in Keleghai River Basin, India. Model. Earth Syst. Environ. 2015, 1, 31. [Google Scholar] [CrossRef]
  39. Dahal, R.K. Regional-Scale Landslide Activity and Landslide Susceptibility Zonation in the Nepal Himalaya. Environ. Earth Sci. 2014, 71, 5145–5164. [Google Scholar] [CrossRef]
  40. Moreira, L.L.; De Brito, M.M.; Kobiyama, M. Effects of Different Normalization, Aggregation, and Classification Methods on the Construction of Flood Vulnerability Indexes. Water 2021, 13, 98. [Google Scholar] [CrossRef]
  41. Hanley, J.A.; McNeil, B.J. The Meaning and Use of the Area under a Receiver Operating Characteristic (ROC) Curve. Radiology 1982, 143, 29–36. [Google Scholar] [CrossRef] [PubMed]
  42. Marzban, C. The ROC Curve and the Area under It as Performance Measures. Weather Forecast. 2004, 19, 1106–1114. [Google Scholar] [CrossRef]
  43. Rahmati, O.; Yousefi, S.; Kalantari, Z.; Uuemaa, E.; Teimurian, T.; Keesstra, S.; Pham, T.; Tien Bui, D. Multi-Hazard Exposure Mapping Using Machine Learning Techniques: A Case Study from Iran. Remote Sens. 2019, 11, 1943. [Google Scholar] [CrossRef]
  44. Youden, W.J. Technique for Testing Accuracy of Analytical Data. Anal. Chem. 1947, 19, 946–950. [Google Scholar] [CrossRef]
  45. Harvey, E.L.; Kincey, M.E.; Rosser, N.J.; Gadtaula, A.; Collins, E. Landslide Inventories for Nepal: Database 2010–2021; Zenodo: Geneva, Switzerland, 2023. [Google Scholar]
  46. Harvey, E.L.; Kincey, M.E.; Rosser, N.J.; Gadtaula, A.; Collins, E.; Densmore, A.L.; Dunant, A.; Oven, K.J.; Arrell, K.; Basyal, G.K.; et al. Review of Landslide Inventories for Nepal between 2010 and 2021 Reveals Data Gaps in Global Landslide Hotspot. Nat. Hazards 2025, 121, 5075–5101. [Google Scholar] [CrossRef]
  47. British Geological Survey (BGS). Polygon Inventory of 183 Landslides Mapped Across Langtang Valley, Nepal (NERC Grant NE/L002582/1); British Geological Survey: Nottingham, UK, 2025. [Google Scholar]
  48. National Disaster Risk Reduction and Management Authority (NDRRMA). BIPAD Portal. Ministry of Home Affairs, Government of Nepal. 2025. Available online: https://bipadportal.gov.np/ (accessed on 30 June 2025).
  49. UNOSAT. Satellite Detected Water Extent, Koshi and Madhesh Provinces, Nepal, as of 01 October 2024. 2024. Available online: https://data.humdata.org/dataset/satellite-detected-water-extent-koshi-and-madhesh-provinces-nepal-as-of-01-october-2024?force_layout=desktop (accessed on 29 June 2025).
  50. Storchak, D.A.; Di Giacomo, D.; Engdahl, E.R.; Harris, J.; Bondár, I.; Lee, W.H.K.; Bormann, P.; Villaseñor, A. The ISC-GEM Global Instrumental Earthquake Catalogue (1900–2009): Introduction. Phys. Earth Planet. Inter. 2015, 239, 48–63. [Google Scholar] [CrossRef]
  51. Di Giacomo, D.; Engdahl, E.R.; Storchak, D.A. The ISC-GEM Earthquake Catalogue (1904–2014): Status after the Extension Project. Earth Syst. Sci. Data 2018, 10, 1877–1899. [Google Scholar] [CrossRef]
  52. Storchak, D.A.; Di Giacomo, D.; Bondar, I.; Engdahl, E.R.; Harris, J.; Lee, W.H.K.; Villasenor, A.; Bormann, P. Public Release of the ISC-GEM Global Instrumental Earthquake Catalogue (1900–2009). Seismol. Res. Lett. 2013, 84, 810–815. [Google Scholar] [CrossRef]
  53. Dandridge, C.; Stanley, T.A.; Kirschbaum, D.B.; Lakshmi, V. Spatial and Temporal Analysis of Global Landslide Reporting Using a Decade of the Global Landslide Catalog. Sustainability 2023, 15, 3323. [Google Scholar] [CrossRef]
  54. Jena, R.; Pradhan, B.; Almazroui, M.; Assiri, M.; Park, H.-J. Earthquake-Induced Liquefaction Hazard Mapping at National-Scale in Australia Using Deep Learning Techniques. Geosci. Front. 2023, 14, 101460. [Google Scholar] [CrossRef]
  55. Rahman, M.Z.; Siddiqua, S.; Kamal, A.S.M.M. Liquefaction Hazard Mapping by Liquefaction Potential Index for Dhaka City, Bangladesh. Eng. Geol. 2015, 188, 137–147. [Google Scholar] [CrossRef]
  56. Youd, T.L.; Perkins, D.M. Mapping of Liquefaction Severity Index. J. Geotech. Eng. 1987, 113, 1374–1392. [Google Scholar] [CrossRef]
  57. Dhital, M.R. Geology of the Nepal Himalaya; Regional Geology Reviews; Springer International Publishing: Cham, Switzerland, 2015; ISBN 978-3-319-02495-0. [Google Scholar]
  58. Chen, C.-M.; Hollingsworth, J.; Clark, M.K.; Chamlagain, D.; Bista, S.; Zekkos, D.; Siwakoti, A.; West, A.J. Erosional Cascade during the 2021 Melamchi Flood. Nat. Geosci. 2025, 18, 32–36. [Google Scholar] [CrossRef]
  59. Pradhan, A.M.S.; Ghimire, P.; Bishwas, N. From Data to Predictions: Landslide Susceptibility Map of Nepal. Google Earth Engine, 2025. Available online: https://wrradc.users.earthengine.app/view/landsusnepal (accessed on 29 June 2025).
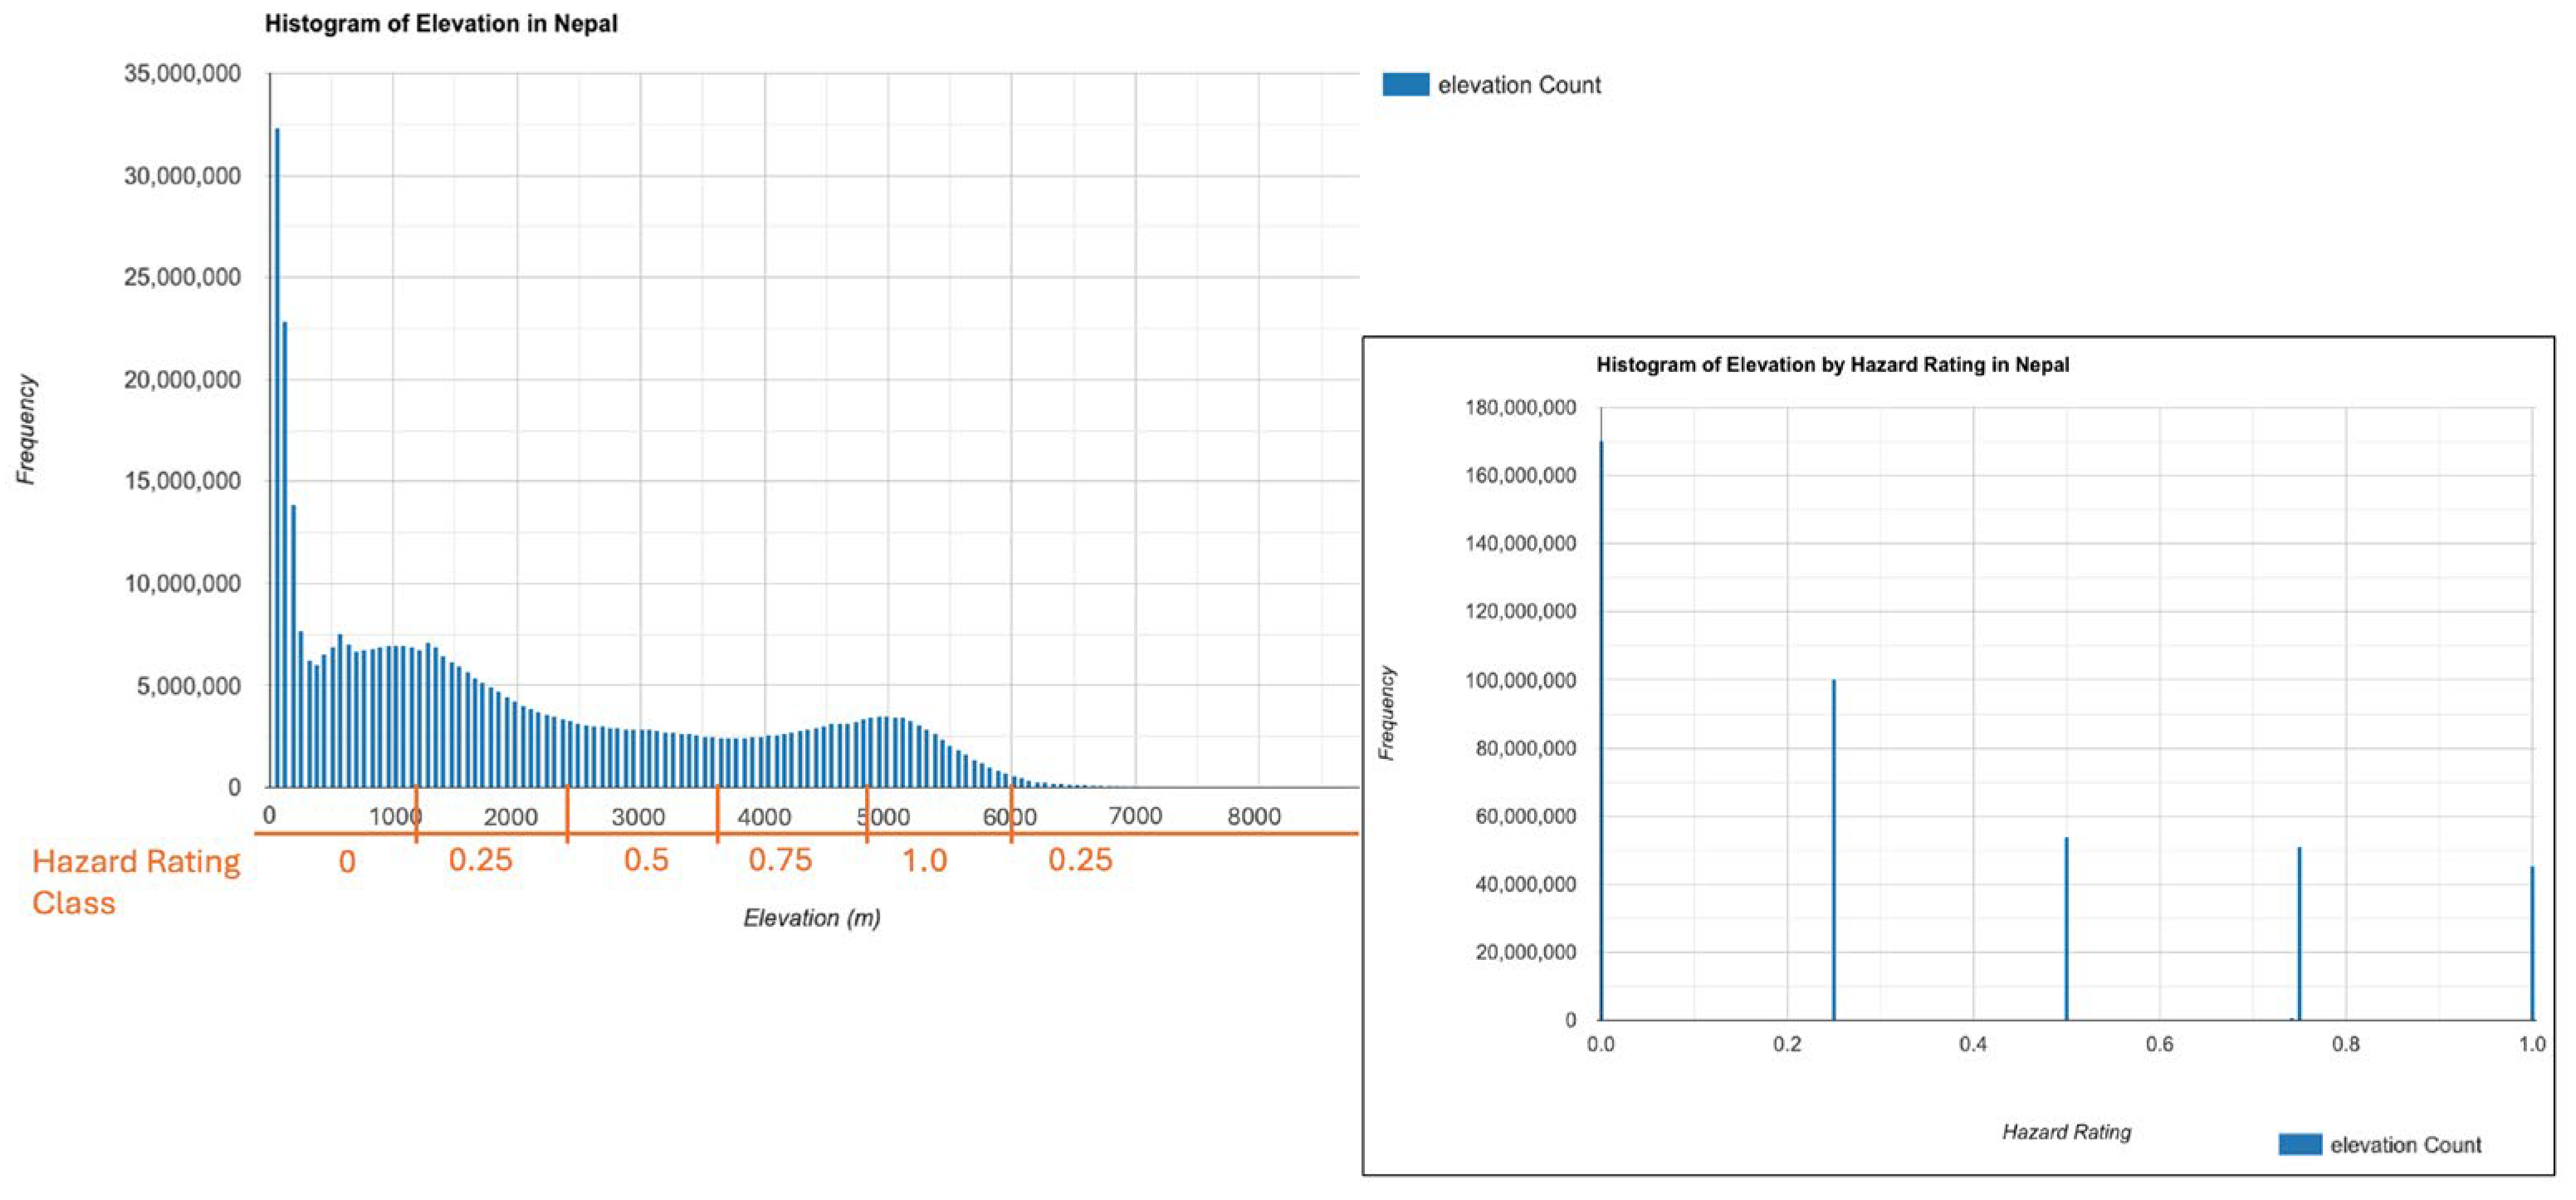
Figure 2. The relationship between the input factor data values and the assigned hazard rating values for the elevation layer used within the landslide hazard index. The histogram on the left shows the frequency of pixels distributed by elevation in Nepal, whereas the histogram on the right shows the frequency of pixels distributed by hazard rating in Nepal.
Geohazards 06 00063 g002
Figure 3. Examples outputs for Nepal from MiMapper: (a) Aggregated hazard, (b) Earthquake Hazard, (c) Landslide Hazard, (d) Flooding Hazard, and the raw data input layers for (e) Elevation (SRTM), and (f) Land Cover (European Space Agency) showing the spatial variability in each of these six layers within MiMapper. Further detail can be explored by accessing MiMapper (https://ee-multihazardmapping.projects.earthengine.app/view/mimapper (accessed on 23 September 2025)).
Geohazards 06 00063 g003
Table 1. The percentage of each hazard category for the four main hazard maps: Aggregated hazard, earthquake hazard, flooding hazard, and landslide hazard.
MiMapper CategoryAggregated HazardEarthquake HazardFlooding HazardLandslide Hazard
Very High0.005.820.470.00
High6.6412.6013.920.09
Medium48.4421.9533.1581.14
Low45.3457.6252.7218.97
Very Low0.002.150.120.00
Table 2. Key validation statistics for each hazard layer at a 0.5 or above threshold against whole Nepal validation data including: Sensitivity, Specificity, Precision, F1 Score, Accuracy, and Area under the Curve (AUC).
Validation MetricFloodingLandslide
Sensitivity0.6370.898
Specificity0.3830.419
Precision0.1160.627
F1 Score0.1960.738
Accuracy0.4120.668
AUC0.4700.719
Disclaimer/Publisher’s Note: The statements, opinions and data contained in all publications are solely those of the individual author(s) and contributor(s) and not of MDPI and/or the editor(s). MDPI and/or the editor(s) disclaim responsibility for any injury to people or property resulting from any ideas, methods, instructions or products referred to in the content.