Article

Adaptive Harmony Search-Based Optimization of Tuned Mass Damper Inerters Under Near-Fault Earthquake Records

1
Department of Civil Engineering, Istanbul University-Cerrahpasa, 34320 Istanbul, Turkey
2
Department of Civil & Environmental Engineering, Temple University, Philadelphia, PA 19122, USA
3
College of IT Convergence, Gachon University, Seongnam 13120, Republic of Korea
*
Authors to whom correspondence should be addressed.
GeoHazards 2025, 6(3), 56; https://doi.org/10.3390/geohazards6030056
Submission received: 15 August 2025 / Revised: 4 September 2025 / Accepted: 9 September 2025 / Published: 11 September 2025

Abstract

Dynamic effects such as wind, traffic, and earthquakes can cause loss of life and property. Since tall buildings are more sensitive to these vibrations, vibration control is an important issue in civil engineering. In this study, the Adaptive Harmony Search (AHS) was used to determine the optimum TMDI parameters. AHS shares similar steps with the classic Harmony Search (HS), which simulates the process of musicians creating new harmonies. However, unlike HS, it uses harmony memory consideration rate (HMCR) and pitch adjustment rate (PAR) values that are updated at each search step, rather than fixed HMCR and PAR values. The aim of the optimization is to minimize the maximum displacement of the upper floor in a 10-story shear building against different earthquake records. To evaluate the performance of the TMDI system, displacement and total acceleration under seismic loading were analyzed. As a result, the TMDI reduced displacement by 35% and 13.33% for non-pulse and pulse, respectively, for near-fault earthquake records. These reductions indicate that the structure’s resistance to dynamic loads can be enhanced using control systems.

1. Introduction

Shelter, one of the most basic needs of humanity, is nowadays easily provided with highly developed techniques. The aim of structural engineering is to design adequately safe and economical structural systems against various types of external loads. One of the most difficult issues in this regard is earthquakes. It is necessary to take precautions against earthquakes, which can have extremely destructive effects on structures. Also, the design of tall buildings is challenging due to their increased sensitivity to dynamic wind loads. As the height of a building increases, its structural stiffness decreases. Resonance can occur, especially in flexible and thin structures. Wind-induced vibrations can adversely affect structural performance, the comfort of occupants, and the operation of equipment inside the building. Damping plays a critical role in these systems. Since natural damping is often insufficient in many tall buildings, engineers use additional damping devices. Studies conducted to date have shown that these devices are critical in improving the dynamic performance of tall buildings.
There are important developments for the safe and economical design of structural systems with adequate strength, stiffness and ductility. One of these developments is structural control systems. Structural control systems are classified as passive, active, hybrid, and semi-active. Among these structural control systems, passive structural control systems are the most commonly used. Passive control devices do not require an external power source (Figure 1). The device uses the forces generated in the device due to building movement. Thus, there is no need for external power and using an active control algorithm. This makes passive control devices ideal and attractive for vibration suppression and offers simplicity compared to other control methods. As a result, passive control devices have become widely used for structures. Examples of passive control devices include base isolation systems and tuned mass dampers (TMDs).
Tuned mass dampers (TMDs) are mechanical systems that reduce the amplitude of dynamic vibrations in structures. The theoretical foundations of the TMD system date back to 1928, when Ormondroyd and Den Hartog [2] introduced the concept of dynamic vibration dampers. TMDs are typically installed on the top floors of buildings to reduce swaying caused by wind forces, traffic, and equipment vibrations. Since they can be used as passive complementary energy dissipation devices, TMDs are represented by a mass connected to the main structure via a spring and a parallel damper [3].
A Tuned Mass Damper Inerter (TMDI) is a relatively new passive control mechanism that has been developed by adding inertia components to the traditional TMD system. It provides higher performance in suppressing structural vibrations by generating additional inertia forces through small masses. The inerter reduces the mass requirement of the TMD, thereby enabling the same vibration control as a lighter TMDI.
Inerter is a lightweight mechanical mass element that connects two independently moving nodes and generates inertial force in response to the relative acceleration at their endpoints [4]. The inerter force can be defined by Equation (1). In Equation (1), x ¨ 1 and x ¨ 2 are the accelerations at the two terminals. b is the inertia and its unit is kilogram. Figure 2 shows chematic representation of the inerter and Figure 3 shows examples of inerter devices.
F = b ( x ¨ 1 x ¨ 2 )
Recent research has focused intensively on the optimization of TMDI systems. Ruiz et al., 2018 [5] used time domain response analysis and probabilistic life cycle criteria on a 21-story building by adopting a multi-objective (Life cycle cost, Repair cost based on return period, and Inerter force) design approach. The study revealed that the use of TMDI can reduce life cycle and repair costs together, but this is achieved through increased inerter strength. They also concluded that connecting the inerter to the lower floors significantly improves performance. Lara-Valencia et al., 2020 [6] performed an optimization study by determining the critical damping ratio (ζTMDI) and frequency ratio (uTMDI) of TMDI using parameters such as mass ratio (µ) and inertia ratio (β). In the numerical analysis conducted on 1,968,192 cases using four different performance indices defined in the study (J1: Minimizes maximum peak displacement; J2: Minimizes RMS displacement, J3: Minimizes interstory drift; JP: Minimizes the weighted sum of these three indices), the results showed that TMDIs designed with the proposed optimization method can reduce structural responses by up to 35%. Domizio et al., 2022 [7] optimized TMDI parameters with a Genetic Algorithm in analyses with several near-fault ground motions including three building and velocity pulses with different periods. Through analysis in the time domain, the TMDI performance was related to the pulse frequency and oscillatory structure of the ground motion. The results show that properly designed TMDIs can effectively mitigate structural responses under certain conditions. Abd-Elhamed and Alkhatib 2023 [8] investigated the effect of TMDI on the response of linearly behaving multi-degree-of-freedom (MDOF) structures under earthquakes from far and near-fault sources. The optimum TMDI parameters are determined by a Genetic Algorithm to minimize the inter-story drift and peak story acceleration. The analysis shows that TMDI outperforms TMD even at low mass ratios. Aydın et al., 2024 [9] determined the optimum TMDI parameters with the Adaptive Harmony Search (AHS) algorithm using far fault ground motions. The effect of the coupling of the inerter at different stories was investigated and the best result was obtained at the 5th story. The results of the study showed that TMD and TMDI reduced the displacement by 21.87% and 25.45% and the total acceleration by 25.45% and 19.59%, respectively, increasing the resilience of the structures against dynamic loads. Peng and Sun 2024 [10] performed reliability-based design optimization (RBDO) of TMDI by combining probability density evolution method (PDEM) with Genetic Algorithm (GA) to reduce structural vibration under non-stationary stochastic excitations. They analyzed a single degree of freedom system at different inertia-to-mass ratios and compared the proposed method with theoretical and variance-based solutions. The results of the study show that TMDI offers probabilistic advantages such as higher vibration reduction, lower mass requirement and reduced stroke requirement. Farsijani et al., 2024 [11] optimized TMDI parameters for peak displacement and top floor acceleration of a 10-story structure for different earthquake frequency contents and structural properties using Particle Swarm Optimization (PSO). As a result, it was observed that the optimum parameters optimized the structural response with less than 3% difference and the optimum parameter values increased as the inertance ratio increased. Pandit et al., 2024 [12] performed TMDI optimization by adopting the minimization of top floor displacement transfer functions as the objective function to reduce excessive vibrations of multi-degree-of-freedom (MDOF) buildings during earthquakes. Three different algorithms (particle swarm optimization (PSO), slime mold algorithm (SMA) and Harris Hawks optimization (HHO)) were used in the optimization under 18 real earthquake records. As a result, the TMDI parameters (mass ratio, frequency ratio, damping ratio and inertia ratio) obtained with SMA showed the best result (maximum displacement reduction between 83–86%). Shahraki and Chaleshtori 2025 [13] optimized the parameters of the nonlinear tuned mass damping inertial system (NTMDI), TMD and TMDI systems using the Slime Mold Algorithm (SMA) to minimize the maximum relative roof displacement of a 10-story steel shear frame under 10 different earthquake effects. As a result, TMDI performed better than TMD due to inertial amplification. The NTMDI reduced the roof displacement by 23.80% compared to the uncontrolled structure. Akbari et al., 2025 [14] used a multi-objective fitness-based algorithm (MOFDO) to optimize TMDI parameters and inerter location in a 10-story shear frame building under soil-structure interaction (SSI) and fixed base conditions. The results of the study using real earthquake records show that TMDIs, especially those placed at lower floors, reduce seismic responses (displacement, acceleration, inter-story slip) more effectively and the performance improves with increasing ground stiffness. Abdeddaim et al., 2025 [15] used a nonlinear single-degree-of-freedom system described by the Bouc-Wen hysterical model and applied a Genetic Algorithm (GA)-based optimization method for optimization to compare how TMDI systems perform in nonlinear hysterical building structures under nonlinear structures and realistic earthquake inputs. According to the results obtained from the analysis including eight different earthquake records, GA-optimized TMDIs provided significant displacement reduction for nonlinear structures.
Although these studies differ in terms of the algorithms used, they show an increasing trend toward the application of advanced numerical techniques for TMDI optimization and seismic design under complex structural and loading conditions. Near-fault earthquake records contain velocity pulses and large displacement demands due to the rupture directivity effect. For that reason, these movements lead to severe damage to structures. Since control systems are optimized for specific analyses, near-fault effects need to be considered in the optimization process. This study aims to find the optimum TMDI design that will minimize the seismic vibrations of a 10-story shear building exposed to different types of near-fault earthquake records. To this end, the mass, stiffness, damping, and inertia parameters of the TMDI are determined in such a way as to minimize the maximum displacement of the upper floor.
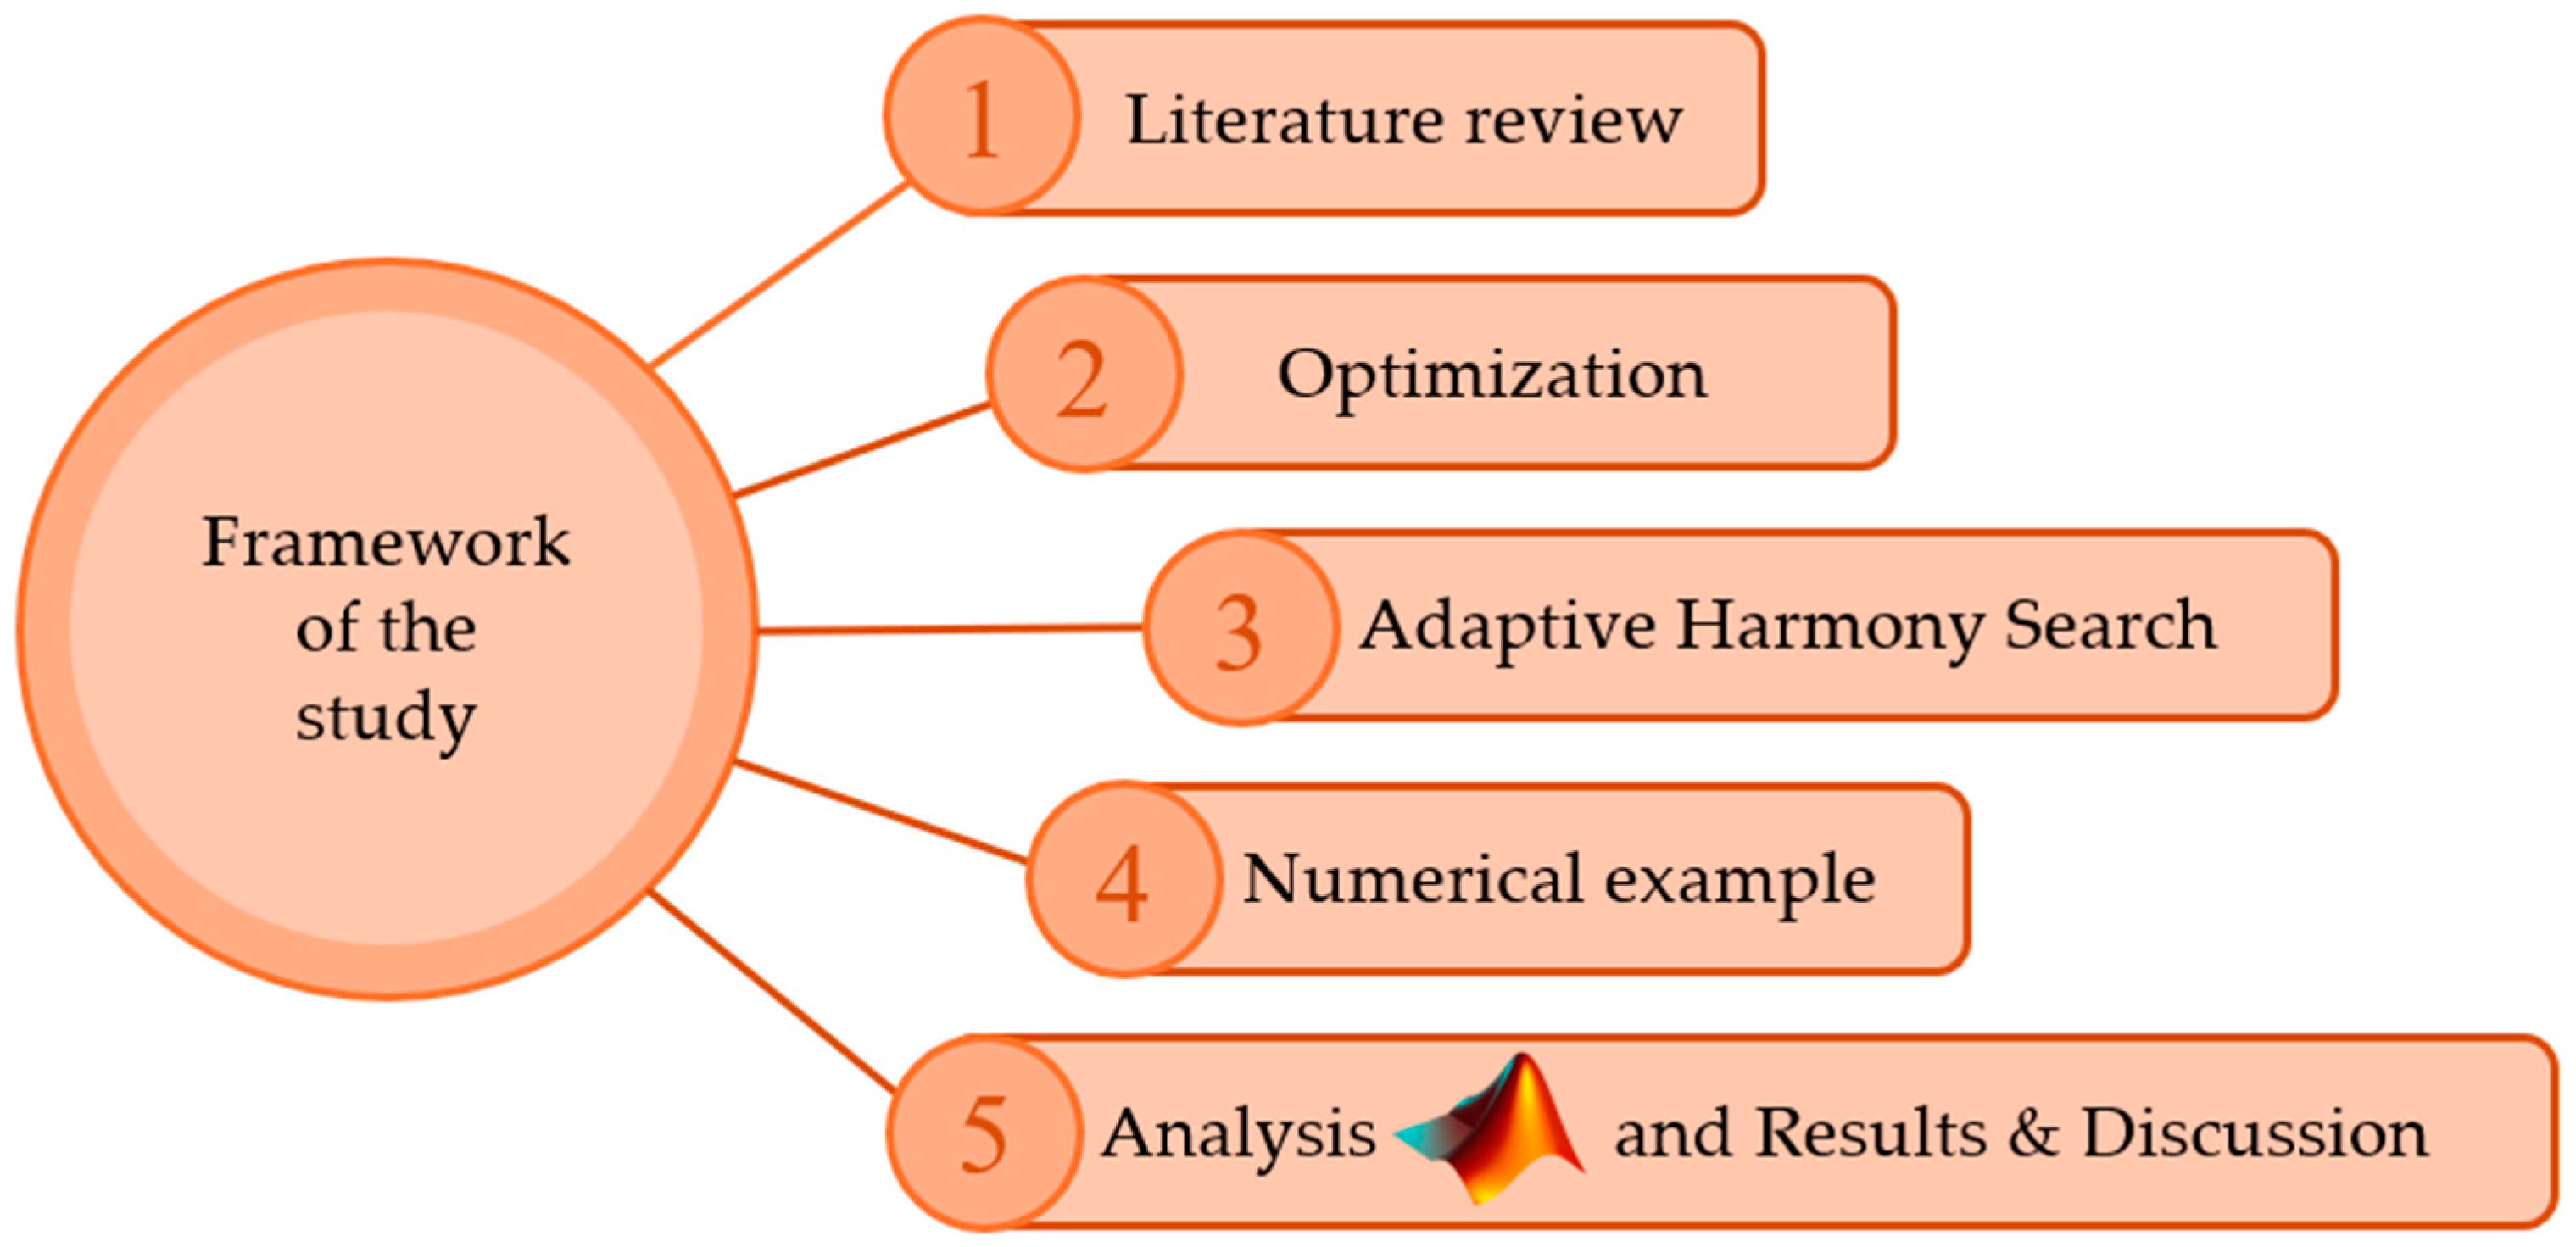
In this study, the purpose of the study is first stated in the Section 1, and existing methods in the literature are compiled. Then, in the Section 2, optimization and the optimization algorithm to be used in the study are defined, and a numerical example is detailed. Subsequently, performance criteria (optimum values, etc.) are presented in the Section 3. In the Section 4, the strengths and weaknesses of the method are evaluated, studies in the literature are tabulated, the potential for real-world applications is discussed, and recommendations for future studies are provided. Finally, in the Section 5, the most important findings from the study, the contributions made, and general recommendations are summarized (Figure 4).

2. Materials and Methods

2.1. Optimization

Optimization algorithms are basically classified as deterministic and heuristic methods. However, since real-world problems are often complex, deterministic methods may be inadequate. In these cases, heuristics are preferred, especially when the function is nonlinear or high dimensional. In recent years, population-based algorithms inspired by living organisms, biological or physical phenomena have become widespread due to their low computational cost and wide adaptability. The optimization process aims to identify the best option by scanning the solution space. Optimization algorithms are widely used to increase efficiency and reduce costs in many fields such as engineering [16], finance [17], and healthcare [18].
Metaheuristic algorithms are methods that provide efficient and flexible solutions to complex problems where traditional optimization methods are inadequate. By balancing exploration and exploitation, these algorithms can scan large solution spaces and increase the probability of reaching the global best solution. Since the success of these algorithms largely depends on the correct parameter settings, designing them to be adaptive can significantly improve both the solution quality and the efficiency of the search process. Therefore, Adaptive Harmony Search (AHS) was chosen in this study. While HMCR and PAR values had to be set manually and trial and error was required in Harmony Search (HS), AHS was used because it automatically optimized these values during the process. The analysis process was performed with MATLAB (R2018a) [19].

2.2. Adaptive Harmony Search (AHS)

Harmony Search Algorithm (HS) is an optimization method developed by Geem et al. [20] in 2001. HS is an optimization algorithm inspired by the process of jazz musicians searching for the best harmony during improvisation. In jazz, musicians try to find the best harmony with either random notes or harmonized notes based on previous experience; similarly, HS aims to reach the optimum result through randomly generated or previously recorded solutions (Figure 5) [20].
In the algorithm, variables represent instruments, and variable values represent notes. Each solution is called a “harmony,” and the harmony memory is continuously updated through random search.
HS algorithm has been successfully applied in many fields [22,23,24] and has been used in the field of civil engineering for the truss optimization based on discrete sizing variables [25], parameter optimization for enhanced tuned mass damper performance [26], design optimization of reinforced concrete frames considering environmental impact the optimum design of steel frames [27], optimization of laminated composite structures [28], and optimum design of post-tensioned concrete cylindrical wall dimensions [29].
The parameters of the algorithm such as HMS (harmony memory size), HMCR (harmony memory consideration rate) and PAR (pitch adjustment rate) are defined. After defining the stopping criterion (maxiter), the design variables and their lower and upper limit ranges, the Harmony Memory (HM) matrix is created. This matrix consists of solution vectors, and the size of the matrix represents the number of solutions to be stored in memory. The solution vector is constructed to contain as many design variables as the previously defined HMS and the size of the population of solution candidates is defined as the harmony memory size (HMS). Each design variable is generated by randomly selecting within the defined solution ranges. Therefore, when HMS is n, n randomly selected solution candidates are generated within the defined boundaries and stored in the HM matrix as shown in Equation (2). Each column of the matrix in Equation (2) represents a design variable. After analyzing the solutions, the objective functions are calculated for each solution in the harmony memory matrix (Equation (2)). After these calculations, the solutions are organized in the matrix in ascending order according to their objective function values. In Equation (2), f(xi) is the value of vector xi in the objective function.
x 1 1 x 1 2 x 2 1 x 2 2 x 1 H M S 1 x 1 H M S x 2 H M S 1 x 2 H M S       x N 1 1 x N 1 x N 1 2 x N 2       x N 1 H M S 1 x N H M S 1 x N 1 H M S x N H M S f ( x 1 ) f ( x 2 ) f ( x H M S 1 ) f ( x H M S )
Then, the process proceeds to the new harmony improvisation stage. Harmony Memory Considering Rate (HMCR) value determines whether the decision variables in the new harmony vector are selected from the existing harmony memory or randomly from the solution space. This is performed separately for each variable in the vector x′. The selection method is given in Equation (3).
x i , n e w = x i , m i n + r a n d ( ) × x i , m a x x i , m i n   i f   H M C R > r 1 x i , n e w = x i , m i n + r a n d ( ) × x i , m a x x i , m i n   i f   H M C R   r 1
After the selection process, the PAR parameter is used to decide whether a tone adjustment is required for each decision variable. This process is expressed by Equation (4).
x n e w = x n e w r a n d × b w ,                 P A R x n e w ,                                 ( 1 P A R )
The objective function value of the newly created harmony vector is compared with the records in memory. If it is worse, it is replaced with the worst value in memory; if not, the solution is kept. The steps of creating a new harmony vector and updating the harmony memory are repeated until the defined stop criterion (maxiter) is reached.
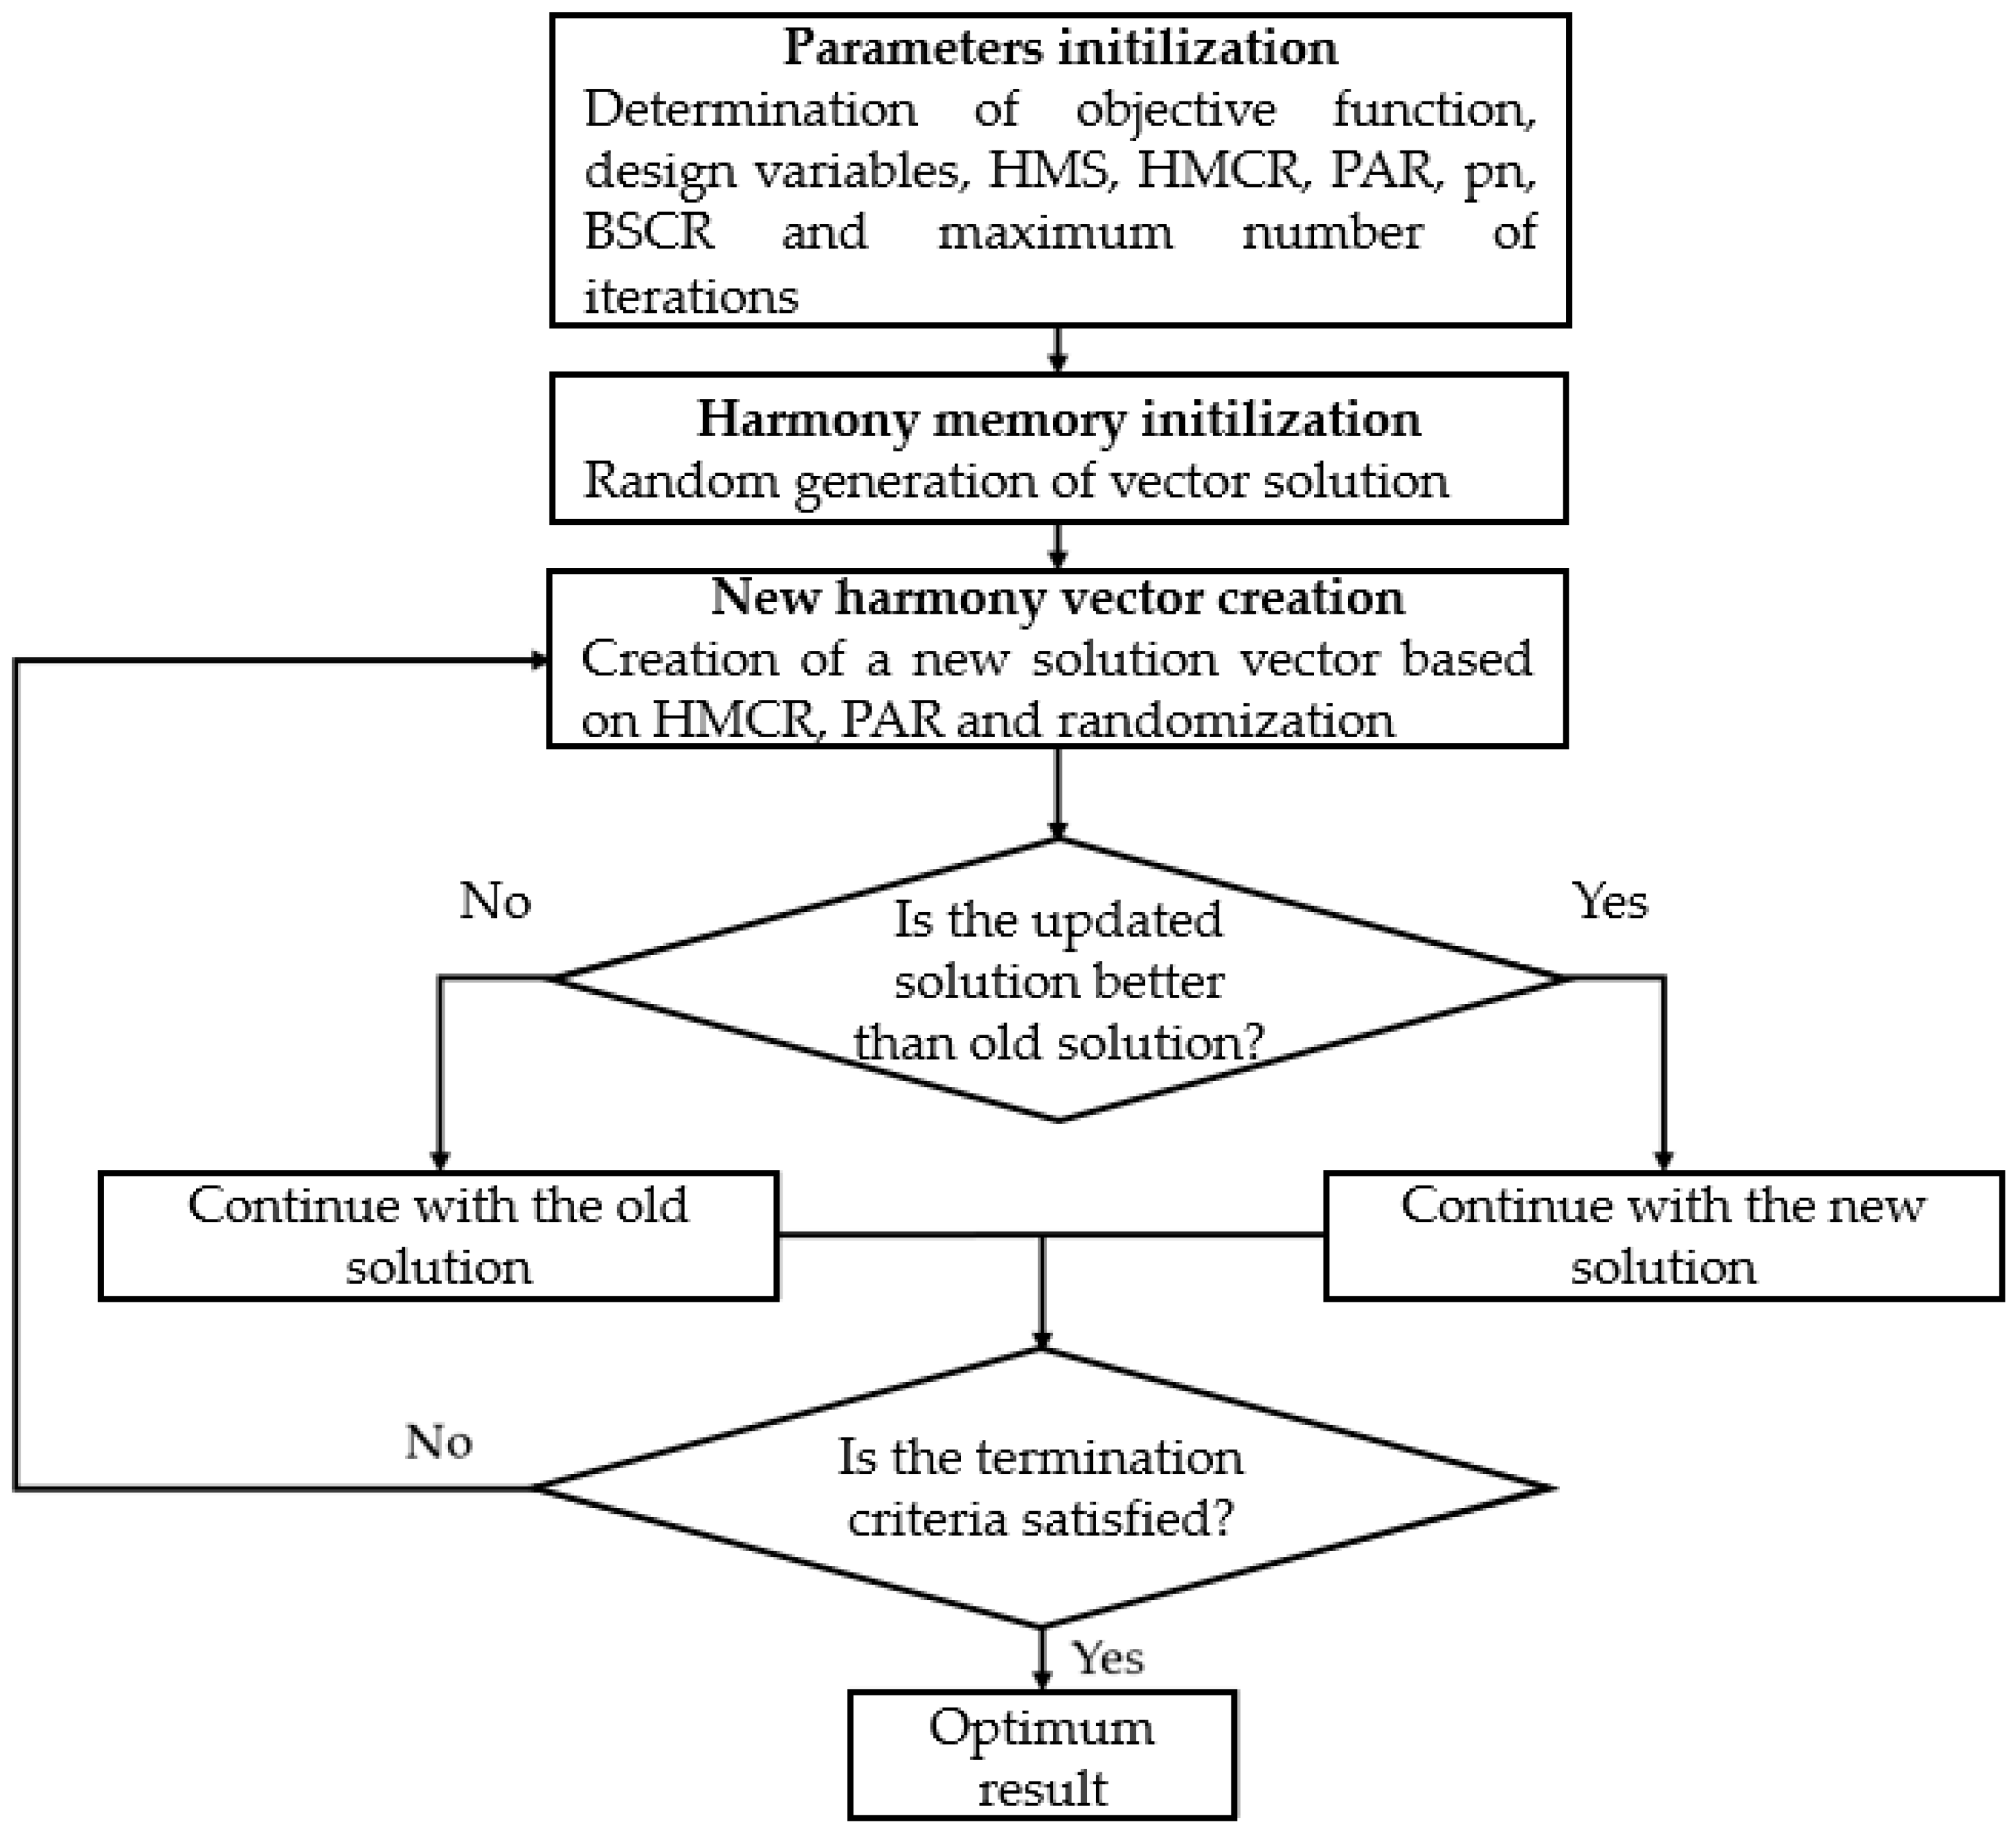
Although the HS method is an effective search technique, it cannot adapt to changing conditions because it uses fixed search parameters throughout the entire search process. The Adaptive Harmony Search (AHS) method was developed by Saka et al. [30] to improve this situation. While AHS shares similarities with HS in terms of its basic steps, it uses dynamic HMCR and PAR values that are updated at each search step, rather than the fixed HMCR and PAR values specified in Equations (5) and (6). HMCR indicates the probability of a decision variable’s value being selected from the current harmony memory, while the PAR value is a parameter that determines the probability of the design variable selected from the harmony memory being modified or not.
H M C R = H M C R i n i t i a l   ( 1 t m t )
P A R = P A R i n i t i a l   ( 1 t m t )  
In Equations (5) and (6), mt is the number of iterations and t is the iteration number, while HMCRinitial and PARinitial are the initial values of HMCR and PAR, respectively. Figure 6 shows the AHS flowchart.

2.3. Numerical Example

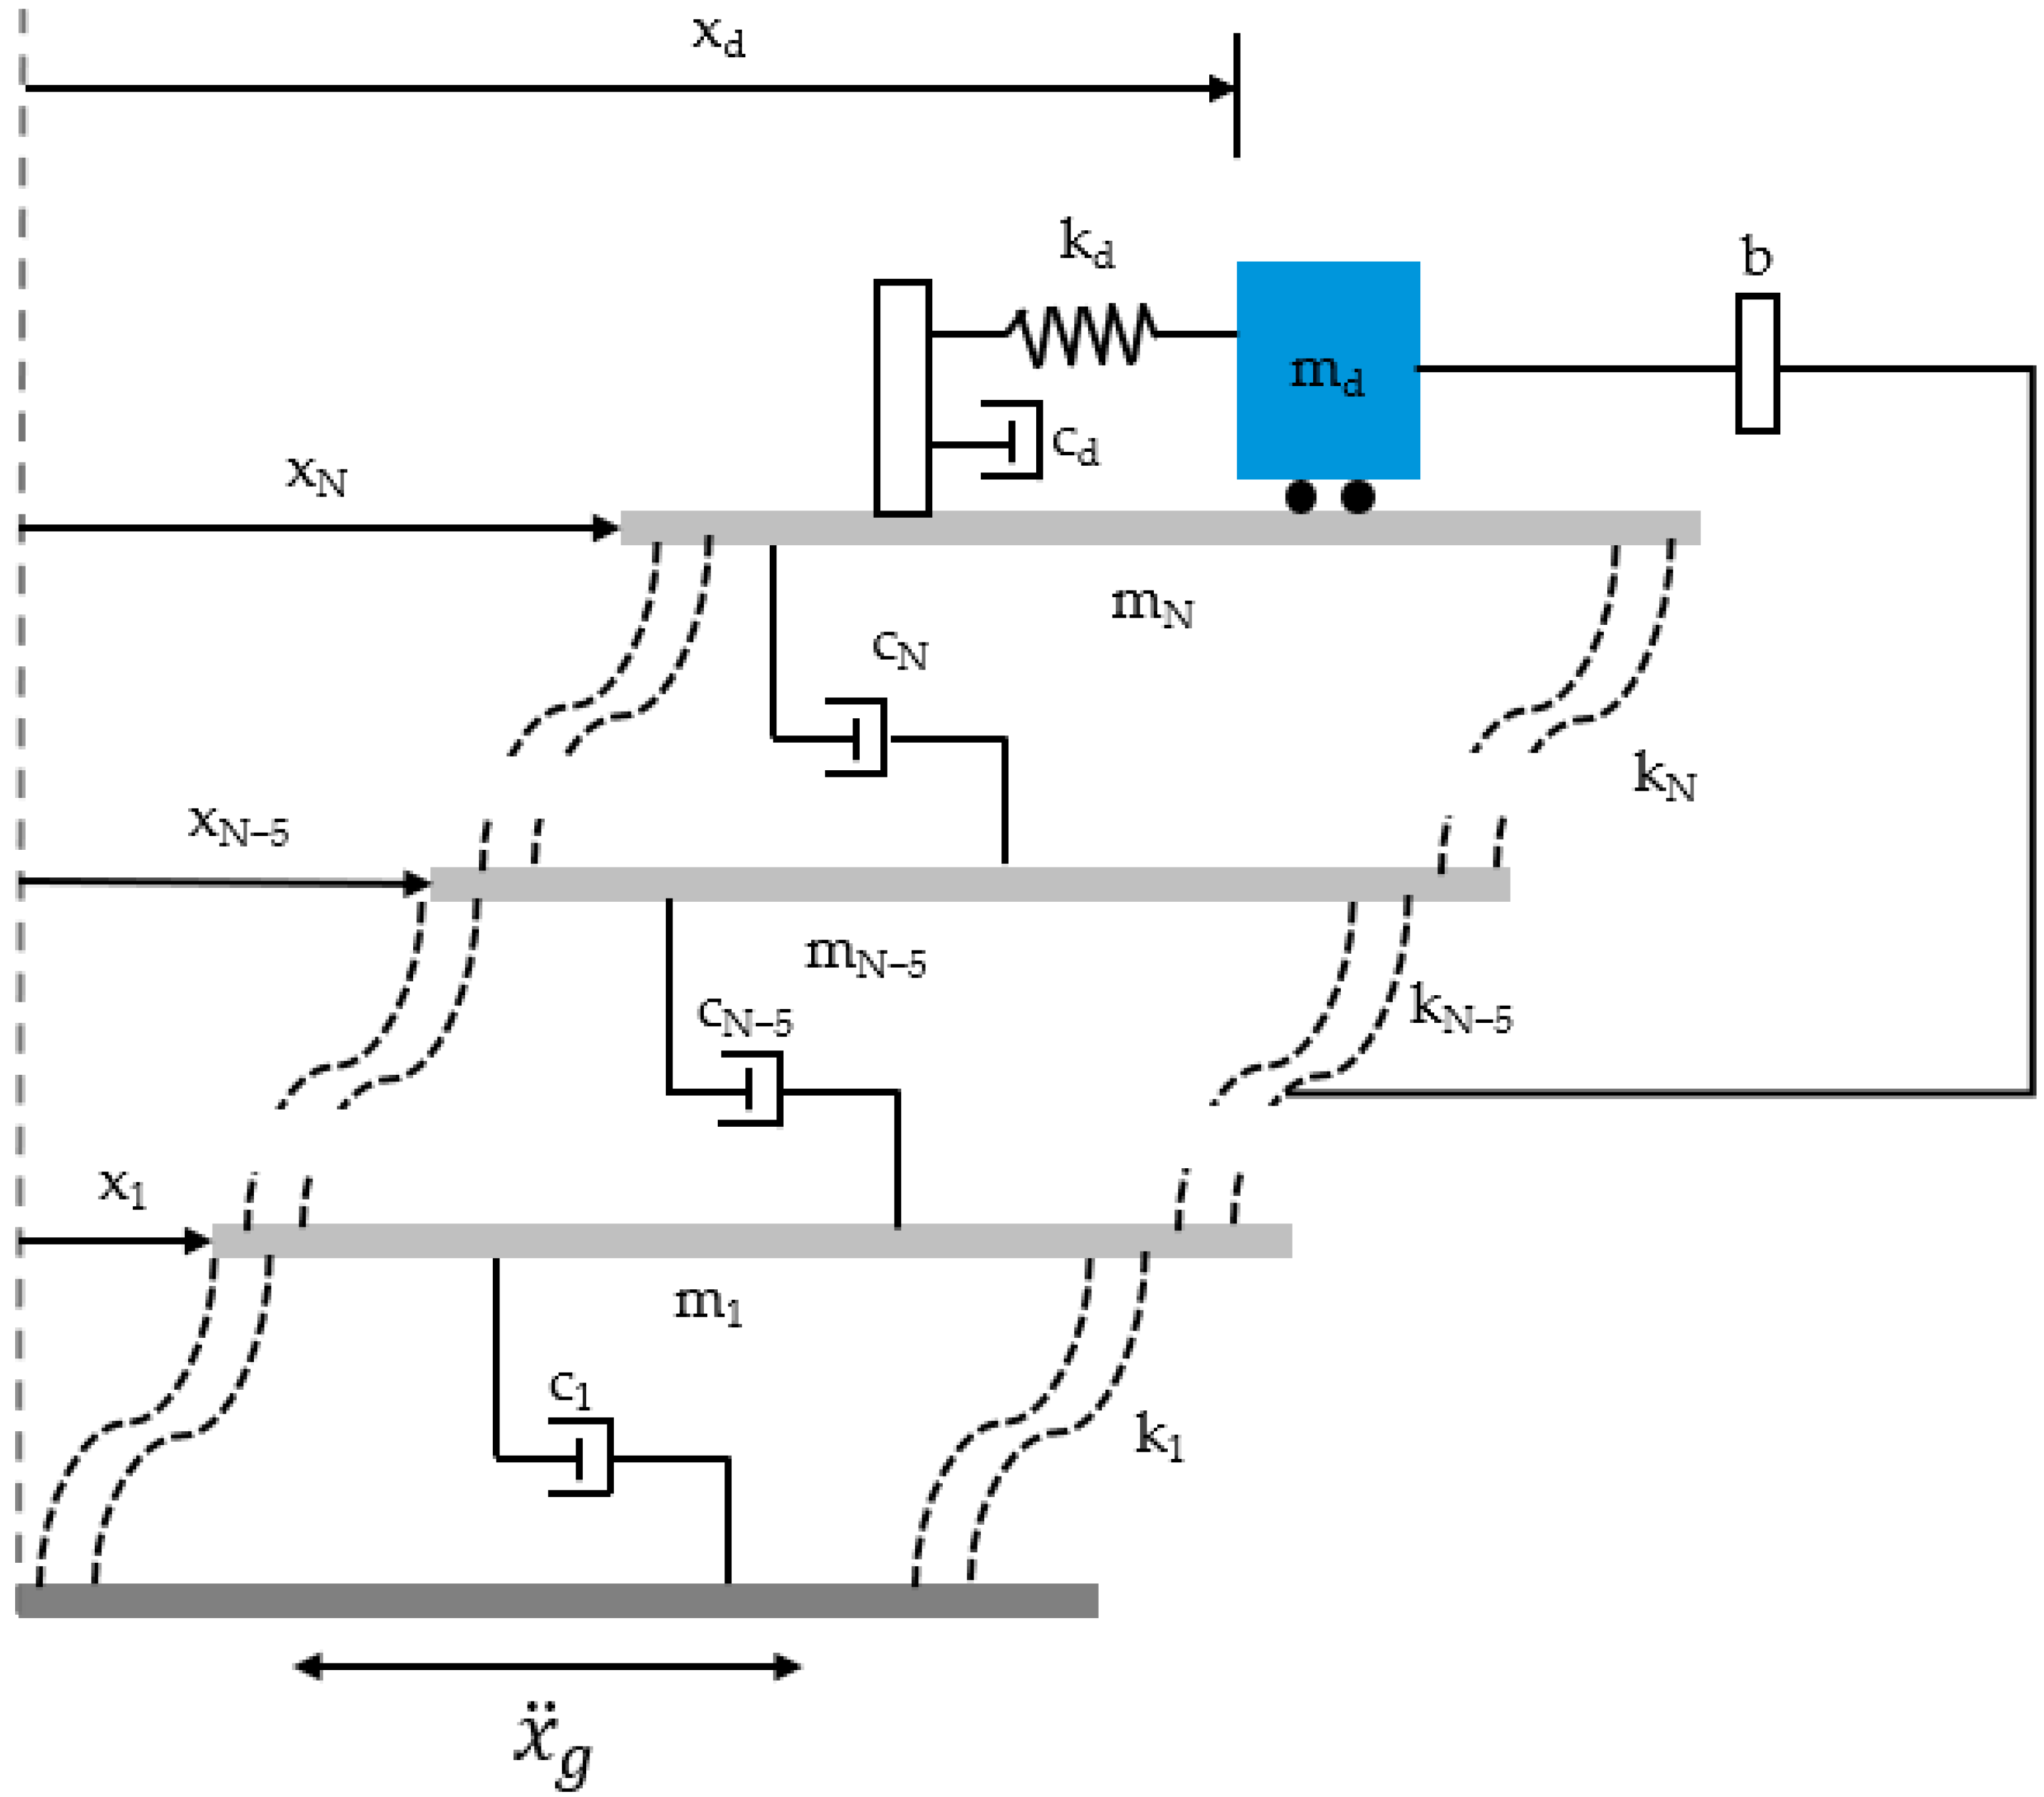
In this study, the aim is to obtain the optimum TMDI parameters by minimizing the displacement response and acceleration response of a 10-story shear building equipped with TMDI on the 5th floor. The system to be analyzed consists of a 10-degree-of-freedom structure with mass (ms), stiffness (ks), and damping ratio (ξs), and a TMDI with mass (mtmdi), stiffness (ktmdi), and damping ratio (ξtmdi).
The equation of motion of the structure was created in matrix form using the mass, stiffness, and damping parameters of the TMDI and modeled in MATLAB Simulink. When the lateral movement of each floor is considered as one degree of freedom, an n-story building is expressed as having n degrees of freedom. When TMDI is added, the system has n + 1 degrees of freedom. The view of the 10-story shear building is presented in Figure 7. More detailed characteristics of this building are given in Table 1.
The equation of motions of an N-story shear building controlled by the TMDI system can be expressed in matrix form using Equation (7). In Equation (7), the displacement vector x(t) is used, which includes the relative displacements of each floor relative to the building and the displacement of the TMDI. The mass (M), stiffness (K), and damping (C) matrices are combined with this vector to form the motion equation.
M x ¨ t + C x ˙ t + K x t = M 1 X ¨ g
Earthquake forces from the ground are included in the model as external excitation in the form of the product of the unit vector [1] used to define the mass matrix and the ground acceleration. The dot operator (˙) in the vectors indicates the derivative with respect to time t. x(t) and −M [1] represent the ground displacement and load vector, respectively. The parameters of the TMDI system are denoted as mass (mtmdi), stiffness (ktmdi), and damping (ctmdi), respectively.
The optimization problem performed using AHS has four design variables. These are mtmdi, period (Ttmdi), damping ratio (ξtmdi), and mass of inerter (b). In this study, TMDI’s displacement limitations were considered. Other practical applications including acceleration limitation of TMDI may also be considered [31]. The aim of optimization using AHS is to minimize the response of the structure. The response is expressed as the displacement of the top floor (xN). The objective function is calculated using the values of randomly generated design variables in the population during each iteration. The initial objective function for an N-story building is shown in Equation (8).
f x = m i n ( m a x X )
The objective function controls the relationship between the maximum displacement of the floor where the TMDI is located (xtmdi) and the displacement of the floor below by limiting the movement of the TMDI with the g1 function, and prevents the stroke capacity limitation (stmax) value from being exceeded. stmax is a value determined by the user that represents the stroke capacity of the TMDI. Equation (9) is normalization based on the uncontrolled structure.
g 1 = m a x ( x t m d i x N ) w i t h   T M D I m a x ( x N ) n o T M D I < s t m a x
Table 2 shows the limit values determined for the design variables of the TMDI system. These ranges are generally chosen according to feasible values of practice.
In the first step of optimization, algorithm parameters, design constants, variable ranges, and user limit values are defined. Design constants are the mass, stiffness, and damping of the structure. The simulation time and stmax are determined by the user. stmax is set to 1.5. The algorithm parameters are HMS, HMCR, PAR, population size (pn), and the best solution consideration ratio (BSCR). The BSCR value is set to 0.3 to prevent getting stuck in a local optimum. The pn value is 10. Parameter settings for AHS are given in Table 3.
Twenty-eight near-field ground motion records (pulse and non-pulse) with different characteristics were selected from the Federal Emergency Management Agency (FEMA) lists [32] to perform a comprehensive study by including various ground motions with a wide range of parameters, including peak ground acceleration (PGA) and peak ground velocity (PGV). These seismic records are given in Table 4 and Table 5 with Record Sequence Number, Horizontal Records (FN), Horizontal Records (FP), maximum peak ground acceleration (PGAmax), maximum peak ground velocity (PGVmax). M is the magnitude. In this study, a 10-story shear building is subjected to the earthquakes listed in Table 4 and Table 5.
There are two types of near-fault earthquakes used (non-pulse and pulse). Table 5 gives the characteristics of ground motion records (non-pulse).

3. Results

The effect of TMDI was investigated using 14 pulse and 14 non-pulse FEMA earthquake records (near-fault) in a 10-story shear building. The analyses were performed using AHS with different impact capacity and mass ratio values for structures with TMDI on the 5th floor. Table 6 shows the results obtained with AHS for the TMDI system on the 5th floor for stmax = 1.5 and a mass ratio of 5% using near-fault earthquake records (non-pulse).
In the uncontrolled structure, the displacement value is 0.9919. Table 6 shows that this value has been effectively reduced to 0.6446. In other words, the TMDI optimization performed with AHS has achieved a 35% reduction in displacement.
As can be seen in Table 6, the optimum mass of the TMDI system reaches the specified maximum mass limit. The g1 value (0.5432) has not exceeded the stmax limit value (1.5). In this case, the constraint values have not been exceeded. The TMDI mass has reached the specified maximum mass limit. The damping ratio is equal to 0.3716. It has not reached the upper limit value defined for the attenuation ratio. The TMDI b value has also reached the specified maximum mass limit.
Table 7 shows the results obtained with AHS for the TMDI system on the 5th floor for stmax = 1.5 and a mass ratio of 5% using near-fault earthquake records (pulse).
In the uncontrolled structure, the displacement value is 0.6457. Table 7 shows that this value has been reduced to 0.5596. In other words, the TMDI optimization performed with AHS has achieved a 13.33% reduction in displacement. Since the earthquakes were pulse-type, meaning they involved highly effective ground movements, their effects on the structure remained limited.
As can be seen in Table 6, optimum mass of the TMDI system reaches the specified maximum mass limit. The g1 value (1.4990) is very close to the stmax limit value (1.5). In this case, the constraint values have not been exceeded. The TMDI mass has reached the specified maximum mass limit. The damping ratio is equal to 0.0938. It has not reached the upper limit value defined for the attenuation ratio and is low according to non-pulse recordings. The b value has also reached the specified maximum mass limit.
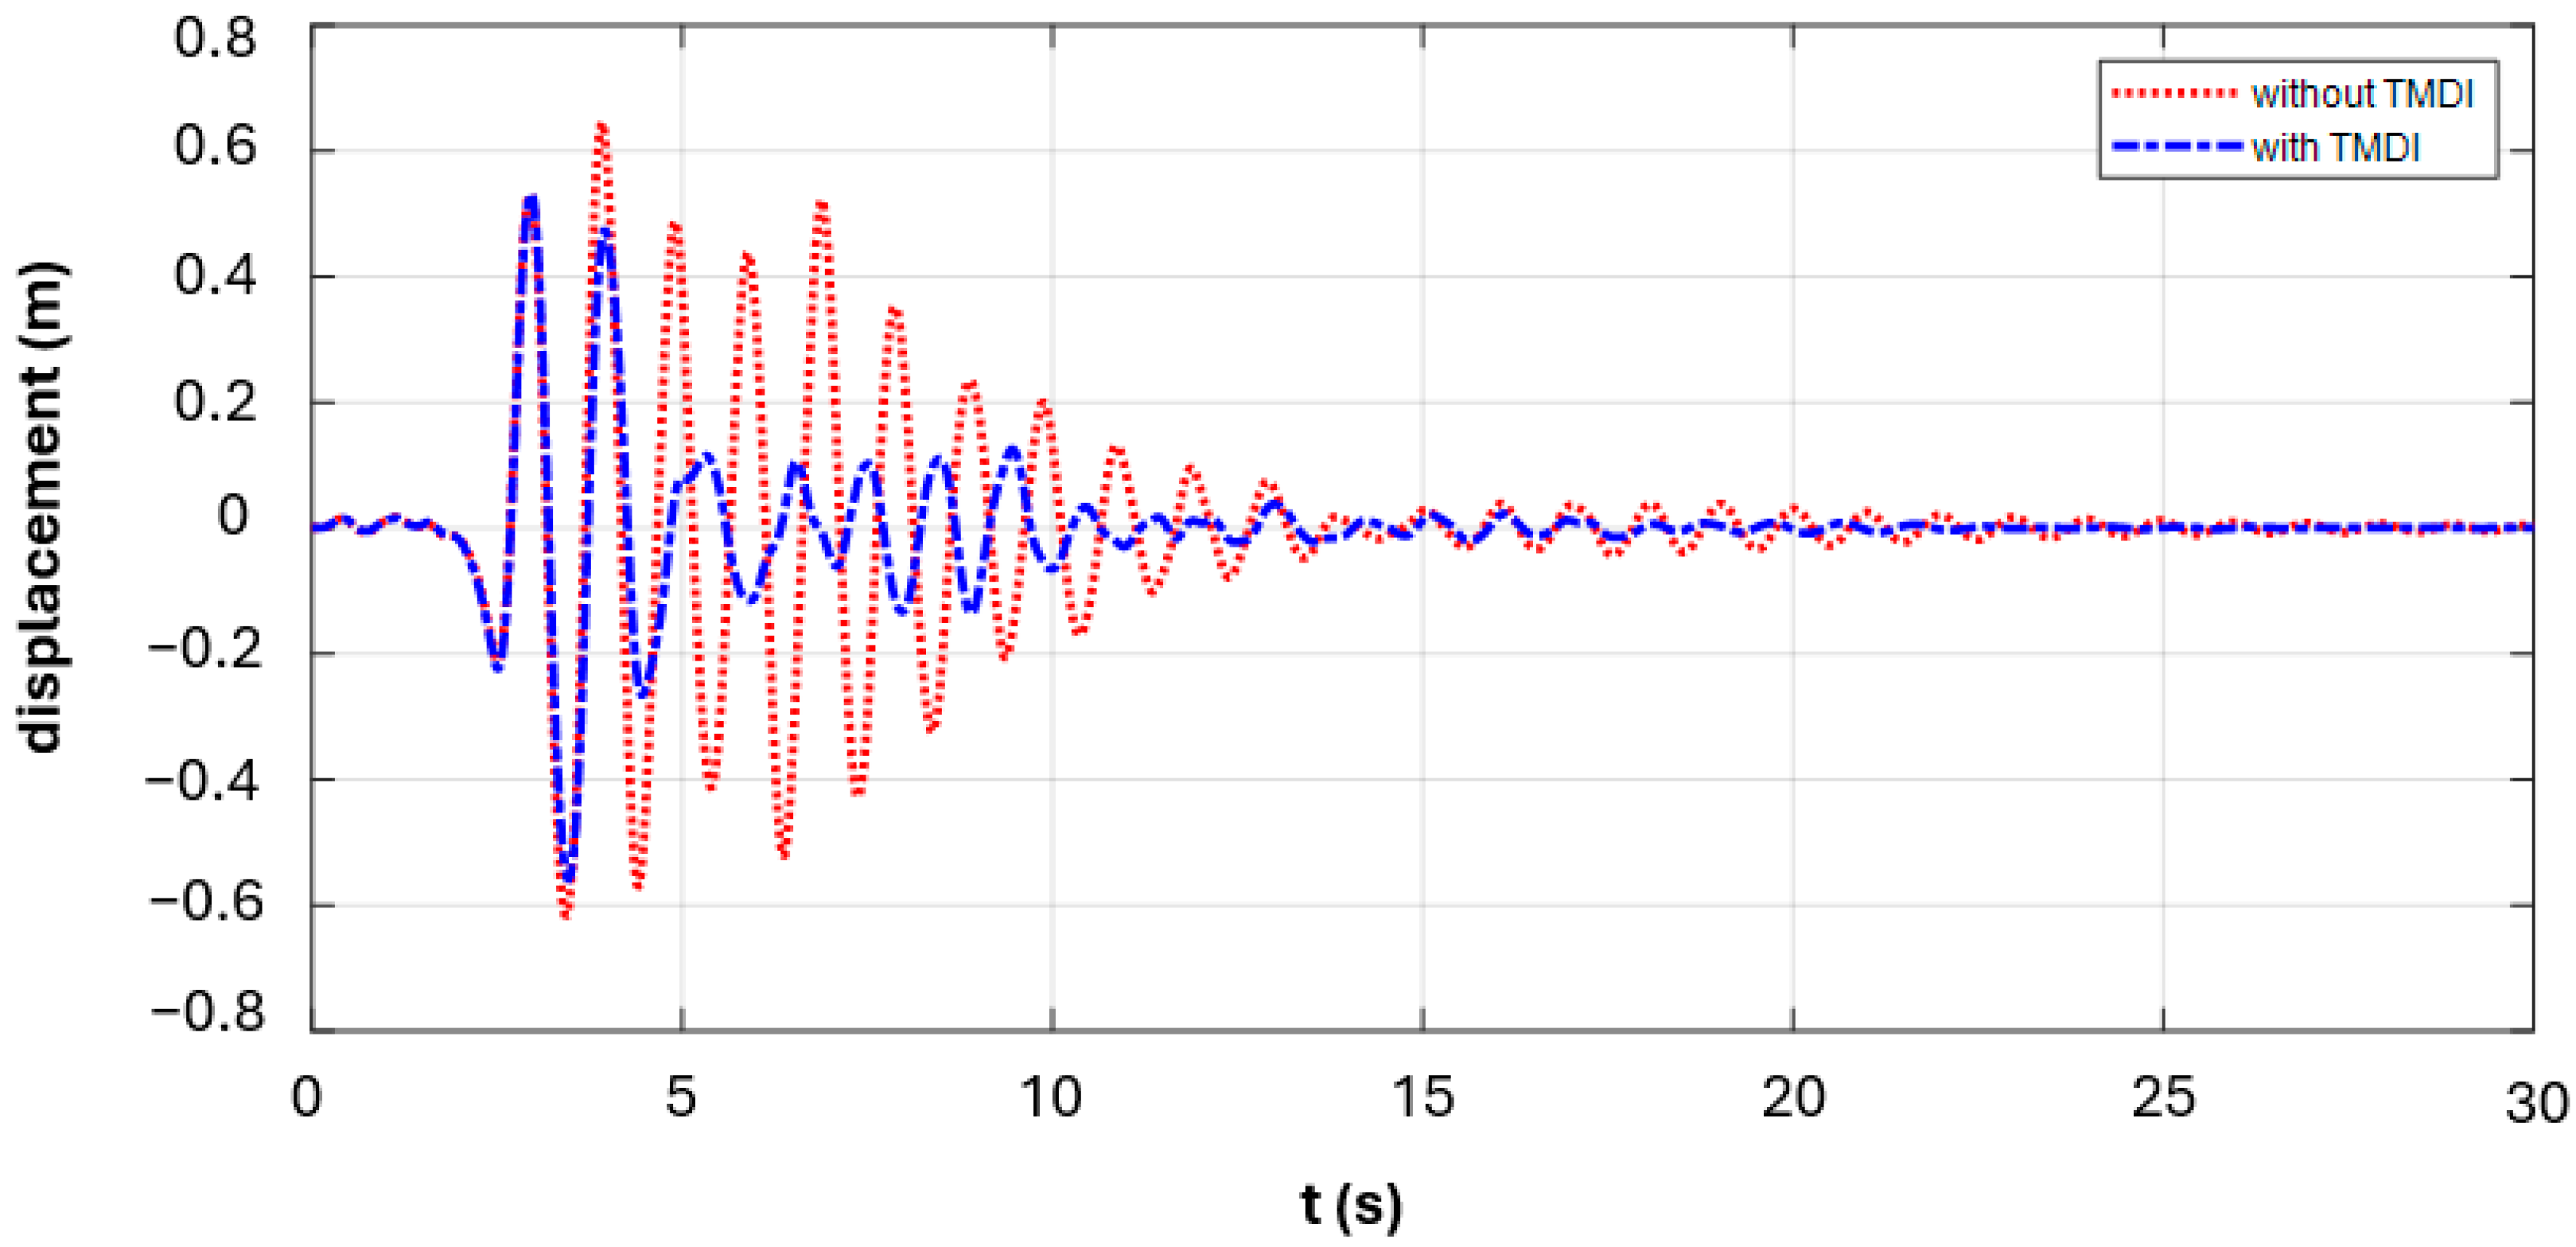
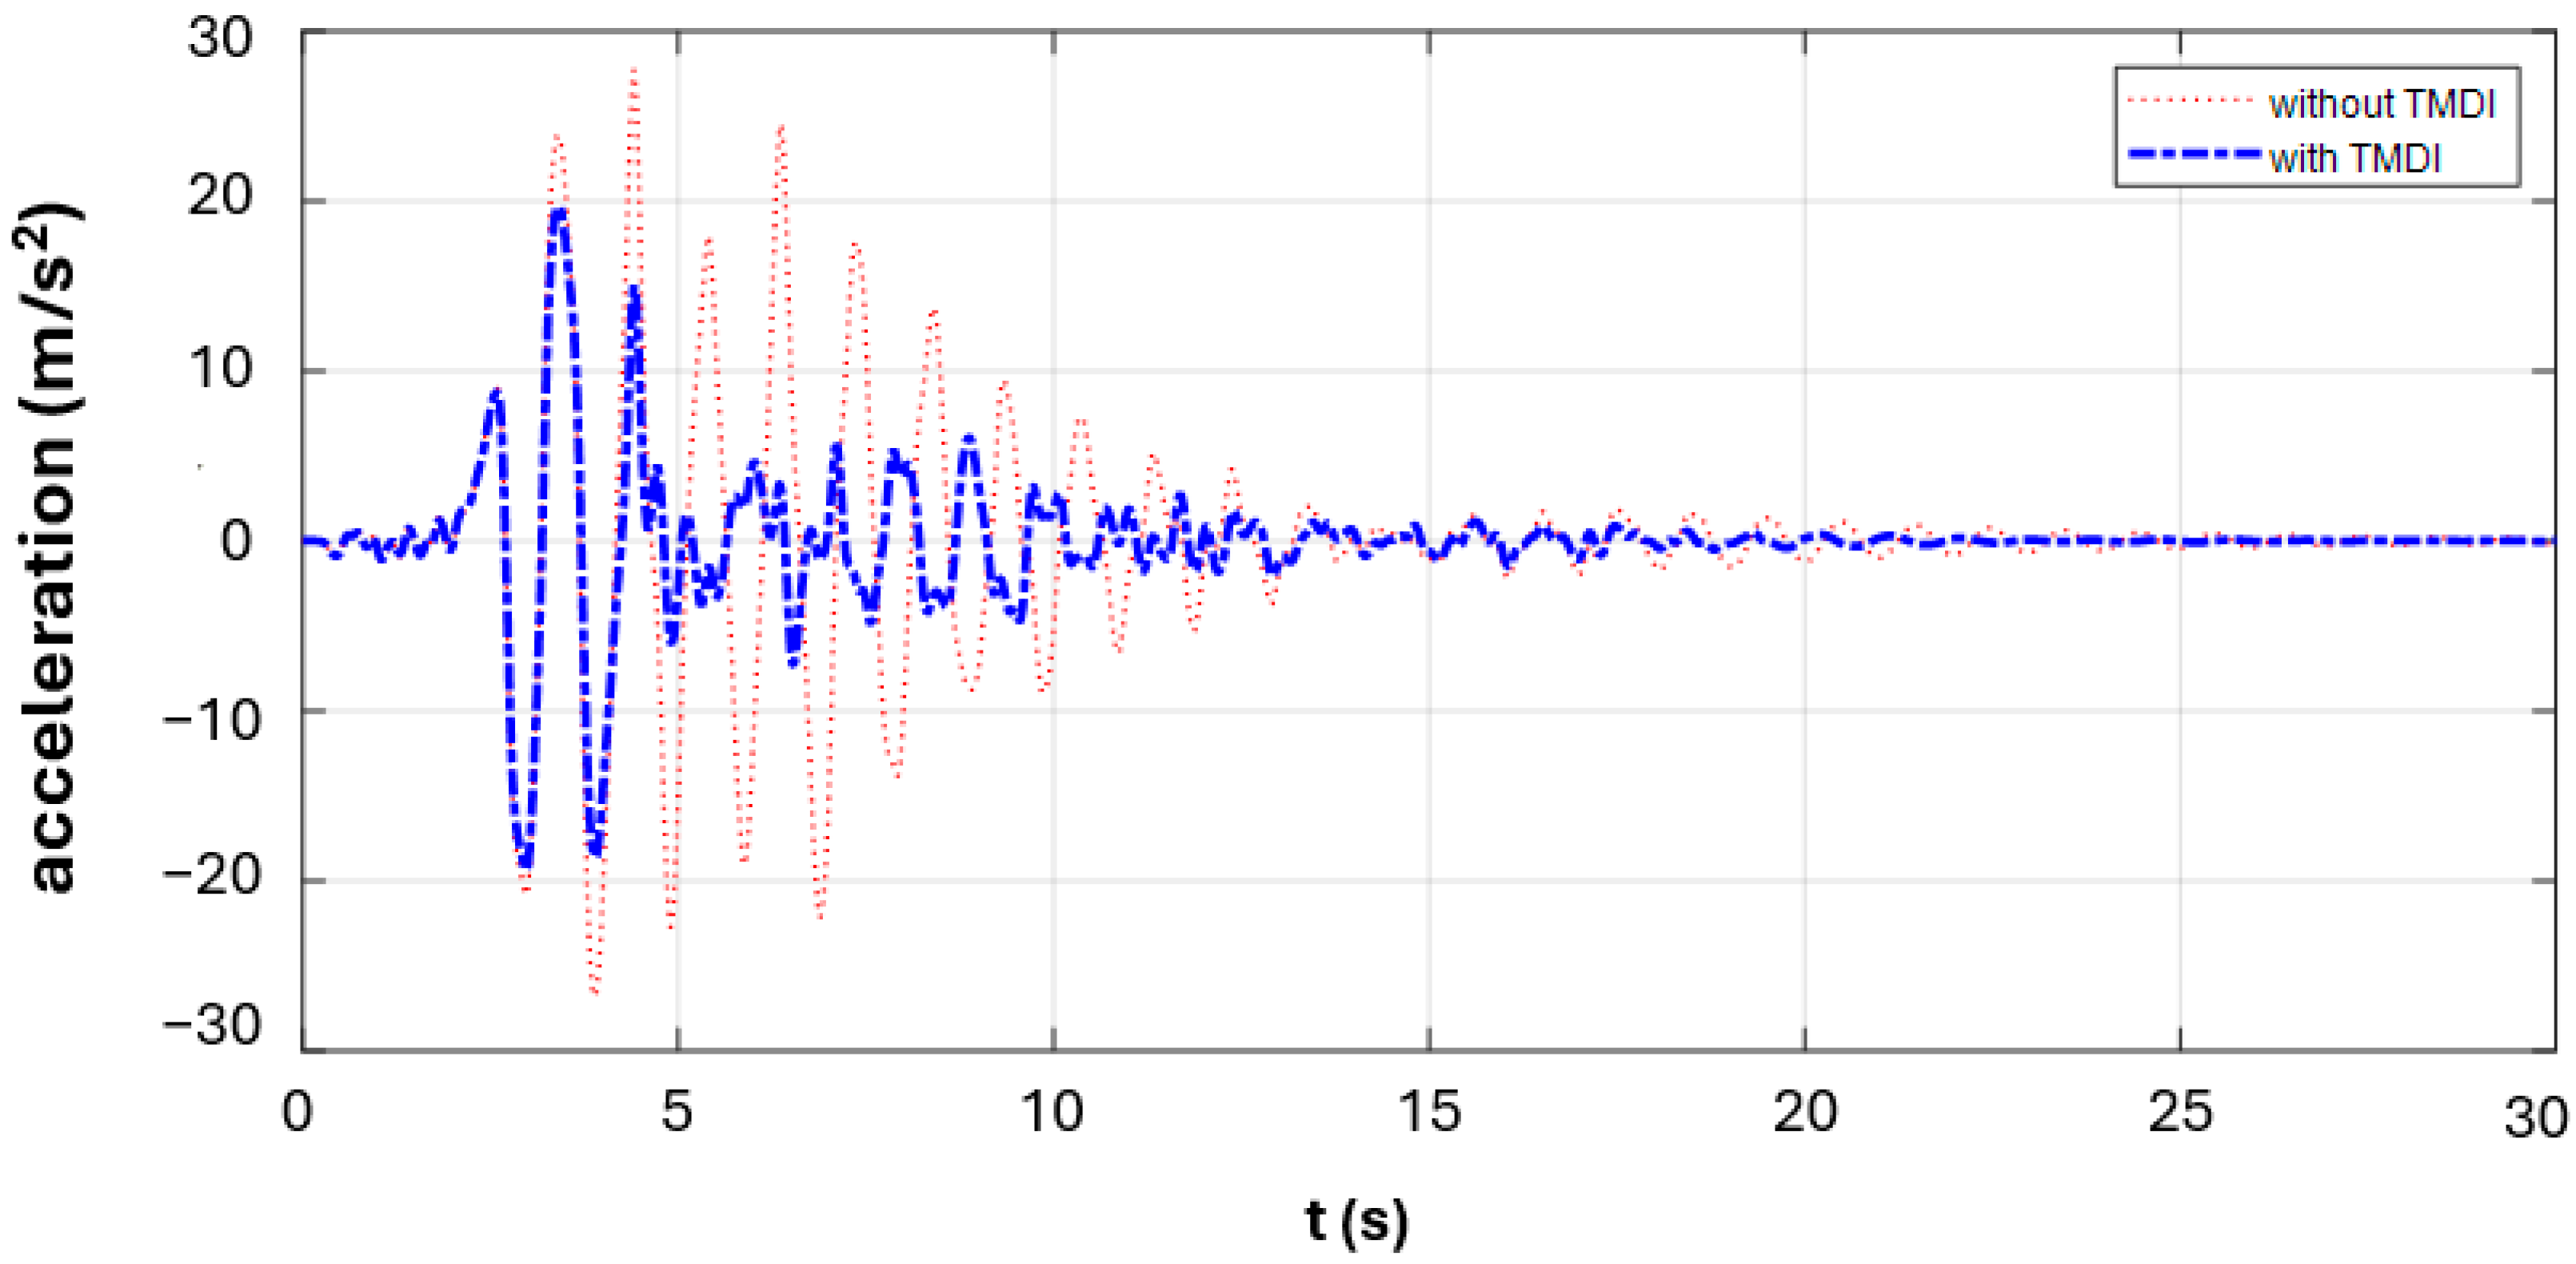
For the case where the TMDI system is connected to the 5th floor of the building, the displacement and graph of the critical earthquake record (CHICHI/TCU067_285) obtained from near-fault non-pulse earthquake records for 1.5 stmax and 5% mass ratio (µ) values is shown in Figure 8, and the total acceleration graph is shown in Figure 9.
When examining the red and blue lines in Figure 8 and Figure 9, it can be seen that structural control can be effectively achieved with optimum TMDI parameters. For the case where the TMDI system is connected to the 5th floor of the building, the displacement and graph of the critical earthquake record (NORTHR/RRS_032) obtained from near-fault pulse earthquake records for 1.5 stmax and 5% mass ratio (µ) values is shown in Figure 10, and the total acceleration graph is shown in Figure 11.
When examining the red and blue lines in Figure 10 and Figure 11, it can be seen that structural control can be effectively achieved with optimum TMDI parameters.

4. Discussion

The AHS method used has shown that the TMDI system installed on the 5th floor of a 10-story shear building is effective in minimizing the seismic response of the structure. Updating the HMCR and PAR parameters in the AHS algorithm has facilitated approaching the global optimum. The algorithm’s flexible structure allows it to be easily adapted to different earthquake records, building types, and TMDI parameters. Consistency was ensured through simulation-based evaluation performed using MATLAB Simulink. Despite these advantages, the algorithm’s high computational requirements increase processing time when used in large-scale systems or with a large number of earthquake records. Additionally, the parameters must be carefully selected to prevent the method from getting stuck in local optima in some cases. Table 6 and Table 7 show that a value of 1.5 stmax is efficient.
As a result, the TMDI reduced displacement by 35% and 13.33% for non-pulse and pulse, respectively. The reason why non-pulse shows better displacement reduction performance than pulse is that pulse contains high-period characteristics. Due to the high-period pulse, it deviates from the structure’s period and, consequently, from the TMDI period optimized based on the structure’s period. This situation leads to lower effectiveness of the TMDI system in pulse recordings.
Table 8 summarizes the studies in which TMDI optimization was performed.
Table 7 shows that advanced numerical techniques are applied for structural optimization and seismic design under complex structural and loading conditions using different algorithms. This study is unique in that it optimizes TMDI parameters using 28 nearby fault earthquakes with AHS. The entire optimization process can be directly applied to TMDI design for taller buildings. It can be used to reduce earthquake-induced damage in structures and control upper-story movements.

5. Conclusions

In this study, the TMDI parameters were optimized using the Adaptive Harmony Search (AHS) method, and it was concluded that the seismic response could be effectively reduced by minimizing the upper floor displacements of the structure. Table 6 and Table 7 enable a comparison of the results obtained for non-pulse and pulse earthquake records. The findings demonstrate that AHS is both a practical and effective method in structural engineering applications. The contributions of this study provide valuable information for the design process in terms of earthquake safety of buildings.
According to the optimal results obtained, it is seen that the optimal parameters are based on the specified mass upper limit for both pulse and non-pulse earthquake records. As a result, the use of TMDI reduced displacement by 35% for non-pulse and by 13.33% for pulse earthquake records. The fact that non-pulse shows better displacement reduction performance is due to the high period of pulse and therefore its deviation from the TMDI period optimized for the structure. This study is an important reference in terms of demonstrating the effectiveness and applicability of an optimization-based approach in TMDI design.
In future works, hybrid optimization methods that can increase the computational efficiency of the algorithm can be applied. Analyses can be performed on different earthquake records and building types of various heights and importance. Machine learning-based prediction models can also be included in the process.

Author Contributions

Conceptualization, G.B., Y.A. and S.M.N.; methodology, G.B., Y.A. and S.M.N.; software, Y.A., G.B. and S.M.N.; validation, Y.A., G.B. and S.M.N.; formal analysis, Y.A., G.B. and S.M.N.; investigation, Y.A.; resources, G.B.; data curation, Y.A.; writing—original draft preparation, Y.A., G.B. and S.M.N.; writing—review and editing, Y.A., G.B., S.M.N., S.K. and Z.W.G.; visualization, Y.A.; supervision, G.B. and Z.W.G.; project administration, Y.A. All authors have read and agreed to the published version of the manuscript.

Funding

This work was supported by TÜBİTAK 2224-A Program.

Data Availability Statement

The original contributions presented in this study are included in the article. Further inquiries can be directed to the corresponding authors.

Conflicts of Interest

The authors declare no conflicts of interest.

References

  1. Bishay-Girges, N.W.; Carr, A.J. Ring spring dampers. Bull. N. Z. Soc. Earthq. Eng. 2014, 47, 173–180. [Google Scholar] [CrossRef]
  2. Ormondroyd, J.; Hartog, J.P.D. The Theory of the Dynamic Vibration Absorber. Trans. Am. Soc. Mech. Eng. 1928, 49–50, 021007. [Google Scholar] [CrossRef]
  3. Longarini, N.; Zucca, M. A chimney’s seismic assessment by a tuned mass damper. Eng. Struct. 2014, 79, 290–296. [Google Scholar] [CrossRef]
  4. Smith, M. Synthesis of mechanical networks: The inerter. IEEE Trans. Autom. Control 2002, 47, 1648–1662. [Google Scholar] [CrossRef]
  5. Ruiz, R.; Taflanidis, A.; Giaralis, A.; Lopez-Garcia, D. Risk-informed optimization of the tuned mass-damper-inerter (TMDI) for the seismic protection of multi-storey building structures. Eng. Struct. 2018, 177, 836–850. [Google Scholar] [CrossRef]
  6. Lara-Valencia, L.A.; Farbiarz-Farbiarz, Y.; Valencia-González, Y. Design of a Tuned Mass Damper Inerter (TMDI) Based on an Exhaustive Search Optimization for Structural Control of Buildings under Seismic Excitations. Shock Vib. 2020, 2020, 8875268. [Google Scholar] [CrossRef]
  7. Domizio, M.; Garrido, H.; Ambrosini, D. Single and multiple TMD optimization to control seismic response of nonlinear structures. Eng. Struct. 2022, 252, 113667. [Google Scholar] [CrossRef]
  8. Abd-Elhamed, A.; Alkhatib, S. Analytical Solution of Seismic Responses of Multi-Storey Building Structures Controlled by Tuned Mass-Damper-Inerter (TMDI). Eng. Sci. 2023, 26, 963. [Google Scholar] [CrossRef]
  9. Aydın, Y.; Bekdaş, G.; Nigdeli, S.M.; Geem, Z.W. Parameter Optimization of Tuned Mass Damper Inerter via Adaptive Harmony Search. Comput. Model. Eng. Sci. 2024, 141, 2471–2499. [Google Scholar] [CrossRef]
  10. Peng, Y.; Sun, P. Reliability-based design optimization of tuned mass-damper-inerter for mitigating structural vibration. J. Sound Vib. 2024, 572, 118166. [Google Scholar] [CrossRef]
  11. Farsijani, D.; Gholam, S.; Karampour, H.; Talebian, N. The impact of the frequency content of far-field earthquakes on the optimum parameters and performance of tuned mass damper inerter. Structures 2024, 60, 105925. [Google Scholar] [CrossRef]
  12. Pandit, A.; Ghiasi, R.; Malekjafarian, A. On the optimization of Tuned Mass Damper Inerter (TMDI) systems for buildings subjected to real ground motions using slime mould algorithm. Soil Dyn. Earthq. Eng. 2024, 179, 108557. [Google Scholar] [CrossRef]
  13. Shahraki, M.A.; Chaleshtori, S.A.H. Comparative Analysis of Novel Nonlinear Tuned Mass Damper Inerter and Traditional Tuned Mass Dampers in Steel Shear Frame Structures. Int. J. Struct. Stab. Dyn. 2025, 2650141. [Google Scholar] [CrossRef]
  14. Akbari, M.; Falborski, T.; Jankowski, R. Evaluating optimal inerter location for tuned mass damper inerter systems in multi-storey buildings considering SSI effects. Mech. Syst. Signal Process. 2025, 232, 112734. [Google Scholar] [CrossRef]
  15. Abdeddaim, M.; Djerouni, S.; Basili, M. Assessment and Performance of Tuned Mass Damper Inerter Design Based on Genetic Algorithm Approach for Nonlinear Structures Subjected to Earthquake Excitation. J. Vib. Eng. Technol. 2025, 13, 353. [Google Scholar] [CrossRef]
  16. Rezk, H.; Olabi, A.G.; Wilberforce, T.; Sayed, E.T. Metaheuristic optimization algorithms for real-world electrical and civil engineering application: A review. Results Eng. 2024, 23, 102437. [Google Scholar] [CrossRef]
  17. Liu, W.; Zhang, J.; Liu, C.; Qu, C. A bi-objective optimization for finance-based and resource-constrained robust project scheduling. Expert Syst. Appl. 2023, 231, 120623. [Google Scholar] [CrossRef]
  18. Wang, L.; Demeulemeester, E. Simulation optimization in healthcare resource planning: A literature review. IISE Trans. 2023, 55, 985–1007. [Google Scholar] [CrossRef]
  19. MATLAB, Version R2018a; The MathWorks Inc.: Natick, MA, USA, 2018.
  20. Geem, Z.W.; Kim, J.H.; Loganathan, G.V. A New Heuristic Optimization Algorithm: Harmony Search. Simulation 2001, 76, 60–68. [Google Scholar] [CrossRef]
  21. Mohammed, S.; Fayçel, K.; University of Ahmed Ben Bella; Rochdi, B. Statistical Analysis of Harmony Search Algorithms in Tuning PID Controller. Int. J. Intell. Eng. Syst. 2016, 9, 98–106. [Google Scholar] [CrossRef]
  22. Gao, K.-Z.; Pan, Q.-K.; Li, J.-Q. Discrete harmony search algorithm for the no-wait flow shop scheduling problem with total flow time criterion. Int. J. Adv. Manuf. Technol. 2011, 56, 683–692. [Google Scholar] [CrossRef]
  23. Sivasubramani, S.; Swarup, K. Multi-objective harmony search algorithm for optimal power flow problem. Int. J. Electr. Power Energy Syst. 2011, 33, 745–752. [Google Scholar] [CrossRef]
  24. Abdulkhaleq, M.T.; Rashid, T.A.; Alsadoon, A.; Hassan, B.A.; Mohammadi, M.; Abdullah, J.M.; Chhabra, A.; Ali, S.L.; Othman, R.N.; Hasan, H.A.; et al. Harmony search: Current studies and uses on healthcare systems. Artif. Intell. Med. 2022, 131, 102348. [Google Scholar] [CrossRef]
  25. Cheng, M.-Y.; Prayogo, D.; Wu, Y.-W.; Lukito, M.M. A Hybrid Harmony Search algorithm for discrete sizing optimization of truss structure. Autom. Constr. 2016, 69, 21–33. [Google Scholar] [CrossRef]
  26. Bekdaş, G.; Nigdeli, S.M. Estimating optimum parameters of tuned mass dampers using harmony search. Eng. Struct. 2011, 33, 2716–2723. [Google Scholar] [CrossRef]
  27. Bekdaş, G.; Nigdeli, S.M.; Kim, S.; Geem, Z.W. Modified Harmony Search Algorithm-Based Optimization for Eco-Friendly Reinforced Concrete Frames. Sustainability 2022, 14, 3361. [Google Scholar] [CrossRef]
  28. de Almeida, F.S. Optimization of laminated composite structures using harmony search algorithm. Compos. Struct. 2019, 221, 110852. [Google Scholar] [CrossRef]
  29. Bekdaş, G.; Cakiroglu, C.; Kim, S.; Geem, Z.W. Optimal Dimensions of Post-Tensioned Concrete Cylindrical Walls Using Harmony Search and Ensemble Learning with SHAP. Sustainability 2023, 15, 7890. [Google Scholar] [CrossRef]
  30. Saka, M.P.; Hasançebi, O. Adaptive Harmony Search Algorithm for Design Code Optimization of Steel Structures; Springer: Berlin/Heidelberg, Germany, 2009; pp. 79–120. [Google Scholar] [CrossRef]
  31. Zucca, M.; Longarini, N.; Simoncelli, M.; Aly, A.M. Tuned Mass Damper Design for Slender Masonry Structures: A Framework for Linear and Nonlinear Analysis. Appl. Sci. 2021, 11, 3425. [Google Scholar] [CrossRef]
  32. Applied Technology Council (ATC). Quantification of Building Seismic Performance Factors, 1st ed.; Federal Emergency Management Agency: Redwood City, CA, USA, 2009. [Google Scholar]
Figure 1. Working process of passive control systems [1].
Geohazards 06 00056 g001
Figure 2. Schematic representation of the inerter.
Geohazards 06 00056 g002
Figure 3. Examples of inerter devices.
Geohazards 06 00056 g003
Figure 4. Framework of the study.
Geohazards 06 00056 g004
Figure 5. Harmony search [21].
Geohazards 06 00056 g005
Figure 6. AHS flowchart.
Geohazards 06 00056 g006
Figure 7. Shear building model used for dynamic analysis.
Geohazards 06 00056 g007
Figure 8. Displacement graph of the structure under the critical earthquake record (CHICHI/TCU067_285) from the non-pulse earthquake records.
Geohazards 06 00056 g008
Figure 9. Acceleration graph of the structure under the critical earthquake record (CHICHI/TCU067_285) from the non-pulse earthquake records.
Geohazards 06 00056 g009
Figure 10. Displacement graph of the structure under the critical earthquake record (NORTHR/RRS_032) from the Pulse earthquake records.
Geohazards 06 00056 g010
Figure 11. Acceleration graph of the structure under the critical earthquake record (NORTHR/RRS_032) from the pulse earthquake records.
Geohazards 06 00056 g011
Table 1. Structural parameters.
ParameterValue
Mass per story (mi)360 ton
Stiffness per story (ki)650 MN/m
Damping coefficient per story (ci)6.2 MNs/m
Table 2. Limit values of the design variables.
ParameterMin–Max Limits
mtmdi (kg)360–180,000
Ttmdi (s)0.4947–1.4840
ξtmdi0.01–0.5
b (kg)360–180,000
Table 3. Parameter settings for AHS.
ParameterValue
HMS10
HMCRinitial0.5
PARinitial0.005
BSCR0.3
pn10
Table 4. Characteristics of ground motion records (Pulse) [32].
ID NoRecord Sequence NumberYearMHorizontal Records (FN)Horizontal Records (FP)PGAMAX (g)PGVMAX (cm/s)
118119796.5IMPVALL/H-E06_233IMPVALL/H-E06_3230.44111.9
218219796.5IMPVALL/H-E07_233IMPVALL/H-E07_3230.46108.9
329219806.9ITALY/A-STU_223ITALY/A-STU_3130.3145.5
472319876.5SUPERST/B-PTS_037SUPERST/B-PTS_1270.42106.8
580219896.9LOMAP/STG_038LOMAP/STG_1280.3855.6
682119926.7ERZIKAN/ERZ_032ERZIKAN/ERZ_1220.4995.5
782819927.0CAPEMEND/PET_260CAPEMEND/PET_3500.6382.1
887919927.3LANDERS/LCN_239LANDERS/LCN_3290.79140.3
910619946.7NORTHR/RRS_032NORTHR/RRS_1220.87167.3
10108619946.7NORTHR/SYL_032NORTHR/SYL_1220.73122.8
11116519997.5KOCAELI/IZT_180KOCAELI/IZT_2700.2229.8
12150319997.6CHICHI/TCU065_272CHICHI/TCU065_0020.82127.7
13152919997.6CHICHI/TCU102_278CHICHI/TCU102_0080.29106.6
14160519997.1DUZCE/DZC_172DUZCE/DZC_2620.5279.3
Table 5. Characteristics of ground motion records (non-pulse) [32].
ID NoRecord Sequence NumberYearMHorizontal Records (FN)Horizontal Records (FP)PGAMAX (g)PGVMAX (cm/s)
112619766.8GAZLI/GAZ_267GAZLI/GAZ_2670.7171.2
216019796.5IMPVALL/H-BCR_233IMPVALL/H-BCR_3230.7644.3
316519796.5IMPVALL/H-CHI_233IMPVALL/H-CHI_3230.2830.5
449519856.8NAHANNI/S1_070NAHANNI/S1_1601.1843.9
549619856.8NAHANNI/S2_070NAHANNI/S2_1600.4534.7
674119896.9LOMAP/BRN_038LOMAP/BRN_1280.6455.9
775319896.9LOMAP/CLS_038LOMAP/CLS_1280.5145.5
882519927.0CAPEMEND/CPM_260CAPEMEND/CPM_3501.43119.5
9100419946.7NORTHR/0637_032NORTHR/0637_1220.7370.1
10104819946.7NORTHR/STC_032NORTHR/STC_1220.4253.2
11117619997.5KOCAELI/YPT_180KOCAELI/YPT_2700.3173.0
12150419997.6CHICHI/TCU067_285CHICHI/TCU067_0150.5691.8
13151719997.6CHICHI/TCU084_271CHICHI/TCU084_0011.16115.1
14211420027.9DENALI/ps10_199DENALI/ps10_2890.33 126.4
Table 6. Optimum results for TMDI system on the 5th floor (non-pulse).
ParameterValue
mtmdi (kg)180,000
Ttmdi (s)0.6986
ξtmdi0.3716
b (kg)180,000
f(x) (m)0.6446
g10.5432
Table 7. Optimum results for TMDI system on the 5th floor (pulse).
ParameterValue
mtmdi (kg)180,000
Ttmdi (s)0.7134
ξtmdi0.0938
b (kg)180,000
f(x) (m)0.5596
g11.4990
Table 8. Summary of TMDI optimization studies.
StudyAimMethod
Ruiz et al., 2018 [5]Seismic protection of multi-story building structuresRisk-informed optimization
Lara-Valencia et al., 2020 [6]Structural control of buildings under seismic excitationsExhaustive Search Optimization
Domizio et al., 2022 [7]Control the seismic response of nonlinear structuresGenetic Algorithm (GA)
Abd-Elhamed and Alkhatib 2023 [8]Investigate the effect of TMDI on the seismic response of linear multi-degree-of-freedom (MDOF) structuresGA
Aydın et al., 2024 [9]Increasing the resilience of the structures against dynamic loadsAdaptive Harmony Search (AHS)
Peng and Sun 2024 [10]Reduce structural vibration under non-stationary stochastic excitationsprobability density evolution method (PDEM) with GA
Farsijani et al., 2024 [11]Reduce the peak displacement and top floor accelerationParticle Swarm Optimization (PSO)
Pandit et al., 2024 [12]Reduce excessive vibrations of multi-degree-of-freedom (MDOF) buildings during earthquakesPSO, Slime Mold Algorithm (SMA) and Harris Hawks optimization (HHO)
Shahraki and Chaleshtori 2025 [13]Minimize the maximum relative roof displacement of a 10-story steel shear frameSMA
Akbari et al., 2025 [14]Evaluating optimum inerter locationMulti-Objective Fitness-Based Algorithm (MOFDO)
Abdeddaim et al., 2025 [15]Nonlinear structures subjected to earthquake excitationGA
This studyDetermine the optimum TMDI parameters that will minimize the structure’s response using near-fault earthquake records (non-pulse and pulse)AHS
Disclaimer/Publisher’s Note: The statements, opinions and data contained in all publications are solely those of the individual author(s) and contributor(s) and not of MDPI and/or the editor(s). MDPI and/or the editor(s) disclaim responsibility for any injury to people or property resulting from any ideas, methods, instructions or products referred to in the content.