Article

Relative Uplift Rates Along the Central Mindoro Fault, Philippines

1
Canadian Nuclear Safety Commission (CNSC), Ottawa, ON K1P 5S9, Canada
2
Department of Earth Sciences, University of Toronto, Toronto, ON M5S 3B1, Canada
3
Department of Science and Technology-Philippine Institute of Volcanology and Seismology (DOST-PHIVOLCS), C.P. Garcia Avenue, U.P. Campus, Diliman, Quezon City 1101, Philippines
*
Author to whom correspondence should be addressed.
GeoHazards 2025, 6(3), 57; https://doi.org/10.3390/geohazards6030057
Submission received: 20 June 2025 / Revised: 9 August 2025 / Accepted: 12 September 2025 / Published: 15 September 2025

Abstract

The Central Mindoro Fault (CMF) is a major active oblique, sinistral strike-slip fault within the Philippine archipelago that accommodates the oblique convergence between the Philippine Sea Plate (PSP) and the Sunda Plate (SP). This study focused on assessing the spatial distribution of relative uplift rates along the CMF by calculating multiple geomorphic indices (elongation ratio, volume-to-area-ratio, valley floor width-to-height ratio, hypsometric integral, and normalized steepness index) and interpreting these values in the context of any along-strike variations in geology and climate, as well as the context of the CMF’s kinematics. We observed 2 characteristics of spatial distributions of relative uplift rates: (1) at least 20–30 km-long high uplift rate sections in the northwestern end of the CMF-bound mountain range (CMF segment I), and (2) at most, CMF-wide moderate to high uplift rates. This trend matches the geomorphic-based cumulative fault offset measurements distribution, possibly indicating consistent kinematics and an overall nearly-uniform stress-field since at least the Pleistocene. Based on the spatial distribution of areas with high relative uplift rates highlighted by this study, future efforts to assess the CMF’s seismogenic capability should focus on segments I and III.

1. Introduction

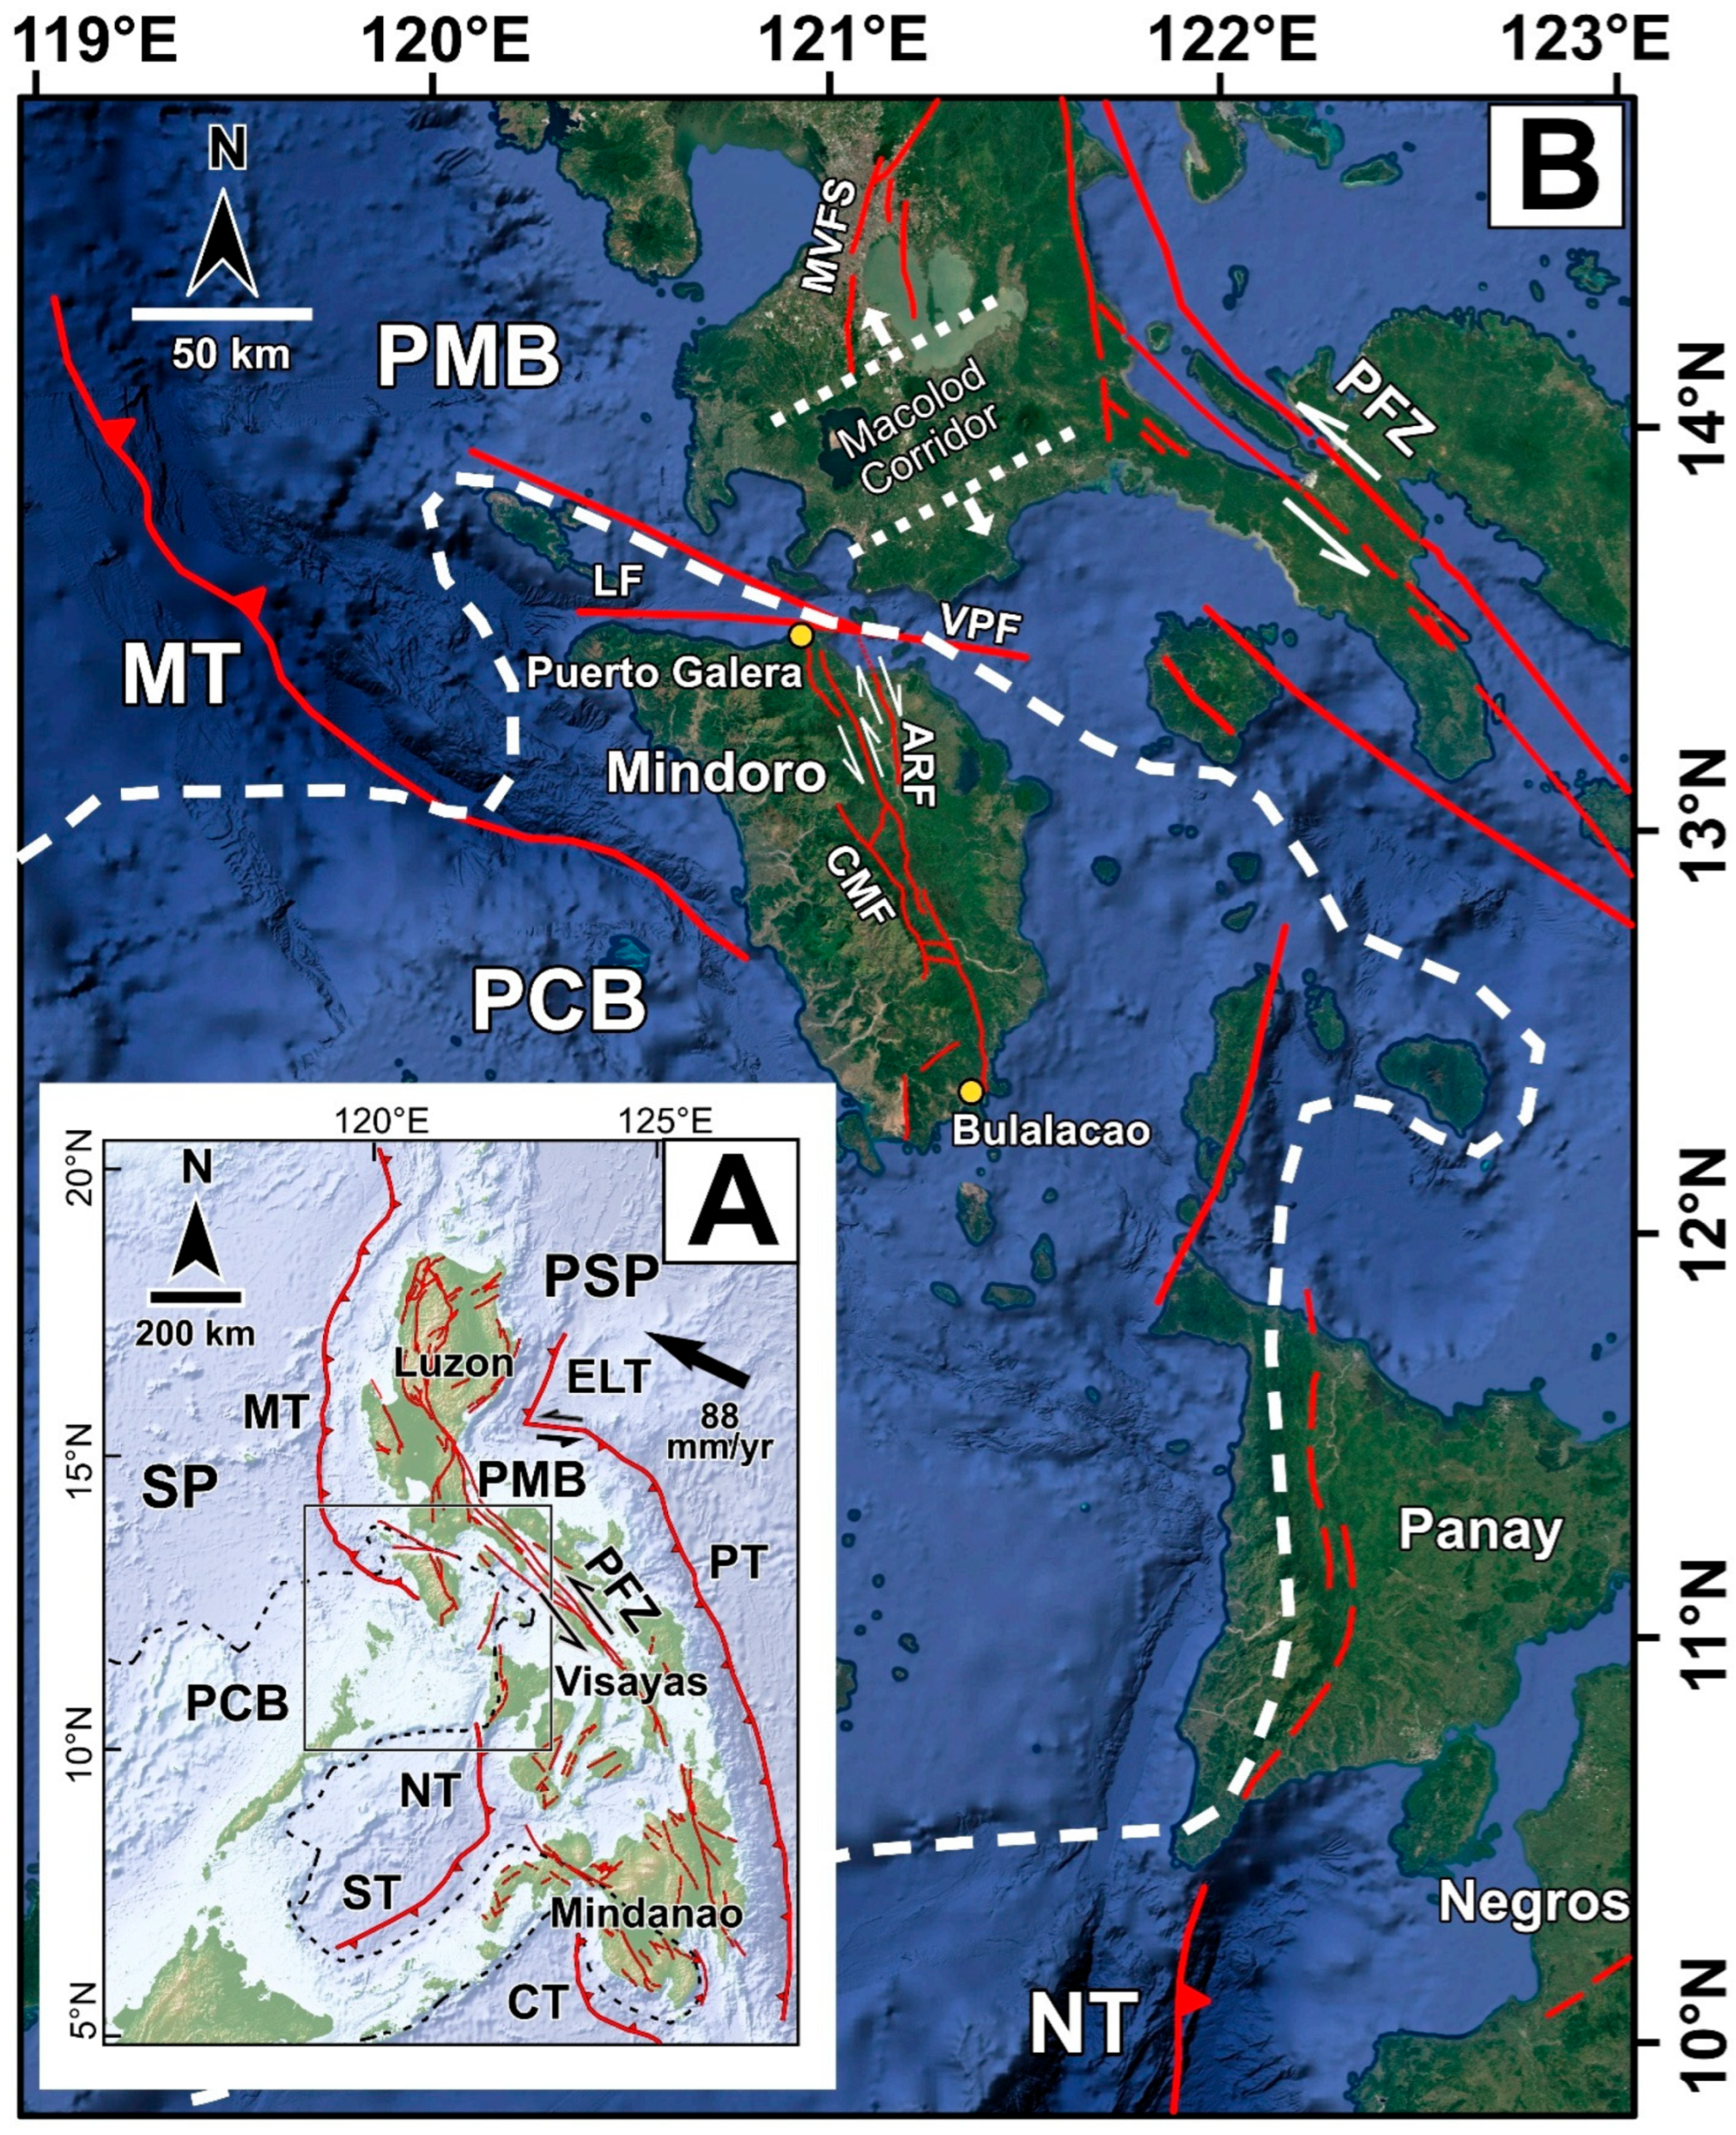
The Central Mindoro Fault (CMF) is a ~135-km-long, NNW-SSE-striking active, oblique sinistral strike-slip fault within the Philippine Island arc system that belongs to the translational boundary between the Palawan Microcontinental Block (PCB) and the Philippine Mobile Belt (PMB) [1]. It participates, along with a larger system of crustal faults and subduction zones throughout the Philippine archipelago, in accommodating the oblique convergence between the Philippine Sea Plate (PSP) and the Sunda Plate (SP) (Figure 1) [2,3].
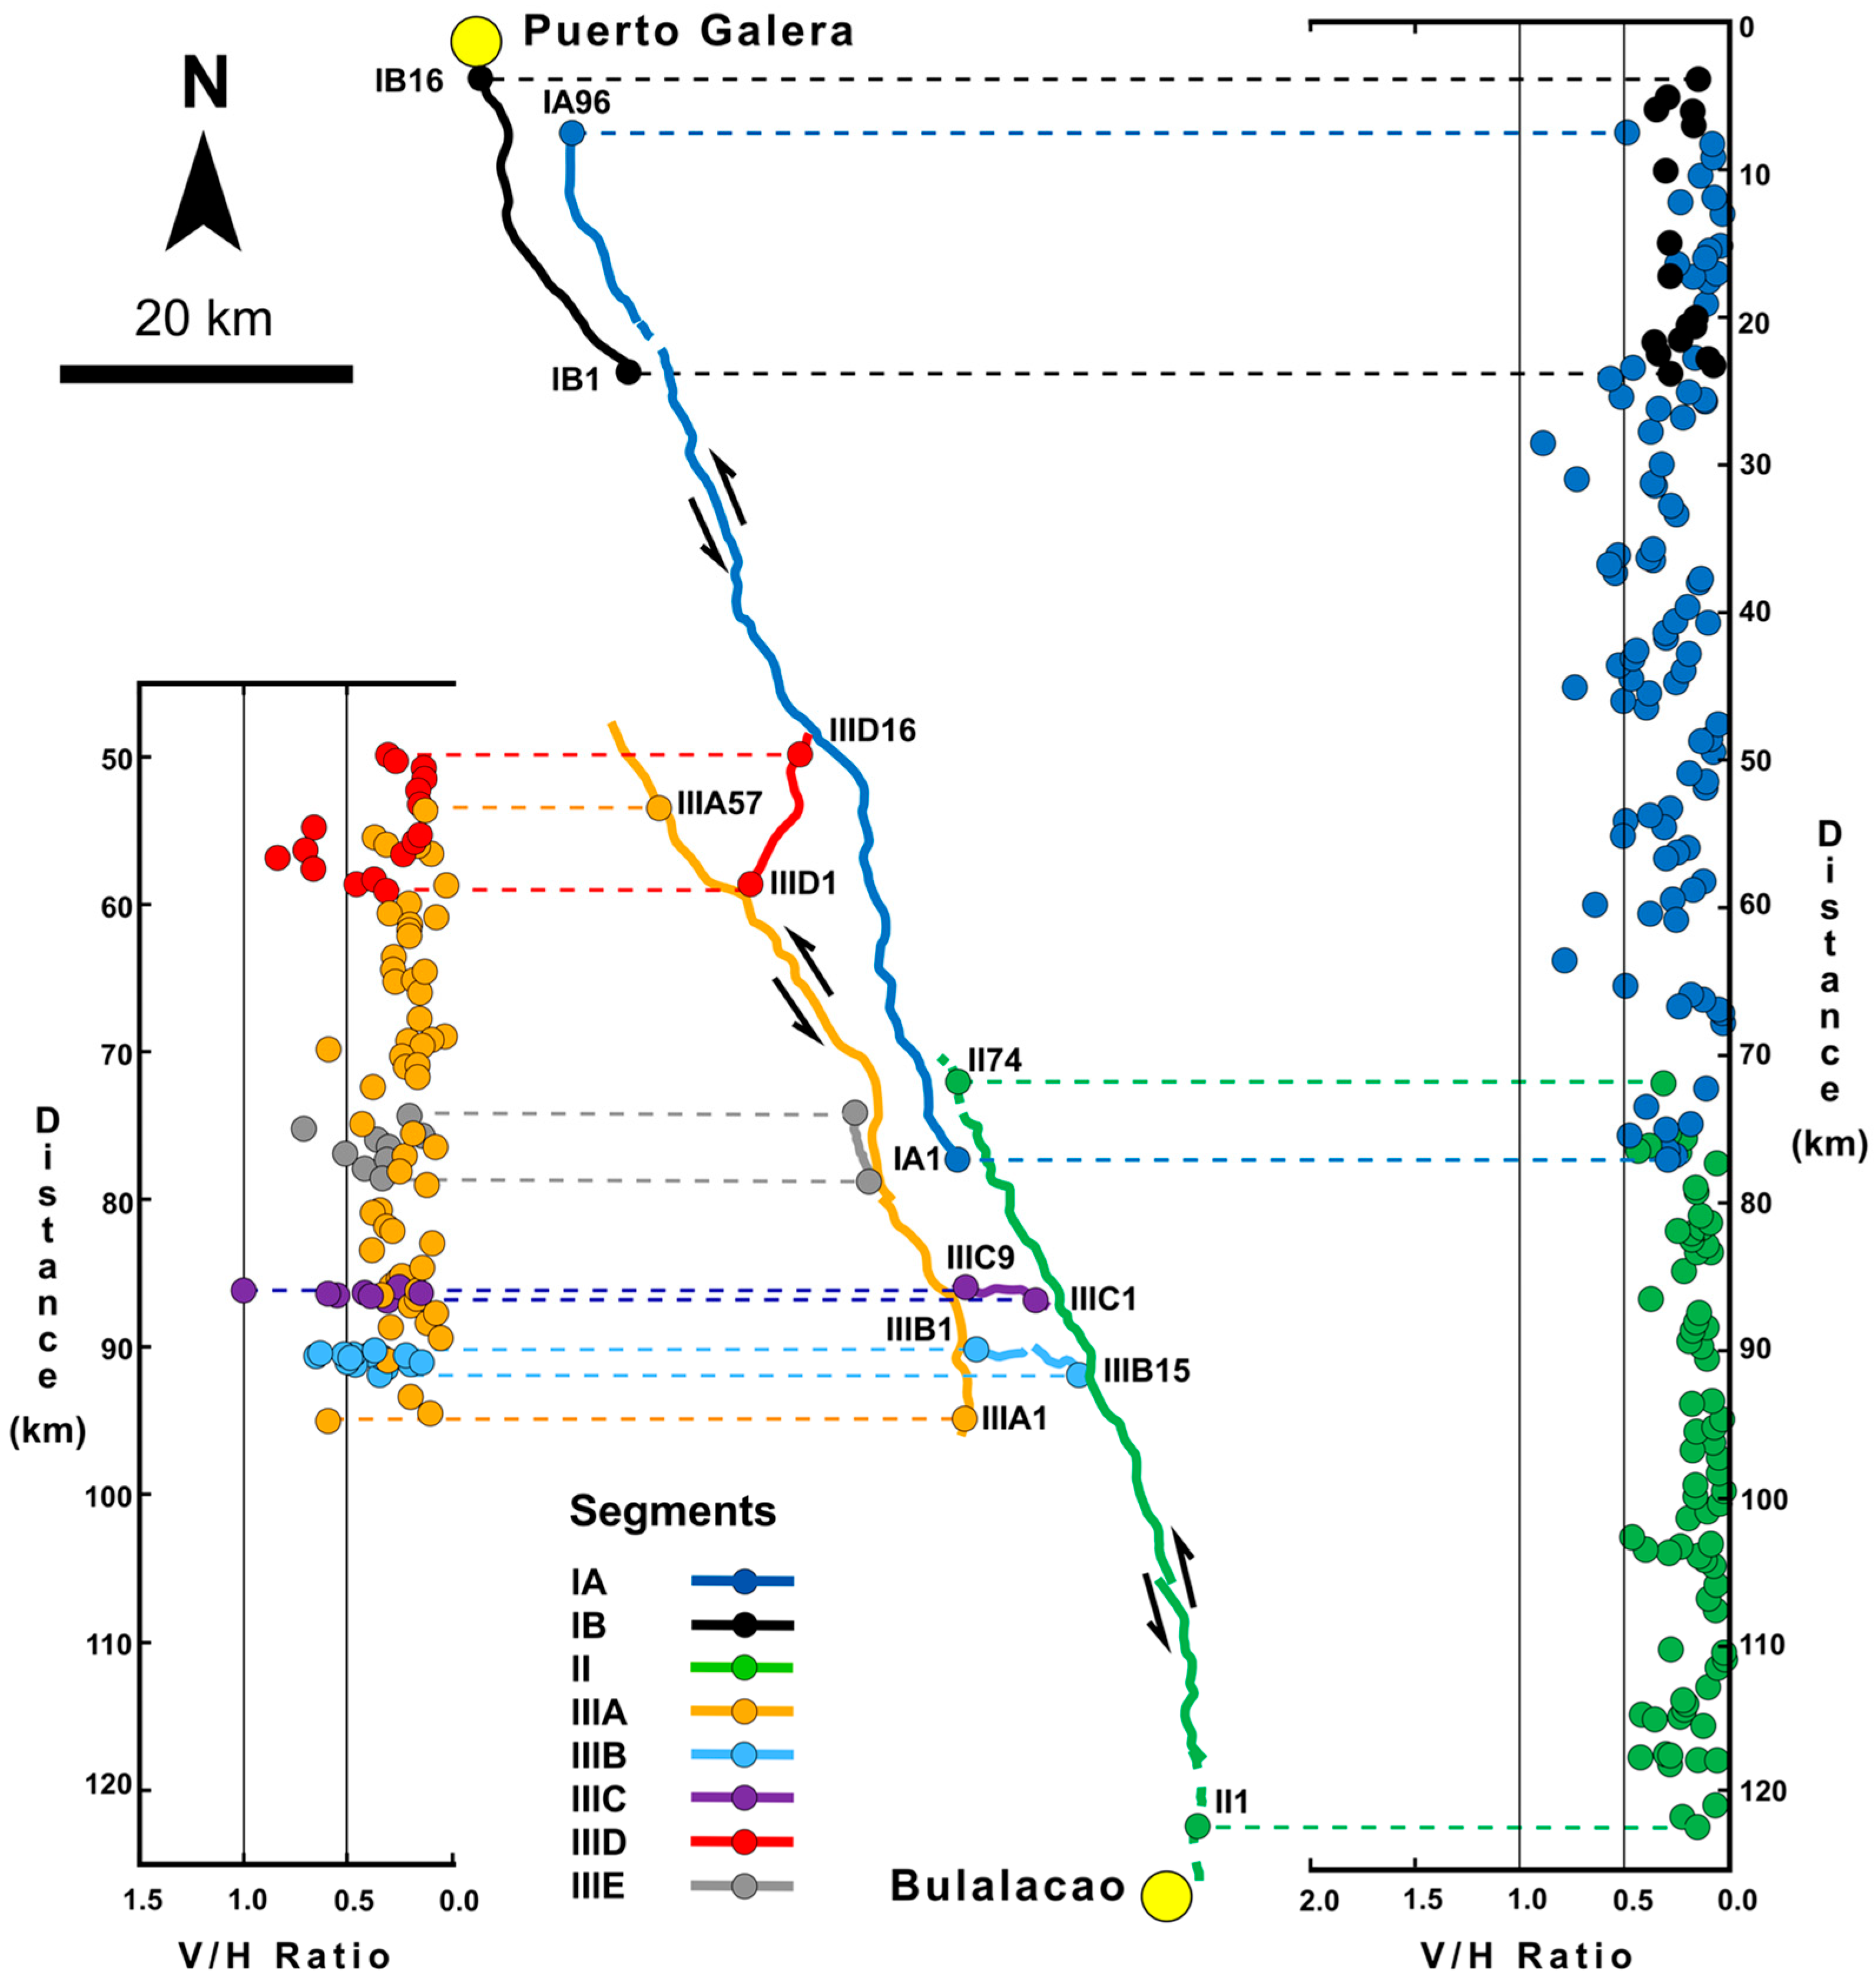
The CMF has been widely recognized by as a prominent structural feature on the island of Mindoro (Figure 1), with several earlier studies making inferences regarding the kinematics and activity of the fault [4,5,6,7,8,9,10,11], but only recently has its trace been mapped in detail and kinematics been determined systematically from documentation of offset morphotectonic features such as spurs and streams [1]. Based on the identification of segments of the CMF (Figure 2), Rimando and Rimando (2025) [1] estimated the possible earthquake magnitudes (MW) for the CMF, ranging between MW 6.6, assuming rupture of the shortest segment (25.6 km-long segment IB), and MW 7.8, assuming rupture of the entire CMF (~135 km-long).
There is a dearth of quantitative geomorphic studies related to active faulting in the Philippines. The few existing studies have focused on the following: (1) analyses of kinematics from morphotectonic features associated with major active faults, such as splays of the Philippine Fault Zone and the CMF [1,12,13], and (2) on documenting the traces and coseismic and/or aseismic offsets of active faults, such as the Marikina Valley Fault System [14,15,16,17,18]; the Aglubang River Fault [1,18]; the North Bohol Fault [19]; the Negros Oriental Fault [3]; and the section of the Philippine Fault in Masbate [20]. There are even fewer studies that utilize morphometric analysis. This work is one of the few studies in the Philippines that utilizes geomorphic index analyses [21] in characterizing neotectonic activity. However, this is the first study that utilizes a GIS-based calculation of multiple indices targeted at drainage basins along-strike of an active fault-bound mountain range itself, to quantify and identify spatial trends in relative uplift rates. In this paper, we calculate a combination of geomorphic indices, including basin elongation ratio, volume-to-area-ratio, valley floor width-to-height ratio, hypsometric integral, and normalized longitudinal river profile steepness.
This study aims to utilize the results of these morphometric analyses to estimate the relative uplift rates that in the absence of absolute uplift rates from either Quaternary geochronology (e.g., [22,23]) or space geodetic techniques (e.g., [24,25,26]), can help build on our current understanding of several aspects of the CMF, such as its: (1) spatial distribution of deformation (and its mechanisms), (2) longer-term fault behavior, and (3) level of tectonic activity, which are all essential to assessing the CMF’s associated seismogenic potential. Understanding the seismic hazards and risks associated with active CMF is crucial, as any earthquake generated along this fault will affect the quickly-growing population centers in the island of Mindoro, and a large earthquake can also potentially affect the nearby densely-populated Greater Manila Area.
Figure 1. (A) The tectonic setting of the Philippines, and (B) the Central Mindoro Fault (CMF) [1] and other structural and tectonic features in the vicinity of Mindoro [4] on a Google Earth satellite image basemap. CMF—Central Mindoro Fault; VPF—Verde Passage Fault; LF—Lubang Fault; ARF—Aglubang River Fault. SP—Sunda Plate; PSP—Philippine Sea Plate; MT—Manila Trench; NT—Negros Trench; ST—Sulu Trench; CT—Cotabato Trench; ELT—East Luzon Trough; PT—Philippine Trench; PFZ—Philippine Fault Zone; PMB—Philippine Mobile Belt; and PCB—Palawan Microcontinental Block. The dashed line marks the approximate location of the PCB boundary.
Geohazards 06 00057 g001
Figure 2. The Central Mindoro Fault (CMF) segments and fault offset plots are adapted from Rimando and Rimando (2025) [1]. Roman numerals and letter combinations indicate the name of fault segments. Vertical to horizontal ratios of fault offset are plotted adjacent to fault traces, with the color of the V/H data points corresponding to the color of segments where the measurements were taken.
Geohazards 06 00057 g002

2. Background

2.1. Tectonic Setting

The ~8.0 cm/yr northwestward motion of the PSP towards the Sunda Plate (SP) [2] is accommodated by a system of crustal faults and subduction zones throughout the archipelago that exhibit complex shear partitioning [3] (Figure 1). The Philippine island arc is bound to its west by the east-dipping Manila-Negros-Sulu-Cotabato Trench System, and to its east, the west-dipping East Luzon Trough-Philippine Trench System [27,28,29,30,31,32,33]. Subduction, thrust/reverse faulting [3,19], oblique strike-slip faulting [1,12], and regional tectonic uplift accommodate the trench-perpendicular component of the overall oblique plate convergence between the PSP and SP. In the intervening crustal blocks between these trenches is the ~1400-km-long, sinistral strike-slip Philippine Fault Zone (PFZ), which traverses the entire length of the PMB from Luzon in the northwest to Mindanao in the southeast [12,13,14,20,34,35]. The PFZ exhibits ~80–100 km and ~200 km of minimum displacement since the Miocene in northwest Luzon [36] and in Mindanao [37], respectively. The PFZ accommodates most of the trench-parallel component of oblique convergence between the PSP and SP [11] (Figure 1).
The CMF is a ~135-km-long, NNW-SSE-striking, active oblique sinistral strike-slip fault that can be traced from Puerto Galera, in the northwestern sector of the island of Mindoro, all the way to Bulalacao due southeast (Figure 2). Rimando and Rimando (2025) [1] identified 3 major geometric segments along the CMF: (1) the 80.25 km-long segment IA, (2) the 60 km-long segment II, and (3) the 57 km-long segment IIIA, at the northern, southern, and southwestern sections of the CMF, respectively (Figure 2). The CMF, along with a number of other strike-slip faults that belong to a wider transcurrent zone in southern Luzon, also accommodates part of the relative motion between the PSP and the SP [1].

2.2. Geomorphology

Mindoro features a NNW-SSE-oriented mountain range that runs along the length of the island, with the highest peak, Mt. Halcon, standing at 2616 m above sea level (Figure 3A). The mountain range separates the drainage basins of west-flowing rivers on the western sector of the range from the drainage basins of east-flowing rivers that were analyzed in this study. A topographic swath profile (Figure 3B) through the 40 drainage basins (with areas ranging from 1.5 to 206 km2) shows the distribution of maximum, mean, and minimum elevation values along-strike of the range. Close to ~70 km distance along the swath topographic profile (Figure 3B), there is a taper in the topography that roughly corresponds to the boundary between segments I and II (Figure 2 and Figure 3B), suggesting that a tectonic control on topography is likely. The trace of the CMF runs parallel to the NNW-SSE mountain range, but segment II exhibits a noticeable departure from the mountain front towards the southeast (Figure 2 and Figure 3A).

2.3. Geology

Mindoro is an amalgamation of 1 to 5 terranes [6,38,39,40,41,42,43,44] resulting from the suturing of mainly continent-derived materials comprising the Palawan Continental Block (PCB) and oceanic and island arc fragments of the PMB [27,42,43,44,45]. The island of Mindoro is composed of the following formations/groups [7]: late Jurassic Halcon Metamorphic Complex, including amphibolite, metagabbro, gneiss, greenschist, phyllite, slate, marble; late Middle Jurassic—early Late Jurassic Mansalay Formation, including sandstone, shale, siltstone, minor limestone, conglomerate; early Oligocene Amnay Ophiolite, including dunite, peridotite, gabbro, basalt; middle Oligocene Lumintao Basalt, including primarily basalt, but also some intercalated tuff, mudstone, siltstones and sandstones; Cretaceous Abra de Ilog Formation, including graywacke, shale, chert, spilitic basalt; late Eocene Lasala Formation, including sandstone, shale, mudstone, conglomerate, limestone, basalt flows and dikes; Pliocene Bongabong Group, including conglomerate, tuffacous sandstone, and mudstone; Pleistocene Oreng Formation, including limestone and conglomerate; and Quaternary Alluvium (Figure 4).

2.4. Climatic Setting

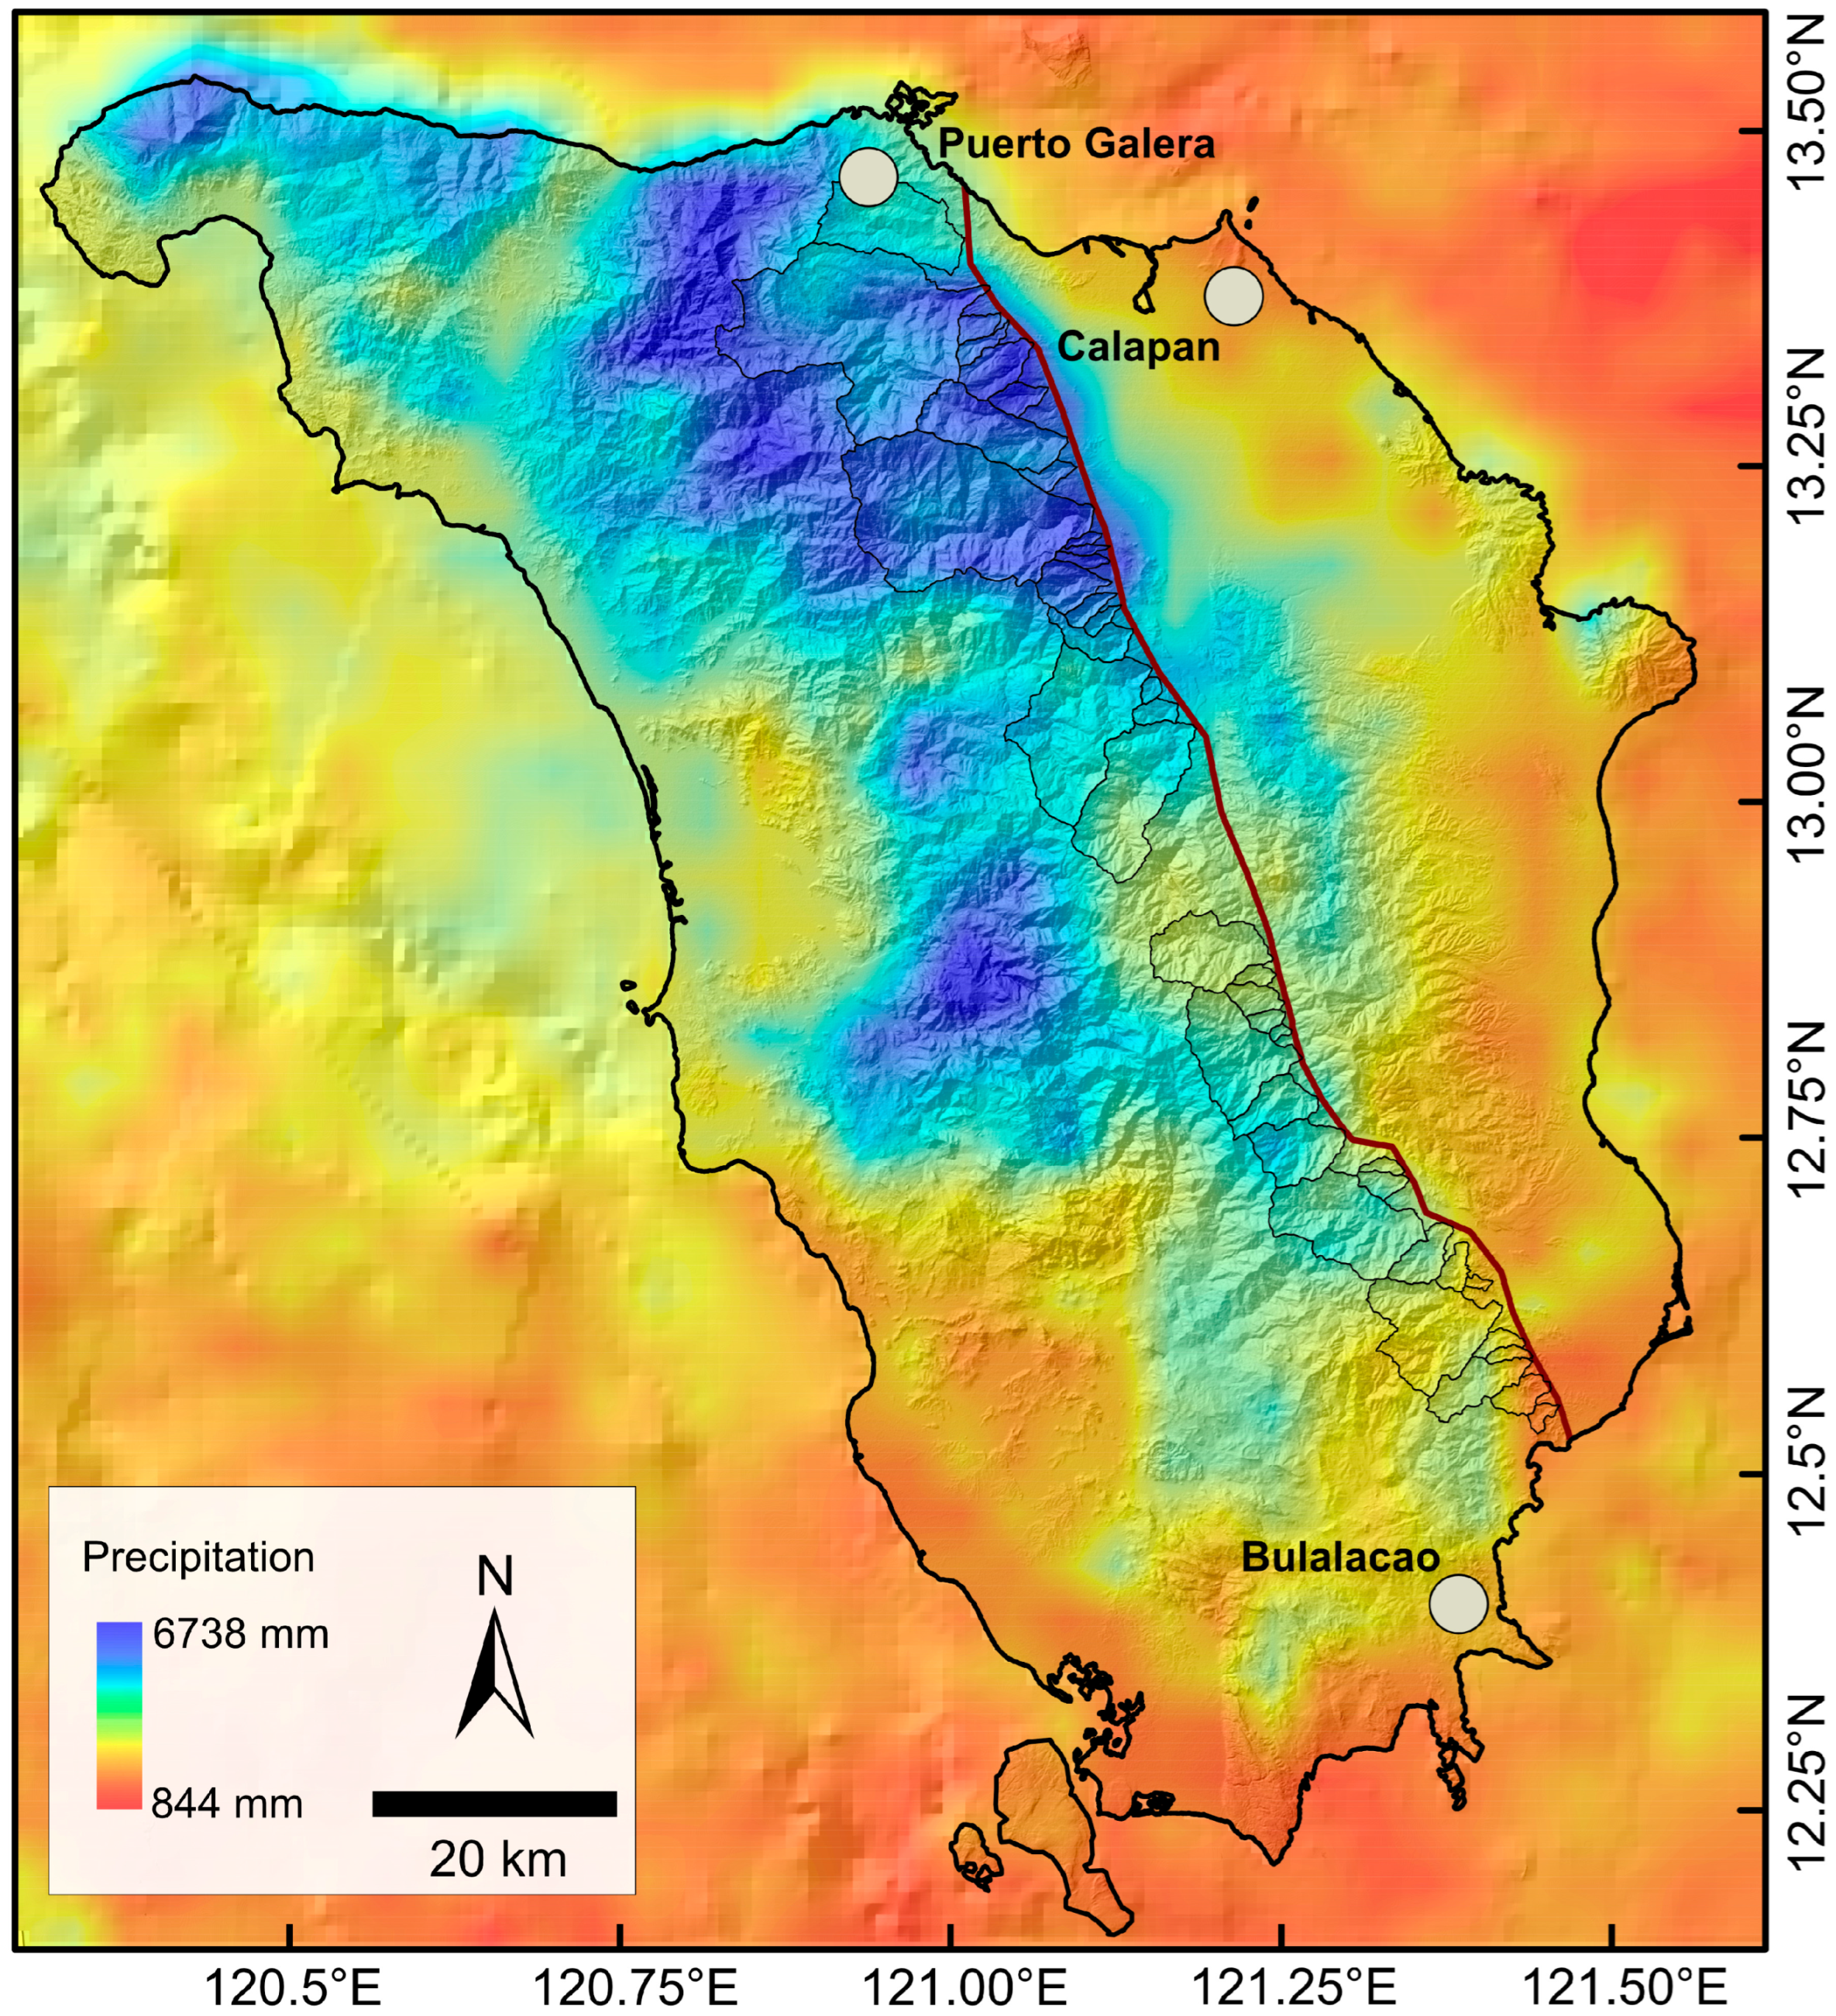
Since climate is known to influence the patterns and rates of landscape evolution [46], it is necessary to characterize the climatic setting, which can provide a proper context for interpreting trends in values of geomorphic indices [47,48,49]. In this study, we identify any along-strike climatic gradients by utilizing the decadal-scale (1998–2009) Tropical Rainfall Measuring Mission (TRMM) satellite-based average annual precipitation data [46] (Figure 5).
The west-east gradient of the TRMM-based annual precipitation map for the island of Mindoro is consistent with regional historical climate classification [50,51] assigning Types I and III climate to the western and eastern sectors of Mindoro, respectively, with the boundary between the two climatic types roughly aligned with the crest of the NNW-SSE-oriented CMF-bound mountain range which runs along the entire length of the island. A Type I climate is characterized by two pronounced seasons: dry from December to May, and wet from June to December. The peak rainfall season is from June to September. Areas with this type of climate experience the southwest monsoon (habagat) and receive significant rainfall due to tropical cyclones during the peak rainfall season. Type III climate lacks a defined peak rainfall season, with rather short dry seasons typically lasting less than three months. Areas with this type of climate do not experience the northeast monsoon (amihan) as much. However, these areas experience the southwest monsoon and rainfall due to tropical cyclones [50,51].
The TRMM-based annual precipitation values range from 844 mm/yr to as much as 6738 mm/yr (Figure 5). In situ rainfall measurements between 1991 and 2000 from the Philippine Atmospheric, Geophysical and Astronomical Services Administration [52] in Calapan of 2408 mm/yr indicate a consistency between the satellite-based TRMM and ground-based data. TRMM data provide greater spatial coverage and resolution, revealing along-strike climatic gradients that are the most relevant for our analyses. Particularly, the TRMM precipitation map reveals a ~40 km-long section northwest of the mountain range with a significantly higher precipitation rate.

3. Materials and Methods

To characterize the along-strike spatial distribution of relative uplift rates along the CMF, we calculated a combination of geomorphic indices. Knowledge of along-strike relative uplift rate variation enables us to infer possible fault segmentation patterns, the structural evolution of a fault system, and to identify priority sites for future detailed seismic hazard investigations. We measured valley-floor-width-to-height ratio (Vf), basin elongation ratio (Re), hypsometric attributes (including hypsometric Integral (HI), and the statistical moments of the hypsometric curve: skewness (Sk), Kurtosis (Kur), Density Skewness (Dsk), and Density Kurtosis (Dkur)), volume-to-area ratio (RVA), and normalized channel steepness index (ksn). These geomorphic indices have been extensively used to detect landform changes related to local tectonic base-level fall associated with range-bounding faults in different tectonic settings worldwide [21,53,54,55,56,57,58,59,60,61,62,63,64,65,66,67,68,69,70,71,72,73,74,75,76,77,78,79,80,81,82]. Therefore, these have been employed to infer the relative uplift rates along the CMF.
Among the geomorphic indices we explored, the valley-floor-width-to-height (Vf) ratio is perhaps one of the most direct indications of relative uplift rate since this is measured at or near the transition between the fault-bound mountain range and the foothills where tectonic perturbations, which cause base-level fall, mainly originate [83]. Volume-to-area ratio (RVA) and hypsometric integral (HI) were calculated as these have been shown to be effective at incorporating the effects of both hillslope and fluvial processes within the entire drainage basin, rather than reflecting individual aspects or sections of tectonic landforms. The statistical moments of the hypsometric curve (Sk, Kur, Dsk, and Dkur) were calculated since these supplement the limited characteristics of a drainage basin that can be inferred solely from the HI value. The basin elongation ratio (Re) was calculated as this provides an areal-based measure of the relative proportions of down-cutting and lateral erosion occurring in each drainage basin, thereby complementing Vf. The normalized channel steepness index (ksn) was also calculated, as it is sensitive to tectonic perturbations and reflects recent tectonic activity, which we utilized for inferring along-strike variations in uplift rates of the CMF.
We analyzed geologic maps from the Philippines’ Mines and Geosciences Bureau [7]; Google Earth satellite imagery; and a combination of hillshade, classified slope, and slope aspect maps that were processed from the 30 m-resolution Advanced Spaceborne Thermal Emission and Reflection Radiometer Global Digital Elevation Model Version 2 (ASTER GDEM V2) (https://asterweb.jpl.nasa.gov/gdem.asp, accessed on 4 February 2019) to delineate the CMF’s fault-bounded mountain range front.
ASTER GDEM V2 was preferred over similar resolution Shuttle Radar Topographic Mission (SRTM30) and ALOS World 3D—30 m (AW3D30) digital elevation models (DEM) due to the pervasiveness of voids in these models in mountainous regions. The vertical and horizontal accuracy of ASTER GDEM V2 is sufficient for our investigation of the spatial distribution of relative uplift rates, considering the scale of the study area, the features observed, and the nature of measurements for each of the geomorphic indices that we analyze. In our calculation of drainage basin-based geomorphic indices, we utilized the hydrology toolset of ArcGIS to delineate drainage basins. We selected pourpoints for basin delineation wherever a channel intersected the fault-bounded mountain range. We limited our calculations to drainage basins that are larger than 1 km2, allowing us to analyze enough basins along strike to have meaningful results, but prevented us from unnecessarily analyzing small basins that are likely to be dominated by non-fluvial processes, basins that were delineated erroneously due to issues with the DEM (as confirmed on satellite images), or basins that are too youthful to yield reliable measurements for morphometric analysis [84]. Moreover, while earlier studies demonstrate that smaller catchments can be more sensitive to uplift [85], it has been demonstrated that for most cases, there is a weak correlation between geomorphic index measurements and drainage basin area as long as a small variance in area of the chosen drainage basins is maintained [75,86].

3.1. Hypsometric Attributes

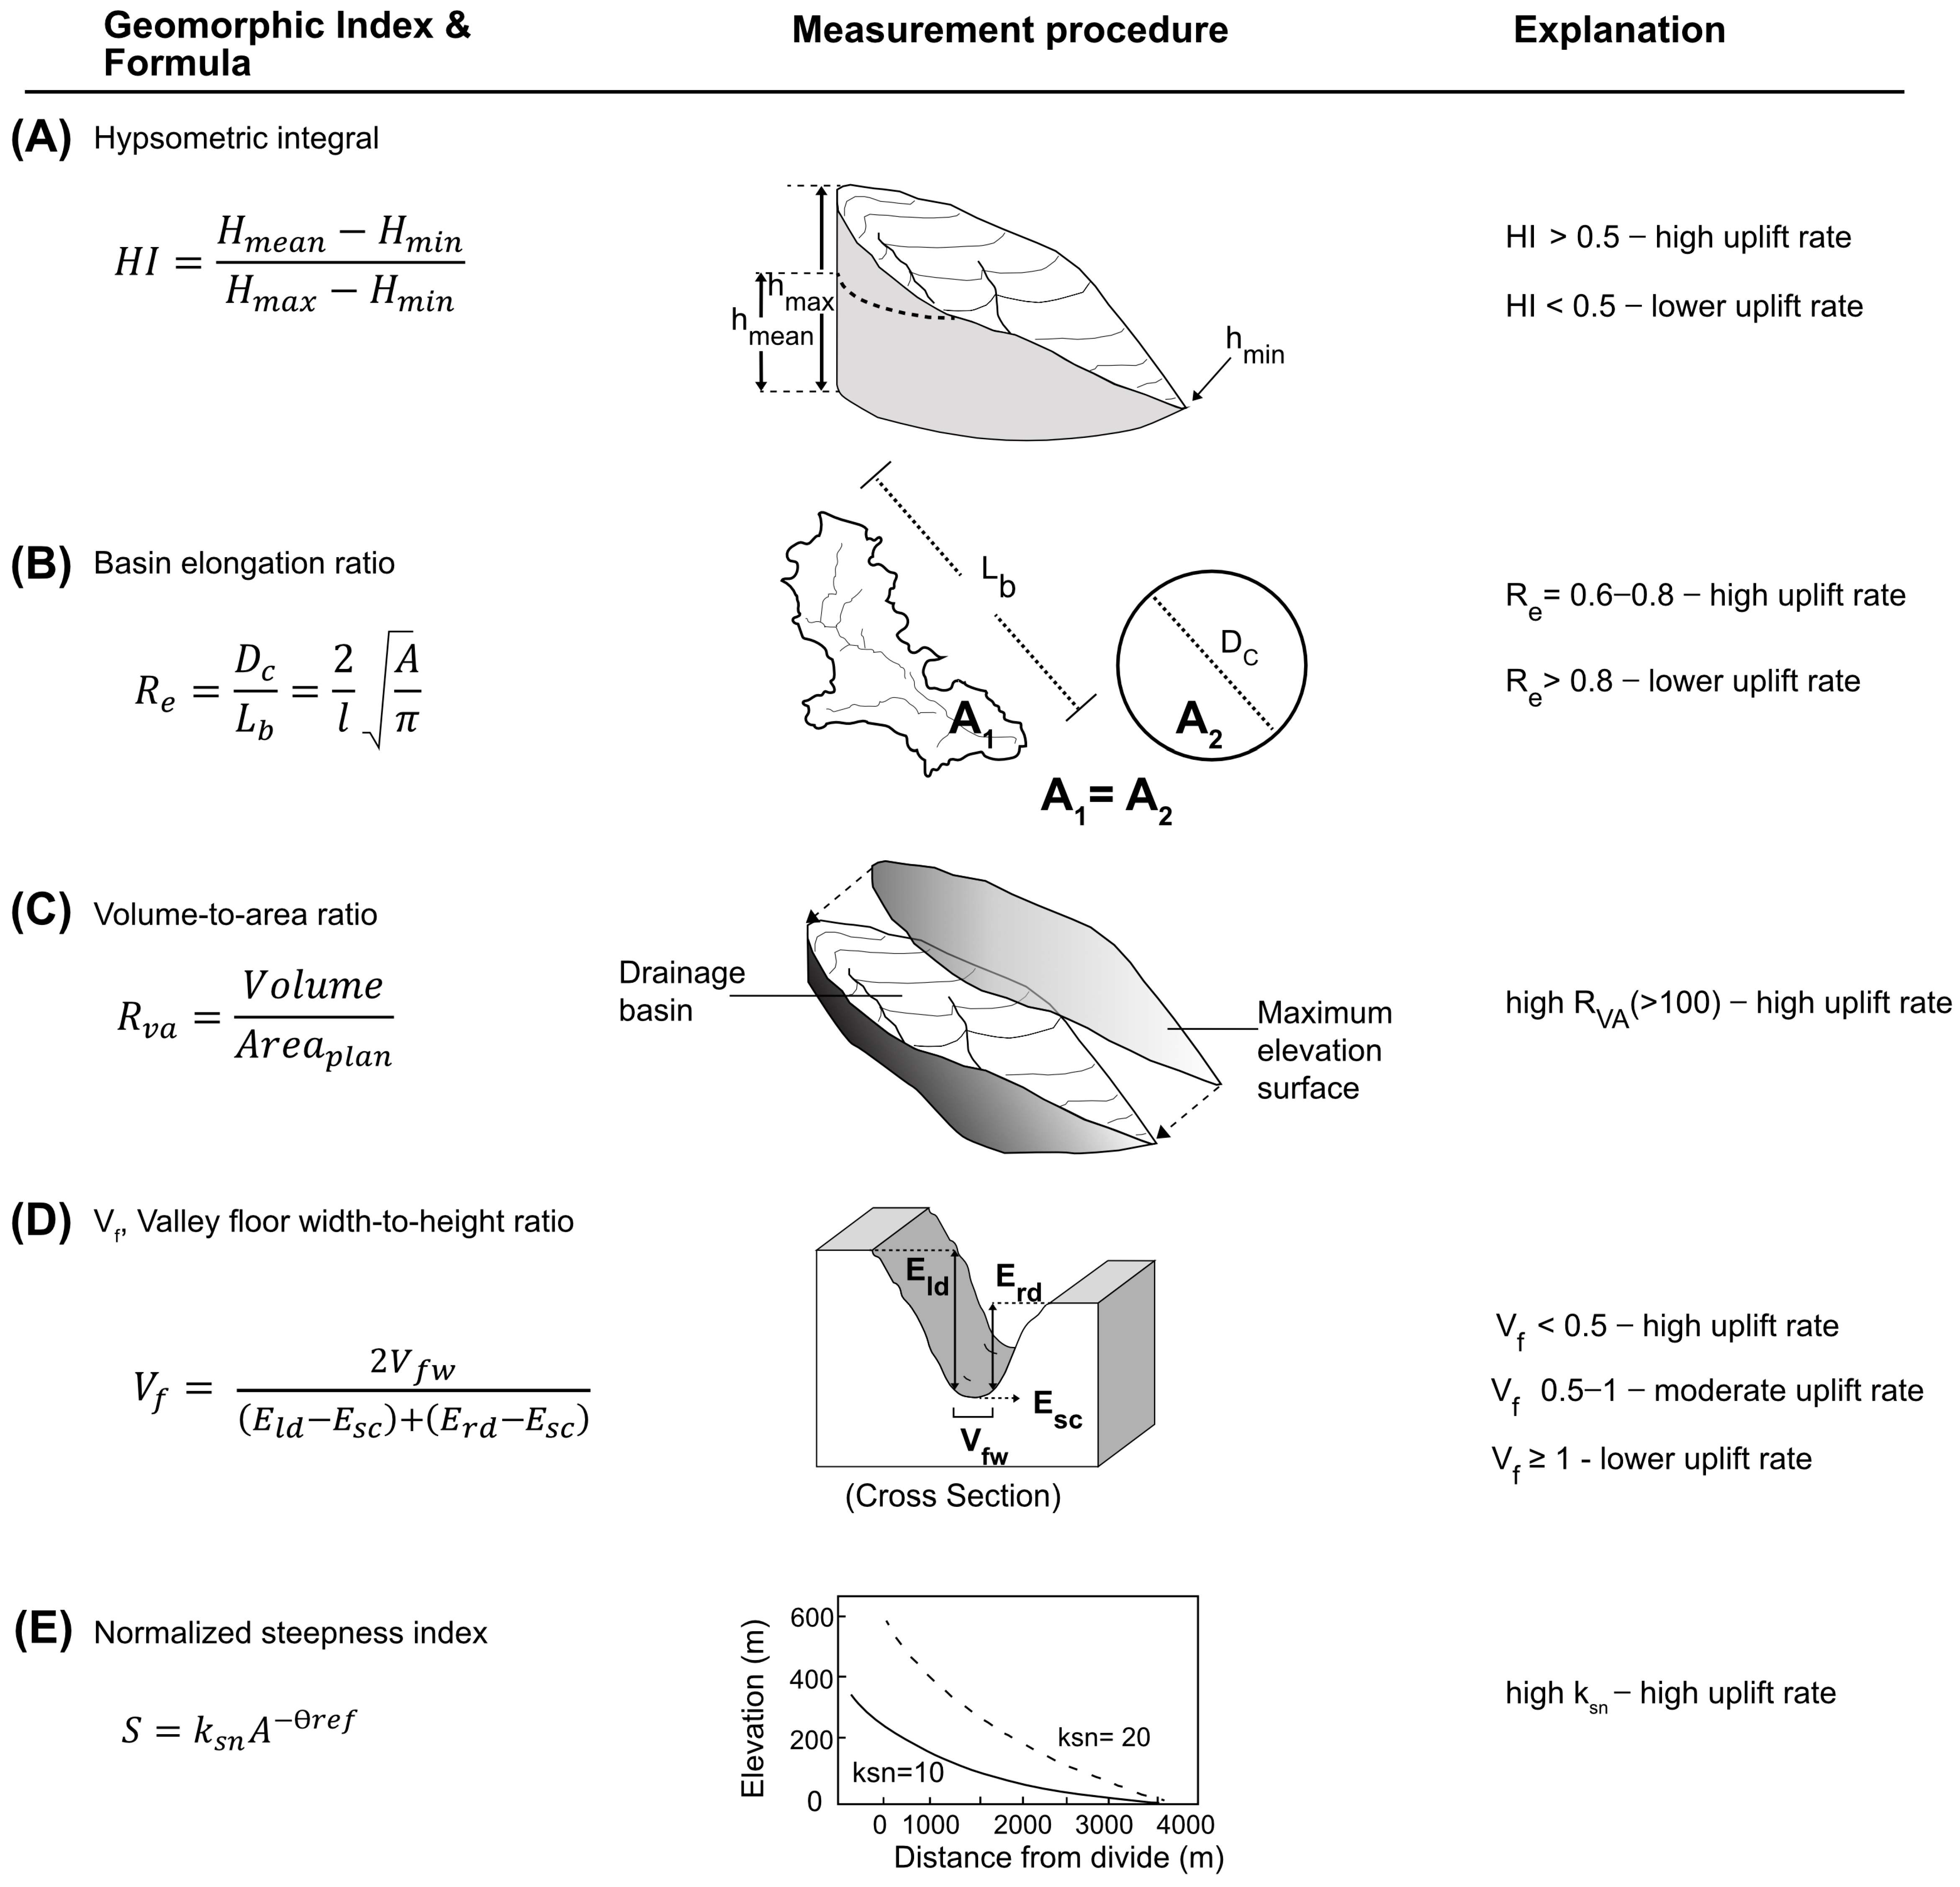
A drainage basin’s hypsometric curve is a representation of the distribution of elevations of a drainage basin [87], with the normalized cumulative area and the normalized relief of a drainage basin plotted on the x- and y-axes, respectively. The hypsometric integral (HI) (Figure 6A), which is utilized to infer basin maturity, corresponds to the area under the hypsometric curve. The hypsometric integral (HI) is calculated from three parameters as follows:
H I = H m e a n H m i n H m a x H m i n
where Hmean is the mean elevation, Hmin is the minimum elevation, and Hmax is the maximum elevation.
HI values can range from 0 to 1; HI values of 0.5–0.6 [88,89] are typically indicative of mature drainage basins. Higher hypsometric integral values usually indicate minimal erosion of material at higher elevation areas and therefore suggest a relatively young landscape associated with relatively higher uplift rates [90,91]. The topographic maturity of a landscape can be inferred from the shape of the hypsometric curve [87].
It can be more beneficial in some situations to describe the hypsometric curve’s shape than to refer to the hypsometric integral, which is represented by a single value, especially since there can be minimal variation in hypsometric integral value once it reaches below 0.6 or 0.5, despite the fact that the same values may potentially represent distinct shapes of hypsometric curves. Fitting a polynomial function with the hypsometric curve (a cumulative distribution function) allows the derivation of polynomial coefficients that represent the skewness and kurtosis of the hypsometric curve. Skewness (Sk) represents the magnitude of headward erosion in the upper reaches of a drainage basin, while kurtosis (Kur) represents the amount of erosion on both the upper and lower reaches of a basin. Density skewness (Dsk) and density kurtosis (Dkur), the skewness and kurtosis of the first derivative of the hypsometric curve (a density function), are indicative of the rate of slope change and mid-basin slope, respectively [92]. Using the drainage basin polygons and the DEM of the area, we utilized the ArcGIS add-in tool, CalHypso, to calculate these hypsometric attributes [93].

3.2. Basin Elongation Ratio (Re)

The basin elongation ratio (Re) is a ratio of the diameter of a circle of the same area as the basin to the drainage basin’s length (Figure 6B) [94]. This geomorphic index describes a basin’s shape, which can be indicative of the relative level of tectonic activity along strike of a fault-bound mountain range.
Mountain ranges that are tectonically active typically exhibit elongate drainage basins, while mountain ranges bound by less active and inactive faults exhibit drainage basins that tend to be more circular [95,96]. Re is expressed as follows:
R e = D c L b = 2 l A π
where Dc is the diameter of a circle of same area as the basin; Lb is the basin length; and A is the area of the basin.
Drainage basin shapes can be categorized according to elongation ratio as follows: very elongated (<0.5), elongated (0.5–0.7), slightly elongated (0.7–0.8), oval (0.8–0.9), and circular (0.9–1.0). The basin elongation ratio varies with the type of climate and geology, but typically ranges from 0.6 to 1 [87]. Re values of 0.6–0.8 correspond to elongated basins, with areas of high-relief and steep slopes, which are associated with high relative uplift; while Re values close to 1 correspond to circular basins, with areas of low-relief and gentle slopes, which are associated with low uplift rate. We obtained the area of each basis from the attributes table of each drainage basin clipping polygon and derived the length of each drainage basin from each basin’s convex hull, which we delineated using the minimum bounding geometry function of ArcGIS.

3.3. Volume to Area Ratio (RVA)

The volume-to-area ratio is the ratio of the drainage basin volume to its planimetric area (Figure 6C). Essentially a measure of a basin’s mean depth, this geomorphic index scales with the rate and amount of offset of the range-bounding fault [97,98,99,100,101]. RVA is expressed as follows:
R V A = V o l u m e A r e a p l a n
where areaplan refers to the planimetric area of the drainage basin.
This geomorphic index normalized basin volume by drainage area, thereby allowing drainage basins with a large range of sizes along strike of the fault-bound range to be directly compared. RVA values greater than 100 usually indicate high relative uplift rates, whereas RVA values that are significantly lower than 100 typically, but not automatically, indicate low relative uplift rates. Actively uplifting basins in their ‘constructional phase’ exhibit low RVA ratios [102]. In ArcGIS, we calculated the drainage basin volume as the difference between the drainage basin topography and the maximum elevation envelope (theoretical pre-erosional surface) that was derived from elevations on the basin’s drainage divide [63,103].

3.4. Valley Floor Width to Valley Height Ratio (Vf)

The valley floor width to valley height ratio (Vf) is the ratio of the width of the valley floor to the average height of the valley (Figure 6D). Vf is expressed as follows:
V f = 2 V f w E l d E s c + E r d E s c
where Vfw represents the valley floor width; Eld, the elevation of the left valley divide; Erd, the elevation of the right valley divide; and Esc, the average valley floor elevation.
Measurement of Vf facilitates the distinction between valleys that evolve primarily due to active downcutting associated with base level fall and valleys that are dominated by lateral erosion of hillslopes. A lower Vf value indicates a narrower valley floor resulting from a higher degree of river down-cutting due to a higher level of tectonic activity [84]. We adopted a standard distance (0.5 to 1 km) from the mountain front for measuring the Vf due to the fact that valley floors tend to become progressively narrower upstream and progressively wider downstream [84]. When comparing Vf values in different locations, drainage basin area, climatic gradients, and lithology were all accounted for, as Vf values may vary based on basin size, discharge, and rock erodibility. Vf values between 0.05 and 0.5 are typical of narrow, deeply incised, V-shaped channels that are formed by very high uplift rates [83], while values close to or greater than 1 are associated with U-shaped channels that are formed by low uplift rates. Vf is an effective indicator of changes in uplift rate on timescales of 10–100 ky [83]. We limited our calculation of Vf to a narrow range of basin sizes (~2–6 km2) for consistency, as smaller streams tend to maintain downcutting much longer compared to larger basins [102]. We calculated Vf from cross-sections extracted at a distance of 500 m upstream of watersheds by using the ‘interpolate line’ and ‘profile graph’ tool of ArcGIS.

3.5. Normalized Channel Steepness Indices (ksn)

The normalized steepness index (ksn) is the steepness of DEM-derived longitudinal stream profiles that has been normalized by contributing drainage basin area [104]. Uplift rate primarily controls the power-law scaling between bedrock river slope and contributing drainage basin area [105,106,107,108]. Therefore, ksn is utilized to map tectonic boundaries and to characterize the spatial distribution of uplift rates along fault systems (Figure 6E). Resembling the stream power incision model from which it was derived, the equation for the normalized steepness index utilizes a reference concavity to factor in the influence of the upstream drainage basin area on the channel slope as follows:
S = k s n A θ r e f
where S is channel slope, A is upstream drainage basin area, and Θref is the reference concavity. A reference concavity of 0.45 is typically used as it provides a good approximation for the natural concavity of rivers, which ranges between 0.4 and 0.6 [105,106,109].
Caution should be observed while utilizing ksn to map the spatial patterns of relative uplift rates—complexities must be considered in distinguishing spatial variations in ksn values as a result of tectonic activity from variation related to lithology [110,111,112], precipitation rate [46], and stream capture [113].
Topographic knickpoints, which are abrupt changes in slope that separate graded channel segments, are also usually identified during ksn analysis of longitudinal stream profiles. Stationary knickpoints can be found along faults or boundaries of lithologic units, while transient knickpoints are usually due to base-level fall or a temporal increase in uplift rate along a structure (fault or fold), and their presence can indicate a change in tectonic [114,115,116,117,118]. Transient knickpoints usually manifest as slope-break knickpoints, separating graded segments with different steepness indices [109], and these tend to migrate upstream as a kinematic wave [119] until equilibrium has been reached by slopes along the entire channel [120,121,122]. The elevation of transient knickpoints that were formed at the same time can be expected to reflect the relative magnitude of the tectonic perturbation (e.g., uplift related to folding or faulting), assuming spatially uniform rock erosional resistance, precipitation rates, and uplift rate [107,122,123].
For calculating normalized steepness indices and identifying knickpoints along stream profiles, we utilized the now-defunct Geomorphtools’ Stream Profiler ArcGIS add-in following the methods of Wobus et al. (2006) [107]. We calculated ksn through linear regression of segments of the log-transformed slope-area plots and identified knickpoints on both river longitudinal profiles and in log-transformed slope-area plots (Supplementary Figures S1–S40).

4. Results

The geomorphic indices that we calculated over the 40 drainage basins in this study are summarized in Figure 7, Figure 8 and Figure 9. Here we describe the range of values and any observed trends.
Hypsometric integral (HI) values range from ~0.2 to ~0.6. HI values start off at ~0.3 at the northwestern end, peak at ~0.6 between 20 and 40 km distance, then gradually decrease due southeast (Figure 7A). Skewness (Sk), kurtosis (Kur), and density skewness (Dsk) (Figure 7B–D) exhibit similar overall trends and clustering of lower values between 20 and 40 km distance, and outliers towards the northwestern and southeastern ends. Skewness (Sk), kurtosis (Kur), and density skewness (Dsk) values mostly range between 0.4 and 0.6, 2.1 and 2.4, and −0.2 and 0.6, respectively; clusters of low values between 20 to 40 km distance of <0.4, <2.1, and <−0.2, respectively, and outliers at the northwestern and southeastern ends at of ~0.8, ~2.6, and ~0.8, respectively. Density kurtosis (Dkur) (Figure 7E) values lie mostly between 1.4 and 1.8, with the exception of the northwestern and southeastern ends that exhibit values of >2.2. Unlike the first 3 statistical moments of the hypsometric curve, Dkur does not show clustering of low values between 20 and 40 km distance (Figure 7E).
Basin elongation ratio (Re) values range from 0.4 to 0.8 and mostly cluster between 0.6 and 0.8, except for the 7 to 40 km interval, where a considerable number of values dip to as low as 0.4 (Figure 7F).
Volume to area ratio (RVA) values span a wide range from 3 to 652, but cluster between 31 and 343 (with 3 and 652 being outliers). Both <100 and >100 RVA values are almost evenly distributed along the entire length of the mountain range (Figure 7G).
Valley floor width to valley height ratio (Vf) values range from 0.3 to 1.7, with most Vf values ranging from 0.3 to 0.75 between 20 and 100 km. A few ≤0.50 Vf values can be found between 20 and 40 km. Several Vf values exceed 1 towards the northwestern end (0 to 20 km) and southeastern end (beyond 100 km) (Figure 7H).
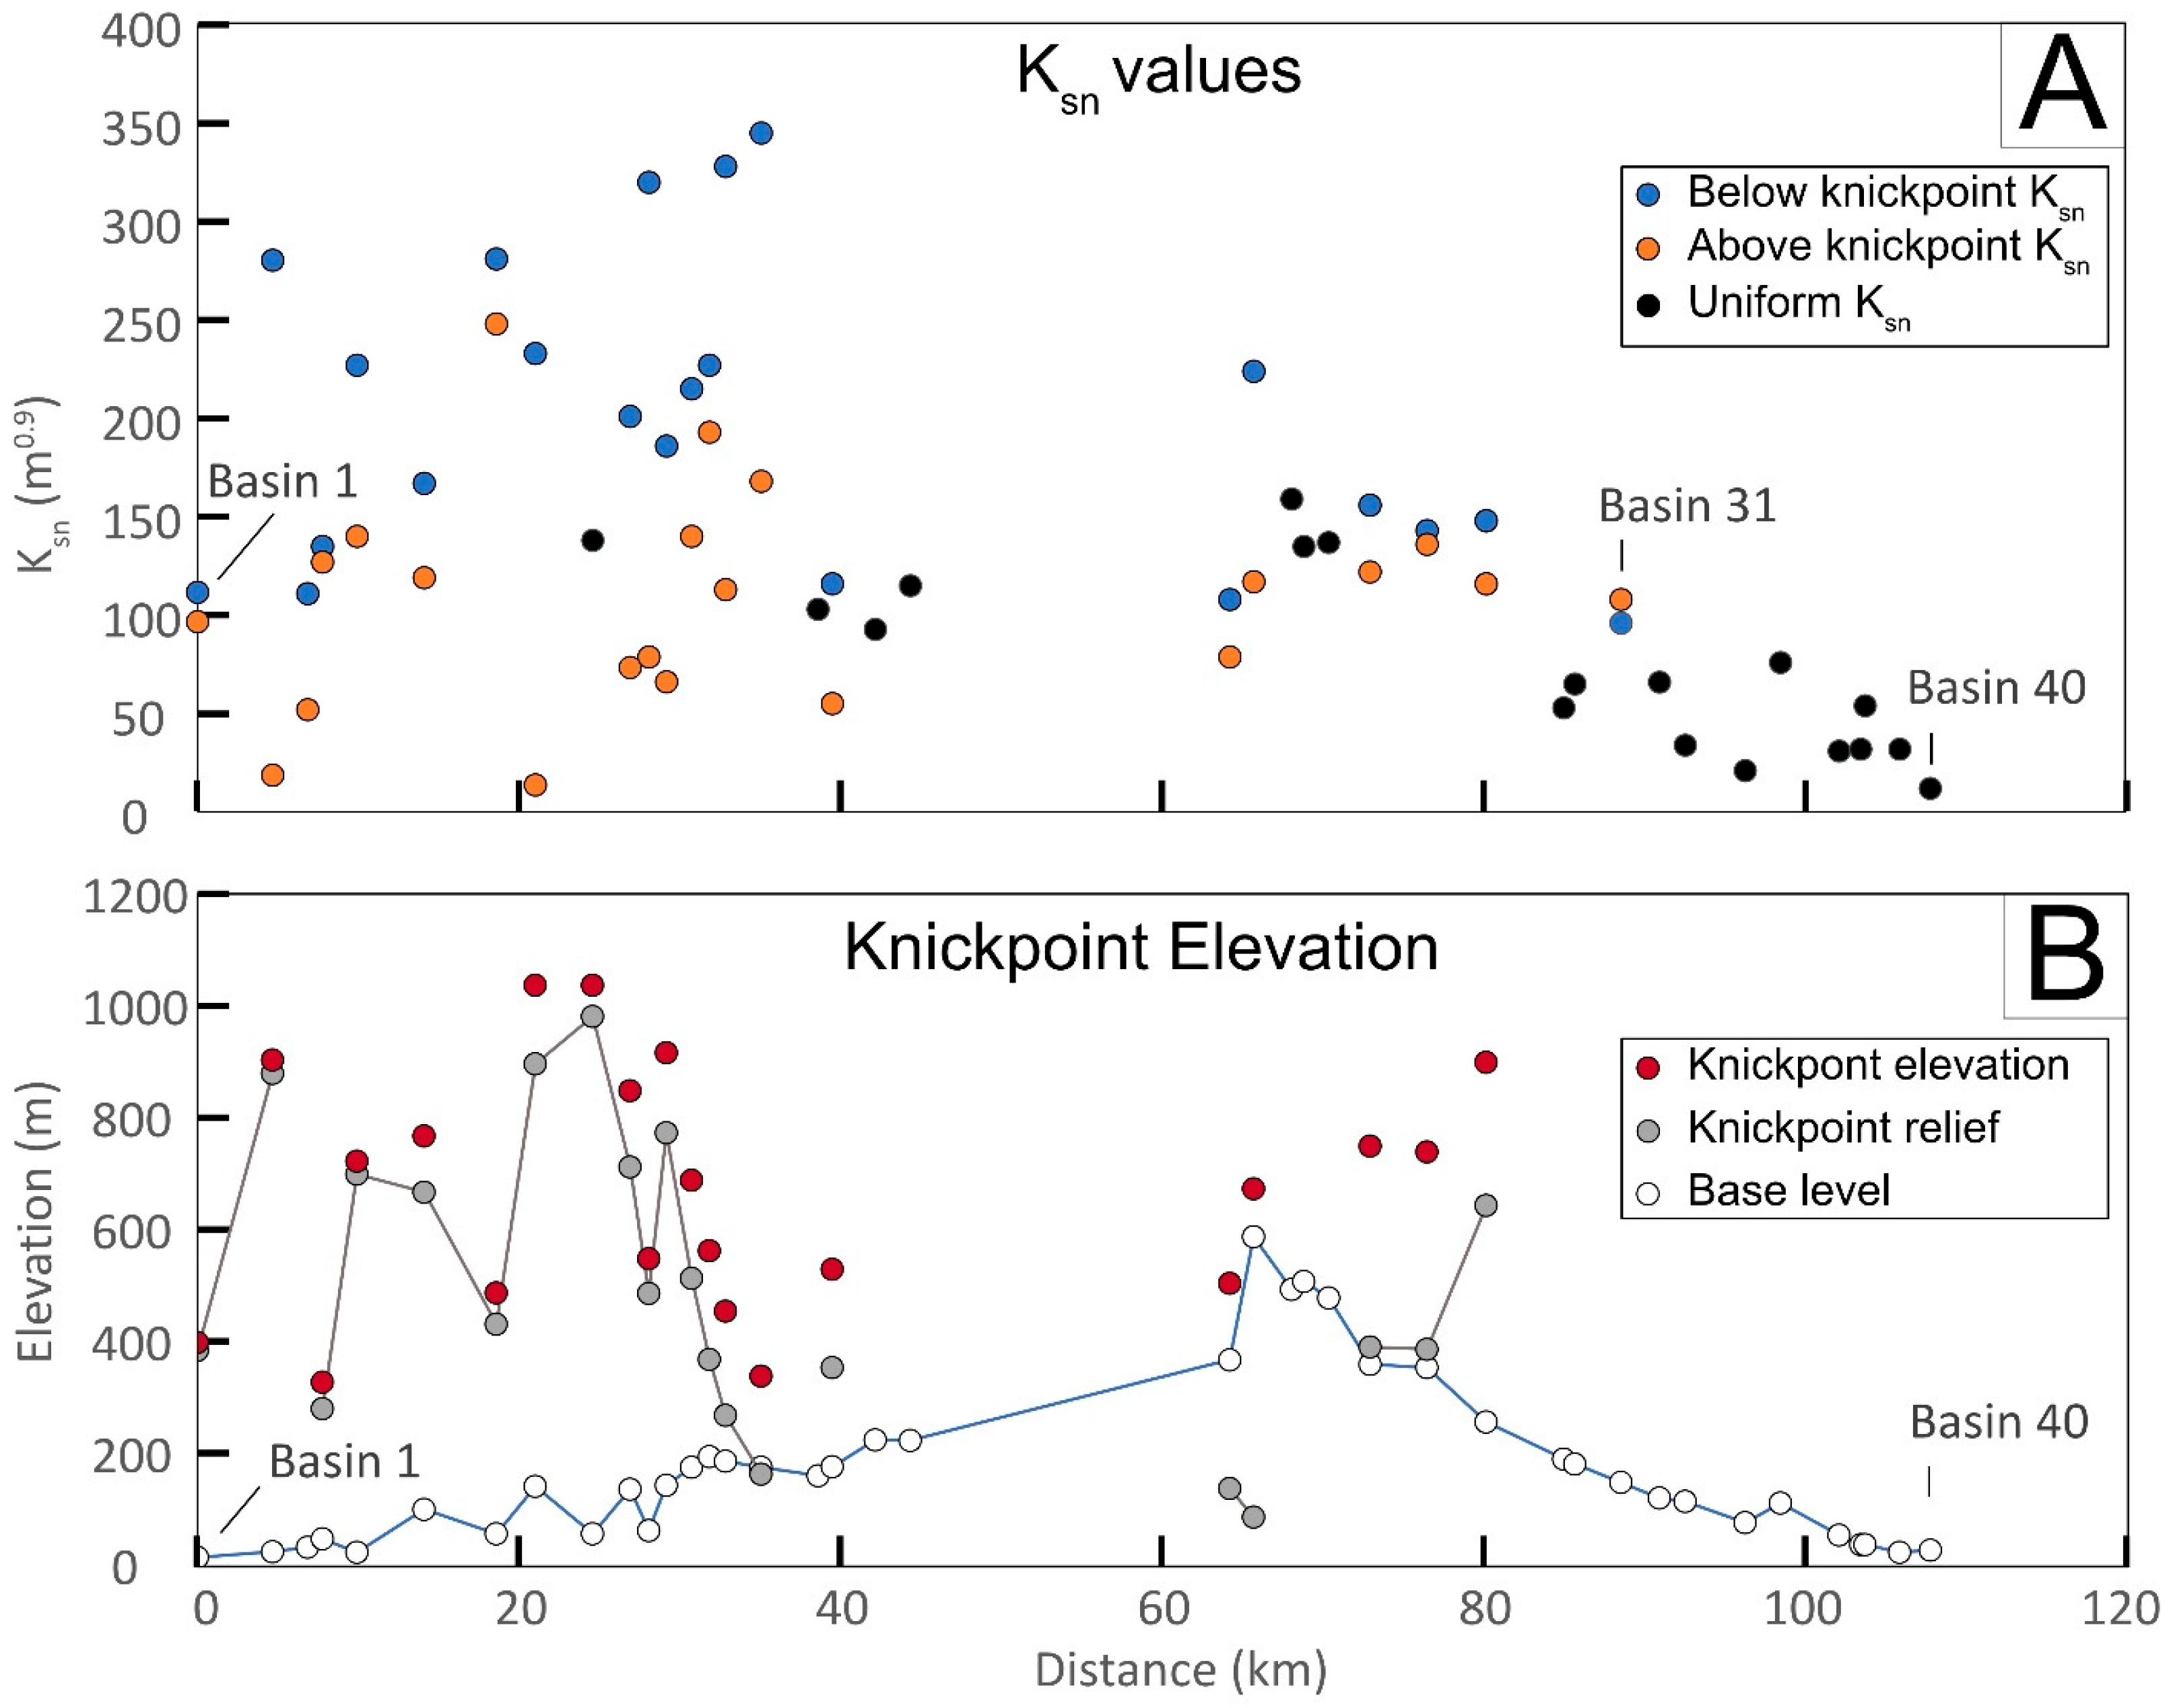
Normalized steepness index (ksn) values of up to 345 m0.9 were measured along segments of the rivers draining east of the CMF (Figure 8 and Figure 9A). Along rivers where no knickpoints were identified (“single segment rivers”), “single segment” ksn values range from 12 to 76 m0.9. Where knickpoints were identified, river profiles were segmented. For profiles that exhibited multiple knickpoints, we focused only on the ksn values below and above the lowest knickpoint, which we refer to as “below knickpoint” and “above knickpoint” ksn values, respectively. “Below knickpoint” ksn values range from 96 to 345 m0.9, while “above knickpoint” ksn values range from 13 to 248 m0.9. Values of “below knickpoint” ksn values are shown to reach up to 17 times higher compared to “above knickpoint” ksn values. It is worth noting that both “below knickpoint” and “above knickpoint” ksn values exhibit a cluster of relatively higher values between 0 and 40 km distance, and that “single segment” rivers towards the southeast exhibit ksn values that are noticeably much lower than the ‘below knickpoint’ ksn values due northwest (0 to 80 km distance) (Figure 9A).
Knickpoints were identified on 21 river profiles (Figure 8), with most of the river profiles exhibiting either slope-break knickpoints or knickzones, rather than vertical step knickpoints (Supplementary Figures S1–S40). A considerable number of knickpoints exhibit elevations that appear to be higher towards the northwest (up to >1000 m high) between 4.5 km and 30 km distance. Even when the pourpoint elevation (which is an approximation of the base level) is considered, differences in elevation between knickpoints and outlet/pourpoints still display higher values (up to ~1000 m high) between 4.5 km and 30 km (Figure 9B).

5. Discussion

We infer relative uplift rates and spatial trends from each of the geomorphic indices that were calculated along the length of the fault-bounded mountain range. We also analyze the relationships among the different geomorphic indices to identify comparable trends or inconsistencies. Finally, we interpret these results in the context of the known kinematics and segmentation patterns of the CMF, as well as the geology and climate of the area, and discuss the implications for regional tectonics and seismic hazards.
The distribution of hypsometric integral (HI) values (Figure 7A) suggests an overall trend of decreasing uplift rate from northwest to southeast, with the highest uplift rates between 20 and 40 km distance, and lowest towards the northwestern and southeastern ends. All skewness (Sk) values (Figure 7B) are positive, suggesting a high degree of headward erosion in the upper reaches of the drainage basins, but to a lesser extent in the drainage basins between 20 and 40 km distance, where the lowest Sk values cluster. The similar trend of kurtosis (Kur) values (Figure 7C) indicates that advanced erosion in both the upper and lower reaches of a basin occurs to a lesser extent in the drainage basins between 20 and 40 km distance. While density skewness (Dsk) values (Figure 7D) exhibit a similar trend as Sk and Kur, the sign of the value bears weight on their interpretation. Positive Dsk values that can be observed throughout the range indicate greater slope change in the upper reaches of a drainage basin, while the negative values that cluster between 5 and 40 km indicate greater slope change in the lower reaches of a drainage basin. Density kurtosis (Dkur) (Figure 7E), which is indicative of the mid-basin slope, however, does not exhibit any discernible trend. Overall, the location and amount of enhanced erosion and slope changes suggested by the statistical moments of the drainage basin hypsometric curves corroborate, or at the very least do not appear to contradict, the interpretation of the existence of higher uplift rates inferred from the higher HI values. In fact, the usefulness of having calculated these statistical moments becomes more apparent when their consistency with ksn values becomes apparent later in this section. Additionally, these statistical moments suggest the section of the mountain range that exhibits a high uplift range could possibly be more extensive (interval between 5 and 40 km distance).
Most of the basins along the entire mountain range are slightly elongated (Re values of 0.7–0.8) to elongated (Re values of 0.5–0.7), suggesting high uplift rates. Notably, between 7 and 40 km distance, the drainage basins are highly elongated (Re values of < 0.5), suggesting very high uplift rates (Figure 7F).
The almost even distribution of basins with >100 volume-to-area ratio (RVA) values along the entire length of the mountain range suggests high uplift rates from northwest to southeast. While there are interspersed <100 RVA values, these are not extremely low, and are therefore more likely to be associated with actively uplifting basins in their ‘constructional phase’ than with low uplift rates (Figure 7G).
The valley floor width to valley height ratio (Vf) values of mostly between 0.3 and 0.75 at distances between 20 and 100 km indicate channel cross-sectional profiles that are intermediate between narrow, deeply incised, V-shaped and broad, U-shaped cross-sectional profiles, which are likely to be a result of moderate uplift rates. Vf values of ≤0.50 between 20 and 40 km distance indicate V-shaped cross-sectional profiles, suggesting the higher uplift rates, while Vf values exceeding 1 towards the northwestern end (0 to 20 km distance) and southeastern end (beyond 100 km distance), indicate lower uplift rates towards the tips of the range (Figure 7H).
A great deal of ksn values (Figure 8 and Figure 9A) measured on rivers from 0 to 80 km distance were significantly higher (>>100 m0.9, and up to 345 m0.9), and comparable to those measured in active tectonic regions characterized by high uplift rates [75,124,125,126]. Rivers towards the southeast (80 km distance onwards) exhibited lower ksn values (12 to 76 m0.9) compared to ksn values of rivers further northwest, and to ksn values of rivers in other active tectonic settings worldwide, suggesting relatively low to moderate uplift rates. With the exception of one catchment (Figure 9A; drainage basin 31 at ~64 km distance), the ksn values below the lowest knickpoints are mostly significantly higher than ksn above the knickpoints, consistent with what is expected of actively uplifting regions (e.g., [68] and references therein). ksn being higher above the knickpoint in basin 31 could be due to the existence of erosionally resistant lithology.
The knickpoints that we identified do not appear to display any spatial correlation with lithologic boundaries (Figure 8) and are mostly slope-break knickpoints (Supplementary Figures S1–S40), mostly separating lower river segment segments with higher ksn from higher river segments with lower ksn. Based on the observed morphology and spatial distribution of knickpoints, these are more likely transient and could either indicate a change in climatic or tectonic forcing. Between 4.5 km and 30 km distance (Figure 9B), there is a cluster of knickpoints that exhibit a high elevation difference with respect to the base-level (approximated by the corresponding drainage basin’s outlet/pourpoint elevation).
Taken together, all the geomorphic indices that we calculated seem to point to the existence of high uplift rates along the CMF. However, there is some variability in the along-strike spatial limits of the high uplift areas suggested by these different geomorphic indices: HI and Vf suggest the section (between 20 and 40 km); statistical moments of the hypsometric curve (between 5 and 40 km or 20 and 40 km distance); knickpoints (4.5 km and 30 km distance); ksn (between 0 to 80 km); Re (entire range, with very high uplift rates between 7 and 40 km); and RVA (entire range).
We interpreted any variations in geomorphic index values along strike of the fault-bounded mountain range in terms of uplift rates, factoring in both lithological heterogeneities and climatic gradients. To factor in lithological contrasts, we analyzed the locations on a lithologic map of the drainage basins or river channels from which the geomorphic indices values were calculated.
While lithological contrasts could complicate our interpretation of trends in geomorphic indices in terms of uplift rates, especially in the northwest sector of the CMF-bound mountain range (Figure 4), a strong argument can be made that tectonics is still more likely to exert a first-order control on the geomorphology of the fault-bound mountain range. We acknowledge that higher uplift rates were inferred from values of several geomorphic indices in the northwestern section (between 0 and 40 km distance), which is dominated by typically highly erosionally resistant schists of the Halcon Metamorphic Complex (Figure 4) [7]. Interestingly, though, the highest annual TRMM-based precipitation rates (>6000 mm) on the island of Mindoro (Figure 5) spatially coincide with the erosionally resistant lithology in the northwestern section of the range, and could feasibly be counterbalancing the erosionally resistant lithology along this section of the mountain range. Assuming this is the case, the potential complications introduced by erosional resistance in the interpretation of geomorphic indices may not be as significant as one would usually expect. Most importantly, independent, primary evidence of high uplift rates exists for the northwestern section of the mountain range (between 0 and 40 km distance). Rimando and Rimando (2025) [1] have previously presented geomorphic evidence of a significant vertical component of fault displacement along the northwestern section of the CMF. Considering the spatial extent and proximity of the CMF, as well as the magnitude of tectonic perturbation caused by the CMF (based on vertical displacement measurements), a strong case can be made for assuming that the CMF likely exerts a first-order control on the geomorphology of the drainage basins along this section. Additionally, due to the long response times of the landscape to tectonic perturbations (~104 to 106 yr) [127,128], these relative uplift rates associated with the CMF are likely to be applicable since at least the Pleistocene.
It is also worth noting that higher uplift rates were also inferred from values of some of the geomorphic indices towards the southeast (>50 km distance), where the lithology is dominated by presumably less erosionally resistant clastic sedimentary rocks of the Mansalay Formation (Figure 4) [7]. While significant within-formation variability in erosional resistance cannot be ruled out, these inferred high uplift rates are more likely real and point to a persistent tectonic signal, likely resulting from proximity to segment III of the CMF that exhibits a high vertical component of displacement (Figure 2). On the other hand, the low uplift rates in the southeastern section inferred from some of the geomorphic indices (e.g., ksn and Vf) could possibly be due to the fact that the southern traces (segment II) of the CMF are located further west of the mountain front (Figure 3), and that the drainage basins delineated based on the mountain front are unable to detect the possibly largest contributing tectonic signal from the CMF.
In addition to the vertical component of displacement observed along the entire CMF, regional uplift related to subduction along the Manila Trench, as well as active folding-related uplift, could also be contributing to the shaping of the drainage basins, and could explain some of the geomorphic indices that suggest the existence of high uplift rates along the entire length of the mountain range.

6. Conclusions

Through our interpretation of several geomorphic indices collectively along the CMF, we have established that:
(1)
There are two possible spatial distributions of uplift rates that are applicable since at least the Pleistocene, taking into consideration both lithological heterogeneities and climatic gradients:
  • at least 20–30 km-long high uplift rates section in the northwestern end of the CMF-bound mountain range (CMF segment I), and
  • at most, possibly the entire CMF with moderate to high uplift rates. The inferred spatial trends in uplift rates from this study are consistent with the fault offset plots from earlier detailed mapping of the CMF.
(2)
Knowledge of the relatively high uplift areas along the CMF can aid in identifying areas that are more tectonically active, by making assumptions about the CMF’s fault dip and its uniformity (steep fault dip, based on the outcrop pattern of the CMF’s trace), and by limiting one’s search to areas with similar vertical-to-horizontal displacement ratios (V/H) sites along the CMF. Doing so can help narrow down priority sites for more detailed field-based neotectonic and paleoseismic studies from which information for seismic hazard assessments, such as possible earthquake magnitude, return periods, and slip rates, can be derived. Based on fault offset measurements and our knowledge of high uplift areas from this study, future work aimed at estimating the CMF’s seismogenic capability will likely benefit the most from focusing on sites along CMF segments I and III.

Supplementary Materials

The following supporting information can be downloaded at: https://www.mdpi.com/article/10.3390/geohazards6030057/s1, Figures S1–S40: River Profiles 1–40, Supplementary Table S1: Geomorphic Indices of the Central Mindoro Fault.

Author Contributions

Conceptualization, J.R.; methodology, J.R.; software, J.R.; validation, J.R. and R.R.; formal Analysis, J.R. and R.R.; investigation, J.R. and R.R.; resources, J.R. and R.R.; data curation, J.R. and R.R.; writing—original draft preparation, J.R. and R.R.; writing—review and editing, J.R. and R.R.; visualization, J.R.; supervision, J.R.; project administration, J.R.; funding acquisition, J.R. and R.R. All authors have read and agreed to the published version of the manuscript.

Funding

This research received no external funding.

Data Availability Statement

The original contributions presented in this study are included in the open-access Zenodo repository at https://doi.org/10.5281/zenodo.15706302. Further inquiries can be directed to the corresponding author.

Acknowledgments

A large part of this work was accomplished while Jeremy Rimando was with the University of Toronto, which provided the software and other resources. We gratefully acknowledge the Department of Science and Technology-Philippine Institute of Volcanology and Seismology (DOST-PHIVOLCS) for supporting Rolly Rimando during the mapping of the CMF. We also thank the editors of GeoHazards for their assistance and the reviewers for their helpful feedback.

Conflicts of Interest

The authors declare no conflicts of interest.

References

  1. Rimando, R.; Rimando, J. The Central Mindoro Fault: An Active Sinistral Fault Within the Translational Boundary Between the Palawan Microcontinental Block and the Philippine Mobile Belt. GeoHazards 2025, 6, 6. [Google Scholar] [CrossRef]
  2. Seno, T.; Stein, S.; Gripp, A.E. A model for the motion of the Philippine Sea plate consistent with NUVEL-1 and geological data. J. Geophys. Res. Solid Earth 1993, 98, 17941–17948. [Google Scholar] [CrossRef]
  3. Rimando, R.; Rimando, J.; Lim, R. Complex Shear Partitioning involving the 6 February 2012 Mw 6.7 Negros Earthquake Ground Rupture in Central Philippines. Geosciences 2020, 10, 460. [Google Scholar] [CrossRef]
  4. Philippine Institute of Volcanology and Seismology (PHIVOLCS). The PHIVOLCS Faultfinder. 2025. Available online: http://faultfinder.phivolcs.dost.gov.ph/ (accessed on 2 January 2025).
  5. Metal Mining Agency of Japan–Japan International Cooperation Agency (MMAJ-JICA). Report on the Geological Survey of Mindoro Island Consolidated Report; MMAJ-JICA: Metro Manila, Philippines, 1984; Volume 57. [Google Scholar]
  6. Karig, D.E.; Sarewitz, D.R.; Haeck, G.D. Role of strike-slip faulting in the evolution of allochthonous terranes in the Philippines. Geology 1986, 14, 852–855. [Google Scholar] [CrossRef]
  7. Mines and Geosciences Bureau (MGB). Geology of the Philippines, 2nd ed.; Mines and Geosciences Bureau, Department of Environment and Natural Resources: Quezon City, Philippines, 2010. [Google Scholar]
  8. Rangin, C.; Stephan, J.F.; Blanchet, R.; Baladad, D.; Bouysee, P.; Chen, M.P.; Chotin, P.; Collot, J.; Daniel, J.; Drouhot, J.M.; et al. Seabeam survey at the southern end of the Manila trench. Transition between subduction and collision processes, offshore Mindoro Island, Philippines. Tectonophysics 1988, 146, 261–278. [Google Scholar] [CrossRef]
  9. Sarewitz, D.R.; Karig, D.E. Processes of allochthonous terrane evolution, Mindoro Island, Philippines. Tectonics 1986, 5, 525–552. [Google Scholar] [CrossRef]
  10. Sarmiento, K.J.S.; Aurelio, M.A.; Flores, P.C.M.; Carrillo, A.D.V.; Marfito, B.J.; Abigania, M.I.T.; Daag, A.S.; Siringan, F.P. Seafloor structures and static stress changes associated with two recent earthquakes in offshore southern Batangas, Philippines. Front. Earth Sci. 2022, 9, 801670. [Google Scholar] [CrossRef]
  11. Wynne, D.B.; McCabe, R.; Mazzullo, J.; Malicse, A. Terrane suturing, Mindoro, Philippines. In Proceedings of the Abstracts and Programs of the Annual Meeting of the Geological Society of America 1985, Orlando, FL, USA, 28–31 October 1985. [Google Scholar]
  12. Rimando, R.; Rimando, J. Morphotectonic Kinematic Indicators Along the Vigan-Aggao Fault—The Western Deformation Front of the Philippine Fault Zone in Northern Luzon, Philippines. Geosciences 2020, 10, 83. [Google Scholar] [CrossRef]
  13. Nakata, T.; Tsutsumi, H.; Punongbayan, R.S.; Rimando, R.E.; Daligdig, J.A.; Daag, A.S.; Besana, G.M. Surface Faulting Associated with the Philippine Earthquake of 1990. J. Geogr. (Chigaku Zasshi) 1990, 99, 515–532. [Google Scholar] [CrossRef][Green Version]
  14. Rimando, R.E.; Knuepfer, P.L.K. Neotectonics of the Marikina Valley fault system (MVFS) and tectonic framework of structures in northern and central Luzon, Philippines. Tectonophysics 2006, 415, 17–38. [Google Scholar] [CrossRef]
  15. Rimando, R.E.; Kurita, K.; Kinugasa, Y. Spatial and temporal variation of aseismic creep along the dilational jog of the West Valley Fault, Philippines: Hazard implications. Front. Earth Sci. 2022, 10, 935161. [Google Scholar] [CrossRef]
  16. Rimando, R.E.; Knuepfer, P.L. Tectonic Control of Aseismic Creep and Potential for Induced Seismicity Along the West Valley Fault in Southeastern Metro Manila, Philippines. GeoHazards 2024, 5, 1172–1189. [Google Scholar] [CrossRef]
  17. Rimando, R.E.; Knuepfer, P.L. Earthquake History and Rupture Extents from Morphology of Fault Scarps Along the Valley Fault System (Philippines). GeoHazards 2025, 6, 23. [Google Scholar] [CrossRef]
  18. Rimando, R.E.; Punongbayan, R.S.; Geronimo-Catane, S.G.; Mirabueno, H.S.; Rasdas, A.S. Ground rupture of the 15 November 1994 Oriental Mindoro (Philippines) earthquake. In Proceedings of the Abstracts of the XXI General Assembly of IUGG, Boulder, CO, USA, 2–14 July 1995. [Google Scholar]
  19. Rimando, J.; Aurelio, M.; Dianala, J.D.; Taguibao, K.J.; Agustin, K.M.; Berador, A.E.; Vazquez, A. Coseismic ground rupture of the 15 October 2013 magnitude (Mw) 7.2 Bohol Earthquake, Bohol island, Central Philippines. Tectonics 2019, 38, 2558–2580. [Google Scholar] [CrossRef]
  20. Llamas, D.C.E.; Marfito, B.J.; Dela Cruz, R.; Aurelio, M.A. Surface rupture and fault characteristics associated with the 2020 magnitude (Mw) 6.6 Masbate earthquake, Masbate Island, Philippines. Tectonics 2024, 43, e2023TC008106. [Google Scholar] [CrossRef]
  21. Cantillep, A.M.F.; Ramos, N.T.; Rimando, J. Relative Uplift Rates along the Vigan-Aggao Fault in Ilocos Norte, Philippines Evaluated Through Morphometric Analysis. Geomorphica 2024, 1, 28. [Google Scholar] [CrossRef]
  22. Rimando, J.; Schoenbohm, L.; Costa, C.; Owen, L.; Cesta, J.; Richard, A.; Gardini, C. Late Quaternary Activity of the La Rinconada Fault Zone, San Juan, Argentina. Tectonics 2019, 38, 916–940. [Google Scholar] [CrossRef]
  23. Rimando, J.; Schoenbohm, L.; Ortiz, G.; Alvarado, P.; Venerdini, A.; Owen, L.; Seagren, E.; Figueiredo, P.; Hammer, S. Late Quaternary Intraplate Deformation Defined by the Las Chacras Fault Zone, West-Central Argentina. Tectonics 2021, 40, e2020TC006509. [Google Scholar] [CrossRef]
  24. Hollenstein, C.; Müller, M.D.; Geiger, A.; Kahle, H.G. Crustal Motion and Deformation in Greece from a Decade of GPS Measurements, 1993–2003. Tectonophysics 2008, 449, 17–40. [Google Scholar] [CrossRef]
  25. Lazos, I.; Chatzipetros, A.; Pavlides, S.; Pikridas, C.; Bitharis, S. Tectonic Crustal Deformation of Corinth Gulf, Greece, Based on Primary Geodetic Data. Acta Geodyn. Geomater. 2020, 17, 4. [Google Scholar] [CrossRef]
  26. Müller, M.D.; Geiger, A.; Kahle, H.G.; Veis, G.; Billiris, H.; Paradissis, D.; Felekis, S. Velocity and Deformation Fields in the North Aegean Domain, Greece, and Implications for Fault Kinematics, Derived from GPS Data 1993–2009. Tectonophysics 2013, 597, 34–49. [Google Scholar] [CrossRef]
  27. Hamilton, W.B. Tectonics of the Indonesian Region, Professional Paper; US Geological Survey: Washington, DC, USA, 1979; p. 345. [Google Scholar]
  28. Acharya, H.K.; Aggarwal, Y.P. Seismicity and tectonics of the Philippine Islands. J. Geophys. Res. 1980, 85, 3239–3250. [Google Scholar] [CrossRef]
  29. Bautista, B.C.; Bautista, M.L.P.; Oike, K.; Wu, F.T.; Punongbayan, R.S. A new insight on the geometry of subducting slabs in northern Luzon, Philippines. Tectonophysics 2001, 339, 279–310. [Google Scholar] [CrossRef]
  30. Cardwell, R.K.; Isacks, B.L.; Karig, D.E. The spatial distribution of earthquakes, focal mechanism solutions, and subducted lithosphere in the Philippine and northeastern Indonesian Islands. In The Tectonic and Geologic Evolution of Southeast Asian Seas and Islands; Hayes, D.E., Ed.; American Geophysical Union: Washington, DC, USA, 1980; pp. 1–35. [Google Scholar] [CrossRef]
  31. Hamburger, M.; Cardwell, R.; Isacks, B. Seismotectonics of the Luzon, Philippines, region. In The Tectonic and Geologic Evolution of Southeast Asian Seas and Islands; Hayes, D.E., Ed.; American Geophysical Union: Washington, DC, USA, 1983; pp. 1–35. [Google Scholar] [CrossRef]
  32. Hayes, D.E.; Lewis, S.D. Structure and tectonics of the Manila Trench System, western Luzon, Philippines. Energy 1985, 10, 263–279. [Google Scholar] [CrossRef]
  33. Ozawa, A.; Tagami, T.; Listanco, E.L.; Arpa, C.B.; Sudo, M. Initiation and propagation of subduction along the Philippine Trench: Evidence from the temporal and spatial distribution of volcanoes. J. Asian Earth Sci. 2004, 23, 105–111. [Google Scholar] [CrossRef]
  34. Allen, C.R. Circum-Pacific faulting in the Philippines-Taiwan region. J. Geophys. Res. 1962, 67, 4795–4812. [Google Scholar] [CrossRef]
  35. Marfito, B.J.; Llamas, D.C.E.; Aurelio, M.A. Geometry and segmentation of the Philippine Fault in Surigao Strait. Front. Earth Sci. 2022, 10, 799803. [Google Scholar] [CrossRef]
  36. Pinet, N.; Stephan, J.F. The Philippine wrench fault system in the Ilocos Foothills, northwestern Luzon, Philippines. Tectonophysics 1990, 183, 207–224. [Google Scholar] [CrossRef]
  37. Mitchell, A.H.G.; Hernandez, F.T.; Dela Cruz, A.P. Cenozoic evolution of the Philippine Archipelago. J. Southeast Asian Earth Sci. 1986, 1, 3–22. [Google Scholar] [CrossRef]
  38. Gervasio, F.C. A study of the tectonics of the Philippine archipelago. Philipp. Geol. 1966, 20, 51–74. [Google Scholar]
  39. Karig, D.E. Accreted terranes in the northern part of the Philippine archipelago. Tectonics 1983, 2, 211–236. [Google Scholar] [CrossRef]
  40. Rangin, C.; Stephan, J.F.; Muller, C. Middle Oligocene oceanic crust of South China Sea jammed into Mindoro collision zone (Philippines). Geology 1985, 13, 425–428. [Google Scholar] [CrossRef]
  41. Marchadier, Y.; Rangin, C. Polyphase tectonics at the southern tip of the Manila trench, Mindoro-Tablas Islands, Philippines. Tectonophysics 1990, 183, 273–287. [Google Scholar] [CrossRef]
  42. Taylor, B.; Hayes, D.E. The Tectonic Evolution of the South China Basin. In The Tectonic and Geologic Evolution of Southeast Asian Seas and Islands; Hayes, D.E., Ed.; American Geophysical Union: Washington, DC, USA, 1980; pp. 89–104. [Google Scholar] [CrossRef]
  43. Holloway, N.H. North Palawan block, Philippines—Its relation to Asian mainland and role in evolution of South China Sea. AAPG Bull. 1982, 66, 1355–1383. [Google Scholar] [CrossRef]
  44. McCabe, R.; Almasco, J.; Diegor, W. Geologic and paleomagnetic evidence for a possible Miocene collision in western Panay, central Philippines. Geology 1982, 10, 325–329. [Google Scholar] [CrossRef]
  45. Yumul, G.P.; Dimalanta, C.B.; Tamayo, R.A. Indenter-tectonics in the Philippines: Example from the Palawan Microcontinental Block-Philippine Mobile Belt Collision. Resour. Geol. 2005, 55, 189–198. [Google Scholar] [CrossRef]
  46. Bookhagen, B.; Strecker, M.R. Spatiotemporal trends in erosion rates across a pronounced rainfall gradient: Examples from the southern Central Andes. Earth Planet. Sci. Lett. 2012, 327, 97–110. [Google Scholar] [CrossRef]
  47. Tucker, G.E. Drainage basin sensitivity to tectonic and climatic forcing: Implications of a stochastic model for the role of entrainment and erosion thresholds. Earth Surf. Process. Landf. 2004, 29, 185–205. [Google Scholar] [CrossRef]
  48. Molnar, P.; Anderson, R.S.; Kier, G.; Rose, J. Relationships among probability distributions of stream discharges in floods, climate, bed load transport, and river incision. J. Geophys. Res. Earth Surf. 2006, 111, F2. [Google Scholar] [CrossRef]
  49. Attal, M.; Cowie, P.A.; Whittaker, A.C.; Hobley, D.; Tucker, G.E.; Roberts, G.P. Testing fluvial erosion models using the transient response of bedrock rivers to tectonic forcing in the Apennines, Italy. J. Geophys. Res. Earth Surf. 2011, 116, F2. [Google Scholar] [CrossRef]
  50. Coronas, J. The Climate and Weather of the Philippines, 1908 to 1918; Bureau of Printing: Manila, Philippines, 1920. [Google Scholar]
  51. Kintanar, R.L. Climate of the Philippines; Philippine Atmospheric, Geophysical and Astronomical Services Administration (PAGASA): Quezon City, Philippines, 1984. [Google Scholar]
  52. PAGASA. Climate Data in the Philippines; Philippine Atmospheric, Geophysical and Astronomical Services Administration: Quezon City, Philippines, 2025. Available online: https://www.pagasa.dost.gov.ph/climate/climate-data (accessed on 2 January 2025).
  53. Ahmad, S.; Alam, A.; Ahmad, B.; Bhat, M.I.; Bhat, M.S. Geomorphic evidence of unrecognized Balapur fault segment in the southwest Kashmir basin of northwest Himalayas. Geomorphology 2015, 250, 159–172. [Google Scholar] [CrossRef]
  54. Alaei, M.; Dehbozorgi, M.; Ghassemi, M.R.; Nozaem, R. Evaluation of relative tectonic activity of Buin Zahra-Avaj area, northern Iran. Arab. J. Geosci. 2017, 10, 3025. [Google Scholar] [CrossRef]
  55. Alipoor, R.; Poorkermani, M.; Zare, M.; El Hamdouni, R. Active tectonic assessment around Rudbar Lorestan dam site, High Zagros Belt (SW of Iran). Geomorphology 2011, 128, 1–14. [Google Scholar] [CrossRef]
  56. Arian, M.; Aram, Z. Relative tectonic activity classification in the Kermanshah area, western Iran. Solid Earth 2014, 5, 1277–1291. [Google Scholar] [CrossRef]
  57. Azañón, J.M.; Perez-Pena, J.V.; Giaconia, F.; Booth-Rea, G.; Martinez-Martinez, J.M.; Rodríguez-Peces, M.J. Active tectonics in the central and eastern Betic Cordillera through morphotectonic analysis: The case of Sierra Nevada and Sierra Alhamilla. J. Iber. Geol. 2012, 38, 225–238. [Google Scholar] [CrossRef]
  58. Azor, A.; Keller, E.A.; Yeats, R.S. Geomorphic indicators of active fold growth: South Mountain–Oak Ridge anticline, Ventura basin, southern California. Geol. Soc. Am. Bull. 2002, 114, 745–753. [Google Scholar] [CrossRef]
  59. Chang, Z.; Sun, W.; Wang, J. Assessment of the relative tectonic activity in the Bailongjiang Basin: Insights from DEM-derived geomorphic indices. Environ. Earth Sci. 2015, 74, 5143–5153. [Google Scholar] [CrossRef]
  60. Daxberger, H.; Riller, U. Analysis of geomorphic indices in the southern Central Andes (23–28° S): Evidence for pervasive Quaternary to Recent deformation in the Puna Plateau. Geomorphology 2015, 248, 57–76. [Google Scholar] [CrossRef]
  61. Ehsani, J.; Arian, M. Quantitative analysis of relative tectonic activity in the Jarahi-Hendijan basin area, Zagros, Iran. Geosci. J. 2015, 19, 751–765. [Google Scholar] [CrossRef]
  62. El Hamdouni, R.; Irigaray, C.; Fernandez, T.; Chacón, J.; Keller, E.A. Assessment of relative active tectonics, southwest border of the Sierra Nevada (southern Spain). Geomorphology 2008, 96, 150–173. [Google Scholar] [CrossRef]
  63. Gaidzik, K.; Ramírez-Herrera, M.T. Geomorphic indices and relative tectonic uplift in the Guerrero sector of the Mexican forearc. Geosci. Front. 2017, 8, 885–902. [Google Scholar] [CrossRef]
  64. Gao, M.; Zeilinger, G.; Xu, X.; Wang, Q.; Hao, M. DEM and GIS analysis of geomorphic indices for evaluating recent uplift of the northeastern margin of the Tibetan Plateau, China. Geomorphology 2013, 190, 61–72. [Google Scholar] [CrossRef]
  65. Giaconia, F.; Booth-Rea, G.; Martínez-Martínez, J.M.; Azañón, J.M.; Pérez-Peña, J.V.; Pérez-Romero, J.; Villegas, I. Geomorphic evidence of active tectonics in the Sierra Alhamilla (eastern Betics, SE Spain). Geomorphology 2012, 145, 90–106. [Google Scholar] [CrossRef]
  66. Gürbüz, A.; Gürer, Ö.F. Tectonic geomorphology of the North Anatolian fault zone in the lake Sapanca Basin (eastern Marmara Region, Turkey). Geosci. J. 2008, 12, 215–225. [Google Scholar] [CrossRef]
  67. Gusti, U.; Peace, A.; Rimando, J. Tectonic geomorphology of the Ottawa-Bonnechere Graben, Eastern Canada: Implications for regional uplift and intraplate seismicity. Can. J. Earth Sci. 2023, 60, 635–652. [Google Scholar] [CrossRef]
  68. Krystopowicz, N.; Schoenbohm, L.M.; Rimando, J.; Brocard, G.; Rojay, B. Tectonic geomorphology and Plio-Quaternary structural evolution of the Tuzgölü fault zone: Implications for deformation in the interior of the Central Anatolian Plateau. Geosphere 2020, 16, 1107–1124. [Google Scholar] [CrossRef]
  69. Özkaymak, Ç. Tectonic analysis of the Honaz Fault (western Anatolia) using geomorphic indices and the regional implications. Geodin. Acta 2015, 27, 110–129. [Google Scholar] [CrossRef]
  70. Özkaymak, Ç.; Sözbilir, H. Tectonic geomorphology of the Spildağı high ranges, western Anatolia. Geomorphology 2012, 173, 128–140. [Google Scholar] [CrossRef]
  71. Özsayın, E. Relative tectonic activity assessment of the Çameli Basin, Western Anatolia, using geomorphic indices. Geodin. Acta 2016, 28, 241–253. [Google Scholar] [CrossRef]
  72. Pedrera, A.; Pérez-Peña, J.V.; Galindo-Zaldívar, J.; Azañón, J.M.; Azor, A. Testing the sensitivity of geomorphic indices in areas of low-rate active folding (eastern Betic Cordillera, Spain). Geomorphology 2009, 105, 218–231. [Google Scholar] [CrossRef]
  73. Pérez-Peña, J.V.; Azor, A.; Azañón, J.M.; Keller, E.A. Active tectonics in the Sierra Nevada (Betic Cordillera, SE Spain): Insights from geomorphic indexes and drainage pattern analysis. Geomorphology 2010, 119, 74–87. [Google Scholar] [CrossRef]
  74. Peters, G.; van Balen, R.T. Tectonic geomorphology of the northern Upper Rhine graben, Germany. Glob. Planet. Change 2007, 58, 310–334. [Google Scholar] [CrossRef]
  75. Rimando, J.M.; Schoenbohm, L.M. Regional relative tectonic activity of structures in the Pampean flat slab segment of Argentina from 30 to 32° S. Geomorphology 2020, 350, 106908. [Google Scholar] [CrossRef]
  76. Rockwell, T.K.; Keller, E.A.; Johnson, D.L. Tectonic geomorphology of alluvial fans and mountain fronts near Ventura, California. In Tectonic Geomorphology; Morisawa, M., Ed.; Proceedings of the 15th Annual Geomorphology Symposium; Allen and Unwin Publishers: Boston, MA, USA, 1985; pp. 183–207. [Google Scholar]
  77. Selim, H.H.; Tüysüz, O.; Karakaş, A.; Taş, K.Ö. Morphotectonic evidence from the southern branch of the North Anatolian Fault (NAF) and basins of the south Marmara sub-region, NW Turkey. Quat. Int. 2013, 292, 176–192. [Google Scholar] [CrossRef]
  78. Silva, P.G.; Goy, J.L.; Zazo, C.; Bardají, T. Fault-generated mountain fronts in southeast Spain: Geomorphologic assessment of tectonic and seismic activity. Geomorphology 2003, 50, 203–225. [Google Scholar] [CrossRef]
  79. Viveen, W.; Van Balen, R.T.; Schoorl, J.M.; Veldkamp, A.; Temme, A.J.A.M.; Vidal-Romani, J.R. Assessment of recent tectonic activity on the NW Iberian Atlantic Margin by means of geomorphic indices and field studies of the Lower Miño River terraces. Tectonophysics 2012, 544, 13–30. [Google Scholar] [CrossRef]
  80. Watkinson, I.M.; Hall, R. Fault systems of the eastern Indonesian triple junction: Evaluation of Quaternary activity and implications for seismic hazards. Geol. Soc. Lond. Spec. Publ. 2017, 441, 71–120. [Google Scholar] [CrossRef]
  81. Wells, S.G.; Bullard, T.F.; Menges, C.M.; Drake, P.G.; Karas, P.A.; Kelson, K.I.; Ritter, J.B.; Wesling, J.R. Regional variations in tectonic geomorphology along a segmented convergent plate boundary, Pacific coast of Costa Rica. Geomorphology 1988, 1, 239–265. [Google Scholar] [CrossRef]
  82. Yıldırım, C. Relative tectonic activity assessment of the Tuz Gölü fault zone; Central Anatolia, Turkey. Tectonophysics 2014, 630, 183–192. [Google Scholar] [CrossRef]
  83. Bull, W.B. Tectonic Geomorphology of Mountains: A New Approach to Paleo-Seismology; John Wiley & Sons: Hoboken, NJ, USA, 2008. [Google Scholar] [CrossRef]
  84. Bull, W.B.; McFadden, L.D. Tectonic geomorphology North and South of the Garlock Fault, California. In Geomorphology in Arid Regions: A Proceedings Volume of the 8th Annual Geomorphology Symposium; Doehring, D.O., Ed.; State University of New York: Binghamton, NY, USA, 1977; pp. 115–138. [Google Scholar] [CrossRef]
  85. Merritts, D.; Vincent, K.R. Geomorphic response of coastal streams to low, intermediate, and high rates of uplift, Medocino triple junction region, northern California. Geol. Soc. Am. Bull. 1989, 101, 1373–1388. [Google Scholar] [CrossRef]
  86. Rimando, J. Distribution and Rates of Quaternary Deformation within the Pampean Flat Slab Segment of the Central Andes of Argentina from 30–32° S. Doctoral Dissertation, University of Toronto, Toronto, ON, Canada, 2020. [Google Scholar]
  87. Strahler, A.N. Hypsometric (area-altitude) analysis of erosional topography. Geol. Soc. Am. Bull. 1952, 63, 1117–1142. [Google Scholar] [CrossRef]
  88. Carson, M.A.; Kirkby, M.J. Hillslope Form and Process; Cambridge University Press: London, UK, 1972. [Google Scholar]
  89. Chorley, R.J.; Kennedy, B.A. Physical Geography: A Systems Approach; Prentice-Hall International Inc.: London, UK, 1971. [Google Scholar]
  90. Chen, Y.C.; Sung, Q.; Cheng, K.Y. Along-strike variations of morphotectonic features in the Western Foothills of Taiwan: Tectonic implications based on stream-gradient and hypsometric analysis. Geomorphology 2003, 56, 109–137. [Google Scholar] [CrossRef]
  91. Lifton, N.A.; Chase, C.G. Tectonic, climatic and lithologic influences on landscape fractal dimension and hypsometry: Implications for landscape evolution in the San Gabriel Mountains, California. Geomorphology 1992, 5, 77–114. [Google Scholar] [CrossRef]
  92. Harlin, J.M. Statistical moments of the hypsometric curve and its density function. J. Int. Assoc. Math. Geol. 1978, 10, 59–72. [Google Scholar] [CrossRef]
  93. Pérez-Peña, J.V.; Azañón, J.M.; Azor, A. CalHypso: An ArcGIS extension to calculate hypsometric curves and their statistical moments. Applications to drainage basin analysis in SE Spain. Comput. Geosci. 2009, 35, 1214–1223. [Google Scholar] [CrossRef]
  94. Schumm, S.A. Evolution of drainage systems and slopes in badlands at Perth Amboy, New Jersey. Geol. Soc. Am. Bull. 1956, 67, 597–646. [Google Scholar] [CrossRef]
  95. Cannon, P.J. Generation of explicit parameters for a quantitative geomorphic study of Mill Creek drainage basin. Okla. Geol. Notes 1976, 36, 3–16. [Google Scholar]
  96. Ramírez-Herrera, M.T. Geomorphic assessment of active tectonics in the Acambay Graben, Mexican volcanic belt. Earth Surf. Process. Landf. 1998, 23, 317–332. [Google Scholar] [CrossRef]
  97. Schumm, S.A.; Parker, R.S. Implications of complex response of drainage systems for Quaternary alluvial stratigraphy. Nat. Phys. Sci. 1973, 243, 99–100. [Google Scholar] [CrossRef]
  98. Jorgensen Harbor, D. Landscape evolution at the margin of the Basin and Range. Geology 1997, 25, 1111–1114. [Google Scholar] [CrossRef]
  99. Ouchi, S. Effects of uplift on the development of experimental erosion landform. In Geological Society of America Abstracts with Programs; Geological Society of America: Boulder, CO, USA, 2002; Volume 34, p. 129. [Google Scholar]
  100. Bonnet, S.; Crave, A. Landscape response to climate change: Insights from experimental modeling and implications for tectonic versus climatic uplift of topography. Geology 2003, 31, 123–126. [Google Scholar] [CrossRef]
  101. Lague, D.; Crave, A.; Davy, P. Laboratory experiments simulating the geomorphic response to tectonic uplift. J. Geophys. Res. Solid Earth 2003, 108, ETG-3. [Google Scholar] [CrossRef]
  102. Frankel, K.L.; Pazzaglia, F.J. Tectonic geomorphology, drainage basin metrics, and active mountain fronts. Geogr. Fis. Dinam. Quat. 2005, 28, 7–21. [Google Scholar]
  103. Frankel, K.L.; Pazzaglia, F.J. Mountain fronts, base-level fall, and landscape evolution: Insights from the southern Rocky Mountains. In Tectonics, Climate, and Landscape Evolution; Willett, S.D., Hovius, N., Brandon, M.T., Fisher, D.M., Eds.; Geological Society of America Special Paper 398; Geological Society of America: Boulder, CO, USA, 2006; pp. 419–434. [Google Scholar] [CrossRef]
  104. Whipple, K.X.; Tucker, G.E. Implications of sediment-flux-dependent river incision models for landscape evolution. J. Geophys. Res. Solid Earth 2002, 107, ETG-3. [Google Scholar] [CrossRef]
  105. Snyder, N.P.; Whipple, K.X.; Tucker, G.E.; Merritts, D.J. Landscape response to tectonic forcing: Digital elevation model analysis of stream profiles in the Mendocino triple junction region, northern California. Geol. Soc. Am. Bull. 2000, 112, 1250–1263. [Google Scholar] [CrossRef]
  106. Kirby, E.; Whipple, K.X.; Tang, W.; Chen, Z. Distribution of active rock uplift along the eastern margin of the Tibetan Plateau: Inferences from bedrock channel longitudinal profiles. J. Geophys. Res. Solid Earth 2003, 108, B4. [Google Scholar] [CrossRef]
  107. Wobus, C.; Whipple, K.X.; Kirby, E.; Snyder, N.; Johnson, J.; Spyropolou, K.; Crosby, B.; Sheehan, D. Tectonics from topography: Procedures, promise, and pitfalls. In Tectonics, Climate, and Landscape Evolution; Willett, S.D., Hovius, N., Brandon, M.T., Fisher, D.M., Eds.; Geological Society of America Special Paper 398; Geological Society of America: Boulder, CO, USA, 2006; pp. 55–96. [Google Scholar] [CrossRef]
  108. Cyr, A.J.; Granger, D.E.; Olivetti, V.; Molin, P. Quantifying rock uplift rates using channel steepness and cosmogenic nuclide–determined erosion rates: Examples from northern and southern Italy. Lithosphere 2010, 2, 188–198. [Google Scholar] [CrossRef]
  109. Kirby, E.; Whipple, K.X. Expression of active tectonics in erosional landscapes. J. Struct. Geol. 2012, 44, 54–75. [Google Scholar] [CrossRef]
  110. Cyr, A.J.; Granger, D.E.; Olivetti, V.; Molin, P. Distinguishing between tectonic and lithologic controls on bedrock channel longitudinal profiles using cosmogenic 10Be erosion rates and channel steepness index. Geomorphology 2014, 209, 27–38. [Google Scholar] [CrossRef]
  111. Duvall, A.; Kirby, E.; Burbank, D. Tectonic and lithologic controls on bedrock channel profiles and processes in coastal California. J. Geophys. Res. Earth Surf. 2004, 109, F3. [Google Scholar] [CrossRef]
  112. Hack, J.T. Studies of longitudinal stream profiles in Virginia and Maryland. U.S. Geol. Surv. Prof. Pap. 1957, 294-B, 45–97. [Google Scholar] [CrossRef]
  113. Robl, J.; Heberer, B.; Prasicek, G.; Neubauer, F.; Hergarten, S. The topography of a continental indenter: The interplay between crustal deformation, erosion, and base level changes in the eastern Southern Alps. J. Geophys. Res. Earth Surf. 2017, 122, 310–334. [Google Scholar] [CrossRef] [PubMed]
  114. Blum, M.D.; Törnqvist, T.E. Fluvial responses to climate and sea-level change: A review and look forward. Sedimentology 2000, 47, 2–48. [Google Scholar] [CrossRef]
  115. Schoenbohm, L.M.; Whipple, K.X.; Burchfiel, B.C.; Chen, L. Geomorphic constraints on surface uplift, exhumation, and plateau growth in the Red River region, Yunnan Province, China. Geol. Soc. Am. Bull. 2004, 116, 895–909. [Google Scholar] [CrossRef]
  116. Whittaker, A.C.; Attal, M.; Cowie, P.A.; Tucker, G.E.; Roberts, G. Decoding temporal and spatial patterns of fault uplift using transient river long profiles. Geomorphology 2008, 100, 506–526. [Google Scholar] [CrossRef]
  117. Walsh, L.S.; Martin, A.J.; Ojha, T.P.; Fedenczuk, T. Correlations of fluvial knickzones with landslide dams, lithologic contacts, and faults in the southwestern Annapurna Range, central Nepalese Himalaya. J. Geophys. Res. Earth Surf. 2012, 117, F1. [Google Scholar] [CrossRef]
  118. Kent, E.; Boulton, S.J.; Whittaker, A.C.; Stewart, I.S.; Cihat Alçiçek, M. Normal fault growth and linkage in the Gediz (Alaşehir) Graben, Western Turkey, revealed by transient river long-profiles and slope-break knickpoints. Earth Surf. Process. Landf. 2017, 42, 836–852. [Google Scholar] [CrossRef]
  119. Rosenbloom, N.A.; Anderson, R.S. Hillslope and channel evolution in a marine terraced landscape, Santa Cruz, California. J. Geophys. Res. Solid Earth 1994, 99, 14013–14029. [Google Scholar] [CrossRef]
  120. Weissel, J.K.; Seidl, M.A. Inland propagation of erosional escarpments and river profile evolution across the southeast Australian passive continental margin. Geophys. Monogr. Ser. 1998, 107, 189–206. [Google Scholar] [CrossRef]
  121. Whipple, K.X.; Tucker, G.E. Dynamics of the stream-power river incision model: Implications for height limits of mountain ranges, landscape response timescales, and research needs. J. Geophys. Res. Solid Earth 1999, 104, 17661–17674. [Google Scholar] [CrossRef]
  122. Niemann, J.D.; Gasparini, N.M.; Tucker, G.E.; Bras, R.L. A quantitative evaluation of Playfair’s law and its use in testing long-term stream erosion models. Earth Surf. Process. Landf. 2001, 26, 1317–1332. [Google Scholar] [CrossRef]
  123. Whittaker, A.C.; Boulton, S.J. Tectonic and climatic controls on knickpoint retreat rates and landscape response times. J. Geophys. Res. Earth Surf. 2012, 117, F2. [Google Scholar] [CrossRef]
  124. Castillo, M.; Muñoz-Salinas, E.; Ferrari, L. Response of a landscape to tectonics using channel steepness indices (ksn) and OSL: A case of study from the Jalisco Block, Western Mexico. Geomorphology 2014, 221, 204–214. [Google Scholar] [CrossRef]
  125. Cannon, J.M.; Murphy, M.A.; Taylor, M. Segmented strain accumulation in the High Himalaya expressed in river channel steepness. Geosphere 2018, 14, 1131–1149. [Google Scholar] [CrossRef]
  126. García-Delgado, H.; Velandia, F. Tectonic geomorphology of the Serranía de San Lucas (Central Cordillera): Regional implications for active tectonics and drainage rearrangement in the Northern Andes. Geomorphology 2020, 349, 106914. [Google Scholar] [CrossRef]
  127. Whipple, K.X. Fluvial landscape response time: How plausible is steady-state denudation? Am. J. Sci. 2001, 301, 313–325. [Google Scholar] [CrossRef]
  128. Wegmann, K.W.; Zurek, B.D.; Regalla, C.A.; Bilardello, D.; Wollenberg, J.L.; Kopczynski, S.E.; Ziemann, J.M.; Haight, S.L.; Apgar, J.D.; Zhao, C.; et al. Position of the Snake River watershed divide as an indicator of geodynamic processes in the greater Yellowstone region, western North America. Geosphere 2007, 3, 272–281. [Google Scholar] [CrossRef]
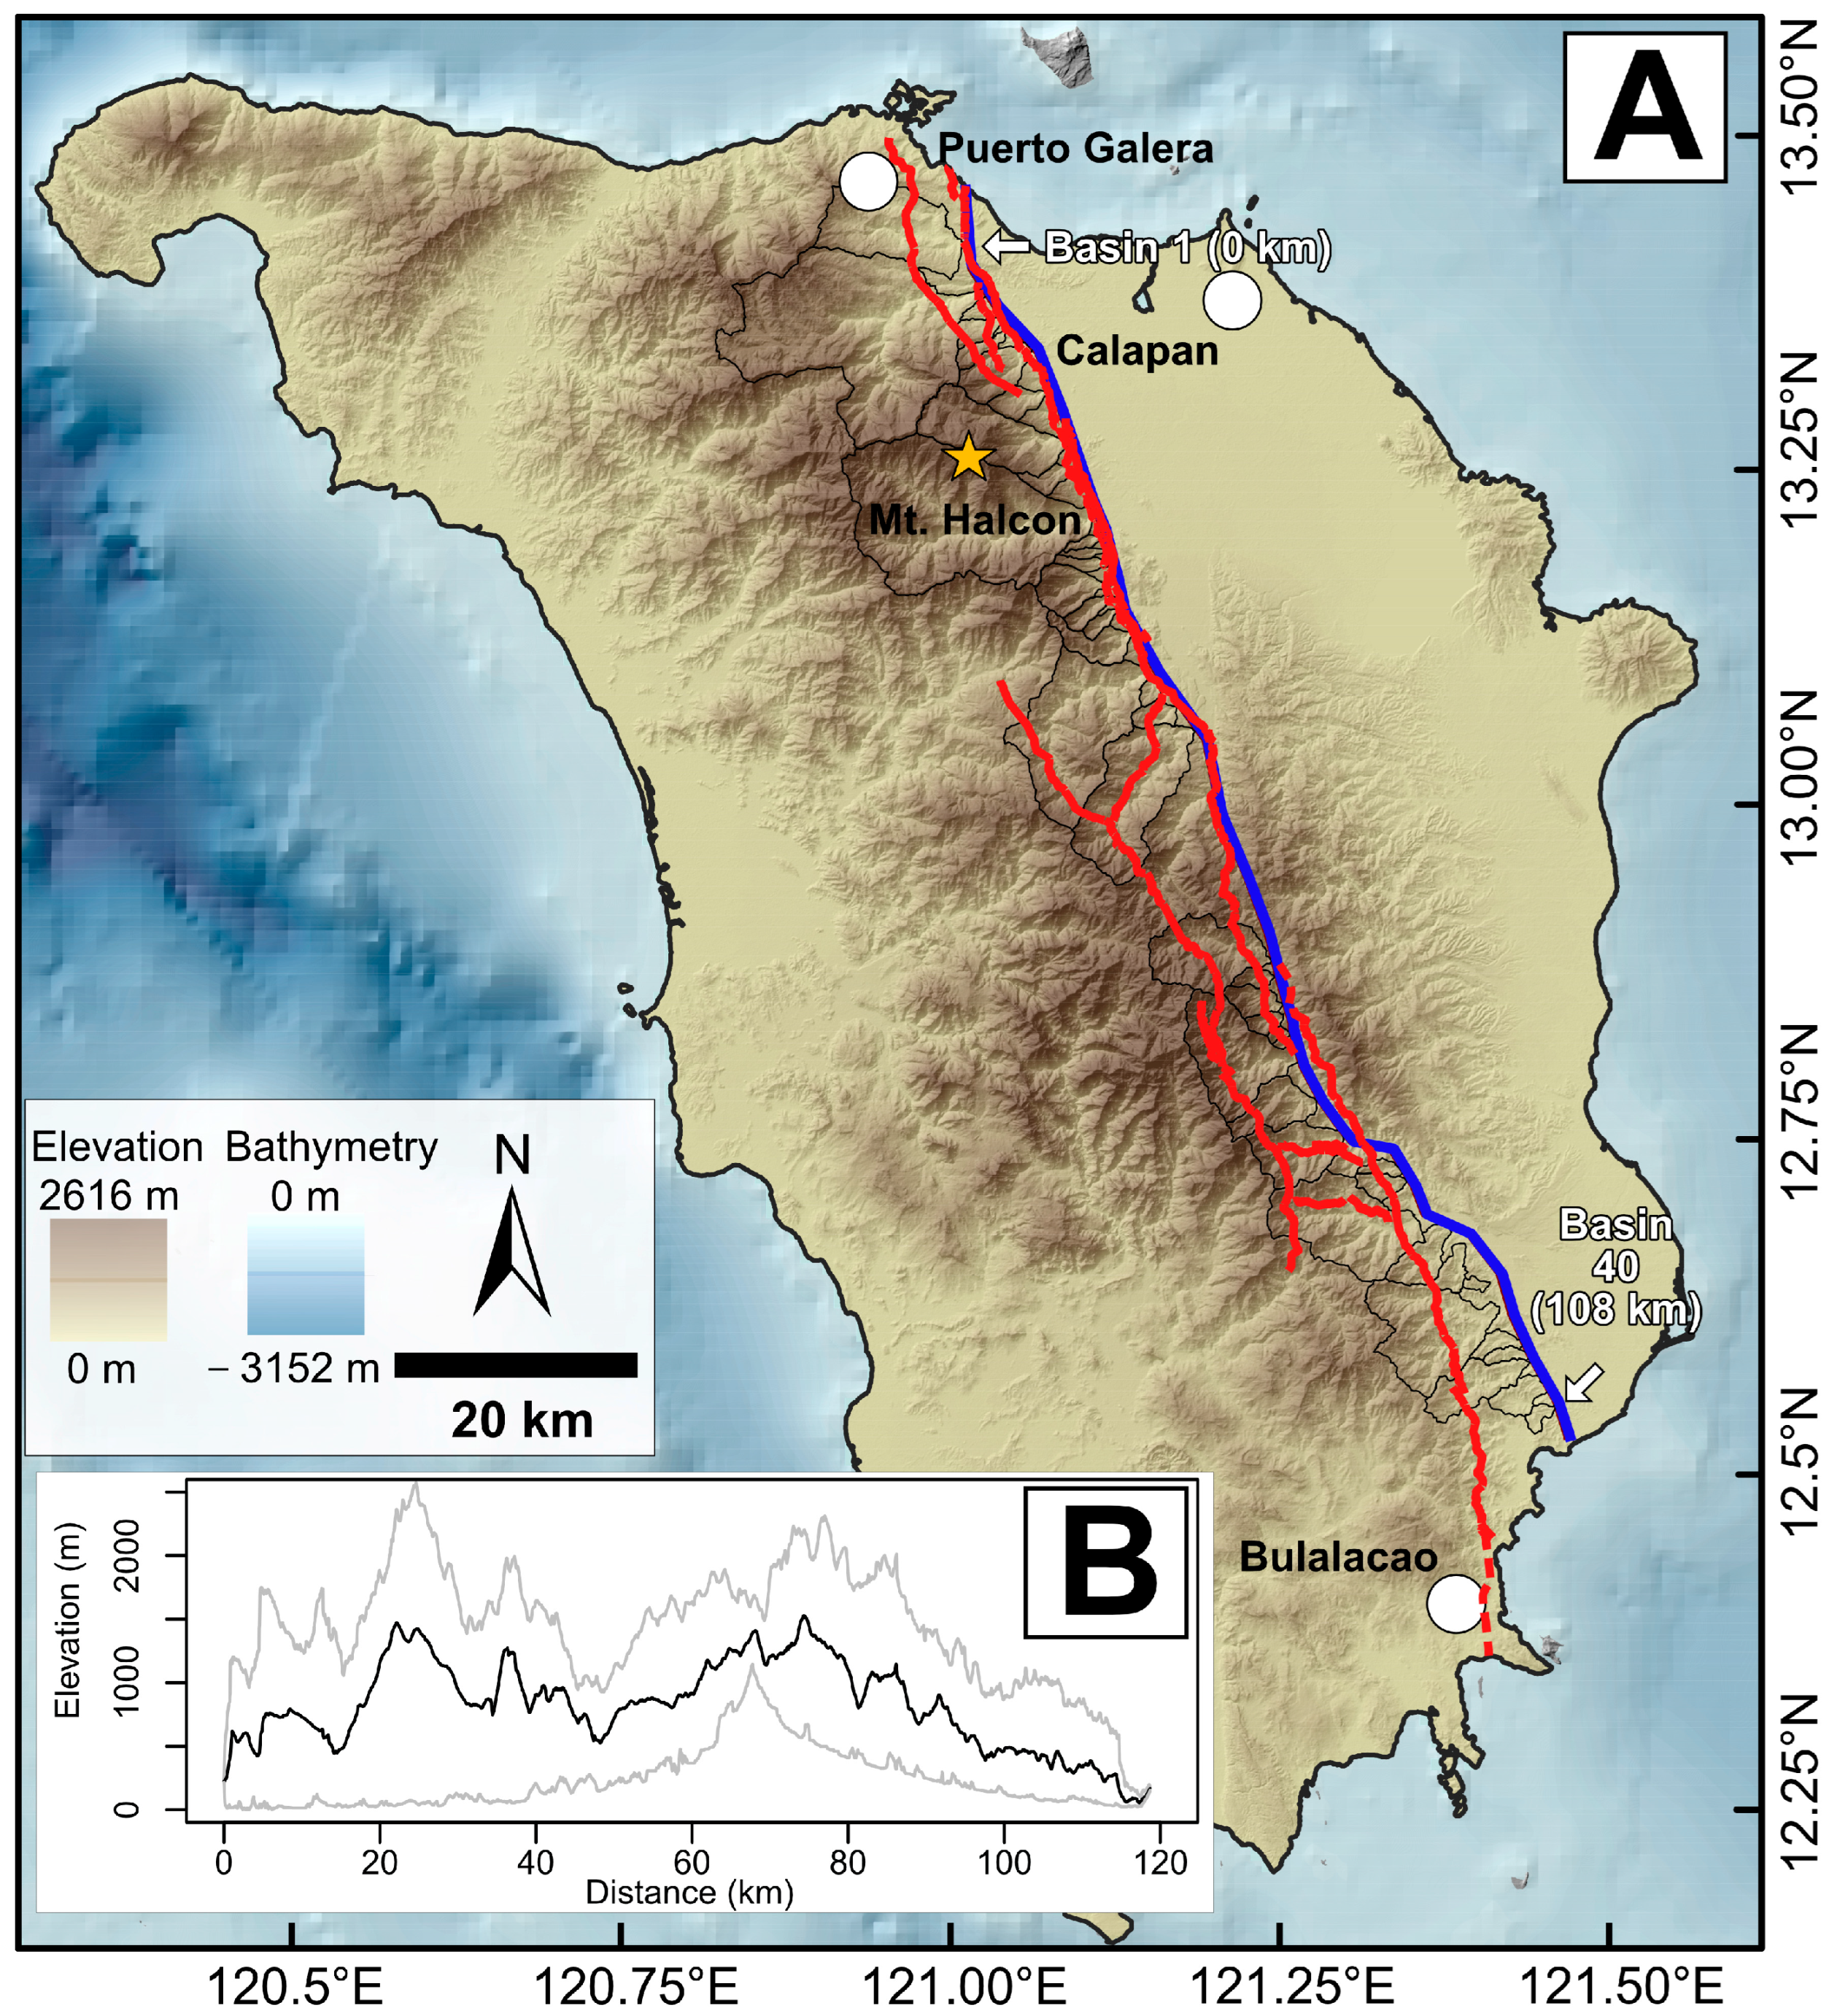
Figure 3. Mindoro Geomorphology. (A) Topography of the island of Mindoro and the bathymetry of offshore areas immediately surrounding Mindoro based on 30 m-resolution ASTER GDEM V2 and 1 km-resolution GEBCO data. The blue line indicates the mountain front (based on a > 15° classified slope map), and the red line indicates the trace of the CMF by Rimando and Rimando (2025). The thin black line outlines the 40 drainage basins that are analyzed in this study. (B) Swath topographic profile through the 40 drainage basins displaying the minimum, mean, and maximum elevations along the east side of the mountain range. Note that the swath topographic profile is longer (~120 km long) than the distance between the outlets of Basin 1 and Basin 40 (108 km), due to the greater width of drainage basins at higher elevations.
Geohazards 06 00057 g003
Figure 4. Geology of Mindoro. The map shows the spatial distribution of lithologies. The black line indicates the mountain front, and the thin white line outlines the 40 drainage basins that are analyzed in this study.
Geohazards 06 00057 g004
Figure 5. Tropical Rainfall Measuring Mission (TRMM) satellite-based average annual precipitation data gathered over a span of 12 years (1998–2009) for the island of Mindoro from Bookhagen and Strecker (2021) [46].
Geohazards 06 00057 g005
Figure 6. Geomorphic indices. Illustrations of the geomorphic indices analyzed in this study, the formulas used to calculate these, and guidance for interpreting these indices.
Geohazards 06 00057 g006
Figure 7. Plots of geomorphic indices. (A) Hypsometric integral (HI). (B) hypsometric curve skewness (Sk). (C) Kurtosis (Kur). (D) Density Skewness (Dsk). (E) Density Kurtosis (Dkur). (F) basin elongation ratio (Re). (G) volume-to-area ratio (RVA). (H) valley-floor-width-to-height ratio (Vf). The red line and blue lines represent locally weighted regressions with spans of 0.25 and 0.5, respectively.
Geohazards 06 00057 g007
Figure 8. Overlay of knickpoints and river segments color-coded according to ksn value on a geologic map of Mindoro Island.
Geohazards 06 00057 g008
Figure 9. River profile analysis results. (A) Plot of ksn values at each basin, distinguishing ksn values based on where these were calculated (above or below a knickpoint, wherever a river displays distinct segments according to ksn value); “Uniform ksn” corresponds to channels without any knickpoints. (B) Plot of knickpoint elevation, knickpoint relief (elevation difference between knickpoint and the basin’s outlet/pourpoint), and base level (given by the basin’s outlet/pourpoint elevation).
Geohazards 06 00057 g009
Disclaimer/Publisher’s Note: The statements, opinions and data contained in all publications are solely those of the individual author(s) and contributor(s) and not of MDPI and/or the editor(s). MDPI and/or the editor(s) disclaim responsibility for any injury to people or property resulting from any ideas, methods, instructions or products referred to in the content.