Article

Seasonal and Episodic Variation of Aseismic Creep Displacement Along the West Valley Fault, Philippines

by
Rolly E. Rimando
*,
Deo Carlo E. Llamas
,
Bryan J. Marfito
and
Renato J. Garduque
Department of Science and Technology-Philippine Institute of Volcanology and Seismology (DOST-PHIVOLCS), Diliman, Quezon City 1101, Philippines
*
Author to whom correspondence should be addressed.
GeoHazards 2025, 6(3), 55; https://doi.org/10.3390/geohazards6030055
Submission received: 13 July 2025 / Revised: 28 August 2025 / Accepted: 9 September 2025 / Published: 11 September 2025

Abstract

Creep through mainly vertical displacement along en echelon ground ruptures within the creeping segment of the West Valley Fault (WVF) in the Luzon Island, Philippines, has been occurring since first documented in the 90 s. It is believed to have been triggered by excessive groundwater withdrawal, mainly because of the high rates of slip recorded in the 90 s. Near-field displacements measured by locally fabricated linear variable differential transformer (LVDT) and ultrasonic creepmeters are compared with near-field long-term displacements as measured by precise leveling surveys. Though the ultrasonic creepmeter is less accurate in measuring short-term displacement than the LVDT creepmeter, both are reliable in measuring longer-term displacements. Data from creepmeters can reveal association of displacement with seasonal precipitation and correlation between short-term displacement and episodic rainfall. In the case of the WVF’s creeping segment, rainfall episodes and wet seasons do not always result in immediate abrupt displacement changes. Nevertheless, the results of our monitoring with creepmeters underscores the contribution of precipitation in triggering creep, through its effect on the ground and by releasing stored tectonic strain, in the southern region of the WVF’s creeping zone where groundwater withdrawal remains largely unregulated. Continuous monitoring and periodic leveling surveys should continue as creep continues to cause damage and the potential for induced seismicity remains.

1. Introduction

Aseismic creep associated with groundwater withdrawal has been occurring since the 90 s along a 15 km-long creeping zone of the West Valley Fault (WVF; Figure 1), which is one of the major segments of the Valley Fault System (VFS) in the Luzon Island (Philippines). Measurement of displacement through periodic precise leveling since 1999 has been useful in determining correlation of displacement with groundwater withdrawal but is not sufficient in resolving the influence of other possible triggers (e.g., rainfall and season changes) in the total displacement and displacement changes. The Tokyo Institute of Technology brought in a transducer-type creepmeter for continuous monitoring, but the usable lifespan of these had been limited by maintenance issues related to the corona virus pandemic that started in early 2020. The technology for measuring and monitoring ground deformation is now quite advanced especially with those involving space technology (e.g., GPS, InSAR, and LiDAR). However, for many countries, the expertise and access to them may be quite difficult. Moreover, creepmeters allow continuous monitoring and/or are more accurate. This research leads to the fabrication of cost-effective creepmeters to continue monitoring the short-term displacement changes. The imported creepmeters which were rendered inoperable during the coronavirus pandemic were replaced by them. Short-term monitoring focuses on two sites in the southern part of the creeping zone where high rates of groundwater extraction and creep rates remain. In this paper, results of monitoring using locally fabricated and inexpensive continuous creepmeters are presented. The continuous creep recording instrument data is used to determine displacement changes and correlation of these (if any) to episodic rainfall and seasonal precipitation. This kind of study is particularly relevant to the Philippine archipelago and other regions characterized by frequent and heavy precipitation and vulnerability to fault creep hazards.
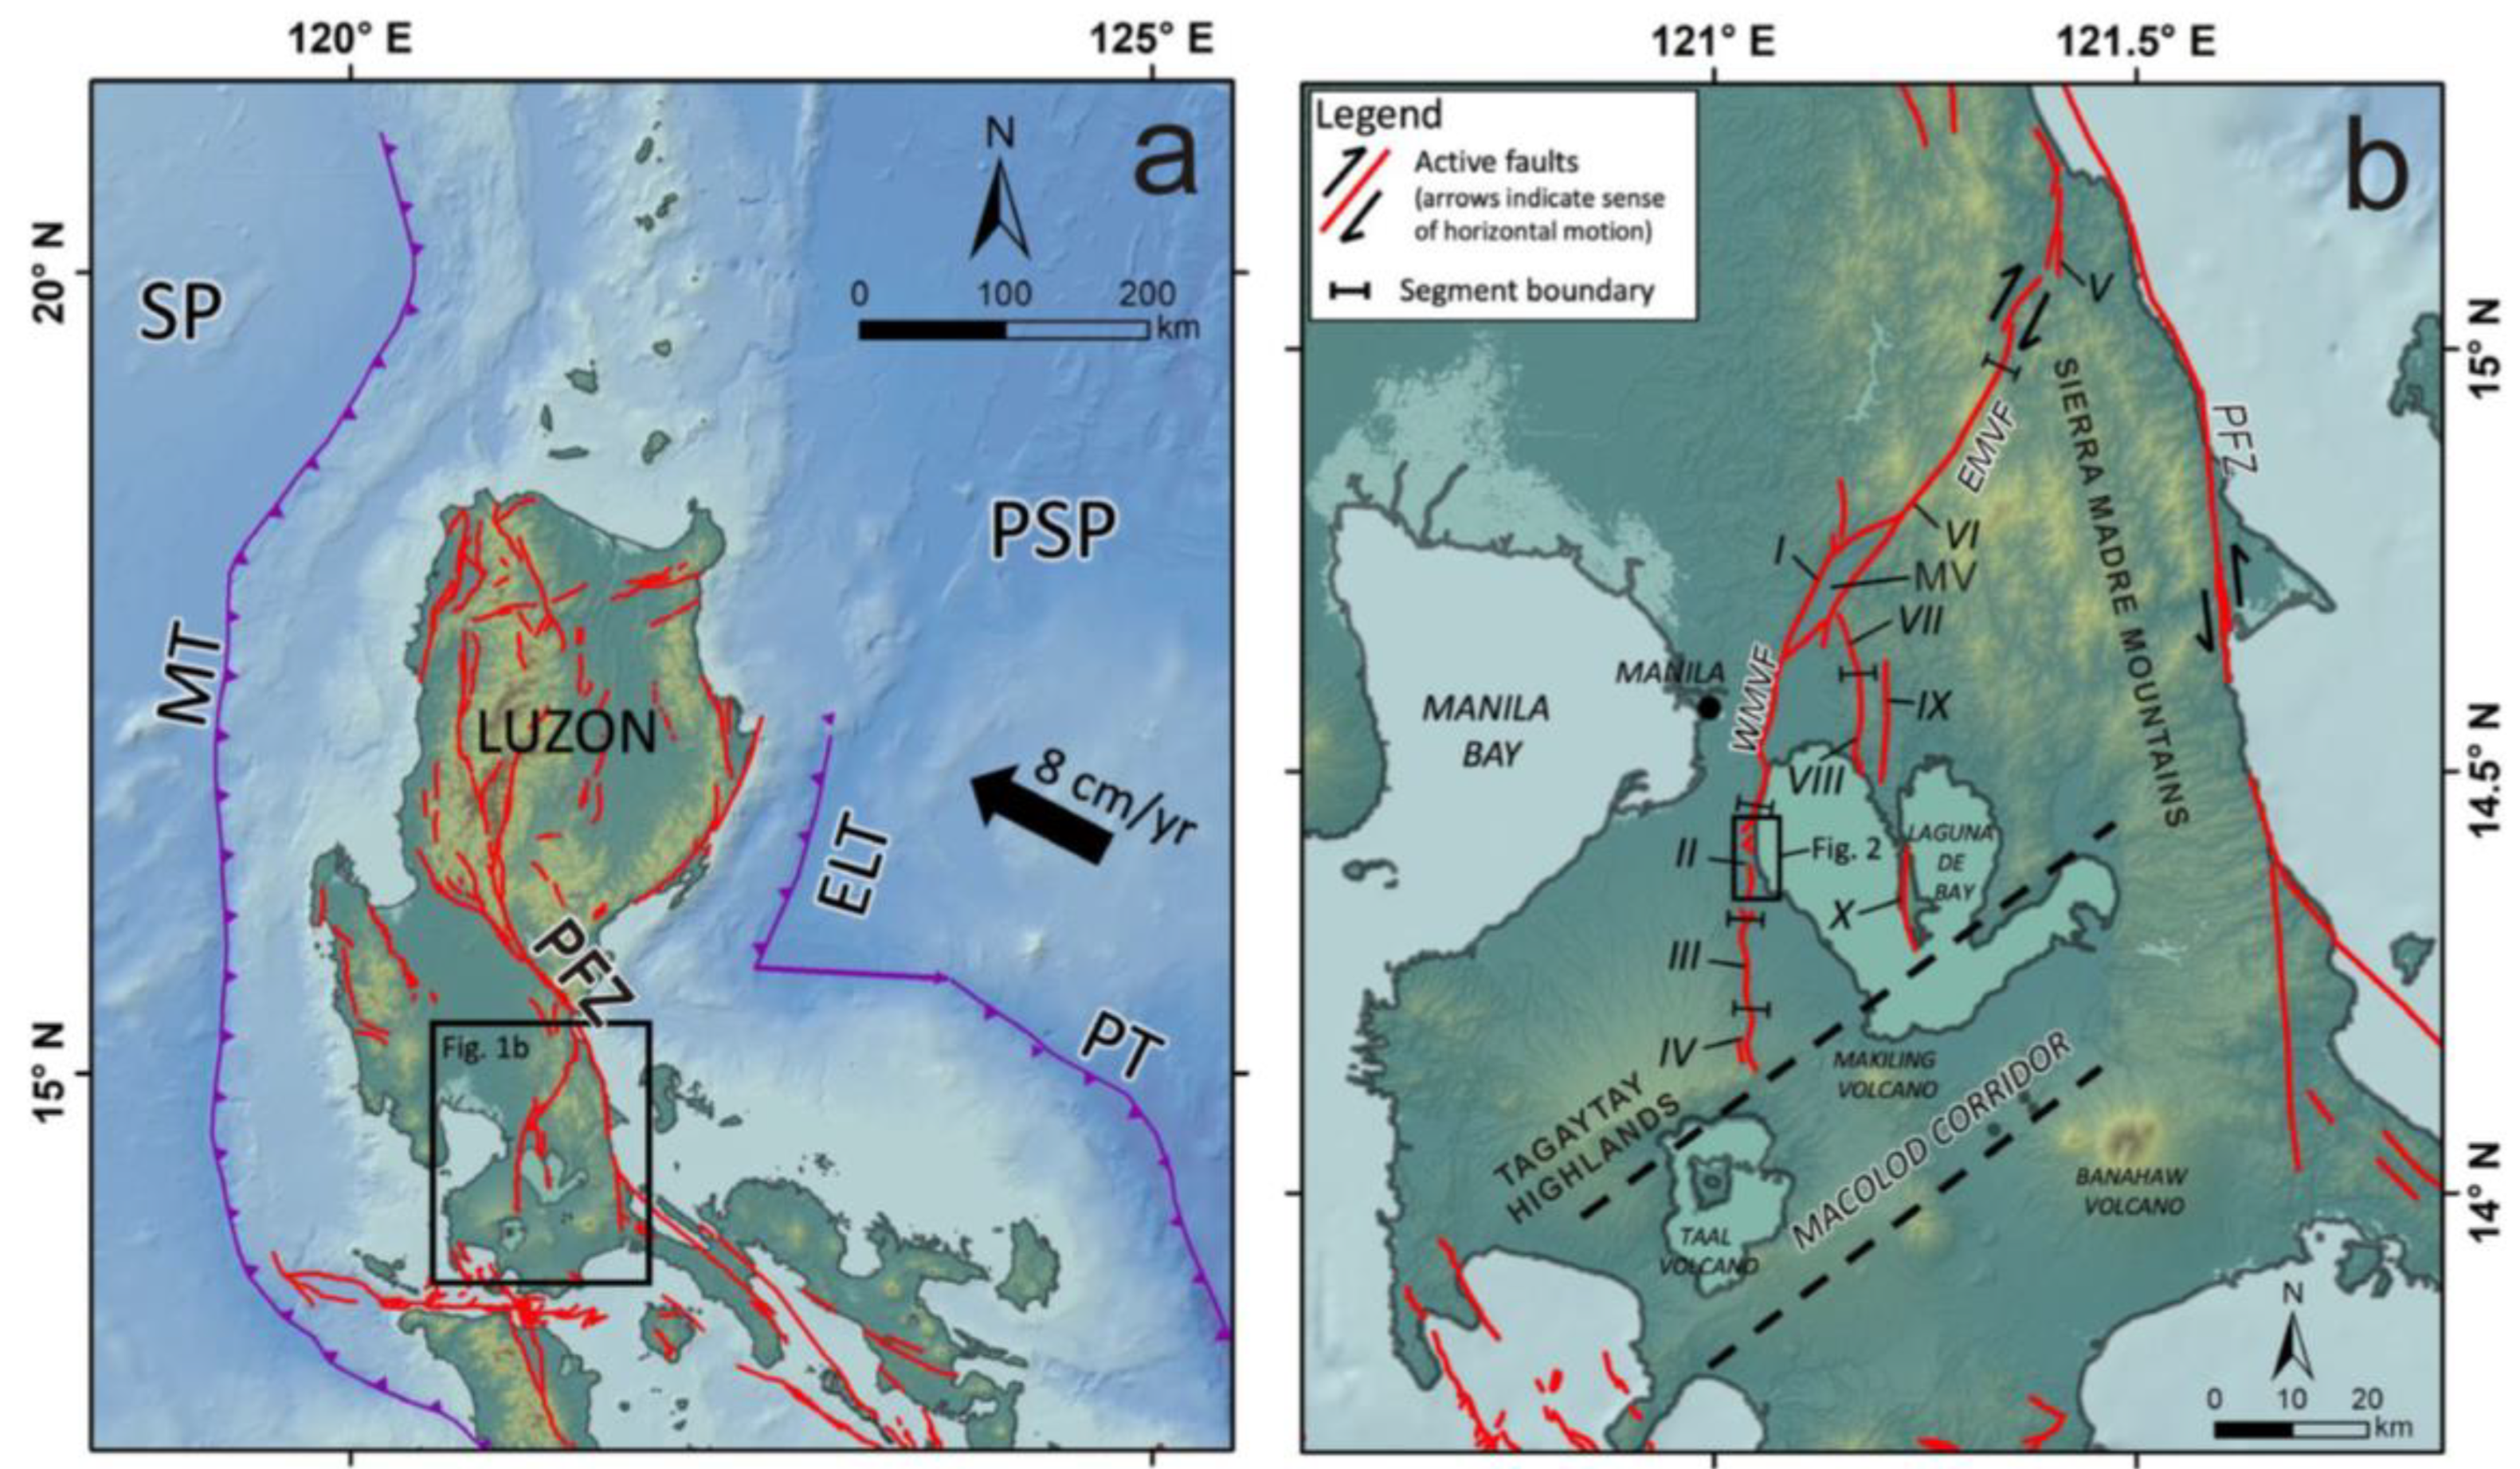
Movement along the VFS and other structures in the region is a result of the northwestward motion of the Philippine Sea Plate (PSP) towards the Sunda Plate (Figure 1a). The VFS appears to branch out from the Philippine Fault Zone (PFZ) and terminates near the northwestern front of the Macolod Corridor (Figure 1b), an extensional structure characterized by volcanism and faulting. The creeping zone overlaps with the southern part of Metro Manila and corresponds to WVF’s segment II (Figure 1b and Figure 2A) [1,2,3,4]. The WVF and the East Valley Fault (EVF; Figure 1) comprise the major segments of the dextral VFS [1,4,5]. WVF’s longest segment, the 45 km segment I, lies to the north of the creeping zone, while the 12 km segment III lies to its south (Figure 1b and Figure 2A). The extensional gap between the right-stepping segments I and III of the WVF is occupied by the creeping echelon segments of segment II.
Figure 1. Location of the creeping zone of the West Valley Fault (WVF). The creeping zone corresponds to segment II of the Valley Fault System (VFS) on the southeastern part of Metro Manila. (a) Three major structures in the VFS region—the Philippine Fault Zone (PFZ), the east Luzon trough (ELT), the Philippine Trench (PT) to the east, and the Manila Trench (MT) to the west are shown. Direction and rate of PSP motion after Seno et al. [6]. Active faults are from [4,7] and references therein. IfSAR-DTM is from [8]. Bathymetry is from [9]. (b) The major topographic elements surrounding the VFS region are the Sierra Madre on the east and the Tagaytay Highlands to its southwest. To the south of the VFS is the Macolod Corridor—a zone of volcanism and faulting. Its northwest and southeast boundaries are indicated by dash lines. Located in the northern part of the Marikina Valley (MV) is a pull-apart basin formed between the two major segments of the VFS (WVF and the East Valley Fault or EVF). The minor structural/geometric segments of MVFS are indicated by numbers I to X. Segmentation after [1,4].
Geohazards 06 00055 g001
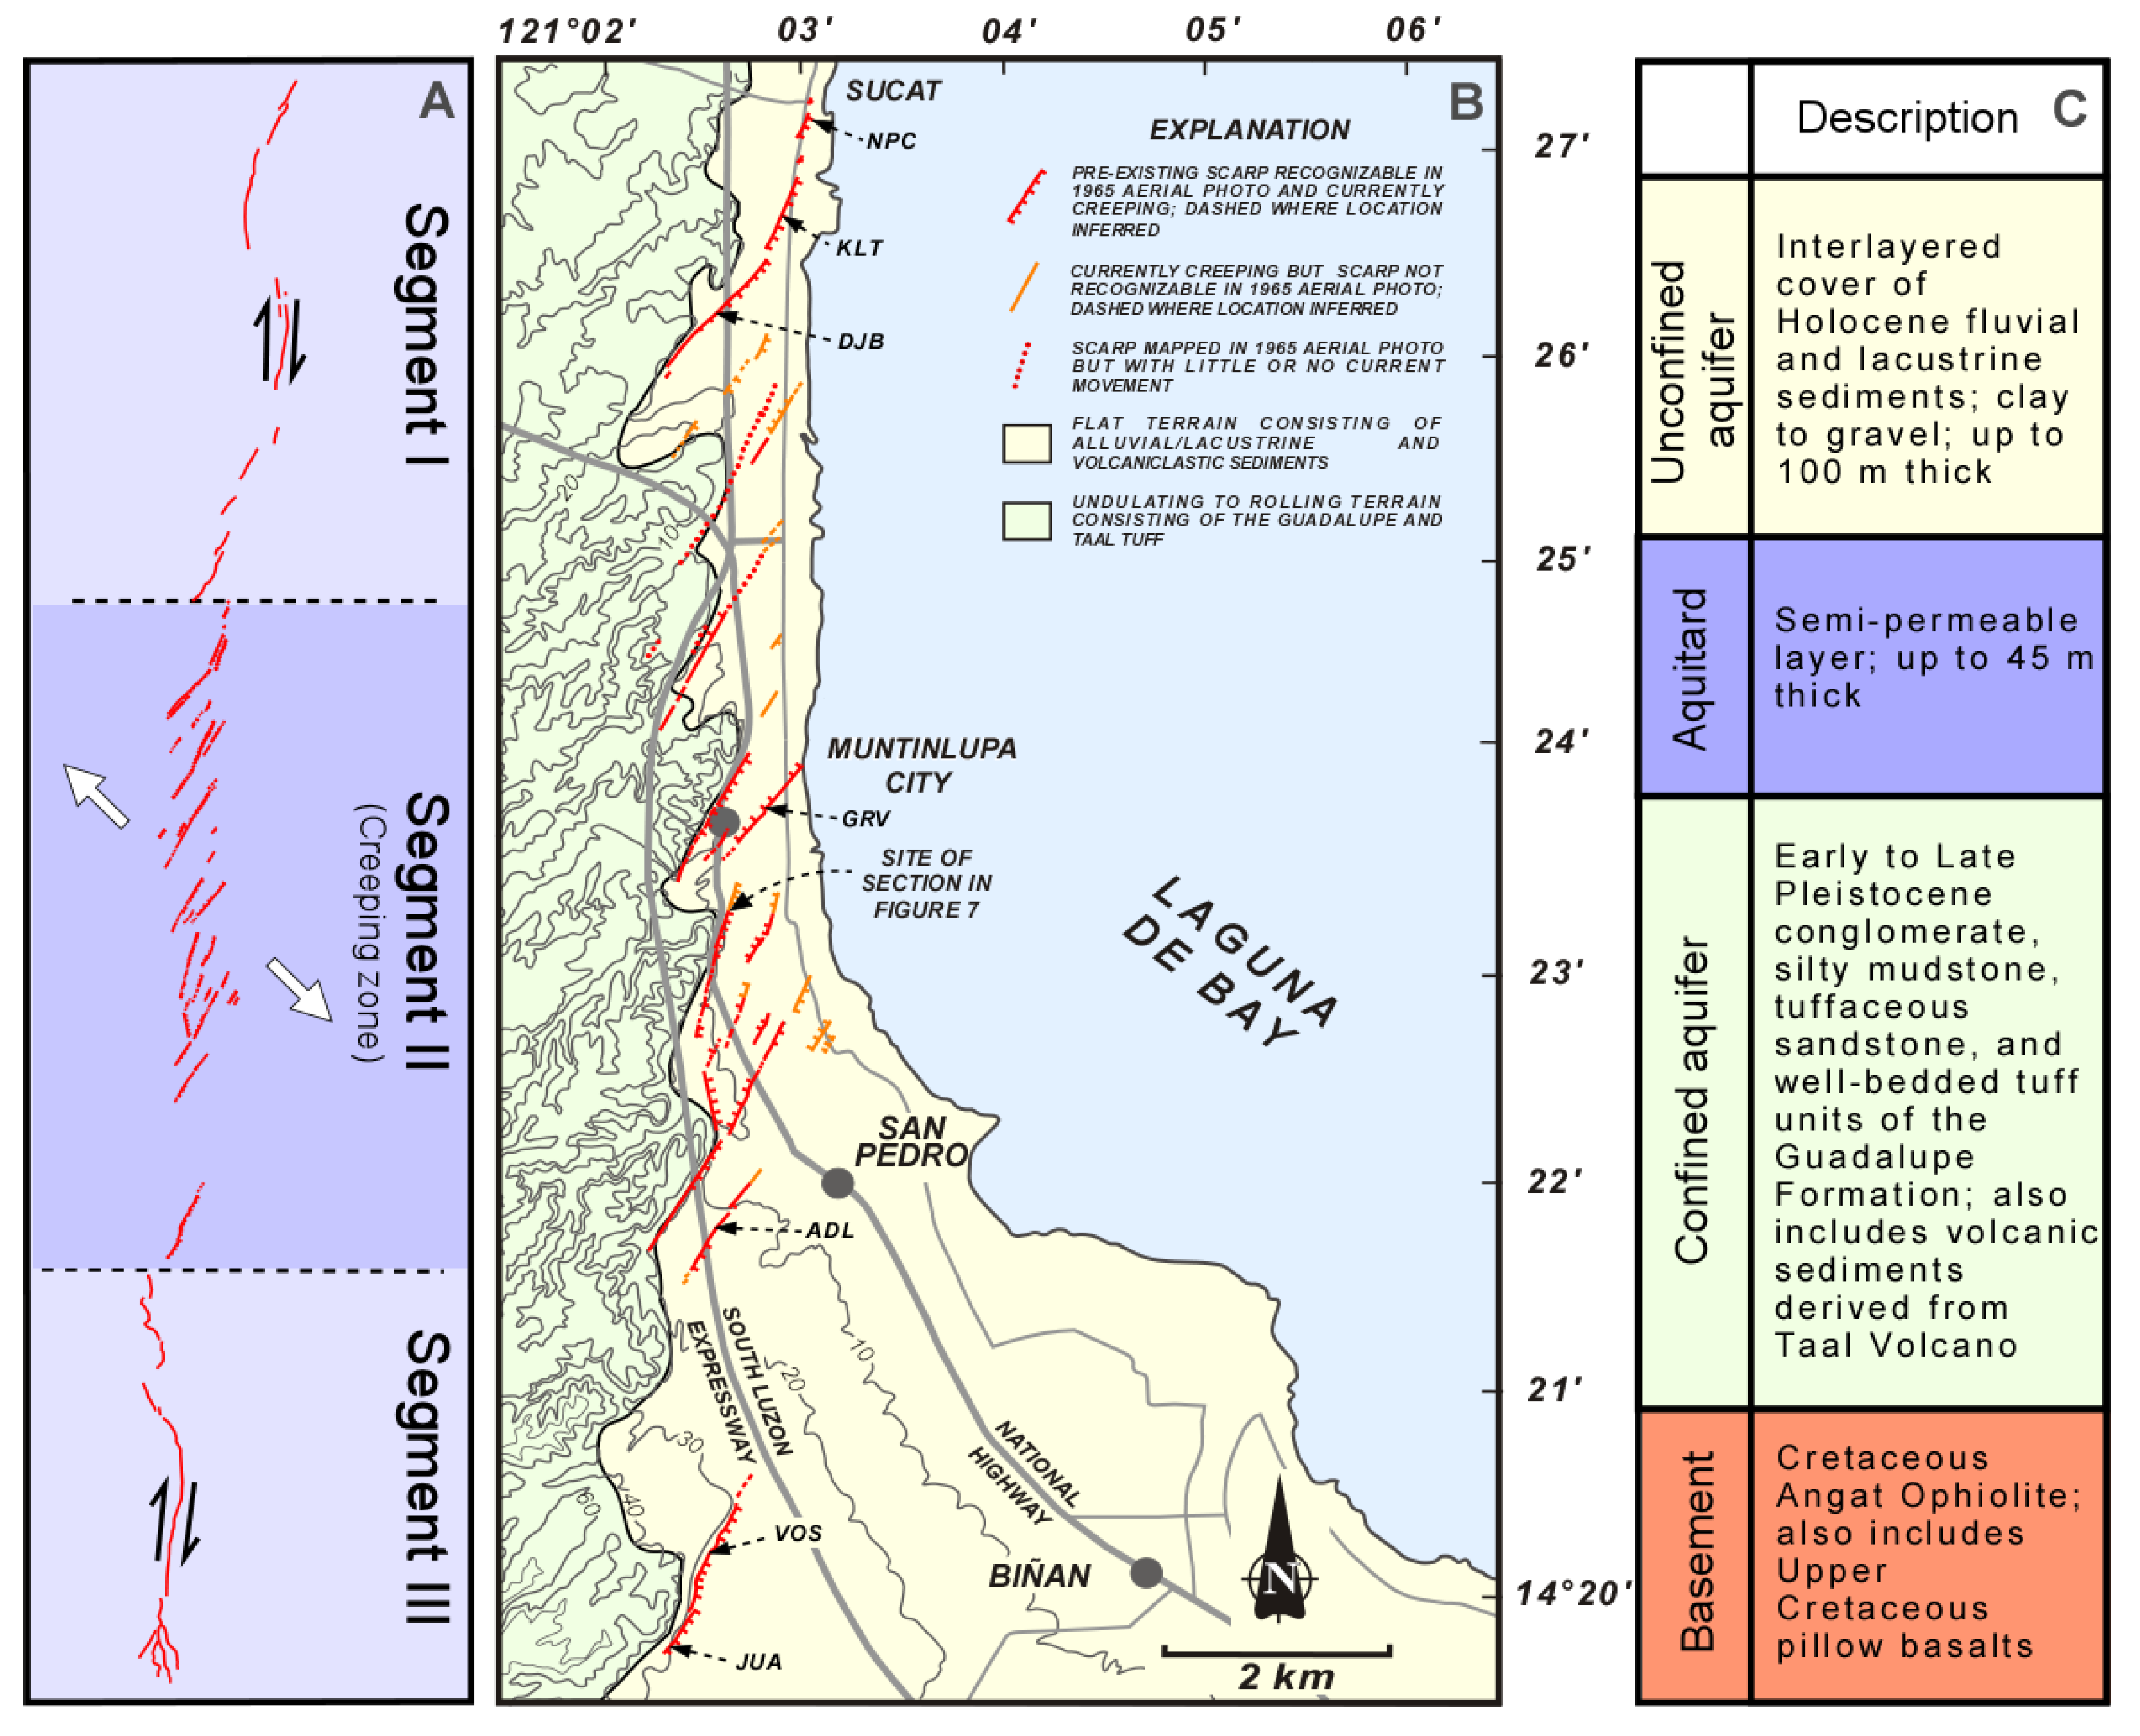
There are numerous cases of aseismic creep linked to groundwater extraction worldwide. Among them are those from the United States [10,11], China, [12,13,14], Thailand [15], Italy [16], and México [17,18,19]. Compared with them, the WVF’s creeping segment is unique in terms of tectonic setting, geometric pattern, style, and creep rate. The occurrence of the WVF’s creeping segment is structurally controlled. It is composed of 15 smaller NE-oriented segments that are arranged en echelon, most of which are associated with pre-existing scarps (Figure 2A,B). It can also be shown from paleoseismic mapping of an exposure across one of the scarps that creep followed pre-existing tectonic structures [1,2,3,20]. The creeping segment (segment II) corresponds to the extensional gap between segments I and III of the dextral WVF (Figure 1 and 2A) [1,4]. The WVF creeping ruptures belong to the surface fault type of aseismic ground failure and are not tensile failure features [10,21]. Figure 2C shows the lithologic units, as described by [22,23,24,25], comprising the aquifers in the study area. Recharge to the groundwater system comes from rainfall and induced flow from Laguna Lake [24].
Figure 2. (A) Location of the WVF creeping segment (segment II) within the gap between the segments I and III of the West Valley Fault (WVF). Harpoon and white arrows indicate senses of motion of the WVF segments (B) Detailed map of the creeping traces and main topographic units in the study area. Most of the creeping faults coincide with pre-creep scarps identified in old aerial photos and topographic maps. NPC, GRV, ADL, VOS and JUA refer to sites where periodic (2–3 times/yr) precise leveling have been conducted to measure displacements since 1999. Measurements were also conducted at KLT and DJB in the early years of the campaign. Slip rates derived from these sites are in [2]. Creepmeters used for this study are installed at VOS and JUA in the southern part of the creeping zone. (C) Lithologic composition of the aquifers in the study area. Figure 2A,B after [1,2]. Figure 2C after [22,23,24,25].
Geohazards 06 00055 g002
Since the early 90 s, vertical creep has been causing damage to roads, buildings, and public utilities. Groundwater withdrawal was the more likely trigger of creep [1,2,26,27] that reactivated the pre-existing structures [1,2,3,20] as the rates of slip are higher than the known tectonic creep rates [28,29,30,31,32,33,34]. The slip rates have been based on displacement measurements made in the 90 s and on results of monitoring that have been conducted since 1999 through precise leveling [35,36,37,38,39]. Three creepmeters had also been installed at various dates at the northernmost and southernmost part of the creeping zone. Both monitoring methods had been carried out by the Philippine Institute of Volcanology and Seismology and the Tokyo Institute of Technology. The joint undertaking was interrupted by the corona virus pandemic in early 2020. Based on the results of displacement monitoring, which shows spatiotemporal links between displacements or vertical slip rates vertical slip and groundwater extraction, it was determined [2] that displacement changes are controlled by groundwater withdrawal. Aside from the continued overextraction of groundwater, the limited water regulatory interventions and distance from the source of recharge have been responsible for the persistent high rates of slip in the southern portion of the creeping zone [2].
The damage due to the vertical movement of the ground that has been incurred and the potential for triggering seismicity brought about by the continued excessive extraction of groundwater [2] underscores the need to continue monitoring displacement and slip rate of fault creep. Numerous worldwide documented cases of fault movements, believed to be induced or triggered by groundwater extraction and other human activities, have resulted in seismicity [40,41]. There are a number of theories explaining the mechanism of fault failure and earthquake generation by fluid extraction [40,42]. Earthquakes resulting from creep are related to the development of resistors to slip [43]. Continuous collection and analysis of displacement monitoring data along the creeping segment of the WVF should contribute to clarifying the role of creeping faults in inducing seismicity and in the assessment of seismic hazard. Monitoring results can be used to identify areas of continued excessive groundwater exploitation and help in coming up with decisions regarding prevention and mitigation measures such as groundwater extraction regulations or alternative sources of water. Distinguishing the causes of displacement variations and determining the contributions of these to the short- and long-term displacement variations should result in more informed decisions regarding hazards associated with aseismic creep due to groundwater withdrawal.

2. Materials and Methods

For the purpose of monitoring short-term, near-field creep displacement and slip rate changes along the WVF’s creeping zone, we have fabricated our own creepmeters. In addition to the creepmeters, we have also assembled our own rain gauge system to record rainfall every 30 min. The data from our rain gauge and the average monthly precipitation for the region enable us to analyze link between deformation and the suspected triggers (i.e., episodic and seasonal precipitation). The monitoring instruments fill the data gap caused by the pandemic-related cessation of operation of creepmeters operated by the joint Philippine Institute of Volcanology and Seismology-Tokyo Institute of Technology (PHIVOLCS-TIT) monitoring team. These operations were discontinued primarily due to maintenance issues with the Linear Variable Differential Transformer (LVDT) creepmeters at Villa Olympia Subdivision (VOS in Figure 2) and Juana Subdivision (JUA in Figure 2).
Mainly for their simplicity and cost-effectiveness, the primary monitoring tools of choice are the Arduino-based creepmeters with LVDT and ultrasonic (US-100) sensors. An LVDT sensor converts linear motion into a proportional electrical signal using an inductive transducer. An ultrasonic creepmeter measures distance that is proportional to the distance traveled by an ultrasonic signal sent and received by a US-100 sensor composed of a transmitter and a receiver. These creepmeters are also relatively easy to assemble, install, and operate. Except for the sensors and programming, the creepmeters have similar components. The main components of the creepmeters are the recording and power supply assemblies. The recording assembly consists of a programmable Arduino Leonardo controller, DC-DC converter, and an SD card module. The SD card module attached to the Arduino controller store displacement data, which is then retrieved during data retrieval and maintenance operations. We used Arduino programming language, which is a simplified version of C++ programming language, to control the operation of the creepmeters. Recording interval for the creepmeters is variable (1–3 hrs). The LVDT creepmeter’s sensor is similar to that of the creepmeter that had been in operation in three sites within the creeping zone before the pandemic but uses a different controller system and programming. The power supply system of our creepmeters consists of solar panel, battery, and solar charger controller. It runs on a lead-acid battery which supplies 12 volts. The DC-DC converter within the recording assembly transforms the 12 volts supplied by the battery to 9 volts.
The recording and power supply assemblies of the rain gauge are similar to those of the creepmeters, except that a tipping bucket-type rain gauge assembly is attached to the Arduino controller instead of an LVDT or ultrasonic sensor. The operation of the rain gauge requires a separate Arduino program. The rain gauge system was installed right beside the solar power supply systems at VOS.
Continuity of monitoring record is critical in the analysis of the influence of rainfall and seasonal precipitation to displacement, but downtime is inherently unavoidable. Causes of downtime include the failure of any of the components of the creepmeter and failure of the power system, which could be related to extreme weather conditions that characterize tropical regions.
Before field deployment and final programming, the creepmeters were calibrated to determine distance-to-target equivalents of the creepmeters’ electrical outputs. This step also determines the optimum operating distance-to-target range for the ultrasonic creepmeter. The LVDT creepmeter’s maximum distance-to-target range is dependent on sensor rod length. The calibration of the rain gauge (accomplished by the manufacturer) took into account the catchment area of its tipping bucket sensor.
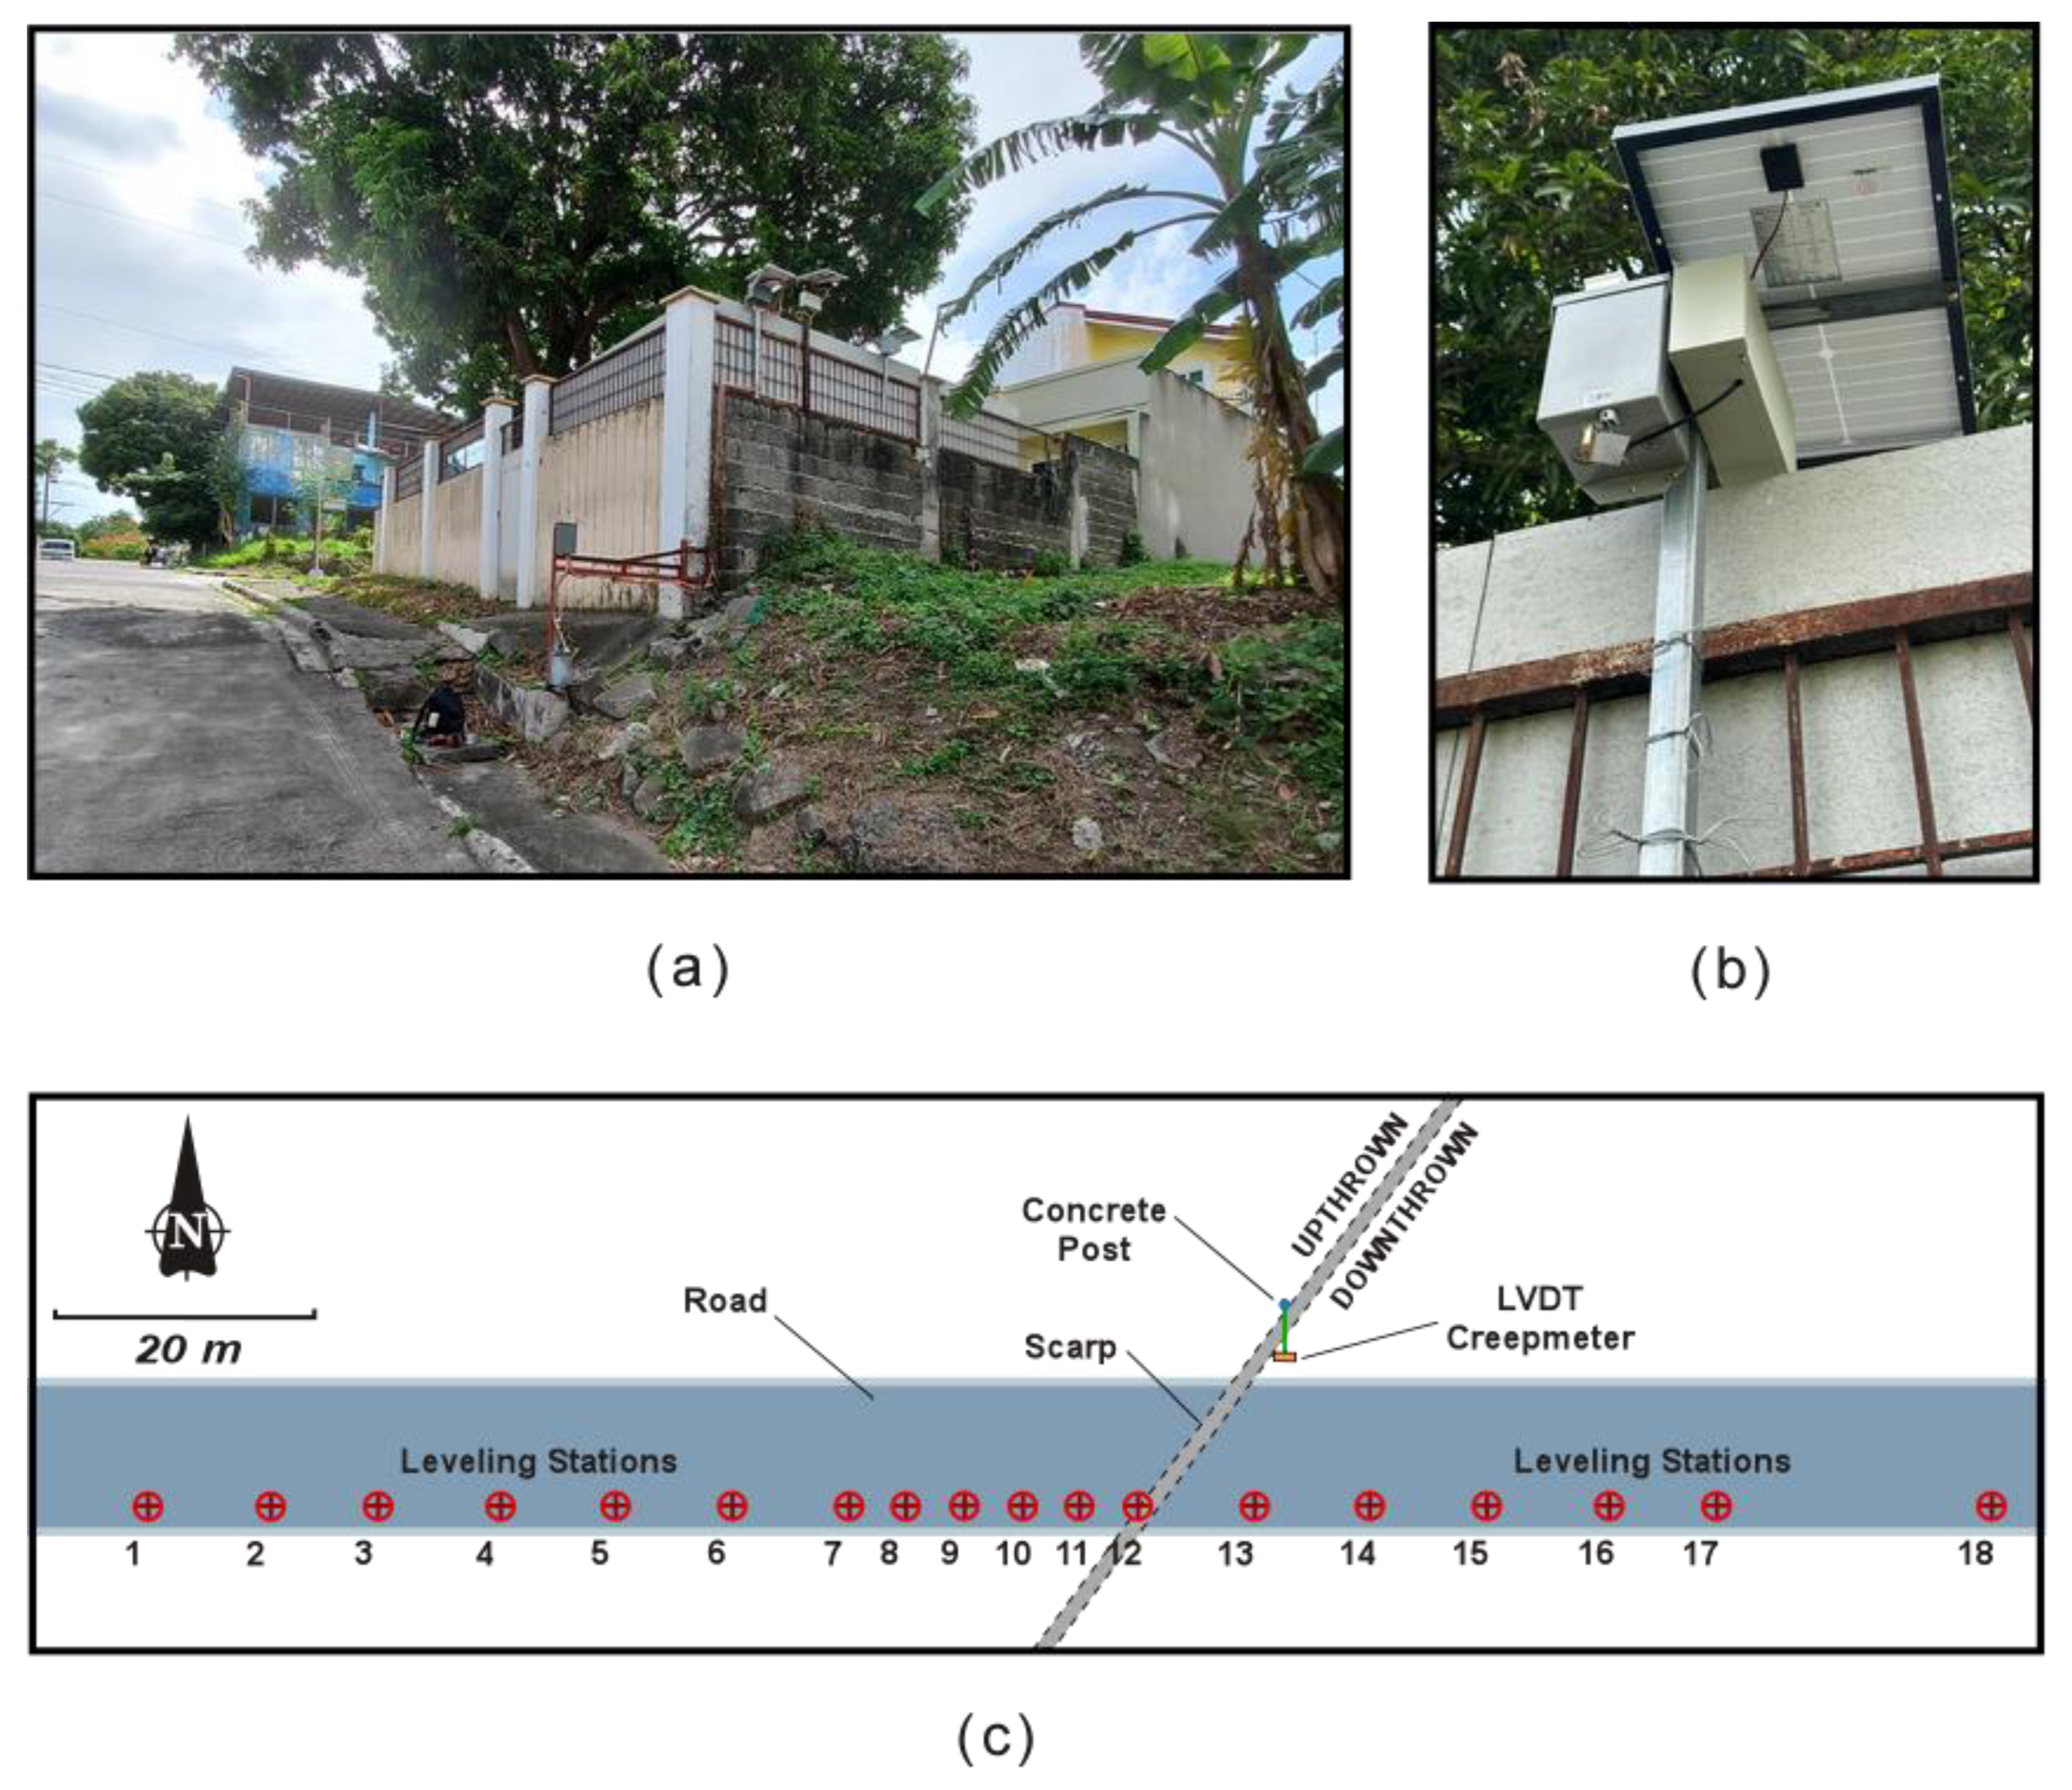
The platform of the ultrasonic and LVDT creepmeters (Figure 3) at JUA is subparallel and of comparable length to the line of benchmarks used for the leveling survey. The creepmeter set-up at VOS is much simpler (Figure 4) and is also beside the line of leveling stations.
The displacements and slip rates obtained from the creepmeters have been compared with the results of the periodic deformation surveys through precise leveling that we have been conducting twice a year. Also included are the results of the deformation surveys prior to the pandemic for a more complete analysis of the relationship of displacement with the possible triggers and controls of creep [2]. Precise leveling by the PHIVOLCS-TIT team had been conducted in several sites (Figure 2) along the length of WVF creeping zone since September 1999 to measure changes in vertical displacement. Precise leveling employed an electronic digital level (TOPCON DL-103AF), which is extremely accurate (the standard deviation is up to 2.5 mm for 1 km). For this study, we use the same digital level, but this is limited to the southernmost sites at JUA and VOS where the rates of slip have been consistently high. The survey lines are located along the road beside the creepmeters (Figure 3 and Figure 4).

3. Results

3.1. Testing of Creepmeters

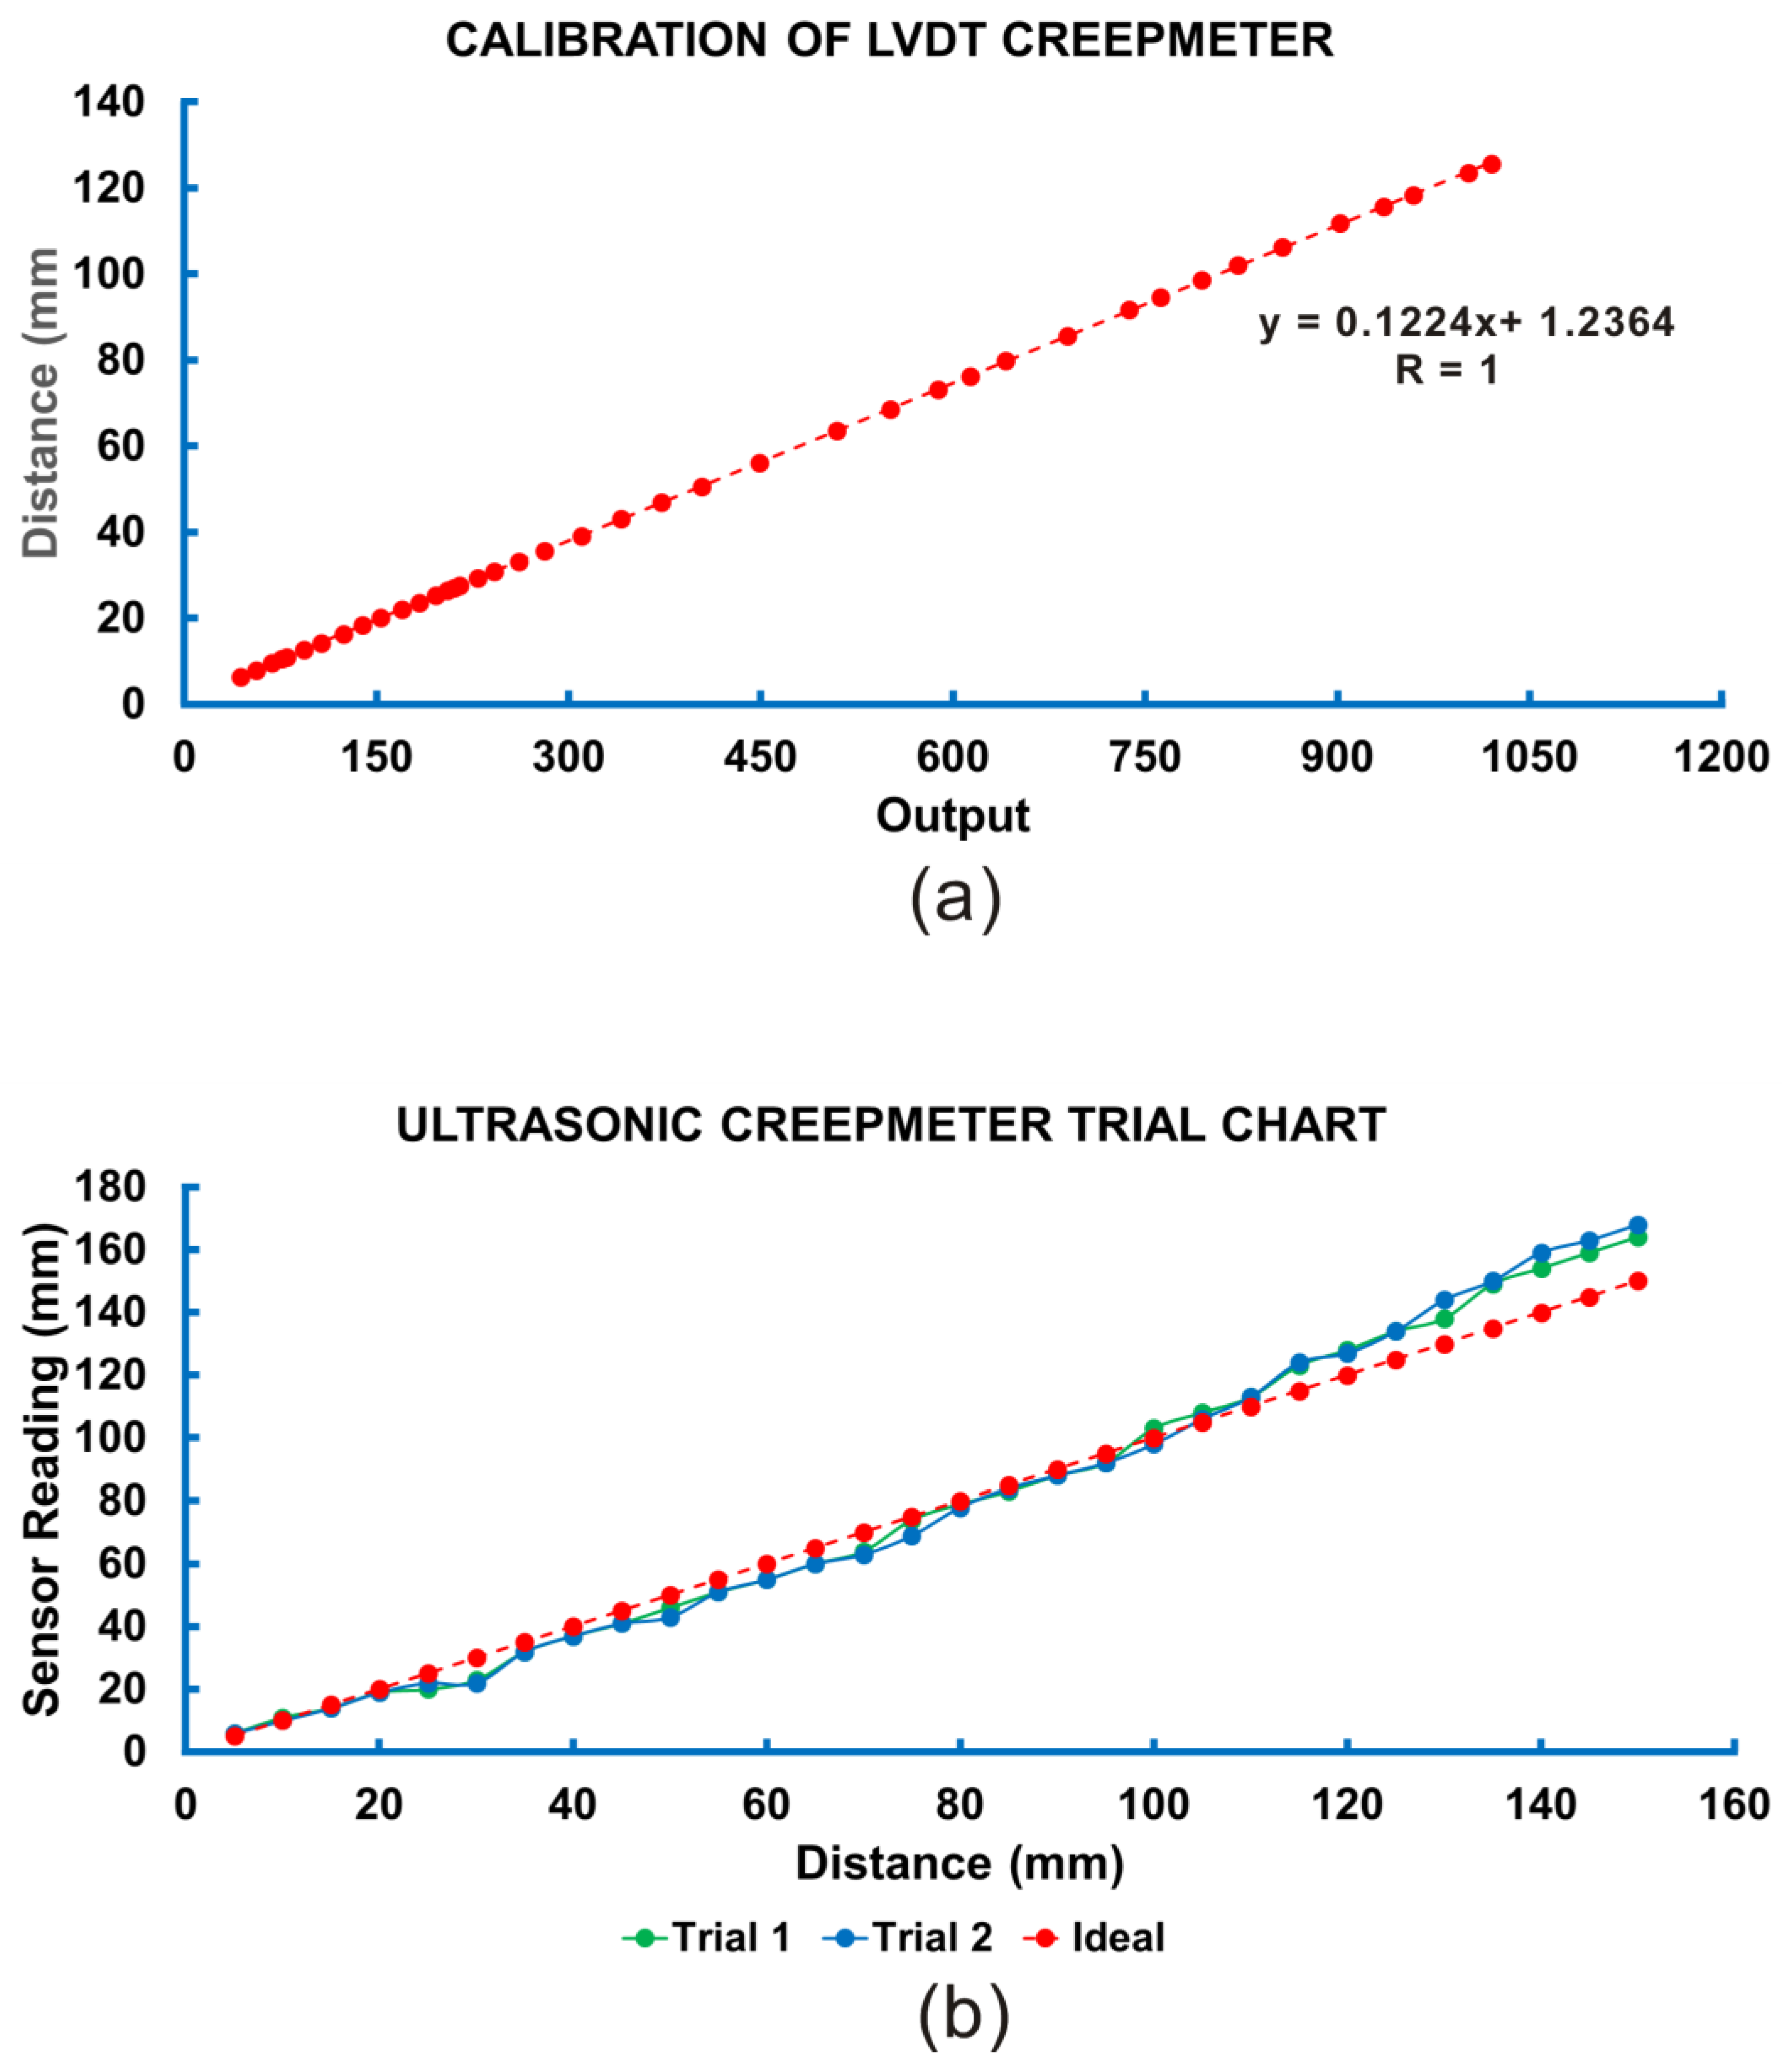
The testing of the creepmeters that we have fabricated were conducted in the laboratory to determine accuracy and reliability of creepmeters in measuring distances before deployment to the monitoring sites. The results show that the LVDT creepmeter is a highly accurate tool for measuring displacement. Figure 5a shows a perfect positive linear relationship (R = 1) between actual distance and the electrical output of the LVDT creepmeter. The ultrasonic creepmeter is less accurate than the LVDT, as our laboratory testing indicates (Figure 5b). Beyond 110 mm, measurements deviate more substantially from the ideal plot of sensor distance vs. actual distance. For trial 1, average absolute deviation was 5.23 mm for the 5–150 mm range and 3.09 for the 5–110 mm range. For trial 2, average absolute deviation was 6.03 mm for the 5–150 mm range and 3.27 for the 5–110 mm range. Moreover, results of monitoring the southernmost creeping segment of the WVF at JUA and VOS indicate that the LVDT creepmeter generates displacement plot that are more stable and, therefore, more accurate and reliable in measuring short-term, near field vertical displacement than the ultrasonic creepmeter (Figure 6, Figure 7, Figure 8 and Figure 9). While LVDT creepmeters are little affected by the elements, the outdoor operation of an ultrasonic creepmeter exposes it to environmental conditions that affect its measurement accuracy. The physical parameters that might affect the speed of sound are temperature, relative humidity, change in pressure and change in concentration of CO2 [44]. Among them, the relative humidity and temperature impact more significantly the speed of sound [45]. Sound wave propagation variations result in reported values that are closer or farther than the actual distances. The US-100 ultrasonic sensor is equipped with a temperature compensation feature. However, an increase in relative humidity decreases the molecular weight of air [46], which increases the speed of sound. Change in pressure, change in concentration of CO2, stormy weather with strong winds, air currents, or hurricanes can also cause measurement fluctuations or a loss of signal.

3.2. Displacements Measured by the LVDT and Ultrasonic Creepmeters
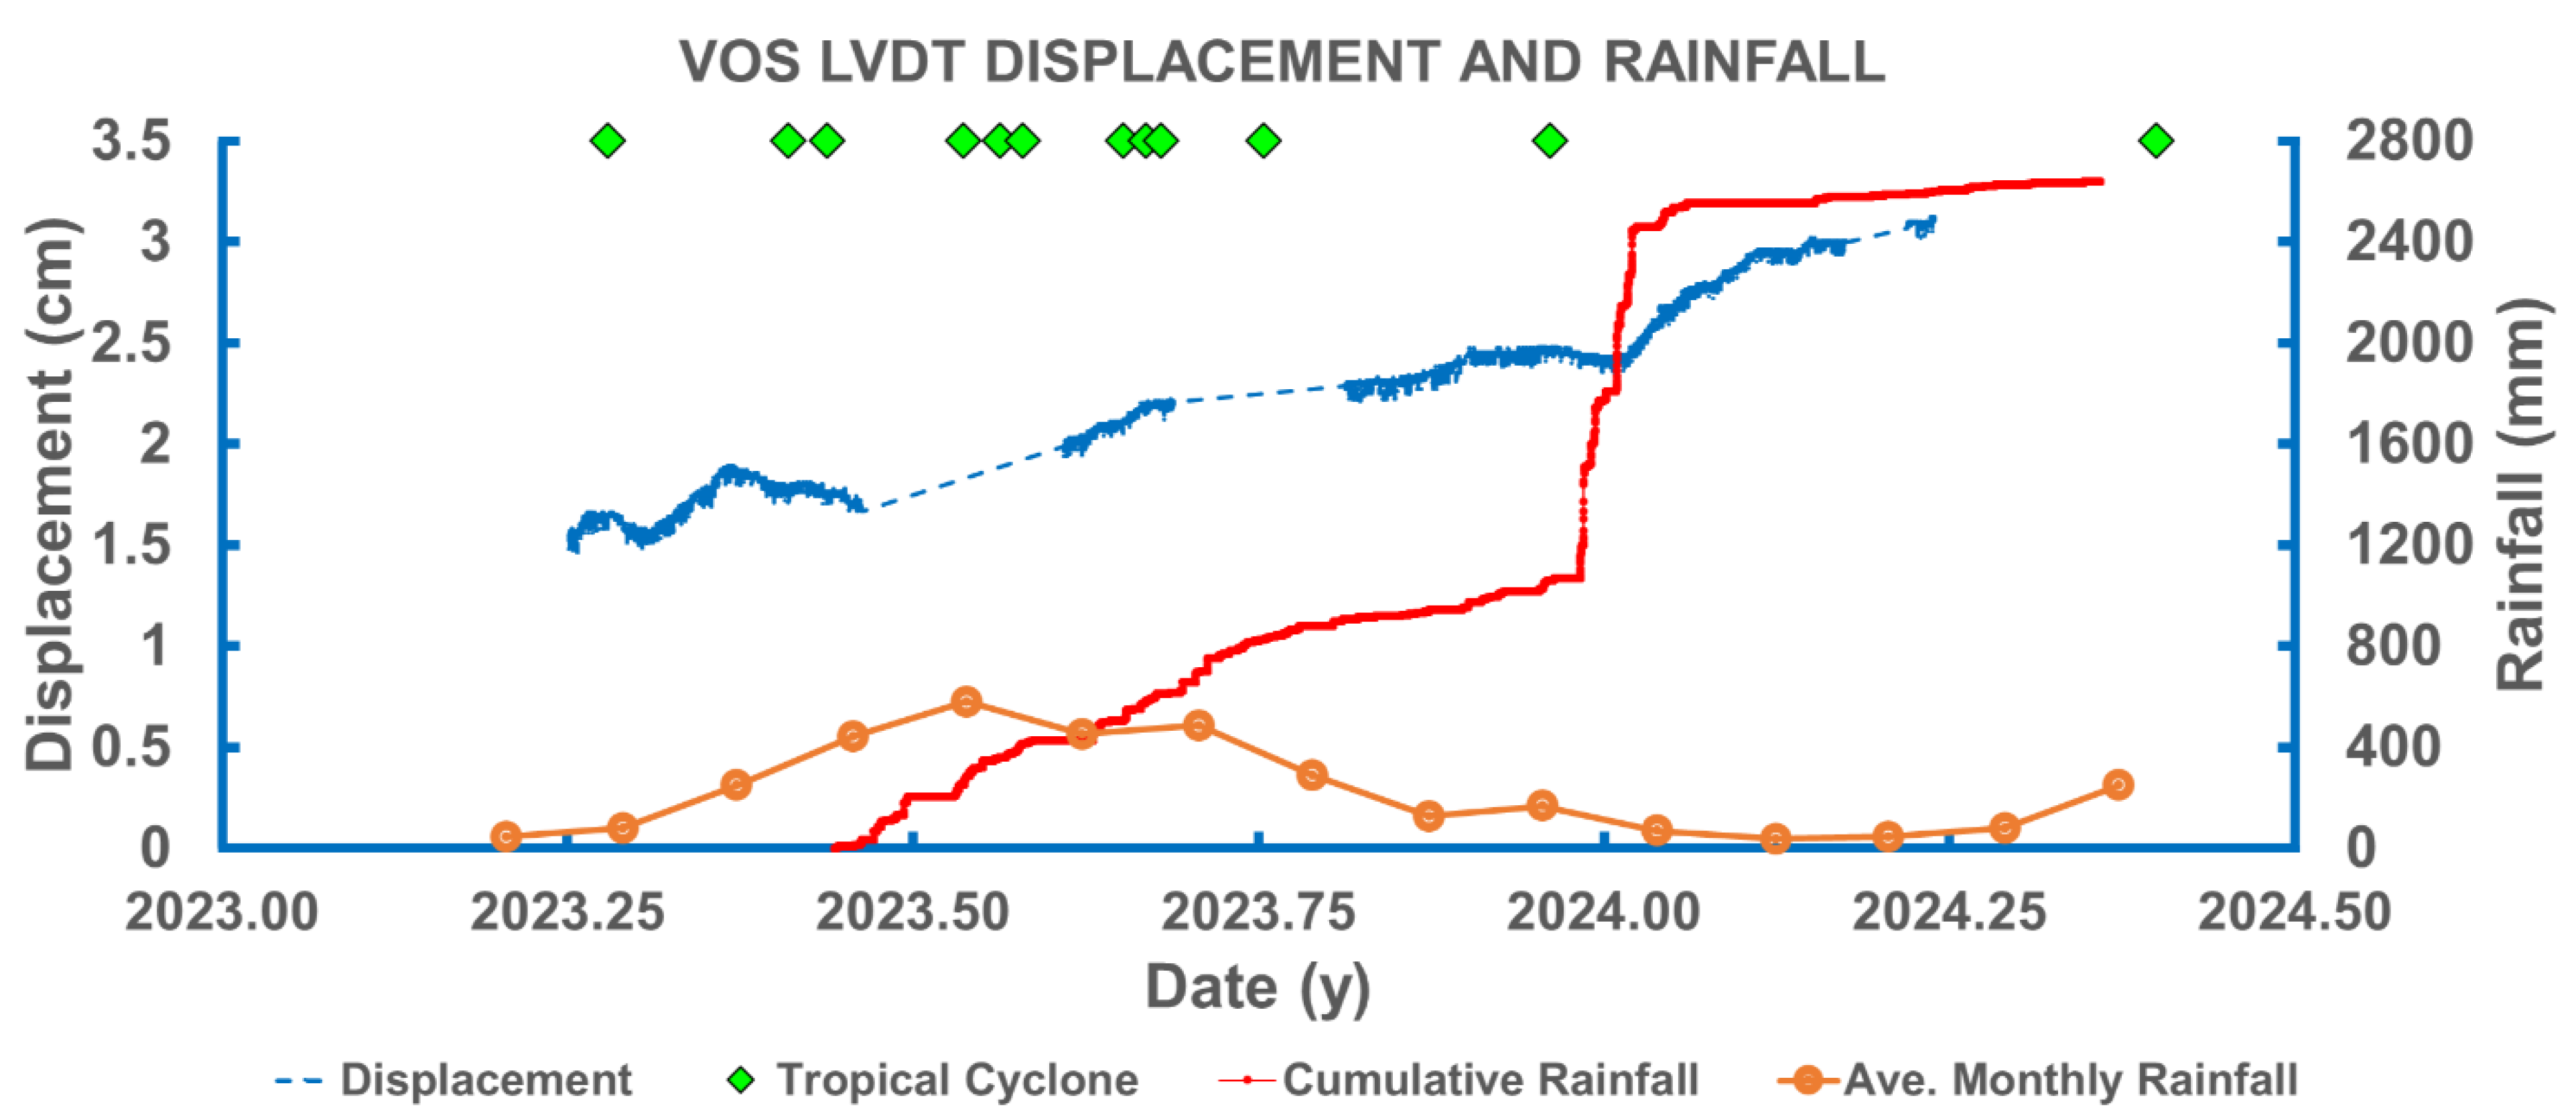
Hourly vertical slip measurements by the LVDT creepmeter at VOS from 1 April 2023 (2023.25 y) to 28 March 2024 (2024.24 y) are presented in a plot showing displacement vs. time (Figure 6). During the monitoring period, the total displacement recorded at VOS was 1.57 cm. Sharp changes in displacement started in late April 2023 and in early January 2024.
Figure 6. Vertical creep slip as measured by the LVDT creepmeter at VOS is shown in a displacement vs. time plot. The plot of rainfall as measured by the rain gauge installed at VOS is based on 30 min recording interval that started on 10 June 2023. Tropical cyclone refers to any of the various levels of weather disturbances (super typhoon, typhoon, severe tropical storm, tropical storms, or tropical depression) that may bring prolonged rainfall. Sources: [47,48].
Geohazards 06 00055 g006
To determine the relationship between displacement and seasonal precipitation, the plot of average monthly rainfall in the study area is included in Figure 6. The creeping region, which is to the west side of Laguna de Bay, is relatively dry during the November-April period and wet during the rest of the year. As the plot of average monthly precipitation (Figure 6) shows, rainy season starts in June (~23.4 y) and tapers off in October (23.8 y). The occurrences of tropical cyclones that might bring significant and prolonged amounts of precipitation are also included in Figure 6. The wet season is characterized by the clustering of these weather disturbances. Figure 6 also shows the plot of cumulative precipitation from the rain gauge station that we have installed at VOS in order to determine temporal association of short-term creep displacement with rainfall.
Figure 6 clearly shows a seasonal and episodic variation in creep motion during the LVDT displacement monitoring period at VOS. The abrupt rise in displacement that was recorded starting in late April 2023 (~2023.31 y) coincides with the increase in precipitation. The rise in displacement is sustained till near the end of the rainy season in October (2023.80 y). This period also coincides with the increase and tapering off of precipitation as recorded by the rain gauge at VOS. The abrupt rise in displacement recorded in early January was preceded by more than 1400 mm increase in precipitation as recorded by the VOS rain gauge from late December to early January. Very slow creep motion followed the rapid rise in early January 2024, which marks the start of a period (January to May) characterized by small amounts of precipitation.
For JUA, the plot of displacement for the LVDT creepmeter is shown in Figure 7. The displacement record from the LVDT creepmeter at JUA represents almost 2 years of monitoring from 24 April 2022 (2022.32 y) to 19 March 2024 (2024.22 y). The VOS LVDT creepmeter was deployed almost 1 year later (1 April 2023) due to logistical limitations imposed by the pandemic. The amount of total displacement during the 2-year monitoring period is almost 2.81 cm or a slip rate of ~1.4 cm/year, which is comparable to the slip rate at VOS.
Figure 7. Vertical creep slip as measured by the LVDT creepmeter at JUA is shown in a plot of displacement vs. time. The plot of rainfall shown is also based on precipitation as measured by the rain gauge installed at VOS on 10 June 2023. VOS and JUA are in contiguous subdivisions along the southernmost creeping segment of the WVF. Tropical cyclones occurring during the period of operation of the LVDT creepmeter at JUA are also included in the plot. Sources: [47,48].
Geohazards 06 00055 g007
Figure 7 also includes the average monthly rainfall from January 2022 to May 2024, occurrences of weather disturbance, and cumulative rainfall from 10 June 2023 to 10 May 2024. While displacement as recorded by the VOS LVDT creepmeter rose abruptly between 2023.5 and ~2023.75, coinciding with the steep rise in the amount of cumulative rainfall, no such dramatic increase can be noted in the case of the JUA LVDT displacement record during the same period. The rainy season in 2023 and the increase in precipitation recorded by the rain gauge at VOS seem to overlap/coincide, however, with the overall rise in displacement during this period. During the 2022 rainy season, the increase in displacement recorded by the LVDT creepmeter at JUA was generally slow and steady. It is briefly interrupted only by a minor and brief decrease at 22.62 y, which occurred during a brief period of relatively lower amount of precipitation (between 22.54 y and 22.7 y). In contrast to the relationship between high volume of precipitation and LVDT displacement at VOS, the abrupt increase in rainfall recorded in late December to early January did not result in a substantial rise in displacement at JUA.
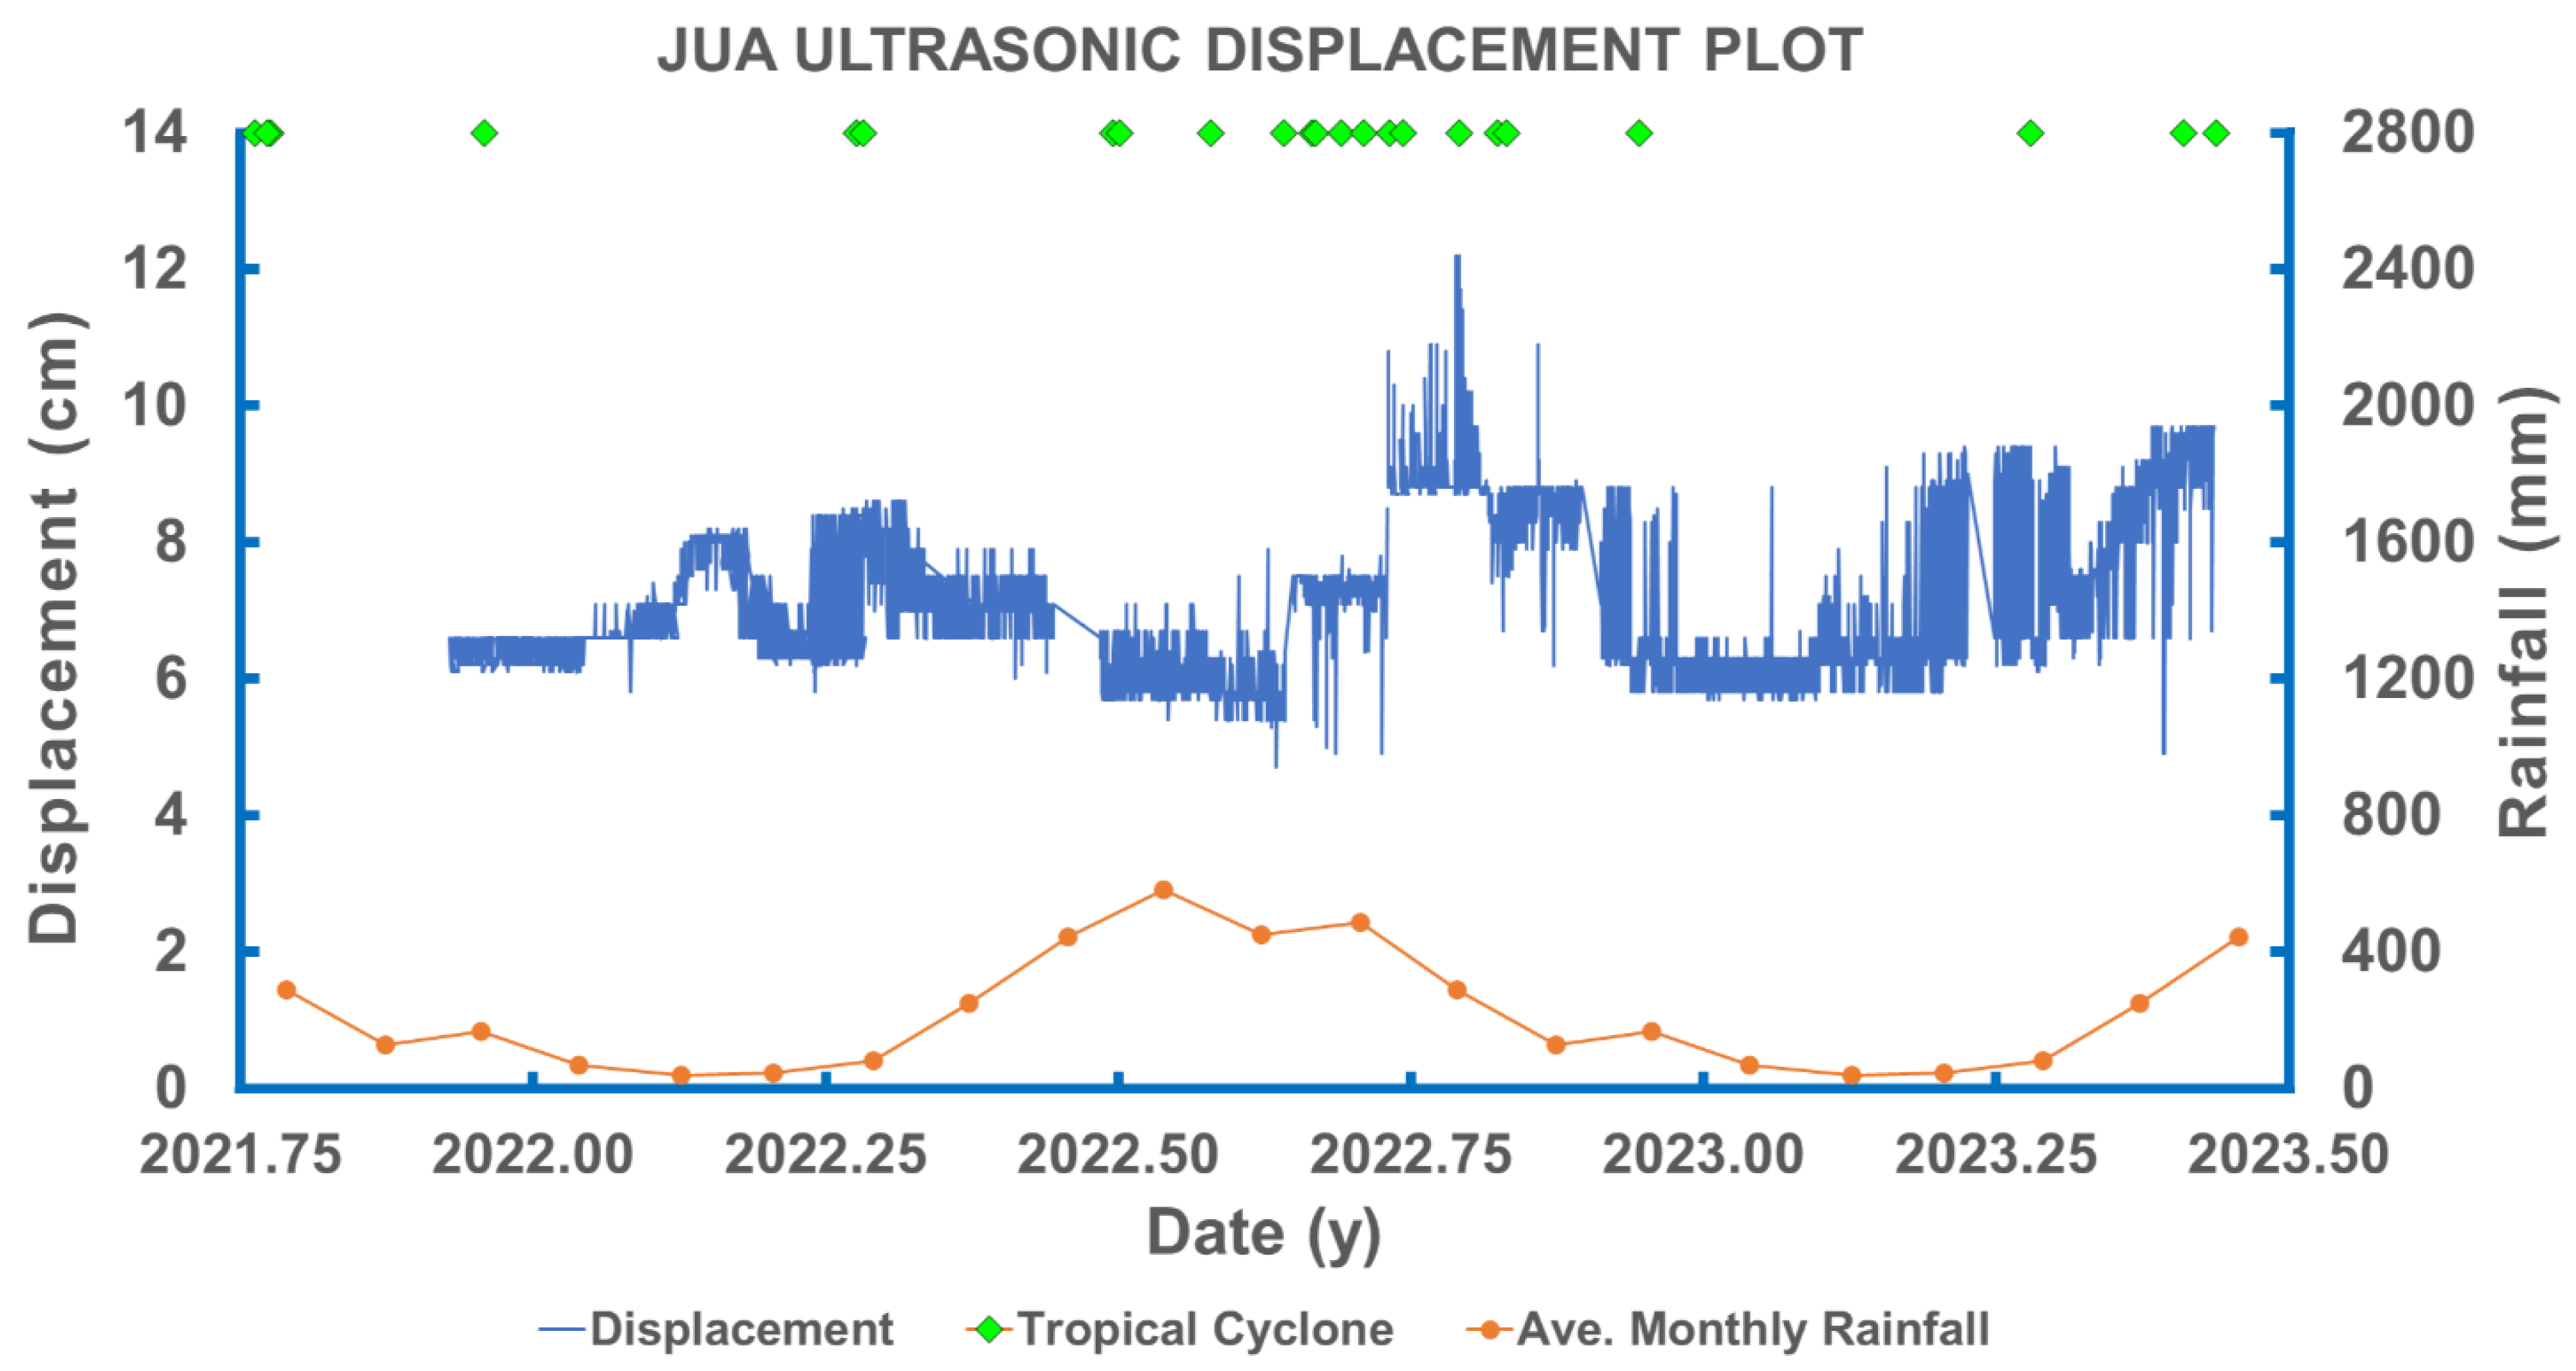
The plot of ultrasonic c creepmeter displacement measurements at JUA in Figure 8 represents the monitoring period from 5 December 2021 (2021.93 y) to 8 June 2023 (2023.44 y), or ~1.5 years. The average monthly rainfall and weather disturbances from October 2021 to June 2023 are also included. As recording of rainfall by the rain gauge at VOS started near the tail end of the ultrasonic displacement record at JUA, Figure 8 does not include a rainfall plot.
In contrast to the LVDT creepmeter displacement record at JUA, the ultrasonic displacement record is characterized by large daily and short term-fluctuations. Caution should then be exercised when analyzing the short-term changes with respect to rainfall. Laboratory testing and calibration conducted before deployment of the ultrasonic creepmeter indicated relatively high degree of accuracy with minimal measurement variance (see Figure 5b for the testing results for the ultrasonic creepmeter). However, as mentioned earlier, field conditions affect the accuracy of the ultrasonic creepmeter and cause displacement plot fluctuations. Nevertheless, the fluctuations do not prevent correlation of displacement with seasonal precipitation changes and the estimation of longer-term displacement from the JUA ultrasonic creepmeter displacement plot.
Figure 8. Plot of displacement as measured by the ultrasonic creepmeter at JUA. Average monthly rainfall is shown but no short-term precipitation is included as the rain gauge at VOS was not installed until June 2023. Tropical cyclones occurring during the period of operation of the ultrasonic creepmeter at JUA are also shown. Sources: [47,48].
Geohazards 06 00055 g008
There are longer-term trends in the ultrasonic record that can be related to seasonal changes in precipitation. Though there is no remarkable relationship between the displacement changes recorded by the ultrasonic creepmeter at JUA and the dry season in 2022, the rainy season in 2022 (year 2022.4 to 22.8) appear to be followed by peaks in the displacement record near the latter part of the rainy season. The onset of the rainy season in 2023 also appears to be associated with the start of the rise in displacements recorded by the ultrasonic creepmeter.
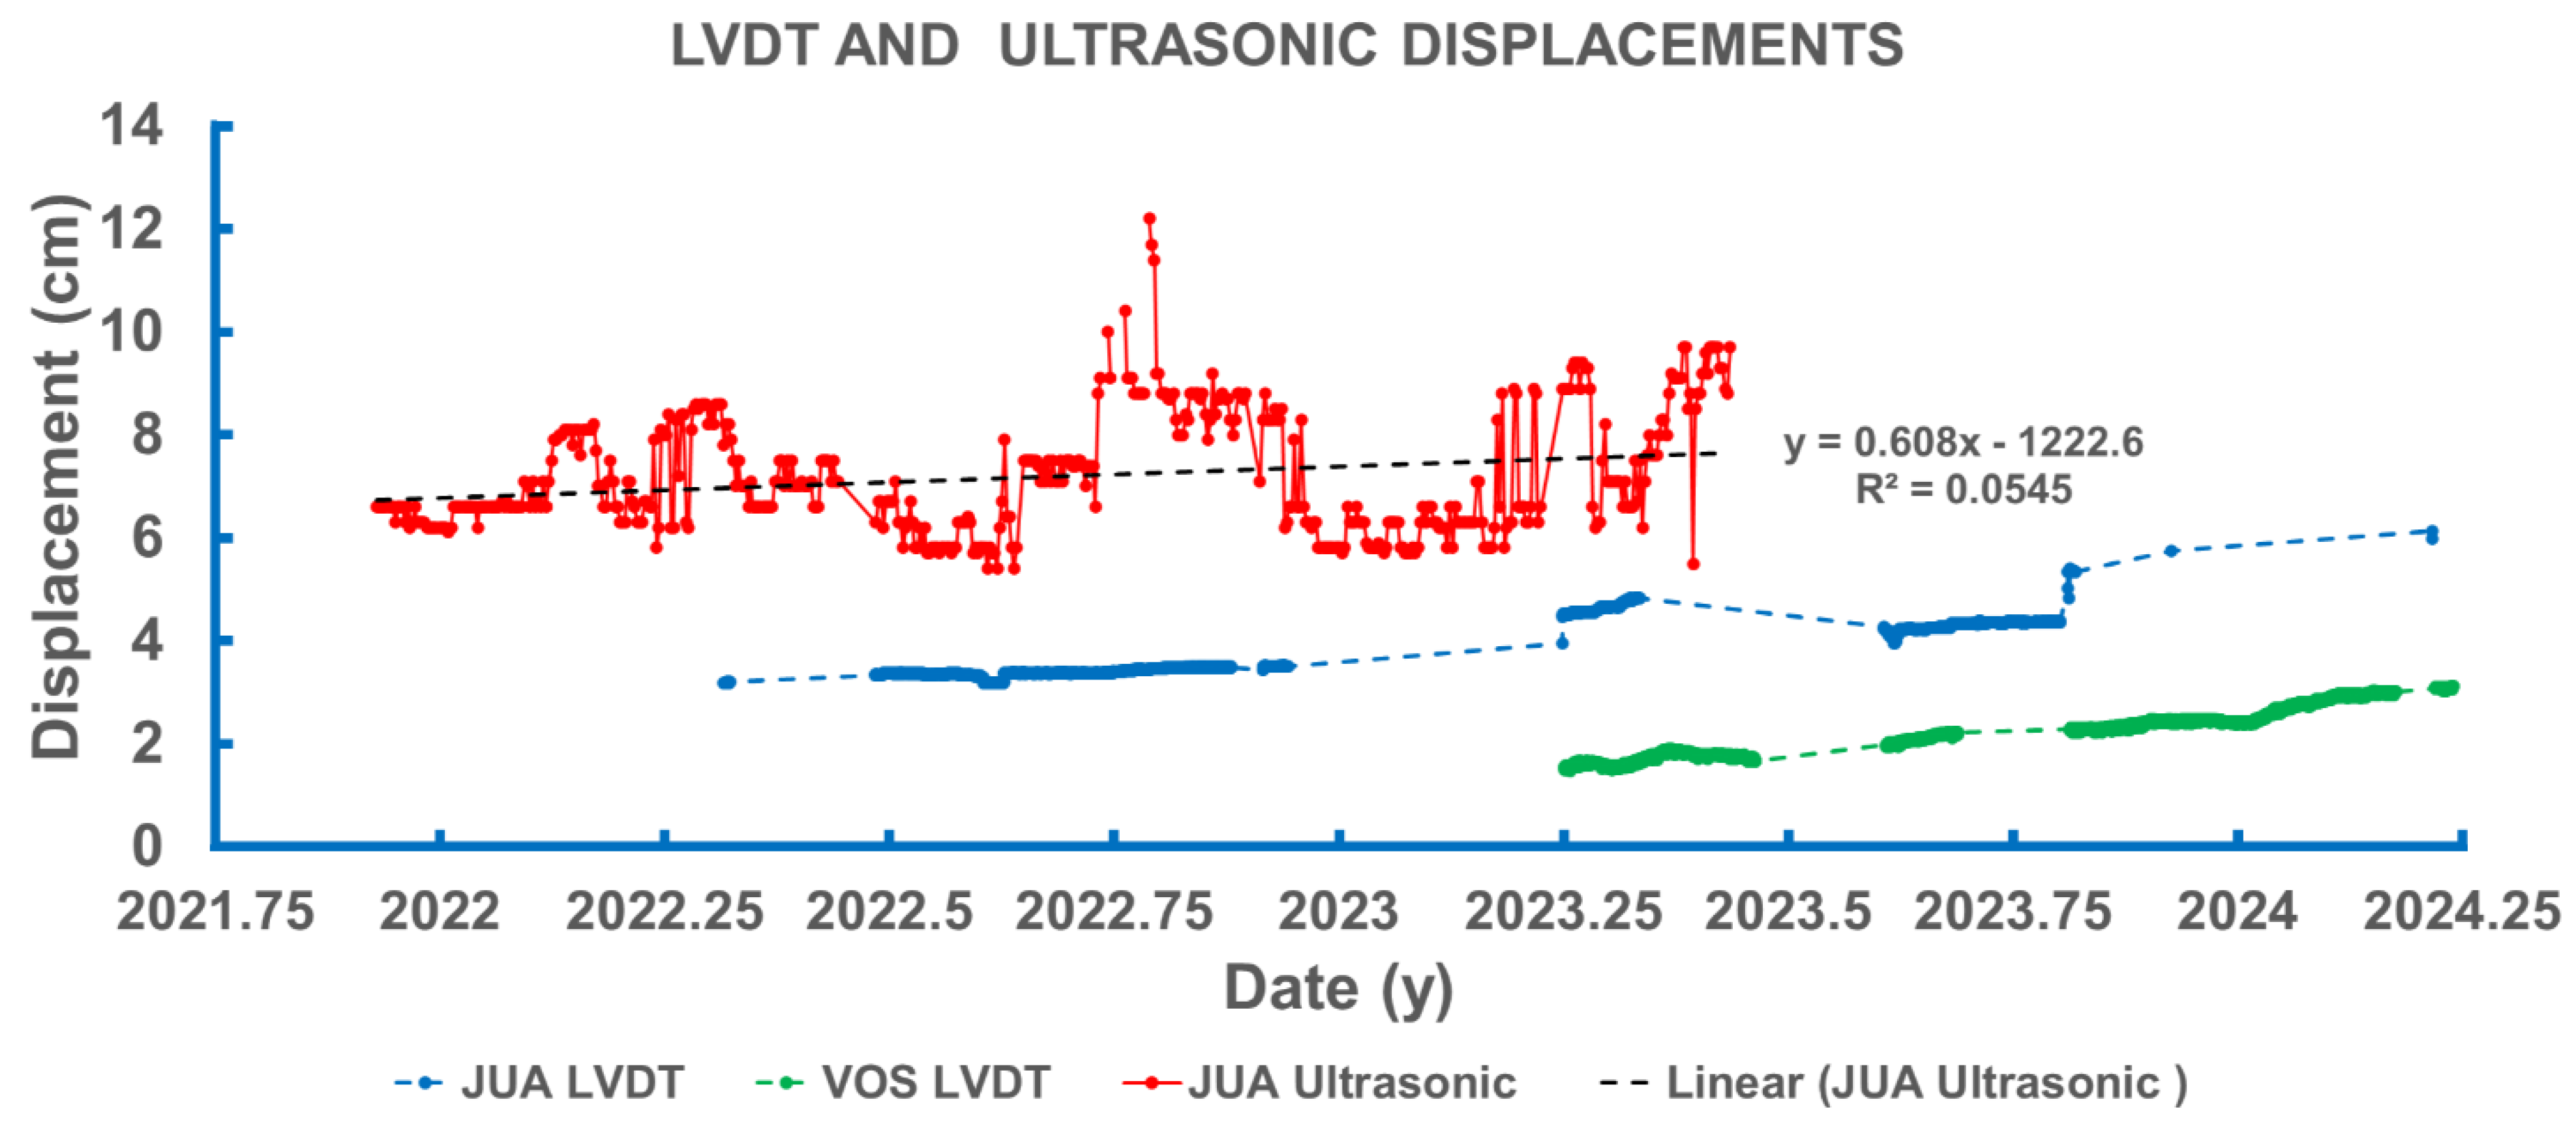
Figure 9 compares the displacement plots for JUA ultrasonic, JUA LVDT, and VOS LVDT creepmeters. To minimize short-term fluctuations caused by environmental conditions that might have an effect on the ground and creepmeter platform or to the operation of the sensor, the JUA ultrasonic displacement plot involved only the daily 1200H data. The daily ultrasonic creepmeter record is characterized by prolonged periods of highs and lows but is still replete with short-term fluctuations. For this reason, it is quite difficult to estimate the amount of displacement during the monitoring period. Nevertheless, based on the trendline drawn for the ultrasonic displacement data, the estimated displacement is 0.92 cm for 1.5 years or 0.61 cm/year, which is less than the slip rate obtained from the LVDT creepmeter at JUA. For the period between 2022.32y and 2023.25 y, when the ultrasonic and LVDT creepmeters at JUA were both in operation, however, the slip rates from the ultrasonic displacement trendline and LVDT plot are quite similar (0.8 cm/yr).
Figure 9. Composite time-series plots for the LVDT and ultrasonic creepmeter displacement data. The JUA ultrasonic displacement plot represents daily measurements to reduce clutter. Displacement from the highly variable ultrasonic plot may also be estimated from A trendline, from which displacement and slip rate may be estimated, was derived from the highly variable ultrasonic displacement plot. Slip rate estimated from the plots of displacement for the duration of operation of the creepmeters are: VOS LVDT (2023.25 y–2024.24 y) = 1.57 cm/yr; JUA Ultrasonic (2021.93 y–2023.44 y) = 0.61 cm/yr; JUA LVDT (2022.32 y–2024.22 y) = 1.4 cm/yr. During the 2022.32 y–2023.25 y period, when the ultrasonic and LVDT creepmeters were both operating, slip rates were identical (0.8 cm/yr).
Geohazards 06 00055 g009

3.3. Comparison with Longer-Term Displacements from Precise Leveling

Periodic (2 times per year) precise leveling to determine creep displacement and slip rates at selected sites (including VOS and JUA) continued through the pandemic. The equipment used (digital level) did not require maintenance or replacement. Figure 10a,b are scarp profiles generated from precise leveling at JUA and VOS, respectively. A profile of the scarp was drawn after each survey and displacements are estimated from the differences in heights of scarps derived from successive survey periods. The displacements plots, which were derived from scarp height increments, for JUA and VOS are also shown in Figure 10a,b, respectively. The short-term slip rates at JUA and VOS derived from the creepmeter data are slower than the longer-term slip rates derived from precise leveling. Creep scarp height at JUA increased by 25.56 cm from the start of precise leveling survey in September 2012 (2012.69) until September 2023 (2023.75), which is equivalent to a slip rate of 2.31 cm/yr. Slip rate had accelerated since 2014. From a slip rate of 0.77 cm/yr for the 7 September 2012 (2012.686 y)–25 March 2014 (2014.235 y) period, slip rate increased abruptly to 2.79 cm/yr from 25 March 2014 (2014.235 y) to 18 October 2021(2021.835 y). Movement slowed down to 1.7 cm/yr from 18 October 2021(2021.835 y) to 12 September 2023 (2023.751 y). Between 25 March 2014 (2014.235 y) and 12 September 2023 (2023.751 y), average slip rate was 2.56 cm/yr.
Between 24 September 1999 (1999.732 y) and 19 October 2022 (2022.835 y), the displacement at VOS as measured by precise leveling amounted to 52.49 cm. This represents an average slip rate of 2.27 cm/yr for the 23-year period. Slip rate had also accelerated since the precise leveling survey that was conducted in March 2014 at VOS. From a slip rate of 0.80 for the 2 September 2011 (2011.672 y)–25 March 2014 (2014.235 y) period, slip rate increased abruptly to 4.1 cm/yr from 25 March 2014 (2014.235 y) to 19 August 2016 (2016.635 y). From 19 August 2016 (2016.635 y) to 19 October 2022 (2022.835 y), movement slowed down to 3.13 cm/yr. The average slip rate from 19 March 2014 (2014.235 y) to 19 October 2022 (2022.835y) was 3.4 cm/yr.
Figure 10. (a) Scarp profiles across the scarp at the JUA monitoring site from September 2012 to September 2023. The displacements derived for the same period is also shown. (b) For VOS, only one scarp profile for each year, from September 1999 to October 2022, is shown to avoid cluttering of the graph but all displacements derived after each survey are shown. Updated and modified from [2,39].
Geohazards 06 00055 g010

4. Discussion

The LVDT displacement and slip rates at VOS and JUA are quite accurate as demonstrated by laboratory testing results (Figure 5) and by the absence of fluctuations that characterize the ultrasonic creepmeter displacement plot from JUA. Overall, the short-term slip rates estimated from the creepmeter measurements are much slower than the longer-term slip rates obtained by precise leveling. At VOS, deformation is distributed and is not confined along a narrow zone centered along the ground rupture. The large disparity in the lengths of the creepmeter platform (~2 m) and the precise leveling survey line (~180 m) could partly account for the large difference between the short- and long-term slip rates. Part of the long-term slip rate most likely also reflects the effects of groundwater extraction, as discussed later in this section. At JUA, where the length of the creepmeter platform is not significantly shorter than the precise leveling survey line (Figure 3), the long-term displacement and slip rates obtained from precise leveling are also much higher than the short-term LVDT displacement and slip rates. In this case, the contribution of groundwater extraction to the long-term displacement and slip rate is more substantial. The more recent (2022.32 y–2024.22 y) short-term LVDT displacement and slip rates at JUA are similar to those obtained from precise leveling during almost the same period (2021.84–2023.75) because periods when rates of slip had been highest occurred earlier.
We are unable to quantify the effects of the many factors influencing the ultrasonic creepmeter measurement accuracy and make the corrections, thereby making the ultrasonic creepmeter not as reliable as the LVDT creepmeter for short-term monitoring of displacement and in determining association of short-term displacement with rainfall. It can be useful, however, in estimating longer-term (months to years) displacement and, to some degree, in determining association of displacement with seasonal precipitation. Rough estimates of longer-term displacement and slip rate can be obtained from the ultrasonic plot trendline. From this trendline, a slip rate of 0.61 cm/y was obtained. For the period when both the JUA LVDT and ultrasonic creepmeters were operating, the slip rates estimated from the LVDT plot and the ultrasonic plot trendline are similar (0.8 cm/y).
Movement within the creeping zone was triggered by groundwater extraction. This assessment was based on the rates of slip in the 90 s (locally as high as 20 cm/yr) which are higher than tectonic rates of slip [1,2]. Results of monitoring of vertical displacement through precise leveling that started in 1999 indicate lower slip rates but those in the southern part of the creeping zone maintained accelerated rates of slip (e.g., up to 3.5 cm/yr at VOS and JUA) [2]. Abrupt and substantial changes in displacements in the southern part of the creeping zone are controlled by groundwater extraction [2]. The abrupt increases in displacement at VOS and JUA were preceded by a sharp rise in groundwater extraction in 2013 near the ADL monitoring site, which is close to JUA and VOS [2]. The start of the surge in extraction near the JUA-VOS area (March 2013) preceded, by 1 year, the start of a significant increase in displacements at JUA and VOS sites [2]. They attribute the extraction surges in 2013 principally to the 2004 ban by the National Water Resources Board (NWRB) [2,49] on groundwater extraction in Metro Manila and vicinity. The ban affected the groundwater extraction balance in favor of the southern part of the creeping zone (i.e., Binan-San Pedro area) which is not covered by the ban.
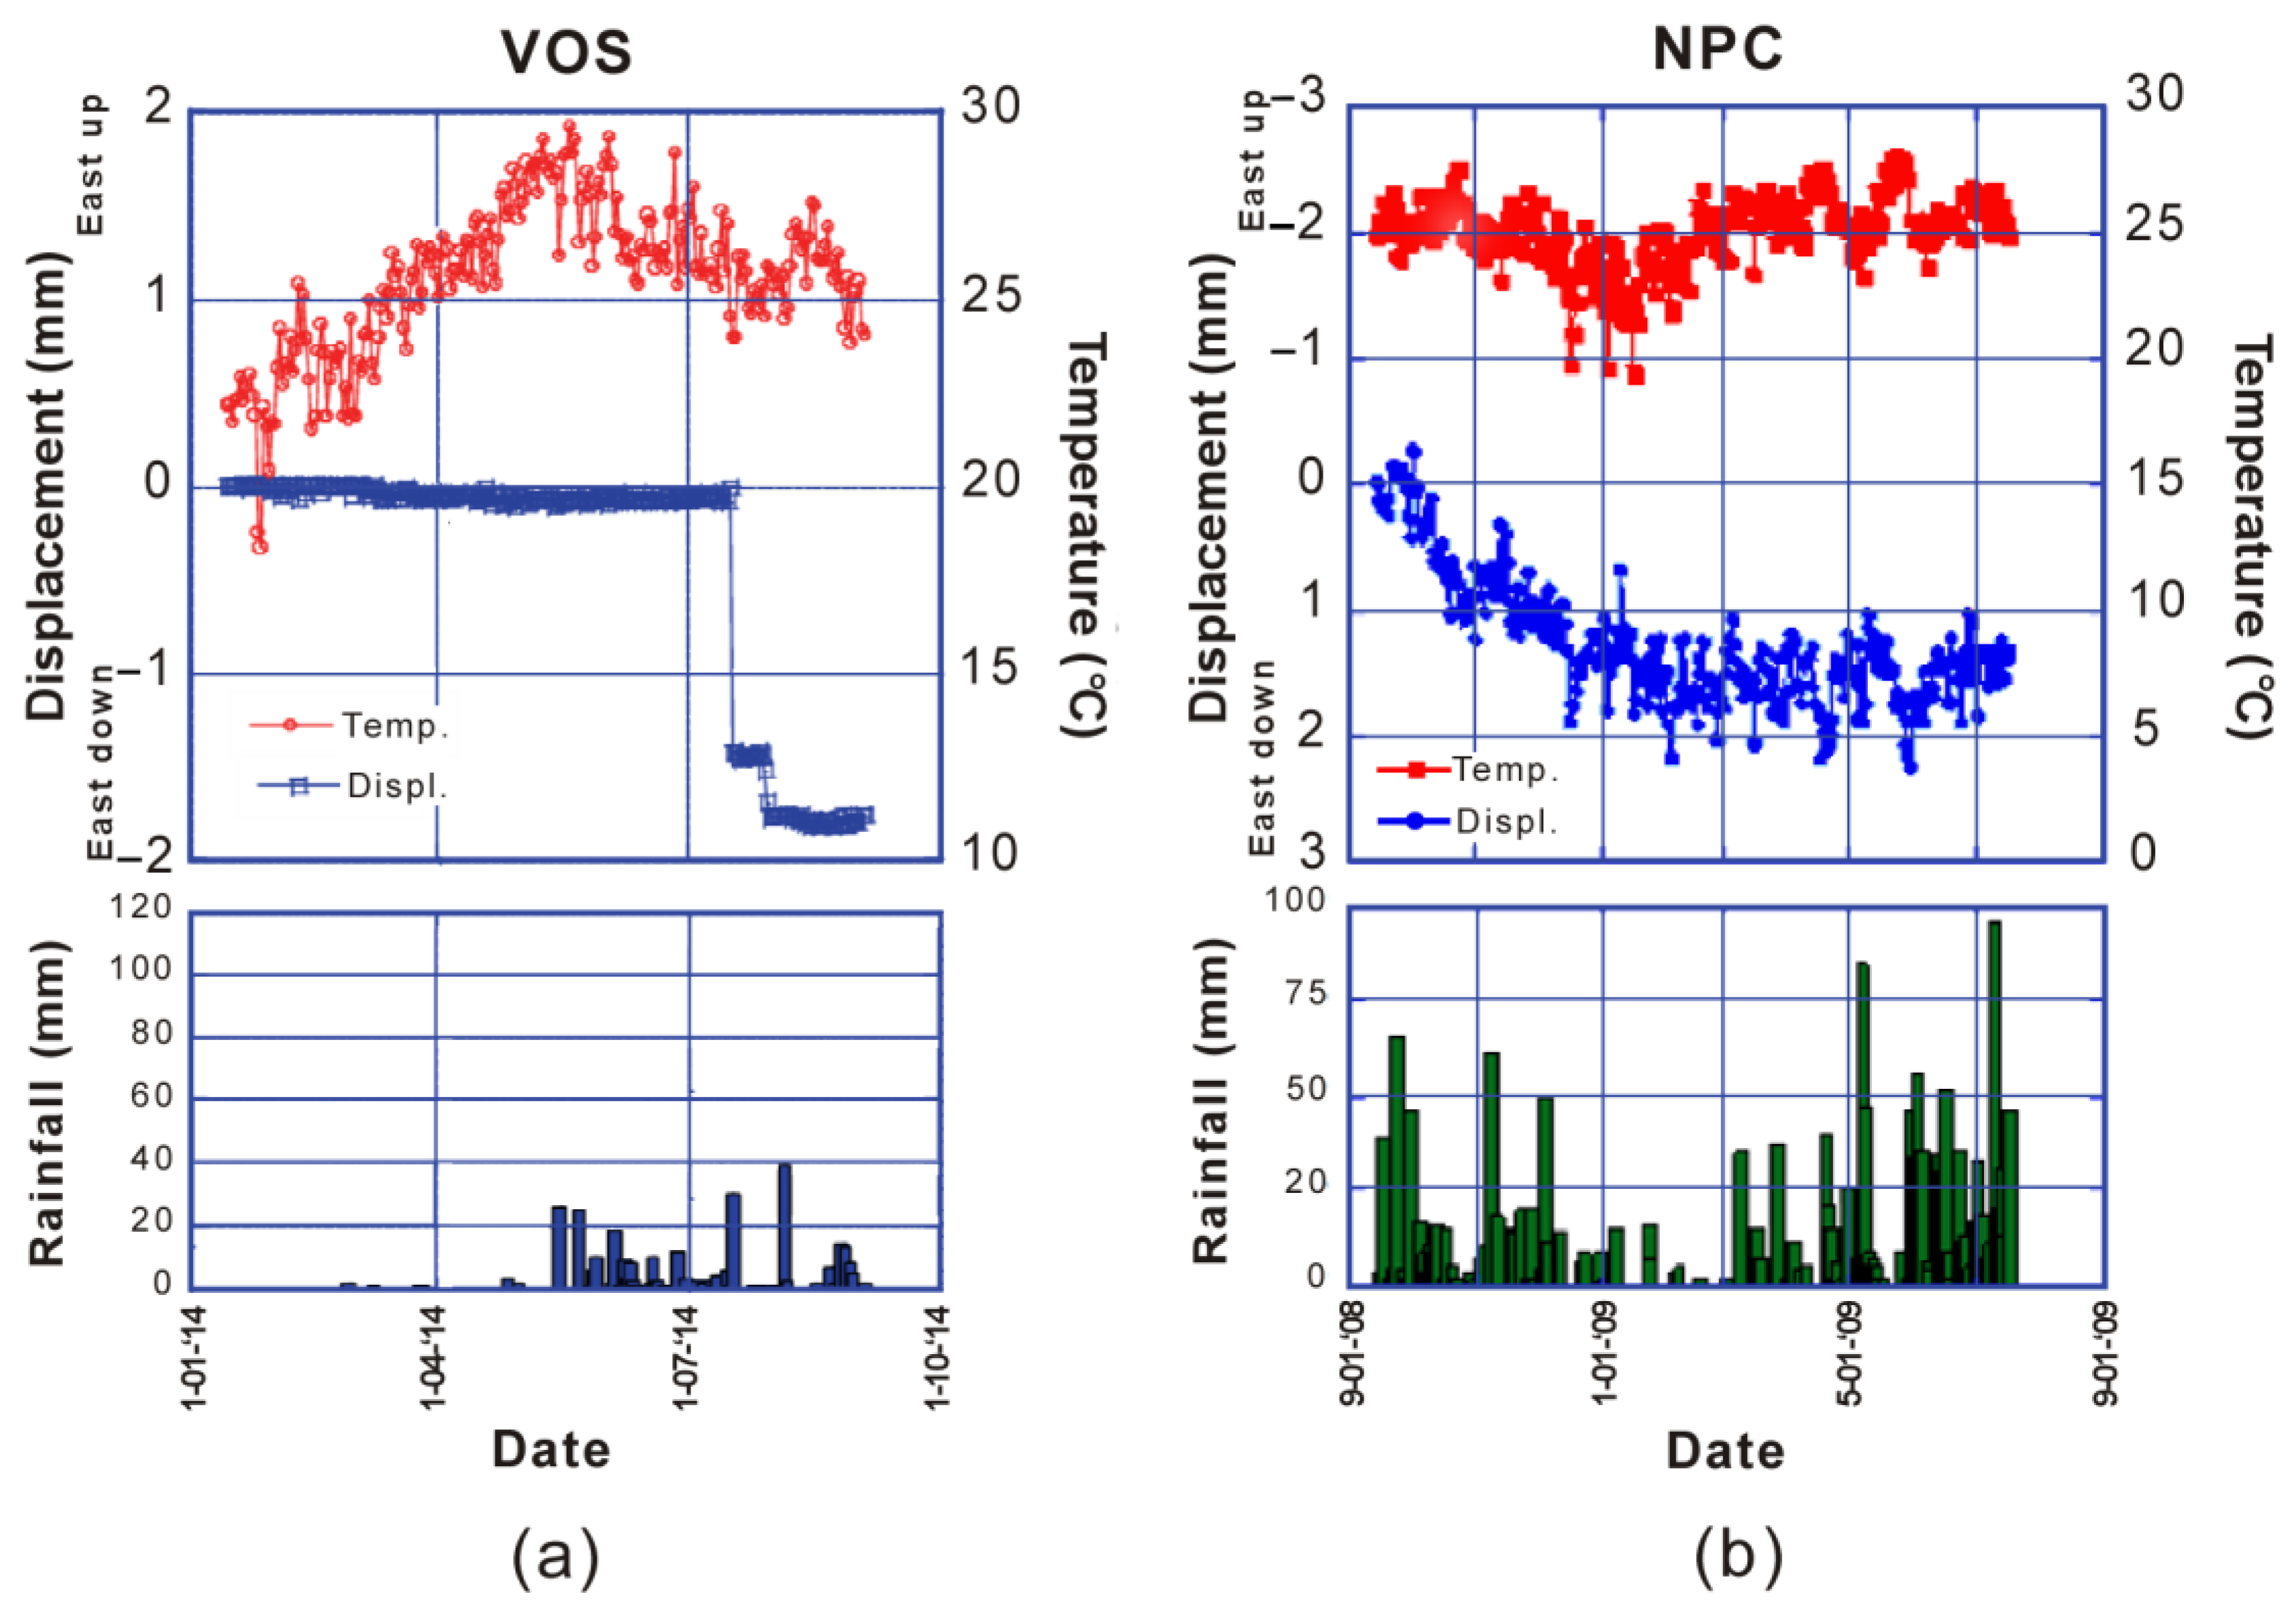
The influence of rainfall and seasonal precipitation cannot be resolved by periodic digital level surveys [2,36,37,38,39]. The results of more near-field continuous monitoring used in this study is more appropriate for this purpose. Episodicity of displacement at VOS is clearly demonstrated by the sharp rise in displacement measured by the LVDT creepmeter in early January 2024 immediately following the onset of and overlapping a period of heavy rainfall in late December 2023 to early January 2024. A similar increase in displacement (by ~2 mm) was reported [37] at VOS on 7 January 2014 (Figure 11a) which was interpreted as a response to a few days of relatively intense rainfall (5–7 January 2014).
Some of the monitoring data point to the seasonal nature of slip with the onset of accelerated slip coinciding with the start of or overlapping with the rainy season. In the vicinity of the study area, most of the total annual precipitation is concentrated during the wet season (May to October) [48]. The voluminous rains that accompany tropical cyclones also usually start in May [50]. There is a clear relationship between the rainy season and increase in displacement as measured by the LVDT creepmeter in 2022 at VOS. The LVDT creepmeter at JUA shows a different picture as there is no obvious relationship between the rainy season and creep displacement in 2022 and the abrupt increase in rainfall recorded in late December to early January does not coincide nor followed by a sharp rise in displacement. However, the rainy season in 2023 seems to overlap/coincide with the overall rise in LVDT displacement at JUA. Except for the peaks in displacement in 2022 and 2023, which can be related with the rainy season, there are no other remarkable correlations involving the JUA ultrasonic creepmeter record.
Continuous monitoring of the VFS creeping zone conducted earlier [38,39] also revealed inconsistencies in the association of changes in displacement with seasonal precipitation and rainfall. Displacement increases in certain rainy seasons but does not in other instances [38,39]. For example, at NPC-B, changes in displacement for the period from September 2008 to January 2009 appear to be related to rain fall (Figure 11b). However, for the period starting in May 2009, which coincides with the onset of the rainy season, no similar change in displacement was recorded [37,40]. Inconsistent association of creep acceleration with rainfall and seasonal precipitation along the San Andreas Fault at Parkfield was also noted [51].
At least some of the creeping segments had been shown to occur along active pre-existing tectonic traces based on mapping of pre-existing scarps and exposure of fault strands and offset sediments [1,3]. Additionally, the WVF’s creeping zone corresponds to the dilational gap between the right-stepping segments I and III (Figure 2A) [1,3,4].
How movement along pre-existing tectonic structures have been triggered by groundwater extraction may be explained by the Mohr–Coulomb failure criterion. Fault failure results when the frictional strength and normal stresses are exceeded by shear stress. Whether fault failure will result directly in aseismic slip or seismicity depends on the frictional properties of faults [52]. Failure results from groundwater extraction as it causes a net decrease in the normal stress due to the compaction of the aquifer and reduced water load [53,54] despite a reduction in the pore fluid pressure and an increase in effective normal stress [55,56].
Rainwater induces slip by reducing near-surface frictional resistance along faults. If rainfall is not a factor (e.g., during summer), the frictional resistance at shallow levels of the fault may eventually be overcome by continued slip at depth [57]. Extended periods of high creep rates are also probably related to intense rainfall that triggers release of stored tectonic strain [51]. It was noted that some of the creep rate surges in the Parkfield section of the creeping segment of the San Andreas fault are not only induced by rainfall but also influenced by seasonal precipitation [51]. It was also observed that slip rate changes along the Chihshang fault in Taiwan are season dependent [58,59].
Short-term ground deformation related to rainfall and to seasonal precipitation could also be the result of soil dynamic changes [51,58,59]. Aside from the effect of varying frictional properties, inconsistencies in the response to precipitation at different times in one site and between sites may be influenced not only by the variations in amount, intensity, and timing of rainfall but also by local ground conditions [57]. As the creepmeter piers are anchored to a certain depth, displacement change may also result from the expansion and contraction due to wetting and drying of near-surface materials. Ground conditions relevant to creepmeter response include the reaction of local soil to rain, height of water table and recharge time, and proximity of creepmeter to bodies of water [57]. The moisture content and soil hydraulic conductivity of the ground down to the depths of the creepmeter piers may affect creepmeter displacement readings [51].
The slip rates derived from the creepmeters indicate continued accelerated creep in the southern part of WVF’s creeping zone. While part of the displacements is associated with seasonal precipitation and episodic rainfall, the primary triggering forces are attributed to the continued overextraction of groundwater. The continued overextraction of groundwater in the southern part of the creeping zone raises concern about exacerbating the damage caused by the ground rupture and the possible occurrence of seismicity.
Minor tectonic stress changes are known to cause enough stress increment that may result in premature occurrence of earthquakes [40]. Stress perturbations that are associated with groundwater extraction and which resulted in earthquakes are a small fraction of the stress drops involved in large earthquakes but are enough to advance the timing of earthquakes [40,60,61,62]. Though excessive groundwater withdrawal and fault creep does not always directly trigger an earthquake (e.g., [63]), numerous cases of earthquakes induced by overextraction are known [40,42,60,61,64,65]. Whether excessive groundwater extraction can lead to seismicity is quite difficult to ascertain and there is no known reliable method for this.
How seismicity may be induced along a creeping fault through groundwater withdrawal was outlined in [43]. In essence, the model predicts that continued depressurization strengthens the fault through the development of “barriers” to slip, which could lead to sudden failure and earthquake once the resistance is overcome by the effective stress. The development of bigger barriers through continued extraction could lead to increase in the size of succeeding earthquakes [43].
Fault jogs and bends are surface expressions of larger-scale barriers and asperities [66,67,68]. Due to the difficulty of opening dilational jogs in the fluid-saturated crust, features such as the WVF creeping zone which is on the gap area between the right-lateral segments I and II of the WVF [1,2,3,4], are the preferred sites for rupture arrest [69,70]. Continued depressurization could weaken and lead to failure of the WVF creeping zone, which in turn could induce static stress changes that could potentially increase stress in adjoining areas and advance the failure of segments I or III. The 45 km segment I has the potential of generating a MW 7 earthquake based on length [1,4] and paleoseismicity [66] or MW 7.7 based on the most recent, single-event scarp offsets [1,4]. It has an estimated return period of 400–600 years [71] and has not moved since 1599 [11,15,71]. Weakening of the creeping zone could also hasten stress load transfer and facilitate slip transfer from one segment to another during an earthquake occurring along segment I or II. The occurrence and timing of this would depend on the resistance of the barrier and on the physical state of the target segment [72].

5. Summary and Conclusions

Monitoring of the southern part of the WVF’s creeping segment using locally assembled, cost-effective LVDT and ultrasonic creepmeters ensured the continuity of the near-field, short-term creep displacement data. The use of the creepmeters brought in from overseas to monitor displacement along the creeping segment of the WVF was interrupted by the onset of the COVID pandemic. Restrictions on travel (of qualified overseas collaborators) and flow of imported materials prevented maintenance and data retrieval. This necessitated fabrication of new types of creepmeters that can be assembled from locally available components to generate and gather data continuously. These are the Arduino-based LVDT and ultrasonic creepmeters. While the LVDT creepmeter is a reliable tool for short-term monitoring of displacement, the ultrasonic creepmeter seems to be more useful for long-term monitoring of displacement. This is due to the sensitivity of the speed of sound to environmental conditions resulting in short-term fluctuations in the ultrasonic displacement plot. Longer-term displacements, however, measured by the ultrasonic and LVDT creepmeters for the same period were comparable.
There are obvious returns of using locally fabricated creepmeters. This includes cost-effectiveness, ease and speed of maintenance due to availability of parts, and familiarity with the equipment’s strengths, limitations, and applicability. The creepmeters complemented the periodic displacement monitoring through precise leveling. Considering the prevalence of unmonitored active faults and other geologic phenomena in many parts of the world, domestically fabricated creepmeters can certainly fill the monitoring gap.
Accelerated creep continues in the southern part of the WVF creeping zone. Breaking the total displacement into its components remains a challenge. Differential compaction of the materials across the ground ruptures due to groundwater withdrawal likely accounts for part of the displacement. Movement along the ground ruptures may have been facilitated by compaction and the removal of mass due to groundwater withdrawal. Compaction and the removal of mass alter the balance of stresses acting on the fault plane, triggering the release of stored strain energy through movement along the ground ruptures. Continued overextraction of groundwater results in further compaction and release of stored strain energy. Episodic and seasonal displacement changes may reflect the effects of rainfall and seasonal precipitation. Different sites, however, have different responses to short periods of heavy rainfall and seasonal precipitation. Furthermore, the same site may have different responses at different seasons and periods of heavy rainfall. Varying fault plane frictional properties, local ground conditions, and the amount, intensity, and timing of rainfall contribute to these responses.
Future work should determine the nontectonic and tectonic contributions to the total displacement. Since our monitoring indicated continued accelerated creep in the study area, the expansion of the area of coverage of existing ground extraction regulations to include the region southeast of Metro Manila should be seriously considered.

Author Contributions

Conceptualization, R.E.R.; methodology, R.E.R., D.C.E.L. and B.J.M.; software, R.E.R., D.C.E.L. and B.J.M.; validation, R.E.R., D.C.E.L. and B.J.M.; formal analysis, R.E.R., D.C.E.L. and B.J.M.; investigation, R.E.R., D.C.E.L., B.J.M. and R.J.G.; resources, R.E.R., D.C.E.L. and B.J.M.; data curation, R.E.R.; writing—original draft preparation, R.E.R. and D.C.E.L.; writing—review and editing, R.E.R., D.C.E.L. and B.J.M.; visualization, R.E.R.; supervision, R.E.R.; project administration, R.E.R. and R.J.G.; funding acquisition, R.E.R., D.C.E.L., B.J.M. and R.J.G. All authors have read and agreed to the published version of the manuscript.

Funding

This research was funded by the Department of Science and Technology—Philippine Institute of Volcanology and Seismology (DOST-PHIVOLCS) in accordance with the General Appropriations Act of the Republic of the Philippines.

Data Availability Statement

The original contributions presented in this study are included in the article. Further inquiries can be directed to the corresponding author.

Acknowledgments

This work was accomplished with the help of the Department of Science and Technology—Philippine Institute of Volcanology and Seismology (DOST-PHIVOLCS) personnel.

Conflicts of Interest

The authors declare no conflicts of interest.

References

  1. Rimando, R.E. Neotectonic and Paleoseismic Study of the Marikina Valley Fault System, Philippines. Ph.D. Thesis, State University of New York at Binghamton, Binghamton, NY, USA, 2002. [Google Scholar]
  2. Rimando, R.E.; Kurita, K.; Kinugasa, Y. Spatial and temporal variation of aseismic creep along the dilational jog of the West Valley Fault, Philippines: Hazard implications. Front. Earth Sci. 2022, 10, 935161. [Google Scholar] [CrossRef]
  3. Rimando, R.E.; Knuepfer, P.L.K. Tectonic control of aseismic creep and potential for induced seismicity along the West Valley Fault in southeastern Metro Manila, Philippines. GeoHazards 2024, 5, 1172–1189. [Google Scholar] [CrossRef]
  4. Rimando, R.E.; Knuepfer, P.L. Neotectonics of the Marikina Valley fault system (MVFS) and tectonic framework of structures in northern and central Luzon, Philippines. Tectonophysics 2006, 415, 17–38. [Google Scholar] [CrossRef]
  5. Arcilla, C.A.; Ruelo, H.B.; Umbal, J. The Angat ophiolite, Luzon, Philippines: Lithology, structure, and problems in age interpretation. Tectonophysics 1989, 168, 127–135. [Google Scholar] [CrossRef]
  6. Seno, T.; Stein, S.; Gripp, A.E. A model for the motion of the Philppine Sea Plate consistent with NUVEL-1 and geological data. J. Geophys. Res. 1993, 98, 17941–17948. [Google Scholar] [CrossRef]
  7. Philippine Institute of Volcanology and Seismology (PHIVOLCS). Available online: https://www.phivolcs.dost.gov.ph/ (accessed on 15 August 2024).
  8. National Mapping and Resource Information Authority (NAMRIA). Available online: https://www.namria.gov.ph/ (accessed on 15 August 2024).
  9. General Bathymetric Chart of the Oceans (GEBCO). Available online: https://www.gebco.net (accessed on 15 August 2024).
  10. Holzer, T.L. Ground failure induced by ground-water withdrawal from unconsolidated sediment. In Man-Induced Land Subsidence; Holzer, T., Ed.; Reviews in Engineering Geology; Geological Society of America: Boulder, CO, USA, 1984; Volume 6, pp. 67–105. [Google Scholar]
  11. Sandoval, J.P.; Bartlett, S.R. Land subsidence and earth fissuring on the Central Arizona Project, Arizona. In Proceedings of the Fourth International Symposium on Land Subsidence, Houston, TX, USA, 12–17 May 1991; pp. 249–260. [Google Scholar]
  12. Geng, D.-Y.; Li, Z.-S. Ground fissure hazards in USA and China. Acta Seismol. 2000, 13, 466–476. [Google Scholar] [CrossRef]
  13. Wang, G.Y.; You, G.; Shi, B.; Qiu, Z.L.; Li, H.Y.; Tuck, M. Earth fissures in Jiangsu Province, China and geological investigation of Hetang earth fissure. Environ. Earth Sci. 2010, 60, 35–43. [Google Scholar] [CrossRef]
  14. Wang, G.Y.; You, G.G.; Shi, B.; Wu, S.L.; Wu, J.Q. Large differential land subsidence and earth fissures in Jiangyin, China. Environ. Earth Sci. 2010, 61, 1085–1093. [Google Scholar] [CrossRef]
  15. Phien-wej, N.; Giao, P.H.; Nutalaya, P. Land subsidence in Bangkok, Thailand. Eng. Geol. 2006, 82, 187–210. [Google Scholar] [CrossRef]
  16. Gambolati, G.; Frezze, R.A. Mathematical simulation of the subsidence of Venice: Theory. Water Resour. Res. 1973, 9, 721–733. [Google Scholar] [CrossRef]
  17. Adrian, O.G.; Rudolph, D.L.; Cherry, J.A. The analysis of long-term land subsidence near Mexico City: Field investigations and predictive modeling. Water Resour. Res. 1999, 35, 3327–3341. [Google Scholar] [CrossRef]
  18. Pacheco, J.; Arzate, J.; Rojas, E.; Arroyo, M.; Yutsis, V.; Ochoa, G. Delimitation of ground failure zones due to land subsidence using gravity data and finite element modeling in the Querétaro valley, México. Eng. Geol. 2006, 84, 143–160. [Google Scholar] [CrossRef]
  19. Martínez-Reyes, J.; Nieto-Samaniego, A.F. Efectos geológicos de la tectónica reciente en la parte central de México. Rev. Mex. De Cienc. Geológicas 1990, 9, 33–50. [Google Scholar]
  20. Rimando, R.E.; Knuepfer, P.L.K. Earthquake history and rupture extents from morphology of fault scarps along the Valley Fault System (Philippines). GeoHazards 2025, 6, 23. [Google Scholar] [CrossRef]
  21. Hernández-Madrigal, V.M.; Muñiz-Jáuregui, J.A.; Garduño-Monroy, V.H.; Flores-Lázaro, N.; Figueroa-Miranda, S. Depreciation factor equation to evaluate the economic losses from ground failure due to subsidence related to groundwater withdrawal. Nat. Sci. 2014, 6, 108–113. [Google Scholar] [CrossRef]
  22. Bureau of Mines and Geosciences. Geology and Mineral Resources of the Philippines, 1st ed.; Bureau of Mines and Geosciences: Manila, Philippines, 1981; pp. 152–153. [Google Scholar]
  23. Cest, Inc. Water Resources assessment for prioritized critical areas (Phase 1): Final report; submitted to the National Water Resources Board, Unpublished work; Cest, Inc.: Metro Manila, Philippines, 2004. [Google Scholar]
  24. Clemente, R.S.; Abracosa, R.P.; David, C.C.; Inocencio, A.B.; Tabios, G.Q. Metro Manila and Metro Cebu Groundwater Assessment; PIDS Discussion Paper Series, No. 2001-05; Philippine Institute for Development Studies: Makati City, Philippines, 2001. [Google Scholar]
  25. Zanoria, E. The Depositional and Volcanological Origin of the Diliman Volcaniclastic Formation, Southwestern Luzon, Philippines. Master’s Thesis, University of Illinois at Chicago, Chicago, IL, USA, 1988. [Google Scholar]
  26. Punongbayan, R.S.; Rimando, R.E. Detailed mapping of active faults in the Fort Bonifacio area and vicinity: Project Terminal Report. Metro Manila, Philippines. submitted to the Department of Science and Technology, Unpublished work. 1996. [Google Scholar]
  27. Rimando, R.E.; Panol, M.D.; Daligdig, J.A.; Lanuza, L.; Besana, G.M.; Takezono, M. Aseismic slip of the Marikina fault in Metro Manila, Philippines (abstract). EOS 2000, 81, WP147. [Google Scholar]
  28. Ambraseys, N.N. Some characteristic features of the Anatolian fault zone. Tectonophysics 1970, 9, 143–165. [Google Scholar] [CrossRef]
  29. Savage, J.C.; Prescott, W.H.; Lisowski, M.; King, N. Geodolite measurements of deformation near Hollister, California, 1971–1978. J. Geophys. Res. 1979, 84, 7599–7615. [Google Scholar] [CrossRef]
  30. Burford, R.O.; Harsh, P.W. Slip on the San Andreas fault in central California from alinement array surveys. Bull. Seismol. Soc. Am. 1980, 70, 1233–1261. [Google Scholar] [CrossRef]
  31. Yu, S.B.; Liu, C.C. Fault creep on the central segment of the Longitudinal Valley fault, eastern Taiwan. Proc. Geol. Soc. China 1989, 32, 209–231. [Google Scholar]
  32. Lienkaemper, J.J.; Borchardt, G.; Lisowski, M. Historic creep rate and potential for seismic slip along the Hayward fault, California. J. Geophys. Res. 1991, 96, 18261–18283. [Google Scholar] [CrossRef]
  33. Kelson, K.I.; Simpson, G.D.; Lettis, W.R.; Haraden, C.C. Holocene slip rate and earthquake recurrence of the northern Calaveras fault at Leyden Creek, northern California. J. Geophys. Res. 1996, 101, 5961–5975. [Google Scholar] [CrossRef]
  34. Stenner, H.D.; Ueta, K. Looking for evidence of large surface rupturing events on the rapidly creeping Southern Calaveras fault, California. In Proceeding of the Hokudan International Symposium and School on Active Faulting, Hokudan-cho, Awaji Island, Japan, 18–26 January 2000; pp. 479–486. [Google Scholar]
  35. Kurita, K.; Kinugasa, Y.; Rimando, R.E.; Papiona, K. Continuous monitoring of the fault creeping on Marikina Valley fault system (MVFS), Metro Manila, Philippines. Res. Rep. Tokyo Metrop. Coll. Ind. Technol. 2011, 5, 6–9. [Google Scholar]
  36. Kurita, K.; Kinugasa, Y.; Deguchi, T.; Rimando, R.E. Monitoring of ground deformation in southern part of Metro Manila, Philippines. In Advances in Civil Engineering and Building Materials; Chang, S., Al Bahar, S., Zhao, J., Eds.; Taylor & Francis Group: London, UK, 2012; pp. 437–440. [Google Scholar] [CrossRef]
  37. Kurita, K.; Kinugasa, Y.; Deguchi, T.; Rimando, R. Monitoring of active fault in south-east part of Metro Manila, Philippines. Res. Rep. Tokyo Metrop. Coll. Ind. Technol. 2015, 9, 41–45. [Google Scholar]
  38. Kurita, K.; Kinugasa, Y.; Deguchi, T.; Rimando, R.E.; Watanabe, M. Monitoring aseismic surface creep along the Western Valley (Marikina) Fault. In Proceedings of the 11th International Workshop on Seismic Microzoning and Risk Reduction, Granada, Spain, 22–24 October 2016; pp. 1–5. Available online: https://www.researchgate.net/publication/333891626_Monitoring_Aseismic_Surface_Creep_along_the_Western_Valley_Marikina_Fault (accessed on 15 February 2025).
  39. Kurita, K.; Kinugasa, Y.; Rimando, R.E.; Garduque, J.R. Monitoring of ground deformation along the Marikina Valley fault system, Manila, Philippines. In Proceedings of the 12th International Workshop on Seismic Microzoning and Risk Reduction, Lima, Peru, 5–8 September 2018; Kanagawa University: Yokohama, Japan, 2018; pp. 1–7. [Google Scholar]
  40. Foulger, G.R.; Wilson, M.P.; Gluyas, J.G.; Julian, B.R.; Davies, R.J. Global review of human-induced earthquakes. Earth Sci. Rev. 2018, 178, 438–514. [Google Scholar] [CrossRef]
  41. Wilson, M.P.; Foulger, G.R.; Gluyas, J.G.; Davies, R.J.; Julian, B.R. HiQuake: The human-induced earthquake database. Seismol. Res. Lett. 2017, 88, 1560–1565. [Google Scholar] [CrossRef]
  42. Wu, W. A review of unloading-induced fault instability. Undergr. Space 2021, 6, 528–538. [Google Scholar] [CrossRef]
  43. Pennington, W.D.; Davis, S.D.; Carlson, S.M.; Dupree, J.; Ewing, T.E. The evolution of seismic barriers and asperities caused by the depressuring of fault planes in oil and gas fields of South Texas. Bull. Seismol. Soc. Am. 1986, 76, 939–948. [Google Scholar]
  44. Nicolau, V.; Miholca, C.; Andrei, M. Fuzzy rules of sound speed influence on ultrasonic sensing in outdoor environments. In Proceedings of the 3rd International Workshop on Soft Computing Applications, Szeged-Arad, Romania, 29 July–1 August 2009; Institute of Electrical and Electronics Engineers: Piscataway, NJ, USA, 2009; pp. 145–150. [Google Scholar]
  45. Panda, G.; Agrawal, D.; Nshimiyimana, A.; Hossain, A. Effects of environment on accuracy of ultrasonic sensor operates in millimetre range. Perspect. Sci. 2016, 8, 574–576. [Google Scholar] [CrossRef]
  46. Bohn, D.A. Environmental effects on the speed of sound. J. Audio Eng. Soc. 1988, 36, 223–231. [Google Scholar]
  47. World Weather Online. Available online: https://www.worldweatheronline.com/binan-weather-averages/laguna/ph.aspx (accessed on 15 August 2024).
  48. Philippine Atmospheric, Geophysical and Astronomical Services Administration. Available online: https://www.pagasa.dost.gov.ph/climate/tropical-cyclone-associated-rainfall (accessed on 15 August 2024).
  49. National Water Resources Board (Resolution No. 001-0904: Policy Recommendations for Metro Manila Critical Areas). Available online: https://nwrb.gov.ph/wp-content/uploads/2023/01/BR_001-0904.pdf (accessed on 3 February 2025).
  50. Gonzalez, E.B. Tropical cyclones and storm surges. In Proceedings of the National Conference on Natural Disaster Mitigation in the Philippines, Quezon City, Philippines, 19–20 October 1994; Punongbayan, R.S., Ed.; Philippine Institute of Volcanology and Seismology: Quezon City, Philippines, 1994; pp. 11–18. [Google Scholar]
  51. Roeloffs, E. Creep rate changes at Parkfield, California 1966–1999: Seasonal, precipitation induced, and tectonic. J. Geophys. Res. 2001, 106, 16525–16547. [Google Scholar] [CrossRef]
  52. Guglielmi, Y.; Cappa, F.; Avouac, J.P.; Henry, P.; Elsworth, D. Seismicity triggered by fluid injection-induced aseismic slip. Science 2015, 348, 1224–1226. [Google Scholar] [CrossRef]
  53. Holzer, T.L.; Davis, S.N.; Lofgren, B.E. Faulting caused by groundwater extraction in southcentral Arizona. J. Geophys. Res. 1979, 84, 603–612. [Google Scholar] [CrossRef]
  54. Segall, P. Earthquakes triggered by fluid extraction. Geology 1989, 17, 942–946. [Google Scholar] [CrossRef]
  55. Segall, P. Stress and subsidence resulting from subsurface fluid withdrawal in the epicentral region of the 1983 Coalinga earthquake. J. Geophys. Res. 1985, 90, 6801–6816. [Google Scholar] [CrossRef]
  56. Segall, P. Induced stresses due to fluid extraction from axisymmetric reservoirs. Pure Appl. Geophys. 1992, 139, 535–560. [Google Scholar] [CrossRef]
  57. Schulz, S.; Burford, R.O.; Mavko, B. Influence of Seismicity and Rainfall on Episodic Creep on the San Andreas Fault System in Central California. J. Geophys. Res. 1983, 88, 7475–7484. [Google Scholar] [CrossRef]
  58. Lee, J.C.; Angelier, J.; Chu, H.T.; Hu, J.C.; Jeng, F.S. Continuous monitoring of an active fault in a plate suture zone: A creepmeter study of the Chihshang Fault, eastern Taiwan. Tectonophysics 2001, 333, 219–240. [Google Scholar] [CrossRef]
  59. Lee, J.C.; Angelier, J.; Chu, H.T.; Hu, J.C.; Jeng, F.S. Monitoring active fault creep as a tool in seismic hazard mitigation: Insights from creepmeter study at Chihshang, Taiwan. Tectonophysics 2005, 337, 1200–1207. [Google Scholar] [CrossRef]
  60. Kundu, B.; Vissa, N.K.; Gahalaut, V.K. Influence of anthropogenic groundwater unloading in Indo-Gangetic plains on the 25 April 2015 Mw 7.8 Gorkha, Nepal earthquake. Geophys. Res. Lett. 2015, 42, 10607–10613. [Google Scholar] [CrossRef]
  61. Kundu, B.; Vissa, N.K.; Gahalaut, K.; Gahalaut, V.K.; Panda, D.; Malik, K. Influence of anthropogenic groundwater pumping on the 2017 November 12 M7.3 Iran-Iraq border earthquake. Geophys. J. Int. 2019, 218, 833–839. [Google Scholar] [CrossRef]
  62. Tiwari, D.K.; Jha, B.; Kundu, B.; Gahalaut, V.K.; Vissa, N.K. Groundwater extraction-induced seismicity around Delhi region, India. Sci. Rep. 2021, 11, 10097. [Google Scholar] [CrossRef] [PubMed]
  63. Lui, S.K.Y.; Huang, Y.; Young, R.P. The role of fluid pressure-induced aseismic slip in earthquake cycle modulation. J. Geophys. Res. Solid Earth 2021, 126, e2020JB021196. [Google Scholar] [CrossRef]
  64. Gonzalez, P.J.; Tiampo, K.F.; Palano, M.; Cannavo, F.; Fernandez, J. The 2011 Lorca earthquake slip distribution controlled by groundwater crustal unloading. Nat. Geosci. 2012, 5, 821–825. [Google Scholar] [CrossRef]
  65. Amos, C.B.; Audet, P.; Hammond, W.C.; Bürgmann, R.; Johanson, I.A.; Blewitt, G. Uplift and seismicity driven by groundwater depletion in central California. Nature 2014, 509, 483–486. [Google Scholar] [CrossRef]
  66. Scholz, C.; Engelder, J.T. The role of asperity indentation and ploughing in rock friction. I. Asperity creep and stick slip. Int. J. Rock Mech. Min. Sci. 1976, 13, 149–154. [Google Scholar] [CrossRef]
  67. Aki, K. Characterization of barriers on an earthquake fault. J. Geophys. Res. 1979, 84, 6140–6148. [Google Scholar] [CrossRef]
  68. Lay, T.; Kanamori, H.; Ruff, L. The asperity model and the nature of large subduction zone earthquakes. Earthq. Predict. Res. 1982, 1, 3–71. [Google Scholar]
  69. Sibson, R.H. Rupture interaction with fault jogs. In Earthquake Source Mechanics; Das, S., Boatwright, J., Scholz, C.H., Eds.; American Geophysical Union: Washington, DC, USA, 1986; Volume 37, pp. 157–168. [Google Scholar] [CrossRef]
  70. Sibson, R.H. Effects of fault heterogeneity on rupture propagation. In Directions in Paleoseismology, Proceedings of Conference XXXIX, Albuquerque, NM, USA, 22–25 April 1987; Crone, A., Omdahl, E., Eds.; United States Geological Survey: Denver, CO, USA, 1987. [Google Scholar]
  71. Nelson, A.R.; Personius, S.F.; Rimando, R.E.; Punongbayan, R.S.; Tungol, N.; Mirabueno, H.; Rasdas, A. Multiple large earthquakes in the past 1500 years on a fault in metropolitan Manila, the Philippines. Bull. Seismol. Soc. Am. 2000, 90, 73–85. [Google Scholar] [CrossRef]
  72. Perkins, D.M. Contagious fault rupture, probabilistic hazard, and contagion observability. In Directions in Paleoseismology, Proceedings of Conference XXXIX, Albuquerque, NM, USA, 22–25 April 1987; Crone, A.J., Omdahl, E.M., Eds.; United States Geological Survey: Denver, CO, USA, 1987; pp. 428–439. Available online: https://pubs.usgs.gov/of/1987/0673/report.pdf (accessed on 16 January 2025).
Figure 3. (a) The LVDT and ultrasonic creepmeter set-up at the Juana Subdivision (JUA in Figure 2) monitoring site. Photo taken on 22 April 2022. (b) The US-100 and LVDT creepmeter controller assemblies and sensors. (c) Schematic representation of the creepmeter set-up and location of precise leveling stations at JUA. The creepmeter platform lies parallel to the leveling survey line.
Geohazards 06 00055 g003
Figure 4. The LVDT creepmeter set-up at the Villa Olympia Subdivision (VOS in Figure 2) monitoring site. (a) The LVDT creepmeter is installed across the ground rupture on the right side of the road. (b) The rain gauge assembly installed beside the LVDT creepmeter. (c) Schematic representation of the LVDT creepmeter set-up and location of precise leveling stations at VOS. Photos taken in June 2024.
Geohazards 06 00055 g004
Figure 5. Results of laboratory testing to determine accuracy of the LVDT creepmeter and the ultrasonic creepmeters. (a) Correlation between distance measured and the electric output of the LVDT creepmeter. (b) Plot of actual distance vs. distance measured by the ultrasonic creepmeter.
Geohazards 06 00055 g005
Figure 11. (a) Abrupt change in displacement in early January 2014 at VOS occurred in response to intense precipitation days before. Source: [37]. (b) Temporal changes in ground deformation (red in the upper diagram), temperature (blue in the upper diagram), and rainfall (lower diagram) at NPC-B. In the case of NPC-B, changes in displacement for the period from September 2008 to January 2009 is related to rain fall. However, there is no such relation for the period starting May 2009, which coincides with the onset of the rainy season. Therefore, correlation between displacement and rainfall does not appear to be strong. Source: [35,37].
Geohazards 06 00055 g011
Disclaimer/Publisher’s Note: The statements, opinions and data contained in all publications are solely those of the individual author(s) and contributor(s) and not of MDPI and/or the editor(s). MDPI and/or the editor(s) disclaim responsibility for any injury to people or property resulting from any ideas, methods, instructions or products referred to in the content.