Article

Assessing Post-Fire Rockfall Hazards: A Case Study of Hazard System Adaptation and Application in Evros, Greece

Department of Civil Engineering, Democritus University of Thrace, 67100 Xanthi, Greece
*
Author to whom correspondence should be addressed.
GeoHazards 2025, 6(3), 54; https://doi.org/10.3390/geohazards6030054
Submission received: 22 July 2025 / Revised: 29 August 2025 / Accepted: 5 September 2025 / Published: 8 September 2025

Abstract

The impacts of climate change, including rising temperatures and severe droughts, have intensified wildfires globally, with increased frequency, severity, and extent. Forests reduce the occurrence of rockfalls and increase their intensity since the slope’s vegetation constrains the trajectory. Consequently, the destruction of vegetation following a wildfire may potentially cause higher and more intense rockfall activity. In this paper, we first evaluate the effects of forest destruction on a local scale by studying a specific site impacted by the 2023 Evros Wildfire, aiming to identify the key factors. Next, we modify existing rockfall hazard rating systems to incorporate these key factors in a user-friendly way. Finally, we apply this system on a regional scale to the area affected by the 2023 Evros Wildfire. The modified system produced results indicating a significant increase in exposure and risk following the wildfire. This information helps to identify vulnerable sites and prioritize them systematically, facilitating informed decision-making regarding restoration strategies.

1. Introduction

On 19 August 2023, in the Evros region in the northeastern part of Greece, the largest wildfire ever recorded in Europe since 2000 broke out. The fire resulted from merging two incidents on 19 August and 23 August, ultimately burning over 90,000 hectares. Between 21 and 23 August, the fire expanded at an explosive rate, burning more than 55,000 hectares in just 48 h, an area that accounts for nearly 60% of the total burned land. The rapid spread of the wildfire was significantly facilitated by the extremely dry atmospheric conditions and the prolonged drought that had influenced the border region in the months leading up to the fire event [1].
There has been a significant increase in forest fires worldwide in recent years. The impacts of climate change, such as rising temperatures and intense droughts, contribute to such phenomena, affecting the frequency, severity, and extent of wildfires [2,3]. Wildfires have significant economic and social impacts, causing extensive damage to infrastructure, triggering evacuations, and even threatening human lives while also being linked to major environmental consequences [4]. The immediate impacts may trigger other hazards and extreme events. Wildfires may increase susceptibility, magnitude, and impact zone of geohazards, such as landslides and rockfalls, and trigger a destructive reaction with severe consequences [5].
Despite the recognized link between wildfires and rockfall activity, existing rockfall hazard rating systems do not account for post-fire conditions. There is a lack of a wildfire-integrated framework to assess how vegetation loss influences rockfall occurrence and severity. This gap motivated the development of FiRo-RiS, a practical system designed to incorporate post-wildfire impacts into rockfall assessment, enabling more accurate identification of vulnerable sites and informed prioritization of restoration strategies.

1.1. Rockfall Activity and the Effects of Wildfires

Rockfall occurrence is influenced by multiple factors, including slope characteristics such as slope gradient, geology, weathering, and vegetation, as well as external factors like climate, seismic activity, and the impact of human activities [6]. Several studies in the literature report an increase in rockfall activity during and after wildfires [4,7,8,9,10], which alters both the detachment area and the propagation zone. Key changes induced by wildfire include the fragmentation of rock exposures due to high temperatures accompanied by changes in mechanical properties, the loss of the protective function of vegetation, the impact of firefighting activities, and/or the effect of extreme heat on existing protective measures [10,11].
In rockfall-prone areas, various measures may be implemented to reduce risk. These include structural protection measures, land-use planning, early warning systems, and biological measures. Among the latter, protective forests are particularly important in mountainous terrains, where they act as natural barriers that reduce the frequency and intensity of rockfall events [12,13,14]. Additionally, their presence renders artificial protective measures more cost-effective or even unnecessary [6]. Protective forests can decrease rockfall occurrence by up to 90% and reduce their intensity by up to 70%, depending on factors such as forest coverage area, density, and diameter of the tree, trunk arrangement, and the volume of rock blocks [12]. The protective effect of forests against rockfalls has been the subject of extensive studies [6,12,13,14,15,16,17,18,19], focusing on the physical, mechanical, and biological functions of trees as barriers that slow down or stop falling rock blocks.
The structure and composition of forests can change abruptly and significantly after wildfires, substantially affecting their protective capacity against rockfalls [20]. The impact of wildfire on vegetation depends on the intensity and duration of the fire [10]. The loss of vegetation causes an increase in rockfall events [7,8], which appears to be more pronounced in the weeks or months following the wildfire, and becomes intensified after periods of heavy rainfall.
Numerous case studies across different regions support these observations. In Southern Italy, wildfire-induced root destruction and thermal stress on geomaterials significantly increased the likelihood of block detachment [21]. De Graff et al. [8], investigating mountainous areas of the U.S., emphasized the role of post-fire erosion processes in slope destabilization. In Hallstatt, Austria, the 2018 wildfire led to increased rockfall activity due to burned roots, falling trees, and heat-induced soil weakening [9]. Literature reviews by Sarro et al. [11] and Perez-Rey et al. [10] further confirm that wildfires intensify both the frequency and intensity of rockfalls by altering rock mass properties, degrading forest cover, and damaging protective infrastructure.

1.2. Rockfall Hazard Assessment Methods

Several methodologies exist to assess rockfall hazards, which are discerned into two main categories: qualitative and quantitative [22]. Qualitative methods are based on descriptive or classified criteria, typically expressed in terms such as “high,” “moderate,” or “low” hazard. These methods require less data and can be applied more quickly, making them suitable for preliminary assessments of areas with limited available data. However, the main drawbacks of qualitative methods are subjectivity and lack of precision. Conversely, quantitative approaches rely on numerical analyses and probability assessments, providing greater precision but requiring extensive data, sophisticated models, higher costs, and more effort [23]. When adequate data are accessible, these methods are preferable for detailed site-specific analyses.
Among the qualitative methods, classification systems prevail. These systems categorize slopes based on their gradient, rock mass characteristics, climatic factors, and others. They have proven particularly useful for road networks, where slopes are ranked to prioritize and implement rockfall mitigation measures.
In the late 1980s, the Oregon Department of Transportation developed the first standardized rockfall hazard assessment system, known as the Rockfall Hazard Rating System (RHRS) [24]. RHRS is a standardized tool for evaluating and ranking rockfall hazards along road networks, created to address the need for a systematic approach to managing the risks posed by rockfalls, especially in mountainous regions. The RHRS includes a preliminary phase for slope classification, followed by a detailed evaluation of high-risk areas. In the detailed phase, each slope section is rated based on factors affecting rockfall hazard and risk, including slope height, ditch effectiveness, average traffic exposure, sight distance, road width, geological conditions, and the size of rock blocks. These parameters are rated on an exponential scale (from 3 to 81 points), depending on the severity of the risk. Therefore, RHRS assesses and ranks rockfall hazard, focusing on geological, climatic, road characteristics, as well as the consequences of failure.
Defining a natural hazard requires assessing susceptibility, magnitude, intensity, potential run-out area, and frequency [25]. Concerning rockfalls, geological features, properties of geomaterials, and weakening factors describe rockfall susceptibility. The volume of rock blocks expresses the magnitude of a rockfall. The event’s intensity is described by the kinetic energy or the velocity of the falling blocks and can be indirectly deduced from the detachment height. The run-out area is typically estimated through trajectory simulation or other parameters such as slope gradient and height. Finally, for the common case that a detailed historical rockfall inventory is absent, frequency is generally assessed based on general information and field observations, such as the presence of rock blocks at the slope base, impact marks on the slope face, or roadway damage. The original RHRS meets these requirements.
Over time, the need arose for the original RHRS to be adapted to geological and climatic conditions and the infrastructure of other areas. Therefore, various modifications of RHRS were implemented, both in the rating criteria and by introducing additional parameters to increase accuracy. Examples of such systems include the Rock Slope Rating Procedure (RSRP) [26], the Italian Modification of the Rockfall Hazard Rating System (mRHRS) [27], the Missouri Rockfall Hazard Rating System (MORFH RS) [28], the Ohio Rockfall Hazard Rating Matrix (ORHRM) [29], the Colorado Rockfall Hazard Rating System (CRHRS) [30], the Ontario Rockfall Hazard Rating System (RHRON) [31], the systems proposed by Saroglou et al. [32] and Eggers et al. [33], and others. However, there is a lack of a hazard assessment system that accounts for the effects of a wildfire.
The main objective of this research is to investigate the additional rockfall hazard and risk that emerged following the devastating 2023 Evros wildfire. For this purpose, a site with three distinct slopes affected by the wildfire, which hosts infrastructures and activities, was studied in detail. At these slopes, the impact of the wildfire on the occurrence of rockfalls and the characteristics of the rockfall trajectories were investigated, using the RockyFor3D software [34] to identify the critical parameters and their influence on trajectory length, both with and without vegetation. Subsequently, a new hazard and risk assessment system was developed by synthesizing and modifying existing systems to account for the effects of vegetation. This new system was then applied in the areas affected by the 2023 Evros Wildfire. In this way, a systematic hazard assessment and a comparative classification of hazardous sites were achieved, enabling the prioritization of risk mitigation actions against rockfalls based on quantified criteria.

2. Insights from the Site-Specific Study

2.1. Study Area Description

An extensive field investigation was conducted at three neighboring slopes in the settlement of Avantas, situated 11 km north of Alexandroupolis, to identify the key parameters and their interactions that influence rockfalls following a forest fire. Figure 1 depicts the relevant location of the study area within Greece (Figure 1a), along with the three slopes studied and other elements of interest in the study area (Figure 1b).
Avantas site was chosen based on specific geological, topographical, and environmental criteria that ensured its suitability for investigating post-wildfire rockfall hazards. The primary criterion for selecting this site was the presence of the steep slopes, mainly composed of fragmented limestone, which are susceptible to rockfalls. Additionally, the landscape experienced significant alterations due to fire, including loss of vegetation and potential thermal fracturing of the rock mass. Moreover, residents have reported the occurrence of rockfalls, and evidence of past activity is visible at the site. Beyond its geological and geomorphological features, the study area offers practical advantages. It is easily accessible, and relevant imagery can be found in public databases, allowing for a comparative assessment before and after the Evros 2023 wildfire.
The site is also critically important as rockfalls directly threaten nearby residential buildings and a key transportation route for Evros prefecture. The road serves as the primary access route to a vast area encompassing several settlements, agricultural activities, and military facilities. Any obstruction or damage to the road from rockfalls could significantly impact local communities and operations. By choosing this location, we aim to enhance our understanding of the post-wildfire rockfall mechanisms while providing valuable insights specific to this site.
The valley is characterized by hilly terrain featuring steep slopes and a stream that runs along the north–south axis. To the stream’s east is a hill with a maximum elevation of +340 m. On the west side of the stream, another hill rises to an elevation of +230 m. Due to the rocky terrain and steep inclines, the area is prone to rockfalls. The first two slopes are north of the settlement, with the Alexandroupolis–Mikro Dereio provincial road running between them.
Figure 2 compares the current condition of Slope 1 to its state before the fire. The slope has a mean gradient of 34° and features rocky outcrops, from which block fragments can detach. Older rockfall fragments are visible on the slope, and the vegetation has been destroyed after the wildfire.
Slope 2 hosts the historic castle of Avantas at its top. Its inclination varies by height; it has a mean gradient of 64° in the upper section, which becomes gentler in the lower part (mean gradient 30°). The stream at the base of this slope serves as a natural barrier against rockfalls. Slope 2 has also experienced vegetation destruction, as shown in Figure 3.
Slope 3 is situated on the northern side of the settlement and has a gentler inclination (mean gradient 24°) and greater slope roughness compared to Slopes 1 and 2. Residences are located at the base of the slope, making the rockfall exposure continuous. A residence that was destroyed by the fire is discernible (yellow circle) in Figure 4. Before the fire, the residence was barely visible due to the dense vegetation.

2.2. Field Deployment

We deployed to the field to gather all necessary information, including discontinuity measurements, Schmidt hammer hardness, vegetation type, size, and density. We also identified the size and location of previously detached blocks. Then, we composed the geological and vegetation maps of the site.
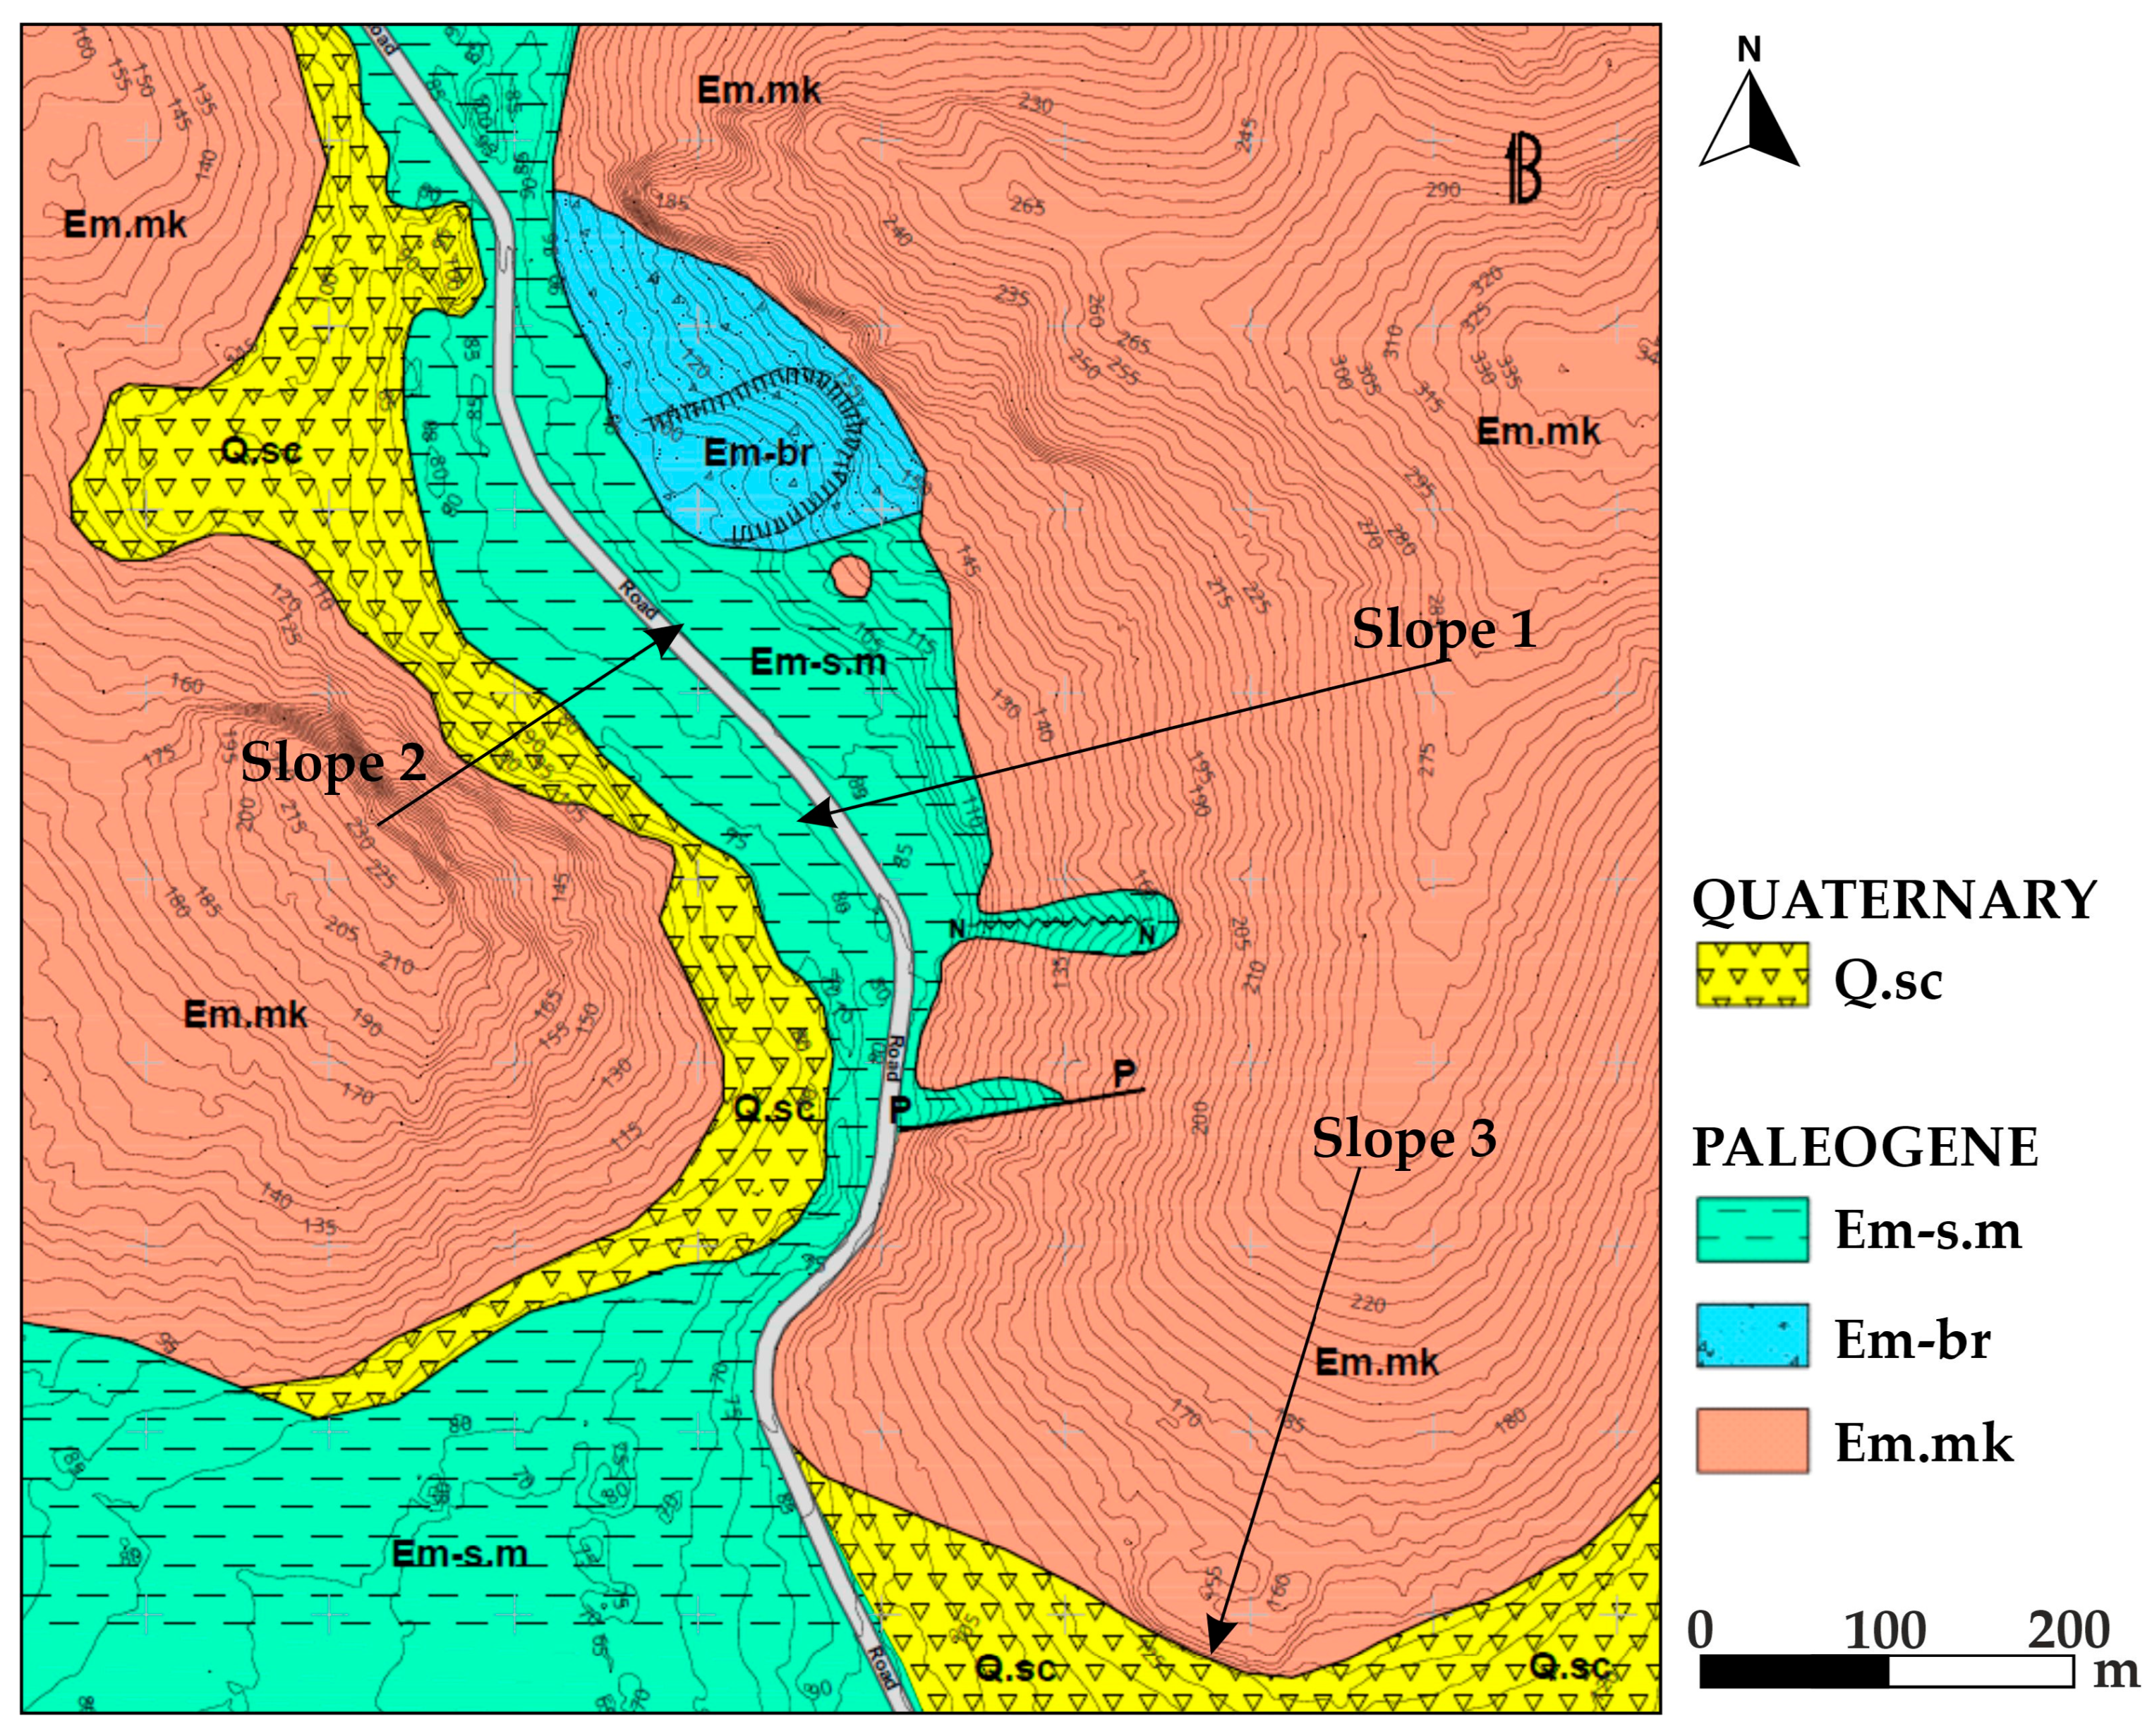
The geological mapping (Figure 5) was conducted at a scale of 1:5000, using the digital elevation model (DEM) from the Hellenic Cadastre as a topographic base in raster format with a 2 m grid. The area is dominated by unbedded, slightly to moderately weathered limestone (Em.mk), which, in places, is significantly fragmented and marls and clays with layers of sandstones (Em-s.m). At the foot of the slopes, scree deposits (Q.sc) are present, consisting mainly of marly limestone fragments, accompanied by soil erosion rills. Additionally, there is evidence of a rotational slide on the conglomeratic breccia (Em-br).
The prevalence of unbedded, slightly to moderately weathered limestone indicates that the existing joints primarily govern rockfall initiation, while weathering processes reduce shear strength along discontinuities and facilitate block detachment. To evaluate rockfall initiation, discontinuity measurements were conducted on the limestone face and processed using Dips v.8 software by RocScience [35]. The analysis revealed three main sets of discontinuities, which create conditions favorable for wedge and toppling failures, verifying the susceptibility to rockfalls.
We documented the detached blocks located at the base of the slopes. We measured the representative dimensions for each block in three perpendicular directions and calculated their volume, assuming a prismatic shape. Figure 6 displays the volume distribution of the blocks, which ranges from less than 0.01 m3 to over 50 m3. This volume corresponds to a mass varying from approximately 25 kg to more than 125 tons.
Surface hardness measurements were conducted using the Schmidt hammer to assess the impact of fire on the limestone rock mass. The investigation focused on neighboring limestone outcrops, comparing locations unaffected by the fire (unburnt outcrops) with those impacted (burnt outcrops). Three sets of measurements were conducted. The average Schmidt hardness value for the unburnt outcrops was 39.4, with a range of 18 to 46, while the burnt outcrops had an average value of 38.4, with a range of 18 to 48. Even though the surfaces exhibited fire-induced color blackening, they retained their original hardness and mechanical properties. Therefore, as evidenced by the Schmidt hardness measurements, the fire had no adverse effect on the surface characteristics of the limestone. Similar findings are reported in Melzner et al. [9], when assessing wildfire effects on rockfall occurrence. A detailed documentation of thermal effects on rock mass can be found in Sarro et al. [11].
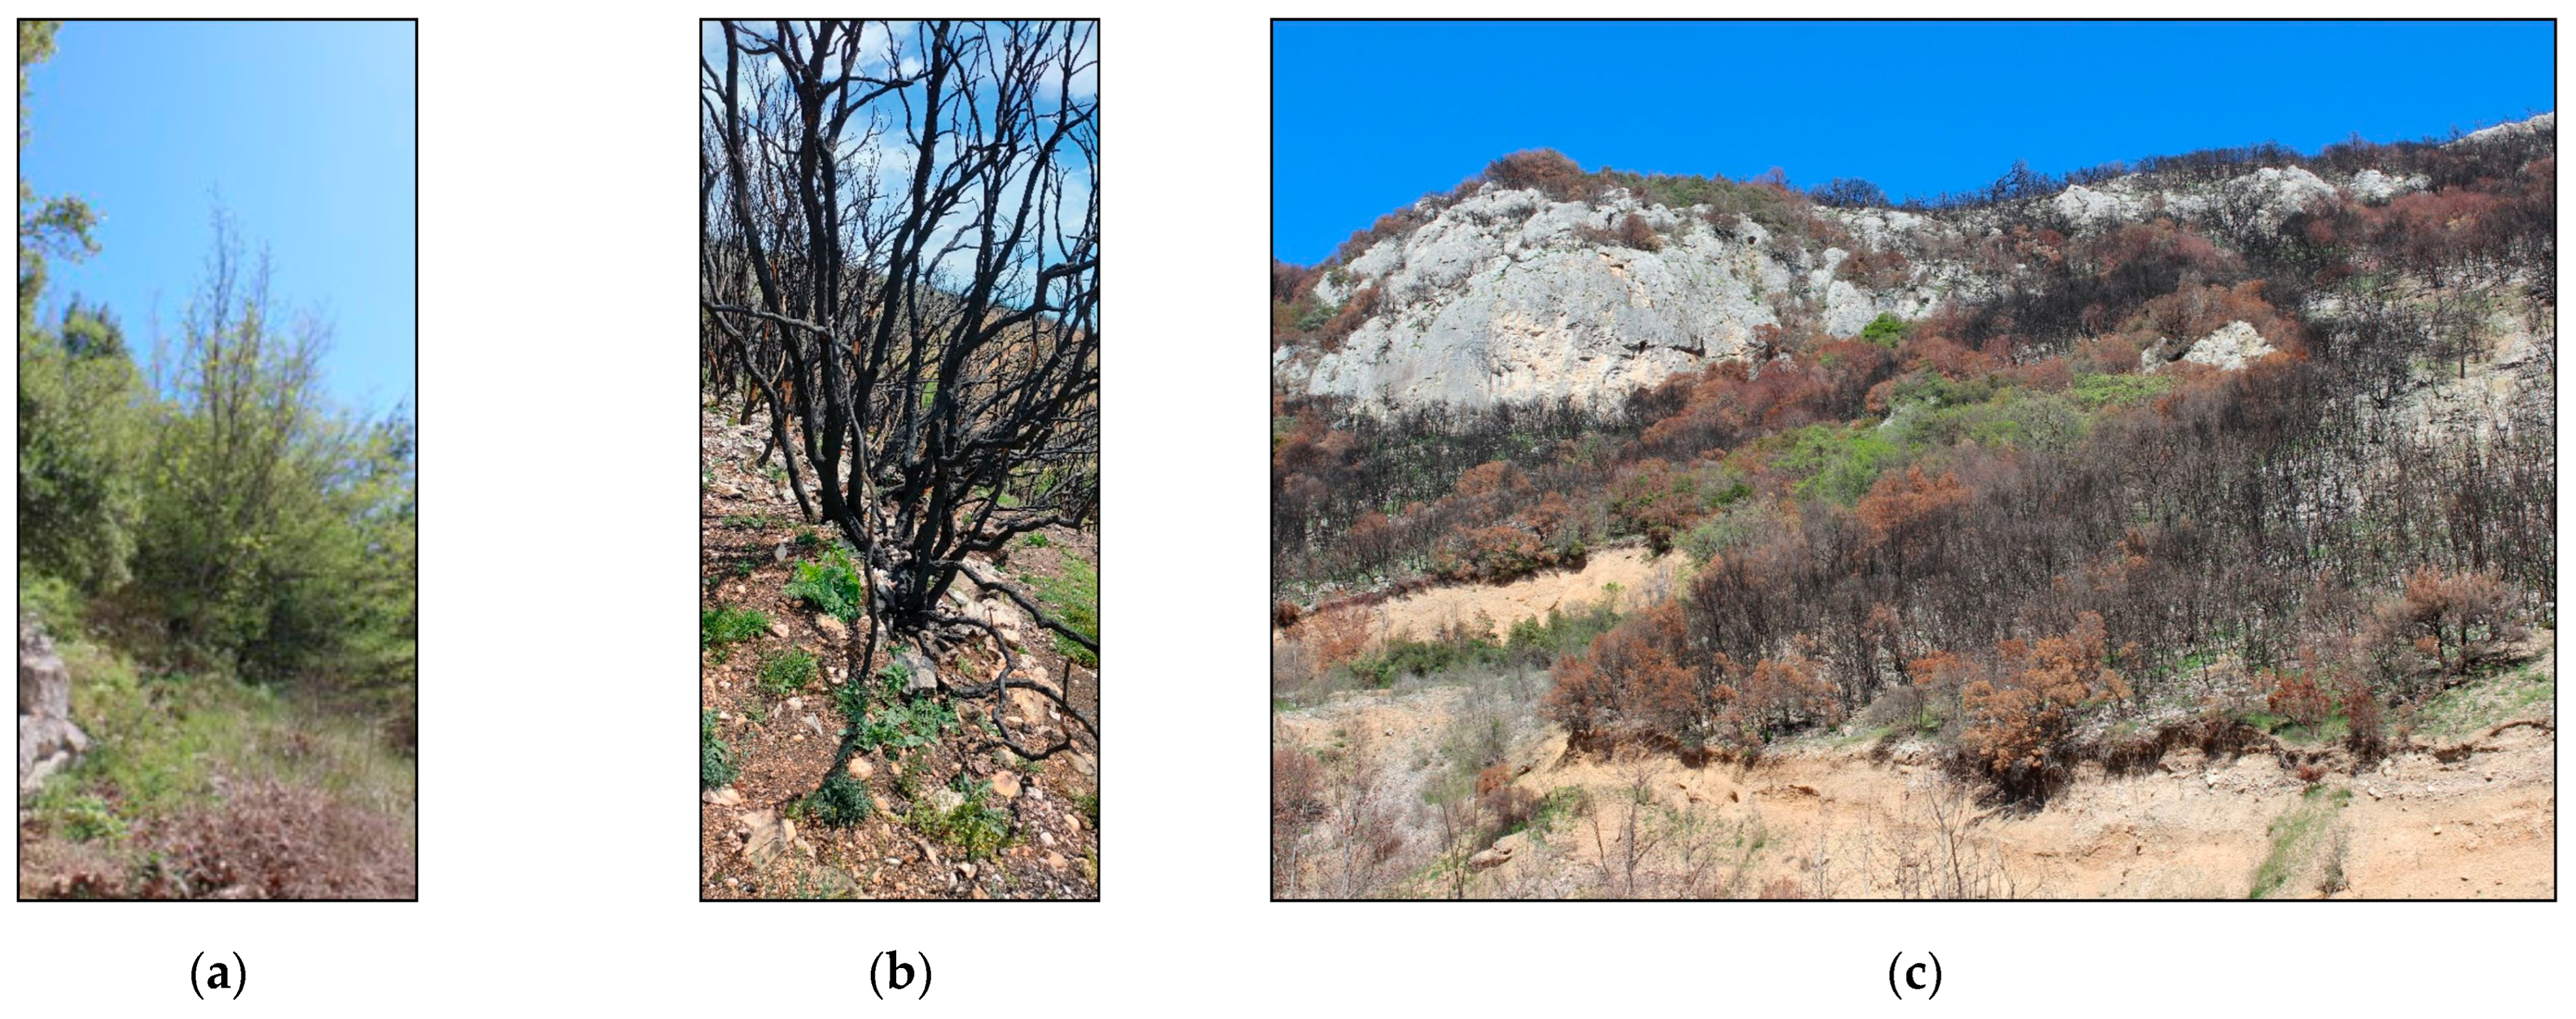
Vegetation is the main parameter that changes after a forest fire. To assess the condition of the vegetation, we examined characteristic areas that were not affected (Figure 7a) compared with areas that were burned (Figure 7b) within the broader region and with imagery available online before the fire, i.e., Google Maps. We examined square patches with approximately 4 m sides, selecting one burned and one unburned patch for each slope. Within each, we determined the tree type, the number of trees, height, and diameters at breast height (DBH).
The area is characterized by typical Mediterranean vegetation, which includes a diverse array of plant species. On Slopes 1 and 2, dense and low vegetation is dominant, featuring species such as kermes oak (Quercus coccifera) and juniper (Juniperus spp.). Additionally, shrubs like thyme (Thymus spp.) and rosemary (Rosmarinus officinalis) are common. The average density in these areas is 6875 stems per hectare, with an average stem diameter at breast height of less than 5 cm and a maximum height of up to 5 m. In Slope 3, the vegetation is similar but less dense, with 4625 stems per hectare. Furthermore, some pine trees are also present near the burned residence.
In the area surrounding the water stream, there are plane trees (Platanus orientalis), willows (Salix spp.), and poplars (Populus spp.). However, no rockfall hazard was identified in these areas, so no analyses were performed with such species.
The fire did not completely destroy the vegetation, as some tree trunks are only superficially burnt (Figure 7b), and some vegetation patches remain unburnt, as depicted in Figure 7c. This evidence suggests that the fire’s intensity was low and is consistent with the Schmidt hammer hardness results, which showed no measurable impact on the limestone outcrops.

2.3. Trajectory Μodeling

We analyzed possible rockfall trajectories in three-dimensional space using RockyFor3D v.6 software [34], which is a rockfall simulation tool that models trajectories, velocities, and energies on 3D terrain. It accounts for the effects of vegetation by simulating energy dissipation from tree impacts, considering factors such as tree density, diameter, and mechanical properties. This software has been successfully utilized for rockfall hazard assessments in forested areas, e.g., [16,36,37] and others.
RockyFor3D utilizes raster maps containing detailed information about a specific property within each map/cell. A total of 14 maps were created to define various elements, including topography, soil type, detachment source, block shape and size, slope roughness, and vegetation characteristics (such as density, height, diameter, and type).
The topography is defined using the area’s 2 m resolution Hellenic Cadastre raster map, and the soil type is assigned based on the geological mapping. The detachment source is assumed to be the apex of each slope, simulating the worst-case scenario in terms of trajectory kinematics. We released 10 blocks from every cell of the slope’s apex to conduct a statistical approach to the potential trajectories at each slope. Three raster maps determine the size of the blocks at the source cell, defining their height, width, and length. We assumed a rectangular shape in the analysis and simulated blocks with volumes of 0.01 m3 and 0.125 m3.
Four raster maps represent the vegetation, each depicting density, height, diameter, and type, compiled based on findings from field surveys. To assess the impact of vegetation, we analyzed two scenarios: the first scenario reflects the site’s vegetation before the fire. In contrast, the second scenario assumes that the fire completely destroyed the vegetation. Although the vegetation was not entirely burned, this assumption serves as a worst-case scenario for our evaluation.
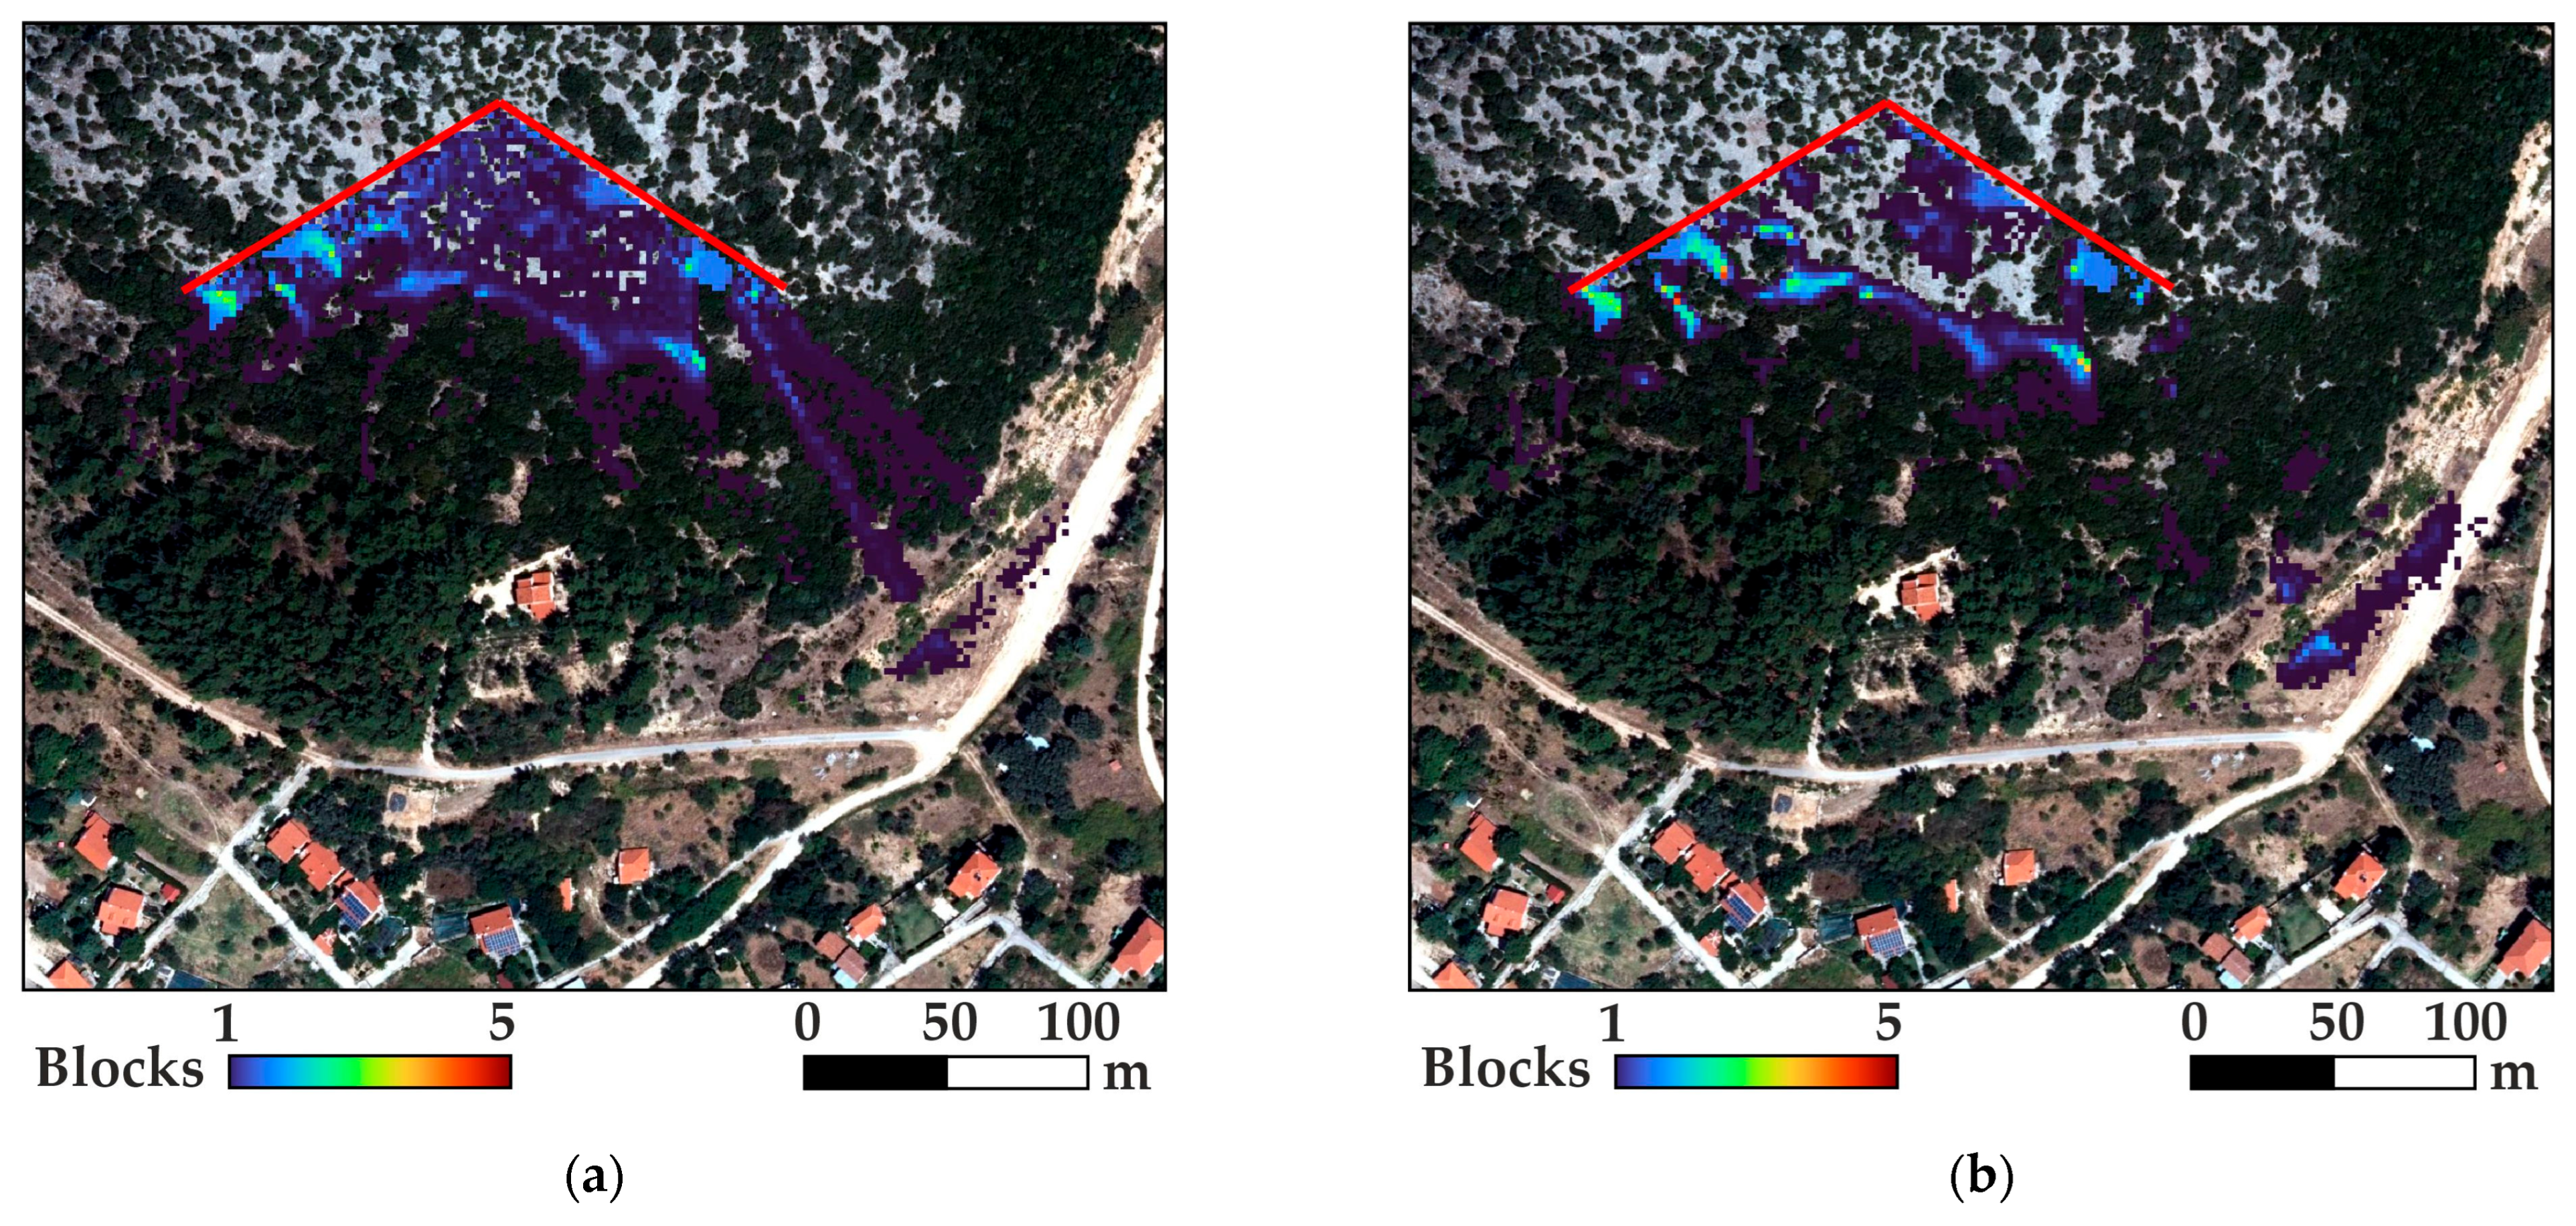
Figure 8, Figure 9, Figure 10 and Figure 11 display the trajectory endpoints overlaid on the orthophoto of the Hellenic cadastre captured before the fire. Both scenarios—one after the wildfire (without vegetation) and the other before the wildfire (with vegetation)—are presented side by side for easier comparison. The dots are color-coded based on the number of blocks that stop within each cell. The detachment source, i.e., the slope’s apex, is indicated with a red line.
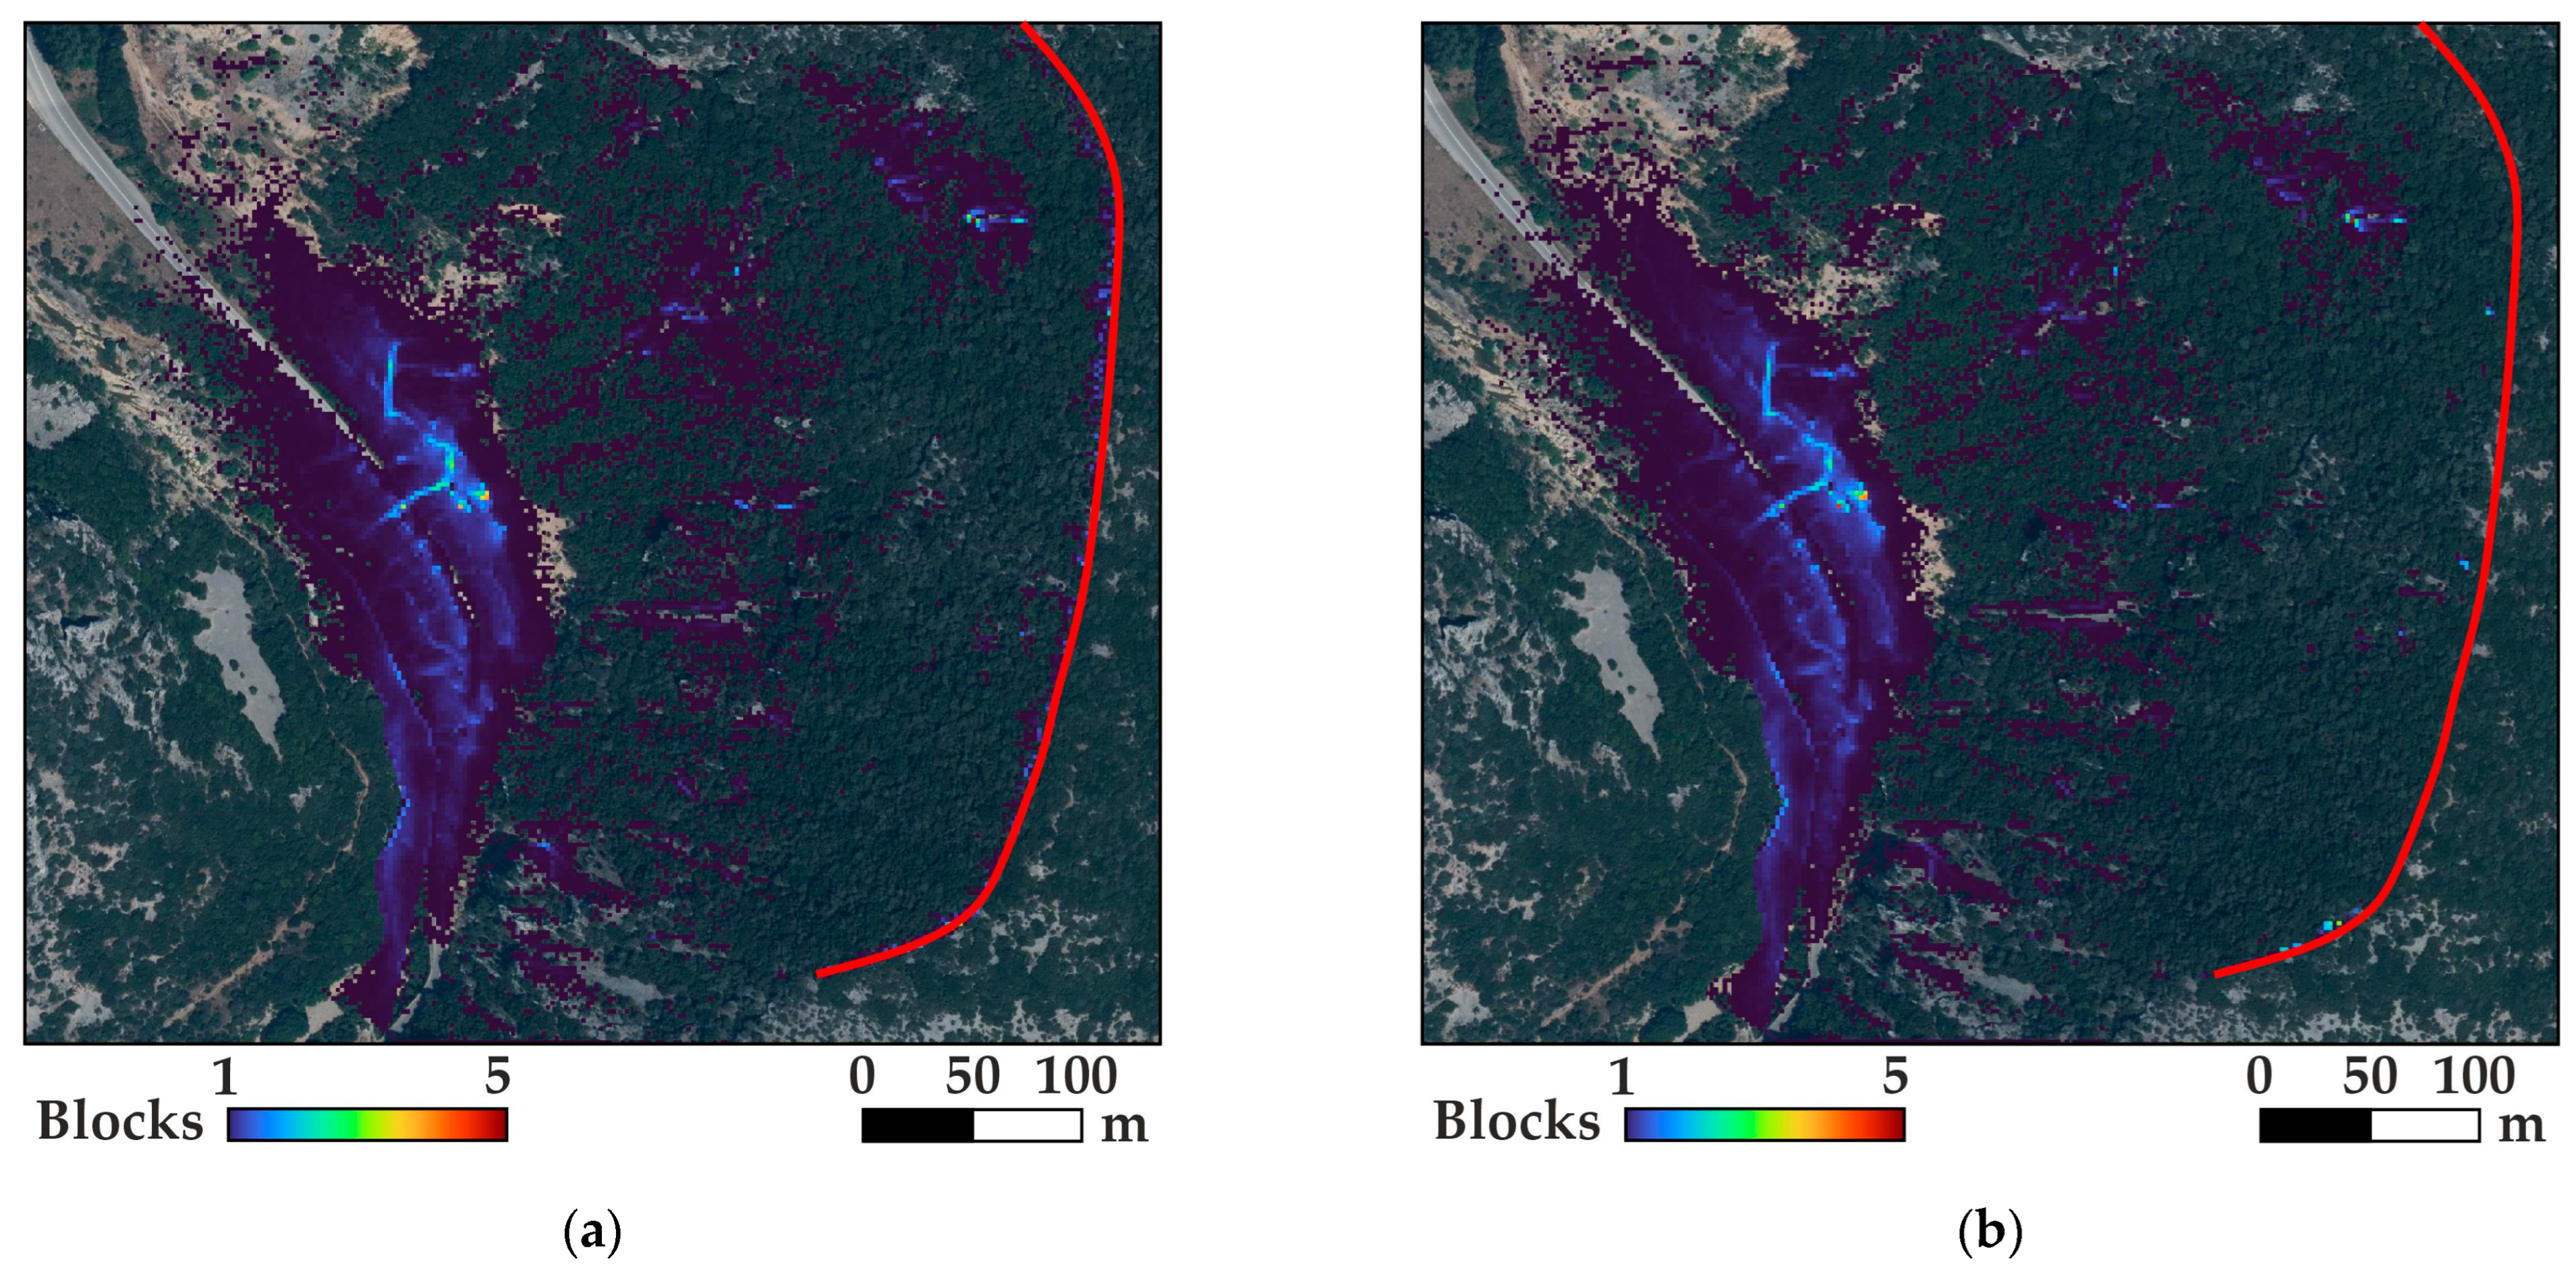
Figure 8 displays the endpoints of trajectories at Slope 1, using blocks with a volume of 0.01 m3. When vegetation is present (before the wildfire, Figure 8a), most blocks stop across the slope, and few reach the road. In the absence of vegetation (as shown in Figure 8b) or when it is destroyed after a wildfire, the blocks travel further down the slope, resulting in the south end of the road being covered with debris. This indicates that vegetation plays a crucial role in controlling the trajectories. Therefore, the run-out distance increases following the wildfire, raising exposure. As mentioned previously, exposure is an important hazard and risk assessment factor.
When examining larger blocks, the role of vegetation in controlling rockfalls appears to diminish. Figure 9 illustrates the trajectory endpoints at Slope 1, using blocks of 0.125 m3. The distinction between the trajectory endpoints without and with vegetation, as shown in Figure 9a and b, respectively, is barely noticeable. There is a slight effect of vegetation, primarily observed in the middle of the slope, but it does not substantially reduce the run-out distance. This is attributed to the vegetation’s ability to withstand impacts since no other parameters differ between these two analyses. The vegetation in the area is not particularly robust; it consists of small trees that cannot dissipate significant kinetic energy. As the block size increases, the resulting kinetic energy upon impact also increases, making the vegetation less effective. Consequently, the effectiveness of vegetation in controlling rockfalls is highly dependent on the falling block’s kinetic energy, which increases with its mass.
The other two examined locations presented a similar pattern for the large (0.125 m3) blocks. Therefore, we do not present these results since there is no significant difference between the two scenarios (unburned and burned vegetation).
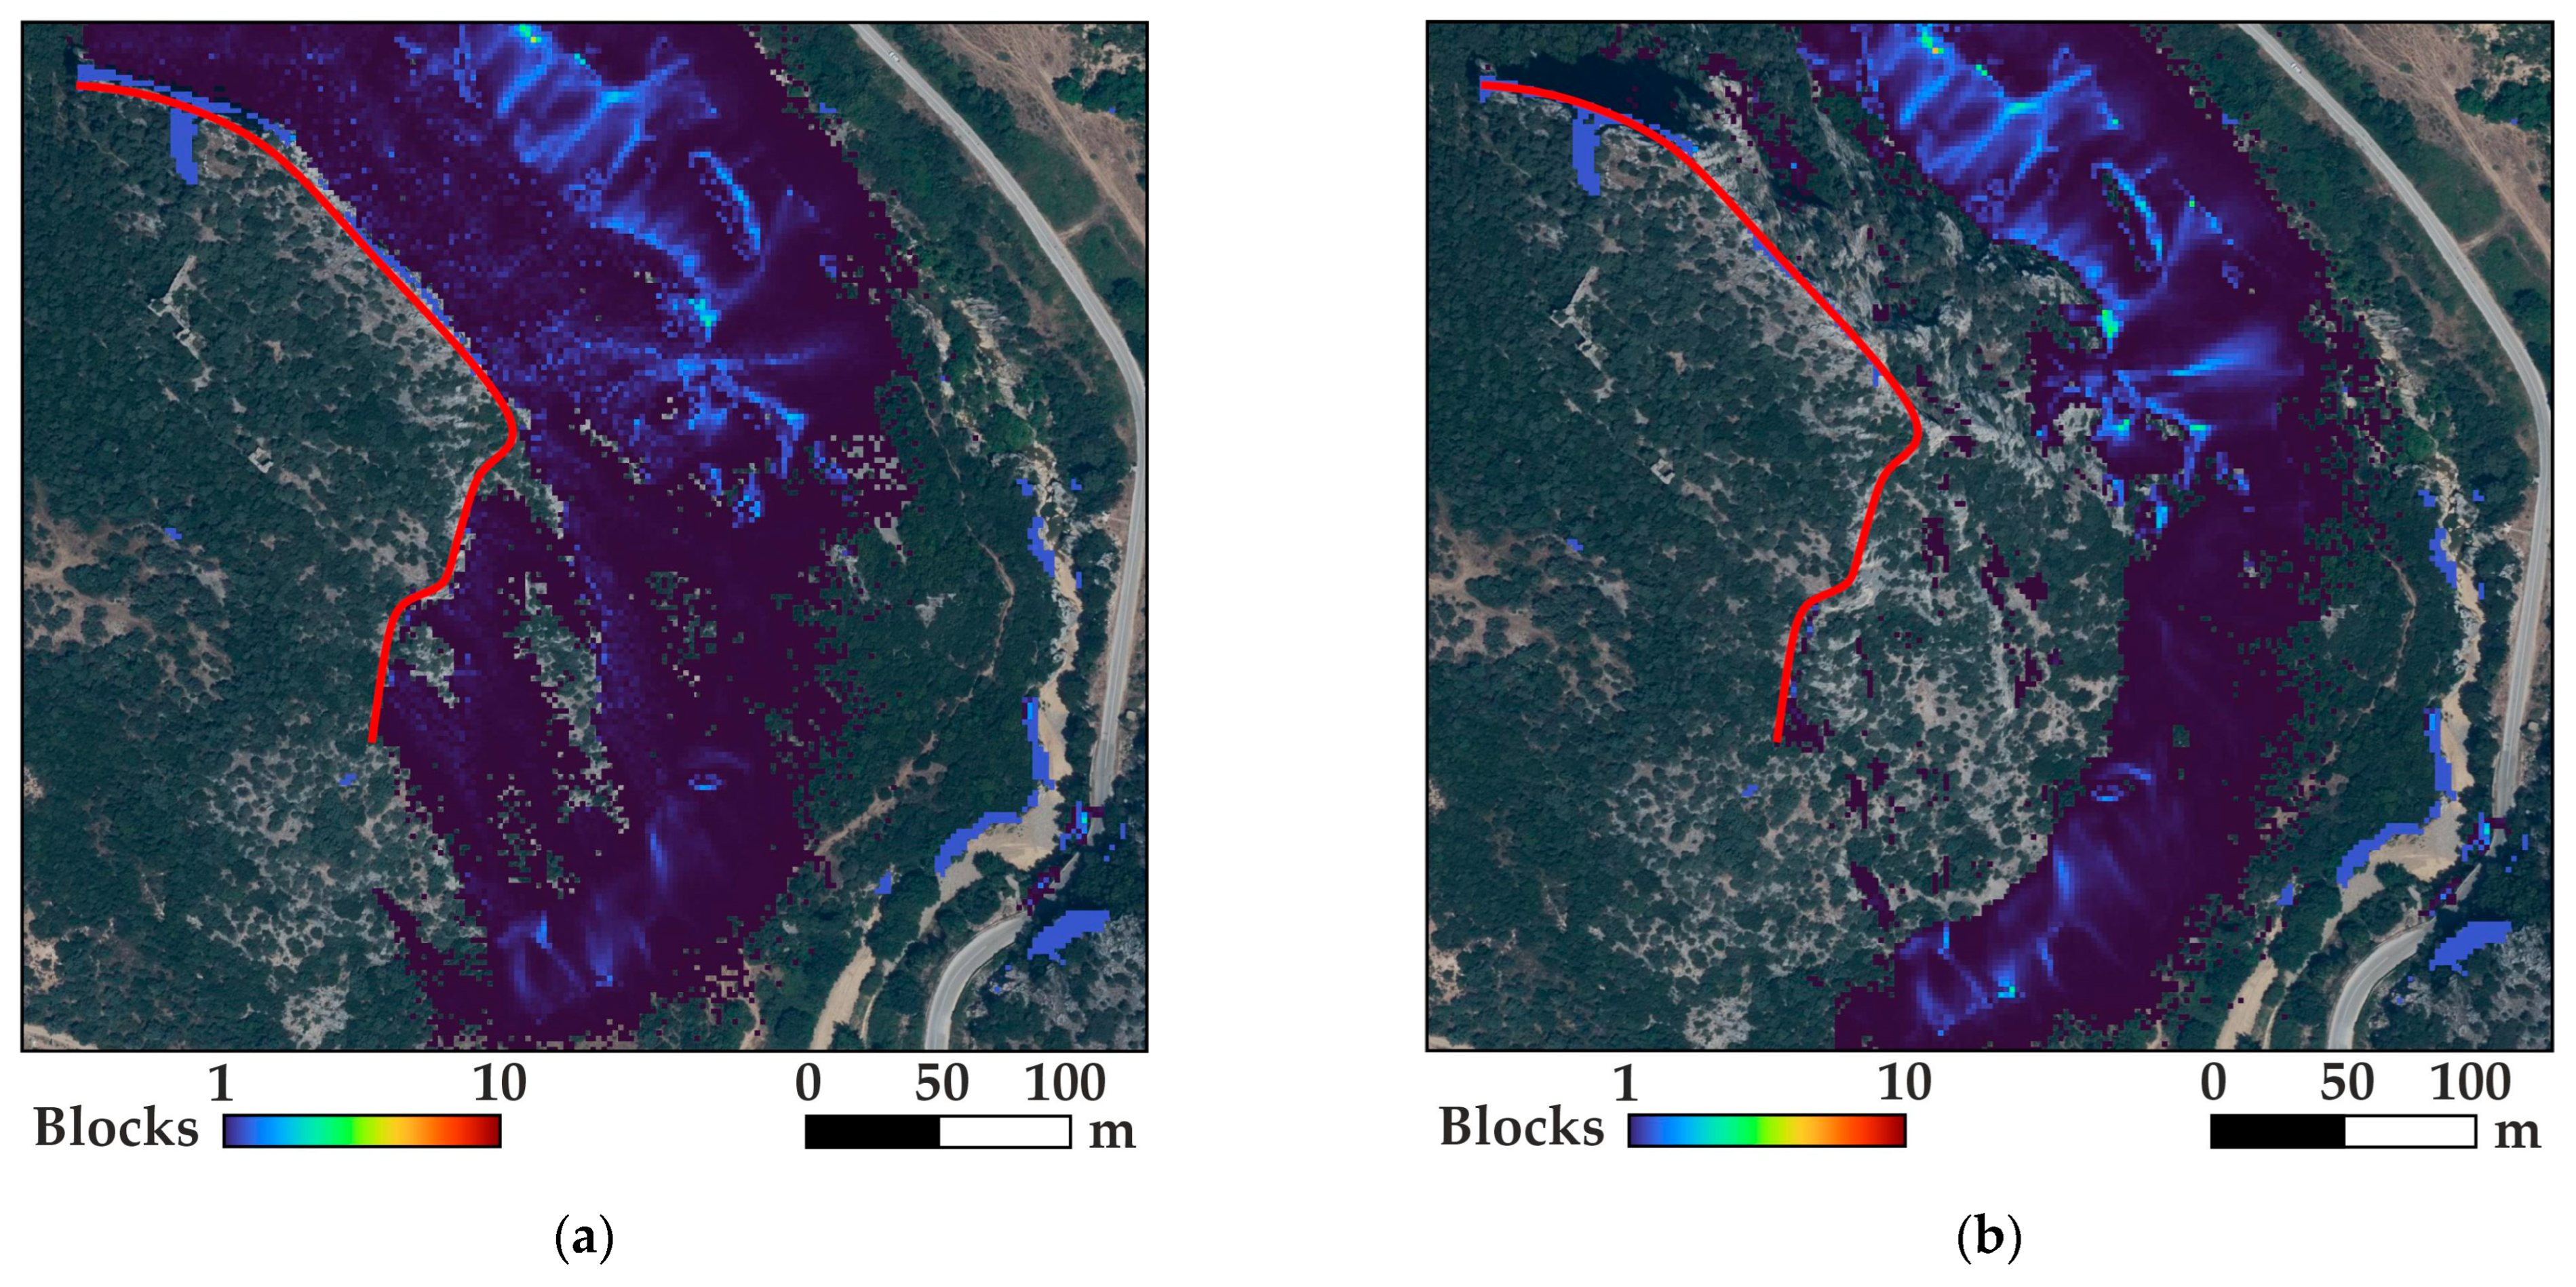
In the second slope (Figure 10), vegetation helps retain some blocks higher up where the inclination is steeper. However, after the destruction of vegetation, no blocks were retained in the upper part of the slope. Additionally, it is observed that the river serves as a natural protective barrier for the road, preventing the blocks from crossing over.
The inclination on the third slope is gentler than the previous slopes. In addition, vegetation is sparser near the starting point (indicated by the red line), and the surface roughness is greater than the previous slopes. In both scenarios (Figure 11), most blocks rest in the middle of the slope due to the mild incline and rough terrain. Once again, the vegetation prevents some blocks from moving further down the slope, although this effect is less pronounced in this slope. To the east of the slope, an existing scree deposit creates a natural pathway for block movement. The analysis results verify its presence, showing a significant accumulation of blocks along this pathway. Additionally, at the lower end of the slope, there is a noticeable concentration of blocks, particularly in the scenario of the burnt vegetation.
Although some pine trees are present on this slope, with significantly stronger trunks and a greater ability to absorb kinetic energy, the block trajectories stop higher up the slope. Therefore, these trees do not interact with the block trajectories, and their effect on limiting movement cannot be quantified.
Based on the aforementioned analysis, several factors influence the run-out distance of falling blocks, including block size, slope inclination, vegetation density, and vegetation’s ability to withstand the blocks’ kinetic energy. Additionally, the slope’s height and inclination are key parameters in rockfall trajectory modeling since they control the block’s velocity and kinetic energy.

3. Rockfall Hazard System Adaptation

To adapt the rockfall hazard-risk assessment system for the area affected by the 2023 Evros wildfire, we aimed to include all essential parameters, ensuring that their determination would not require time-consuming procedures during field surveys.
According to the literature, a thorough assessment of rockfall hazard should include the evaluation of (a) susceptibility, (b) magnitude, (c) intensity, (d) potential run-out area, and (e) frequency of rockfalls [25,38,39].
Susceptibility is determined by the characteristics of the rock mass and the presence of factors that affect its mechanical properties. The magnitude of a rockfall is typically measured by the size or volume of the rock fragments. In contrast, the intensity of a rockfall refers to the kinetic energy, or velocity, which develops during the incident. Within the context of a hazard-risk assessment framework, intensity can be estimated based on the maximum height from which the rock block is likely to detach. The precise determination of intensity can be achieved through simulation, a process that requires detailed data and significant effort.
The potential run-out area is estimated through trajectory simulation. However, it can also be approximated using easily identifiable parameters such as the height and angle of the slope, the presence or absence of protective measures like barriers, and the slope morphology.
When assessing the frequency of rockfalls, detailed historical records are often scarce. As a result, estimates are made based on general information and field observations indicating recent activity. Signs of such activity may include rock fragments at the slope’s base, impact marks on the slope’s surface, or evidence on the roadway.
After reviewing existing systems in the literature, we selected seven parameters that can all be measured or estimated through on-site observations. Five of these parameters are related to the slope’s hazard (H), while the remaining two pertain to exposure and vulnerability (R).

3.1. Rockfall Hazard

The parameters H1 (slope height), H2 (block size), and H3 (annual rainfall) are derived from the original RHRS proposed by Pierson [24], while the parameters H4 (rock mass condition) and H5 (rockfall frequency) are based on the proposal by Eggers et al. [33].
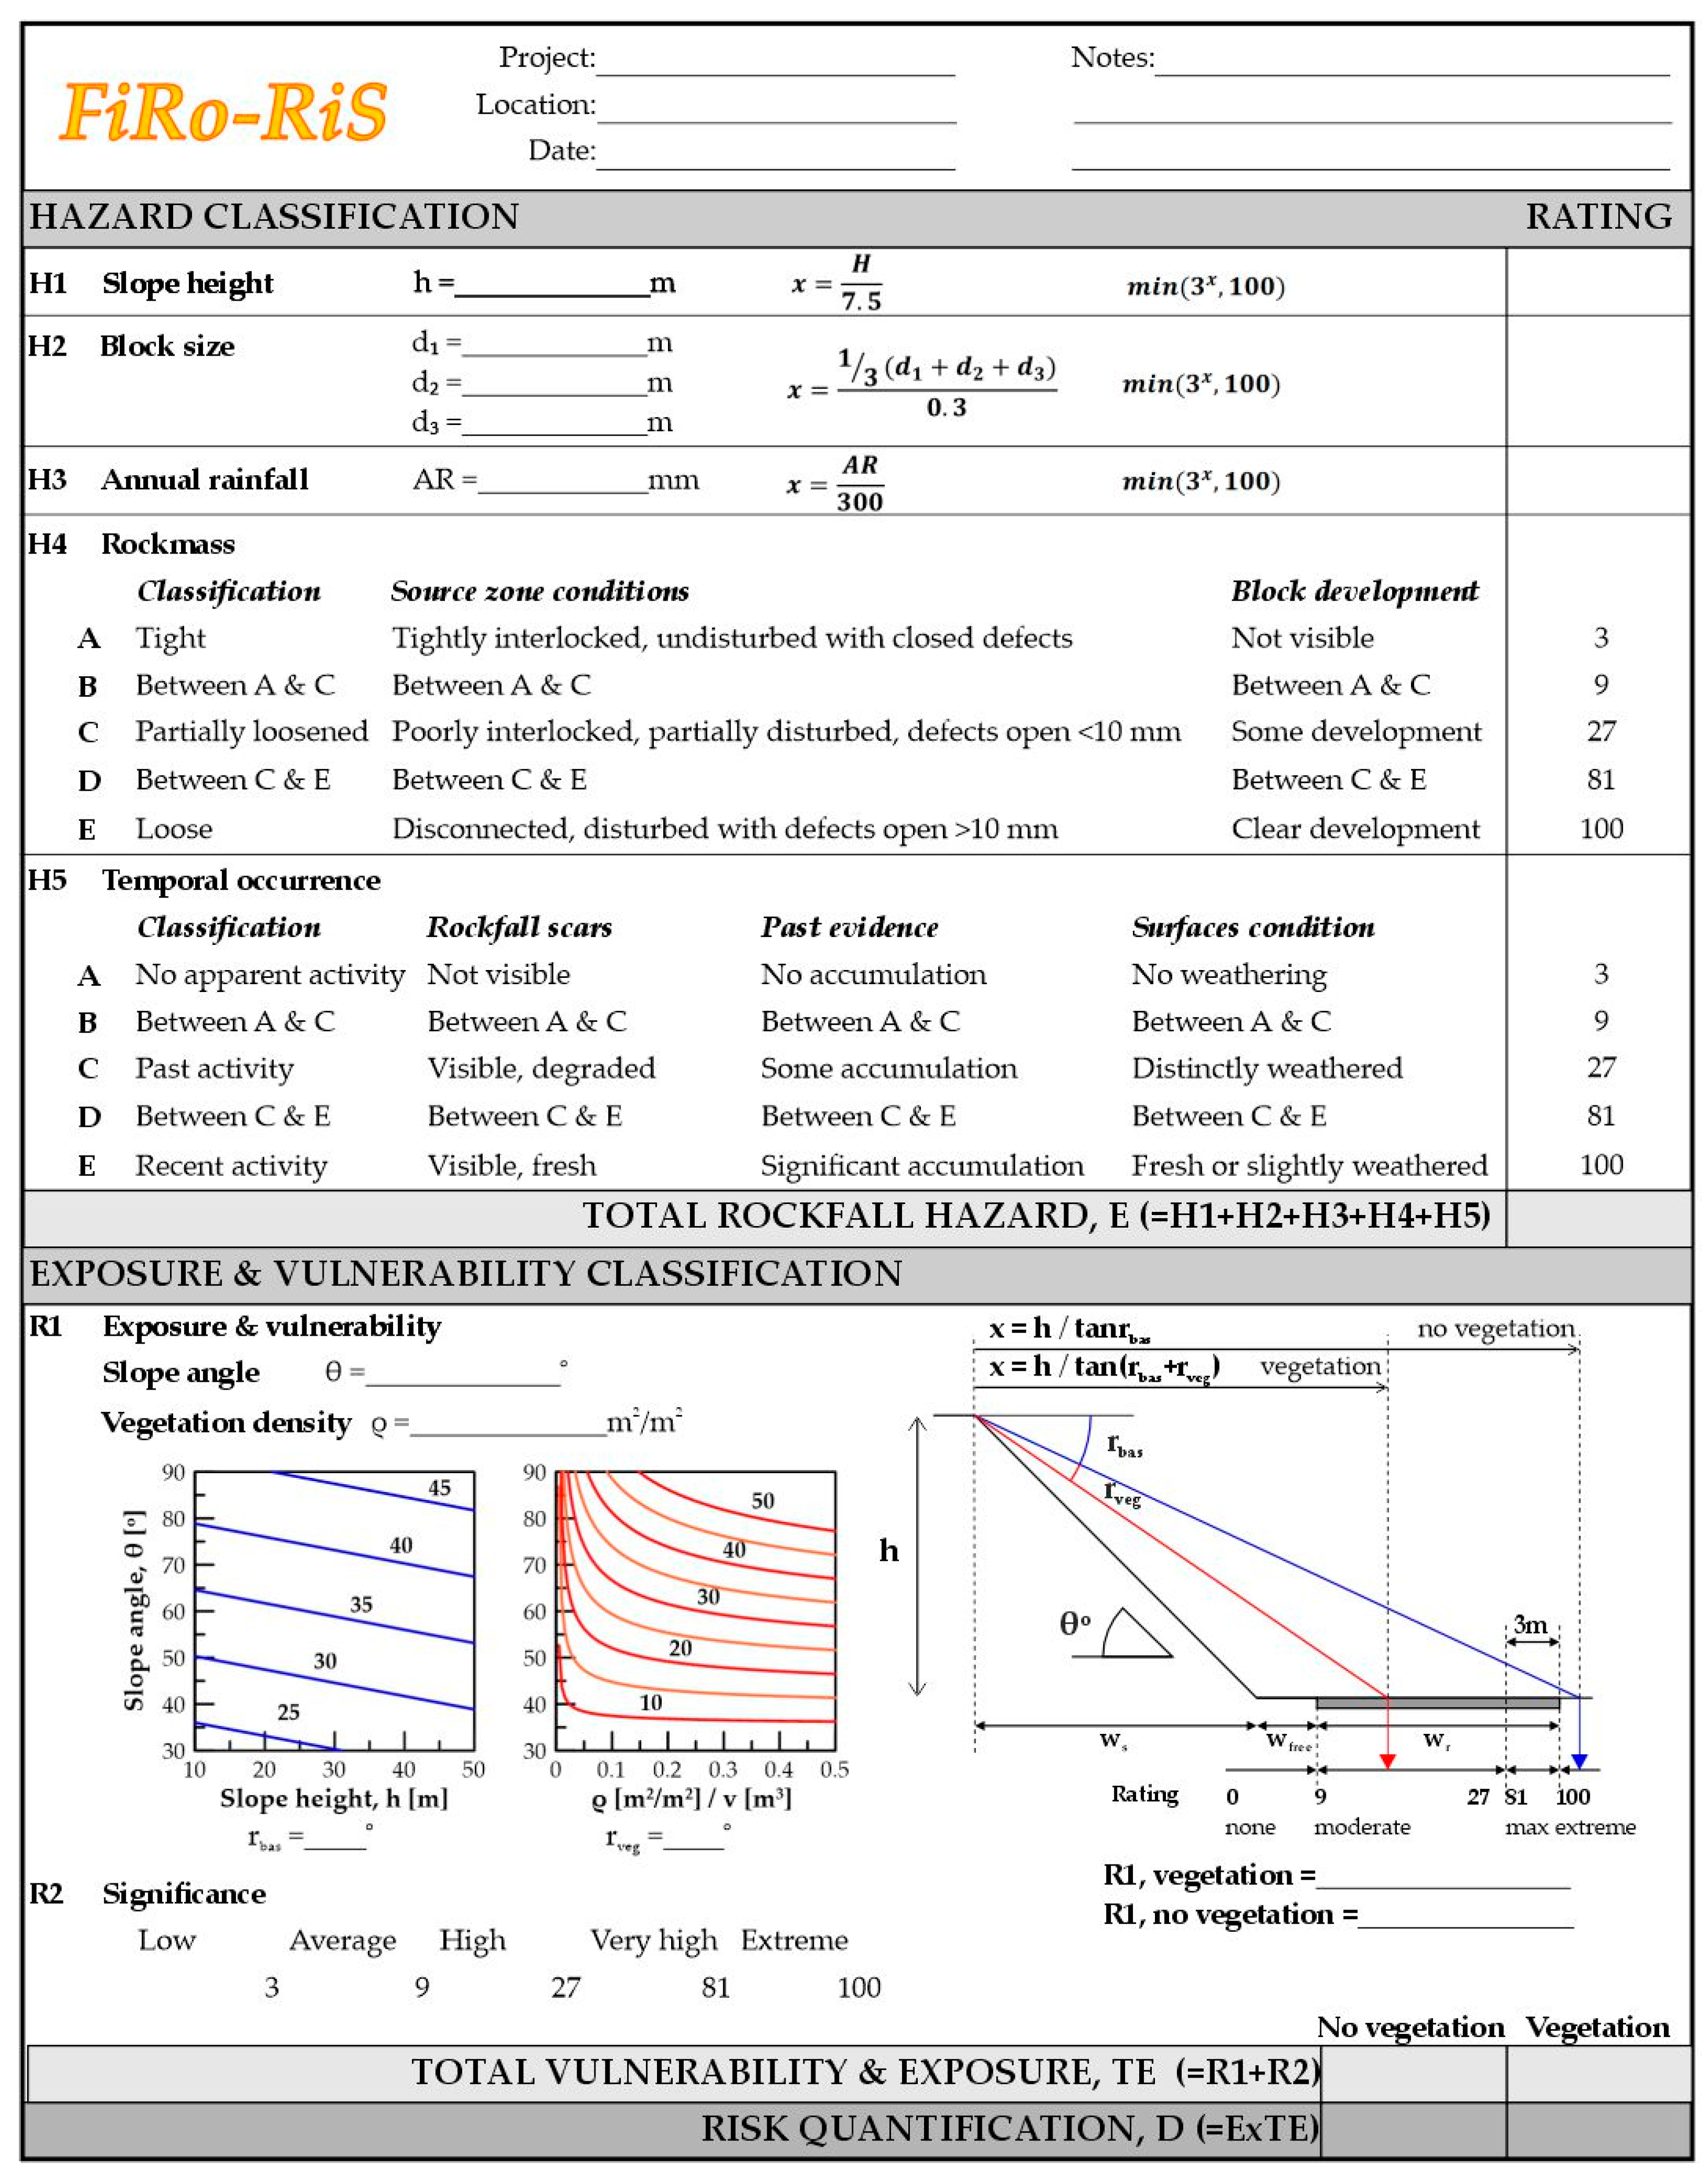
Parameters H1 (slope height) and H2 (block size) are rated based on field measurements and follow an exponential scale to accentuate the difference in rating. The formulas to calculate each rate originate from the original system, but have been expressed in the SI system and modified to have a maximum value of 100, according to:
H = min 3 x , 100
Parameter H1 (slope height, h in m) is defined as the elevation difference between the highest block fragment that is susceptible to detach and the level of interest, according to:
x = 7.5 h
Parameter H2 (block size) accounts for the mean block size, that is the average dimension of the characteristic block at the examined location as measured at three perpendicular directions (d1, d2, d3), according to:
x = d 1 + d 2 + d 3 1 3 0.3
Parameter H3 accounts for rainfall since precipitation influences the initiation of rockfalls. Rockfall frequency increases during periods of heavy rainfalls, making precipitation a key factor [40]. Annual rainfall height (AR, in mm) can be retrieved from National Meteorological Agencies or online repositories, like Climate databases (i.e., NASA POWER, Copernicus Climate Data Store (CDS), WordClim, and others), and GIS platforms (i.e., Google Earth Engine). The factor to rate precipitation is:
x = A R 300
Parameter H4 is qualitative and classifies rock mass conditions and block development in the source zone based on field observations. It considers the degree of rock mass stability, ranging from tightly interlocked and undisturbed rock to loosened and highly fractured, as well as the presence and potential detachment of blocks. The original classification of Eggers et al. [33] includes three distinct classes (A, C and E, in Table 1). However, when we implemented this criterion in the field, we encountered some cases in which these classes could not be clearly assigned, so we added two additional classes (B and D) to account for conditions that lie on their boundaries.
Parameter H5 is also qualitative and evaluates the temporal occurrence probability by assessing rockfall scars and accumulation zones in the field. Similarly to parameter H4, we added two classes (B and D, in Table 2) between the original three to better capture cases we encountered in the field that fell between the distinct categories proposed by Eggers et al. [33].
The scores of each H parameter are summed to calculate the total rockfall hazard (E).

3.2. Exposure and Vulnerability

To assess risk, in addition to hazard, it is essential to determine and evaluate both exposure and vulnerability, as these factors influence the potential impact, thus the related total risk. This is accomplished by parameter R1, which integrates both aspects. On the one hand, parameter R1 accounts for vulnerability by considering the type of infrastructure and the impact of a potential incident. If the infrastructure affected is the road network, the aim is to determine whether a rockfall incident would result in a partial or complete road closure, an outcome with significant implications for the local community. Similarly, if the affected infrastructure is a residential building, the vulnerability increases as residents face displacement or physical harm. On the other hand, parameter R1 also incorporates exposure by assessing the likelihood that the infrastructure will be affected by rockfalls. The rating for parameter R1 is derived from field survey measurements that are then used to estimate the rockfall’s trajectory endpoint based on the reach angle concept.
Reach angle (r), introduced as Fahrböschung angle in the work of Heim [41], is formed by the horizon and the line connecting the detachment position and the furthest trajectory endpoint. The reach angle concept has been used, with variations, in relevant rockfall and landslide studies, for example, [42,43] and others.
As demonstrated from the detailed site-specific study in Section 2, the parameters influencing trajectory length, thus reach angle, are: (a) slope height, (b) slope angle, (c) vegetation density, and (d) block size. To estimate the trajectory length, we conducted parametric analyses using RocFall2 v.8 software [44] by varying the aforementioned parameters within their typical range for the broader study area. The parametric analysis was conducted using the rigid body method, which considers the block’s shape and mass. The method considers the impulse reaction of the block during the instantaneous contact period with the slope to determine its response to impact [45]. The input parameters (Normal (Rn) and Tangential (Rt) Coefficient of Restitution, Dynamic and Rolling Friction) were selected by RocFall2 [44] suggested values for Rock Debris/Soil slopes.
Additional modules are available in RocFall2, including the forest damping theory [46]. A drag coefficient is assigned to the slope over an effective height corresponding to the tree height. When a rock block travels within this height range, forest damping is applied, with the resisting force (drag) being proportional to the block’s velocity. The drag coefficient is determined based on average forest density [47] and ranges from 100 kg/s to 1000 kg/s. Forest density is quantified by the Basal Area, which is defined as the total cross-sectional area of tree trunks and stems per hectare in the slope segment. Typical values for the drag coefficient, based on [47], are 250 kg/s for an open forest with a basal area of 20 m2/ha, 500 kg/s for a medium forest with a basal area of 35 m2/ha, and 750 kg/s for a dense forest with a basal area of 50 m2/ha.
Note that we assume that following a wildfire, the vegetation will be burnt and totally lost, leading to an increased run-out distance, thus an increase in exposure. Following the wildfire, the run-out distance is calculated by setting forest damping to zero. If the forest density before the wildfire is known, then the effect of the wildfire can be quantified by comparing the levels of exposure before and after the wildfire.
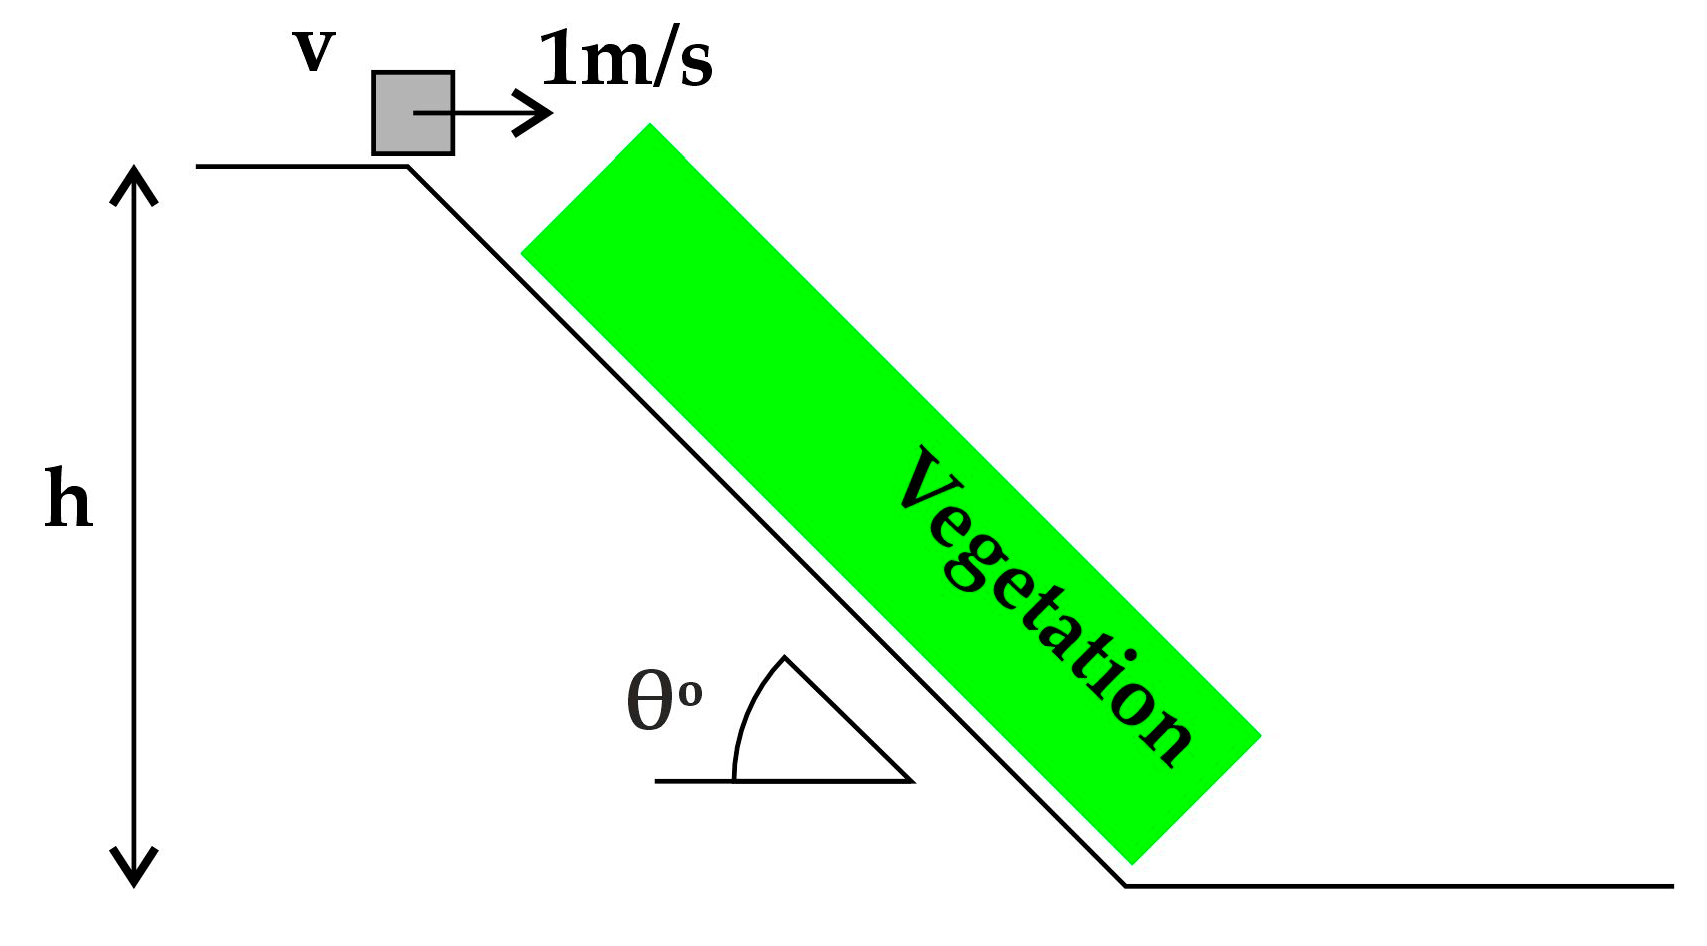
Parameters in RocFall2 are defined using statistical distributions, allowing for the generation of multiple trajectories. This approach captures the inherent variability of natural parameters, introducing a stochastic element to the analysis and enhancing its realism. Figure 12 presents the model developed in RocFall2. Table 3 presents the values used, which combined resulted in 216 analyses.
Reach angle (r) was divided into two components: (a) the basic reach angle (rbas), which depends on the slope height and slope angle (without vegetation, or following the wildfire), and (b) the vegetation-induced reach angle increase (rveg), which depends on the block size and vegetation density (before the wildfire). This approach allows for directly identifying the impact of vegetation loss due to a wildfire on the trajectory length. Before a wildfire, the reach angle (r) is the sum of these components. After the wildfire, the reach angle equals the basic reach angle, since the vegetation is destroyed.
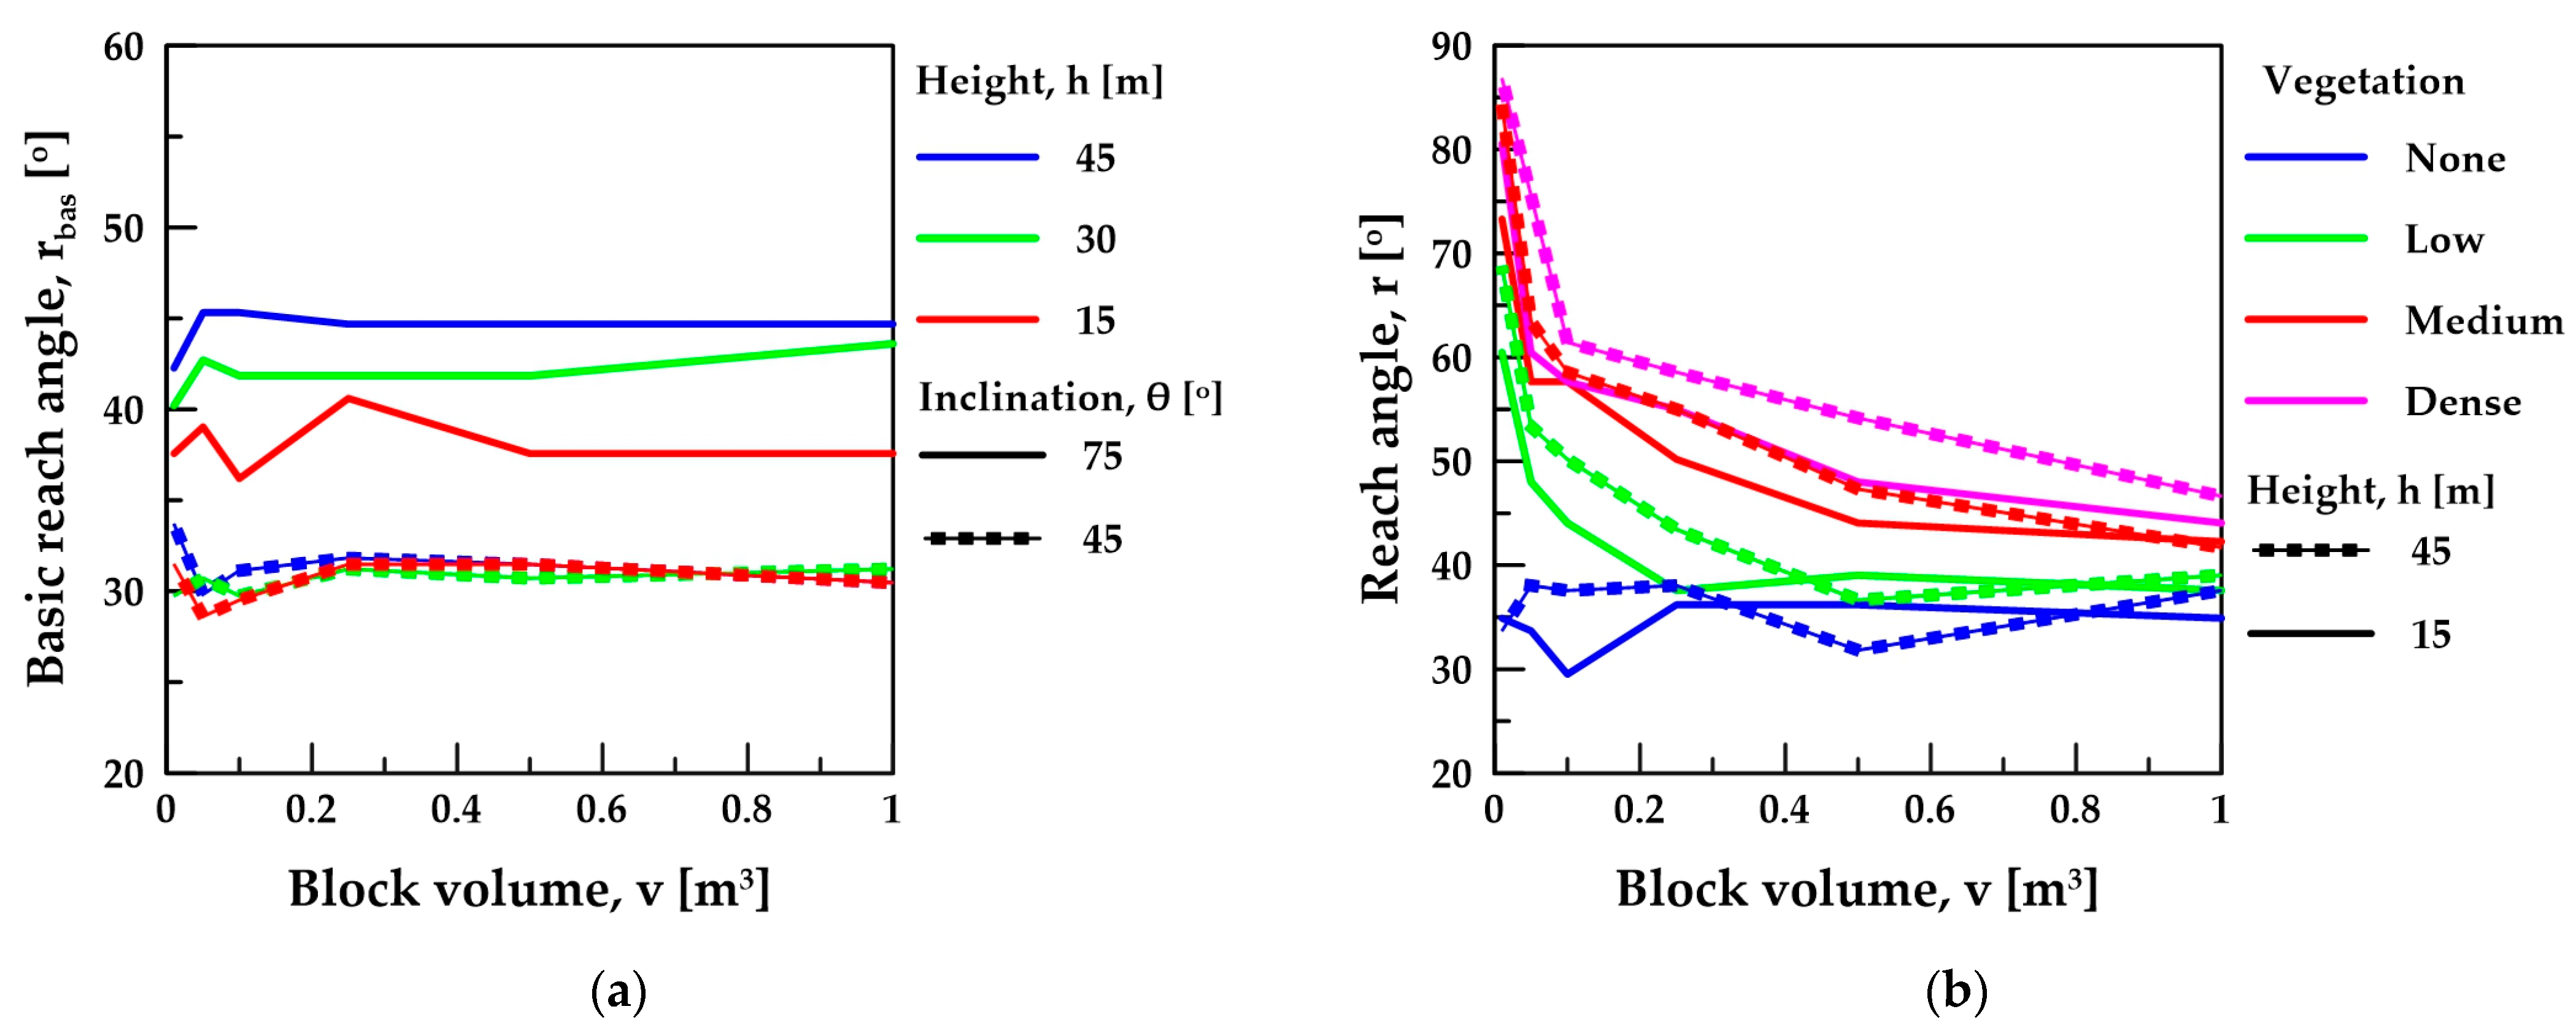
Figure 13a illustrates the basic reach angle (rbas) as a function of the block volume and the slope height for analyses conducted on bare slopes (without vegetation) with inclinations of 75° (solid lines) and 45° (lines with square marks), respectively. Since both slope inclinations show a nearly horizontal trend, we conclude that block mass (or volume) does not significantly affect basic reach angle. Consequently, the basic reach angle correlates with slope height (h, in meters) and slope angle (θ, in degrees) according to Equation (5).
r b a s = 11.4 + 0.1 h + 0.35 θ
Equation (5) is satisfactory, yielding a correlation coefficient of R2 = 0.922. Additionally, the coefficient values confirm that slope height has a lesser impact on basic reach angle, especially when the height is limited, compared to slope inclination.
Figure 13b presents the results for a 60° slope with heights of 15 m (solid lines) and 45 m (lines with square marks), respectively, considering all examined block volumes and vegetation densities. The results indicate that denser vegetation and smaller block volumes lead to higher reach angle values, corresponding to a narrower rockfall influence zone, as the blocks rest closer to the release zone.
Examining the difference in reach angle between the analyses on bare and vegetated slopes, we deduced that vegetation density, slope inclination, and block volume significantly affect the difference in reach angle, while the effect of slope height is less influential. Therefore, the additional effect of vegetation on reach angle is correlated (Equation (6)) with the vegetation density (ρ, in m2/m2), expressed as the total area of stems at breast height per square meter, the block volume (v, in m3), and the slope angle (θ, in degrees).
r v e g = 0.18 θ ln ρ v + 1.1 θ 29.5
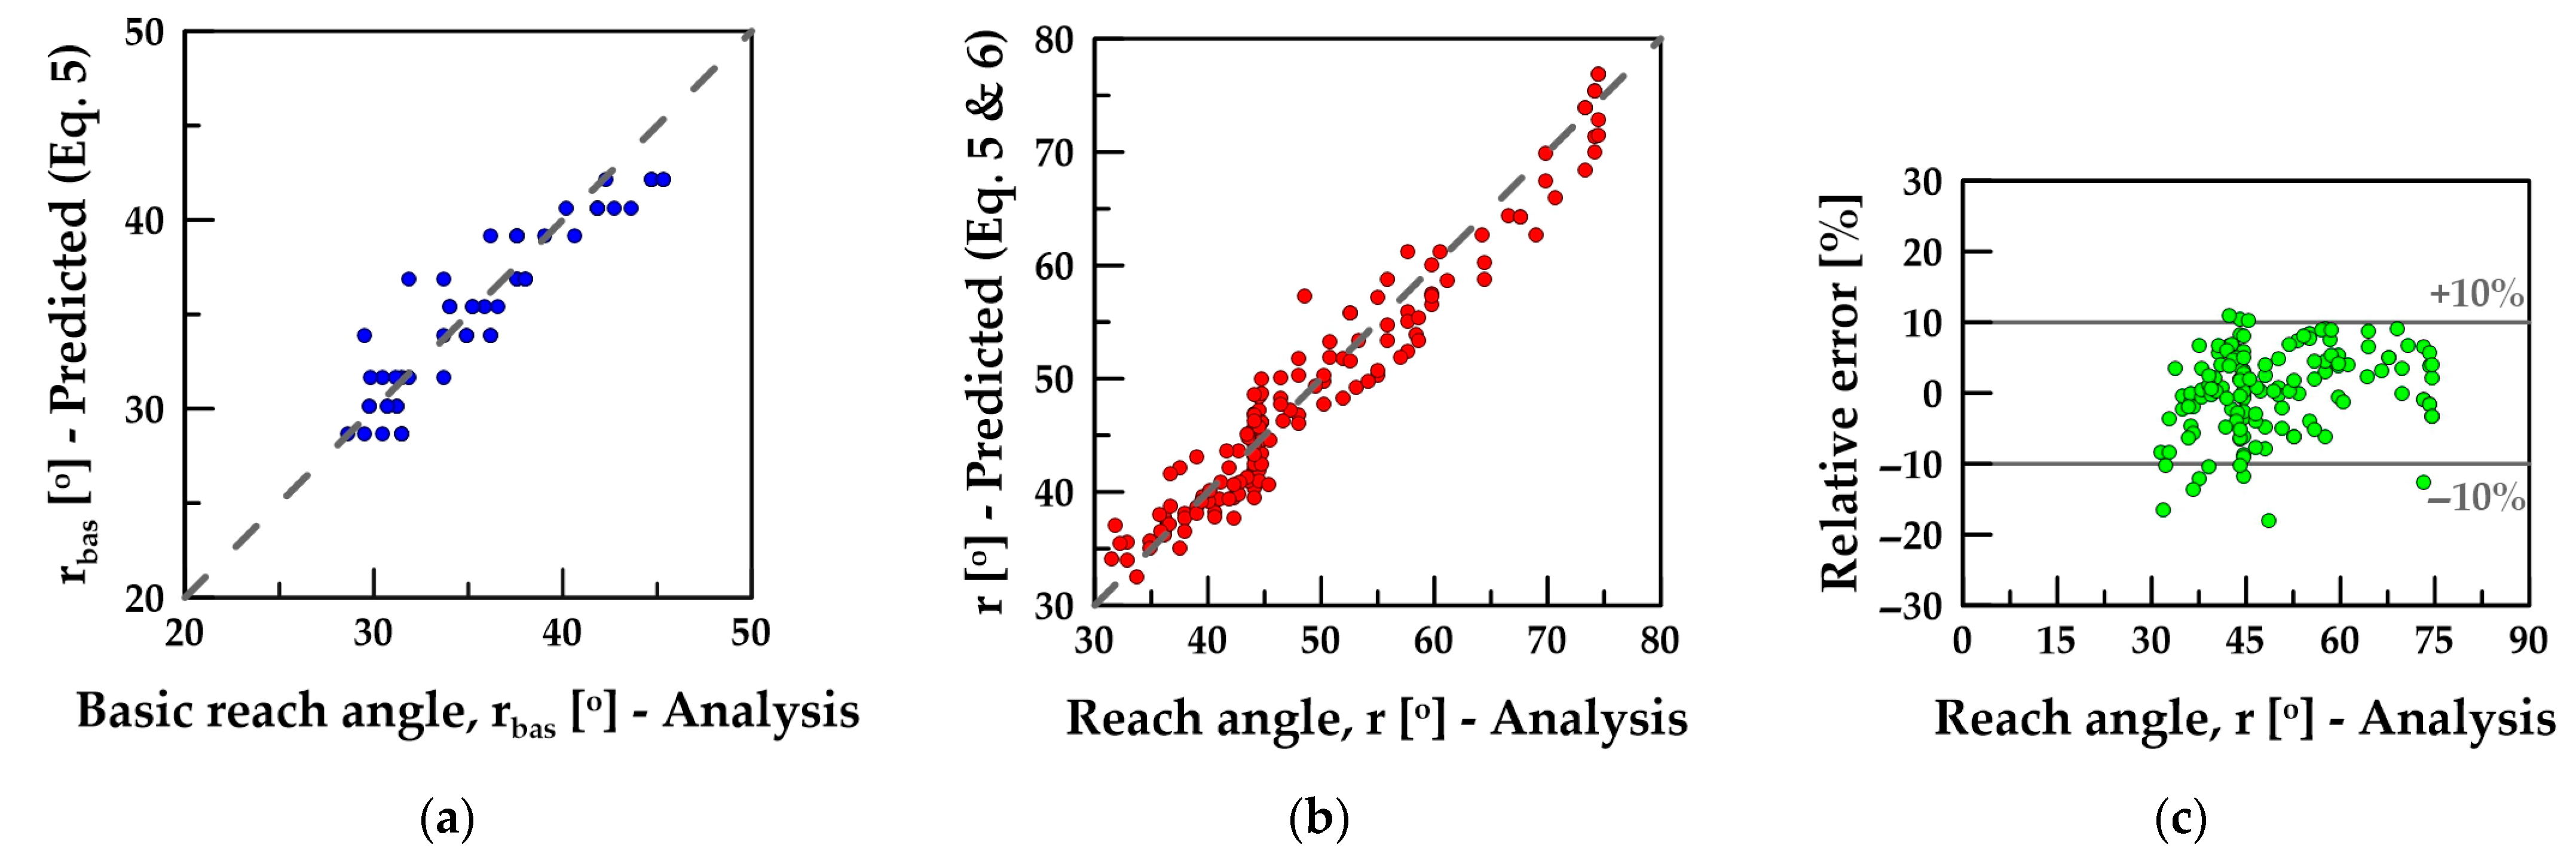
To evaluate these correlations, Figure 14a presents a one-to-one comparison between the basic reach angle calculated by the analyses and the one predicted by the correlation (Equation (5)). Similarly, Figure 14b compares the total reach angle, which incorporates vegetation and block size, calculated by the analyses and the one predicted by the correlation (Equation (5) + Equation (6)). The values are closely aligned with the 45° reference line in both cases, indicating a satisfactory predictive performance. Moreover, Figure 14c depicts the relative prediction error compared to the values obtained from the analysis. The absolute error is limited to a ±10% range, which is considered acceptable. These correlations are embedded in the developed hazard-risk system as nomographs to facilitate implementation.
After estimating the reach angle using the aforementioned correlations, parameter R1 is rated depending on the type of infrastructure affected. Note that the free width (wfree) between the slope toe and the infrastructure must be measured during the field survey.
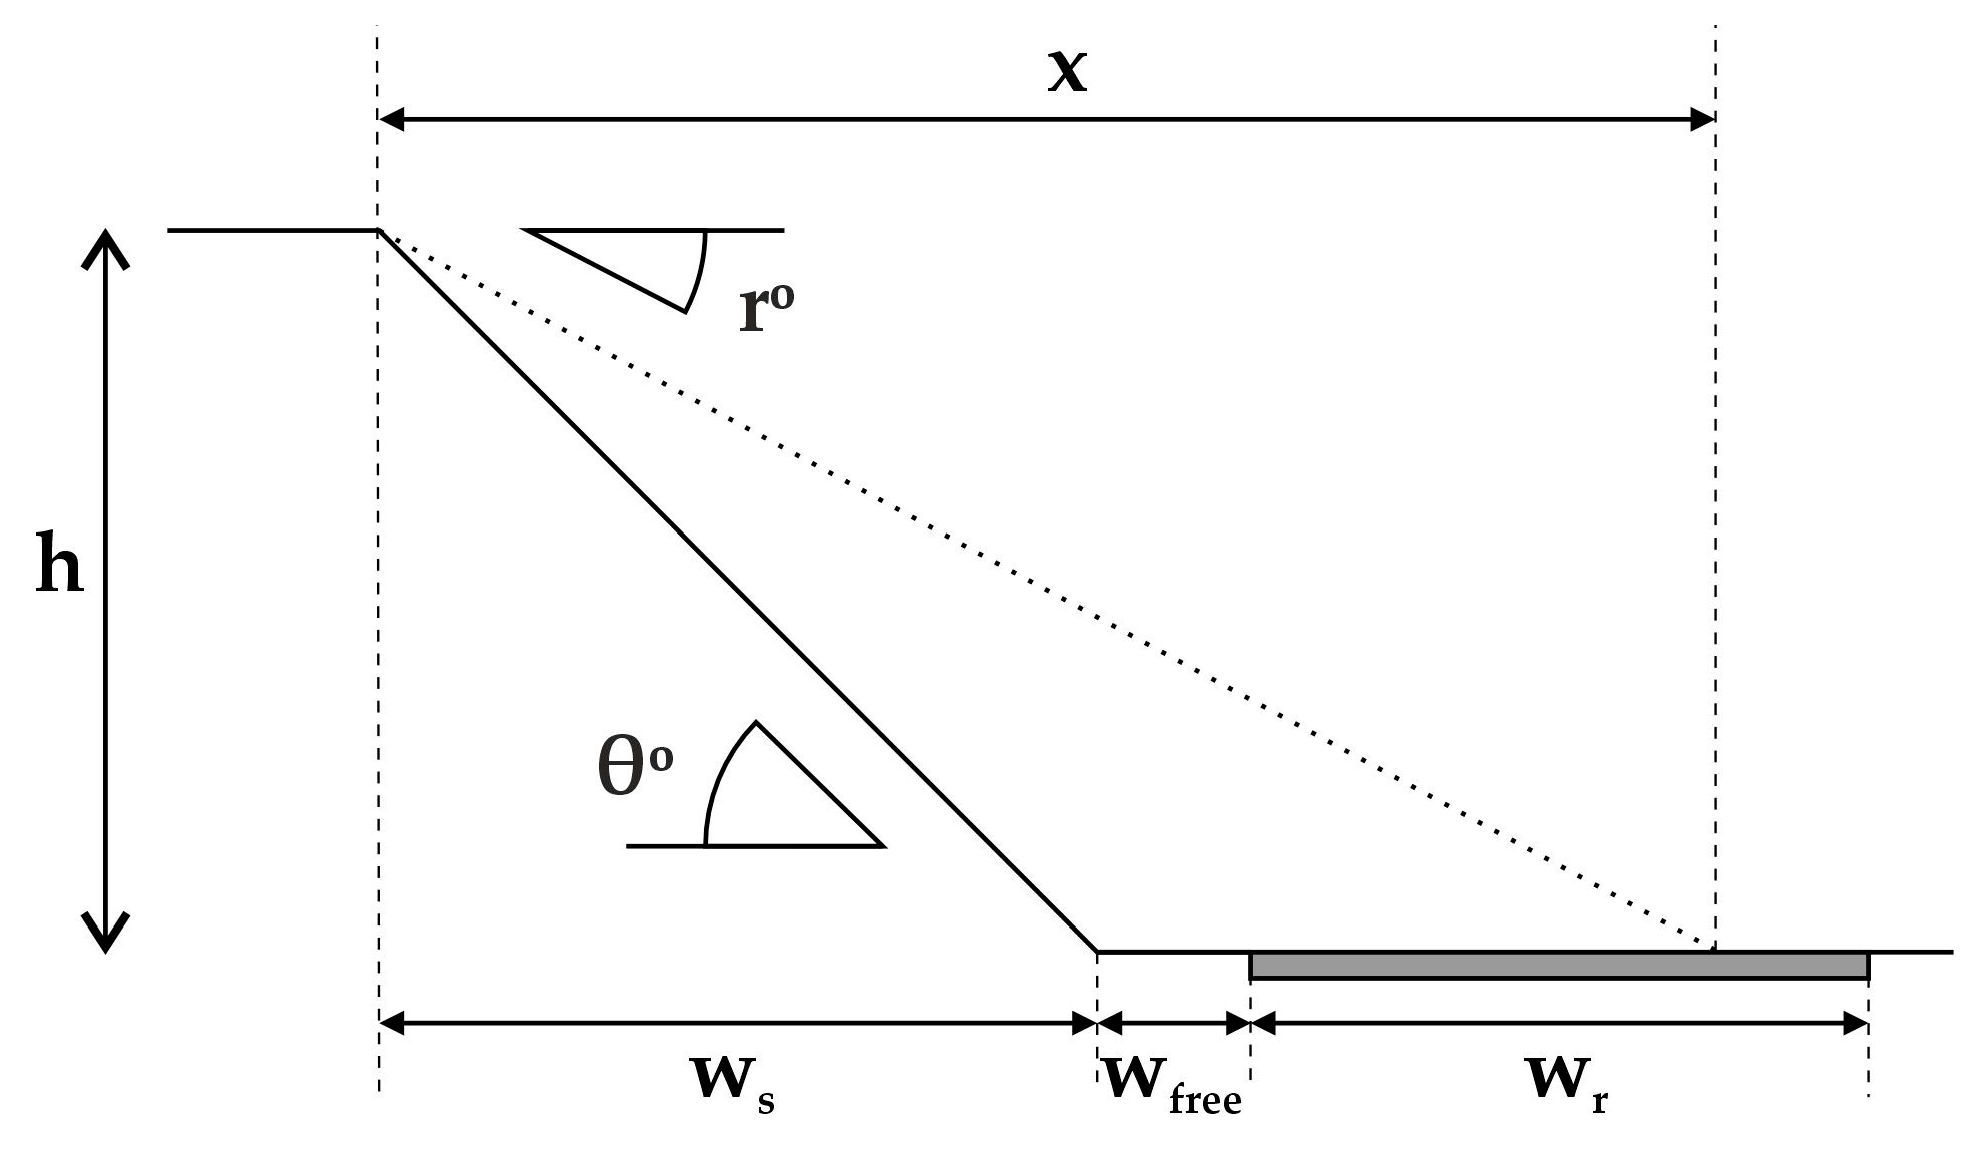
Figure 15 illustrates the geometry in the case of a road being examined. In this case, the road width (wr) must also be measured during the field survey.
The following cases are discerned: (a) the falling block does not reach the road (x < ws + wfree), so no consequences are expected and R1 equals 0; (b) the falling block reaches the road but leaves a free width of 3 m width (x < ws + wfree + wr − 3 m), allowing vehicle movement; thus the road maintains serviceability (R = 9 to 27, depending on the unaffected width); (c) the falling block affects the entire road cross-section (x > ws + wfree + ws − 3 m), resulting in maximum consequences (R1 = 81); and d) the falling block exceeds the road area (x > ws + wfree + ws) and threatens additional infrastructure situated downslope, having extreme consequences (R1 = 100). Note that x and ws are calculated according to x = H/tan r and ws = H/tan θ.
In case a resident or a facility is affected, the consequences are considered extreme (R1 = 100) when it is located within the rockfall transition zone (x > ws + wfree).
Parameter R2 refers to the significance of the potential impacts. It is subjective and based on the importance of exposed elements from a socio-economic perspective. For example, when the main infrastructure affected is the road network, criteria for assessing its importance could include daily traffic volume, the presence of alternative routes, or others.
The sum of the individual scores for the R1 and R2 parameters gives the total score for the combination of vulnerability and exposure, according to TE = R1 + R2.

3.3. Risk Quantification

The final risk score is calculated as the product of the total hazard and vulnerability-exposure scores, according to D = E × TE. To avoid excessively large values, the total scores of E and TE are normalized by dividing them by their maximum scores, which are 500 and 200, respectively.
The proposed system is named FiRo-RiS, derived from the words Fire Rockfall Risk System, and is presented in Figure 16.

4. Implementation Across the Burnt Area

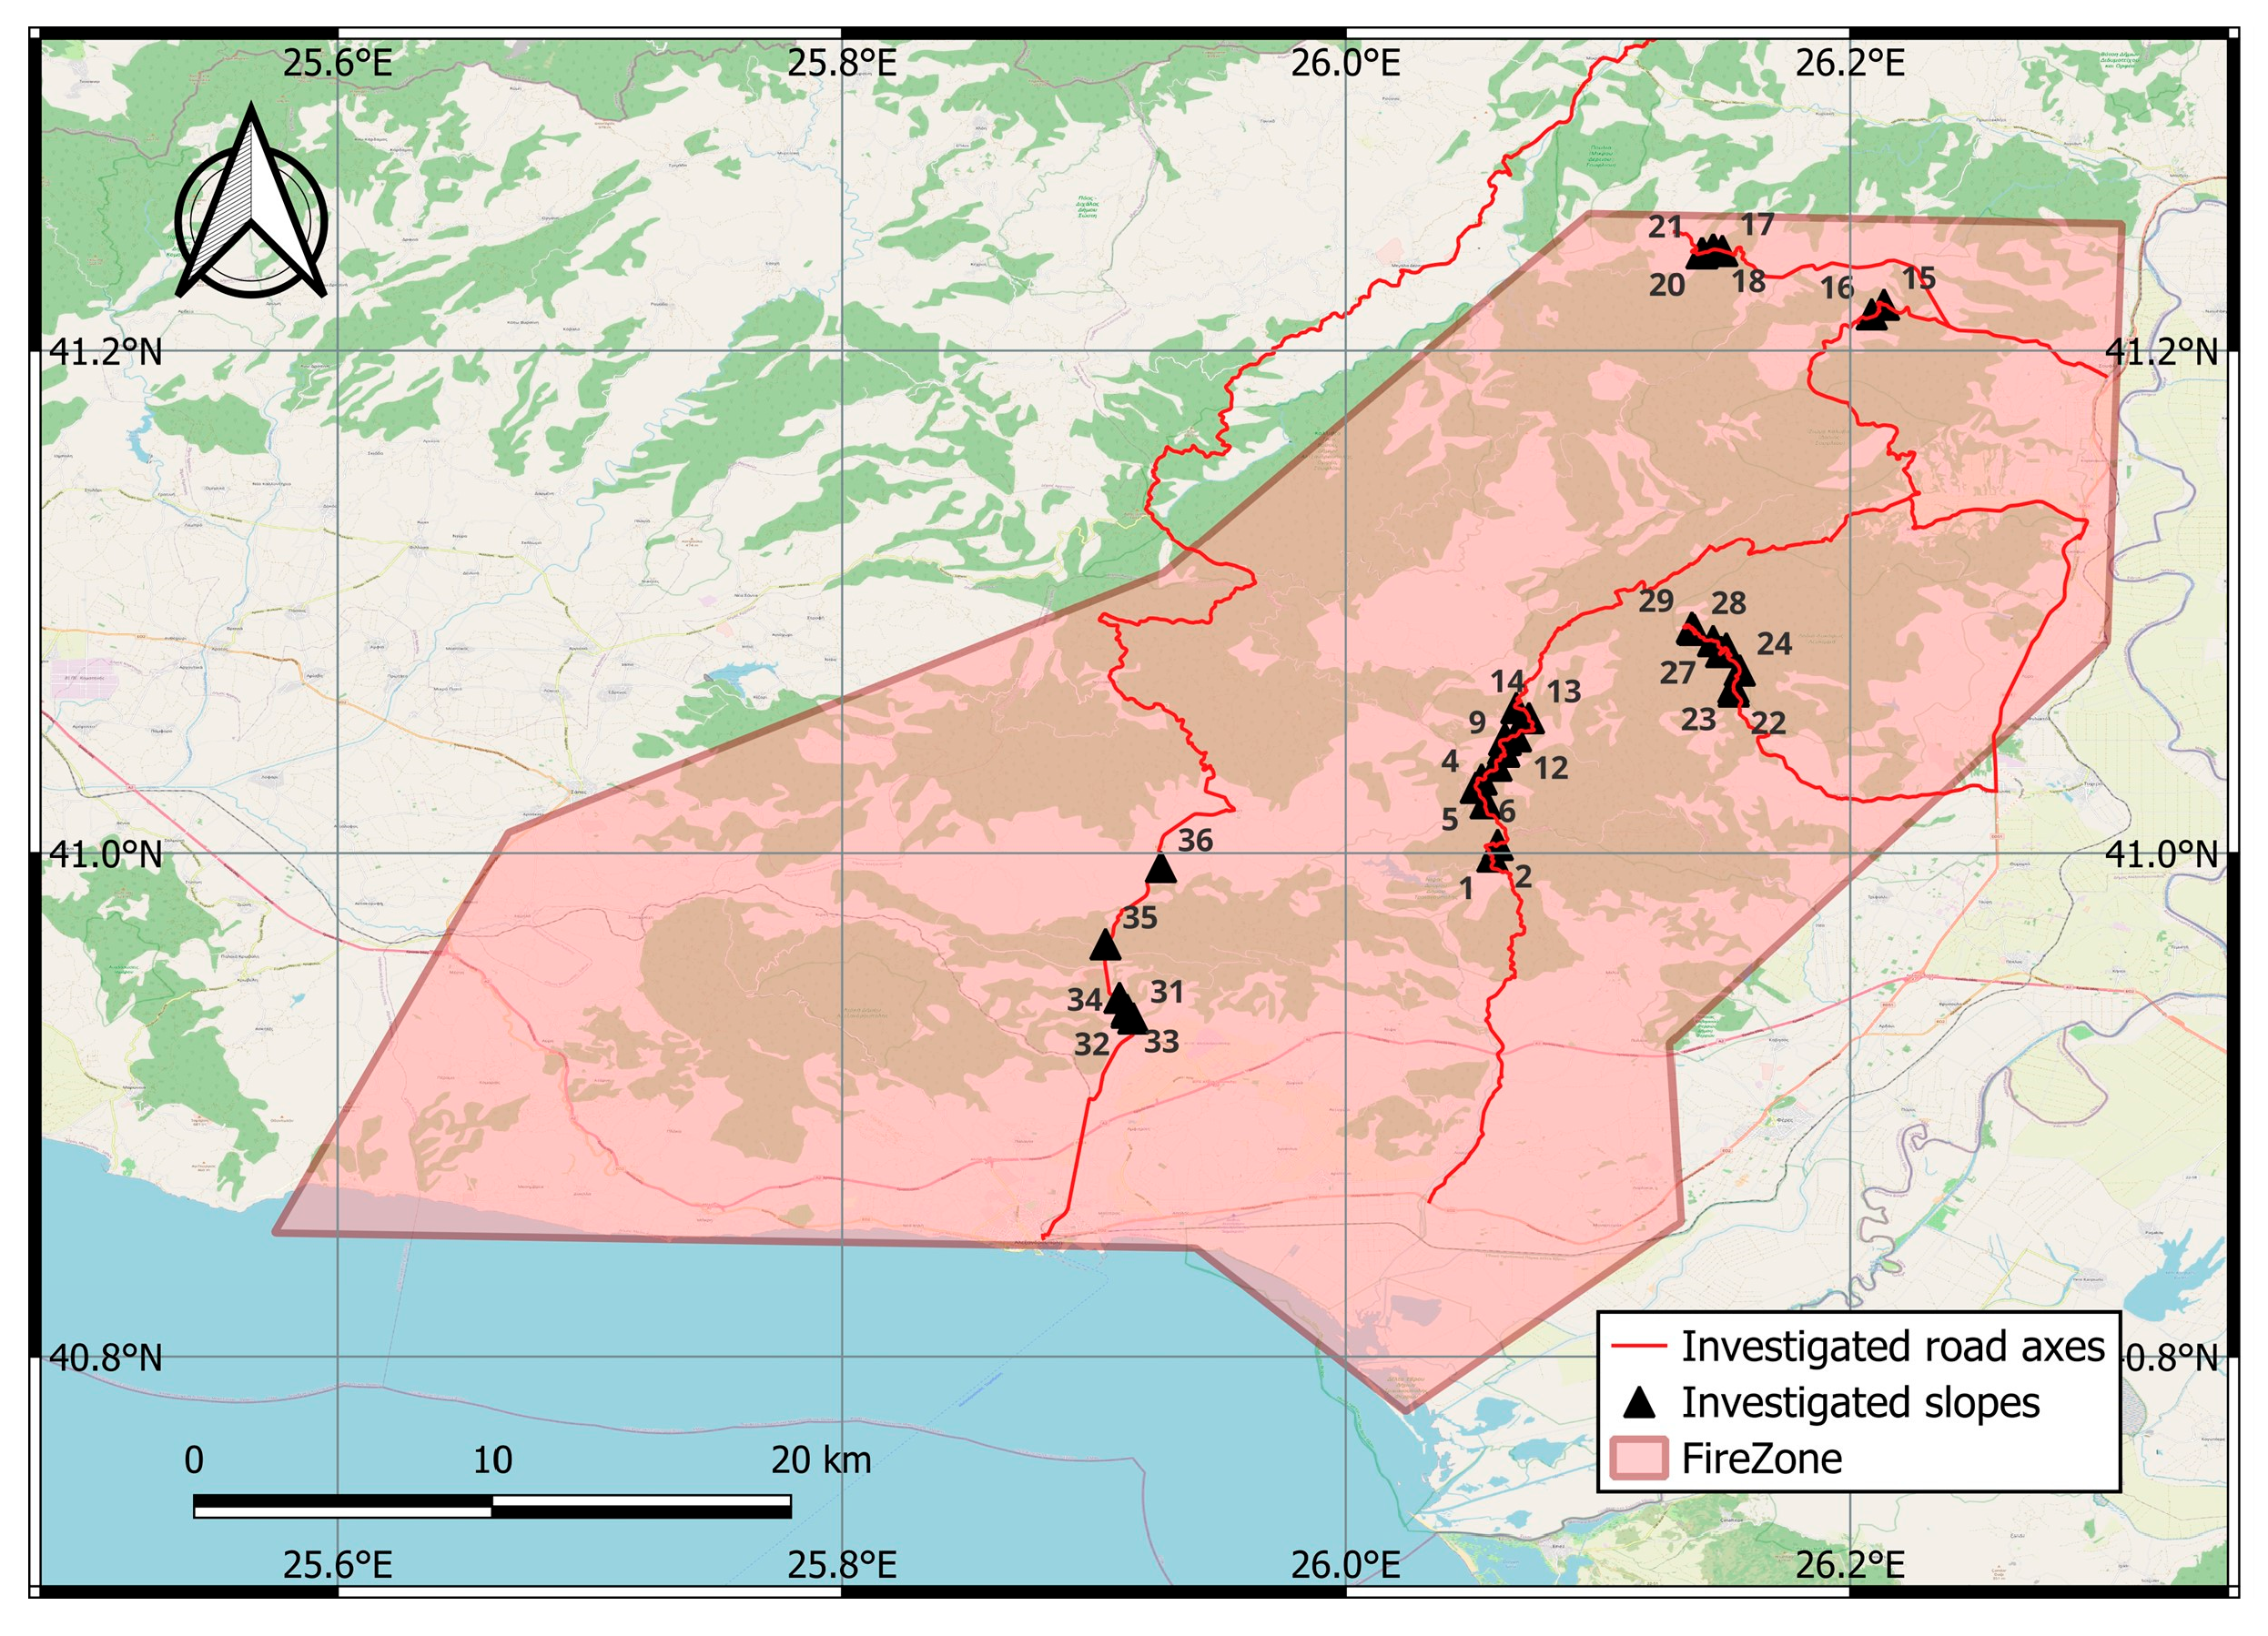
The developed Rockfall Hazard-Risk System (FiRo-RiS) was applied during an on-site inspection one year after the devastating wildfire. The surveyed routes included the mountainous road network and settlements impacted by the wildfire. Along these routes, 36 slopes were identified and examined (Figure 17).
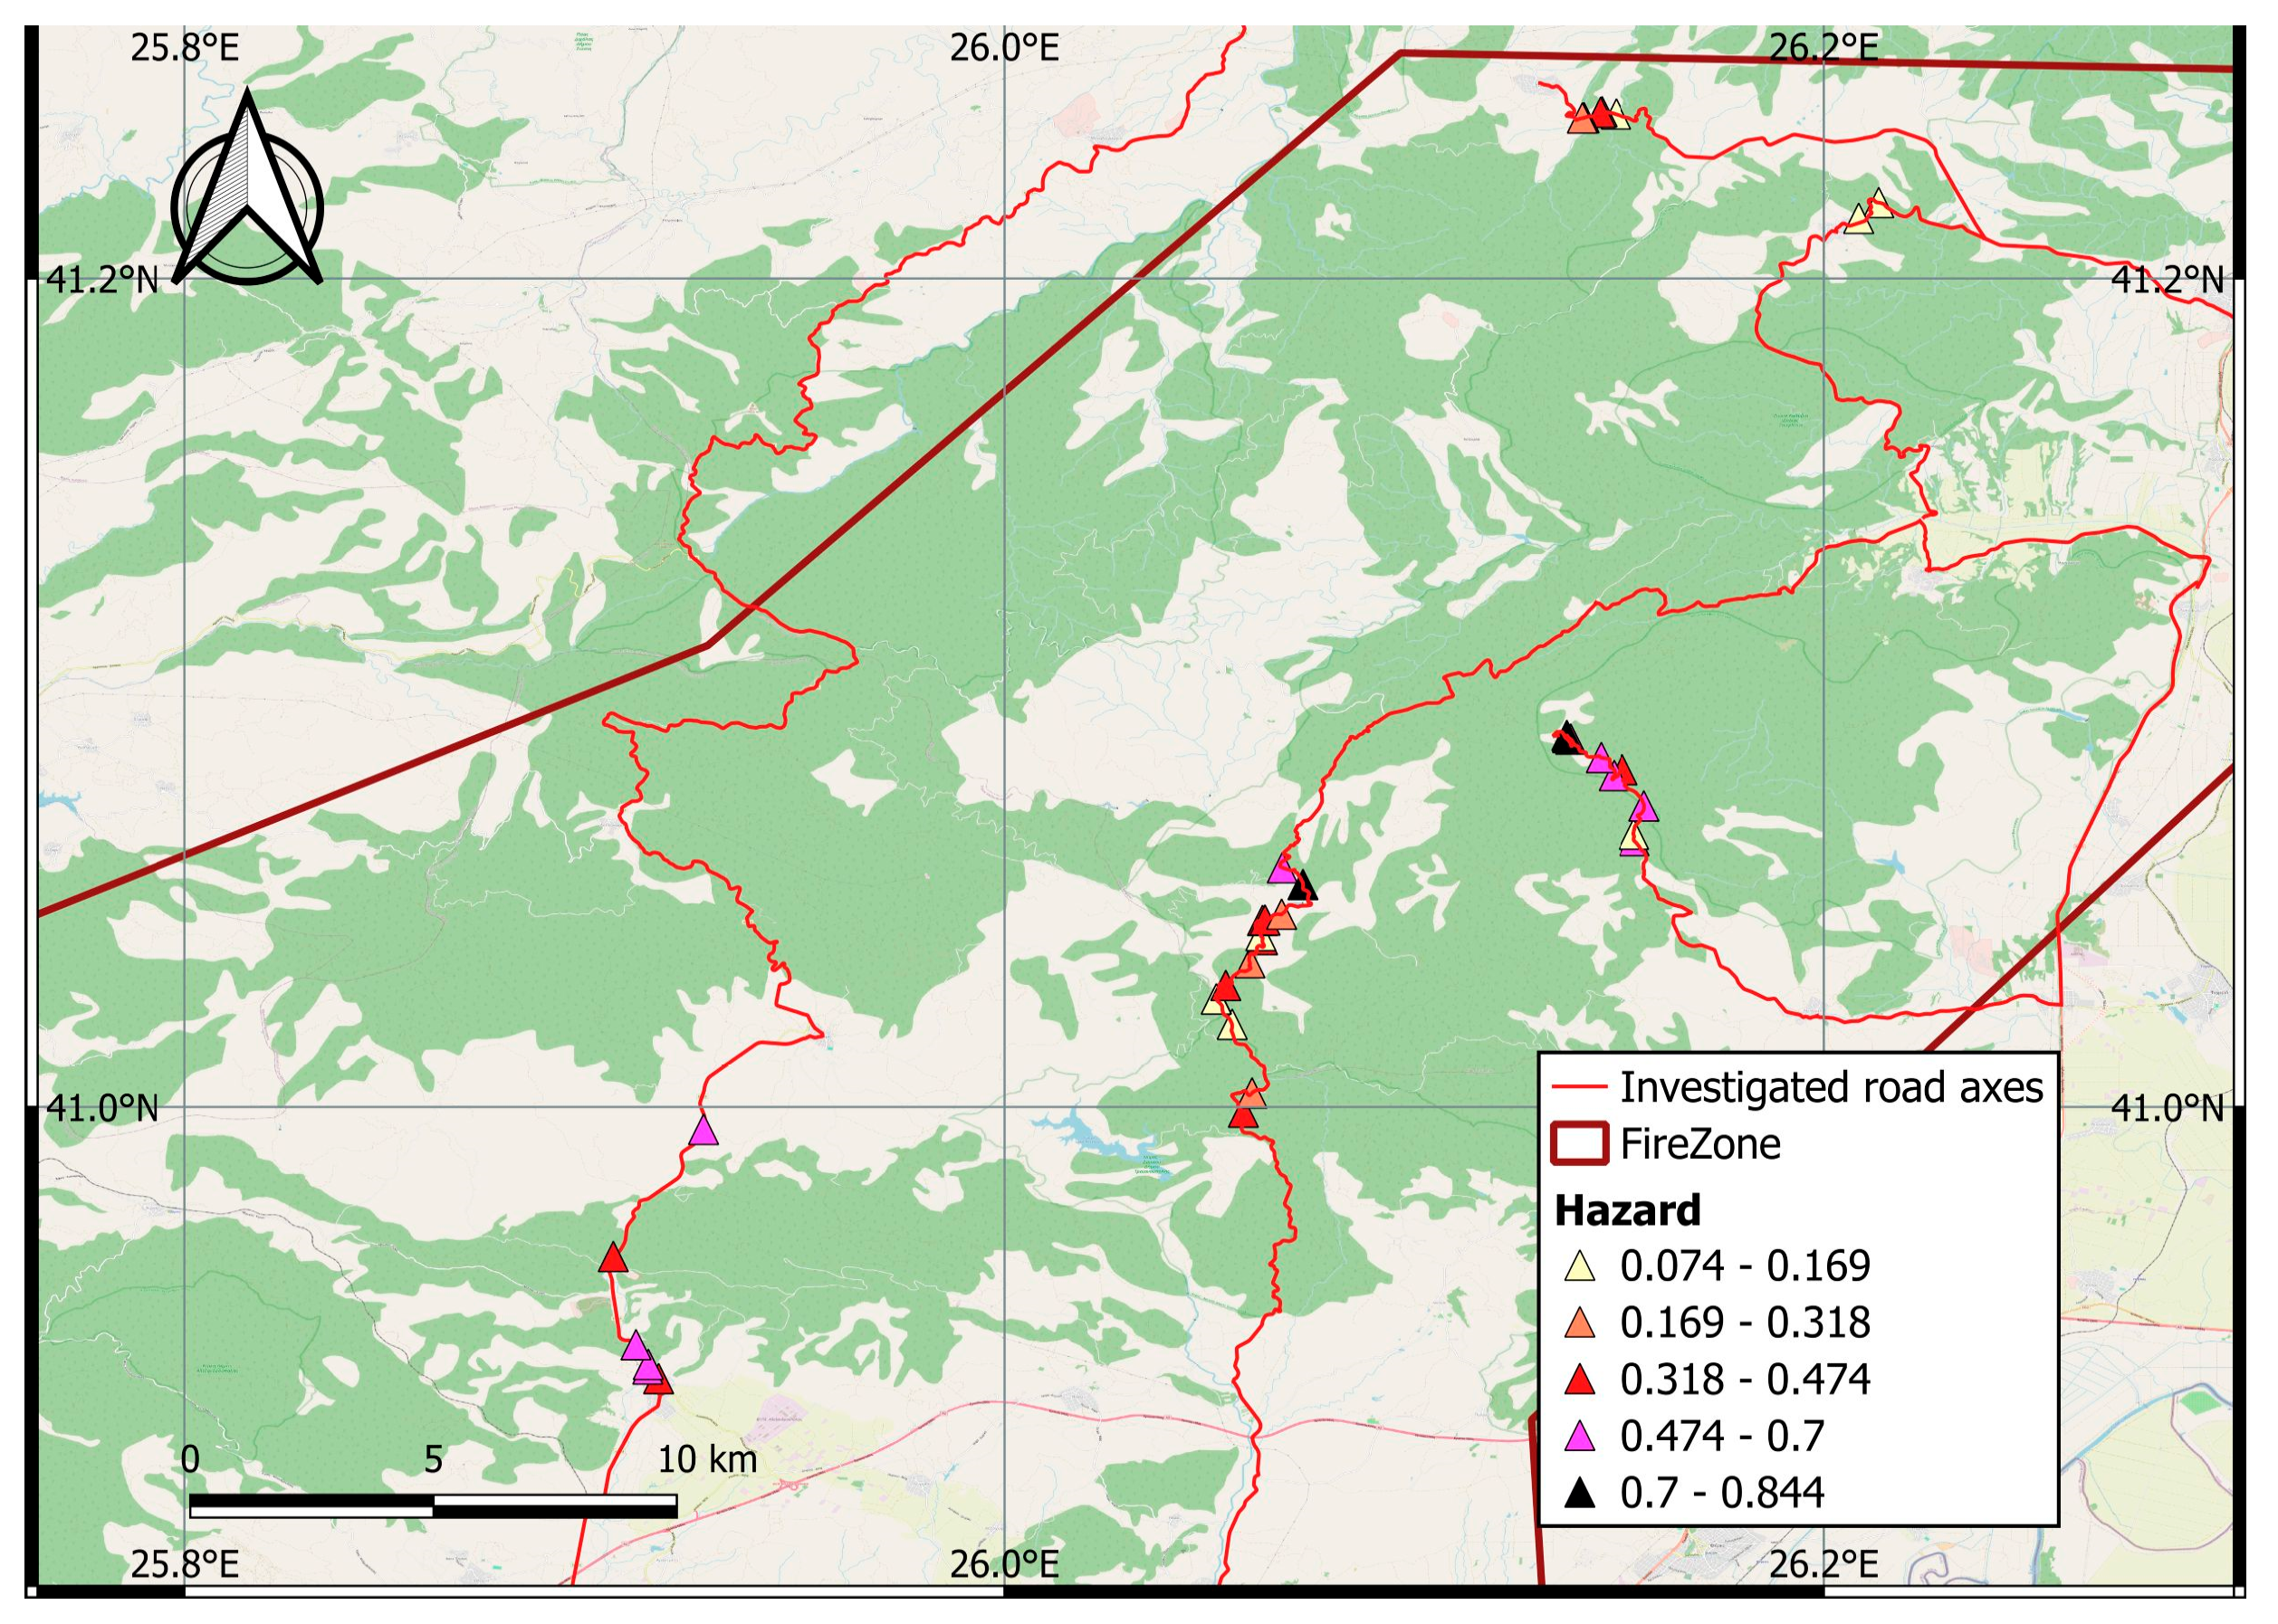
Figure 18 presents the rockfall hazard map of the examined locations using the normalized score, Enorm. The five classes of the Enorm were created using the Jenks algorithm [48]. This algorithm aims to minimize the standard deviation of scores within each class while maximizing the differences between the central values of different classes.
Since the system has a comparative character between the examined slopes, each class is given a qualitative description: (a) Low, (b) Moderate, (c) High, (d) Very High, and (e) Extreme.
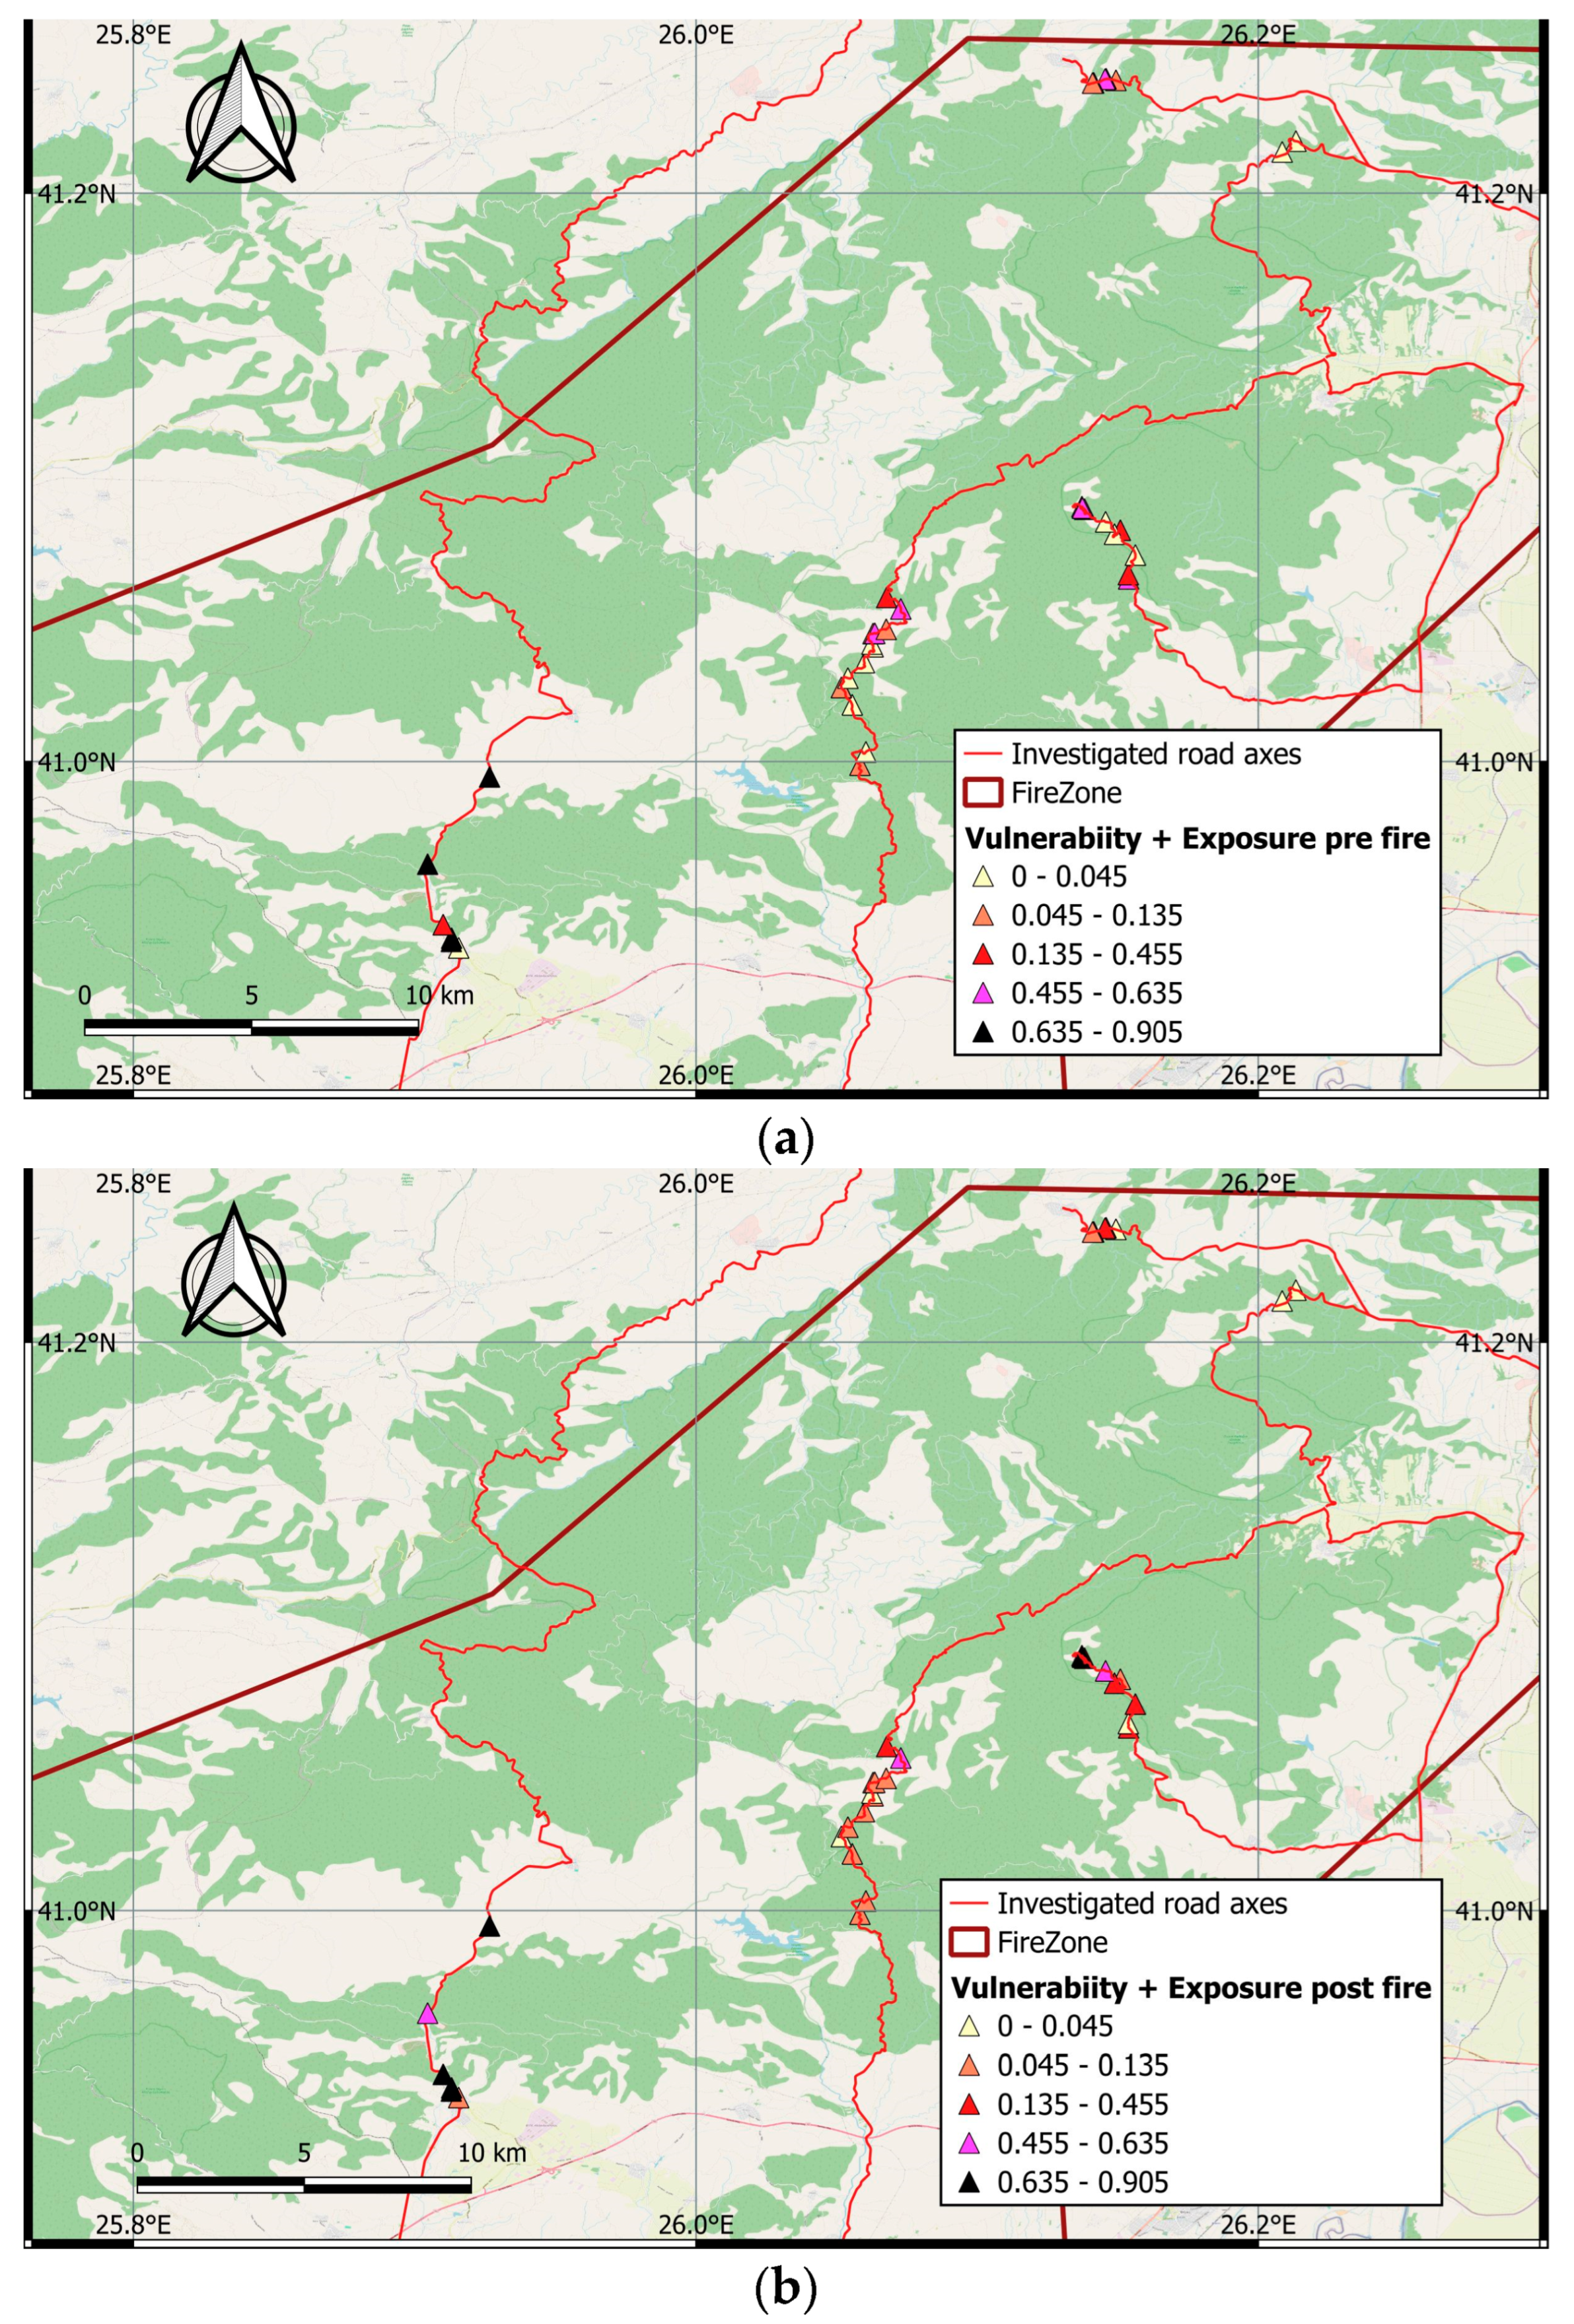
Figure 19 illustrates the qualitative classification of Vulnerability-Exposure (VE). A key aspect of this analysis is the comparison between subfigures a and b, which depict the VE scores before and after the wildfire, respectively. The five classes represented in these maps were also determined using the Jenks algorithm.
Before the wildfire (see Figure 19a), the majority of locations were classified as having “Low” (33%) and “Moderate” (22%) Vulnerability-Exposure (VE). The remaining classification included 12% for “High,” 22% for “Very High,” and 11% for “Extreme.” On the contrary, after the wildfire (see Figure 19b) and the vegetation loss, the percentages of the “Low” and “Moderate” VE classes dropped to zero, while the “Very High” VE class significantly increased. Specifically, after the fire, the proportions of the “High”, “Very High,” and “Extreme” VE classes were 8%, 78%, and 14%, respectively.
The impact of vegetation loss is further highlighted by comparing the subfigures in Figure 20, which depict the distribution of total risk (R) scores before and after the wildfire. Notably, before the wildfire, 61% of locations were classified as having “Low” risk, while the remaining classes accounted for 6%, 14%, 5%, and 14% of the study area, respectively.
Following the 2023 Evros wildfire, the proportion of locations classified as “Low” risk substantially decreased to 19%, accompanied by a significant increase in those classified as “Moderate” risk (39%). A slight increase was also noted in the proportions of the “High,” “Very High”, and “Extreme” risk classes, which reached 17%, 8%, and 17%, respectively.
The FiRo-Ris system is a qualitative rating tool, thus includes subjectivity. To assess subjective interpretations, the system was applied independently by two team members for each location. As is common with such systems, some user ratings variations were observed. However, these were not significant enough to change the overall qualitative interpretation of the results.

5. Discussion and Conclusions

The findings from the case study indicate that vegetation plays a vital role in reducing the propagation of rockfalls. Factors such as block size, slope inclination, vegetation density, the ability of vegetation to absorb the kinetic energy of falling rocks, and the height of the slope determine whether a rockfall will affect an infrastructure. The study shows that the destruction of vegetation after a wildfire can expand the area affected by rockfalls, thereby increasing risk. However, the evidence did not suggest that wildfires increase the susceptibility to rockfalls in the area affected by the 2023 Evros wildfire.
To assess the impact of vegetation loss on rockfall propagation, we employed the concept of reach angle and conducted a parametric analysis of the affected area. This approach allowed us to empirically correlate factors such as block size, slope inclination, vegetation density, and slope height with the trajectory length of rockfalls.
To evaluate the effects of the 2023 wildfire on the extensive area impacted, we adapted two existing hazard rating systems [24,33] to fit local conditions. FiRo-RiS (Fire Rockfall Risk System) draws upon the logic of these systems and introduces several important modifications. First, the scoring of Pierson’s parameters [24] was expressed in SI units and normalized to a maximum of 100, improving comparability. Second, the qualitative parameters of Eggers et al. [33] were expanded from three to five classes to capture intermediate conditions that are frequently observed in the field. Third, FiRo-RiS integrates a new exposure/vulnerability component, linked to reach angle correlations derived from extensive trajectory simulations. These changes provide a more comprehensive and flexible framework, particularly suited to post-fire contexts where vegetation loss must be taken into account.
Applying the FiRo-RiS system in the area affected by the Evros 2023 wildfire provided valuable insights into how vegetation loss impacts rockfall hazards and risks. There was a significant increase in Vulnerability-Exposure (VE) and total risk (R) following the wildfire. Before the fire, most locations showed low to moderate levels of VE and risk. However, after the fire, the loss of vegetation resulted in most locations being classified as high to extreme levels of VE and R. After implementing the system, areas with greater risk were systematically identified and prioritized.
The FiRo-RiS system serves as a tool for risk assessment in areas affected by fire. It provides a systematic method for evaluating rockfall risk, enabling decision-makers to prioritize mitigation efforts based on their relative severity. For example, extreme-risk road sections can be targeted for immediate interventions, such as installing protective barriers or implementing slope stabilization measures. On the other hand, areas with lower risk may not require urgent action. Furthermore, the system’s capability to measure changes in risk over time supports long-term planning and monitoring strategies.
Beyond the study area, the FiRo-RiS system has potential applications in fire-prone regions worldwide, particularly in mountainous terrain where rockfall is a common hazard. Its adaptability enables it to be implemented in various geographic contexts, providing local authorities and engineers with a reliable method to assess rockfall risk after wildfires.
However, FiRo-RiS does have some limitations. One significant challenge is the reliance on users to conduct field surveys and qualitatively assess specific properties, which introduces a degree of subjectivity. While implementation by multiple users for all sites can help mitigate this issue, some variability may remain. Additionally, although the semi-empirical correlations related to reach angles have high correlation coefficients, they do not fully account for all parameters that influence trajectory propagation.
A further limitation concerns the assumption of complete vegetation loss following the wildfire. While this conservative assumption guarantees that the worst-case conditions are captured, it may overestimate rockfall propagation in areas where some vegetation survived the fire. Future work should incorporate various vegetation recovery scenarios to assess the sensitivity of the results.
Another limitation is the system’s generalizability across different environmental settings. Although the study demonstrated its effectiveness in the examined area, variations in geological, climatic, and vegetation conditions could impact its applicability elsewhere. Future validation of FiRo-RiS in diverse environments will be essential to refine its effectiveness across broader contexts. Testing the system in various post-fire environments with differing conditions will help improve its generalizability.
Several potential enhancements could improve the FiRo-RiS system. One key aspect is reducing field subjectivity in parameter selection, which could be addressed through the integration of machine learning techniques and automated classification to improve consistency in parameter determination. Additionally, linking the system with remote sensing data, such as UAV-based photogrammetry and LiDAR, could enhance the efficiency of field data collection and provide higher-resolution inputs.
The FiRo-RiS system represents an advancement in post-fire rockfall risk assessment. With further refinements, it can potentially become a widely used tool for hazard mitigation and risk-informed decision-making in fire-affected mountainous regions worldwide.

Author Contributions

Conceptualization, P.A.; methodology, P.A., D.S. and E.P.; software, L.K., E.P. and P.A.; investigation and data curation, All authors; writing—original draft preparation, review and editing, P.A., D.S. and E.P.; supervision, project administration, and funding acquisition, P.A. All authors have read and agreed to the published version of the manuscript.

Funding

This research was funded by Democritus University of Thrace, grant number KE83226, under the initiative “DUTh To The People: Actions to Mitigate the Effects of the Devastating Fires in Thrace”.

Data Availability Statement

The original contributions presented in this study are included in the article. Further inquiries can be directed to the corresponding author(s).

Acknowledgments

The authors express their gratitude to Evangellos Evangellou and Theofilos Tzevelekis for their assistance in the field investigation.

Conflicts of Interest

The authors declare no conflicts of interest. The funder had no role in the design of the study; in the collection, analyses, or interpretation of data; in the writing of the manuscript; or in the decision to publish the results.

References

  1. Giannaros, T. Evros—The Largest Forest Fire of the Last 20 Years in Europe. Climatebook 2024. Available online: https://climatebook.gr/evros-i-megalyteri-dasiki-pyrkagia-ton-teleftaion-20-eton-stin-evropi/ (accessed on 10 May 2024).
  2. Liu, Y.; Stanturf, J.; Goodrick, S. Trends in global wildfire potential in a changing climate. For. Ecol. Manag. 2010, 259, 685–697. [Google Scholar] [CrossRef]
  3. Gehring, E.; Maringer, J. Disturbance Calls for Disaster: Why forest fires increase landslides and rockfall hazards. Res. Outreach 2020, 112, 122–125. [Google Scholar]
  4. Cunningham, C.X.; Williamson, G.J.; Bowman, D.M. Increasing frequency and intensity of the most extreme wildfires on Earth. Nat. Ecol. Evol. 2024, 8, 1420–1425. [Google Scholar] [CrossRef]
  5. Vahedifard, F.; Abdollahi, M.; Leshchinsky, B.A.; Stark, T.D.; Sadegh, M.; AghaKouchak, A. Interdependencies between wildfire-induced alterations in soil properties, near-surface processes, and geohazards. Earth Space Sci. 2024, 11, e2023EA003498. [Google Scholar] [CrossRef]
  6. Scheidl, C.; Heiser, M.; Vospernik, S.; Lauss, E.; Perzl, F.; Kofler, A.; Kleemayr, K.; Bettella, F.; Lingua, E.; Garbarino, M. Assessing the protective role of alpine forests against rockfall at regional scale. Eur. J. For. Res. 2020, 139, 969–980. [Google Scholar] [CrossRef]
  7. De Graff, J.V.; Gallegos, A.J. The challenge of improving identification of rockfall hazard after wildfires. Environ. Eng. Geosci. 2012, 18, 389–397. [Google Scholar] [CrossRef]
  8. De Graff, J.V.; Shelmerdine, B.; Gallegos, A.; Annis, D. Uncertainty associated with evaluating rockfall hazard to roads in burned areas. Environ. Eng. Geosci. 2015, 21, 21–33. [Google Scholar] [CrossRef]
  9. Melzner, S.; Shtober-Zisu, N.; Katz, O.; Wittenberg, L. Brief communication: Post-wildfire rockfall risk in the eastern Alps. Nat. Hazards Earth Syst. Sci. 2019, 19, 2879–2885. [Google Scholar] [CrossRef]
  10. Pérez-Rey, I.; Sarro, R.; Tomás, R.; Alejano, L.R.; Gutiérrez, L.H.; Mateos, R.M.; Riquelme, A. A brief review of the effect of wildfires on rockfall occurrence. IOP Conf. Ser. Earth Environ. Sci. 2023, 1124, 012122. [Google Scholar] [CrossRef]
  11. Sarro, R.; Pérez-Rey, I.; Tomás, R.; Alejano, L.R.; Hernandez-Gutierrez, L.E.; Mateos, R.M. Effects of wildfire on rockfall occurrence: A review through actual cases in Spain. Appl. Sci. 2021, 11, 2545. [Google Scholar] [CrossRef]
  12. Moos, C.; Dorren, L.; Stoffel, M. Quantifying the effect of forests on frequency and intensity of rockfalls. Nat. Hazards Earth Syst. Sci. 2017, 17, 291–304. [Google Scholar] [CrossRef]
  13. Dorren, L.K.; Berger, F.; Le Hir, C.; Mermin, E.; Tardif, P. Mechanisms, effects and management implications of rockfall in forests. For. Ecol. Manag. 2005, 215, 183–195. [Google Scholar] [CrossRef]
  14. Dupire, S.; Bourrier, F.; Monnet, J.-M.; Bigot, S.; Borgniet, L.; Berger, F.; Curt, T. Novel quantitative indicators to characterize the protective effect of mountain forests against rockfall. Ecol. Indic. 2016, 67, 98–107. [Google Scholar] [CrossRef]
  15. Stoffel, M.; Wehrli, A.; Kühne, R.; Dorren, L.K.; Perret, S.; Kienholz, H. Assessing the protective effect of mountain forests against rockfall using a 3D simulation model. For. Ecol. Manag. 2006, 225, 113–122. [Google Scholar] [CrossRef]
  16. Dorren, L.; Berger, F.; Putters, U. Real-size experiments and 3-D simulation of rockfall on forested and non-forested slopes. Nat. Hazards Earth Syst. Sci. 2006, 6, 145–153. [Google Scholar] [CrossRef]
  17. Radtke, A.; Toe, D.; Berger, F.; Zerbe, S.; Bourrier, F. Managing coppice forests for rockfall protection: Lessons from modeling. Ann. For. Sci. 2014, 71, 485–494. [Google Scholar] [CrossRef]
  18. Lanfranconi, C.; Sala, G.; Frattini, P.; Crosta, G.; Valagussa, A. Assessing the rockfall protection efficiency of forests at the regional scale. Landslides 2020, 17, 2703–2721. [Google Scholar] [CrossRef]
  19. Song, K.; Yang, H.; Liang, D.; Chen, L.; Qu, L.; Chen, C. Assessment and Mechanism Analysis of Forest Protection against Rockfall in a Large Rock Avalanche Area. Forests 2023, 14, 1982. [Google Scholar] [CrossRef]
  20. Maringer, J.; Ascoli, D.; Dorren, L.; Bebi, P.; Conedera, M. Temporal trends in the protective capacity of burnt beech forests (Fagus sylvatica L.) against rockfall. Eur. J. For. Res. 2016, 135, 657–673. [Google Scholar] [CrossRef]
  21. Guasti, G.U.; Caprinali, A.; Majorca, L. Rockfall and debris flow hazards after summer wildfires in Cerreto Sannita, Benevento, Italy. Landslide Sci. Pract. 2013, 4, 217–225. [Google Scholar] [CrossRef]
  22. Ferrari, F.; Giacomini, A.; Thoeni, K. Qualitative rockfall hazard assessment: A comprehensive review of current rractices. Rock Mech. Rock Eng. 2016, 49, 2865–2922. [Google Scholar] [CrossRef]
  23. Sotiriadis, D.; Klimis, N.; Koutsoupaki, E.I.; Petala, E.; Valkaniotis, S.; Taftsoglou, M.; Margaris, V.; Dokas, I. Toward a plausible methodology to assess rock slope instabilities at a regional scale. Geosciences 2023, 13, 98. [Google Scholar] [CrossRef]
  24. Pierson, L.A. The Rockfall Hazard Rating System; Oregon State Highway Division, Engineering Geology Group: Salem, OR, USA, 1991. [Google Scholar]
  25. Fell, R.; Corominas, J.; Bonnard, C.; Cascini, L.; Leroi, E.; Savage, W.Z. Guidelines for landslide susceptibility, hazard and risk zoning for land use planning. Eng. Geol. 2008, 102, 85–98. [Google Scholar] [CrossRef]
  26. Hadjin, D.J. New York State Department of Transportation rock slope rating procedure and rockfall assessment. Transp. Res. Rec. 2002, 1786, 60–68. [Google Scholar] [CrossRef]
  27. Budetta, P. Assessment of rockfall risk along roads. Nat. Hazards Earth Syst. Sci. 2004, 4, 71–81. [Google Scholar] [CrossRef]
  28. Maerz, N.H.; Youssef, A.; Fennessey, T.W. New risk–consequence rockfall hazard rating system for Missouri highways using digital image analysis. Environ. Eng. Geosci. 2005, 11, 229–249. [Google Scholar] [CrossRef]
  29. Shakoor, A.; Woodard, M.J. Development of a Rockfall Hazard Rating Matrix for the State of Ohio; Kent State University Dept of Geology: Kent, OH, USA, 2005. [Google Scholar]
  30. Santi, P.M.; Russell, C.P.; Higgins, J.D.; Spriet, J.I. Modification and statistical analysis of the Colorado rockfall hazard rating system. Eng. Geol. 2009, 104, 55–65. [Google Scholar] [CrossRef]
  31. Franklin, J.; Wood, D.; Senior, S.; Blair, J.; Wright, J. RHRON: Ontario Rockfall Hazard Rating System—Field Procedures Manual; Ontario Ministry of Transportation Materials Engineering and Research Office Report MERO-043; Ontario Ministry of Transportation (MTO): Toronto, ON, Canada, 2013. [Google Scholar]
  32. Saroglou, H.; Marinos, P.; Tsiambaos, G. Rockfall hazard and risk assessment: An example from a high promontory at the historical site of Monemvasia, Greece. Nat. Hazards Earth Syst. Sci. 2012, 12, 1823–1836. [Google Scholar] [CrossRef]
  33. Eggers, M.; Nash, T.; Dwumfour, D.; Turbitt, S.; Dixon, J. Natural Slope Hazard Management and Integration with Mining Operations; Australian Centre for Geomechanics: Perth, Australia, 2021. [Google Scholar] [CrossRef]
  34. Dorren, L.K. Rockyfor3D (v5. 2) Revealed—Transparent Description of the Complete 3D Rockfall Model; EcorisQ Paper: Geneva, Switzerland, 2015; Available online: http://www.ecorisq.org (accessed on 1 April 2024).
  35. Rocscience. Dips: Stereonet Analysis for Engineering Geology, Version 8.0; Rocscience Inc.: Toronto, ON, Canada, 2023. [Google Scholar]
  36. Saroglou, H.; Berger, F.; Bourrier, F.; Asteriou, P.; Tsiambaos, G.; Tsagkas, D. Effect of Forest Presence on Rockfall Trajectory. An Example from Greece. In Engineering Geology for Society and Territory-Volume 2: Landslide Processes; Springer: Cham, Switzerland, 2015. [Google Scholar] [CrossRef]
  37. Corona, C.; Lopez-Saez, J.; Favillier, A.; Mainieri, R.; Eckert, N.; Trappmann, D.; Stoffel, M.; Bourrier, F.; Berger, F. Modeling rockfall frequency and bounce height from three-dimensional simulation process models and growth disturbances in submontane broadleaved trees. Geomorphology 2017, 281, 66–77. [Google Scholar] [CrossRef]
  38. Fell, R.; Ho, K.K.; Lacasse, S.; Leroi, E. A Framework for Landslide Risk Assessment and Management. In Landslide Risk Management; CRC Press: Boca Raton, FL, USA, 2005; pp. 13–36. [Google Scholar]
  39. Corominas, J.; van Westen, C.; Frattini, P.; Cascini, L.; Malet, J.-P.; Fotopoulou, S.; Catani, F.; Van Den Eeckhaut, M.; Mavrouli, O.; Agliardi, F. Recommendations for the quantitative analysis of landslide risk. Bull. Eng. Geol. Environ. 2014, 73, 209–263. [Google Scholar] [CrossRef]
  40. D’Amato, J.; Hantz, D.; Guerin, A.; Jaboyedoff, M.; Baillet, L.; Mariscal, A. Influence of meteorological factors on rockfall occurrence in a middle mountain limestone cliff. Nat. Hazards Earth Syst. Sci. 2016, 16, 719–735. [Google Scholar] [CrossRef]
  41. Heim, A. Bergsturz und Menschenleben; Fretz und Wasmuth: Zurich, Switzerland, 1932. [Google Scholar]
  42. Evans, S.; Hungr, O. The assessment of rockfall hazard at the base of talus slopes. Can. Geotech. J. 1993, 30, 620–636. [Google Scholar] [CrossRef]
  43. Corominas, J. The angle of reach as a mobility index for small and large landslides. Can. Geotech. J. 1996, 33, 260–271. [Google Scholar] [CrossRef]
  44. RocScience. Rocfall—Probabilistic Analysis of Rockfalls on Slopes, Version 2023.1; Rocscience Inc.: Toronto, ON, Canada, 2024. [Google Scholar]
  45. Ashayer, P. Application of Rigid Body Impact Mechanics and Discrete Element Modeling to Rockfall Simulation; Library and Archives Canada: Ottawa, ON, Canada, 2007. [Google Scholar]
  46. Leine, R.I.; Schweizer, A.; Christen, M.; Glover, J.; Bartelt, P.; Gerber, W. Simulation of rockfall trajectories with consideration of rock shape. Multibody Syst. Dyn. 2014, 32, 241–271. [Google Scholar] [CrossRef]
  47. Bartelt, P.; Bieler, C.; Buhler, Y.; Christen, M.; Dreier, L.; Gerber, W.; Glover, J.; Schneider, M. RAMMS::ROCKFALL User Manual v1.8; WSL Institute for Snow and Avalanche Research SLF: Davos, Switzerland, 2024; p. 149. [Google Scholar]
  48. Jenks, G.F. The data model concept in statistical mapping. Int. Yearb. Cartogr. 1967, 7, 186–190. [Google Scholar]
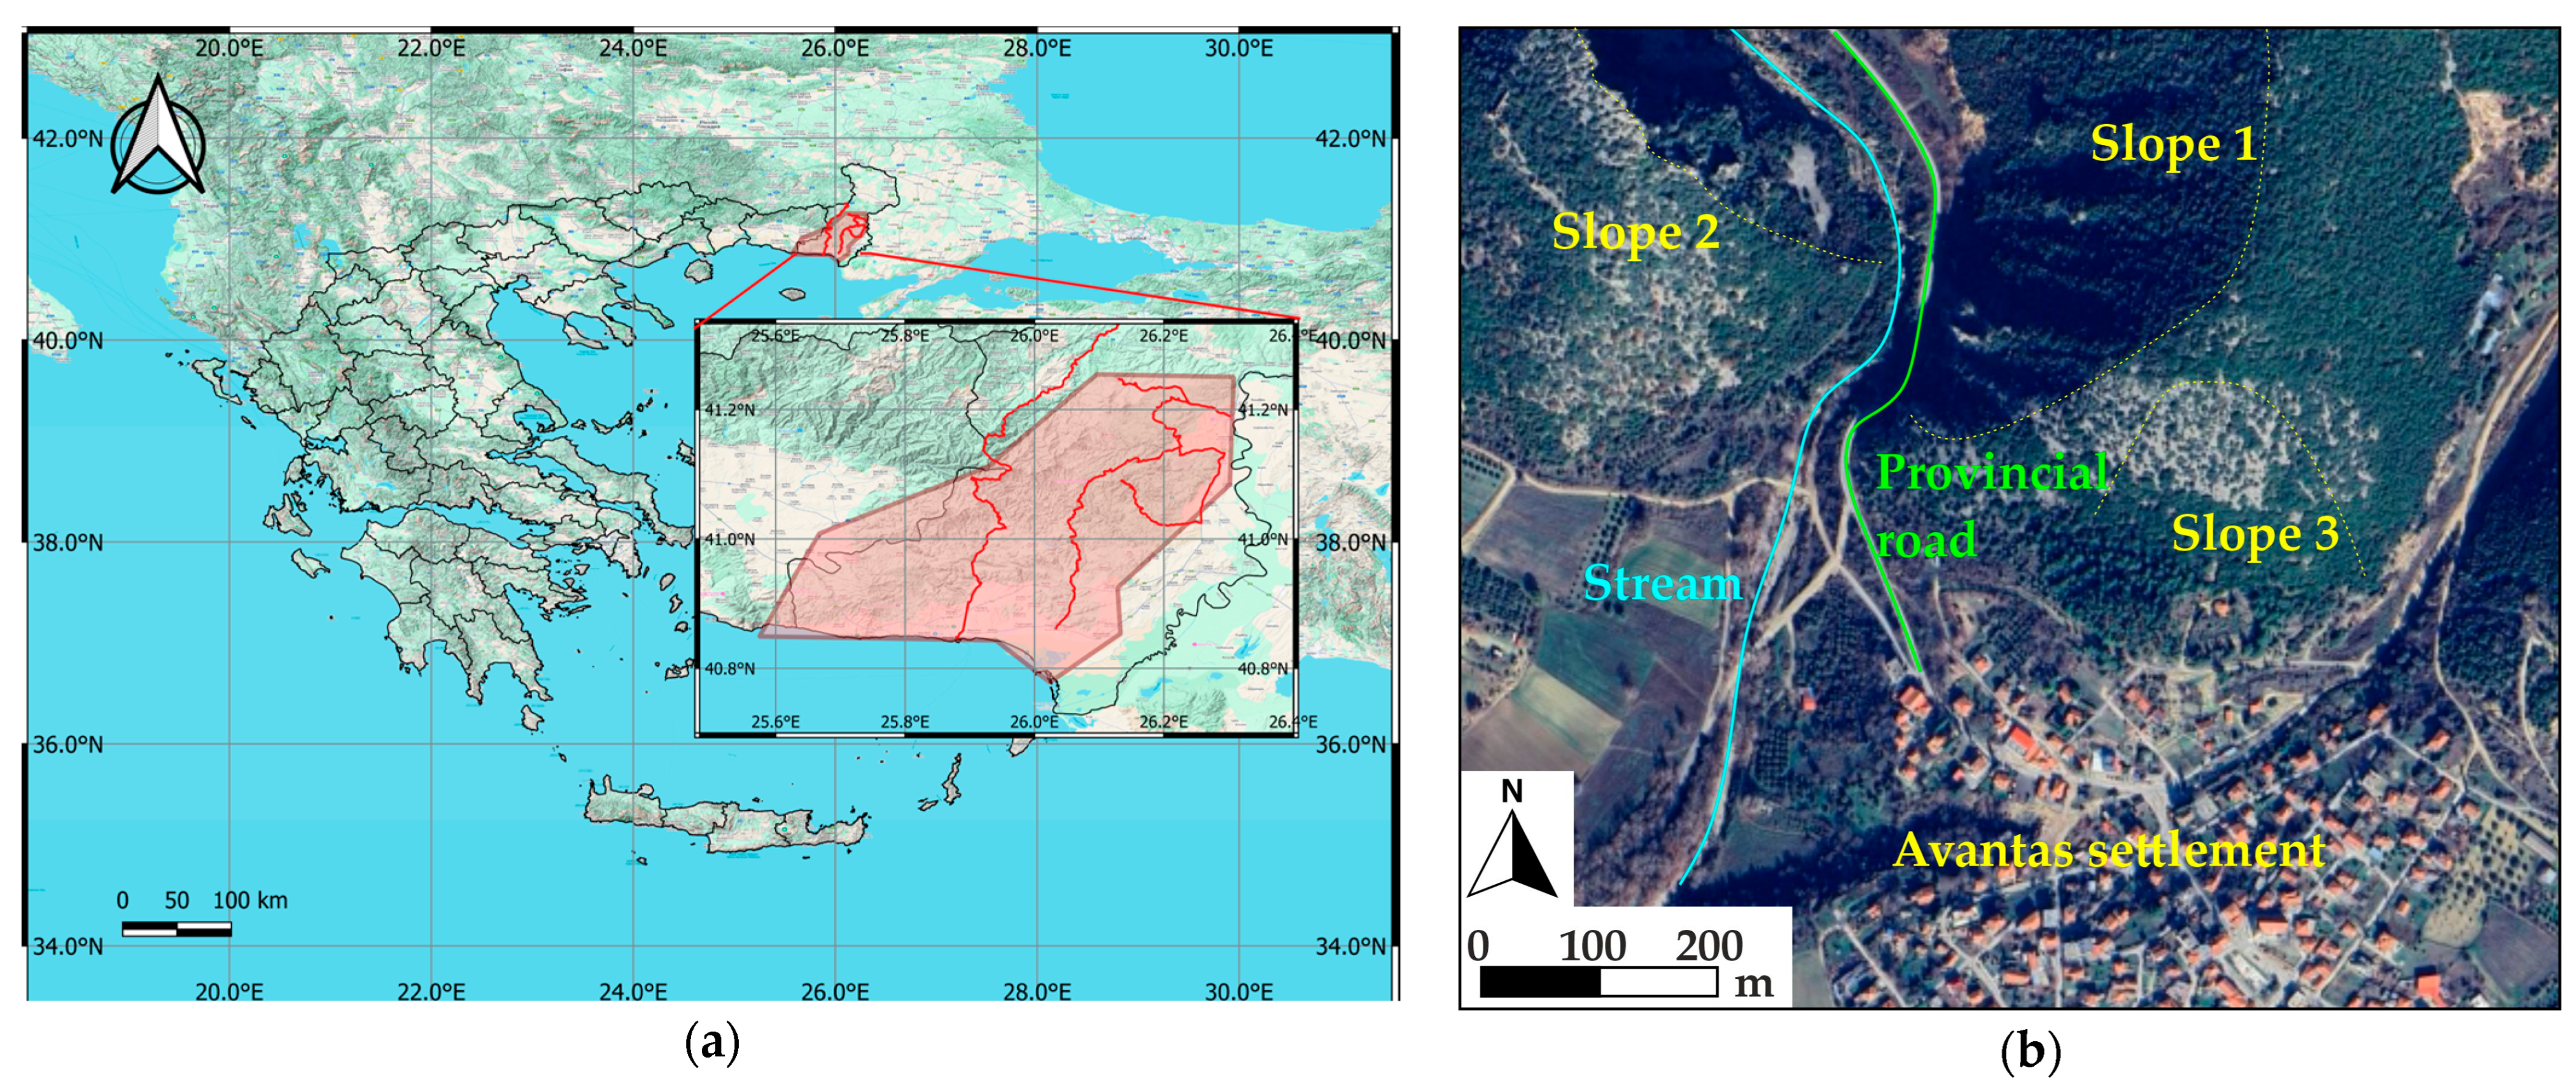
Figure 1. (a) Relative location of the study area with respect to Greece. (b) Aerial photo of the Avantas study area.
Geohazards 06 00054 g001
Figure 2. Slope 1: before (a) and after (b) the Evros 2023 wildfire and (c) typical cross-section.
Geohazards 06 00054 g002
Figure 3. Slope 2: before (a) and after (b) the Evros 2023 wildfire and (c) typical cross-section.
Geohazards 06 00054 g003
Figure 4. Slope 3: before (a) and after (b) the Evros 2023 wildfire and (c) typical cross-section. Note the residence before (a) and after the (b) the wildfire in the yellow circle.
Geohazards 06 00054 g004
Figure 5. Geological map of the area. The black lines correspond to the typical cross-sections in Figure 2, Figure 3 and Figure 4.
Geohazards 06 00054 g005
Figure 6. Rock fragment distribution at the base of the slopes.
Geohazards 06 00054 g006
Figure 7. Vegetation before (a) and after (b) the fire, as well as a general view of current vegetation conditions (c).
Geohazards 06 00054 g007
Figure 8. Trajectory endpoints for Slope 1 with rectangular blocks of 0.01 m3 (a) before and (b) after the wildfire.
Geohazards 06 00054 g008
Figure 9. Trajectory endpoints for Slope 1 with rectangular blocks of 0.125 m3 (a) before and (b) after the wildfire.
Geohazards 06 00054 g009
Figure 10. Trajectory endpoints for Slope 2 with rectangular blocks of 0.01 m3 (a) before and (b) after the wildfire.
Geohazards 06 00054 g010
Figure 11. Trajectory endpoints for Slope 3 with rectangular blocks of 0.01 m3; (a) before and (b) after the wildfire.
Geohazards 06 00054 g011
Figure 12. Geometry and parameter definitions used in the parametric analysis.
Geohazards 06 00054 g012
Figure 13. Indicative trends observed from the parametric analysis; (a) basic reach angle (rbas) as a function of the block volume and the slope height on bare slopes, and (b) reach angle (r) as a function of vegetation density and the slope height.
Geohazards 06 00054 g013
Figure 14. Comparison between analysis results and prediction of the reach angle correlations; (a) basic reach angle, (b) reach angle, and (c) relative error.
Geohazards 06 00054 g014
Figure 15. Geometry for rating parameter R1.
Geohazards 06 00054 g015
Figure 16. The proposed Post-fire Rockfall Hazard-Risk Assessment System, FiRo-RiS.
Geohazards 06 00054 g016
Figure 17. Overview of the surveyed routes (in red) and slopes (black triangles) examined.
Geohazards 06 00054 g017
Figure 18. Normalized Rockfall Hazard map.
Geohazards 06 00054 g018
Figure 19. Normalized Vulnerability—Exposure (VE) maps (a) before and (b) after the wildfire.
Geohazards 06 00054 g019
Figure 20. Normalized Risk (R) maps; (a) before and (b) after the wildfire.
Geohazards 06 00054 g020
Table 1. Rating for the rock mass condition: Parameter H4.
ClassSource Zone ConditionsBlock DevelopmentMarks
A—TightTightly interlocked, undisturbed with closed defectsNot visible3
BBetween A and CBetween A and C9
C—PartiallyPoorly interlocked, partially disturbed with defects open <10 mmSome development27
DBetween C and EBetween C and E81
E—LoosenedDisconnected, disturbed with defects >10 mmClear development100
Table 2. Rating for the temporal occurrence of rockfalls: Parameter H5.
ClassRockfall ScarsPast EvidenceRockfall FragmentsMarks
A—No activityNot visibleNo accumulationNo fragments3
BBetween A and CBetween A and CBetween A and C9
C—Past activityVisible, degradedSome accumulationDistinctly weathered27
DBetween C and EBetween C and EBetween C and E81
E—Recent activityVisible, freshSignificant accumulationFresh or slightly weathered100
Table 3. Parameters and their discrete values used in the parametric analysis.
ParameterDiscrete Values
Slope height, h [m]15, 30, 45
Slope angle, θ [°]45, 60, 75
Vegetation density, ρ, [m2/m2]0, 0.01, 0.03, 0.05
Block Volume, v [m3]0.01, 0.05, 0.1, 0.025, 0.5, 1
Disclaimer/Publisher’s Note: The statements, opinions and data contained in all publications are solely those of the individual author(s) and contributor(s) and not of MDPI and/or the editor(s). MDPI and/or the editor(s) disclaim responsibility for any injury to people or property resulting from any ideas, methods, instructions or products referred to in the content.