1. Introduction
A flood hazard refers to the likelihood of a flood event with a specific intensity and recurrence interval occurring in a given location and timeframe [
1,
2]. Building on this concept, flood susceptibility represents an area’s inherent vulnerability to flooding based on its physical characteristics, indicating where floods are likely to occur without predicting their frequency [
3,
4].
The recent increase in the frequency and severity of extreme weather events (wildfires, floods, heatwaves, etc.) underscores the devastating impacts of climate change worldwide [
5,
6]. Due to climate change impacts and the increasing concentration of populations near coastal areas, lakeshores, and river basins, flooding has become one of the most frequent and devastating disasters, causing severe damage to communities, livelihoods and critical infrastructure [
7,
8]. Floods have accounted for 44% of all disaster events during the last 5 decades (1970–2019), affecting over 2.3 billion people worldwide between 1980 and 2009 and contributing to mass displacement, injuries and the spread of waterborne diseases [
7,
9].
According to [
9], economic losses from weather-, climate- and water-related disasters have been estimated at USD 3.6 trillion globally between 1970 and 2019, with floods alone accounting for 31% of that total. In Africa, floods were responsible for 34% of the USD 38.5 billion disaster-related economic losses. In the Democratic Republic of Congo, floods between October 2023 and January 2024 affected at least 300,000 people, caused approximately 300 deaths and the destruction of more than 43,000 houses, and severely impacted infrastructure and agricultural land [
10,
11].
In the past five years, the city of Uvira in the Democratic Republic of Congo has experienced several flood events. In April 2020, catastrophic flooding affected 9 out of the city’s 14 neighborhoods, resulting in at least 38 deaths, 185 injuries, 100 separated children and the displacement of approximately 70,000 people [
12,
13]. Flooding in Uvira predominantly occurs during the rainy season, when rivers overflow due to extreme rainfall events. The most recent incidents were reported in 2024, when the city experienced intense flooding in May, June, and July, leading to the displacement of 1200 people to camps under deplorable conditions [
14].
Uvira features several rivers, including the Kavimvira, Mulongwe, and Kalimabenge, which frequently overflow during periods of heavy rainfall. The city is also located along the shores of Lake Tanganyika, whose water level has risen by approximately 2 m since 2019 [
15,
16]. In total, 61.9% of Uvira’s land area has a slope of less than 2%, and 78.2% is considered susceptible to flooding when slope is taken into account [
17].
Accurate flood susceptibility mapping is essential for risk mitigation. GISs and remote sensing have emerged as powerful tools for assessing flood-prone areas, particularly in data-scarce regions [
18]. Machine Learning (ML) has also emerged as another powerful tool for flood susceptibility mapping (FSM), offering predictive capabilities through algorithms like Neural Networks and ensemble models [
19]. Its methods, such as Neural Networks (NNs), ensemble models, and hybrid approaches, have shown promise in flood modeling but face challenges like overfitting, data inconsistency, and limited real-time predictive capacity [
20], especially in data-scarce regions like Uvira. In contrast, GISs and RS techniques are essential and widely applied to assess flood risks and enhance disaster preparedness and response [
18]. Multi-Criteria Decision Making (MCDM) techniques like the AHP offer a robust framework for integrating diverse flood-conditioning factors (e.g., slope, land use, rainfall, and proximity to water) into spatial assessments [
21,
22,
23]. This approach aligns with methodologies applied in other contexts, such as railway infrastructure resilience studies, where GIS-based AHP models identified flood-prone zones to prioritize maintenance and disaster planning [
24].
The integration of GISs and RS with the AHP facilitates the evaluation of flood susceptibility factors within a given area. This approach has consistently proven effective for flood susceptibility mapping across various regions [
21,
22]. For example, ref. [
23] demonstrated the application of the AHP in Kota Belud, Malaysia, where topographic and environmental factors were integrated to provide a comprehensive assessment of flood-prone zones. Furthermore, RS techniques are particularly useful in data-scarce regions, offering valuable spatial insights to support flood management efforts. The AHP also enables the prioritization of risk factors by assigning them scores based on their relative importance in a specific context [
25].
Despite Uvira’s acute vulnerability to recurrent floods, existing studies have focused narrowly on post-disaster impact assessments [
13] or community resilience strategies [
16], leaving a critical gap in proactive, spatially explicit flood susceptibility mapping. While GISs and AHP-based approaches have been widely applied elsewhere [
21,
22,
23], their use in data-scarce African urban contexts particularly in the Great Lakes region remains limited. No prior study has integrated Uvira’s unique drivers (lake-level rise, dense river networks, and rapid urbanization) into a comprehensive risk model, hindering evidence-based mitigation planning.
This study provides the first high-resolution flood susceptibility map of Uvira, addressing an urgent need for actionable risk intelligence. By combining open access remote sensing data with AHP-weighted multi-criteria analysis, the methodology offers a replicable framework for flood-prone cities with similar data constraints. The results directly inform land use zoning, early-warning systems, and infrastructure priorities while filling a key gap in climate adaptation planning for Central Africa’s rapidly urbanizing lakeshore communities.
The primary objective of this study is to assess and map flood susceptibility in Uvira, the Democratic Republic of Congo, using a GIS, RS and the AHP. This approach aims to identify flood-prone areas and inform urban planning and flood management strategies. The significance of this study lies in its potential to enhance flood management practices in Uvira by pinpointing high-risk zones, thereby benefiting urban planners, policymakers, and communities at risk of flooding. Given the demonstrated effectiveness of these methods in various regions, the study’s methodology can also be replicated to other flood-prone areas worldwide to improve disaster preparedness and resilience.
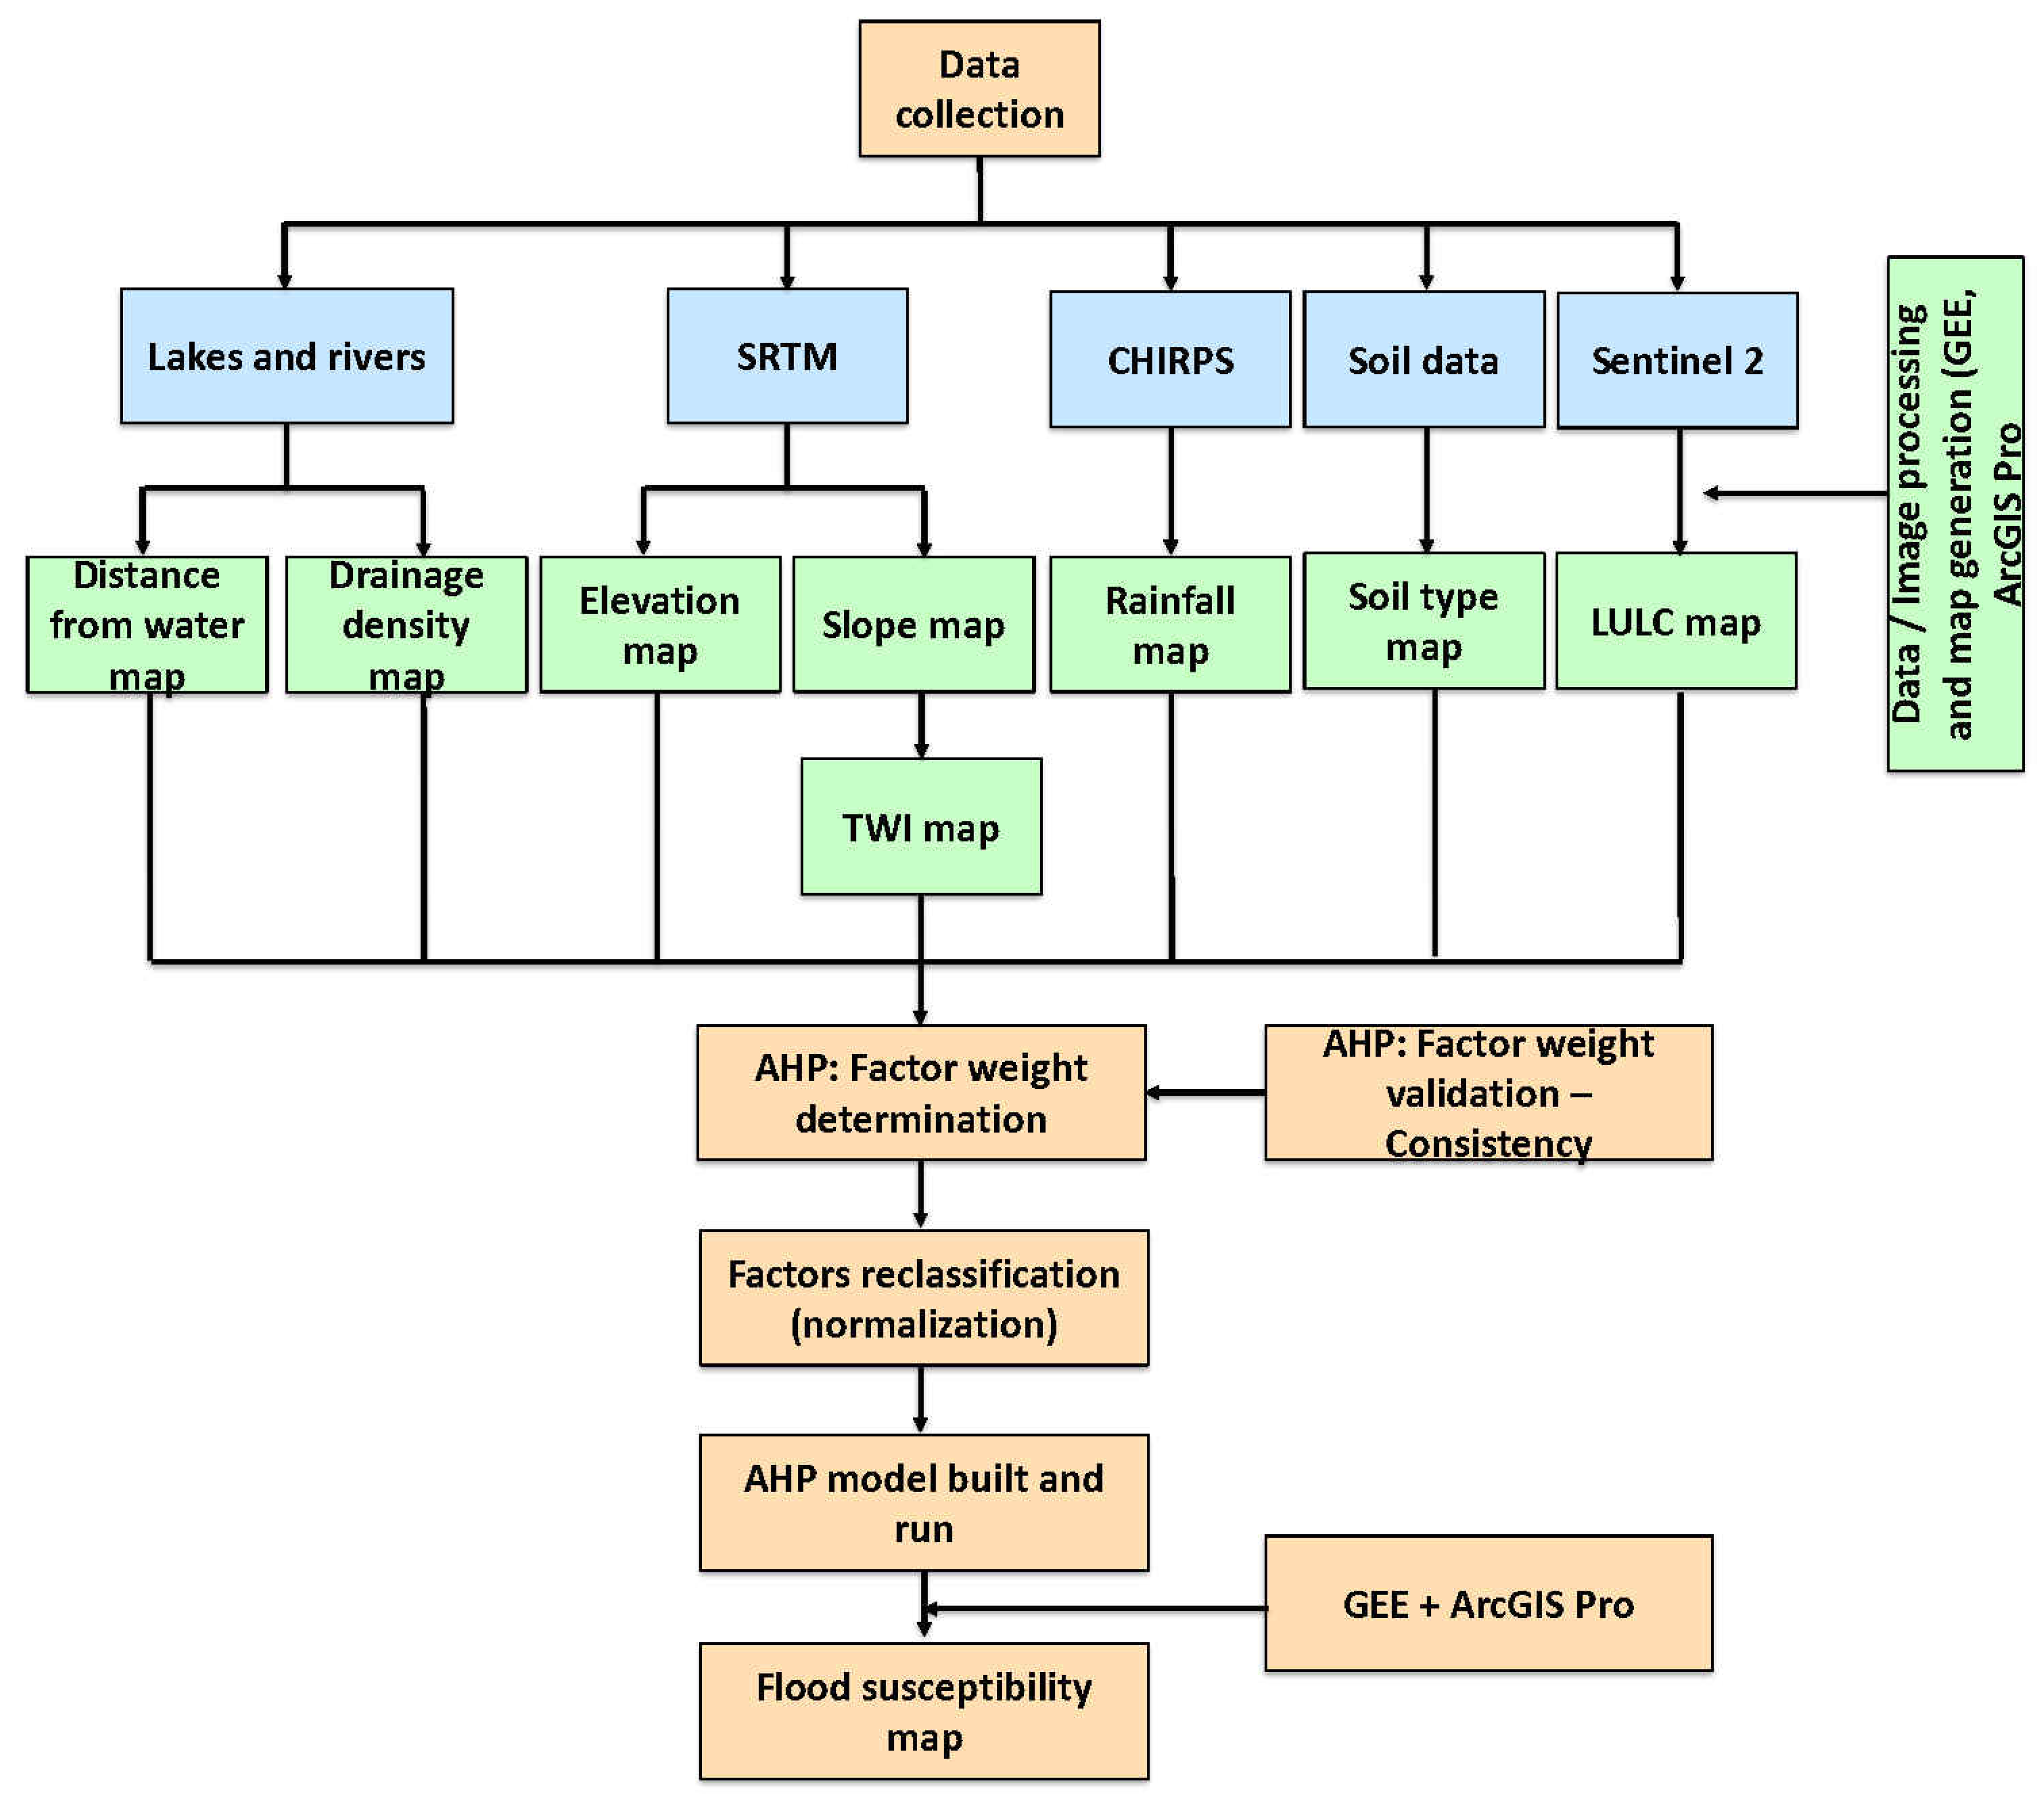
This study contributes to flood risk assessments by integrating the AHP with a map removal sensitivity analysis to produce and verify a flood susceptibility map for Uvira. While the AHP is a widespread method used in multi-criteria flood assessments, it is usually coupled with expert opinion in previous studies without any further empirical verification. With the incorporation of a spatially explicit sensitivity analysis, this study enables a more efficient evaluation of factor influence, leading to more transparent and reliable results. Implementing this methodology in Google Earth Engine also ensures computational efficiency and replicability, which is vital in data-constrained urban environments. Applying this integrated approach to the less-studied Uvira context addresses a crucial void and offers practical information for flood risk management in analogous contexts.
3. Results
This study successfully assessed flood susceptibility in the city of Uvira, using a GIS and RS through the AHP that integrated eight flood-inducing factors. The results are structured in the following sections:
3.1. Flood-Inducing Factors
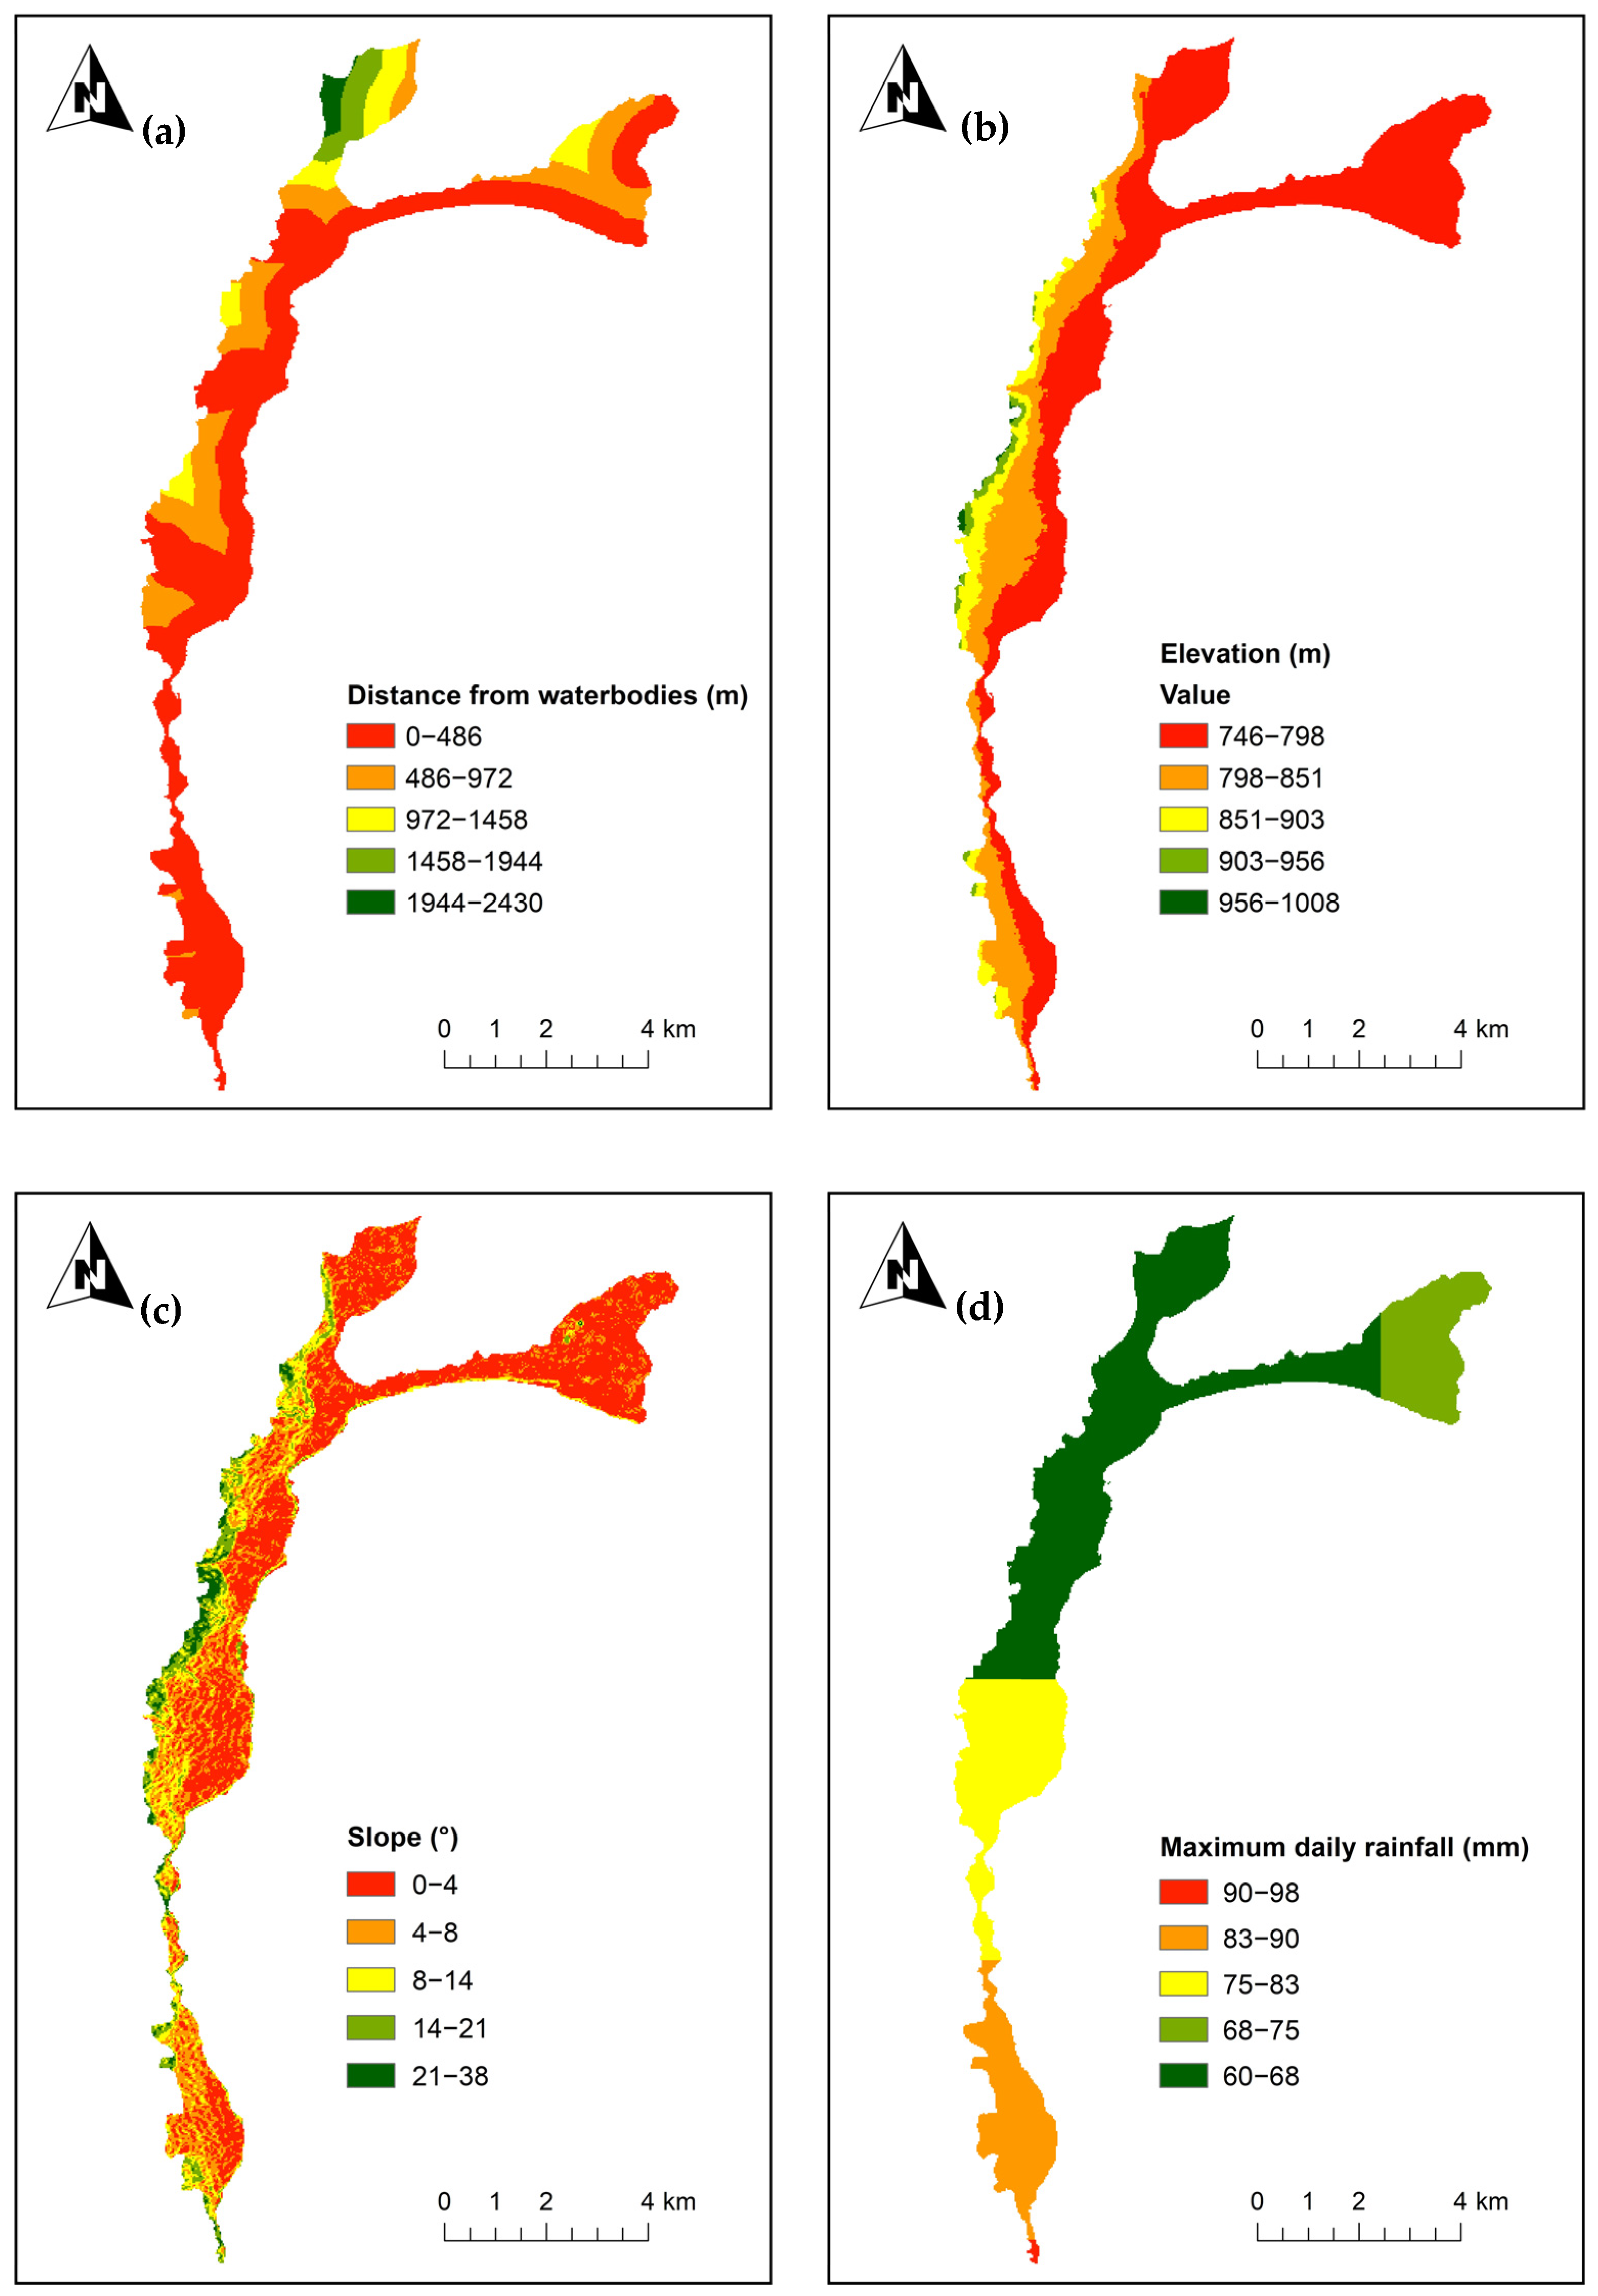
3.1.1. Distance from Water
In the city of Uvira, proximity to water is the most significant contributing factor to flood occurrence (factor weight = 0.319), despite the notable influence of other variables (
Table 2). During extreme rainfall events, rivers overflow, resulting in flash floods. Additionally, rising water levels in Lake Tanganyika have led to gradual flooding along its shoreline. The distance to water, ranging from 0 to 2430 m, was classified into five categories. As shown in
Table 4, up to 63.1% of the city’s total area lies in immediate proximity to water (0–486 m), with an additional 23.4% classified as close, further increasing flood susceptibility across much of the city. The map (
Figure 3a) highlights areas in closest proximity to water, which are widespread, particularly along the Lake Tanganyika shoreline, with the exception of a small area in the northwest.
3.1.2. Elevation
Table 5 indicates that approximately 62.8% of Uvira’s total land area lies at the lowest elevation range (746–798 m), primarily in the eastern part of the city, which borders Lake Tanganyika (
Figure 3b). Another 27.6% falls within a lower elevation range (798–851 m), further increasing the city’s susceptibility to flooding, as low-lying areas are generally more vulnerable. Only a small portion of Uvira, located in the western area and covering 2.4% of the city, is situated at a higher elevation (903–1008 m) (
Figure 3b). These areas represent the highlands that are likely less susceptible to flooding due to gravitational runoff and high drainage efficiency. However, their low spatial coverage reduces their significance in offering urban flood mitigation benefits.
3.1.3. Slope
The findings of this study (
Table 2) indicate that, after proximity to water and drainage density, slope is the third most influential factor contributing to flood susceptibility in Uvira (Factor weight = 0.125). As shown in
Table 6, 75.5% of the city’s land area lies within flat to gently sloping terrain, extending from the Lake Tanganyika shoreline in the east towards the city’s center (
Figure 3c), thereby increasing flood susceptibility. Additionally, 13.5% of the area has moderate slopes, corresponding to moderate flood susceptibility based on topographic gradient.
Figure 3c further illustrates that steep and very steep slopes, covering only 11% of the city’s total area, are primarily located in the western region, mainly dominated by the highlands.
3.1.4. Rainfall
Rainfall is also a major factor influencing flood risk in the city of Uvira (
Table 2). Daily maximum rainfall ranges from 60 to 98 mm, with notable spatial variations: lower rainfall amounts are recorded in the northern part of the city and gradually increase toward the south. The areas that receive the highest (classified as high and very high) amount of daily rainfall, covering 16.9% of the city (
Table 7) and represented on the map in orange and red (
Figure 3d), are mainly located in the southern zones.
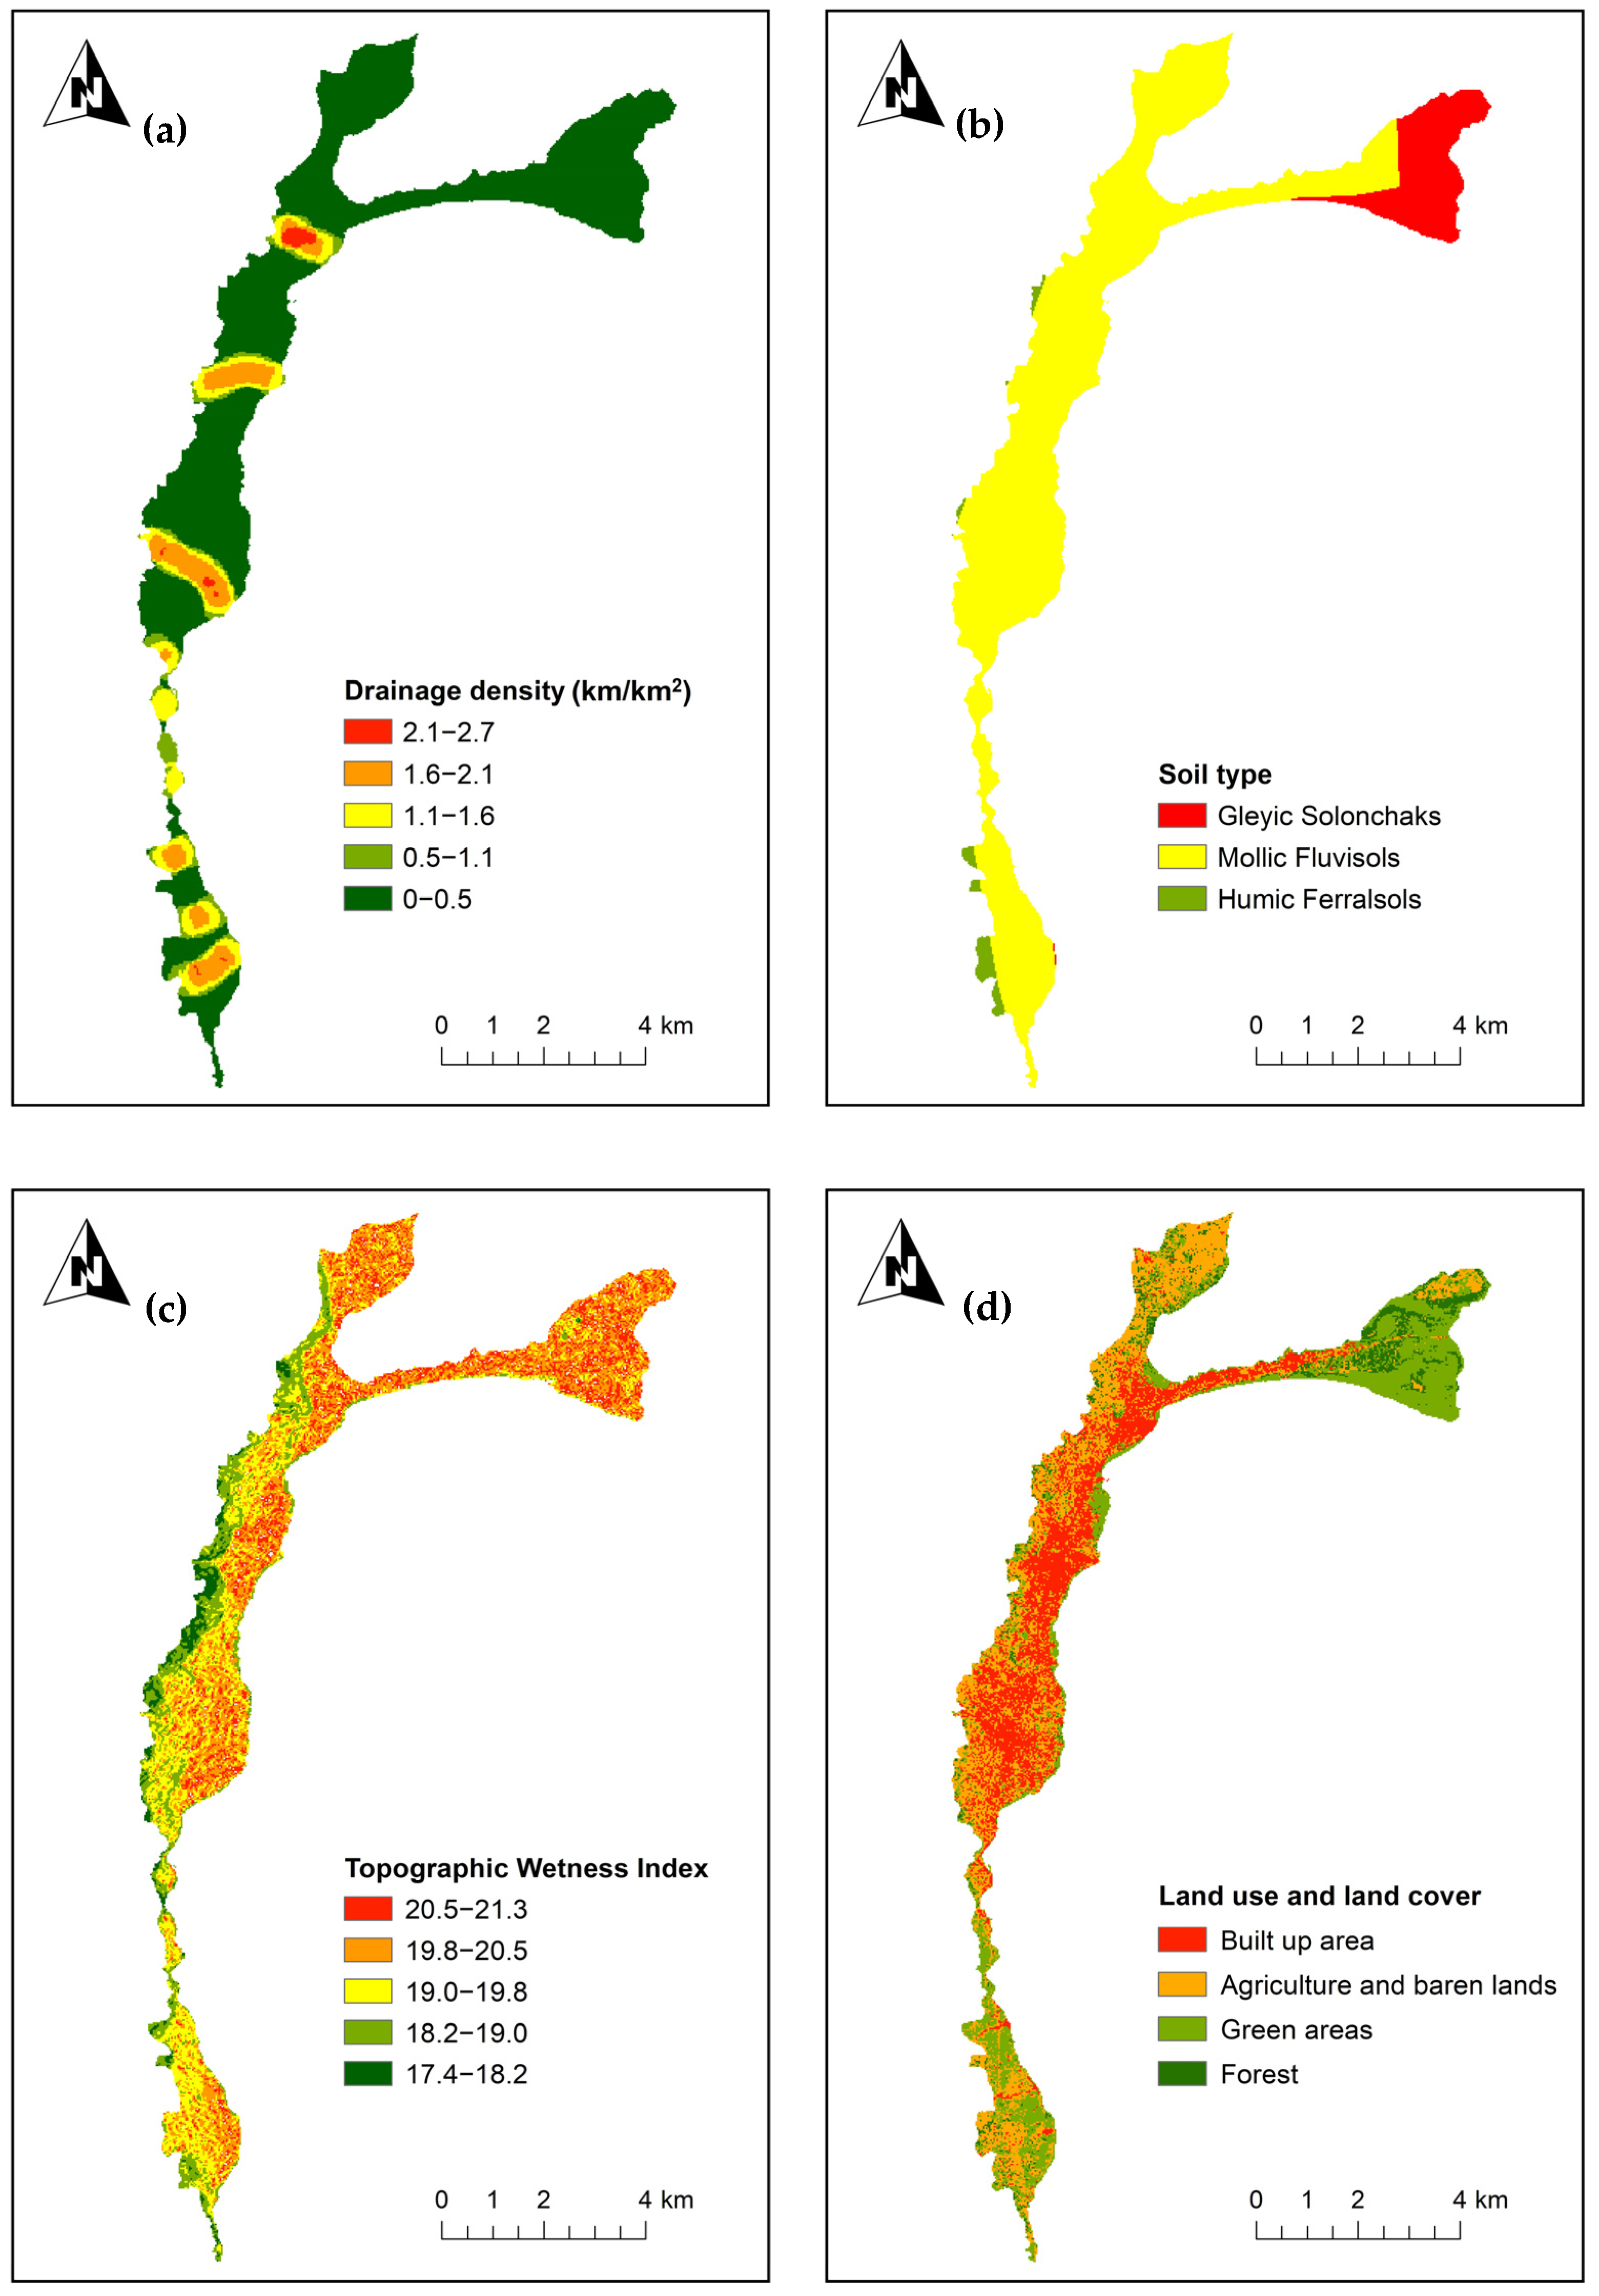
3.1.5. Drainage Density
In Uvira, drainage density, ranging from 0 to 2.7 km/km
2, plays a crucial role in the occurrence of floods. It is particularly high in areas adjacent to rivers (
Figure 4a), thereby increasing flood susceptibility in those regions. However, zones characterized by very high and high drainage density cover only 1% and 9.3% of the city’s total area, respectively, whereas areas with moderate drainage density account for 7.9% (
Table 8). The remaining 81.8% of the city is situated in regions characterized by low or very low drainage density, where river networks are less concentrated. These areas of high drainage density are represented in red and orange on the map (
Figure 4a), covering small areas across the city.
3.1.6. Soil Type
The city of Uvira is predominantly covered by Mollic FLUVISOLS, which occupy approximately 84.5% of its total land area (
Table 9), and by Gleyic SOLONCHAKS, which extend across 13.4% in the northeastern region (
Figure 4b). These findings indicate that nearly the entire city consists of soil types highly susceptible to flooding. Gleyic SOLONCHAKS exhibit very high flood susceptibility, while Mollic FLUVISOLS are also classified as highly susceptible. Only 2.1% of Uvira’s land area is composed of Humic FERRALSOLS, which are less susceptible to flooding. They are mainly located in the west, represented on the map in green (
Figure 4b).
3.1.7. Topographic Wetness Index
The topographic wetness index (TWI) in the city of Uvira, ranging from 17.4 to 21.3 (
Table 10), is generally high, with areas of elevated TWI values (classified as high and very high) covering approximately 55.2% of the city’s total land area. These areas represented in orange and red on the map (
Figure 4c) typically extend from the east (Lake Tanganyika shoreline) to the central part of the city and are most dominant in the North. Additionally, 26.6% of Uvira’s land area falls within the medium TWI range, while the remaining 18.2% is characterized by low TWI values. Areas with moderate TWI values are mainly situated in the city’s center, whereas low TWI zones are concentrated in the western region.
3.1.8. Land Use/Land Cover
Human activities, including agriculture and urban development, occupy a substantial portion of Uvira’s land area (up to 63.1%), while the remaining 36.9% consists of vegetated areas, including forests (
Table 11). Tree cover is primarily concentrated in the northern part of the city, especially in the northeast (
Figure 4d), whereas built-up areas dominate the central region, extending from the eastern zone (Lake Tanganyika’s shoreline) to the west. Agricultural zones are mainly located in the northwest, west, and southern parts of the city. The analysis of Sentinel 2 images produced an LULC map of the city of Uvira, which was validated with an overall accuracy of 0.995 and a Kappa coefficient of 0.993.
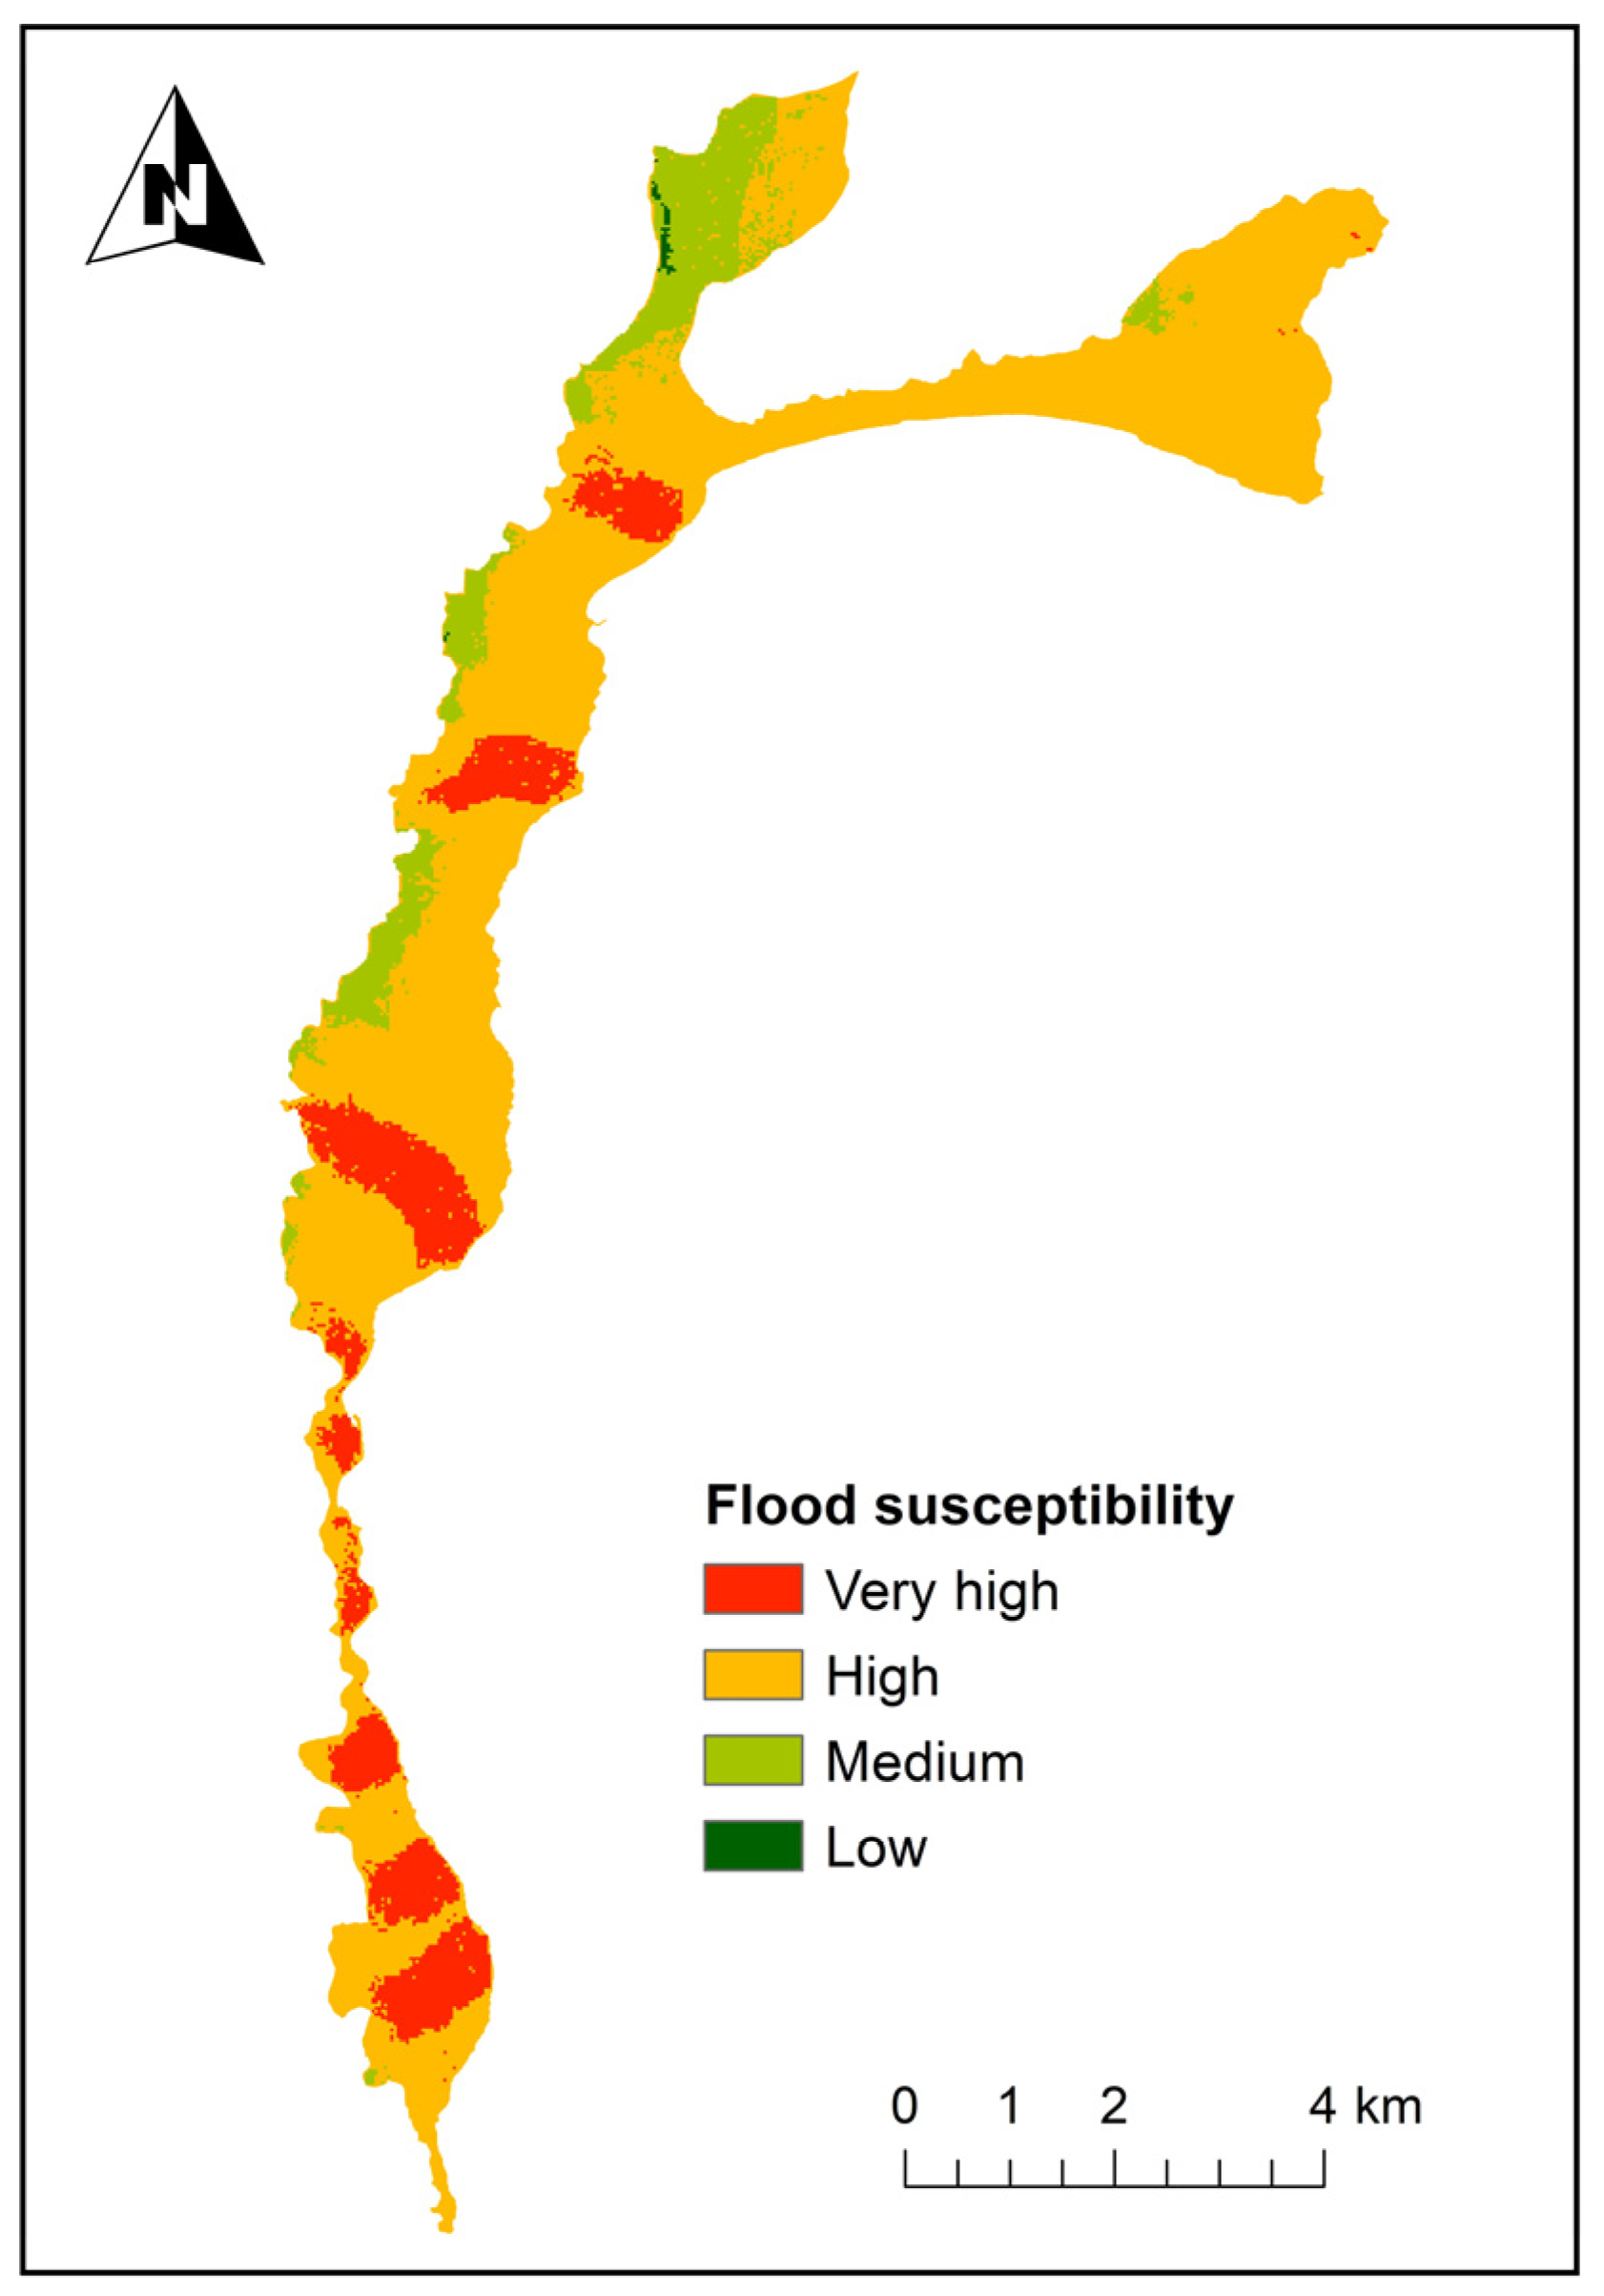
3.2. Flood Susceptibility in the City of Uvira
This subsection presents the main result of the study, the flood susceptibility map, which provides valuable insights into the spatial distribution of flood susceptibility across the city of Uvira by identifying flood-prone areas. That map was generated using a GIS, RS, and the AHP, a Multi-Criteria Decision Making approach. Eight key factors influencing flood susceptibility were selected and analyzed: distance to water bodies, elevation, slope, rainfall intensity, drainage density, soil type, the topographic wetness index, and land use/land cover. Each factor was reclassified, assigned values ranging from 1 to 5 for normalization, and then given weighted scores reflecting their relative importance, as determined through pairwise comparisons. These weighted factors were finally combined using a weighted linear combination method to produce the final susceptibility map.
The results presented in
Table 12 indicate that 16.9% of Uvira’s total land area is exposed to very high flood susceptibility. Most of these zones are located near the rivers and are dispersed throughout the city (
Figure 4).
Figure 4 further illustrates that a substantial portion of these areas lies along the three city’s largest rivers, Mulongwe, Kavimvira and Kalimabenge, which frequently overflow during intense rainfall events. Proximity to rivers and high drainage density are key contributors to flood susceptibility in these zones. Moreover, an overlay with the land use/land cover map revealed that some human settlements are established in these zones, directly exposing the population to potential flood impacts.
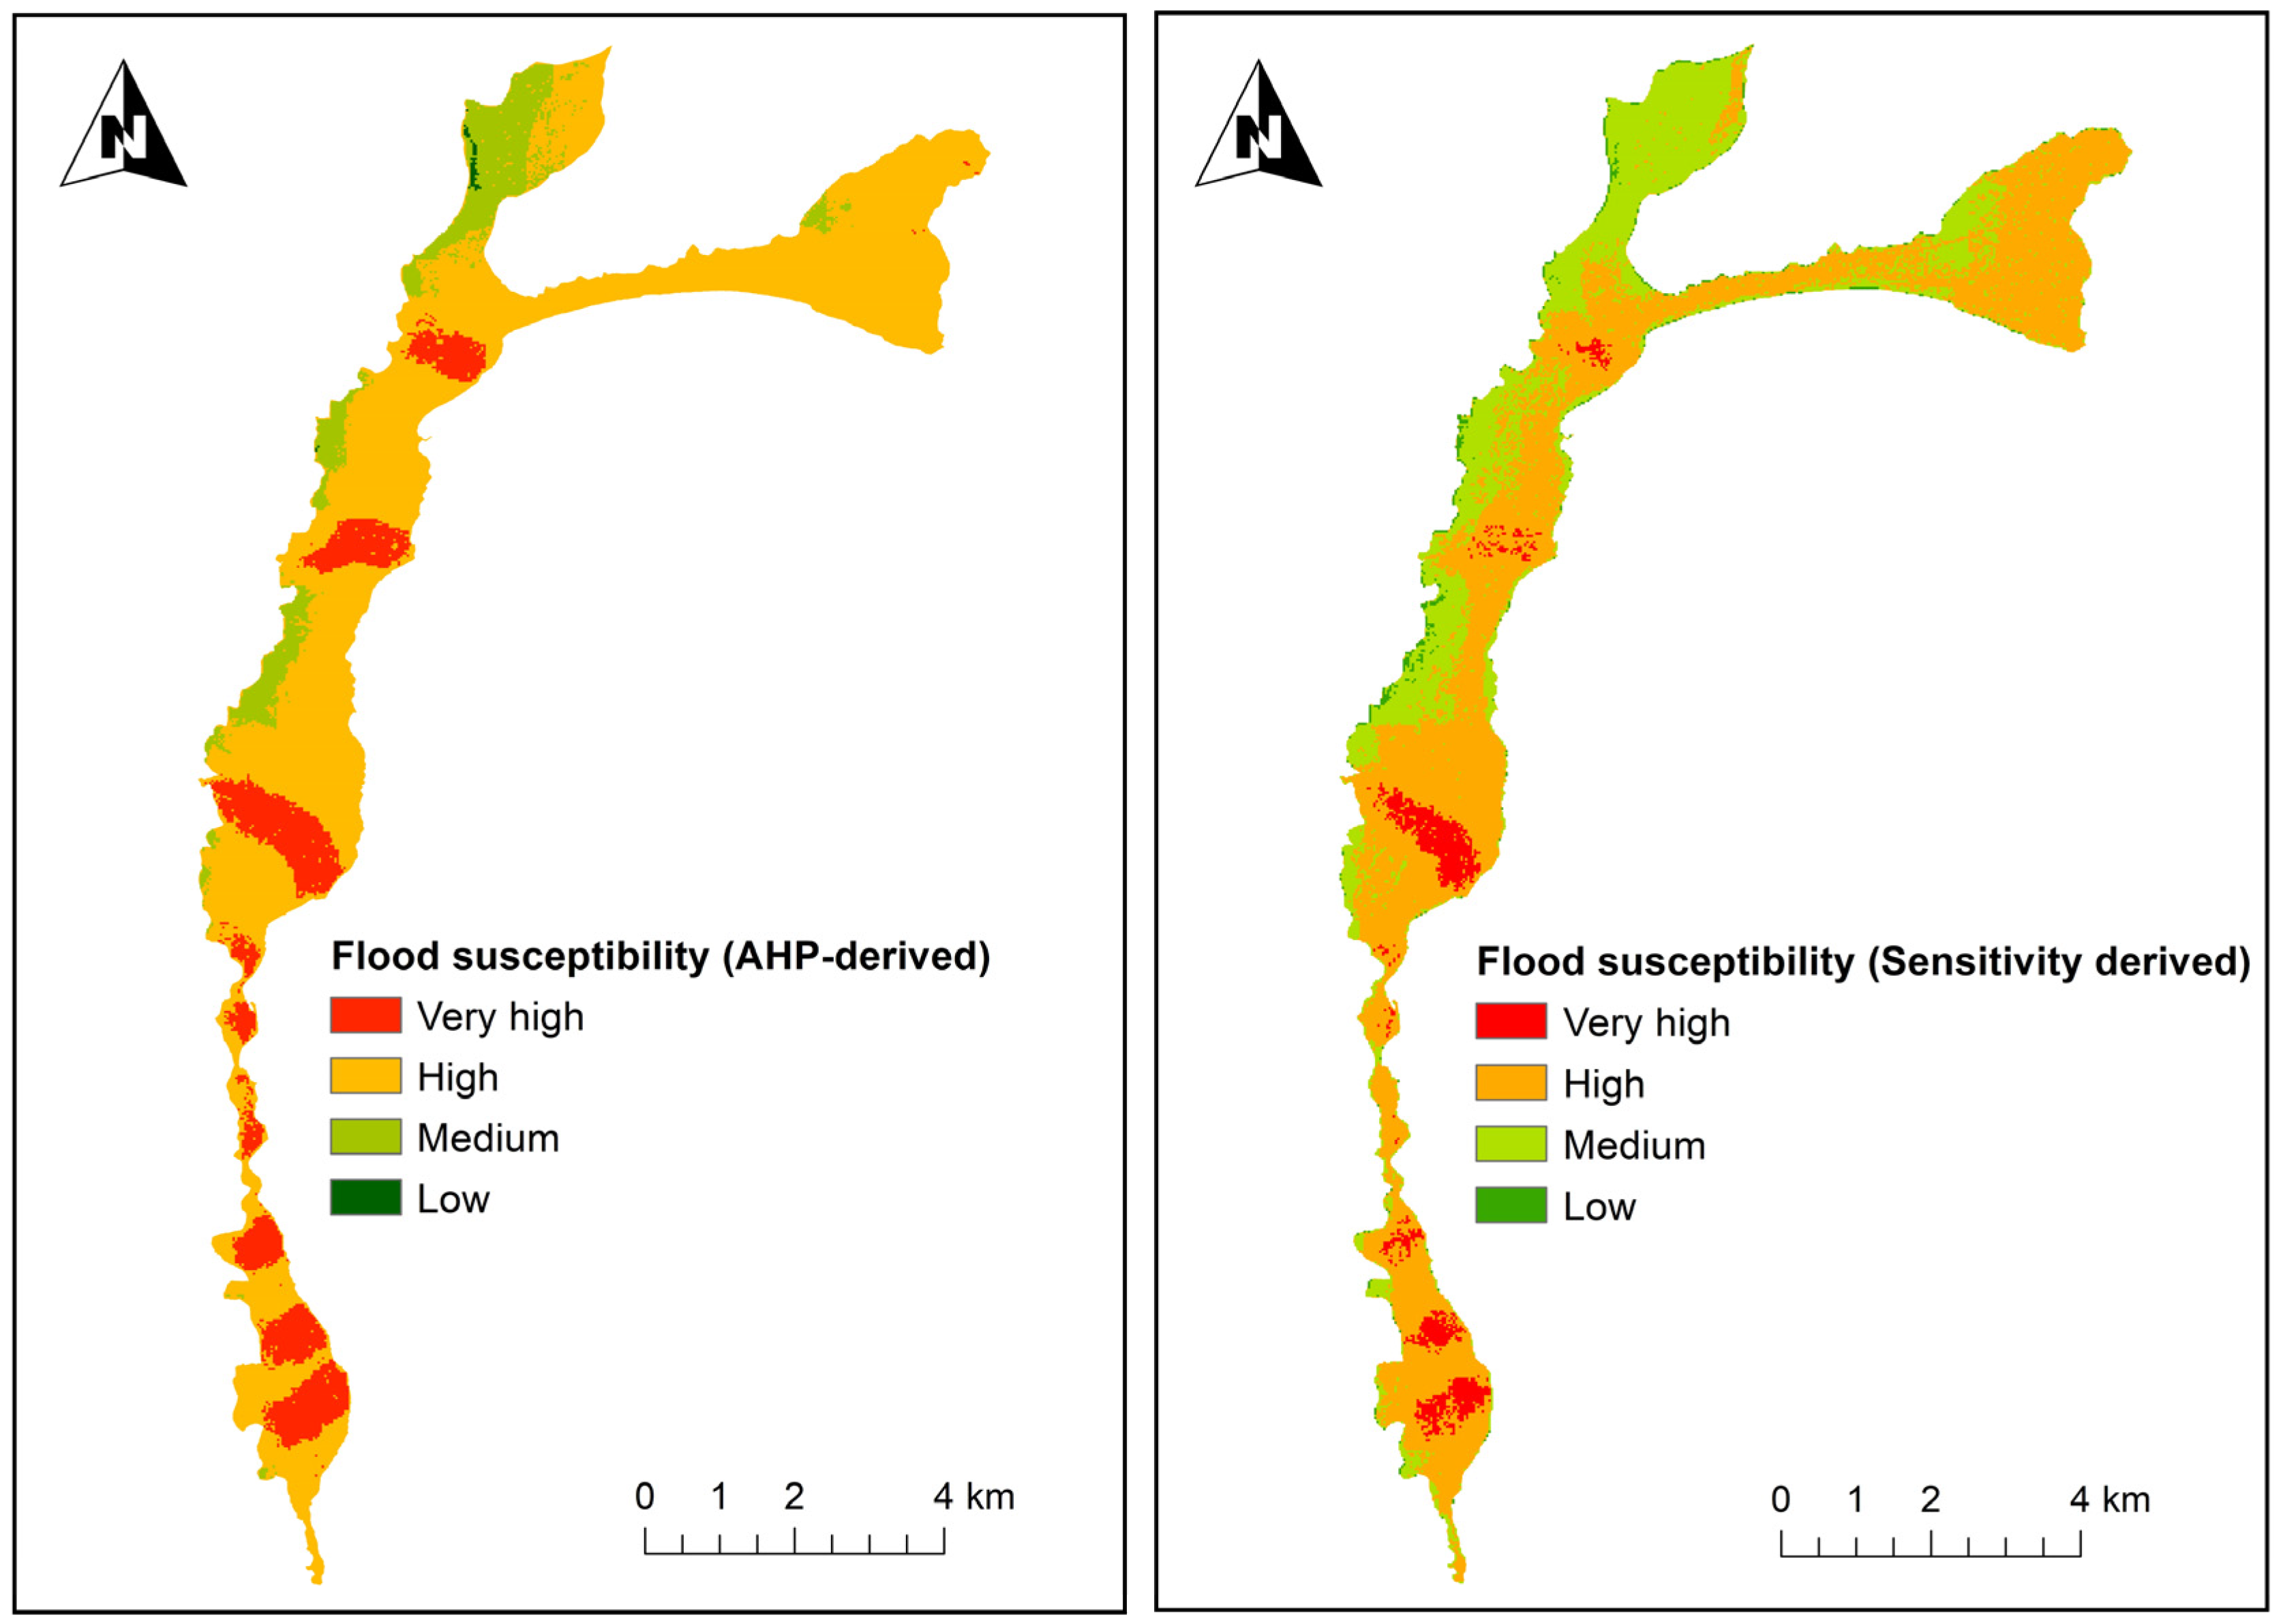
Table 12 further indicates that 70.4% of the city’s land area is classified as having high flood susceptibility, spanning various areas between rivers and along the Lake Tanganyika coastline. The flood susceptibility map (
Figure 5) highlights a continuous belt of high-susceptibility zones extending from the northern to the southern parts, demonstrating that flood susceptibility in Uvira is not localized but widespread. In total, approximately 87.3% of Uvira’s land area falls within flood-prone zones, classified as high and very high susceptibility, with the majority of human settlements also located within these areas.
Furthermore, 11.7% of the city’s area, primarily in the western and northern regions, is classified as having moderate flood susceptibility, while only 1.0%, located in the northwest, is considered to have low susceptibility.
3.3. Sensitivity Analysis
This section presents the results of the sensitivity analysis, conducted using a map removal approach to assess the consistency of the AHP-derived weights and validate the flood susceptibility map. This involved systematically excluding each flood susceptibility factor and regenerating the susceptibility map accordingly. The impact of removing each factor was then measured using the mean absolute difference.
Table 13 summarizes the results issued of the sensitivity analysis, which assessed the impact of removing individual factors on the overall flood susceptibility map. The base scenario, in which equal weights were assigned to all factors, served as a reference. The other scenarios (2 to 9) represent the exclusion of one factor at a time with corresponding recalculations of flood susceptibility level areas for each level.
The results indicate that removing drainage density (scenario 6) resulted in a significant increase in the area classified as “very high” susceptibility compared to the baseline scenario. This finding aligns with the AHP-derived flood susceptibility maps, which showed very high flood susceptibility in areas of high drainage density, confirming the strong influence of this factor. Conversely, the exclusion of distance from waterbodies (scenario 2), elevation (scenario 3) and slope (scenario 4) resulted in a decrease in areas classified as “very high” susceptibility compared to the baseline. These observations further support the weights assigned to these factors in determining flood susceptibility in Uvira.
Other scenarios such as the removal of soil type, the topographic wetness index and land use/land cover resulted in “very high” flood-prone areas that were either identical or slightly different from the baseline scenario. This outcome indicates their relatively moderate influence on flood susceptibility, consistent with their assigned weights in the AHP analysis.
The findings presented in
Table 14 indicate that both the AHP and the sensitivity analysis highlight extensive flood-prone zones. The sensitivity analysis reinforces the AHP findings, confirming that a significant portion of Uvira’s land area is prone to flooding, covering approximately 87.3% and 67.9% of the city, according to the AHP and sensitivity analyses, respectively. However, the sensitivity analysis reveals a broader extent of areas classified as moderately susceptible, which were not fully captured by the AHP method relying on expert-based judgment. Both approaches identify zones of “very high susceptibility” along the major rivers, emphasizing the critical role of proximity to waterbodies in influencing flood susceptibility in Uvira (
Figure 6).
Further supporting the AHP-derived map, the sensitivity analysis demonstrates that flood susceptibility gradually decreases westward. The most flood-prone areas are primarily located in the eastern part of the city, along the Lake Tanganyika shoreline, and extend progressively across the urban landscape (
Figure 6).
4. Discussion
This study finds that flood susceptibility in Uvira results from a combination of topographic, hydrological, climatic, and human factors. Among the eight factors analyzed, proximity to water bodies emerged as the most influential contributor to flood susceptibility. Over 63% of Uvira is located within approximately 486 m of rivers and Lake Tanganyika, significantly increasing the risk of both riverine and lake-based flooding. This finding aligns with the earlier work of [
15], which reported a 2 m rise in Lake Tanganyika’s water level since 2019, exacerbating shoreline flooding risk.
Elevation and slope greatly influence the spatial distribution of flood-prone areas. The predominance of low-lying land (over 90% of the city lies below 851 m) creates natural runoff accumulation zones. This supports the findings of [
54] who emphasized the importance of elevation in directing water flow, as gravity drives water from higher to lower terrain. Similarly, ref. [
55] observed that flood events frequently occur in low-elevation or downstream areas. Furthermore, 75.5% of the city’s land area lies within flat to gently sloping terrain, exacerbating flood susceptibility. In comparison, ref. [
17] reported that 78.2% of Uvira’s land area is prone to flooding when slope is taken into consideration.
The analysis also reveals that areas with high drainage density near rivers correspond to zones of the highest flood susceptibility, highlighting the strong relationship between drainage patterns and flood risk. Elevated drainage density and stream frequency can accelerate surface water flow during intense rainfall events, thereby increasing flood likelihood [
18]. Notably, the areas surrounding the Kavimvira River exhibit the highest drainage density and are frequently affected by flooding due to river overflow. For instance, following the torrential rainfall on 12 December 2020, several cases of damage were reported, including four fatalities, two missing persons, two serious injuries, and numerous homes destroyed, particularly in the northern districts where the Kavimvira River overflowed its banks [
56].
The city of Uvira receives a significant amount of rainfall, ranging from 985 to 1302 mm annually. However, total annual rainfall may have less impact on flooding compared to the intensity and frequency of extreme rainfall events, which significantly contribute to triggering flash floods. Their contribution to lake overflow flooding, however, is limited, as such events are more closely associated with the slow and steady rise in Lake Tanganyika’s water level. For instance, a high-intensity rainfall event following a wetter-than-usual rainy season caused the severe flash flood of April 2020, which resulted in 43 fatalities, 200 injuries, and the destruction of over 5500 homes and left at least 70,000 people homeless [
13]. Additionally, ref. [
57] emphasizes that intense rainfall events are among the leading causes of flash floods, often producing catastrophic impacts in affected regions.
Furthermore, nearly the entire city of Uvira is underlain by soil types highly susceptible to flooding, with 84.5% of Mollic Fluvisols and 13.4% of Gleyic Solonchaks. Fluvisols are particularly common in riverine zones, as they typically occur in periodically flooded environments such as alluvial plains, river fans, valleys, and tidal marshes [
58]. According to [
36], both Fluvisols and Solonchaks are characterized by low permeability, which contributes to elevated flood susceptibility. In contrast, only 2.1% of Uvira’s land area consists of Humic Ferralsols, which are known for their higher permeability and thus lower flood susceptibility [
36]. These soils are located in the western part of the city, where elevation is higher, consistent with the observation by [
59] that Ferralsols are typically found on stable, flat to gently undulating plateaus.
In Uvira, the areas of elevated TWI values cover up to 55.2% of the city’s total land area. This significantly increases flood susceptibility in these regions, consistent with [
60], who reported that higher TWI values are strongly associated with increased flood susceptibility.
The predominance of built-up and agricultural areas significantly increases Uvira’s flood susceptibility. As highlighted by [
61], large-scale land reclamation, climate change, and intensified human activities have led to more frequent flood disasters. Ref. [
62] further emphasizes that the rapid expansion of urban areas has increased flood vulnerability by expanding impermeable surfaces, which reduce natural infiltration and enhance surface runoff. In contrast, forest cover plays a mitigating role in flood prevention by intercepting stormwater and promoting soil moisture deficits, thereby improving the land’s capacity to absorb rainfall [
63].
This study demonstrates that multiple factors contribute to the high frequency of flood events in Uvira, including its geographic location along the Lake Tanganyika shoreline, the presence of a dense river network, and its topographic characteristics. Land use change also significantly influences the severity of flood impacts. For example, ref. [
16] notes that the effects of the 2020 flood in Uvira were exacerbated by urban expansion and climate change. Effective planning and mitigation strategies have to integrate multi-factorial assessments to enhance urban resilience in Uvira and other flood-prone cities within the Great Lakes region.
5. Conclusions
This study successfully assessed flood susceptibility in the city of Uvira, located in the eastern Democratic Republic of Congo, using the AHP as an MCDM approach. It integrated eight influential factors identified as key drivers of flooding in the city: distance from water bodies (0.319), elevation (0.083), slope (0.125), rainfall (0.083), drainage density (0.184), soil type (0.118), the topographic wetness index (0.032), and land use/land cover (0.056). Both the individual and combined impacts of these factors on flood susceptibility were evaluated. The findings indicate that proximity to water exerts the strongest influence on flood susceptibility in Uvira, followed by drainage density and slope, despite the relevance of all considered factors.
Despite challenges encountered during the research process (the lack of historical data and relevant preliminary research directly addressing the topic), this study successfully identified flood-prone areas in Uvira, thereby filling a critical knowledge gap. However, future studies should incorporate infrastructure and socio-economic variables to enable a more comprehensive flood risk assessment, including the evaluation of population vulnerability and exposure. Such an integrated approach would enhance Uvira’s urban resilience by informing the development of effective mitigation strategies and reflecting the adaptive capacities of local communities.
The study was conducted in a data-scarce context, which is a common limitation in the Democratic Republic of Congo. Although multiple flood events have occurred in Uvira, no official records were available to validate the study’s results. Future research should aim to incorporate such data if they become available. Furthermore, researchers working in collaboration with local authorities and organizations should establish systematic flood event documentation, including spatial mapping, to build a local database in a city where flash floods are both frequent and destructive.
While the results of this study should be supplemented by further analysis, some preliminary recommendations can be proposed. First, the construction of residential housing should be strictly regulated in areas adjacent to rivers, where flood susceptibility is extremely high. Establishing buffer zones and implementing mitigation measures such as reforestation and the introduction of mangroves in selected areas near rivers and along the Lake Tanganyika shoreline should be prioritized. Second, urban expansion should be directed toward areas with lower flood susceptibility, offering potential relocation zones for portions of the city’s population. However, thorough preliminary assessments are essential to identify the most suitable sites for such development.
This study provides valuable insights into the factors driving flood occurrence in Uvira and the locations most at risk. The findings offer a practical foundation for urban planners, policymakers, decision-makers, and local communities to design and implement evidence-based flood mitigation strategies.


 ,
, 


