Abstract
Earth fill dams are susceptible to internal erosion and instability when founded over cavity-prone formations such as gypsum or karstic limestone. Subsurface voids can significantly compromise dam performance, particularly under seismic loading, by altering seepage paths, raising pore pressures, and inducing structural deformation. This study examines the influence of cavity presence, location, shape, and size on the behavior of zoned earth dams. A 1:25 scale physical model was tested on a uniaxial shake table under varying seismic intensities, and seepage behavior was observed under steady-state conditions. Numerical simulations using SEEP/W and QUAKE/W in GeoStudio complemented the experimental work. Results revealed that upstream and double-cavity configurations caused the greatest deformation, including crest displacements of up to 0.030 m and upstream subsidence of ~7 cm under 0.47 g shaking. Pore pressures increased markedly near cavities, with peaks exceeding 2.7 kPa. Irregularly shaped and larger cavities further amplified these effects and led to dynamic factors of safety falling below 0.6. In contrast, downstream cavities produced minimal impact. The excellent agreement between experimental and numerical results validates the modeling approach. Overall, the findings highlight that cavity geometry and location are critical determinants of dam safety under both static and seismic conditions.
1. Introduction
Earth fill dams are vital for water storage, flood control, and irrigation, but problematic foundation conditions often threaten their long-term safety [1]. Dams constructed over soluble rock formations, such as gypsum, limestone, or chalk, face serious risks due to the potential for seepage-induced dissolution [2,3]. This process can form hidden cavities beneath the foundation, leading to differential settlement, internal erosion, or collapse [4].
Global incidents have demonstrated the severity of such conditions. The failures of the St. Francis Dam (USA, 1928) and Quail Creek Dam (USA, 1989) were linked to dissolved gypsum foundations. Similarly, Mosul Dam in Iraq, built on gypsum and anhydrite layers, has suffered from continuous void formation since its reservoir was first impounded despite decades of intensive grouting [5]. These cases underscore the hazards posed by karstic or evaporitic foundations, particularly when combined with seismic loading [6].
Earth fill dams inherently experience seepage, as water seeks paths through the embankment or foundation [7]. Zoned dams address this using low-permeability clay cores flanked by pervious shells and filters. These features help control the phreatic line and reduce internal erosion, uplift, and slope instability [8,9]. Studies have shown that adding a central clay core significantly reduces seepage [10]. Where foundations are weak or cavity-prone, seepage risks increase. Pore pressure monitoring is therefore a standard dam safety measure [11,12].
Major failure mechanisms include piping, differential settlement, slope instability, and liquefaction [13]. Piping is triggered by uncontrolled seepage and can breach dams quickly [13,14]. Differential settlement from compressible or collapsing soils may crack the core or misalign structures. Slope instability can result from weak foundations, saturation, or earthquakes [15]. For example, the Lower San Fernando Dam failed in 1971 due to liquefaction of its hydraulic fill. Engineers now assess slope stability under static and seismic loads [16,17]. Liquefaction of saturated sandy foundations during earthquakes can cause major deformation. The even moderate shaking could destabilize embankments showed by [18,19].
Experimental and numerical studies have advanced understanding. of stability of dams Baena and Toledo modeled seepage and gypsum dissolution, confirming that permeability increases with cavity growth. Ref. [20] simulated cavity expansion in karst. FEM used to show that upstream cavities cause more seepage than downstream ones [21]. Dynamic simulations by [22]. demonstrated the benefits of reinforcement for stability to dams.
In all the previous studies, the cavities impact under the zone earth dam has been not addressed and the effect of cavity–earthquake dualism, also, the locations, diameters, shapes, and of the cavities are not represented as important factors in almost all the related previous studies. Although studies have investigated static seepage or dynamic earthquake responses separately, limited research has addressed how cavity geometry—shape, size, and location—affects dam behavior under combined conditions. This study addresses this gap through integrated physical and numerical modeling.
The objectives are to:
- Evaluate dam performance under static and seismic conditions, with and without foundation cavities.
- Investigate the influence of cavity geometry on deformation, pore pressure, and failure mechanisms.
- Validate numerical simulations results against physical model results.
- A 1:25 scale physical model of a zoned earth dam was constructed with a clay core and sandy shell over a gypsum-rich soil foundation, incorporating controllable cavity scenarios. The 1:25 scale was selected based on a balance between experimental feasibility, measurement accuracy, and the need to capture essential geometric and mechanical features of the prototype structure. While there is no single code or standard that prescribes this specific scale, the selection follows widely accepted practices in physical modeling, consistent with similitude principles (e.g., dimensional analysis and dynamic similarity). The model was tested under various seismic excitations using a shaking table, and seepage was monitored during static loading. Parallel simulations using GeoStudio (SEEP/W and QUAKE/W) were calibrated using experimental data. This combined approach provides insights into how subsurface voids affect dam safety and informs design strategies for foundations in karstic terrain.
2. Earth Dam Model Analysis
2.1. Dam Model Scaled Experimental Setup
To investigate the effects of subsurface cavities on the hydraulic and seismic behavior of zoned earth dams, an experimental program was conducted using a physical model tested on a shaking table. The experiments aimed to simulate seepage behavior and dynamic response under controlled conditions while varying cavity configurations within the dam foundation.
2.1.1. Description of the Shaking Table and Flume Setup
The physical experiments were performed using a custom-designed uniaxial shaking table, which was integrated with a rigid flume capable of accommodating a scaled model of the earth dam. The shaking table was powered by a high-precision Delta ECMA-L11845RS, the equipment was sourced from Delta Electronics, Inc., a Taiwanese electronics manufacturing company headquartered in Neihu District, Taipei City. Servo motor and controlled via a ball screw mechanical transmission system, allowing the accurate reproduction of earthquake ground motions, including the well-known Koyna earthquake acceleration record. The setup consisted of I-section steel channels fixed to the floor with vibration-isolating rubber layers and roll bolts for stability. Linear motion was guided by 120 cm steel tracks and four sliders, enabling controlled unidirectional movement. Safety switches were installed to prevent over-travel. The flume measured 2.0 m in length, 0.5 m in width, and 1.2 m in depth. It was constructed of steel with transparent acrylic walls to facilitate visual monitoring of seepage and internal deformation. The flume was designed to allow the application of both steady-state seepage flow and dynamic excitation. Figure 1 shows the shaking table and the flume setup used in this study.

Figure 1.
Shaking table and the flume setup.
2.1.2. Scaled Model Specifications (1:25 Scale)
A zoned earth dam model was constructed at a scale of 1:25, following dimensional similarity laws. The model incorporated a central impermeable core flanked by more permeable shell materials, closely simulating a real zoned dam cross-section. The upstream and downstream slopes were built at 1.5 H:1 V inclination. The total height of the dam model was 0.6 m, with a crest width of 0.1 m and a base width of approximately 1.6 m. The foundation soil was composed of gypsum-rich soil to simulate problematic conditions, matching the geotechnical characteristics of foundations known to be vulnerable to dissolution and cavity formation. Figure 2 shows the zoned earth dam model.

Figure 2.
The zoned earth dam model.
- Instrumentation: accelerometers, LVDTs, pore pressure sensors.
To capture the dam’s behavior under seepage and seismic loading, a comprehensive instrumentation plan was implemented. The model was equipped with: Accelerometers: Placed at the crest and shell zones to measure dynamic accelerations during shaking. Linear Variable Differential Transformers (LVDTs): Installed to monitor horizontal and vertical displacements, particularly at the crest and slopes. Pore Pressure Transducers: Positioned at different locations within the dam body and foundation to capture pore water pressure evolution during both static and dynamic loading. Data Acquisition System: A National Instruments (NI) system controlled via LabVIEW software (LabVIEW NXG 5.0 LabVIEW 2020) was used for continuous real-time monitoring and recording.
- 2.
- Cavity configurations (locations: upstream, core, downstream, double).
Five different scenarios were studied to investigate the influence of cavity location on dam behavior:
- No cavity (reference condition).
- Cavity beneath the upstream zone.
- Cavity beneath the clay core.
- Cavity beneath the downstream zone.
- Double cavity condition (upstream and downstream).
Each cavity was manually formed as a hollow zone within the foundation soil using a rigid mold before compaction. The cavities were located at a depth of 0.19 m from the foundation surface, and their dimensions were kept constant across tests for consistency in comparison. Figure 3 shows all five types of cavity locations.
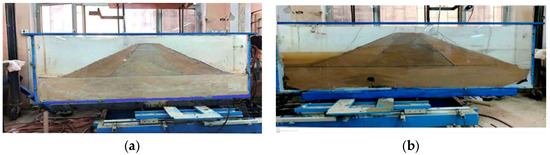

Figure 3.
The five types of cavity configurations: (a) Without cavity (b) Cavity under upstream (c) Cavity under core (d) Cavity under downstream (e) Two cavities.
It is important to note that the present study assumes a homogeneous soil medium to isolate the effects of cavity geometry and location. While this simplification allows for clearer interpretation of the observed geotechnical responses, real dam foundations often exhibit significant soil variability and material heterogeneity, which can markedly influence seepage patterns and deformation behavior.
3. Numerical Modeling
The utilization of numerical fashions has significantly contributed to resolving several design-demanding situations and has expedited the validation method, making sure of the integrity of applied centers. This has been carried out through the utilization of finite detail applications, including the Geo-Studio software program (version 23). Geo-Studio is a software program suite usually employed to assess the performance of diverse types of dams and levees. It allows the prediction of structure performance concerning seepage, agreement, filling/draining, and stability all through the construction process. Both lengthy periods (constant nation) and comprehensive brief assessments can be performed to evaluate time-based reactions. Advanced stability investigations can incorporate pore water pressures (P.W.P) and stresses. Furthermore, the software helps the assessment of the structure’s reaction to seismic stress, floor freezing/thawing, and different land climate interactions.
3.1. Use of SEEP/W and QUAKE/W Modules from GeoStudio
The numerical models were developed using the same geometric dimensions, material properties, and boundary conditions as those applied in the physical experiments to ensure consistency and enable validation. The dam and foundation were modeled with saturated/unsaturated soil behavior, and the Van Genuchten method was used to estimate hydraulic conductivity functions for both the core and shell materials. Soil-water characteristic curves (SWCCs) were defined based on experimental data, and material properties such as unit weight, cohesion, internal friction angle, and modulus of elasticity were assigned as measured in the laboratory. Figure 4: Schematic diagram of the numerical model showing dam geometry, material zones, and boundary conditions).

Figure 4.
Schematic diagram of the numerical model.
3.2. Material Properties, Meshing Strategy, Boundary Conditions
The numerical domain was discretized using a combined quadrilateral and triangular finite element mesh, consisting of 2404 elements and 2515 nodes, as shown in Figure 5. The mesh density was refined in regions near the cavities and the dam interface to capture hydraulic and mechanical gradients. For the SEEP/W analysis, boundary conditions included a constant total head at the upstream face and a potential seepage surface at the downstream slope, representing steady-state flow conditions. For QUAKE/W, vertical boundaries at the sides were fixed in the vertical direction but allowed to move horizontally, while the bottom boundary was fixed in both directions. Table 1 summarizes the material properties used in the model.

Figure 5.
The numerical domain mesh.

Table 1.
Soil properties.
3.3. Input Motion (Earthquakes: 0.1 g, 0.33 g, 0.47 g)
Dynamic analysis was conducted using the QUAKE/W module by importing the steady-state pore pressure results from the SEEP/W simulations. The Koyna 1967 [23] ground motion record was applied as a horizontal input motion with peak ground acceleration 0.47 g and modified to two levels of peak ground acceleration (PGA): 0.1 g and 0.33 g, each lasting for 20 s, as shown in Figure 6. The original time history was multiplied by a constant factor so that its PGA matched the target value of 0.47 g. This method preserves the frequency content and duration of the original signal, making it suitable for engineering demand assessments. The analysis accounted for linear elastic soil behavior with a constant damping ratio as assumed from relevant references. Initial in-situ stress conditions were generated within QUAKE/W prior to dynamic loading to ensure realistic stress distribution at the start of seismic excitation.

Figure 6.
Input earthquake acceleration record for Koyna earthquake 1967 [23].
- Simulation of cavity shape, size, and depth variations.
A parametric study was conducted to examine the influence of various cavity characteristics:
- Cavity locations: beneath the upstream zone, under the core, beneath the downstream zone, and with dual cavities (upstream and downstream).
- Cavity shapes: circular (used in all experimental models), elliptical, and irregular.
- Cavity sizes: diameters of 3 cm, 7 cm, and 10 cm.
- Cavity depths: vertical depths of 0.1 m and 0.3 m below the dam foundation surface.
These simulations allowed for evaluating how the presence and geometry of cavities affect seepage flow rates, pore water pressure distributions, crest displacements, and stability under seismic loading. The results were used to interpret the mechanical response of the dam under various combinations of static and dynamic stress conditions.
The numerical outputs were later compared with the experimental results to validate model performance and quantify the level of agreement, which was found to be high (R2 ≥ 0.989).
4. Results and Discussion
4.1. Seepage Behavior Under Static Conditions
The steady-state seepage performance of the zoned earth dam was evaluated for five configurations: no cavity, an upstream cavity, a core cavity, a downstream cavity, and a double cavity. Table 2 summarizes the total seepage flow rates measured at water depths of 0.15 m and 0.30 m for experimental and numerical models. For the baseline (no-cavity) case, the recorded seepage rates were and at 0.15 m and 0.30 m heads, respectively. In this configuration, the clay core acted as a very low-permeability barrier: the phreatic surface fell sharply across the core and did not reach the downstream face, leading to saturation primarily in the foundation under the dam body. The minimal core permeability thus limited seepage magnitude, maintaining a relatively steady upstream head while the downstream slope remained dry and stable (low pore pressure). Figure 6 shows the phreatic line in the different cases.
Table 2.
Seepage discharges for experimental and numerical models.
Introducing a cavity beneath the upstream zone markedly increased seepage flow. The measured flow rates rose to (15 cm head) and (30 cm head), substantially higher than the no-cavity values. The upstream cavity behaved like a high-pressure sink: numerical flow lines show water rushing from the reservoir into the cavity. Figure 7 and Figure 8 show the phreatic line for model without cavity at water levels 15 and 30 cm, respectively. Experimentally, the phreatic line was observed to rise and even emerge at the downstream face when the full head (0.30 m) was applied. In the low-head case, the phreatic surface remained within the embankment, but at higher head it intersected the slope face, indicating increased saturation of the dam. The cavity accelerated saturation of surrounding soil and led to localized erosion (liquefaction) of the upstream shell.

Figure 7.
Phreatic line in the different cases.

Figure 8.
Phreatic line for model without cavity at water level =15 cm.
The cavity-under-core configuration also enhanced seepage. Measured flow rates were (15 cm head) and (30 cm head), higher than in the no-cavity case. The cavity acted as a conduit (“pipe”) forcing water through the clay core, so the core saturated more rapidly and the phreatic surface rose within it. In other words, the phreatic line in the core moved closer to the crest, increasing foundation saturation beneath the core. Small zones of erosion developed around the cavity due to the focused flow (the core particles were washed toward the cavity). However, the downstream face remained mostly dry since the phreatic surface still decayed across the core (no direct cut-through was reported).
With a cavity under the downstream zone, seepage flows were lower than in the upstream or core cases: measured rates were (15 cm) and (30 cm). Because the downstream cavity lies far from the reservoir, flow must travel through much of the dam body before entering it. The experiments showed that the phreatic surface remained confined within the embankment and no significant failure or erosion of the cavity occurred. Thus, saturation zones in the downstream-cavity case were comparable to the no-cavity dam, with only modest increases in foundation saturation and downstream face moisture.
The double-cavity configuration produced the largest seepage rates. With cavities under both the upstream and downstream zones, measured discharges reached 1(15 cm head) and (30 cm head). In this case the phreatic line rose throughout the core and downstream shells, fully saturating the foundation. Chapter 4 notes that the cavities acted as “pipes” cutting across the dam, raising the phreatic surface nearly to the crest and causing the foundation to become fully saturated. Maximum settlement (≈2.3 cm) was observed, and partial failure of the upstream cavity occurred before the downstream cavity was significantly engaged. Overall, the double-cavity case showed the most severe saturation and erosion of the embankment.
Numerical SEEP/W simulations of the same scenarios captured these trends very well. The computed phreatic lines and flow nets agreed with observations: for example, all cases showed the core as a zone of sharply declining phreatic head, and streamlines concentrated around cavities nearer the reservoir. Figure 9 compares experimental vs. numerical seepage rates for all configurations; the linear regression gave , indicating an excellent match as shown in Figure 10. In summary, both experimental and numerical results consistently show that introducing cavities increases seepage rates and raises the phreatic surface, with the greatest effect when cavities lie near the upstream core; the computed pore-water pressure and phreatic profiles closely mirrored the laboratory behavior.

Figure 9.
Phreatic line for model without cavity at water level=30 cm.

Figure 10.
Comparison of Experimental and Numerical Seepage Discharges.
4.2. Settlement and Structural Performance
Figure 11 shows the calculated settlement after 10 days from the model filled with water. Settlement and deformation behavior of the dam were significantly influenced by the presence and position of foundation cavities. In the reference case without cavities, saturation led to only minor settlement (1 cm at the core after 10 days). The impermeable clay core effectively controlled seepage, no internal erosion or liquefaction occurred, and under seismic loading, only slight upstream cracking and crest displacements (0.017–0.02 m) were observed—indicating stable performance.

Figure 11.
Calculated settlement after 10 days from the model filled with water.
When a cavity was introduced beneath the upstream shell, both settlement and damage increased sharply. Crest settlement reached 2 cm due to core collapse toward the cavity. The cavity served as a seepage conduit, triggering severe internal erosion and adjacent soil liquefaction. The static factor of safety (FOS) fell to 1.40 (from 2.19), and dynamic FOS dropped to 0.579. In experiments, moderate shaking caused partial collapse of the cavity and 3 cm of upstream shoulder drop, while strong shaking (0.47 g) led to full collapse, 300 mm lateral crest displacement, and 7 cm upstream subsidence.
A core-located cavity caused similar static settlement (2 cm) as piping through the core saturated and mobilized the clay. The static FOS was 1.51 and dropped to 0.88 under shaking. Moderate earthquakes initiated partial cavity failure and core cracking, while strong shaking induced full collapse and 2 cm of additional settlement. However, crest displacement remained modest (0.025–0.045 m), as deformation concentrated near the core.
The downstream cavity had the least impact. Static core settlement was 1 cm, and the static/dynamic FOS remained relatively high (1.53/1.01). Under seismic loading, only partial cavity collapse occurred, producing local downstream cracks and 3 cm subsidence, without widespread liquefaction. Crest displacements remained small (0.025–0.04 m).
The double-cavity configuration (upstream and downstream) was most critical. Combined seepage through both cavities raised the phreatic line and liquefied the foundation. Settlement reached 2.3 cm and static/dynamic FOS dropped to 1.39/0.53. Under strong shaking, the upstream cavity collapsed first, followed by full liquefaction and core failure. Experimental results showed crest displacements of up to 0.30 m and wide cracks (7 cm).
Numerical simulations closely matched experimental trends. Static and seismic models confirmed severe stability loss in upstream and double-cavity cases, while downstream configurations had minimal effect. Displacement fields showed strong agreement—e.g., 10 cm upstream cavities produced crest displacements up to 0.145 m in simulations, consistent with laboratory observations. In conclusion, upstream and multiple cavities substantially degrade dam performance, while downstream cavities pose lower risk.
4.3. Dynamic Response Under Seismic Loading
Under seismic loading, crest settlement increased with higher peak ground acceleration (PGA), and deformation severity was closely linked to cavity location. In the upstream-cavity model, the dam experienced 7 cm upstream subsidence and 0.30 m crest displacement at 0.47 g. In contrast, the core and downstream-cavity cases showed significantly smaller crest movements 0.025–0.045 m and 0.025–0.040 m, respectively. Numerical QUAKE/W simulations confirmed that crest displacement grows with both shaking intensity and cavity proximity to the dam face. For example, a shallow 10 cm upstream cavity caused displacements rising from 2.2 cm at 0.10 g to 3.0 cm at 0.47 g, while a deeper 30 cm cavity produced up to 13 cm of movement.
Pore-water pressures rose significantly during shaking, especially for upstream or dual cavity configurations. In physical tests, dynamic pore pressure in the upstream cavity model reached 2.7 kPa at 0.47 g, while core and downstream cavities generated lower peaks (1.1–2.0 kPa and 0.6–1.1 kPa, respectively). The double-cavity model produced the highest pressure (3.0 kPa), triggering liquefaction in the upstream zone. QUAKE/W simulations supported these results, with peak pore pressures for irregular cavities of 2.4 kPa (upstream), 1.9 kPa (core), 1.8 kPa (downstream), and 3.0 kPa (double), all higher than elliptical cases. The highest pressures consistently occurred at the upstream shell base and increased with reservoir height. Results for pore water pressure for cases is shown in Figure 12 Crest acceleration also increased with PGA and was amplified by cavity presence. In the upstream-cavity model, crest accelerations reached 0.075, 0.20, and 0.27 g at 0.10, 0.33, and 0.47 g, respectively. Other configurations followed similar trends. Cracking patterns mirrored these dynamics: upstream cavities caused partial collapses and cracking at 0.33 g and full collapse at 0.47 g, with 4–5 cm cracks in the slope and crest. Core and downstream cavities led to localized deformation (2–3 cm) and foundation cracks. The dual-cavity case showed the worst damage, including vertical core cracks up to 7 cm, as shown in Figure 13.

Figure 12.
Pore water pressure for cases.

Figure 13.
Crest cracks.
Figure 14 shows results of Factor of safety for model with cavity diameter: (a) 3 cm (b) 7 cm (c) 10 cm Dynamic stability analyses highlighted the degradation. In the intact dam, the dynamic safety factor (SF) dropped from 1.11 (0.10 g) to 0.74 (0.47 g). Cavities further reduced SF: a shallow upstream cavity decreased it to 0.55–0.57 at 0.47 g. At this intensity, SF values fell below the recommended seismic safety threshold (1.1–1.2) in all cavity cases. Overall, upstream and multi-cavity configurations most severely compromised dynamic performance, with high PGA amplifying their effects.

Figure 14.
Factor of safety for model with cavity diameter: (a) 3 cm (b) 7 cm (c) 10 cm.
5. Conclusions
In this study, a 1:25-scale model of a zoned earth dam with a clay core was tested under static seepage and dynamic (shake-table) loading, and equivalent scenarios were simulated using SEEP/W and QUAKE/W. The cavity configurations varied in location (upstream, core, downstream, and dual) as well as in size and shape. The numerical models were calibrated against experimental data, yielding excellent agreement (R2 ≈ 0.99) between measured and simulated responses. This validated experimental–numerical approach underpins the findings and provides a robust framework for assessing dam stability.
- The presence of cavities dramatically altered seepage behavior. In the no-cavity case, flows were minimal and confined beneath the dam due to the impermeable core; introducing an upstream cavity roughly quadrupled flow rates (e.g., from to m3/s at 0.30 m head) and raised the phreatic surface to the downstream slope. A cavity under the core similarly increased flow by routing water through the core and saturating the foundation, whereas a downstream cavity had a much smaller effect, since flow paths remained long. The dual-cavity scenario produced the largest seepage rates and near-full saturation of the dam base. Parametric simulations further showed that larger or irregular cavities amplified these trends, yielding still higher flows and pore pressures.
- Consistent with seepage trends, upstream and multi-void configurations caused the greatest deformation and stability loss: under static saturation the core settlement reached ~2 cm (vs ~1 cm without cavities) and static factors of safety fell markedly. Under seismic shaking, these effects were magnified: the upstream-cavity model exhibited ~0.30 m crest displacement and ~7 cm subsidence at high PGA (versus centimeter-scale shifts in the other cases), with peak pore pressures reaching ~2.7–3.0 kPa (versus ~0.6–1.1 kPa) in upstream/dual void scenarios, triggering localized liquefaction. Consequently, dynamic factors of safety dropped below recommended seismic thresholds (~0.5–0.6 in the upstream and dual-cavity cases). Irregular void geometries further exacerbated these adverse responses, underscoring the critical influence of cavity geometry on dam stability.
- Overall, this combined experimental–numerical investigation demonstrates that subsurface cavities—especially larger, irregular, or upstream-located voids—substantially compromise dam performance. By quantifying the coupled effects on seepage, deformation, pore pressure, and stability, the study enhances understanding of how hidden foundation voids undermine dam safety. The validated methodology provides a reliable basis for assessing dam behavior in karstic settings, contributing valuable insights for the safety evaluation of earth dams.
Author Contributions
Conceptualization, I.H.H., A.H.K.A.-S. and H.M.J.; methodology, software, validation, formal analysis; investigation, resources, data curation, writing—review and editing, funding acquisition, visualization, I.H.H.; supervision, project administration, A.H.K.A.-S. and H.M.J. All authors have read and agreed to the published version of the manuscript.
Funding
This research received no external funding.
Data Availability Statement
The original contributions presented in this study are included in the article. Further inquiries can be directed to the corresponding author.
Conflicts of Interest
The authors declare no conflicts of interest.
References
- Lienhart, D.A. Long-term geological challenges of dam construction in a carbonate terrane. Environ. Eng. Geosci. 2013, 19, 1–25. [Google Scholar] [CrossRef]
- Milanović, P.; Maksimovich, N.; Meshcheriakova, O.; Milanović, P.; Maksimovich, N.; Meshcheriakova, O. Prevention and Remediation at Dam Sites and Reservoirs. In Dams and Reservoirs in Evaporites; Springer: Berlin/Heidelberg, Germany, 2019; pp. 65–92. [Google Scholar]
- Ali, L.; Tanaka, N. Experimental Investigation of Levee Erosion during Overflow and Infiltration with Varied Hydraulic Conductivities of Levee and Foundation Properties in Saturated Conditions. GeoHazards 2023, 4, 286–301. [Google Scholar] [CrossRef]
- Adcock, L.; Brimm, R. A history of karst seepage—Center Hill Dam rehab. Int. Water Power Dam Constr. 2008. Available online: https://www.waterpowermagazine.com/analysis/a-history-of-karst-seepage-center-hill-dam-rehab/?cf-view (accessed on 1 June 2025).
- Bridle, R. Internal erosion mechanics and risk estimation based on ICOLD Bulletin 164. In Proceedings of the Geo-Risk Conference 2017, Denver, CO, USA, 4–6 April 2017; pp. 137–146. [Google Scholar]
- Wang, S.; Chen, J.; He, H.; He, W. Experimental study on piping in sandy gravel foundations considering effect of overlying clay. Water Sci. Eng. 2016, 9, 165–171. [Google Scholar] [CrossRef]
- Fu, Z.; Chen, S.; Ji, E.; Li, G.; Lu, Y. Using clay-gravel mixtures as the impervious core materials in rockfill dams. In Dam Engineering-Recent Advances in Design and Analysis; IntechOpen: London, UK, 2020. [Google Scholar]
- Kayode, O.T.; Odukoya, A.M.; Adagunodo, T.A.; Adeniji, A.A. Monitoring of seepages around dams using geophysical methods: A brief review. In IOP Conference Series: Earth and Environmental Science; IOP Publishing: London, UK, 2018; p. 12026. [Google Scholar]
- Engineer Manual. In Slope Stability; US Army Corps of Engineers: Washington, DC, USA, 2003.
- Edil, T.B.; Berilgen, M.M. Construction of Earth Dams on Soft Ground: Principles and Examples. In Advances in Ground Improvement: Research to Practice in the United States and China; ASCE Publishing: Reston, VA, USA, 2009; pp. 298–307. [Google Scholar] [CrossRef]
- Ito, M.; Azam, S. Determination of swelling and shrinkage properties of undisturbed expansive soils. Geotech. Geol. Eng. 2010, 28, 413–422. [Google Scholar] [CrossRef]
- Kalantari, B. Foundations on collapsible soils: A review. Proc. Inst. Civ. Eng. Eng. 2013, 166, 57–63. [Google Scholar] [CrossRef]
- Indraratna, B.; Chu, J.; Rujikiatkamjorn, C. Ground Improvement Case Histories: Embankments with Special Reference to Consolidation and Other Physical Methods; Butterworth-Heinemann: London, UK, 2015. [Google Scholar]
- Bruce, D.A. Design, construction and performance of seepage barriers for dams on carbonate foundations. Carbonates Evaporites 2013, 28, 229–241. [Google Scholar] [CrossRef]
- Berhe, T.G.; Wang, X.; Wu, W. Numerical investigation into the arrangement of clay core on the seismic performance of earth dams. Soil. Dyn. Earthq. Eng. 2010, 131–138. [Google Scholar] [CrossRef]
- Romanov, D.; Gabrovšek, F.; Dreybrodt, W. Dam sites in soluble rocks: A model of increasing leakage by dissolutional widening of fractures beneath a dam. Eng. Geol. 2003, 70, 17–35. [Google Scholar] [CrossRef]
- Baena, C.M.; Toledo, M.A. An experimentally verified model of the seepage progress due to dissolution of soluble particles in foundations subject to intergranular flow. Environ. Earth Sci. 2014, 72, 3369–3382. [Google Scholar] [CrossRef]
- Yang, Z.; Elgamal, A.; Adalier, K.; Sharp, M.K. Earth dam on liquefiable foundation remediation: Numerical simulation of centrifuge experiments. J. Eng. Mech. 2004, 130, 1168–1176. [Google Scholar] [CrossRef]
- Cui, C.-Y. Seismic behavior and reinforcement mechanisms of earth dam and liquefiable foundation system by shaking table tests and numerical simulation. Soil Dyn. Earthq. Eng. 2023, 173, 108083. [Google Scholar] [CrossRef]
- Nadhir, A.-A.; Nasrat, A.; Varoujan, S.; Sven, K.; Jan, L. Is Mosul Dam the Most Dangerous Dam in the World? Review of Previous Work and Possible Solutions. Engineering 2017, 9, 801–823. [Google Scholar] [CrossRef]
- Ali, A.M.; Karkush, M.O.; Al-Jorany, A.N. Numerical modeling of connected piled raft foundation under seismic loading in layered soils. J. Mech. Behav. Mater. 2023, 32, 20220250. [Google Scholar] [CrossRef]
- Papaioannou, G.; Alamanos, A.; Maris, F. Evaluating Post-Fire Erosion and Flood Protection Techniques: A Narrative Review of Applications. GeoHazards 2023, 4, 380–405. [Google Scholar] [CrossRef]
- Bhasin, R.; Aslan, G.; Dehls, J. Ground Investigations and Detection and Monitoring of Landslides Using SAR Interferometry in Gangtok, Sikkim Himalaya. GeoHazards 2023, 4, 25–39. [Google Scholar] [CrossRef]
Disclaimer/Publisher’s Note: The statements, opinions and data contained in all publications are solely those of the individual author(s) and contributor(s) and not of MDPI and/or the editor(s). MDPI and/or the editor(s) disclaim responsibility for any injury to people or property resulting from any ideas, methods, instructions or products referred to in the content. |
© 2025 by the authors. Licensee MDPI, Basel, Switzerland. This article is an open access article distributed under the terms and conditions of the Creative Commons Attribution (CC BY) license (https://creativecommons.org/licenses/by/4.0/).