1. Introduction
The southern coast of Java, Indonesia, is one of the most tsunami-prone regions in the world due to its proximity to the highly active tectonic boundary between the Indo-Australian and Eurasian Plates. This boundary is part of the Pacific Ring of Fire, an area with frequent seismic activity that generates powerful underwater earthquakes capable of producing tsunamis. The main source of tsunami events in Indonesia is generally considered to be shallow earthquakes in the subduction zone or plate boundary due to the release of large amounts of energy, which cause vertical shifts on the seafloor [
1]. The latest research conducted by the authors of [
2,
3] showed that there is a surface deformation of the multi-GNSS receiver data that has the potential to cause a megathrust earthquake that could cause a tsunami in the southern region of Java Island. Therefore, the southern region of Java Island is one of the regions in Indonesia that has potential for earthquake and tsunami disasters.
The 2006 Pangandaran earthquake and tsunami serve as a stark reminder of this region’s vulnerability. In that tragic event, the tsunami waves reached heights of up to seven metres, causing widespread devastation, including loss of life, destruction of property, and significant economic impacts [
4,
5,
6]. The geography of southern Java, characterized by steep coastal areas and narrow continental shelves, amplifies the impact of tsunamis [
7]. The tsunami severely affected the tourism industry in areas like Pangandaran. Visitor numbers dropped drastically from about 900,000 annually to just over 250,000 immediately after the tsunami; furthermore, it also caused extensive damage to buildings and infrastructure [
8].
In addition to direct damage, tsunamis can have long-lasting economic consequences for local industries [
9]. Coastal economies often rely heavily on tourism, fisheries, and agriculture, which can be severely affected by such natural disasters. The destruction of fishing boats, equipment, and marine habitats disrupts fishing communities’ livelihoods, leading to income loss and increased poverty. Similarly, the tourism industry may suffer from the destruction of infrastructure and a decline in visitor numbers due to safety concerns. This was observed after the 2011 Tohoku tsunami in Japan, where the tourism sector faced significant challenges in recovery, and the closure of Japanese ports following the 2011 tsunami had global repercussions, affecting industries reliant on Japanese exports such as the automotive and electronics sectors [
10].
Tsunami run-up models are essential tools for predicting the extent of coastal flooding and the potential impact on coastal communities. These models simulate how far inland a tsunami wave will travel, known as the “run-up”, by considering wave height, coastal topography, and bathymetry (the underwater depth of ocean floors). Accurate run-up models help in assessing risk and planning effective mitigation strategies to protect lives and property [
11]. The run-up can be simulated on a 3-D topographic model to obtain detailed information about the potential damage. A 3-D topographic model of the coastal area can be derived by integrating UAV photogrammetry and bathymetric survey data [
12]. Three-dimensional tsunami inundation mapping provides more spatially accurate information, precisely representing how tsunami waves interact with coastal topographies and coastal buildings so that damage estimates for affected buildings can also be calculated more precisely. In addition, by conducting 3D tsunami inundation mapping, office holders can make better decisions and plan better in their areas to increase infrastructure resilience and the resilience of the surrounding community to tsunami disasters.
Improving the ability to predict and mitigate tsunami disasters is very important to reduce the impact of future tsunamis. One way to achieve this is to map the potential area of a high-resolution three-dimensional tsunami submersion. Unlike 2D models, 3D models can provide more accurate and realistic results to overcome the potential dangers of tsunami immersion. With 3D models, the main characteristics of the immersion process can be better described [
13]. The 3D tsunami submersion potential map can also be useful in selecting tsunami evacuation buildings, planning evacuation routes, and planning mitigation measures to strengthen buildings to minimize potential human and economic losses [
14].
In this research, the tsunami economic loss analysis will be applied for one tourism area in Southern Coast of West Java Province, in the area known as Batukaras Village. The village is part of Pangandaran Regency, one of the top tourist destinations in West Java. Every year, the village attracts national and international tourists to Batukaras beach, famous as a surfing destination [
15]. According to data from the Tourism Office of Pangandaran Regency, in 2023, the village attracted 475,988 national and international tourists, an increase from 449,629 in the previous year. The village is located in a closed bay and faces the Indian Ocean; as such, Batukaras beach is popular among surfers. For those reasons, tourism is the main economic pillar, alongside fisheries and agriculture [
15].
2. Materials and Methods
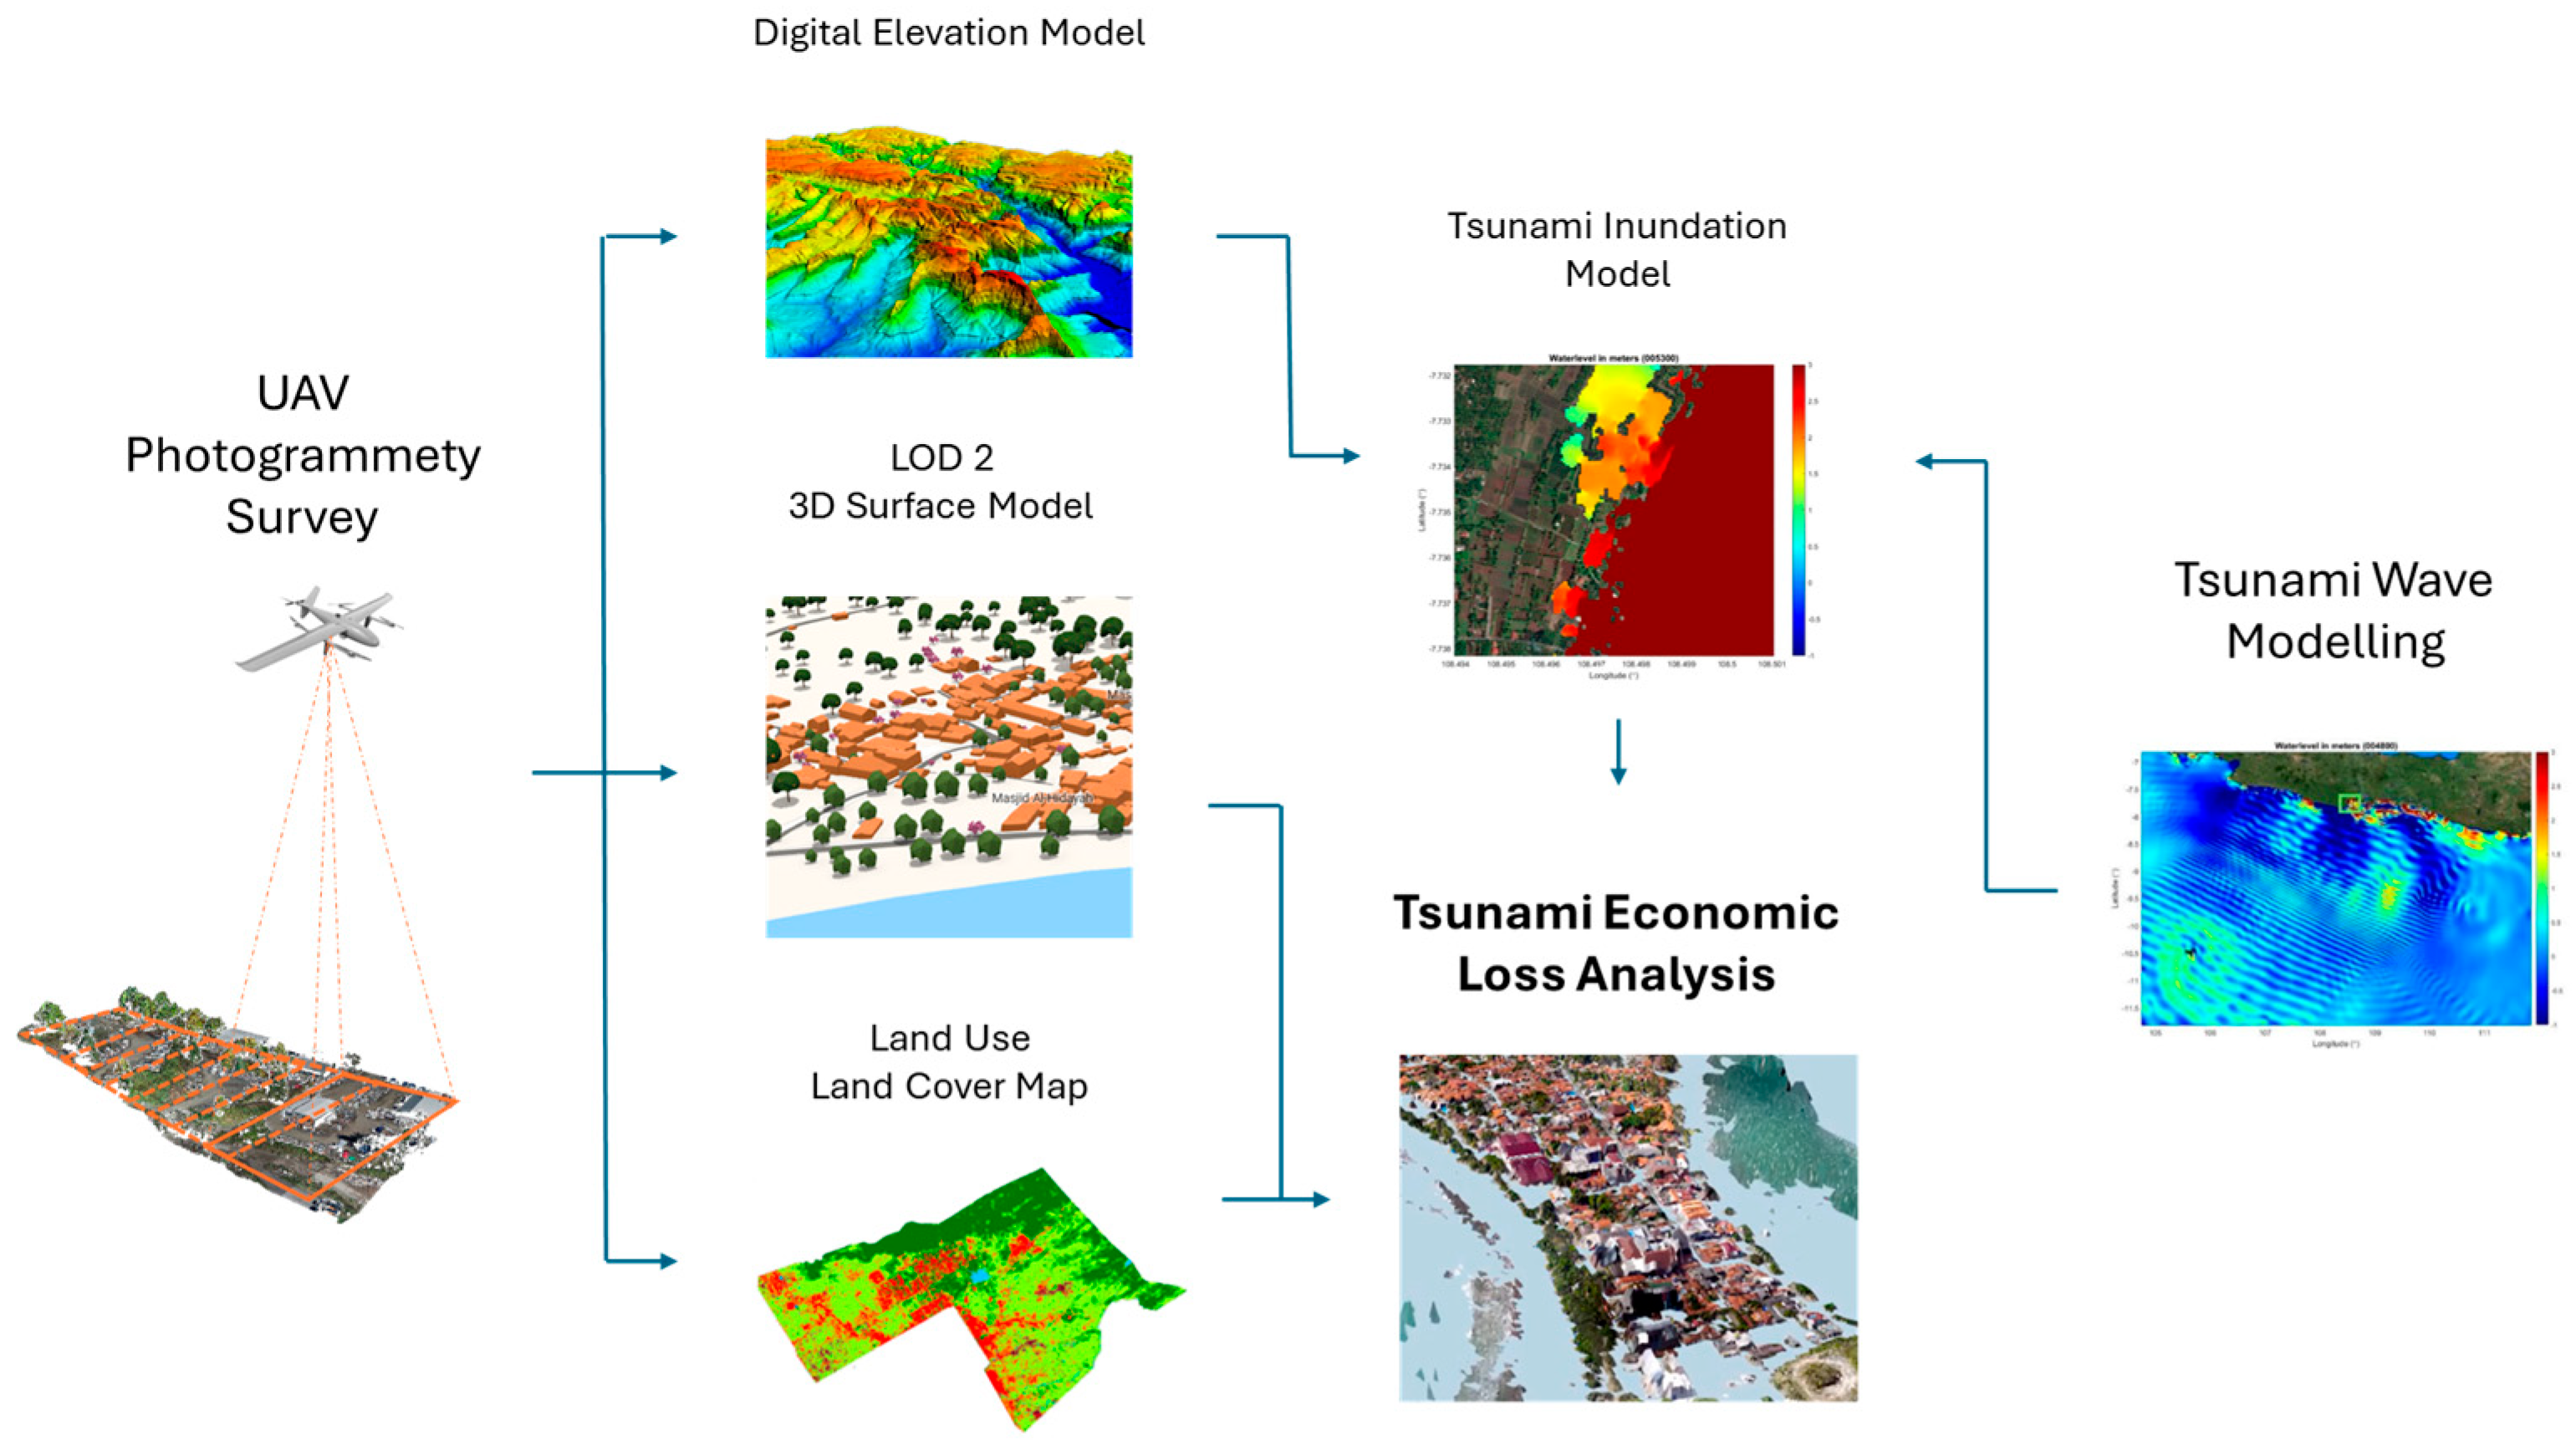
Tsunami economic loss analyses use geospatial data that are mainly produced from UAV (Unmanned Aerial Vehicle) Photogrammetric Surveys and Tsunami Wave Modelling (
Figure 1). A UAV Photogrammetric Survey was conducted in May 2023 and was intended to conduct three-dimensional mapping with the level of detail of objects on the Earth’s surface up to Level of Detail (LOD)-2. The mapping uses UAVs that can take off and land vertically (VTOL—Vertical Take Off and Landing) with GNSS RTK positioning systems [
16]. The Digital Elevation Model (DEM) and LOD-2 model of the Batukaras Village area are derived from aerial photographs produced at an altitude of 300 m with a data resolution of 10–12 cm or with a point density of 100 ppm (points per m
2). To improve the accuracy of the horizontal and vertical position of DEM and LOD-2, the aerial photos are georeferenced using 22 Ground Control Points (GCP) and Independent Check Points (ICP).
The dentification and mapping of buildings with LOD-2 detail was provided by UAV aerial photo data processing and field surveys for sampling the uses of the buildings. These buildings were then classified based on the type of building (refer to [
17]) for the vulnerability study of the building.
The land cover and land use map is derived from UAV aerial photo data; refer to the [
18] for concerns regarding the national standard for Land Cover Classification. To complement and assist in interpreting and identifying land cover from this UAV aerial photo, existing land cover maps from the Indonesian Geospatial Agency, or any other sources, were used. The results of this land cover mapping will be verified through a field survey for accuracy test analysis.
Potential tsunami hazards related to tsunami wave height, time of arrival, and inundation area are simulated using a hydrodynamic model. The simulation starts from the formation of the initial wave according to the worst possible scenario from the megathrust segments in the Indian Ocean, to the spread of tsunami waves from their source to the southern coastal area of Java Island, and to the run-up of the tsunami waves on the mainland in the Pangandaran coastal tourist area. The scenario of the tsunami simulation was based on the worst-case scenario reported in [
19]. Modelling the formation of waves, the propagation of tsunami waves to coastal areas and the runoff from the coast to the mainland, along with the speed of wave propagation, are modelled using Delft3D software version 4.05 [
20]. The tsunami wave run-up simulation on the coastal area uses the DEM from UAV Photogrammetry.
The economic loss (in IDR or Indonesian Rupiah) is calculated based on three factors (
Figure 2):
Buildings, estimated from the damage ratio and the value of the buildings.
Land use/land cover, estimated from the loss of crop products for a period of one year.
Tourism, estimated from the loss of visitors who engage in tourism activities (surfing, eating, buying souvenirs), buy entrance tickets, and stay in hotels, for a period of one year. One year is the length of time in which the economy slowly begins to return to normal. This happened in the 2004 Indian Ocean Tsunami, where the victims began to live normal lives again, children started going to school, those who lost their jobs started to go back to work, most of the damaged fishing boats were replaced, and the farmland was cleared and replanted [
21,
22].
2.1. Methods of Run-Up Model
The tsunami run-up is obtained by modelling with Delft3D using the numerical modelling method. The Delft3D-FLOW numerical hydrodynamic modelling system solves problems using non-linear shallow water equations derived from equations based on the basic principles of continuity and momentum equations expressed through the Navier–Stokes equations to describe fluid flow in shallow waters where the water depth is shallow compared to the wavelength [
20]. These equations assume that the fluid flow has a constant density.
The continuity equation in the hydrodynamic model ensures that the mass of water remains constant in the system, that no water is lost or suddenly appears, and that the flow conditions in the system increase or decrease due to the flow from and to other places, while the momentum equation describes how the velocity of water changes due to various forces acting on the system.
A few parameters need to be set to build a tsunami run-up model. The most important is the generator source of the tsunami and topographic and bathymetric data as the model domain.
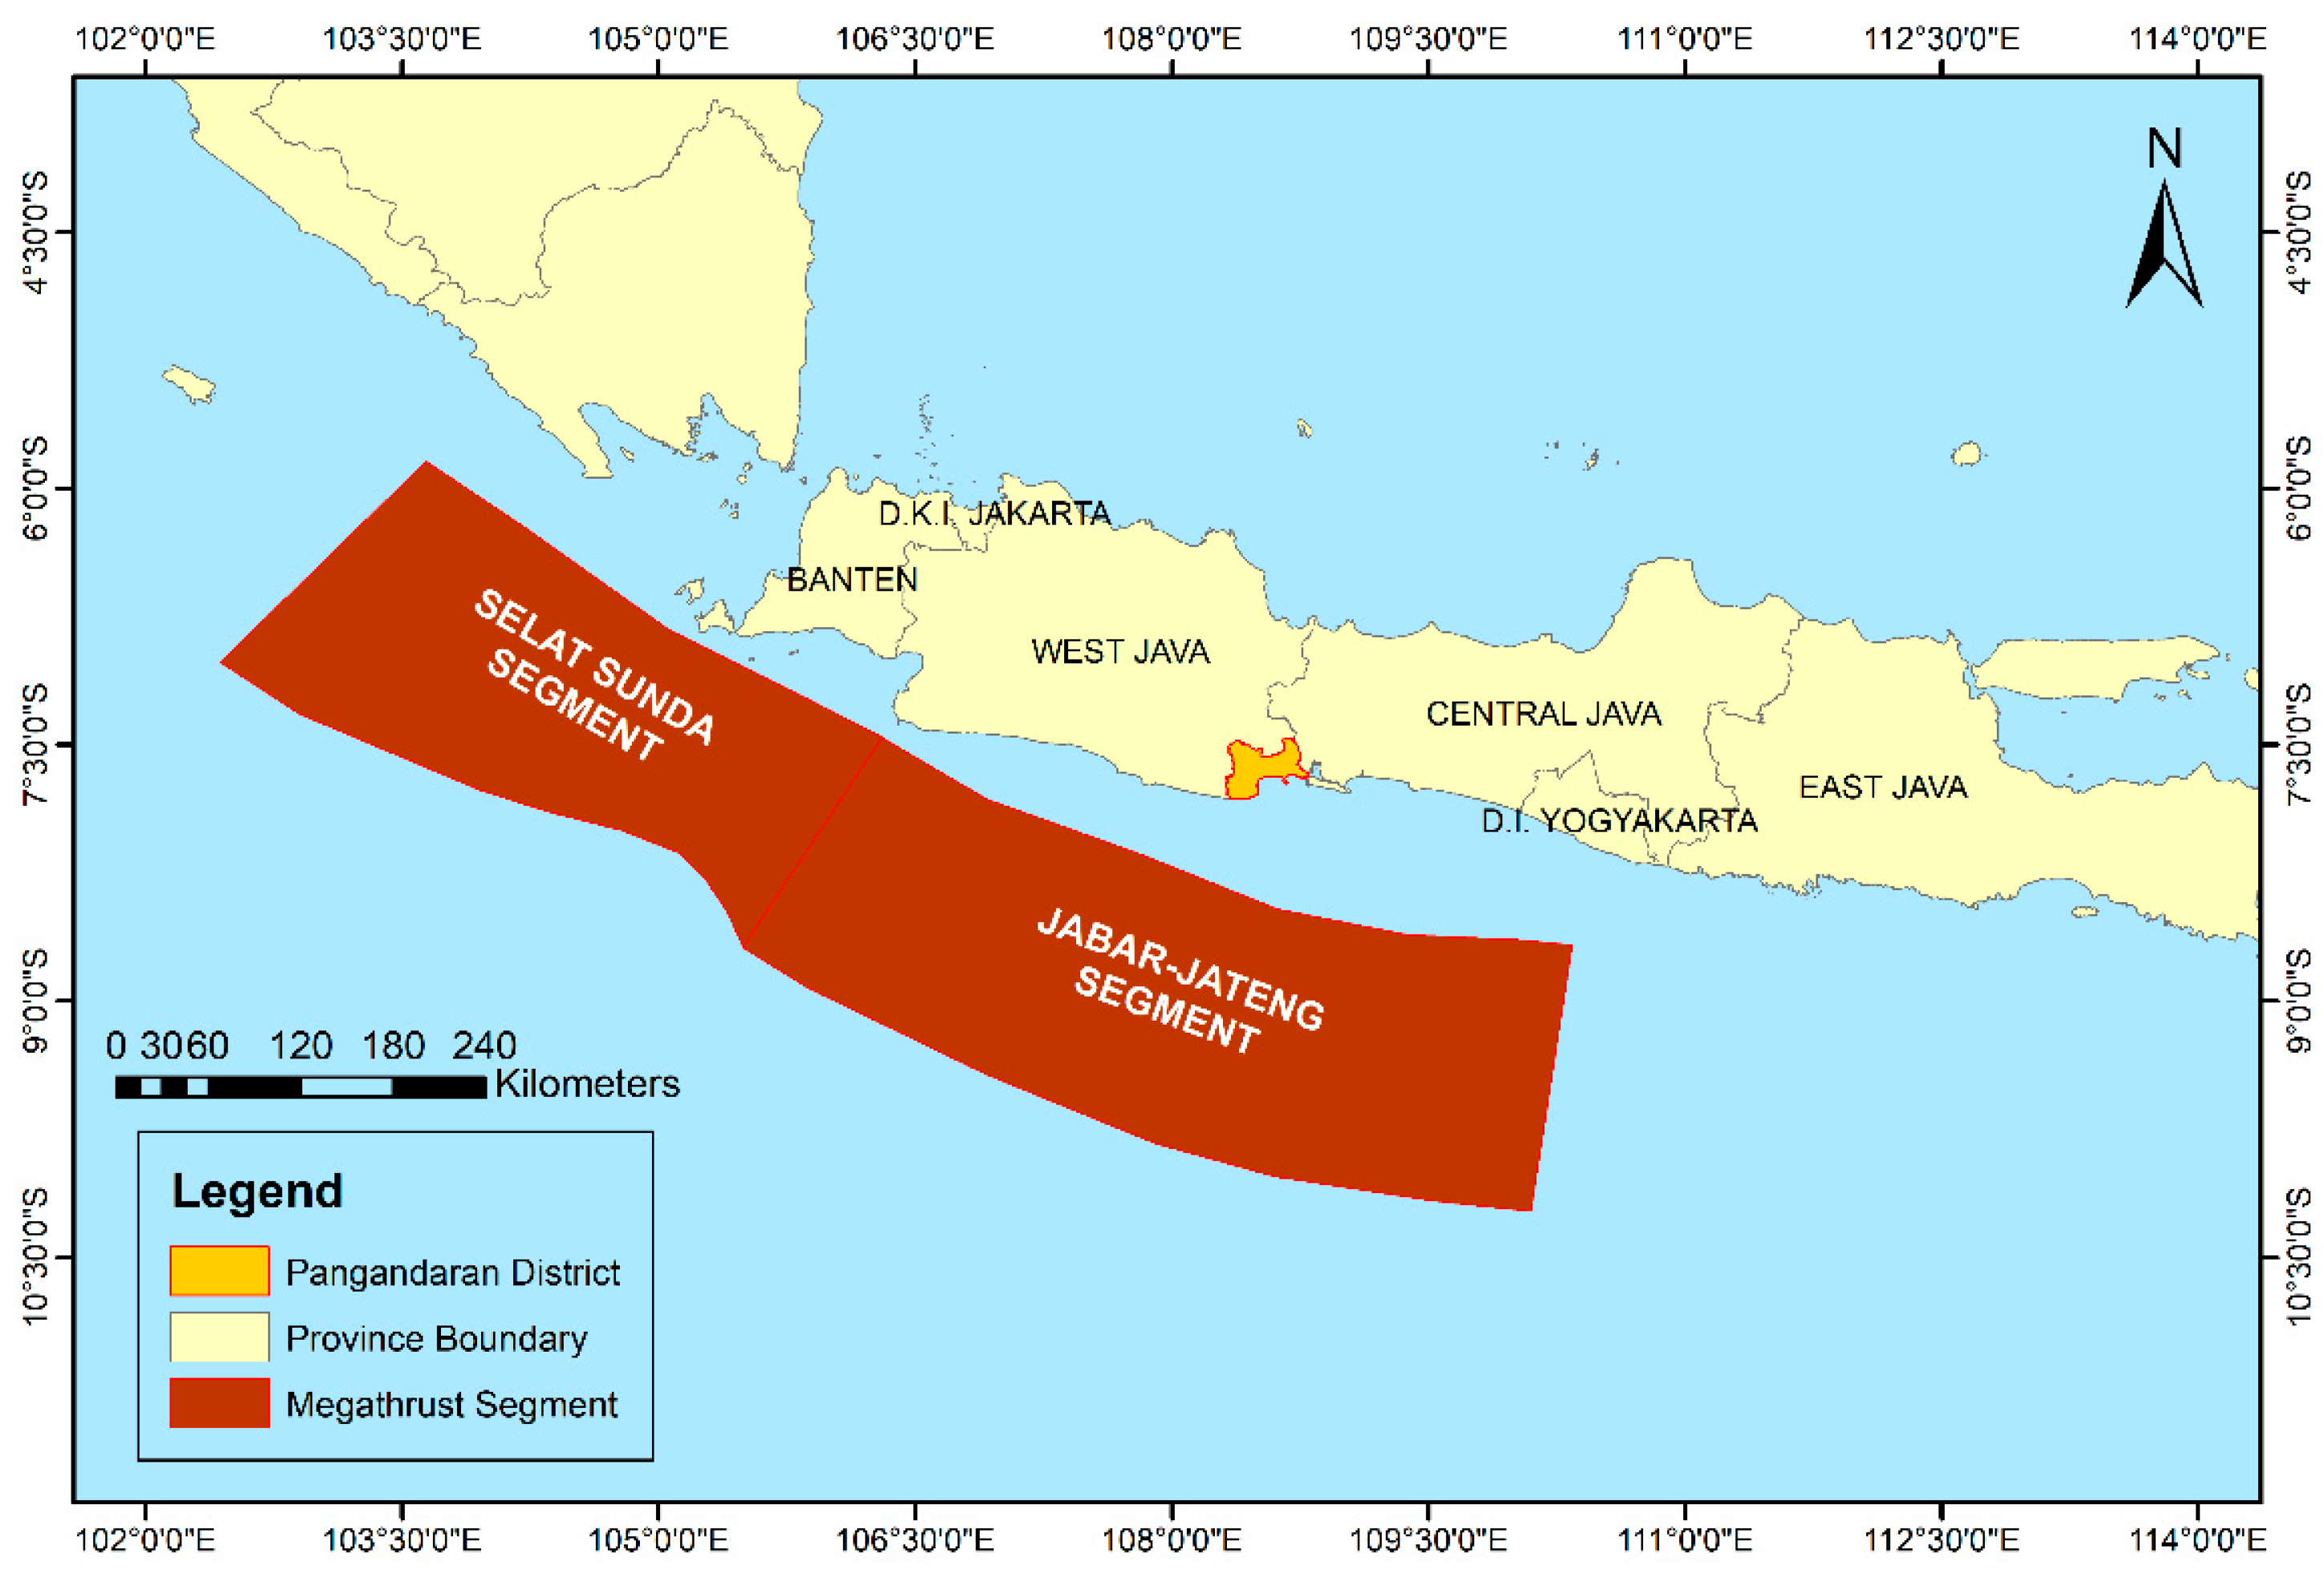
The tsunami generator source used in this model is the worst scenario which has affected the Pangandaran District [
18]. The Jabar-Jateng megathrust segment generates this worst scenario. This megathrust segment is located in the southern part of Java Island, directly opposite the Pangandaran District (
Figure 3). This megathrust segment is the segment that has the longest size among the other segments in the southern region of Java Island, with the highest potential magnitude. There are other segments with the same potential magnitude but provide different tsunami potential results due to differences in other parameters and location. Based on the model conducted by (2020) [
18], the Jabar-Jateng megathrust segment generates a tsunami with the worst results for the Cijulang sub-district, Pangandaran District, where the research area of this paper is located. This megathrust segment generates a tsunami with a maximum inundation height of 15.9 m, an arrival time of 28 min, and a maximum inundation range of 2.215 km. In comparison, the other segments have inundation height results of no more than 10 m, arrival times of no faster than 30 min, and an inundation range of no more than 1.1 km.
The megathrust parameters in
Table 1 are used to generate tsunamis in a larger model that includes the segment sizes. This model generates the initial wave of the tsunami that enters the study area. The initial waves will be input to the open boundaries of the model domain by nesting from the larger model.
The model domain is built by integrating the topographic and bathymetric data. Each of the data have a different resolution and vertical reference. Therefore, the data must first be aligned regarding vertical reference and resolution before being integrated. The resolution is based on the desired model resolution, which is 5.5 m.
The run-up model parameter settings can be seen in
Table 2.
Settings for the roughness coefficient parameter use varying values depending on the land cover in the study area. The roughness coefficients are summarized from [
23,
24,
25] and can be seen in
Table 3.
2.2. Buildings
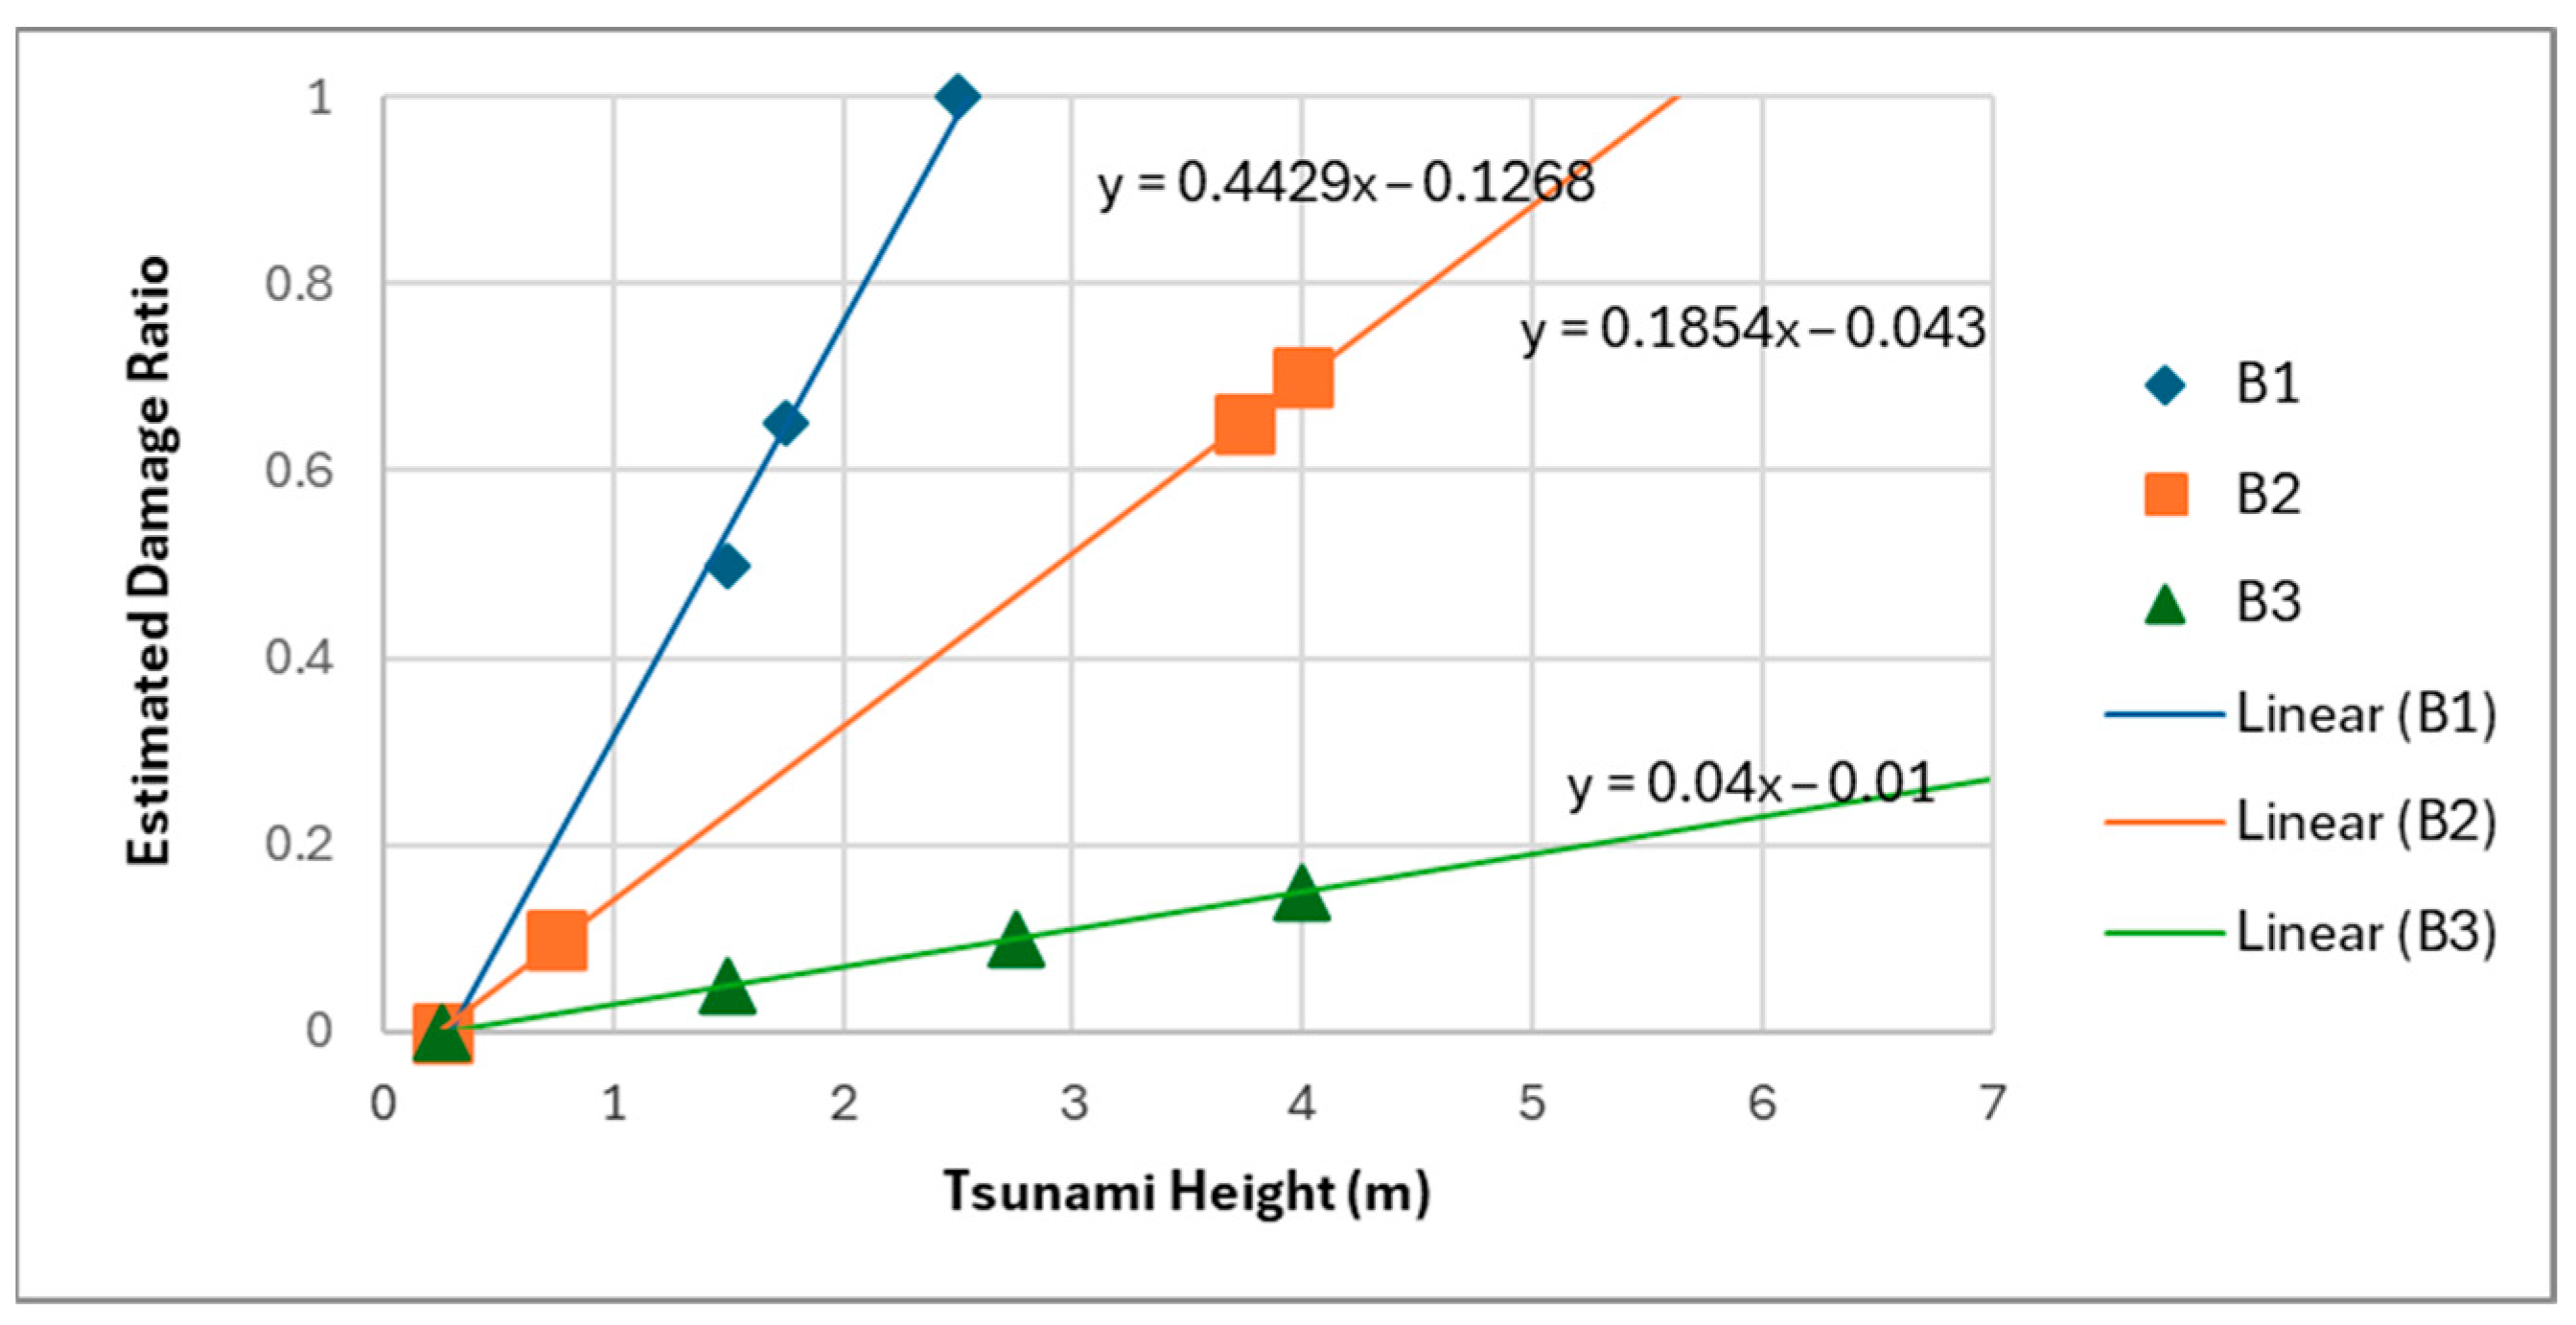
An analysis of the potential damage to buildings and land cover is conducted in tsunami inundation areas based on the height of the tsunami waves. The calculation of potential economic losses due to building damage is carried out using the type of building and the tsunami hazard (height of the tsunami wave) that inundates the building. The buildings are classified into 3 types, as follows: (1) type 1, Timber/Traditional Block (1-storey); (2) type 2, Traditional Brick with RC (1-storey); and (3) type 3, RC Column with Brick Infill (2+ storeys) based on [
17]. Once the inundation height of each building is identified, the damage ratio of the building is estimated based on the vulnerability curve modified and extrapolated from [
17] (
Figure 4). The vulnerability curve from [
17] is carefully selected after a previous analysis of the curves from several studies [
26,
27,
28,
29,
30,
31,
32,
33,
34]. The vulnerability curve from [
17] is the most relevant to this study, since the study areas are very close, both are tourism areas, and the building types have the same characteristics. In [
26,
27,
28,
29], the vulnerability curves were analyzed based on the impact of earthquake-generated tsunamis in various areas in Indonesia. However, the building characteristics are different due to different cultures and not being a tourism area. As vulnerability curves from [
30,
31,
32,
33,
34] were analyzed from other countries, they are also not applicable to this study. The economic loss for each building is estimated based on the damage ratio multiplied by the area of the building and the value per unit area (Equation (1)). The value is analyzed based on interviews with local residents and the government.
Figure 4.
Building vulnerability curve (modified from [
17]).
Figure 4.
Building vulnerability curve (modified from [
17]).
where
= economic loss in buildings (in IDR)
= number of inundated buildings of type (where is 1, 2 or 3)
= area of inundated building number (in m2)
= value of building of type (IDR per m2)
= damage ratio of building of type number (in %)
2.3. Land Use/Land Cover
The potential loss of crop products from certain land use/land cover areas after a tsunami event is estimated based on the crop production per year per hectare. The inundated land use/land cover area (in hectares) is multiplied by the crop production (in kg per year per hectare) and multiplied by the price of the crop production per kg (Equation (2)). The five following types of land use/land cover are inundated from the tsunami modelling result: (1) coconut plantation, (2) paddy field, (3) fishpond, (4) shrimp pond, and (5) mixed plantation.
where
= economic loss in land use/land cover (in IDR)
= number of inundated land use/land cover areas of type (where is 1–5)
= area of inundated land use/land cover number (in m2)
= price of crop production of land use/land cover of type (IDR per kg)
= Crop production in land use/land cover of type number (in kg/ha/yr)
2.4. Tourism
The economic loss in tourism is estimated based on the loss of visitors who spend their money (on food, activities, and souvenirs), buy entrance tickets, and stay in hotels for a period of one year (Equation (3)). The estimated number of visitors is assumed to be equal to the number in 2023. Characteristics of domestic and international visitors are identified from the interviews to estimate the average tourist spending and average period of stay for both types of visitors.
where
= economic loss in tourism (in IDR);
= average expenditure of money on food for visitor type (domestic or international);
= the number of visitor type ;
= average length of stay for visitor type (days);
= average expenditure of money for activities for visitor type (IDR);
= ratio of the values for visitors’ expenditures on activities for visitor type (%);
= average expenditure of money for souvenirs for visitor type (IDR);
= average ratio of values for visitors who spend money on souvenirs, of visitor type (%);
= entrance ticket price (IDR);
= the number of hotels in the inundation area;
= the number of rooms in hotel ;
= average weekday room rate of hotel (IDR);
= weekday occupancy rate of hotel (%);
= the number of weekdays in a year;
= average weekend room rate of hotel (IDR);
= weekend occupancy rate of hotel (%);
= the number of weekend day in a year.
The total tsunami economic loss (
) can be calculated as the sum of the economic losses in building, land use, and tourism sectors (Equation (4))
3. Results
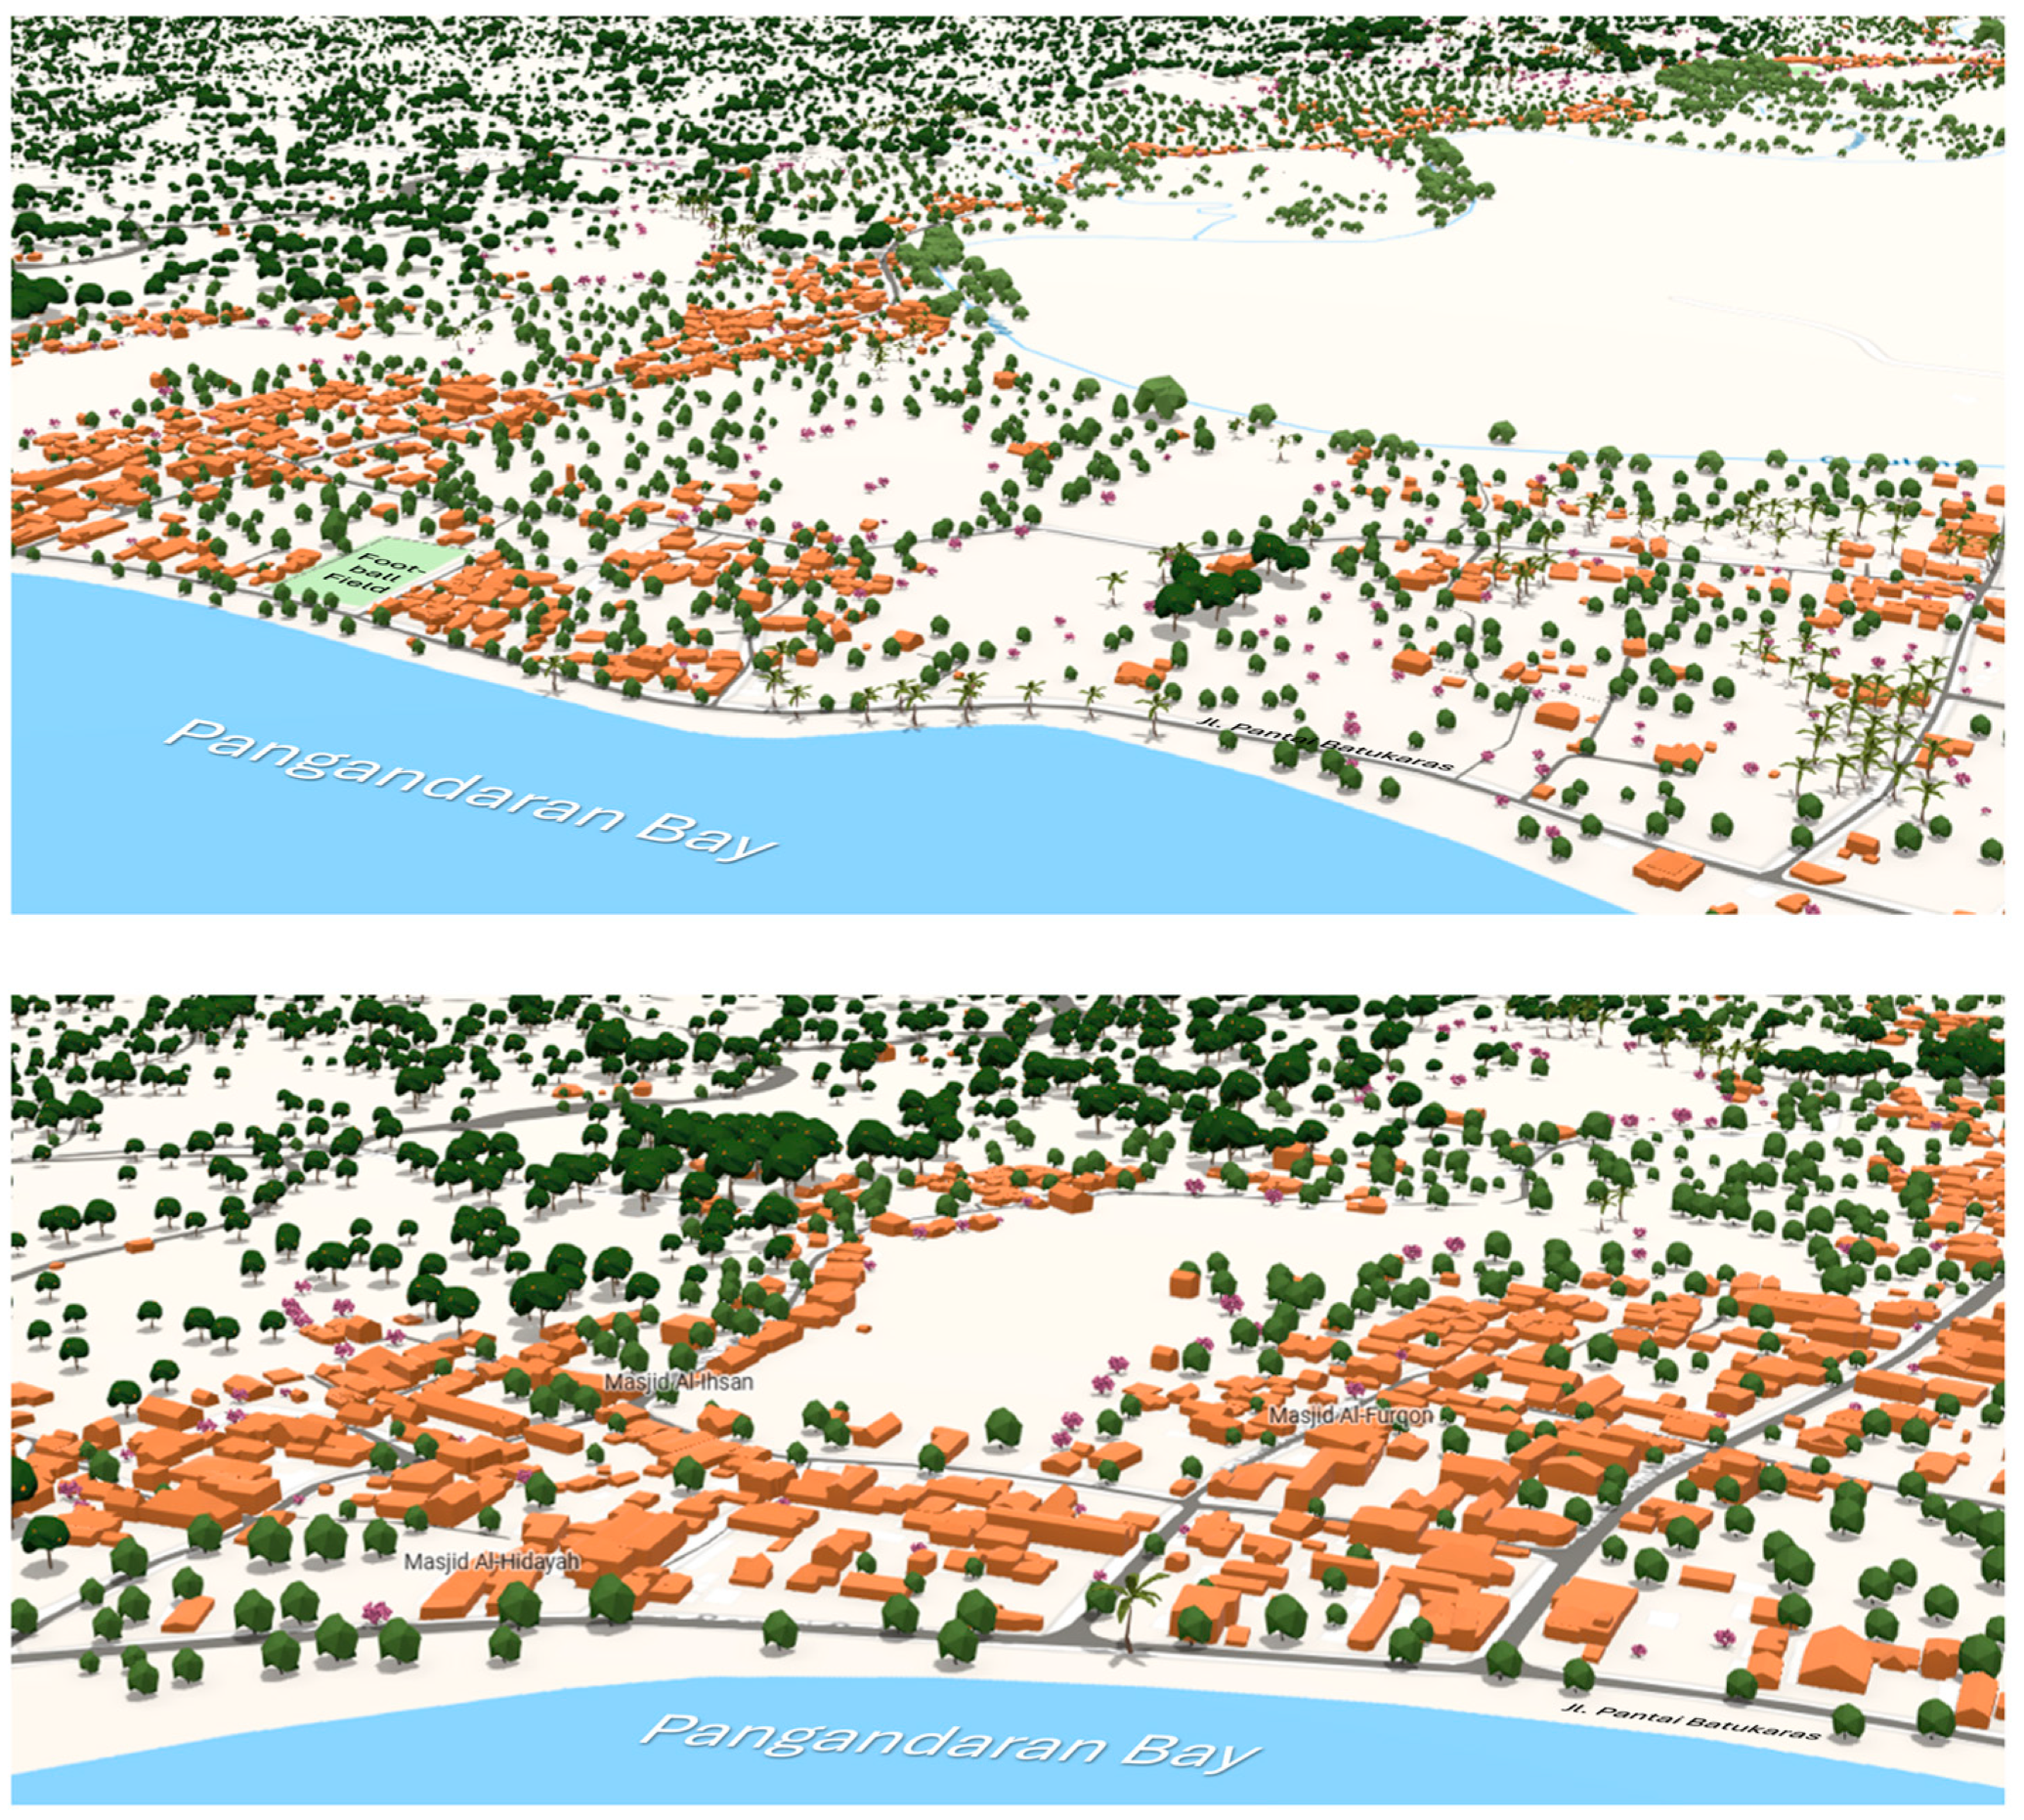
The LOD2 Model resulting from the UAV photogrammetry survey is presented in
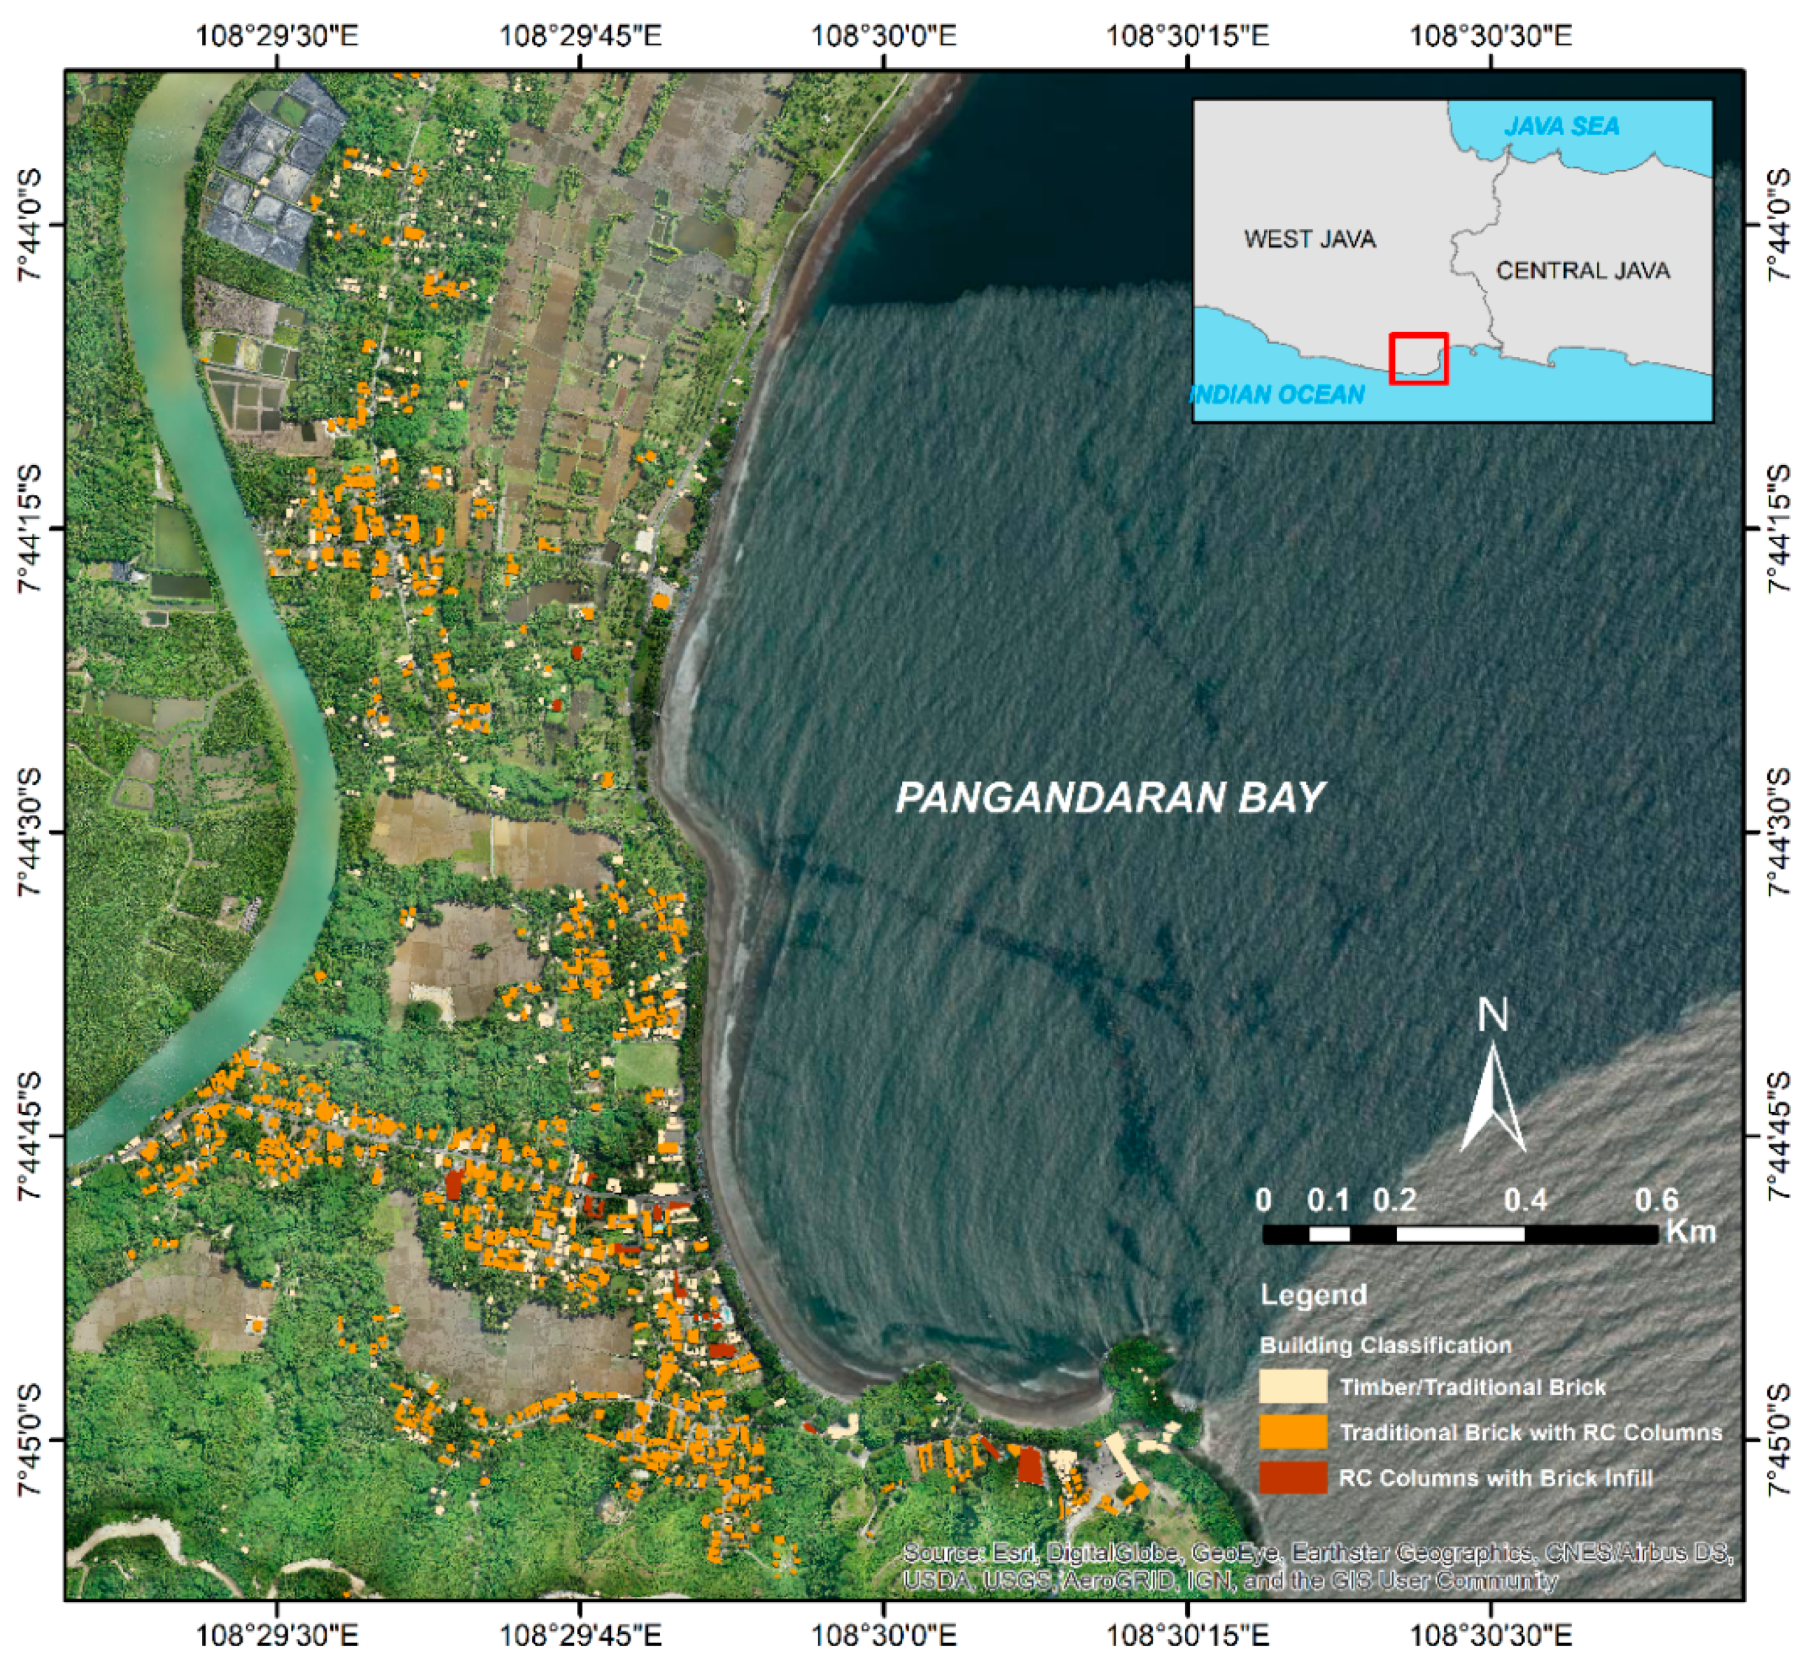
Figure 5. The model is capable of displaying individual buildings along with the heights of the buildings. The buildings, in LOD-2, are classified based on [
17] and presented in
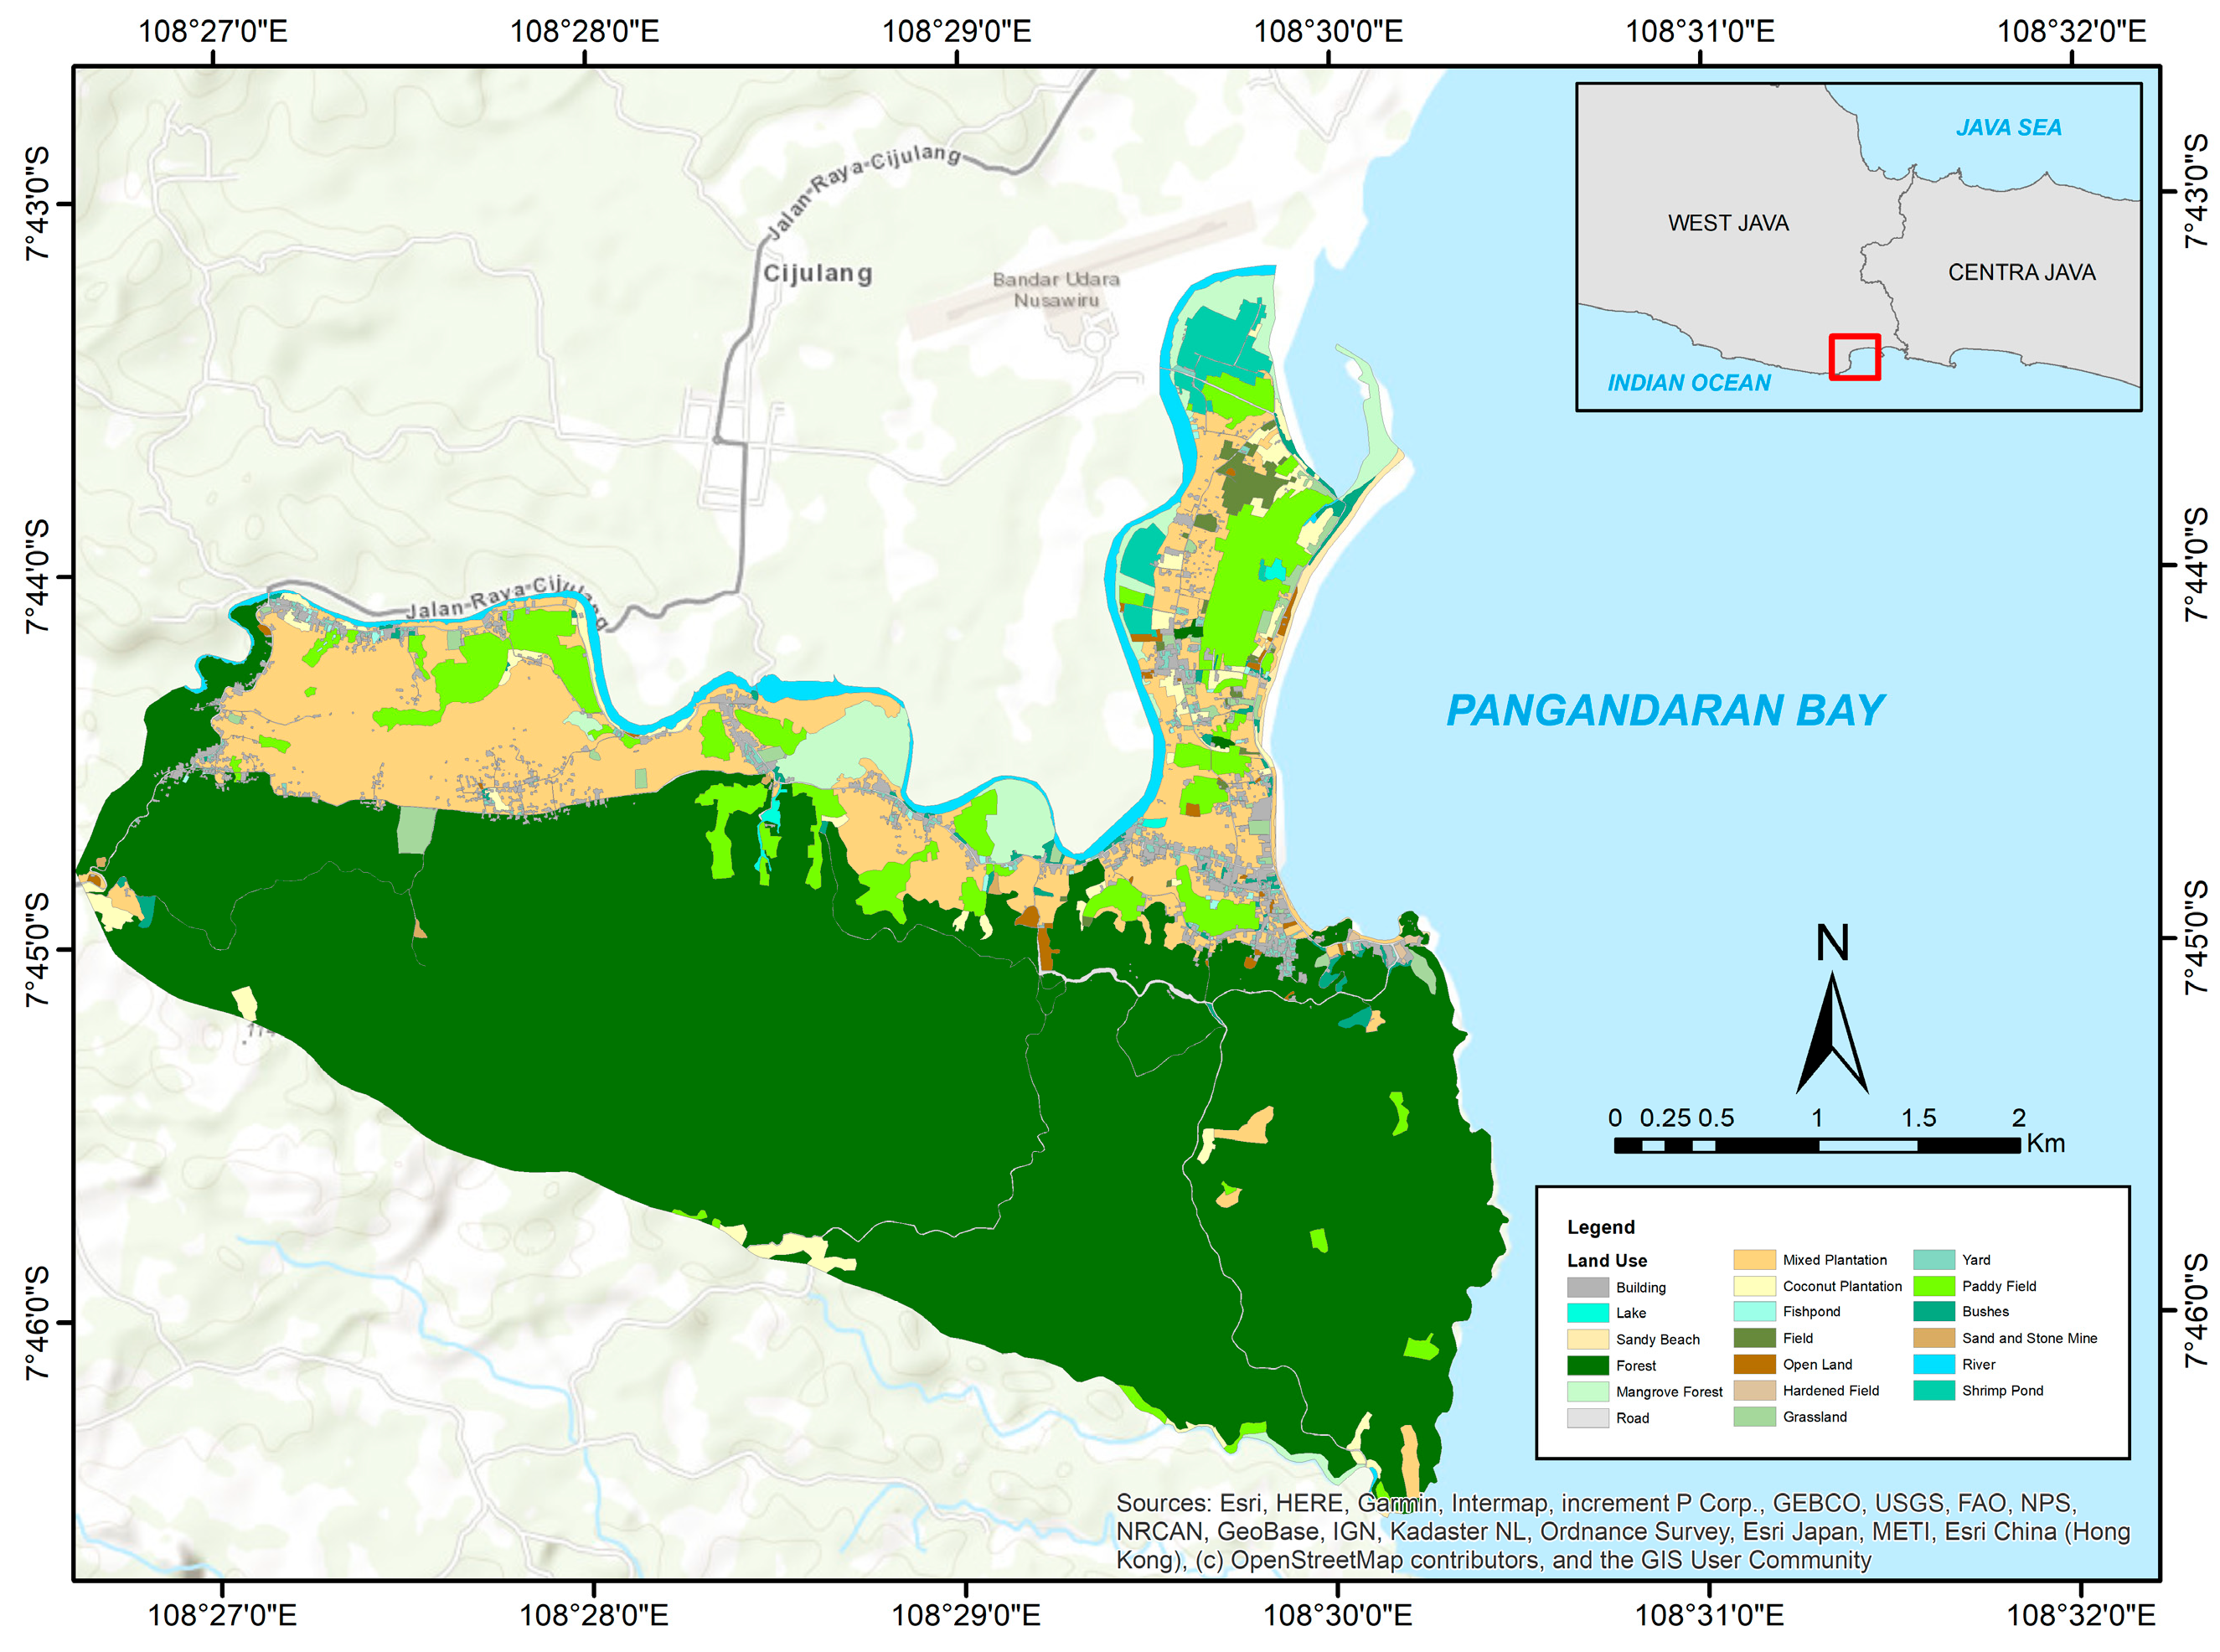
Figure 6. Another derivation product of UAV photogrammetry mapping is the land use/land cover map presented in
Figure 7.
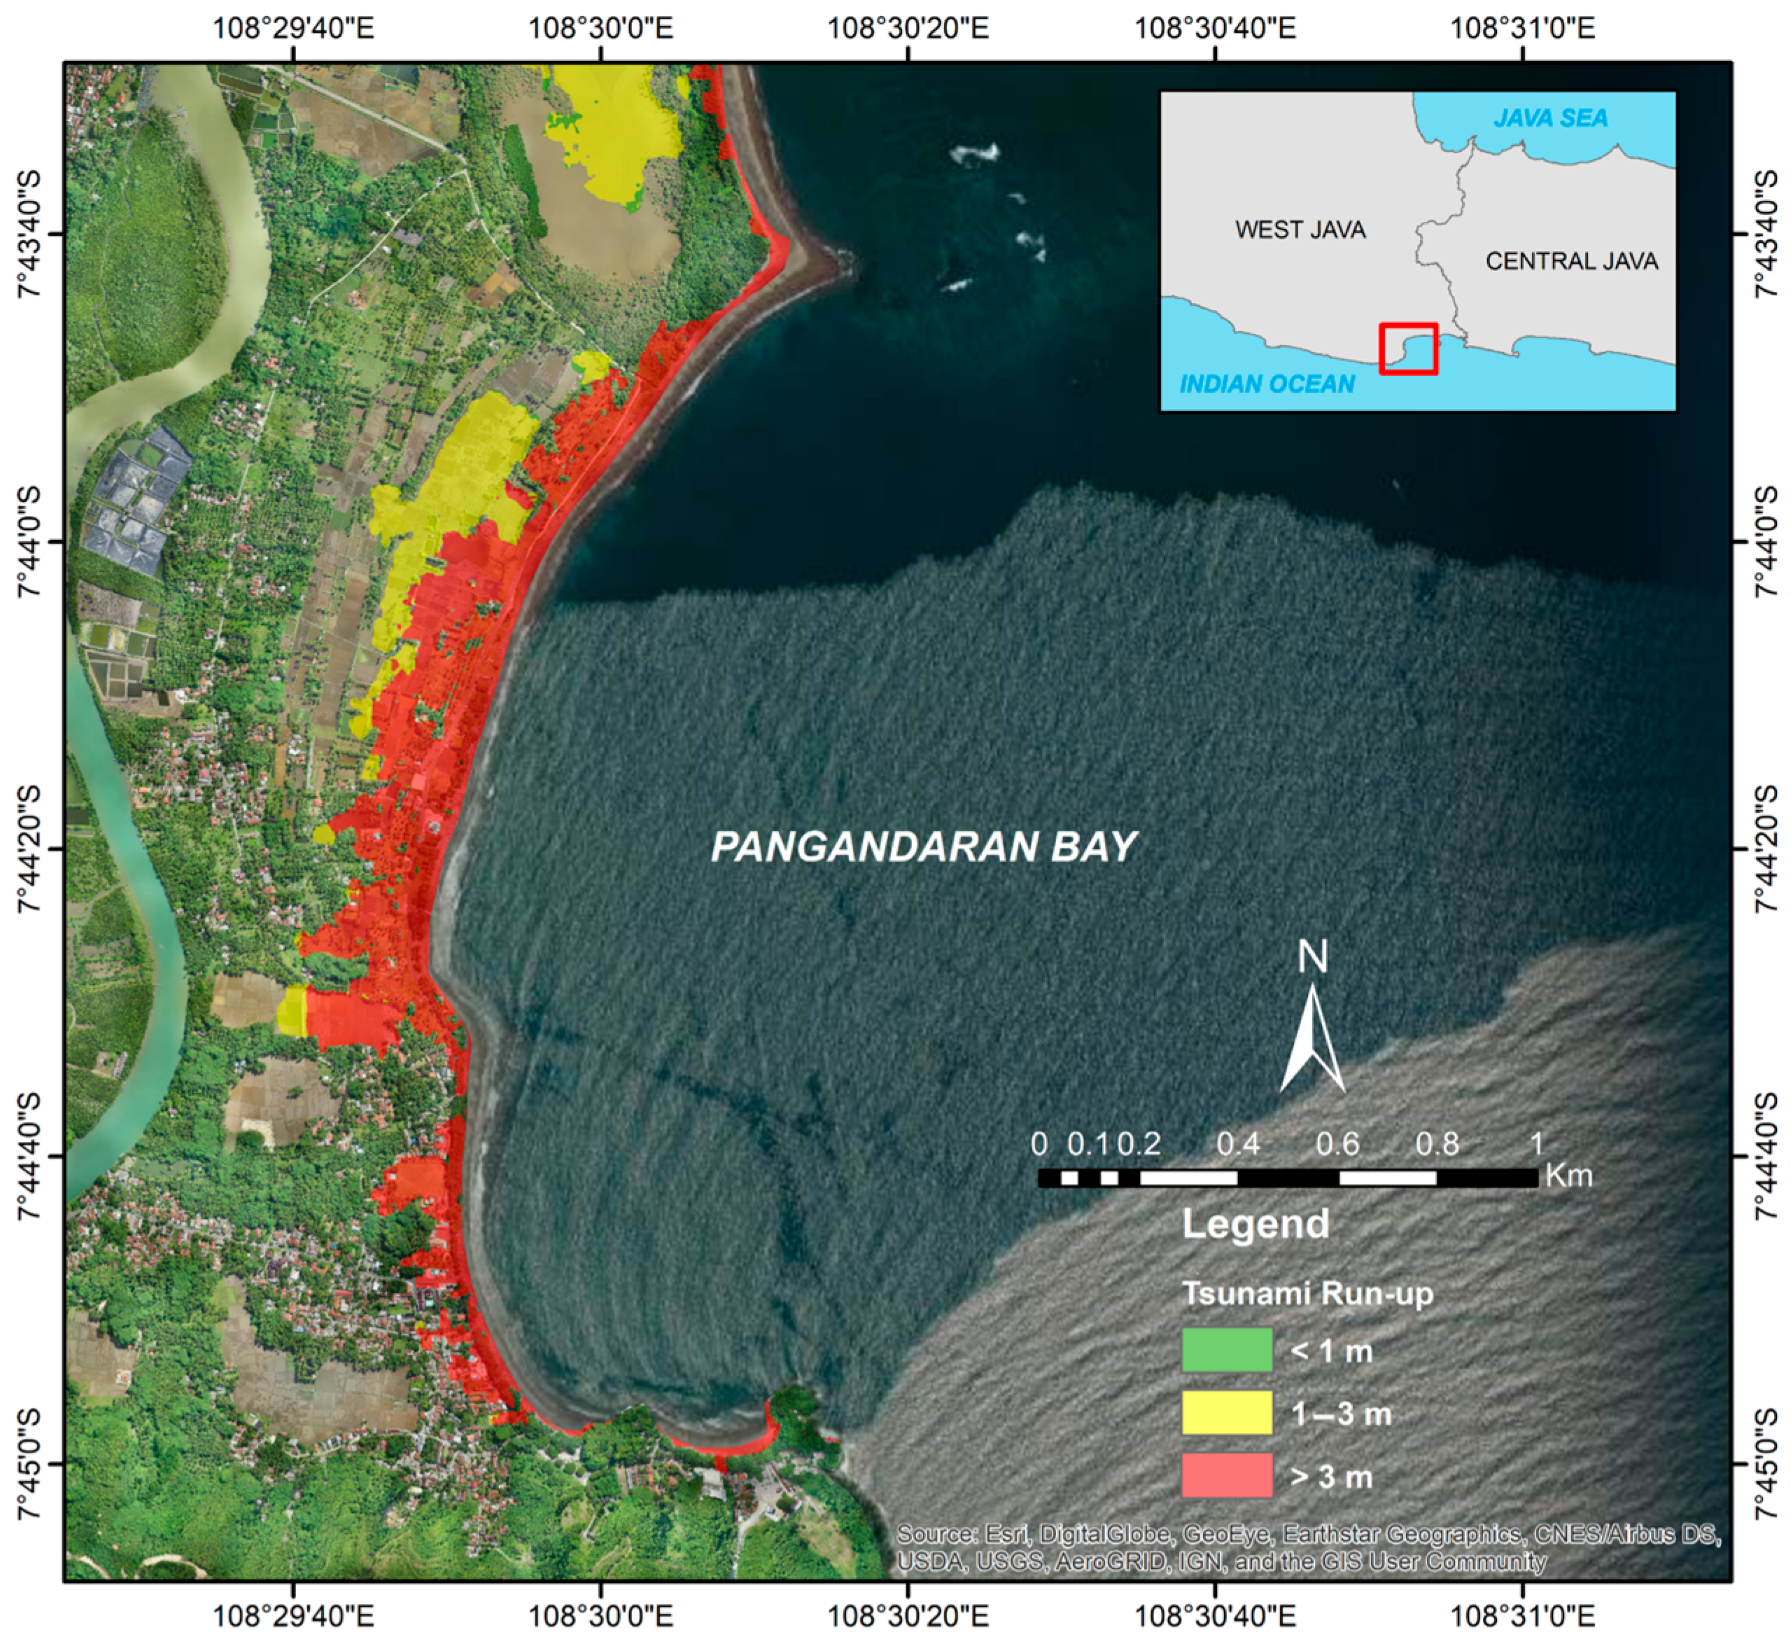
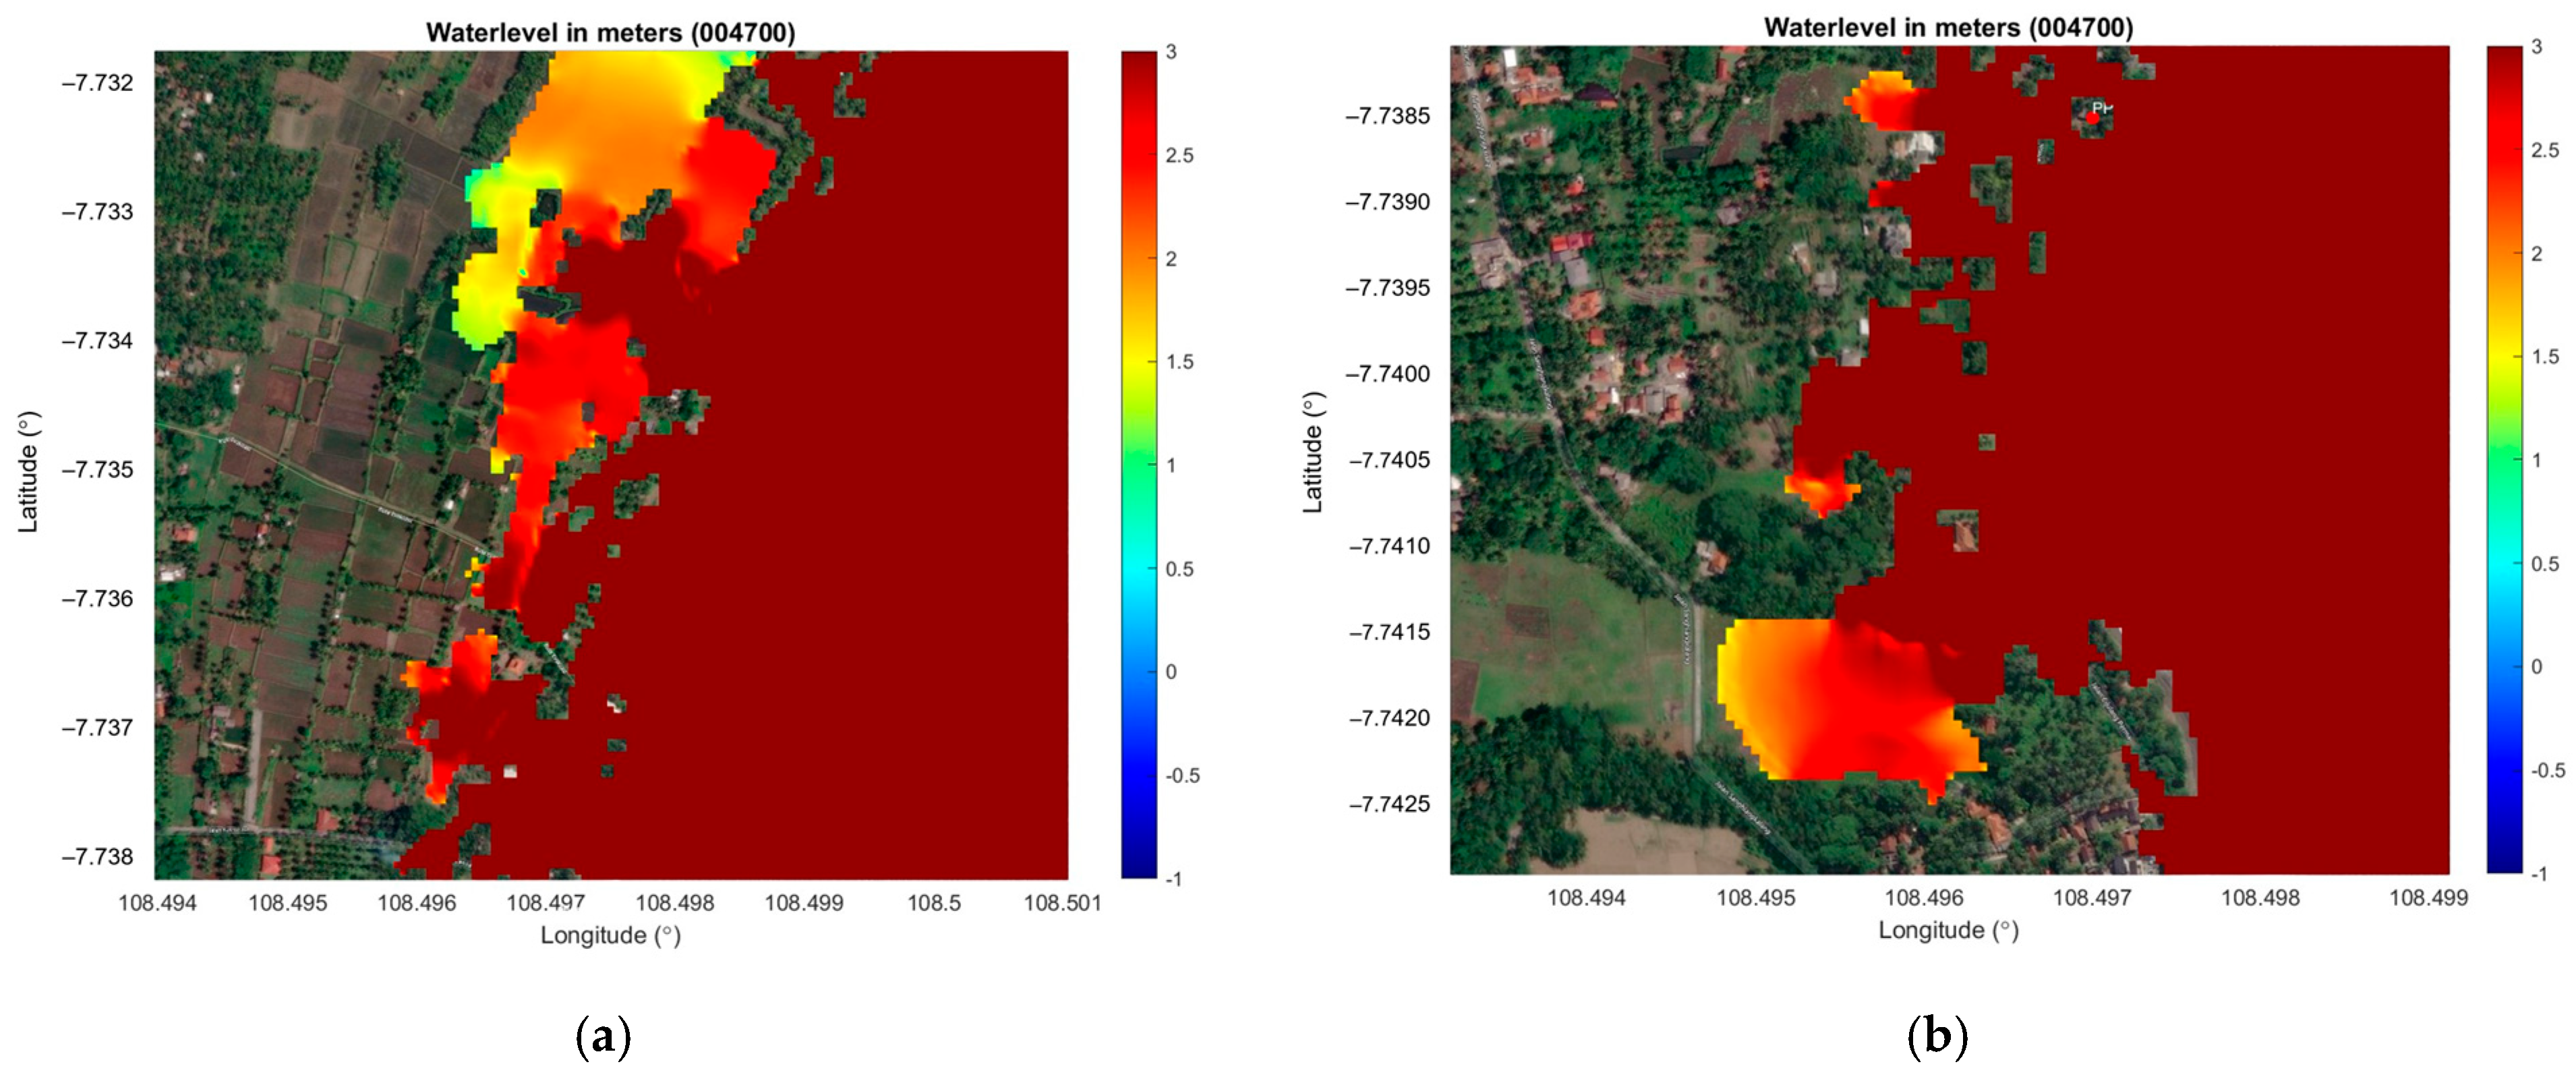
Figure 8 and
Figure 9 show the tsunami inundation area as the result of the tsunami run-up model.
Figure 9 shows the results of a more detailed, high-resolution tsunami model, where it can be seen that the tsunami waves entering the research area entered through gaps in buildings or trees and were held back by several taller infrastructures. Impacted buildings and land uses/land covers are shown in
Table 4 and
Table 5.
Estimating tsunami economic loss as described in Equations (1)–(4) requires some data and assumptions. The economic loss in buildings (
in Equation (1)) requires the number of inundated buildings, as well as their area (
), type, damage ratio (
), and value (
). The number, type, and area of the buildings can be derived from the LoD-2 model (
Figure 5) as presented in
Table 4, while the damage ratio is estimated based on [
17] and the inundation height of the buildings. The value of the building per m
2 (
) is analyzed from the interviews, and determined as IDR 3 million/m
2 for a one-storey building and IDR 6 million/m
2 for a two-storey building.
Table 4 presents the estimated economic loss from buildings.
Related to economic loss in productive land (
in Equation (2)), five types of land use were identified, as shown in
Table 5. The economic value/price of crop products (
) and the production per hectare (
) for each land use type were analyzed based on interviews with local farmers and the government.
Economic loss in the tourism sector is estimated based on the loss of visitors, which will impact income from tickets, hotels, and other touristic expenses (Equation (3)).
Table 6 presents the number of visitors to Batukaras Village from 2019 to 2023. The loss from ticket income can be calculated directly using the ticket price per person (
) as IDR 15,000. The number of visitors in 2023 is assumed to be the number of visitors that were lost during the recovery period in this analysis (
.
Table 7 presents some assumptions for tourist spending on food (
), activities (
), and souvenirs (
), as well as the estimated average length of stay (
). Using part of Equation (3), the estimation of economic loss in tourist spending is presented in
Table 8. In this estimation, the value of the ratio of visitors who spend money on activities for domestic and international visitors to those who do not (
) is 0.5, which means only half of the domestic and international visitors who spend money on activities (rent a bike or a surfboard). Another assumption involves the ratio of visitors who spend money on souvenirs, regarding both domestic and international visitors, to those who do not (
), which was determined to be 0.5. Tourists are assumed to spend money on food and activities every day during their stay in Batukaras Village, but only once on a souvenir.
Table 9 presents the estimation of the annual incomes of all hotels that are located in the inundation area based on the number of rooms (
), weekday rate (
), and weekend rate (
). In this estimation, based on interviews, the occupation rate during weekday (
) is determined as 0.5, and the occupation rate during the weekend (
) is 1. The number of weekdays (
) in a year is 260, while the number of weekend days (
) in a year is 104.
4. Discussion
In total, 3276 buildings are identified from the LOD-2 model, of which most of the buildings (1874) are in the type 2 class (Traditional Brick with RC Columns, one storey), and only 24 buildings are classified as type 3 (RC Columns with Brick Infill, two storey or more). The rest (1378) are classified as Timber/Traditional Brick buildings; beyond this, the land use/land cover map shows that most of the area in the Batukaras Village (90.9%) is covered by vegetation (forest and plantations). Only 2.1% of the area is used for residential purposes, and 5% for paddy fields.
The tsunami run-up impacted an area of 43.311 ha, with 165 buildings (
Table 4), 23 of which are hotels/guest houses. This inundation area also affected five economically productive land use types, with a total area of 24.46 ha (
Table 5).
Timber/traditional brick class buildings dominate the inundation area, as can be seen in
Table 4, with about 64%, or 105 buildings, potentially contributing about IDR 26 billion in economic losses. In total, the economic loss from the buildings is about IDR 49.6 billion.
The impacted/inundated area () is calculated from the overlay of the inundation map and land use map. It can be seen that most of the run-up covered paddy field area; however, most of the economic loss comes from the mixed plantation land, with a value of IDR 5,9 billion, which contributes about 87.7% of the economic loss from productive lands.
Table 6 presents the potential economic loss from entrance ticket sales to the beach. In 2020 and 2021, the number of visitors dropped, particularly international ones, due to the COVID-19 pandemic. However, since then, the number of visitors has increased. About IDR 7 billion is estimated to be lost from entrance ticket income due to the tsunami event. Another potential economic loss may come from tourists’ spending during their visits.
Table 8 presents the estimation of this loss, and it gives a value for the loss of about IDR 132 billion. Using part of Equation (3), the annual total income for hotel rooms can be estimated at IDR 13.27 billion (
Table 9), and this is assumed to be the potential economic loss during a year-long recovery period after a tsunami disaster.
The combination of potential economic losses from tourism in tickets, hotels, and other spending gives a total value of IDR 152.43 billion (
Table 6 +
Table 8 +
Table 9), with tourist spending contributing the most, at IDR 132.02 billion, or about 86.61%. Tourist spending on food is the highest among the other expenditures, with a value of IDR 95.97 billion, or about 62.96% the of economic loss from the tourism sector. This is understandable, since all visitors need food every day, for as long as they stay in the area.
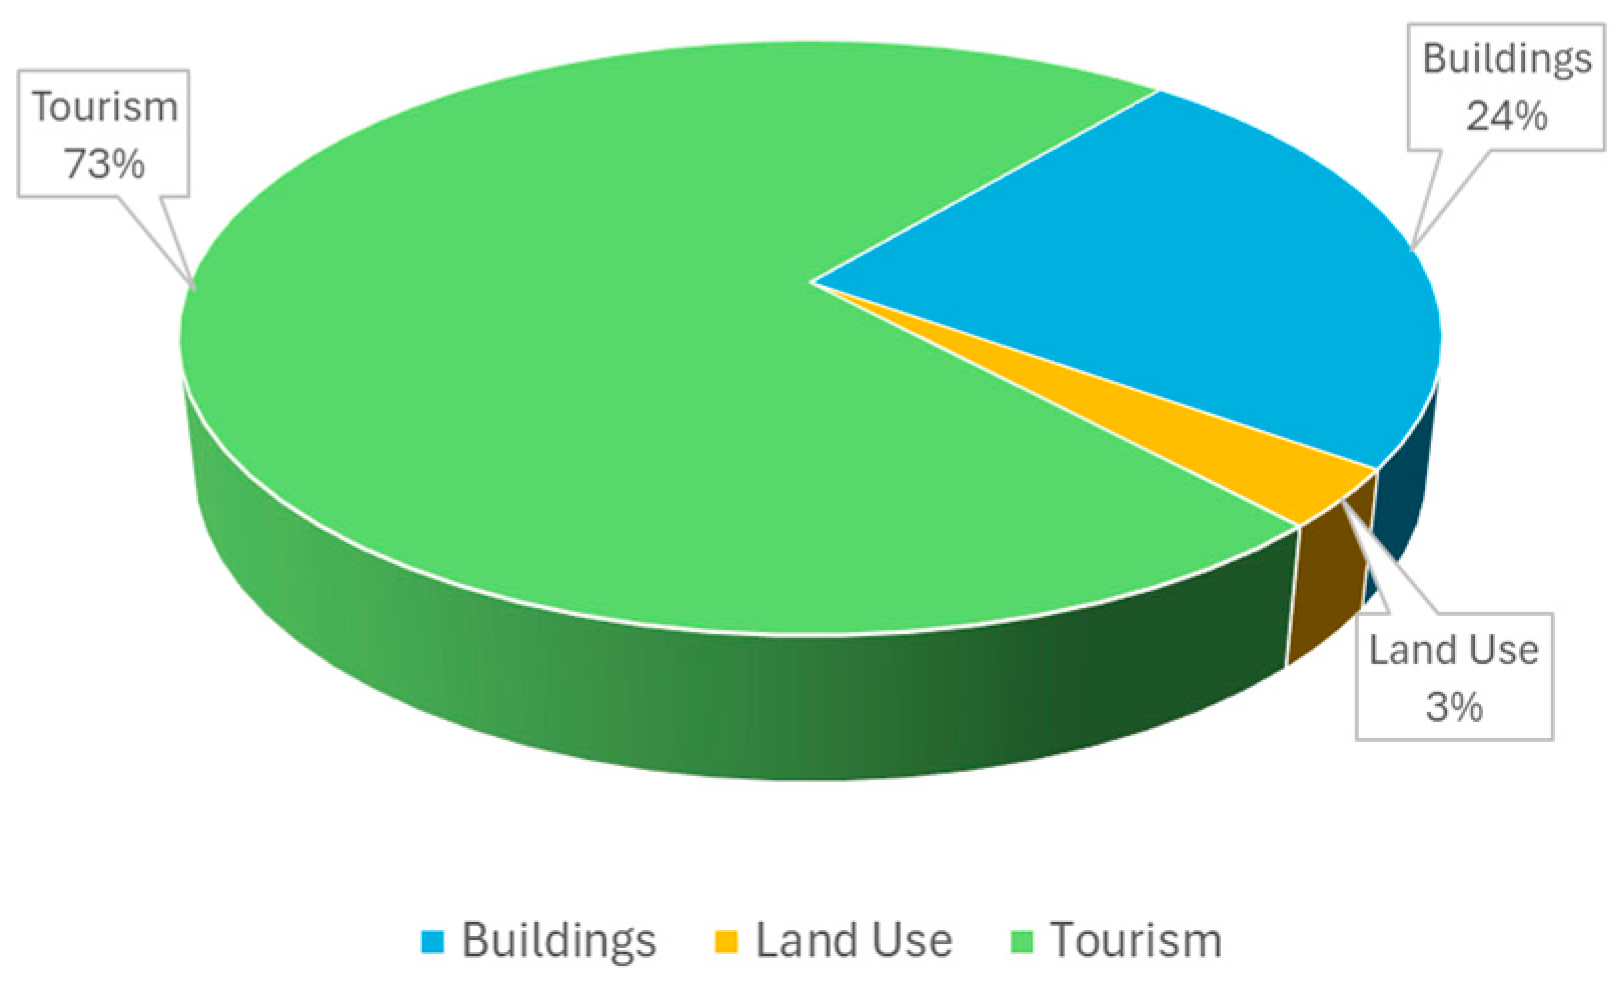
In total, the potential economic loss due to the tsunami disaster is IDR 208.79 billion; the detailed summary is presented in
Table 10. The table shows that IDR 152.43 billion, or about 73% of the total potential economic loss, comes from tourism factors (
Figure 10). Therefore, it is clear that tsunami disasters will severely affect tourism areas.
The significant economic losses from the tourism sector highlight the long-term challenges faced by tsunami-affected areas. Even after infrastructure is rebuilt, the fear and negative perception of safety among potential visitors can prolong the decline in tourist arrivals, delaying economic recovery. Tourism recovery after a tsunami event depends on policy makers’ initiatives, infrastructure rebuilding, media influence, and tourist safety perceptions. Quick responses, such as financial aid, marketing campaigns, and regulatory changes, are known to be effective in restoring tourists’ confidence and attracting visitors back to affected areas [
35,
36,
37,
38].
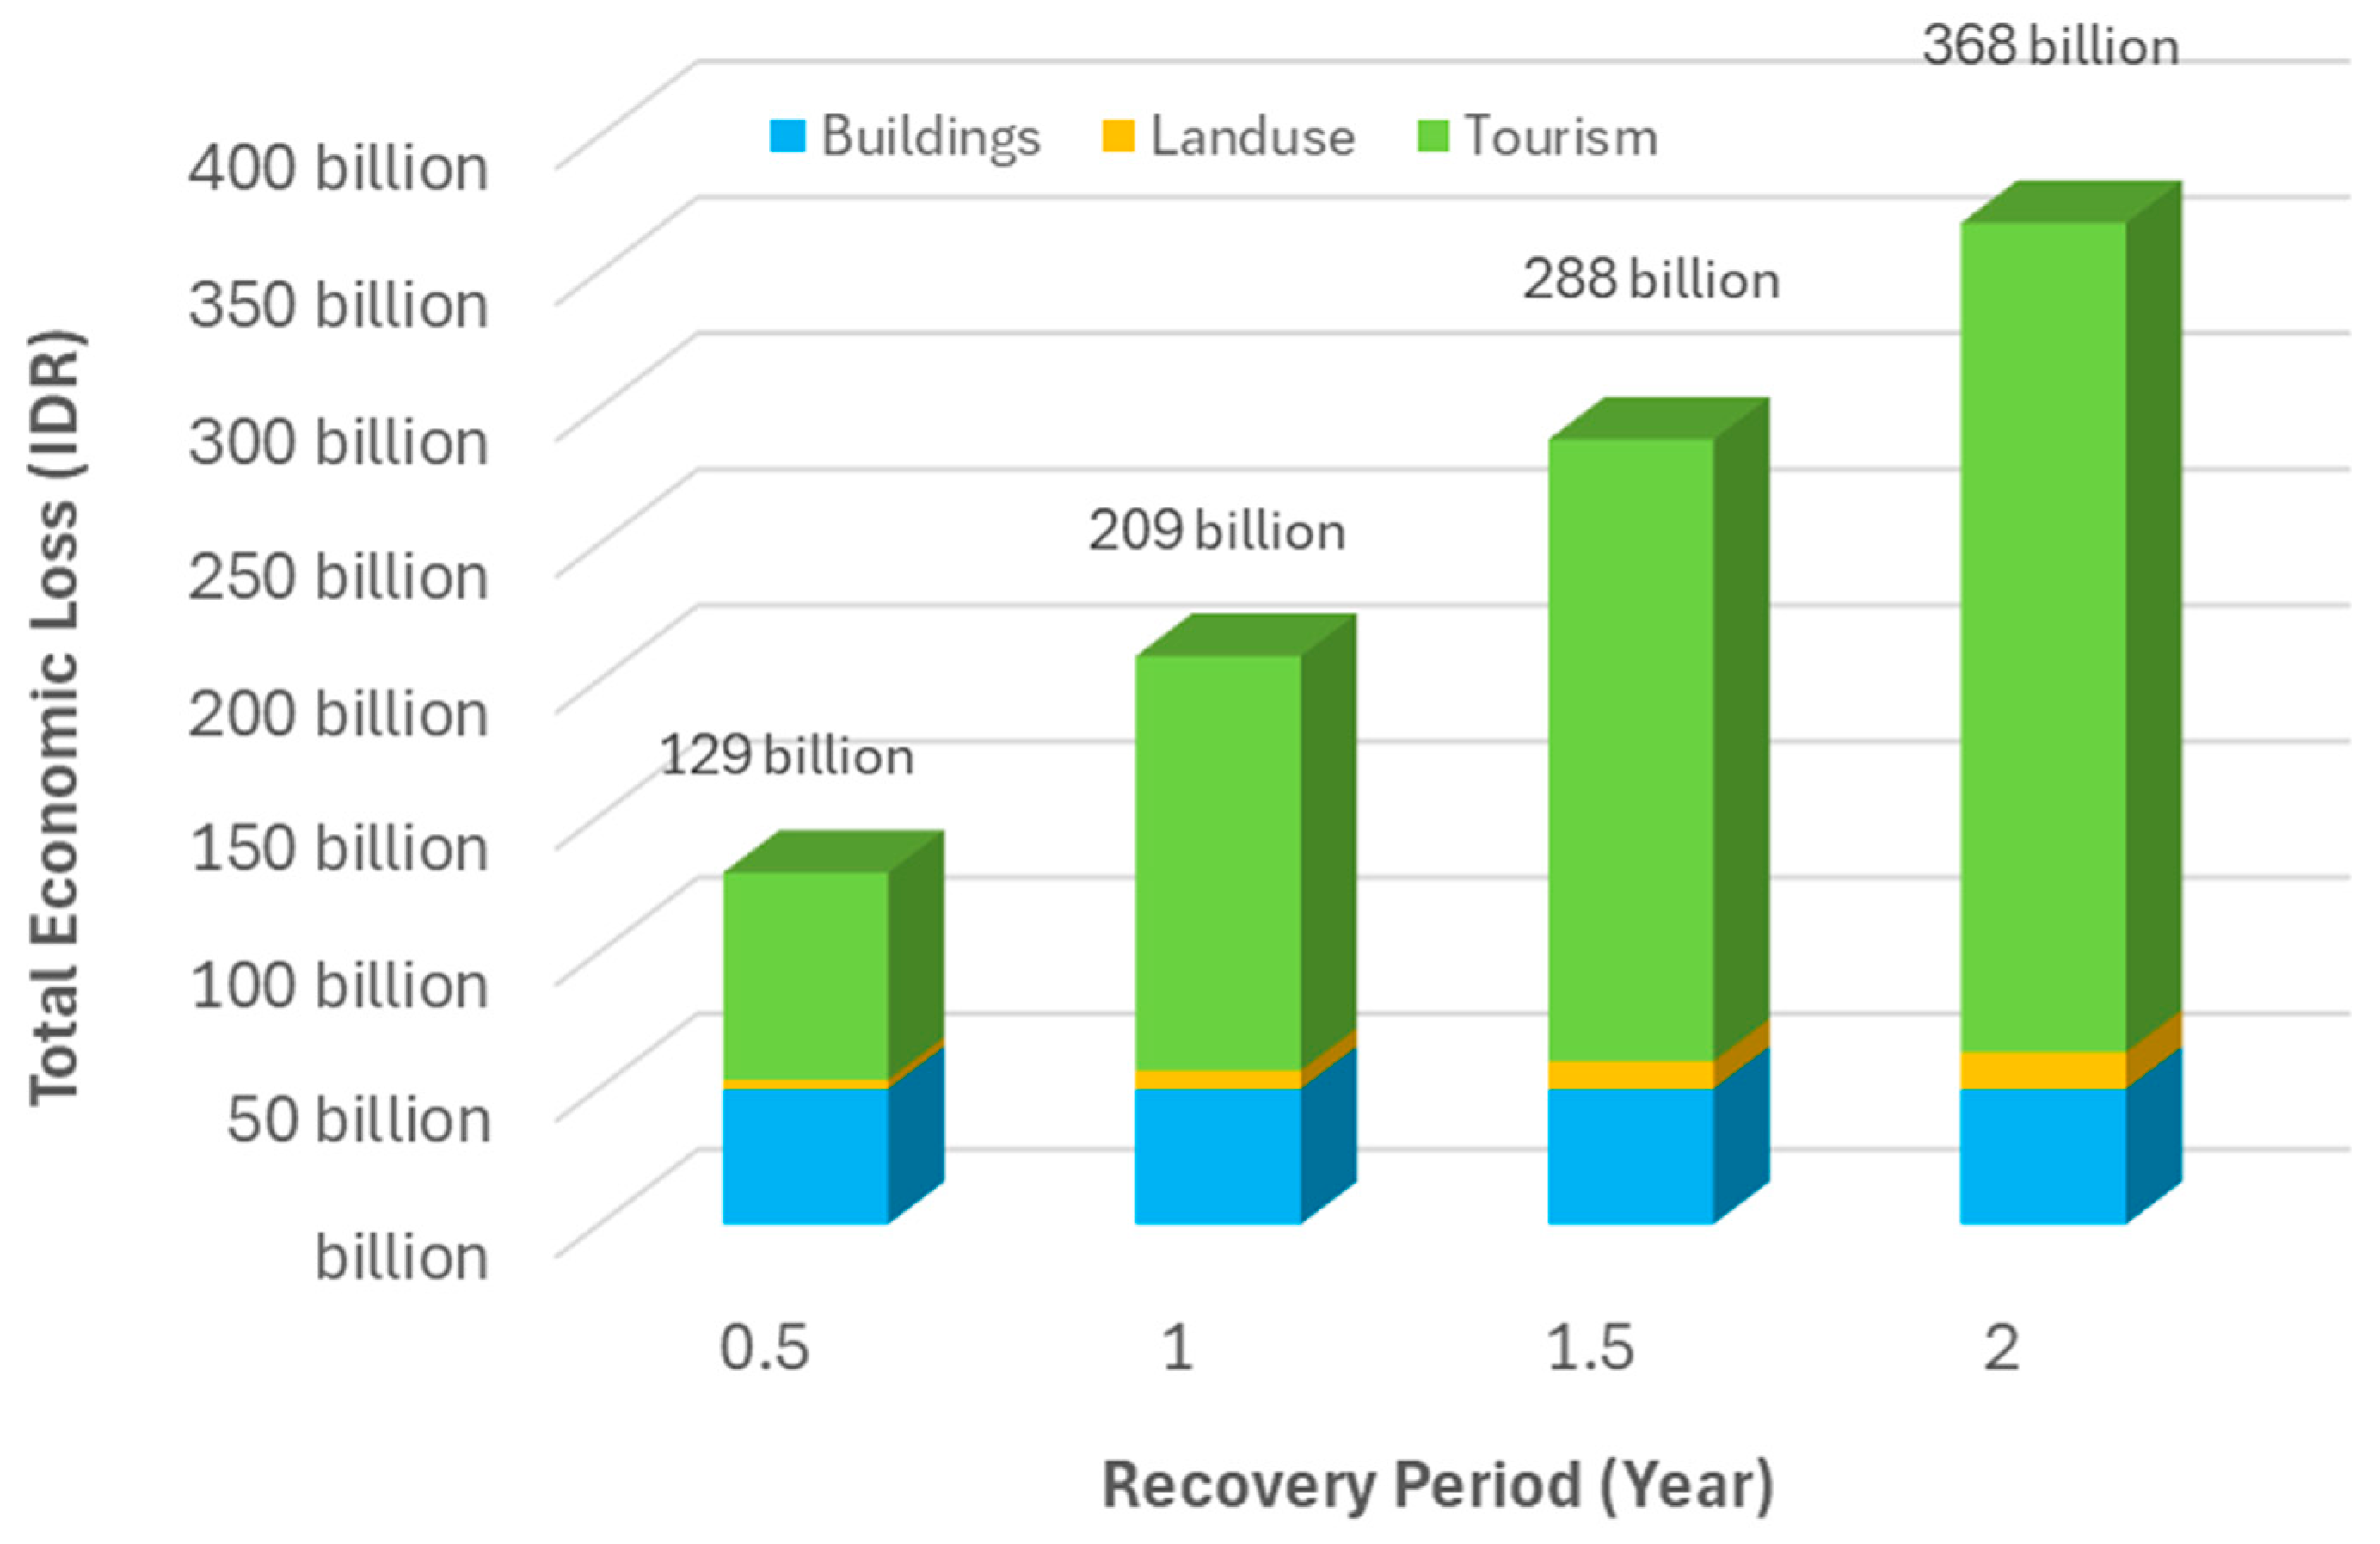
It was stated before that all calculations of estimated economic losses in Equations (1)–(4) are assumed for a one-year recovery period. A calculation using a shorter recovery period would reduce the estimated economic losses, particularly in land use and tourism factors. Different recovery periods are simulated, and the results are presented in
Figure 11. It compares estimated economic losses using various recovery periods (0.5, 1, 1.5, and 2 years) from all three sectors. From the simulation, a half-year difference in the recovery period will give a difference of IDR 80 billion in the total economic loss. By reducing the recovery period to 6 months, savings of IDR 80 billion can be used to compensate and rebuild the damage in buildings and productive lands as well as to reactivate the tourism and public facilities and infrastructure.
The other strategy to reduce economic loss is to apply spatial planning to limit development near the coastline, as has been performed in several areas in Indonesia that were affected by the tsunami, like Aceh and Palu. On the other hand, relocating some buildings and productive lands from the inundation area to the safe area can reduce population density in vulnerable areas. Improvement incentives and financial mechanisms, such as insurance planning for buildings in vulnerable areas and subsidies for tsunami-resistant buildings, are also essential to apply. However, these strategies are more challenging, and may produce more problems. To avoid more problems, several factors should be considered when a spatial planning strategy is applied, including the implementation of multi-faceted approaches, strengthening institutional frameworks, improving data collection and sharing, enhancing community engagement, and securing adequate funding [
39]. Some other recommendations on a broader scale are found in [
40,
41], related to reducing economic losses by way of enhancement of early warning systems, investing in research and development, regional cooperation and information sharing, adapting infrastructure and urban planning, technological upgrades for disaster monitoring, and improving urban infrastructure, along with other methods. These strategies can be implemented either at the local or national level.
5. Conclusions
An estimation of the potential economic loss following a tsunami disaster in a tourism area on the southern coast of Java Island was successfully carried out. The estimation is based on geospatial data derived from a UAV photogrammetry survey and a tsunami run-up model. An LoD-2 3D model, Digital Elevation Model, and land use/land Cover Map of Batukaras Village were derived from UAV aerial photos and later used in the tsunami wave run-up model. The economic loss is calculated from the following three factors: (1) buildings, estimated from the damage ratio and the value of the buildings; (2) land use/land cover, estimated from the loss of crop products for a period of one year; and (3) tourism, estimated from the loss of visitors who do tourism activities (surfing, eating, buying souvenirs), buy entrance tickets, and stay in hotels, also for a period of one year. One year is assumed as the recovery period for crop products and tourism activities following the tsunami event. The total potential economic loss from the tsunami disaster is IDR 208.79 billion, 73% of which comes from tourism factors. One of the efforts to reduce this economic loss is to accelerate the recovery period so that economic activities can be carried out immediately after a tsunami disaster, including in the tourism sector. A 6-month recovery period reduction could save about IDR 80 billion in economic loss, and the savings can be used to compensate and repair the damage in buildings and productive lands as well as to reactivate tourism and public facilities and infrastructure. Another option is to implement a spatial planning strategy (e.g., reduction in development near the coastline, relocation of buildings and productive lands, use of building insurance, and offerings of subsidies to tsunami resistant buildings), which is more complex to apply since it should consider a multi-faceted approach, strengthening institutional frameworks, improving data collection and sharing, enhancing community engagement, and securing adequate funding.


 ,
, 


