Article

Geoinformatics-Based Mapping of Environmental Sensitive Areas for Desertification over Satara and Sangli Districts of Maharashtra, India

1
Department of Geoinformatics, School of Natural Resource Management, Central University of Jharkhand, Ranchi 835222, India
2
Department of Ecology and Natural Resources Management, Center for Development Research (ZEF), University of Bonn, 53113 Bonn, Germany
3
Global Mountain Safeguard Research (GLOMOS), United Nations University—Institute for Environment and Human Security (UNU-EHS), UN Campus, Platz der Vereinten Nationen 1, 53113 Bonn, Germany
*
Author to whom correspondence should be addressed.
GeoHazards 2024, 5(2), 415-440; https://doi.org/10.3390/geohazards5020022
Submission received: 4 March 2024 / Revised: 30 April 2024 / Accepted: 14 May 2024 / Published: 17 May 2024

Abstract

:
Desertification processes in arid, semi-arid, and dry sub-humid conditions have been enhanced in recent decades. The geospatial database and associated satellite data can be effectively employed for regional planning to address desertification and land degradation. In this study, the Mediterranean Desertification and Land Use (MEDALUS) model has been used to map environmentally sensitive areas due to desertification in the Satara and Sangli districts of Maharashtra, India. This was achieved by combining Landsat-8 multispectral data, Census data, soil data, and climatic variables like temperature, rainfall, and evapotranspiration. The algorithm of MEDALUS is the geometric mean of four indicators, namely soil quality index (SQI), climate quality index (CQI), vegetation quality index (VQI), and socio-economic quality index (SEQI). The findings indicated that the majority of the study area comes under the potential category of desertification (60.32%) followed by fragile (27.87%) and critical (11.81%). Areas with a high propensity for desertification were found over the low to very low climatic quality and moderate to high soil quality including lower socio-economic quality. The lower socio-economic quality is mainly due to high to very high population density (>100 people/km2), low to moderate illiteracy rate (<16%), and low to moderate work participation rate (<50%) that incentivize unsustainable land use practices. The study provides a valuable tool for understanding and managing natural resources. It offers a detailed analysis of the environmental sensitivity of the study area, taking into account various factors like land use, vegetation cover, slope, and soil erosion potential. The developed comprehensive map of the area helps in identifying the most sensitive regions and developing appropriate conservation strategies. The information obtained from the study can be utilized to develop and implement successful measures to prevent or alleviate desertification, which is crucial for sustaining the health of ecosystems and the welfare of local residents.

1. Introduction

The United Nations Convention to Combat Desertification (UNCCD) has defined desertification as the degradation of land in arid, semi-arid, and dry sub-humid areas due to various factors such as climatic variations and human activities (e.g., clearing vegetation from the land’s surface, deforestation, and unrestrained animal grazing). Desertification is a significant global, ecological, and environmental problem with far-reaching consequences on socio-economic and political conditions [1]. It affects different regions with varying characteristics in terms of geography, economy, and social and environmental conditions. In a study conducted by Hai et al. [2], it was found that several human activities contribute to desertification, including high population and poverty, inappropriate cultivation techniques, deforestation, inadequate legal frameworks, weak management capacity, lack of adequate knowledge, and lack of awareness among the local population. The unsustainable use of land can result in soil degradation, which is commonly referred to as desertification [3,4,5]. In pursuit of higher productivity, exploitation has increased, and humans have disturbed less productive and more delicate lands [6]. This overexploitation leads to the degradation of vegetation, soil, and water. Desertification is a self-perpetuating process that worsens over time, and as it progresses, the costs of rehabilitation increase exponentially [7]. Desertification is a major global concern, according to the United Nations Environment Programme (UNEP). It has already harmed 36 million square kilometers of land and affects the lives of 250 million people. If left unchecked, it could displace 135 million people by the year 2045, making it one of the most serious environmental issues facing humanity today [8]. Nearly 30% of areas in India experienced desertification, according to the State of India’s Environment report for 2019 [9]. Nearly 40 to 70% of the land in eight states (Rajasthan, Delhi, Goa, Maharashtra, Jharkhand, Nagaland, Tripura, and Himachal Pradesh) has become desertified. Furthermore, desertification has increased in 26 of 29 Indian states between 2003 and 2005 and 2011 and 2013 [9]. As per the ISRO’s report “Desertification and Land Degradation Atlas of India” [10], the area of the country under land degradation is reported to be 96.40 mha, or 29.32% of the total geographic area (TGA) of the country, between 2011 and 2013, compared to 94.53 mha, or 28.76% of the TGA, between 2003 and 2005. In 2018–2019, desertification has been increased to 97.85 mha (or 29.77%) [11]. In total, 1.87 mha of the country’s TGA (or 0.57% of it) have experienced desertification or other forms of land degradation between the years 2003 and 2005 and 2011 and 2013. In arid regions, wind erosion is seen to be the major mechanism of desertification, while water erosion and vegetation degradation are more prevalent in semi-arid and dry sub-humid areas [12].
The alarming escalation of desertification poses a significant threat to agricultural productivity, exacerbating land degradation and contributing to climate change [13,14]. This degradation not only undermines water supply, soil health, and environmental integrity [15] but also diminishes both the quantity and quality of surface and groundwater resources [16]. Soil erosion, a consequence of this degradation, leads to substantial losses in vegetation productivity. Moreover, desertification reduces the capacity of soil to absorb water, resulting in heightened surface runoff and elevated flood discharges [17]. Consequently, flooding becomes more frequent and severe due to increased runoff. Due to a variety of natural or anthropogenic factors, including deforestation, overgrazing, and climate change, rich land can become deserts through the process of desertification [18]. This process causes the soil to deteriorate, the vegetation cover to decline, and the soil’s ability to retain water to decline. As a result, the soil dries out and loses its capacity to absorb and hold water. On such degraded ground, when it rains heavily, the water cannot penetrate the hard, compact surface of the soil; instead, it runs off, producing erosion and removing the topsoil, which is the most fertile part of the soil [16]. Gullies and dry riverbeds are created as a result, and they can easily overflow with a strong downpour. The amount of water that is naturally absorbed by the ground is also decreased in a desertified area since there are fewer plants to absorb water from the soil. As a result, there is a higher chance of flash flooding since the water has nowhere to go and can quickly build up, causing a surge of water downstream [19]. As the land’s capacity to absorb and retain water decreases due to desertification, more surface runoff and erosion occur. The risk of flash floods is heightened due to this and the absence of vegetative cover [20]. Food security is put at risk because land degradation reduces and endangers food production. Land degradation puts future nutrition at risk by reducing agricultural productivity and activities [21]. Apart from that, if the socio-economic sector is seen, then a great impact on health, the problem of migration, etc., can be noticed.
Desertification arises from a confluence of climatic and anthropogenic influences. Declining precipitation patterns coupled with unsustainable land use practices, such as excessive groundwater extraction and deforestation, significantly accelerate desertification processes [10]. The UNCCD leads global efforts to combat desertification and promote sustainable land management through international collaboration and knowledge sharing. Many techniques are used on global to national levels to deal with desertification. Conventional methods such as statistical studies and modeling strategies are frequently used to manage and prevent desertification [22]. The risk of desertification can be calculated using models like the Universal Soil Loss Equation (USLE) and the Revised Universal Soil Loss Equation (RUSLE), which are used to calculate soil erosion rates [23]. The Century model and the GLOBIOM model are used to simulate vegetation dynamics and to forecast land use changes that may affect desertification [24]. The MEDALUS (Mediterranean Desertification and Land Use) model has gained widespread recognition across various Mediterranean regions, being implemented at national, regional, and local levels. In a notable application, it was utilized within an entire Greek state to evaluate the susceptibility to desertification, employing the four indicators prescribed in the original MEDALUS [25]. Studies have employed this approach to evaluate the susceptibility to desertification at the regional level in India, with the findings indicating the favorable performance of the technique [26,27]. Researchers have used several indices such as soil quality index (SQI), climate quality index (CQI), vegetation quality index (VQI), and socio-economic quality index (SEQI) for predicting desertification zones by integrating several influencing factors [28,29,30].
About half of the area of Satara and Sangli districts of Maharashtra in India is at risk of desertification due to vegetation degradation, water erosion, increasing salinity, and anthropogenic activities in their physiographic divisions [10,31,32]. It is expected to worsen with the changing climate. The methodology adopted by [10,11,12] for identifying desertification is mainly based on the visual interpretation of satellite images of IRS-based sensors such as Linear Imaging and Self Scanning Sensor (LISS-III) and Advanced Wide Field Sensor (AWiFS). Therefore, a comprehensive study using a better methodology is selected for conducting desertification analysis over two districts. Notably, this study aims to identify environmentally sensitive areas to desertification in these districts, which would be helpful in targeted conservation efforts, developing early warning systems and climate change adaptations. The objective of the study is to discuss how remote sensing and Geographic Information Systems (GIS) technology can be used to gather spatial and temporal information about environmental factors influencing desertification. It also employs the concept of four indices—SQI, CQI, VQI, and SEQI—and how they can contribute to identifying environmentally sensitive areas in the two districts for desertification. The MEDALUS modeling technique is also integrated to anticipate vulnerable areas and implement appropriate mitigation strategies to conserve the land from drought and desertification, creating a more eco-friendly environment.
The structure of the paper comprises several sections. Section 2 describes the study area, data used, and method applied. Section 3 describes results on SQI, CQI, VQI, and SEQI followed by discussion in Section 4 and conclusions in Section 5.

2. Materials and Methods

2.1. Study Area

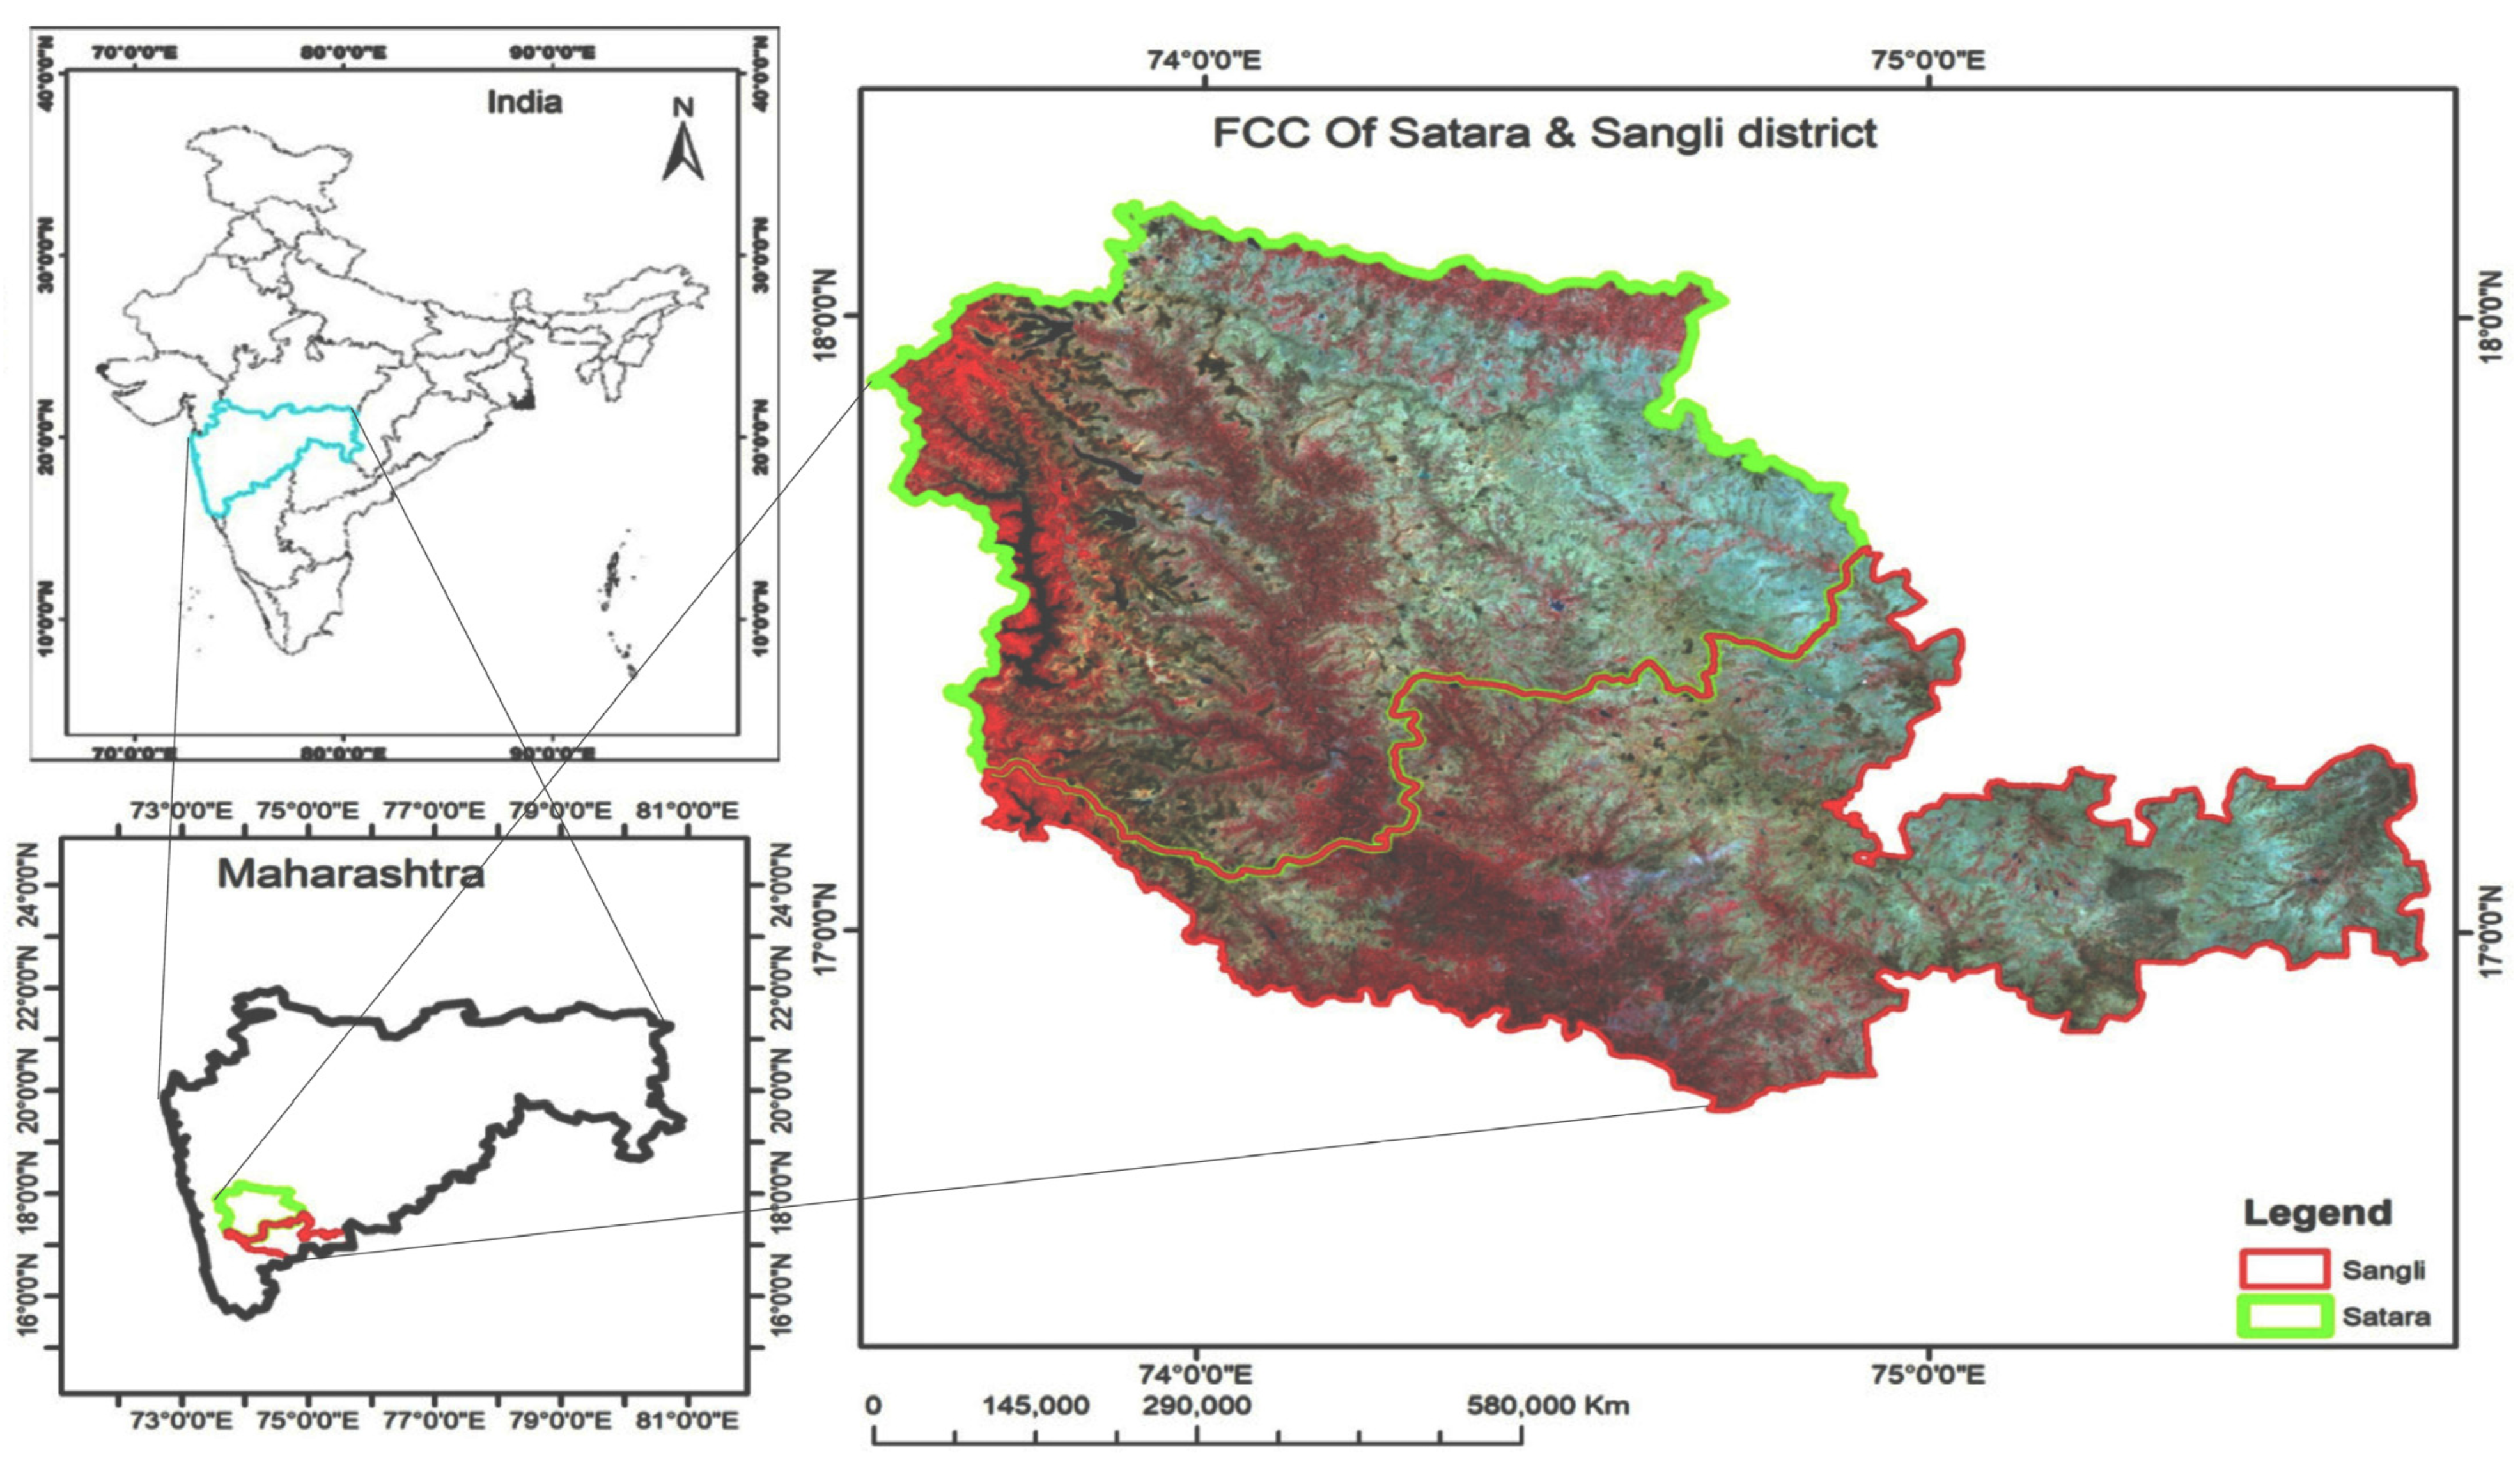
The study area Satara and Sangli districts of Maharashtra is located in the southwestern part of India (Figure 1). The Sangli district lies between 16°45′ to 17°33′ N latitudes and 73°42′ to 75°40′ E longitudes with a geographical area of 8572 km2 with an altitude between 600 to 900 m. Satara district is situated in the Bhima and Krishna basin and lies between 17° to 18° 11′ N latitudes and 73° 33′ to 74° 54′ E longitudes and covers an area of 10,484.89 km2 with an altitude of 900 to 1200 m. The area of the Sangli district is composed of hill ranges and plains. Maharashtra is the state with the second highest area under desertification/land degradation, i.e., 44.93% for the period 2011–2013 [8]. The desertification/land degradation area in Maharashtra has increased by about 1.55% since 2003–2005. Eastern and Central Maharashtra State is a severely drought-prone area [33].
The climate in Sangli district is generally hot and dry, but it is cooler in the hilly regions. The annual maximum temperature in Sangli is 42 °C and the minimum temperature is 10.3 °C. In April, the temperature can reach up to 42 °C whereas in July, it drops down to 31 °C. Similarly, the minimum temperature can range from 10.3 °C in December to 21.5 °C in April. On average, the district receives a rainfall of 543–620 mm per year and features monsoon climate. The climate of the Satara district plays an important role and influences the settlement of consumption patterns and agriculture. The average annual temperature varies from 34 °C to 36 °C during the summer season. The months of December and January are slightly severe and quite fair, and the temperature varies from 10 °C to 12 °C. The months of December and January recorded the coldest months of the year. Fog is a common climate phenomenon of this winter season that occurs early in the morning. The average rainfall in the Satara district is 600 mm.

2.2. Data Used

Various optical satellite data, soil, and climate data used in this study for the assessment of environmentally sensitive areas for desertification are mentioned in Table 1. Landsat-8 OLI data (30 m) acquired from USGS, https://earthexplorer.usgs.gov (accessed on 4 April 2019), is used for preparing land use land cover (LULC) map during 2019. Normalized difference vegetation index (NDVI) derived from OLI data is further used to evaluate vegetation cover percentage. SRTM Dem with 90 m resolution is used for extracting the slope gradient. Climatic variables such as rainfall (mm), potential evapotranspiration (PET in mm), wind speed at 10 m height (m/s) from March to July, and air temperature (°C) are downloaded for the year 2019. The data from Giovanni, https://giovanni.gsfc.nasa.gov/giovanni (accessed on 3 March 2020), comprises TRMM-based gridded rainfall product (3B42, version 7 at 0.25 × 0.25°), which were further used for deriving the CQI. The monthly PET data were downloaded from the Climatic Research Unit (CRU) with a spatial resolution of 0.5 × 0.5°. The air temperature (°C) and wind speed (m/s) (March to July) point-based data are downloaded from World Weather for Water Data Service (W3S), https://www.uoguelph.ca/watershed/w3s (accessed on 10 March 2020). Average annual rainfall (mm) and PET (mm) are used to derive rainfall erosivity and aridity index (AI).
Soil maps (1:250 K) prepared by the National Bureau of Soil Survey and Land Use Planning (NBSS and LUP) and the Joint Research Centre European Soil Data Centre (ESDAC) are utilized to deduce SQI. Soil texture, soil depth, soil drainage, and degree of soil erosion maps were prepared with the help of data available from ESDAC. Soil parent material and soil salinity maps are prepared with the help of data available from NBSS and LUP. Census data comprising population, block-wise growth rate, illiteracy rate, and work participation are used to derive SEQI (Census, 2011). The point-based and Census-based data are converted to raster format using the Inverse Distance Weighted (IDW) interpolation technique. All these spatial maps are prepared using the Inverse Distance Weighted (IDW) interpolation technique with a spatial resolution of 0.05°. IDW is used because it performs well in situations where the spatial distribution of sample points adequately represents the underlying spatial trend of the variable being interpolated. The course resolution gridded data were resampled to 0.05° using the nearest neighbor resampling method. Most of the processing is performed using ArcGIS 10.7 software.

2.3. Method Applied

Desertification presents a multifaceted challenge resulting in diminished spatio-temporal land productivity [13,15,16,17,18,19,20,21]. This intricate phenomenon is intricately linked to various environmental factors such as climate, soil, vegetation, and land morphology, as well as human activities including socio-economic practices and behavioral patterns [10]. The MEDALUS model utilizes key indicators to determine environmentally sensitive areas for desertification (ESAs) [28]. These ESAs are identified based on a composite evaluation of both physical and anthropogenic factors. Physical attributes encompass soil characteristics, climate conditions, and vegetation qualities, while the socio-economic quality index (SEQI) reflects human-induced pressures on the environment concerning desertification processes. To facilitate analysis, a geodatabase and thematic maps of 19 key indicators of desertification are generated, ensuring uniformity in the projection system and spatial resolution.
Indicators are categorized into four quality indices: soil quality index (SQI), climate quality index (CQI), vegetation quality index (VQI), and SEQI. Each index is computed using sub-indicators, which are further classified and assigned weight values. Based on a detailed literature review, each factor of desertification has been assigned a weight ranging from 1.0 (indicating low sensitivity) to 2.0 (indicating high sensitivity) for each class [34,35,36]. The final environmentally sensitive areas index (ESAI) map is generated through geometric mean calculations within a GIS. Spatial layers are standardized to a 30 m resolution using the nearest neighborhood method and projected to a UTM zone 30 projection system.
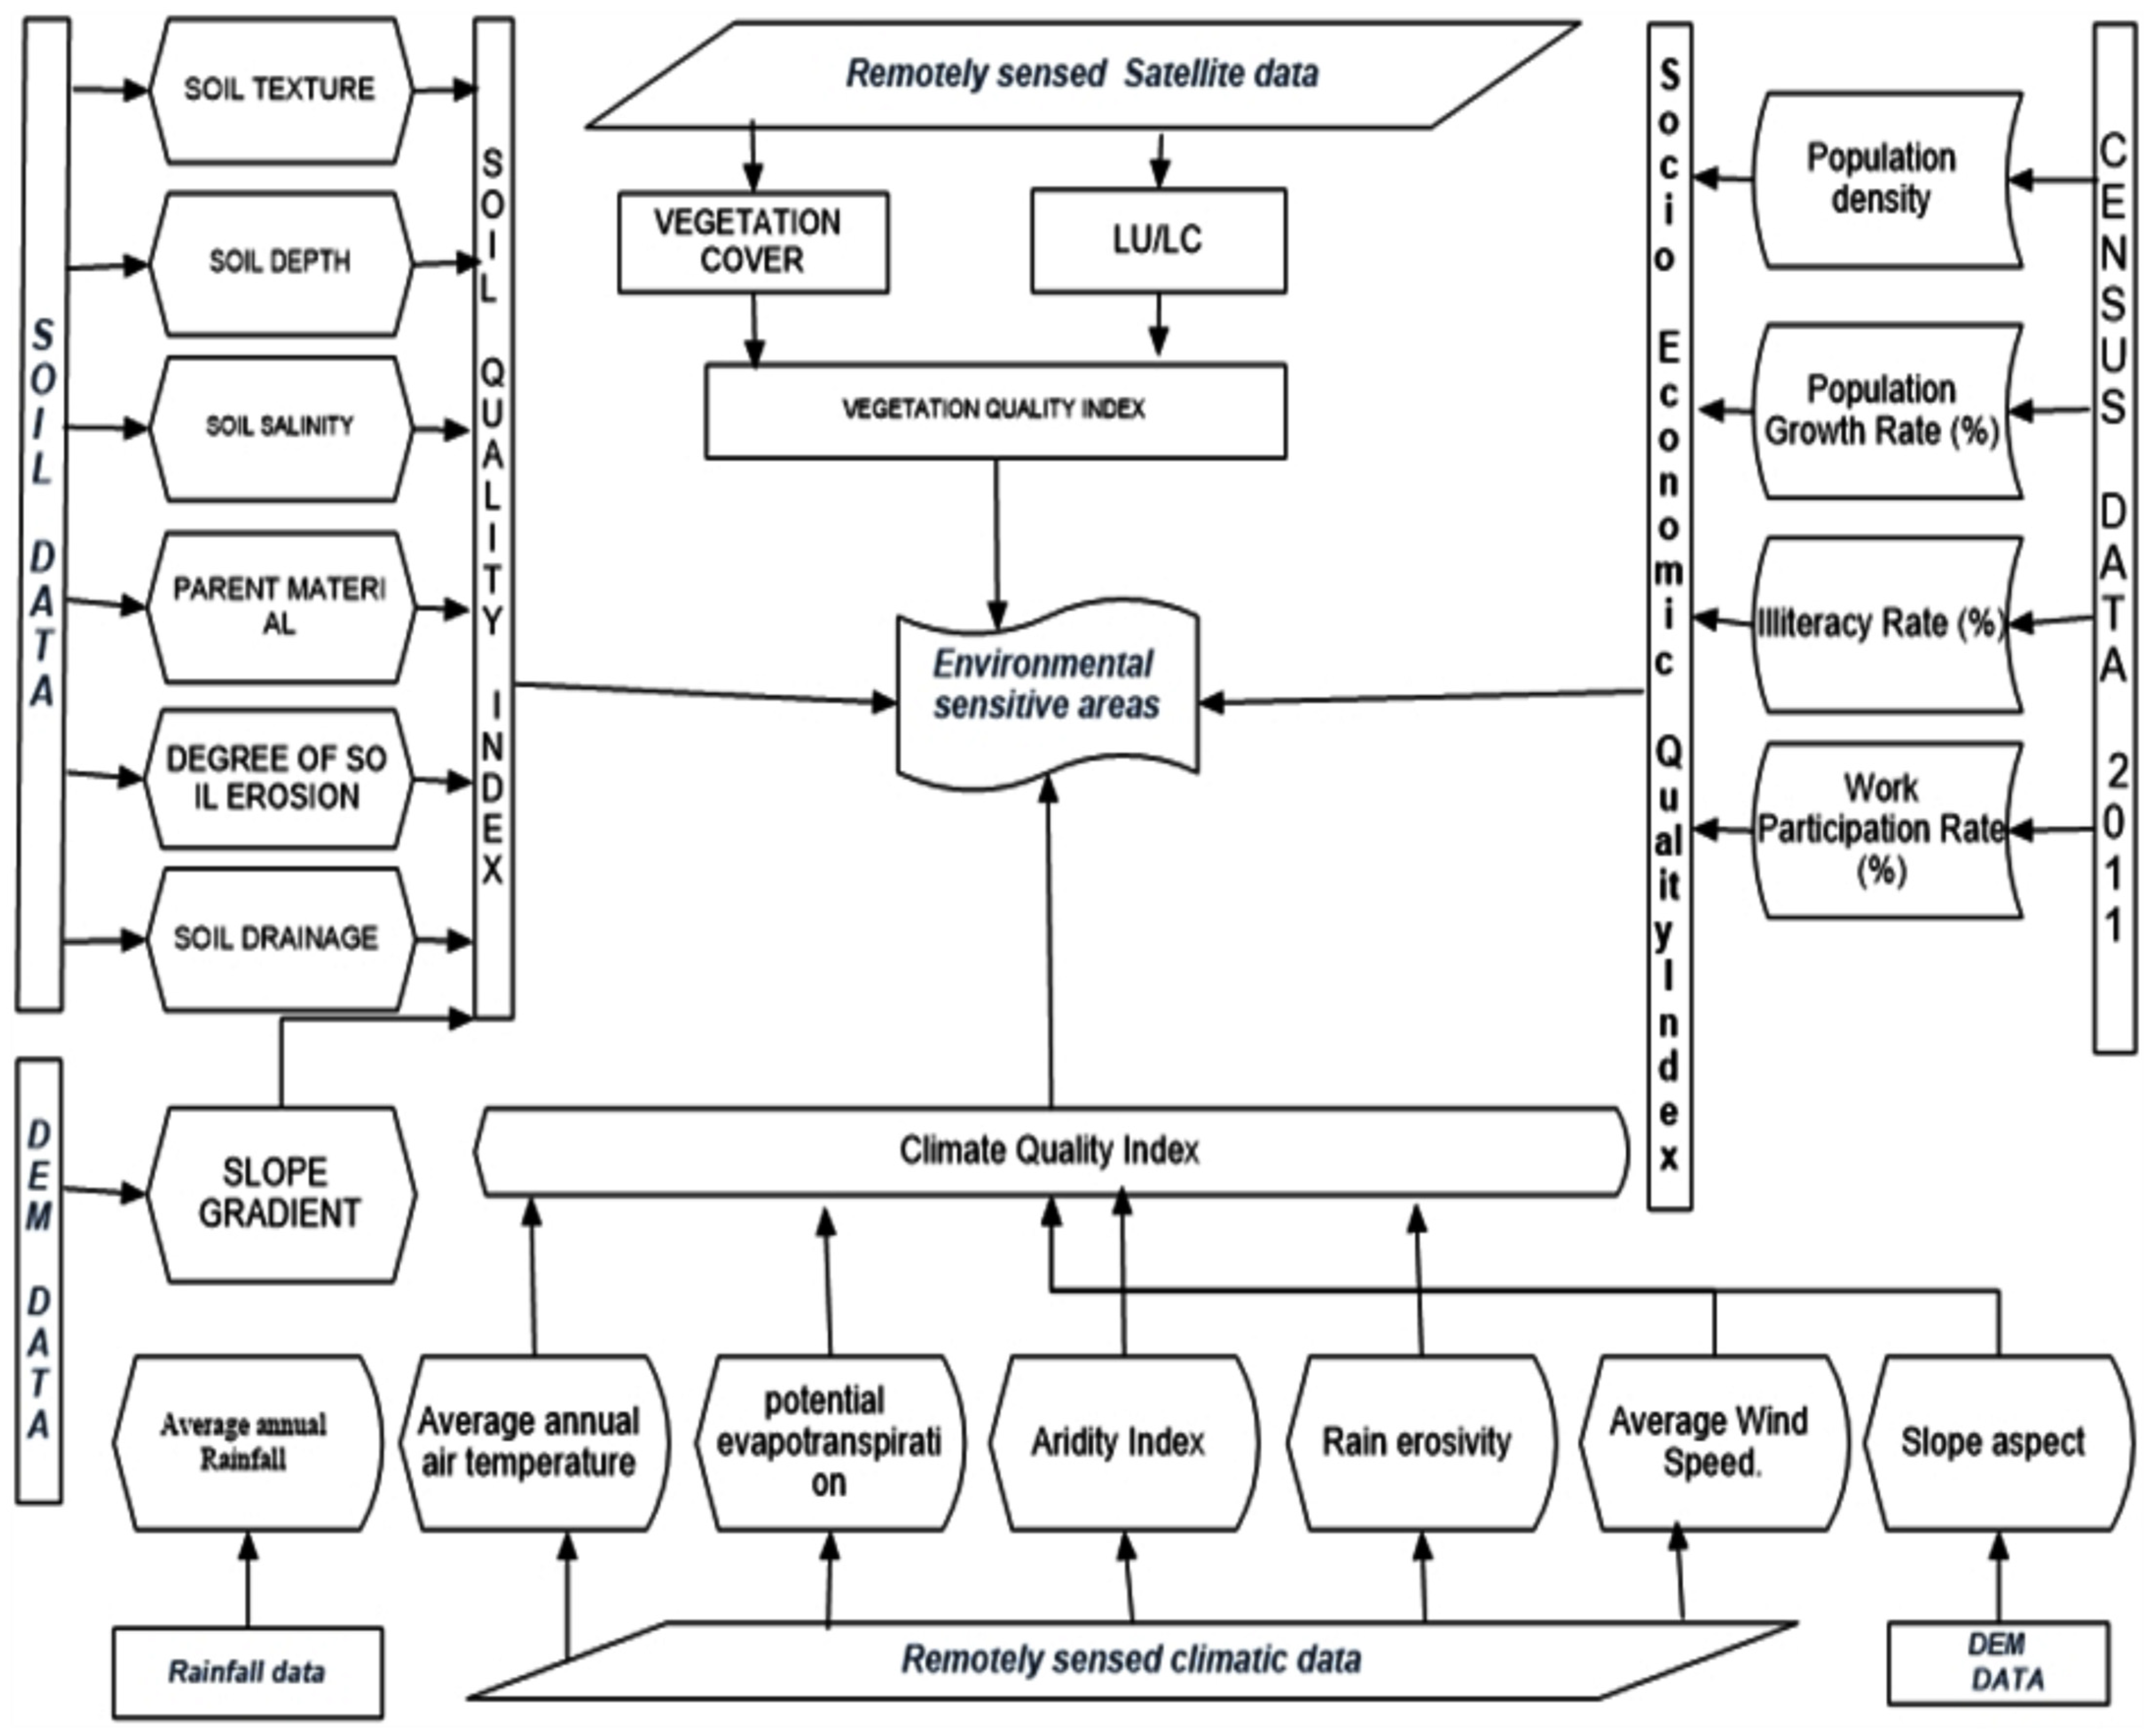
The methodology for assessing environmentally sensitive areas for desertification is outlined in Figure 2 in the form of a flowchart and explained in Section 2.3.1, Section 2.3.2, Section 2.3.3, Section 2.3.4 and Section 2.3.5.

2.3.1. Soil Quality Index (SQI)

Soil plays a crucial role in evaluating desertification, with its quality influenced by factors such as lithological composition, depth, slope, organic content, degree of erosion, salinity, and texture [37]. Gathering and reproducing soil-related maps and data is a vital step in this assessment process. The SQI was deliberated by the geometric mean of the indicators associated with each index. It is a benchmark used to evaluate quality; their classes and their assigned weightage are described in Supplementary Table S1. Soil texture map, soil depth map, soil drainage map, and degree of soil erosion maps were prepared with the help of data available from ESDAC. Soil parent material and soil salinity maps are (1:250 k) prepared by NBSS and LUP which are further utilized to deduce SQI. The slope gradient was estimated using SRTM DEM using the surface tool in ArcGIS. The SQI was calculated using Equation (1).
S Q I = ( S T × S D × S S × P M × S E × S D r ) 1 4
where ST is soil texture, SD is soil depth, SS is soil salinity, PM is parent material, SE is degree of soil erosion, and SDr is soil drainage.

2.3.2. Vegetation Quality Index (VQI)

Assessing desertification in arid and semi-arid regions hinges significantly on vegetation coverage. Vegetation not only mitigates sand dune encroachment and soil erosion but also fosters a microclimate beneficial to local communities and their livestock [38]. Consequently, vegetation enhances organic soil content and significantly diminishes soil erosion intensity, thereby bolstering soil cohesion and quality [37]. It is a benchmark index used to evaluate vegetation quality and their classes and their assigned weightage, which are described in Supplementary Table S2. VQI considers the normalized difference vegetation index (NDVI) and LULC. The NDVI evaluates the vegetation by computing the distinction between near-infrared (NIR) which vegetation strongly reflects and red light (RED) wavelength of light which vegetation absorbs [39]. NDVI always ranges from −1 to +1 and is calculated as:
N D V I = ( N I R R E D ) ( N I R + R E D )
The vegetation cover percentage (%) was evaluated using the minimum and maximum values calculated from the NDVI. Landsat-8 images from April 2019 were used for LULC classification by using Support Vector Machine (SVM). SVM is a discriminative classifier formally defined by a separating hyperplane [40]. SVM is suitable for land cover classification where distinguishing between multiple classes with varying spectral signatures is crucial. In this study, SVM was trained using a subset of labeled data, where representative samples from each land cover class were taken. These samples, along with extracted spectral, textural, and contextual features from the Landsat-8 imagery, were fed into the SVM algorithm for training. The Radial Basis Function (RBF) kernel of SVM was used to classify the image into 7 classes, namely waterbody, forest, settlement, fallow land, barren land, cropland, and scrub. The trained SVM model was then applied to classify the Landsat-8 image into the predefined land cover classes. The VQI was calculated using Equation (2).

2.3.3. Climatic Quality Index (CQI)

Fluctuating climate patterns, recurrent droughts, and extreme weather conditions characterized by low precipitation and high temperatures can render plants and land susceptible to desertification [37]. The CQI serves as the reference point for assessing climatic conditions, with its respective classes and assigned weights detailed in Supplementary Table S3. Climatic quality is determined by various factors including rainfall, potential evapotranspiration (PET), and average wind speed at 10 m. In addition, the aridity index and rainfall erosivity were also considered under CQI.
The aridity index, which is used to describe long-term climatic water deficits is calculated using Equation (3) [41].
A r i d i t y   I n d e x = A v e r a g e   a n n u a l   r a i n f a l l   ( m m ) A v e r a g e   a n n u a l   P E T   ( m m )
Rainfall erosivity (Modified Fournier Index) is an index that describes the ability of rainfall to cause soil erosion [42]. Rainfall erosivity (mm/hr) is calculated using Equation (4).
R a i n f a l l   e r o s i v i t y = i = 1 n P i 2 P
where pi represents mean precipitation of month i (mm) and p represents mean annual precipitation. Finally, the CQI is evaluated using Equation (5).
C Q I = ( A R × A A T × P E T × A I × R E × A W S × A ) 1 7
where AR is average annual rainfall, AAT is average annual air temperature, PET is potential evapotranspiration, AI is aridity index, RE is rain erosivity, AWS is average wind speed and A is slope aspect.

2.3.4. Socio-Economic Quality Index

The parameters used to evaluate socio-economic quality, their classes and their assigned weightage are described in Supplementary Table S4. Block-wise data from the Census of India, https://data.gov.in (accessed on 21 April 2020), for the year 2011 were used to evaluate the socio-economic quality parameters. Block-wise population density (PD), block-wise population growth rate (% per year) (PG), block-wise illiteracy rate (%) (I), block-wise work participation rate (%) (WP) were calculated by dividing the total population of villages for year 2011 by its area. SEQI was calculated using Equation (6).
S E Q I = ( P D × P G × I × W P ) 1 4

2.3.5. Environmental Sensitive Areas (ESAs) to Desertification

The methodology for assessing environmentally sensitive areas is based on the MEDALUS model, developed by the European Commission [43]. Our study has developed 19 indicators of desertification using layers derived from satellite data as well as from other available sources. All four indices, soil quality index (SQI), climate quality index (CQI), vegetation quality index (VQI), and socio-economic quality index (SEQI), were integrated to calculate a single index called environmental sensitive areas to desertification index (ESAI) using Formula (7).
E S A I = [ S Q I × V Q I × C Q I × S E Q I ] 1 4

3. Results

3.1. Determination of Soil Quality Index (SQI)

3.1.1. Soil Texture and Soil Depth

Figure S1 depicts the spatial variation and area percentage of soil texture class in the study area. Both the districts have a higher percentage of clayey soil (59.25%) than loamy soil (40.75%). Loamy soils are a better option for crops due to their better permeability, nutrient quality, and ease of tilling compared to clay soils. These soils drain water appropriately and do not hold it for long, which is essential for crop growth. Additionally, the presence of silt in loamy soils further enhances their nutrient quality. However, in the studied districts, the percentage of loamy soils is relatively low, which can increase the sensitivity of crop production.
Soil depth plays a crucial role in determining the yield of crops, especially when they are grown without irrigation. Deep soils can hold more plant nutrients and water, making them more suitable for plant growth. On the other hand, shallow soils have less mechanical support and are prone to erosion, which can reduce soil productivity. Trees growing in shallow soils are also more susceptible to wind damage. Figure S2 displays a map of soil depth, while Table 2 shows the percentage of the study area that falls under different soil depth categories. In the study area, a large proportion, approximately 20.15% and 26.54%, of the soil is classified as shallow and very shallow, respectively, due to erosion and indicating the reduced soil productivity and higher vulnerability to crop production.

3.1.2. Soil Salinity and Soil Parent Material

The accumulation of salts in the soil is called salinization. There is a negative effect on desertification due to higher soil salinity [44]. The soil salinity map indicates a negligible soil salinity category covering 97.21% of the area and a slight soil salinity category covering 2.79% of the area (Figure S3). Thus, soil salinity has not been an influencing factor for desertification in the study area. The soil formed from parent material that is soft to friable is most susceptible to desertification, whereas parent material that is moderately coherent is moderately susceptible to desertification, while coherent parent material is less susceptible to desertification [43]. Soils weathered from basalt tend to be fine-textured and fertile due to the rapid cooling of lava flows along the surface of the earth [45]. The maximum percentage of area, i.e., 58.52% is under basalt rock parent material, followed by alluvium (32.9%) and granite (8.56%) (Figure S4).

3.1.3. Slope Gradient and Drainage Maps

Slope gradient affects surface water runoff and soil sediment loss. The steep slope enhances the speed of runoff resulting in accelerated erosion due to more transported and dissolved materials. Therefore, higher slope gradients will have a positive effect on desertification [46]. The majority of the area, i.e., 83.5%, belongs to slope gradient 0–5° (Figure 3a and Table S2) and thus indicates less vulnerability to soil erosion. Soil salinization and soil drainage are both related to each other. These both affect the desertification areas. Poorly drained soil is more vulnerable to soil salinization than in well-drained soils [46]. The result of the soil drainage map reveals that the maximum percentage, i.e., 60.21% area (Figure 3b and Table S6) is under the well drainage category.

3.1.4. Degree of Soil Erosion Map

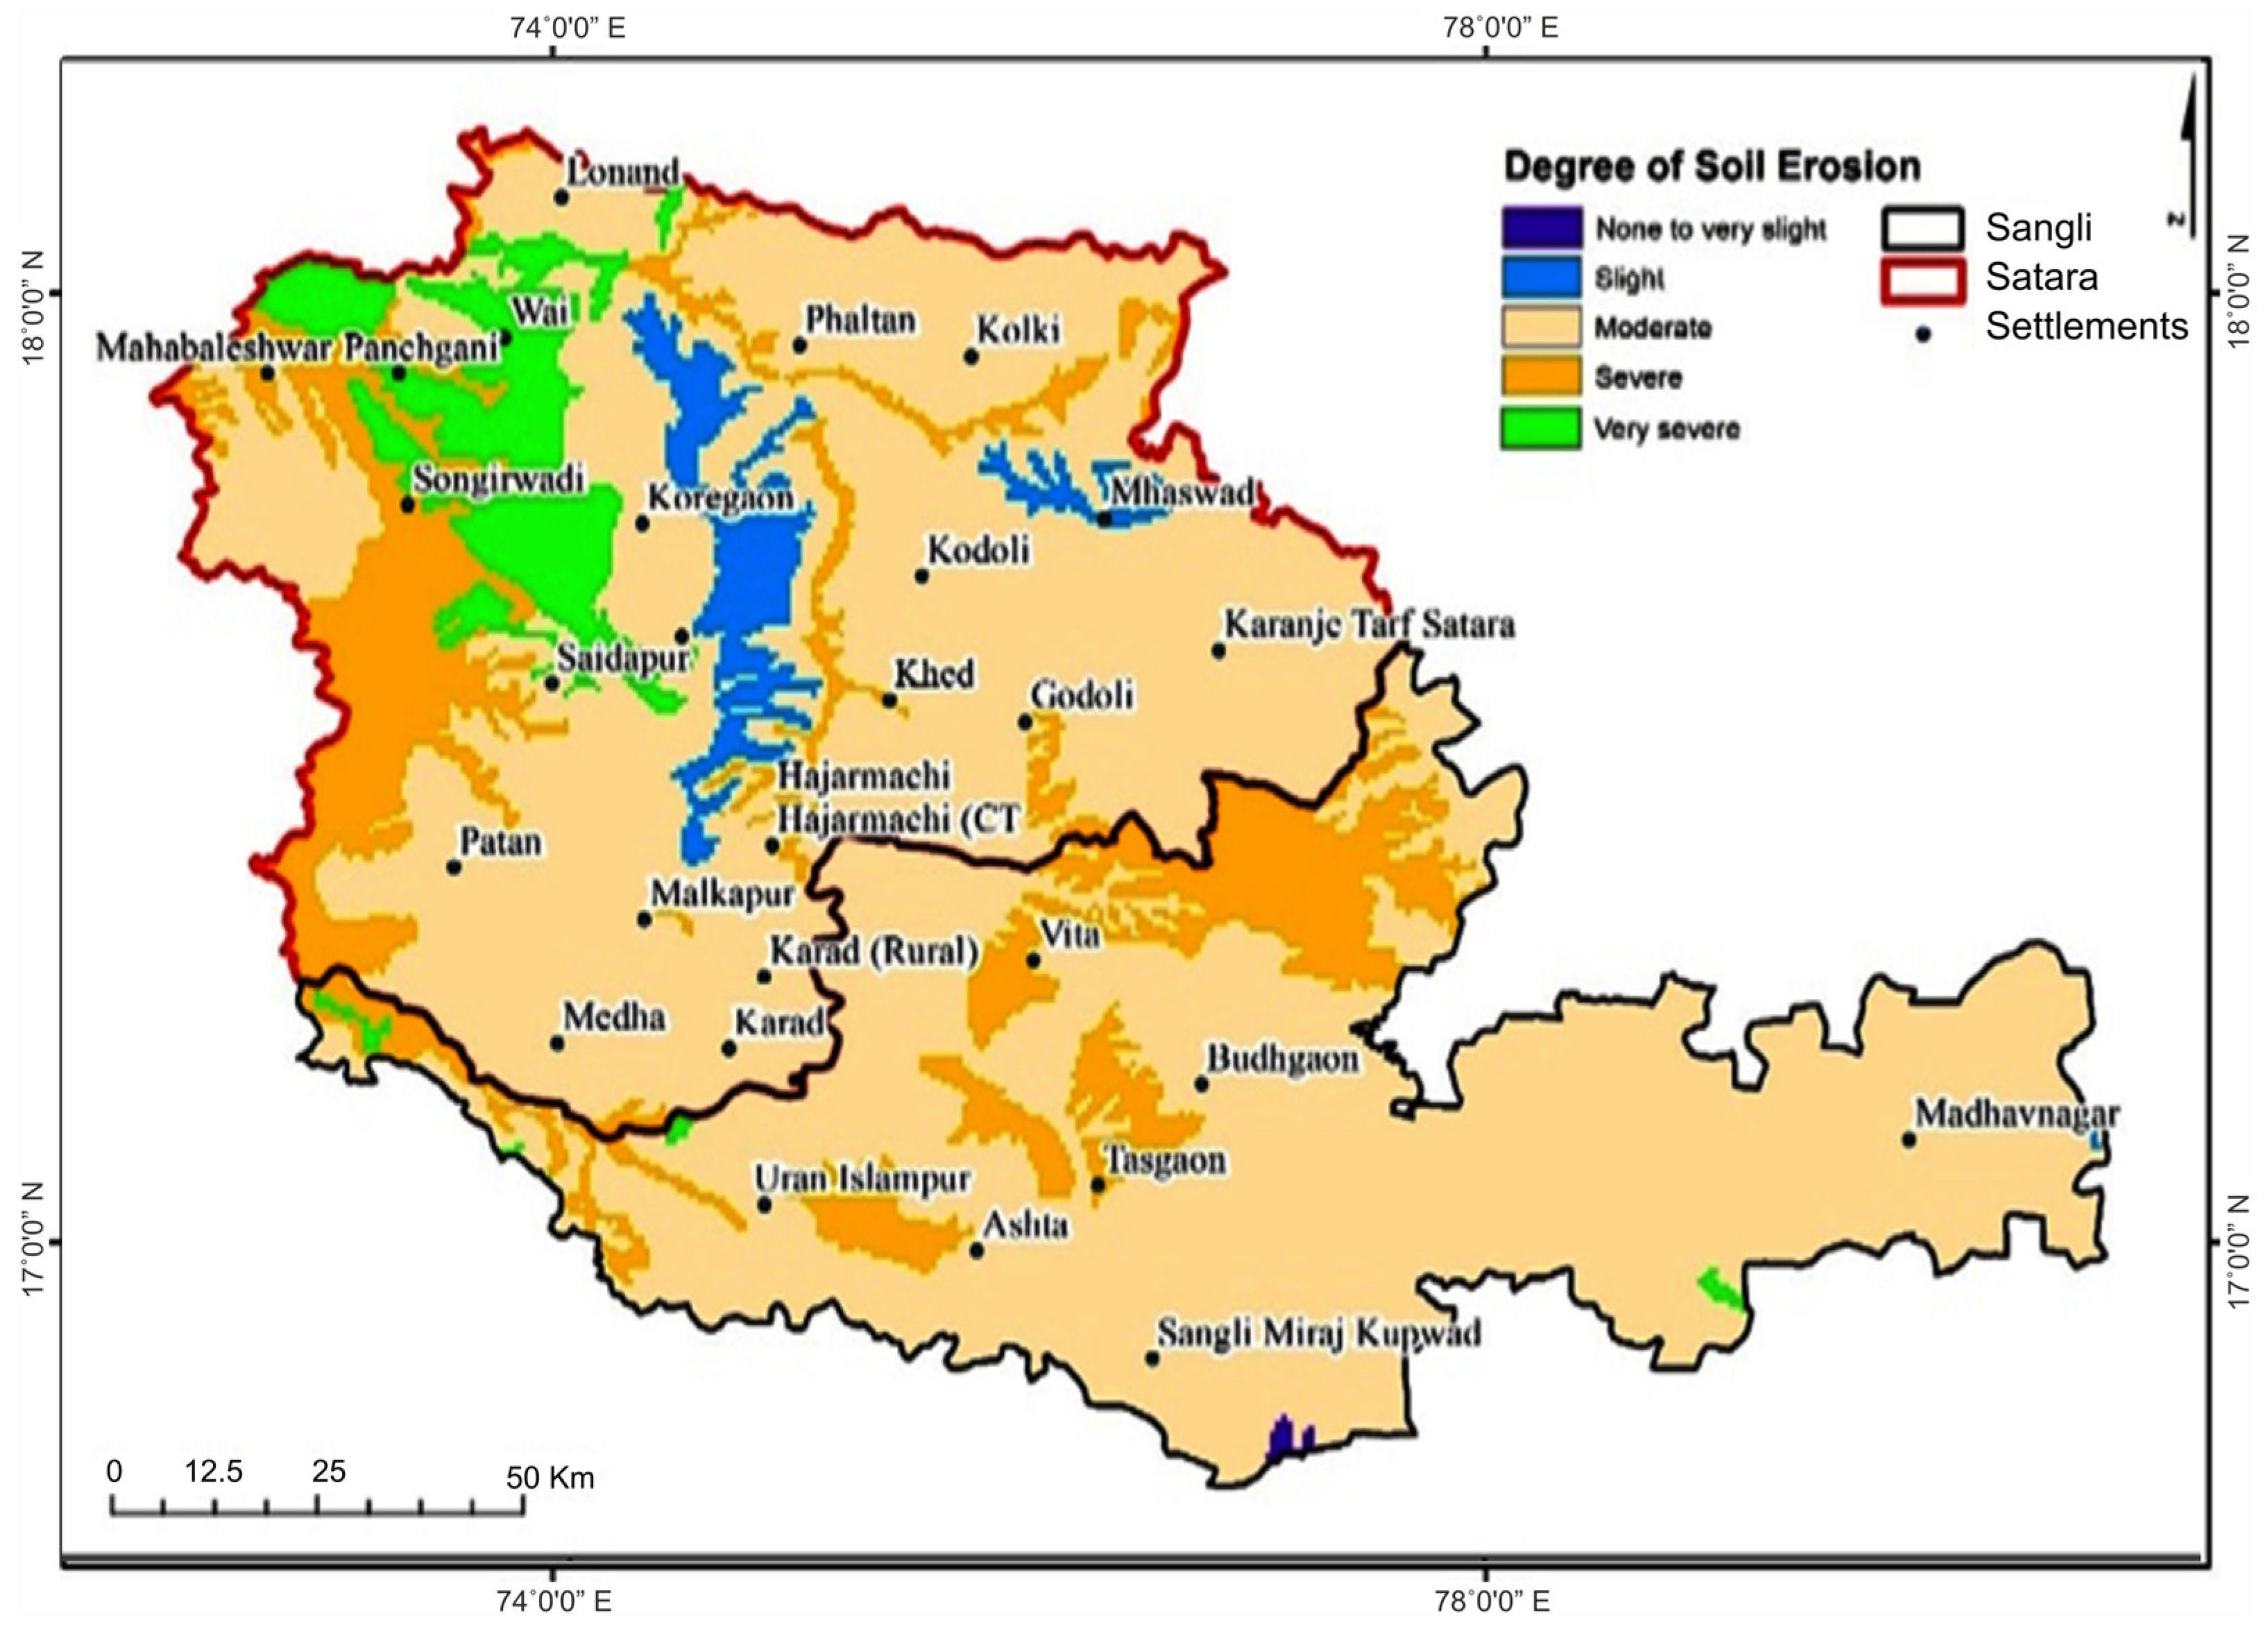
Soil erosion is a major reason for land degradation and desertification. Higher levels of soil erosion increase the risk of land degradation and desertification. In the studied area, the maximum portion comes under a moderate degree of soil erosion category (80.03%) followed by severe category (16.26%) (Figure 4).

3.1.5. Soil Quality Index

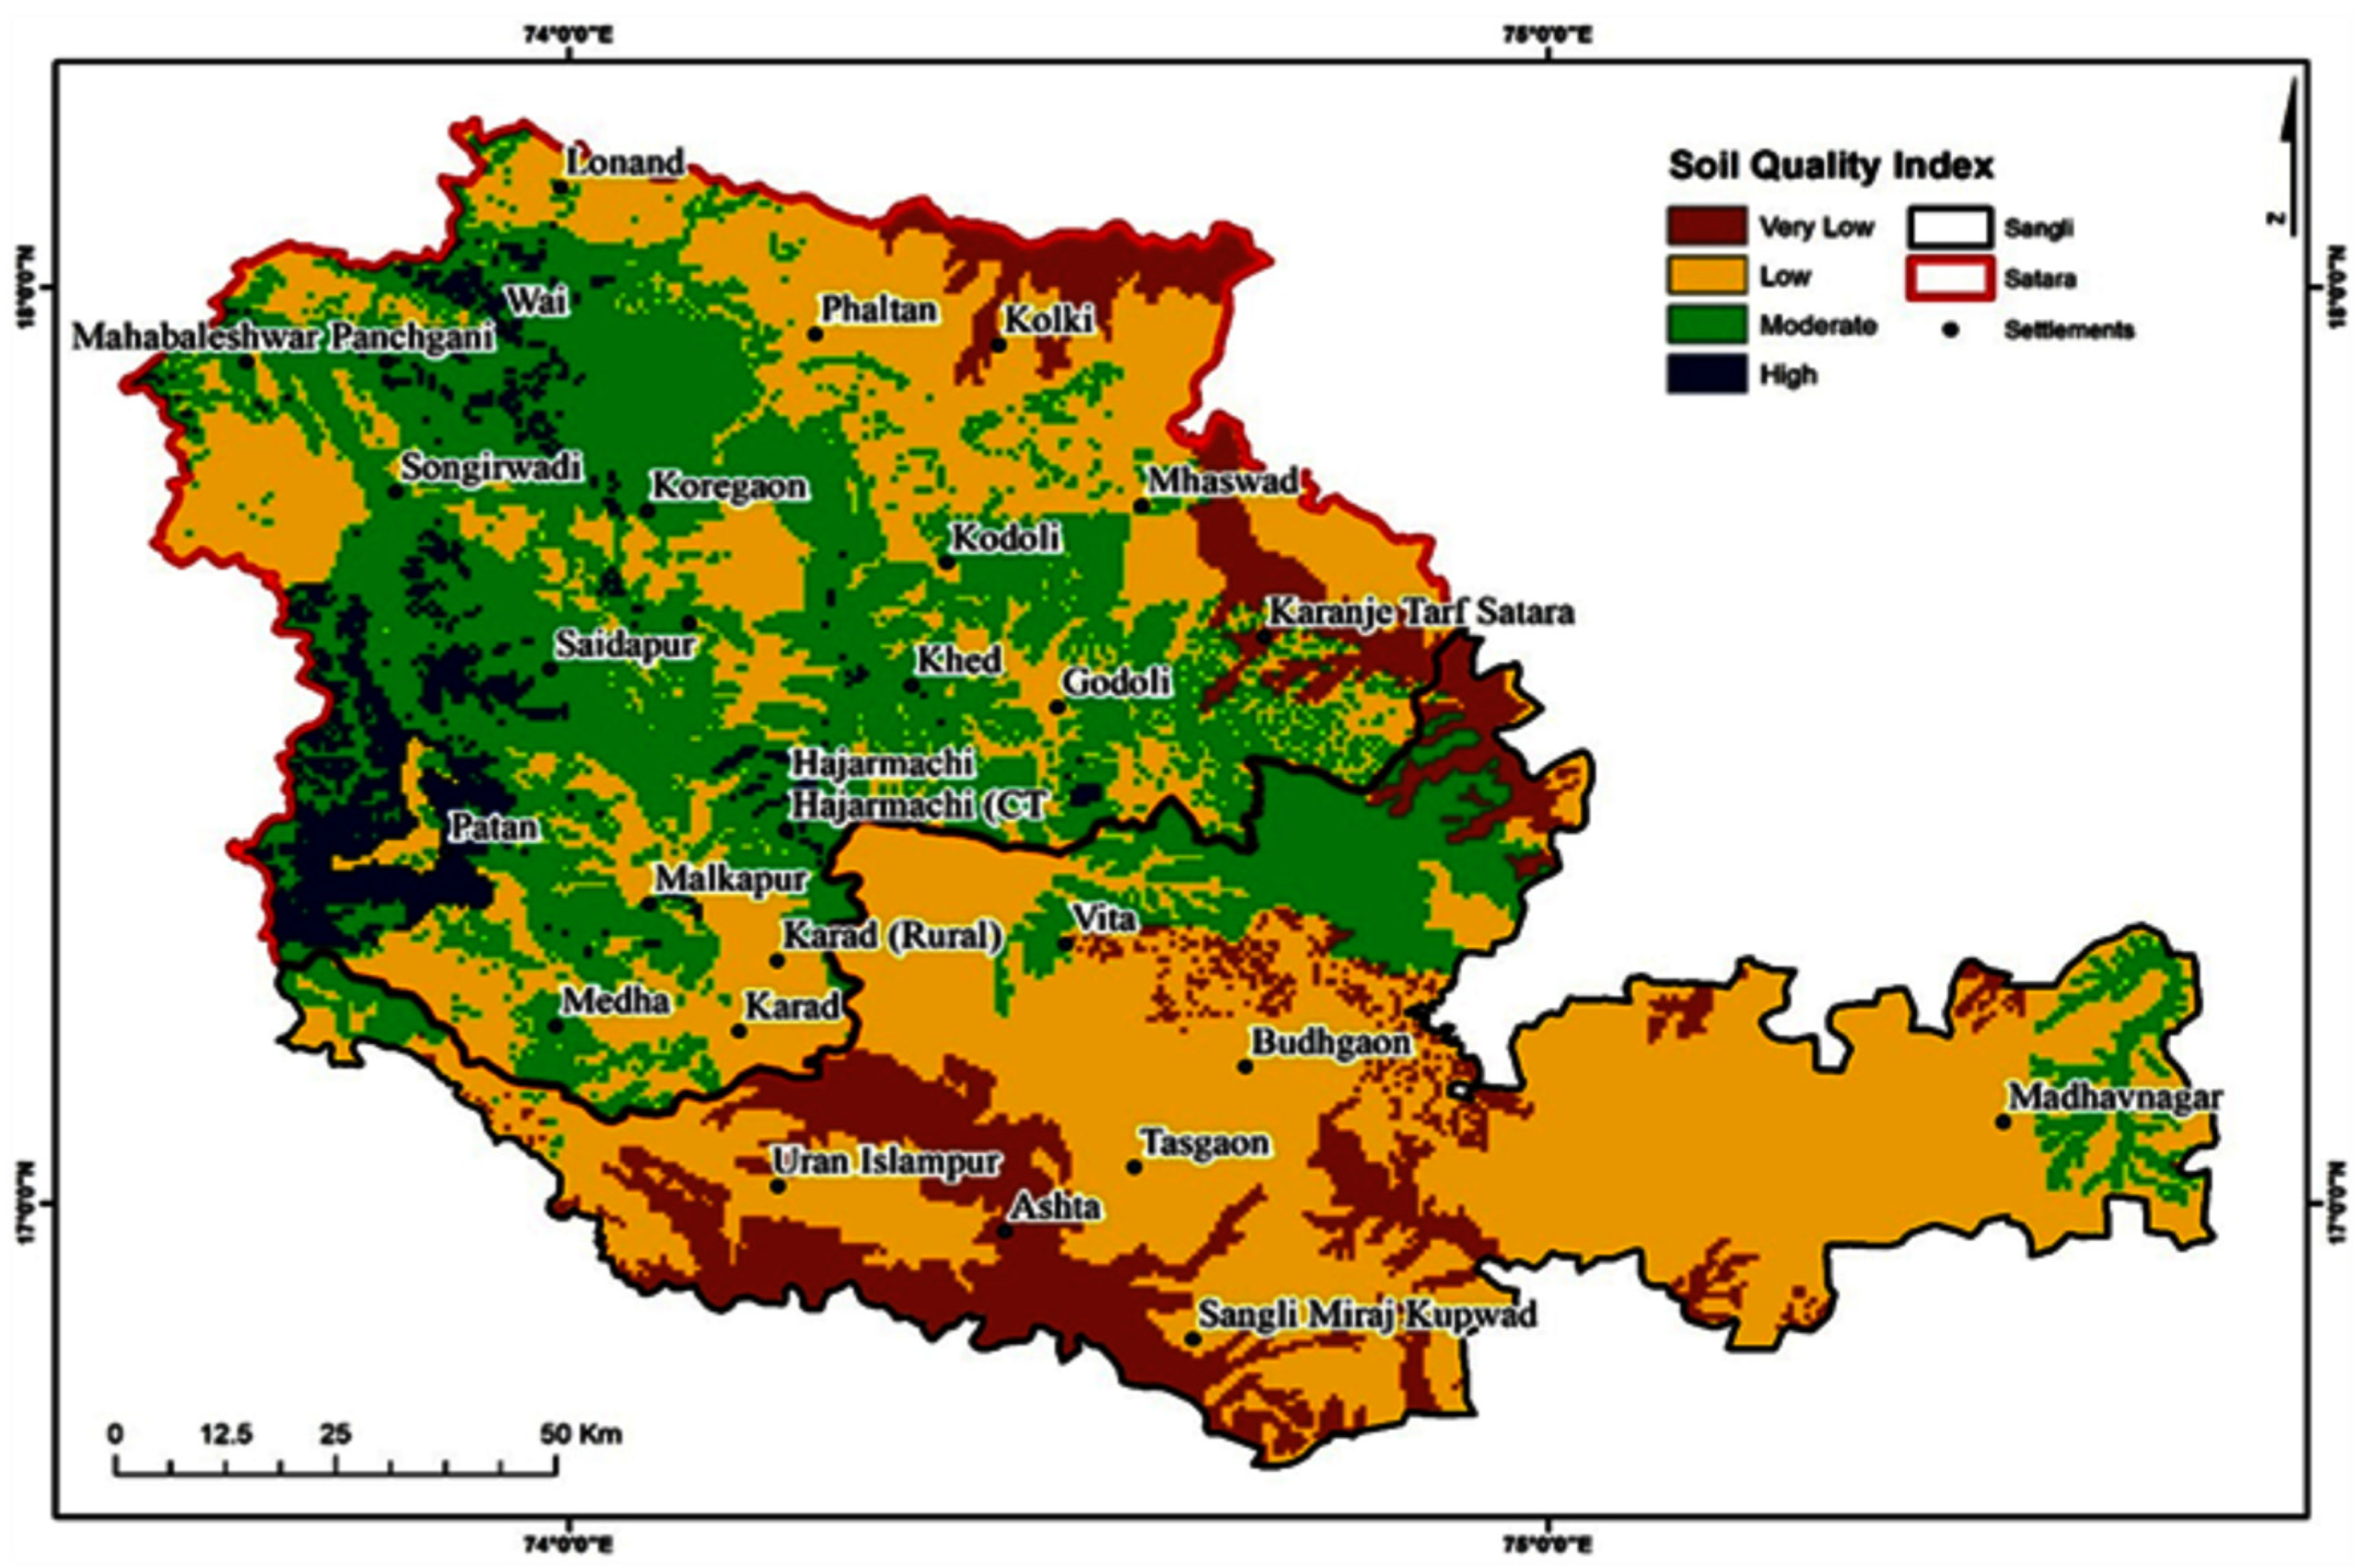
Waterbodies and rocks are the non-soil categories, so the weightage assigned to them is 1 and 2, respectively. Figure 5 shows the spatial pattern of the soil quality index in four major categories. The moderate and high soil quality are mainly distributed in Satara district whereas very low to low soil quality are mainly distributed in Sangli district. A maximum area of 52.76% is found under the low soil quality index whereas 30.66% of the area is found under the moderate category. The category of high soil quality index accounted for 3.81% of the area, whilst very low accounted for 12.77%. The steeper slopes with slope gradient of >15° account for nearly 3% which coincides with forest areas over the western part of the study area. So, areas with steeper slopes are not found to be prone to desertification.

3.2. Parameters Used for Vegetation Quality Index

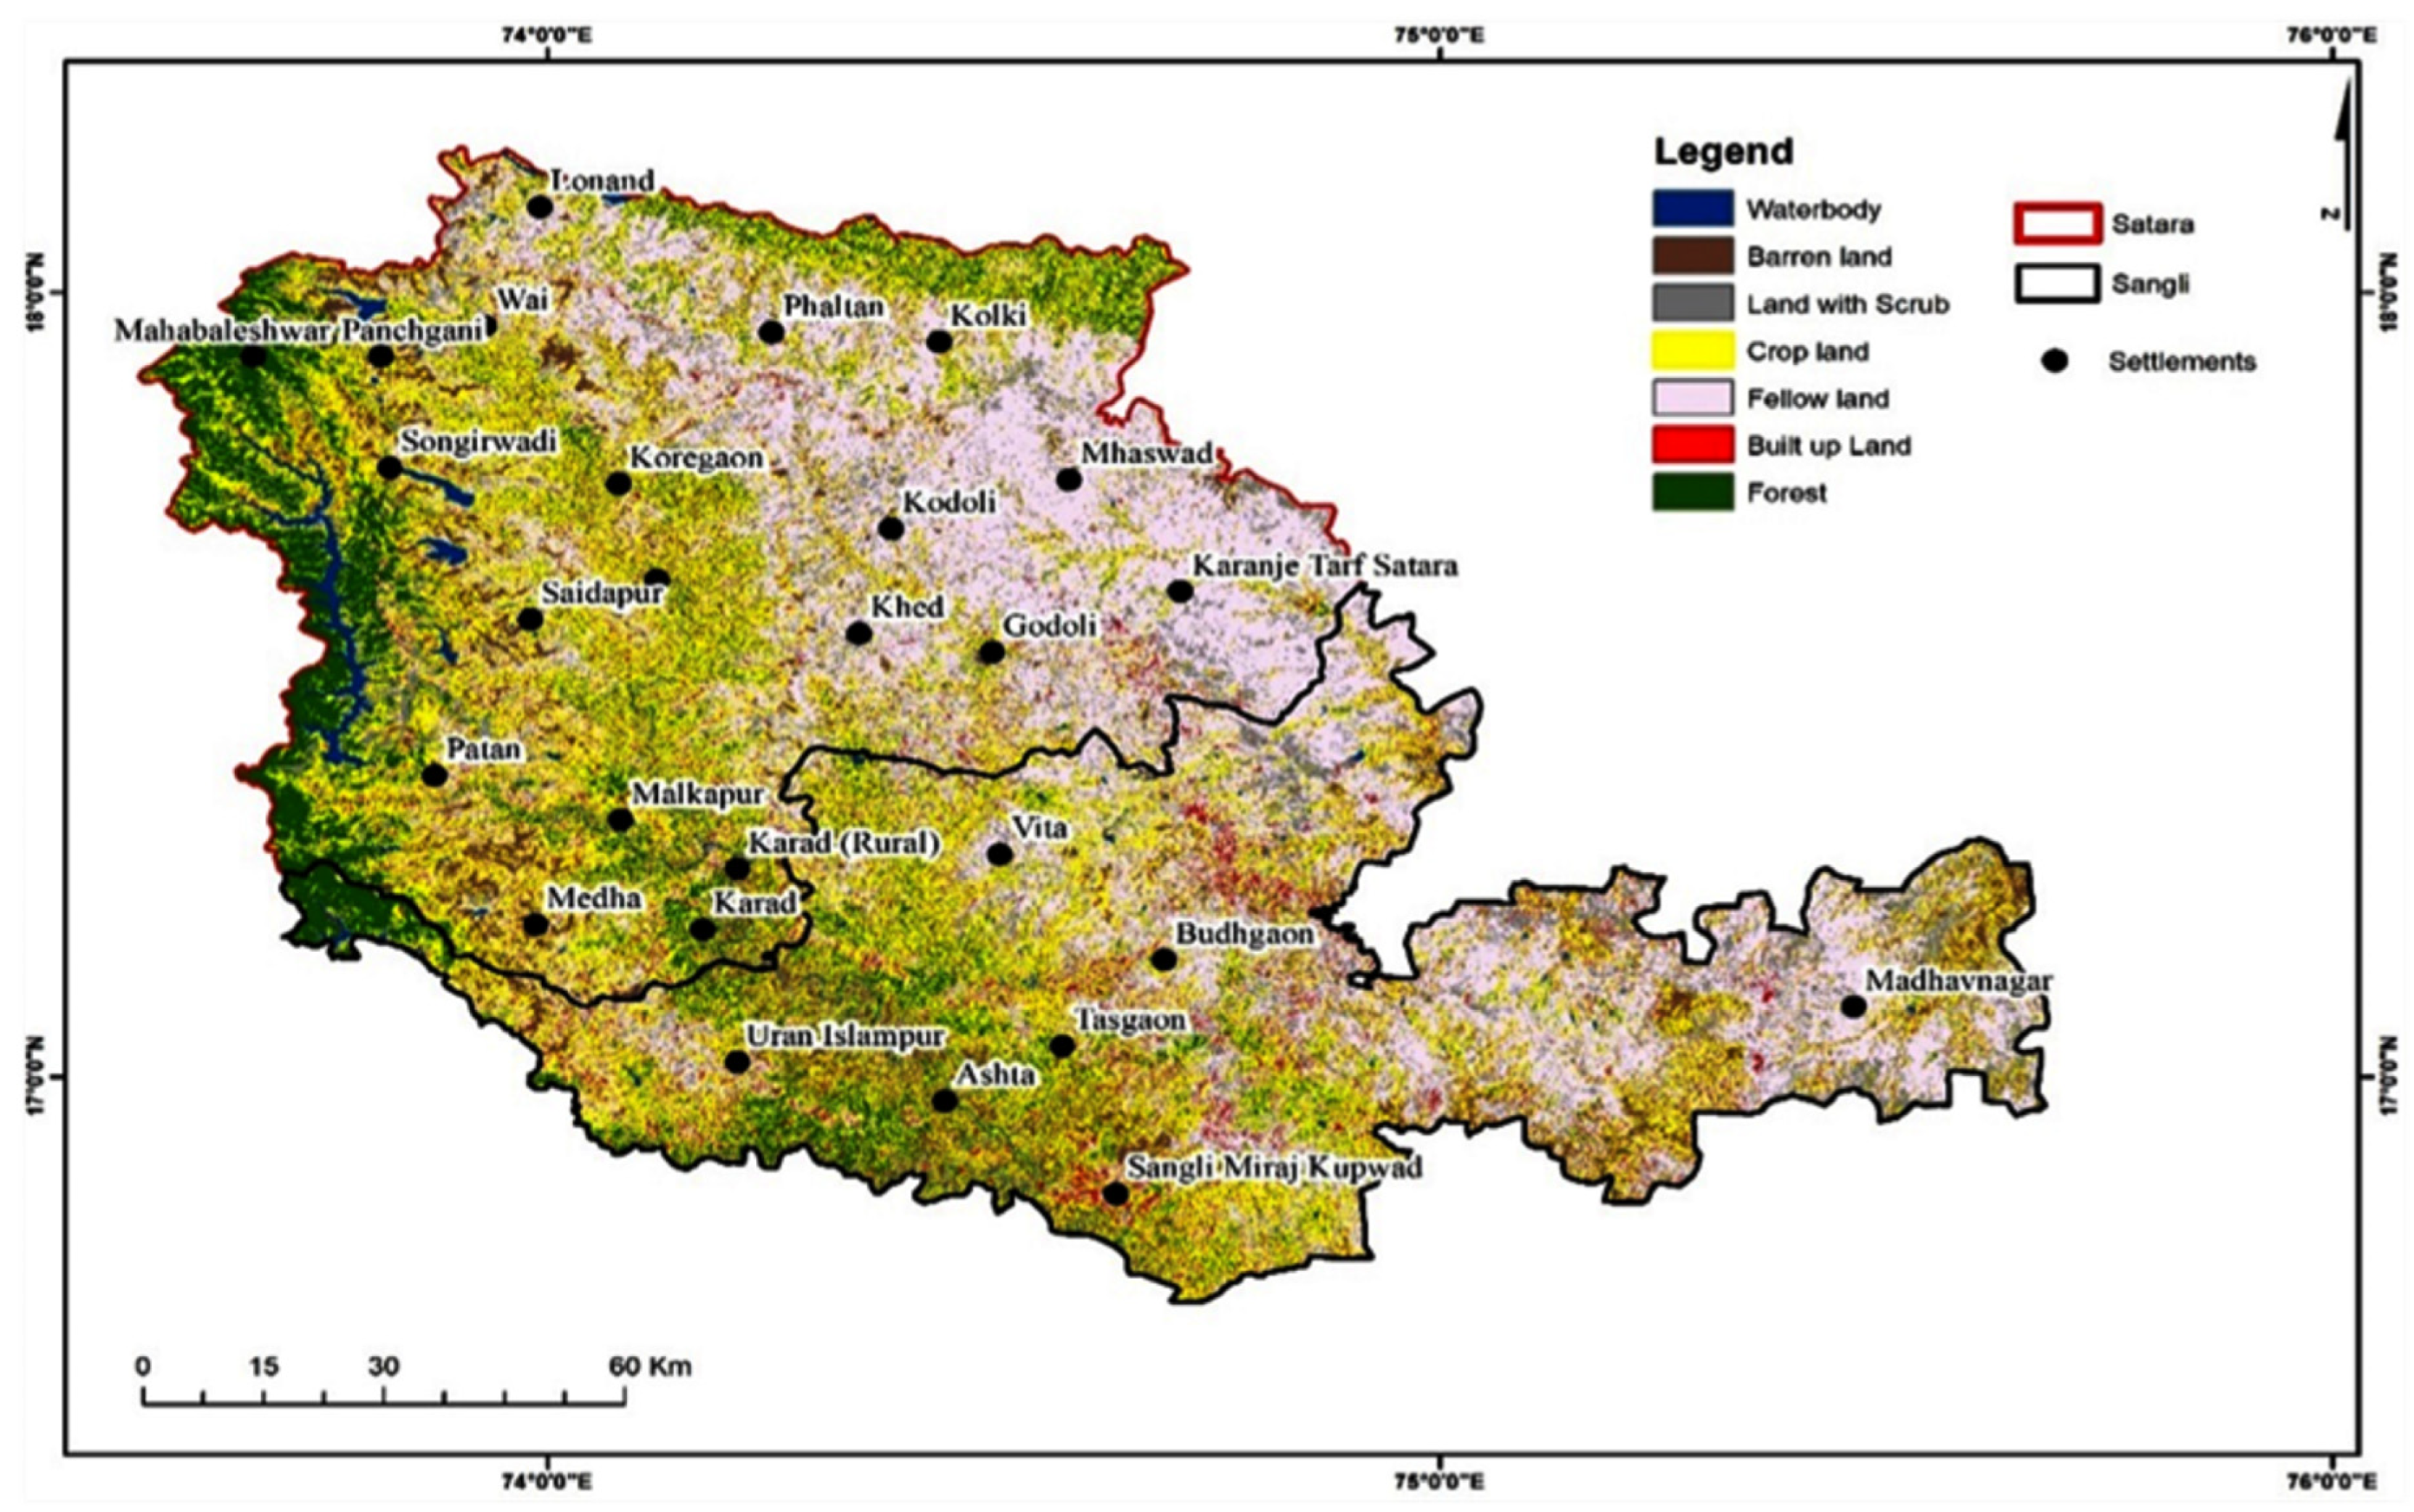
As the amount of vegetation cover increases, there is an exponential decrease in both runoff and sediment loss and vice versa. When the vegetation cover reaches 45–50%, it is considered critical because the soil is sufficiently protected from raindrop impact, leading to a significant reduction in soil erosion [47]. In addition, the types of vegetation and land use play a crucial role in regulating various processes that impact desertification. The satellite images were classified into seven classes, namely waterbody, forest, settlement, fallow land, barren land, cropland, and scrub (Figure 6 and Table 3). Fallow land is the dominant class (25%), followed by cropland (24.46%).

3.2.1. NDVI and Vegetation Cover (%)

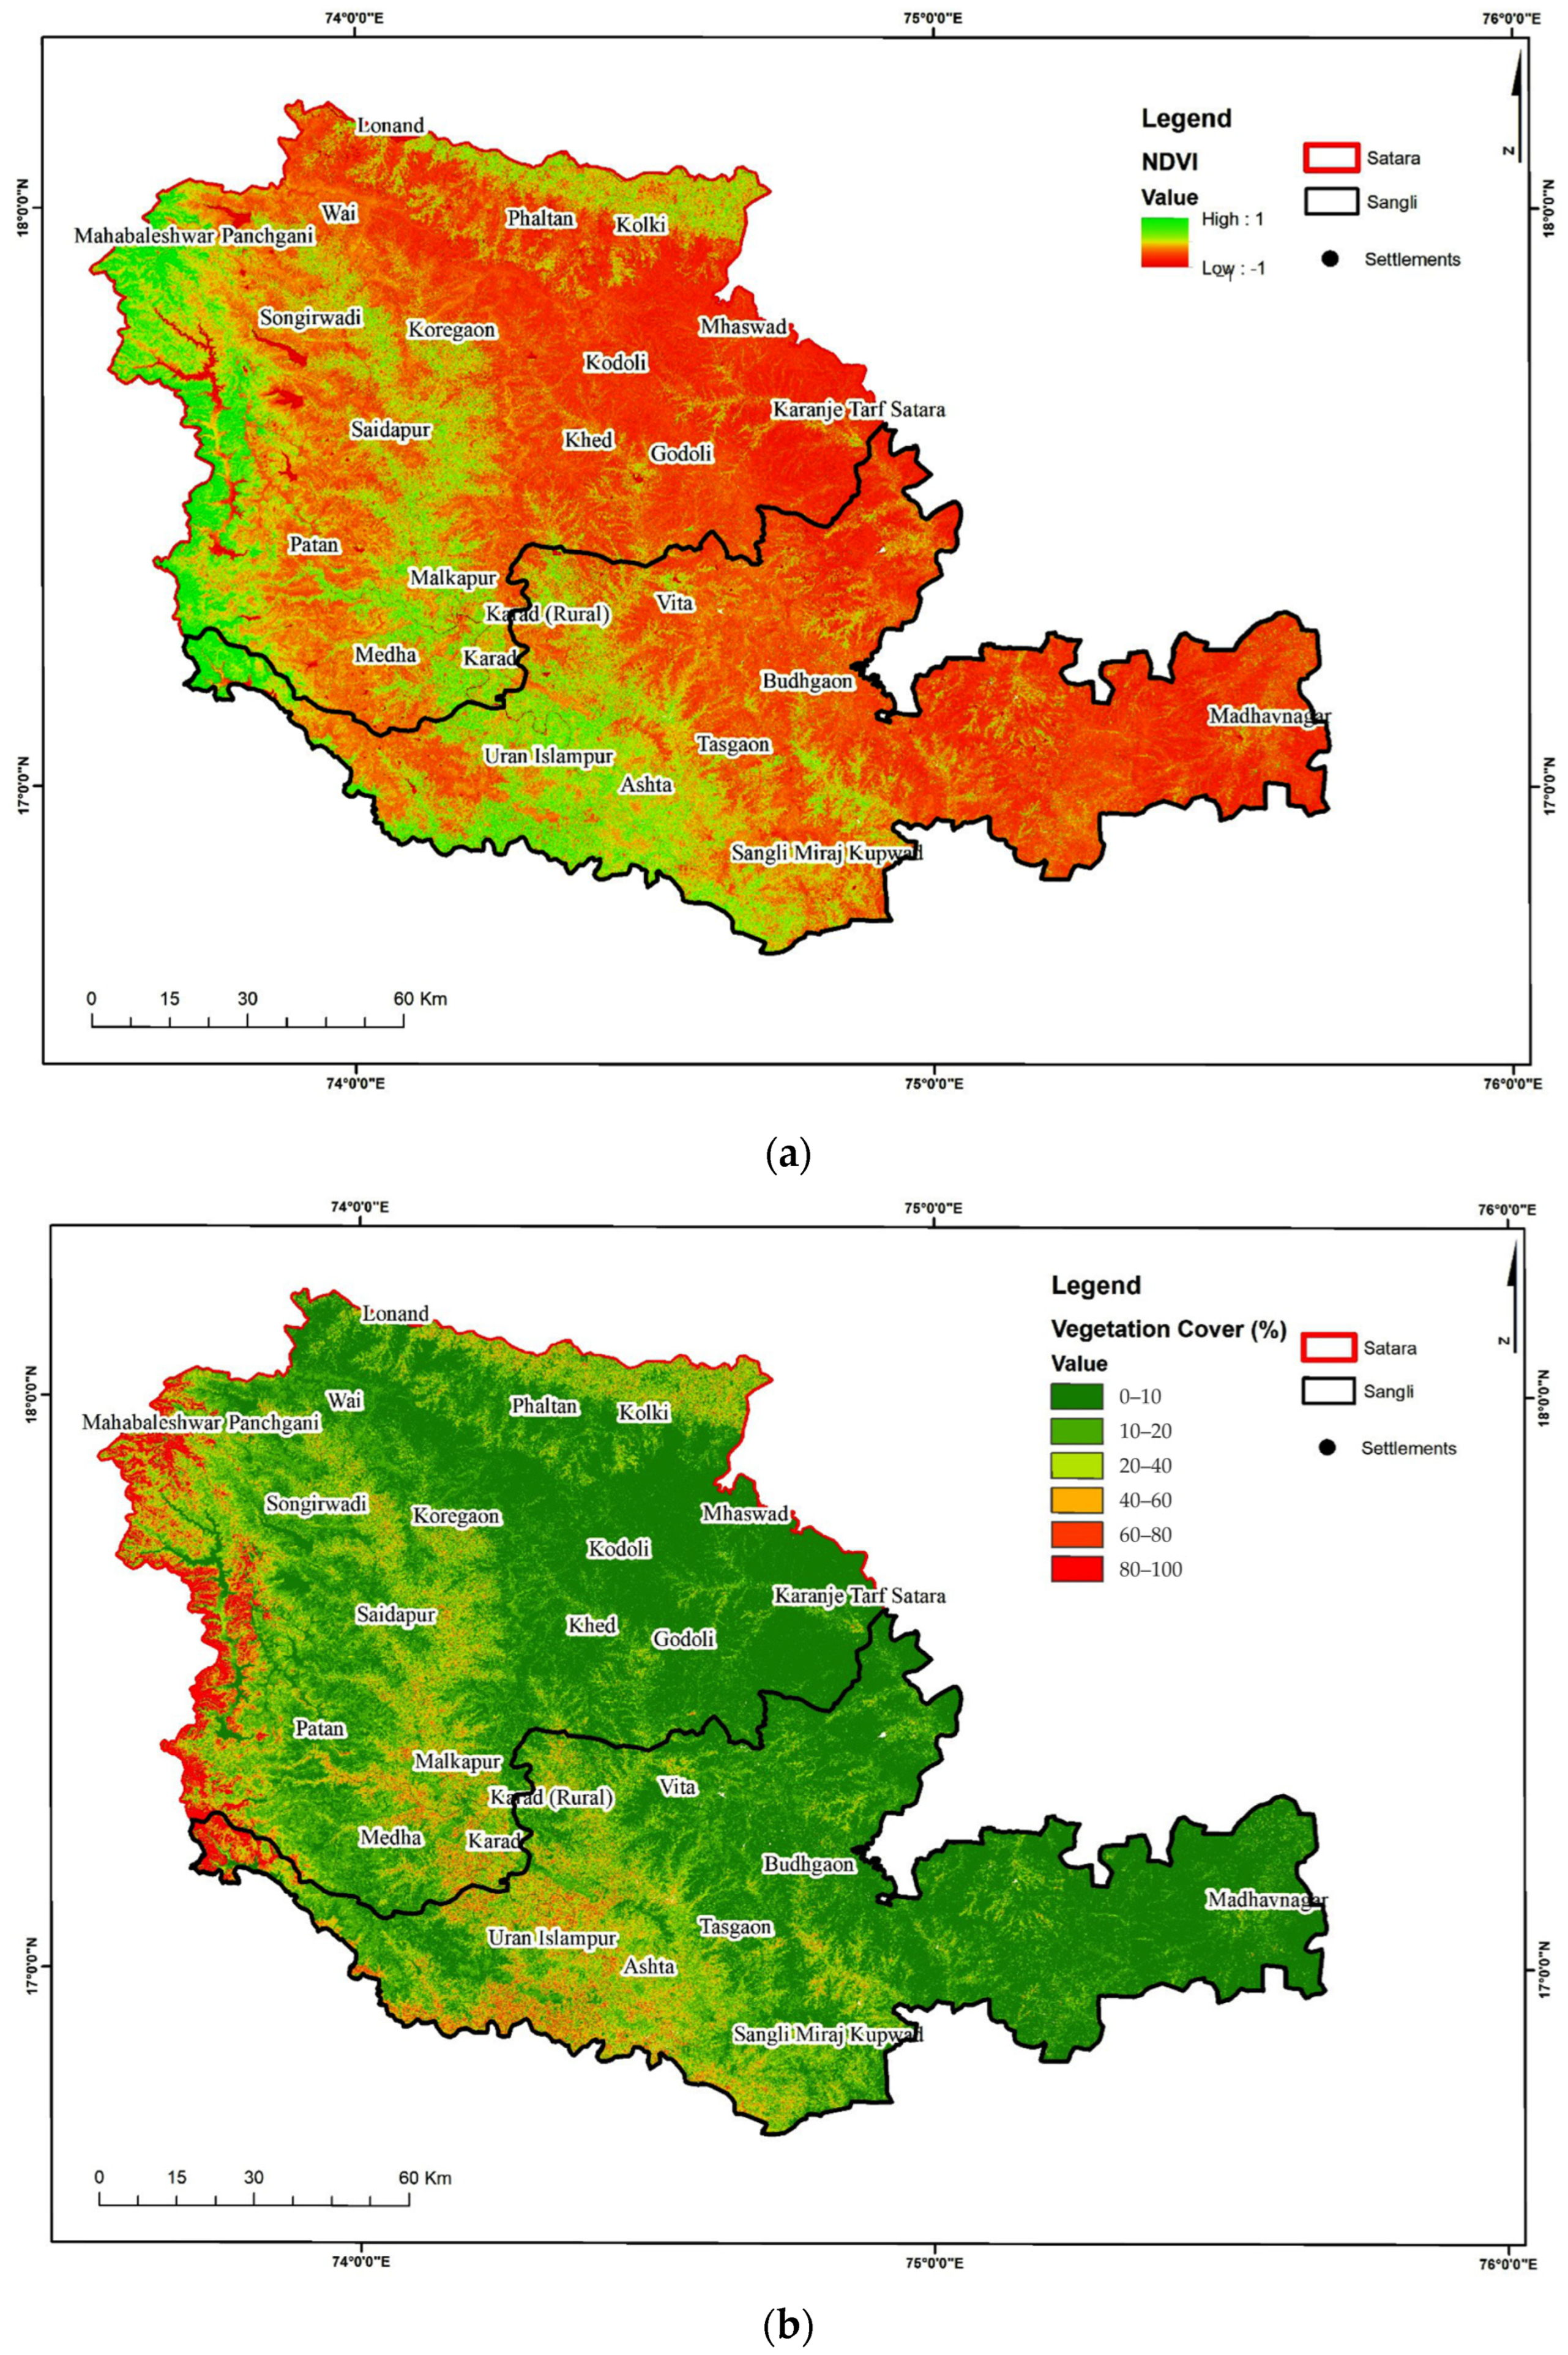
The NDVI is usually sensitive to vegetation. However, the identification of vegetated and non-vegetated areas is performed by LULC data, as NDVI alone may not accurately distinguish between the two. In the study area, categories identified in LULC data like cropland, deciduous forest, and degraded forest were considered as vegetated areas, and other categories as non-vegetated areas. Areas that have barren rock, sand, or snow usually have very low NDVI values, typically 0.1 or less. Sparse vegetation such as shrubs, grasslands, or senescing crops may result in moderate NDVI values, approximately 0.2 to 0.5. On the other hand, high NDVI values, approximately 0.6 to 0.9, correspond to dense vegetation such as that found in temperate and tropical forests or crops at their peak growth stage. In the study area, high NDVI values were found in some parts of the Satara district, whereas the majority of the study area represents sparse to very sparse vegetation (Figure 7a). The vegetation cover map showed that the western part of the study area is mostly dominated by forest cover (Figure 7b). It is considered an important parameter to deduce VQI.

3.2.2. Vegetation Quality Index

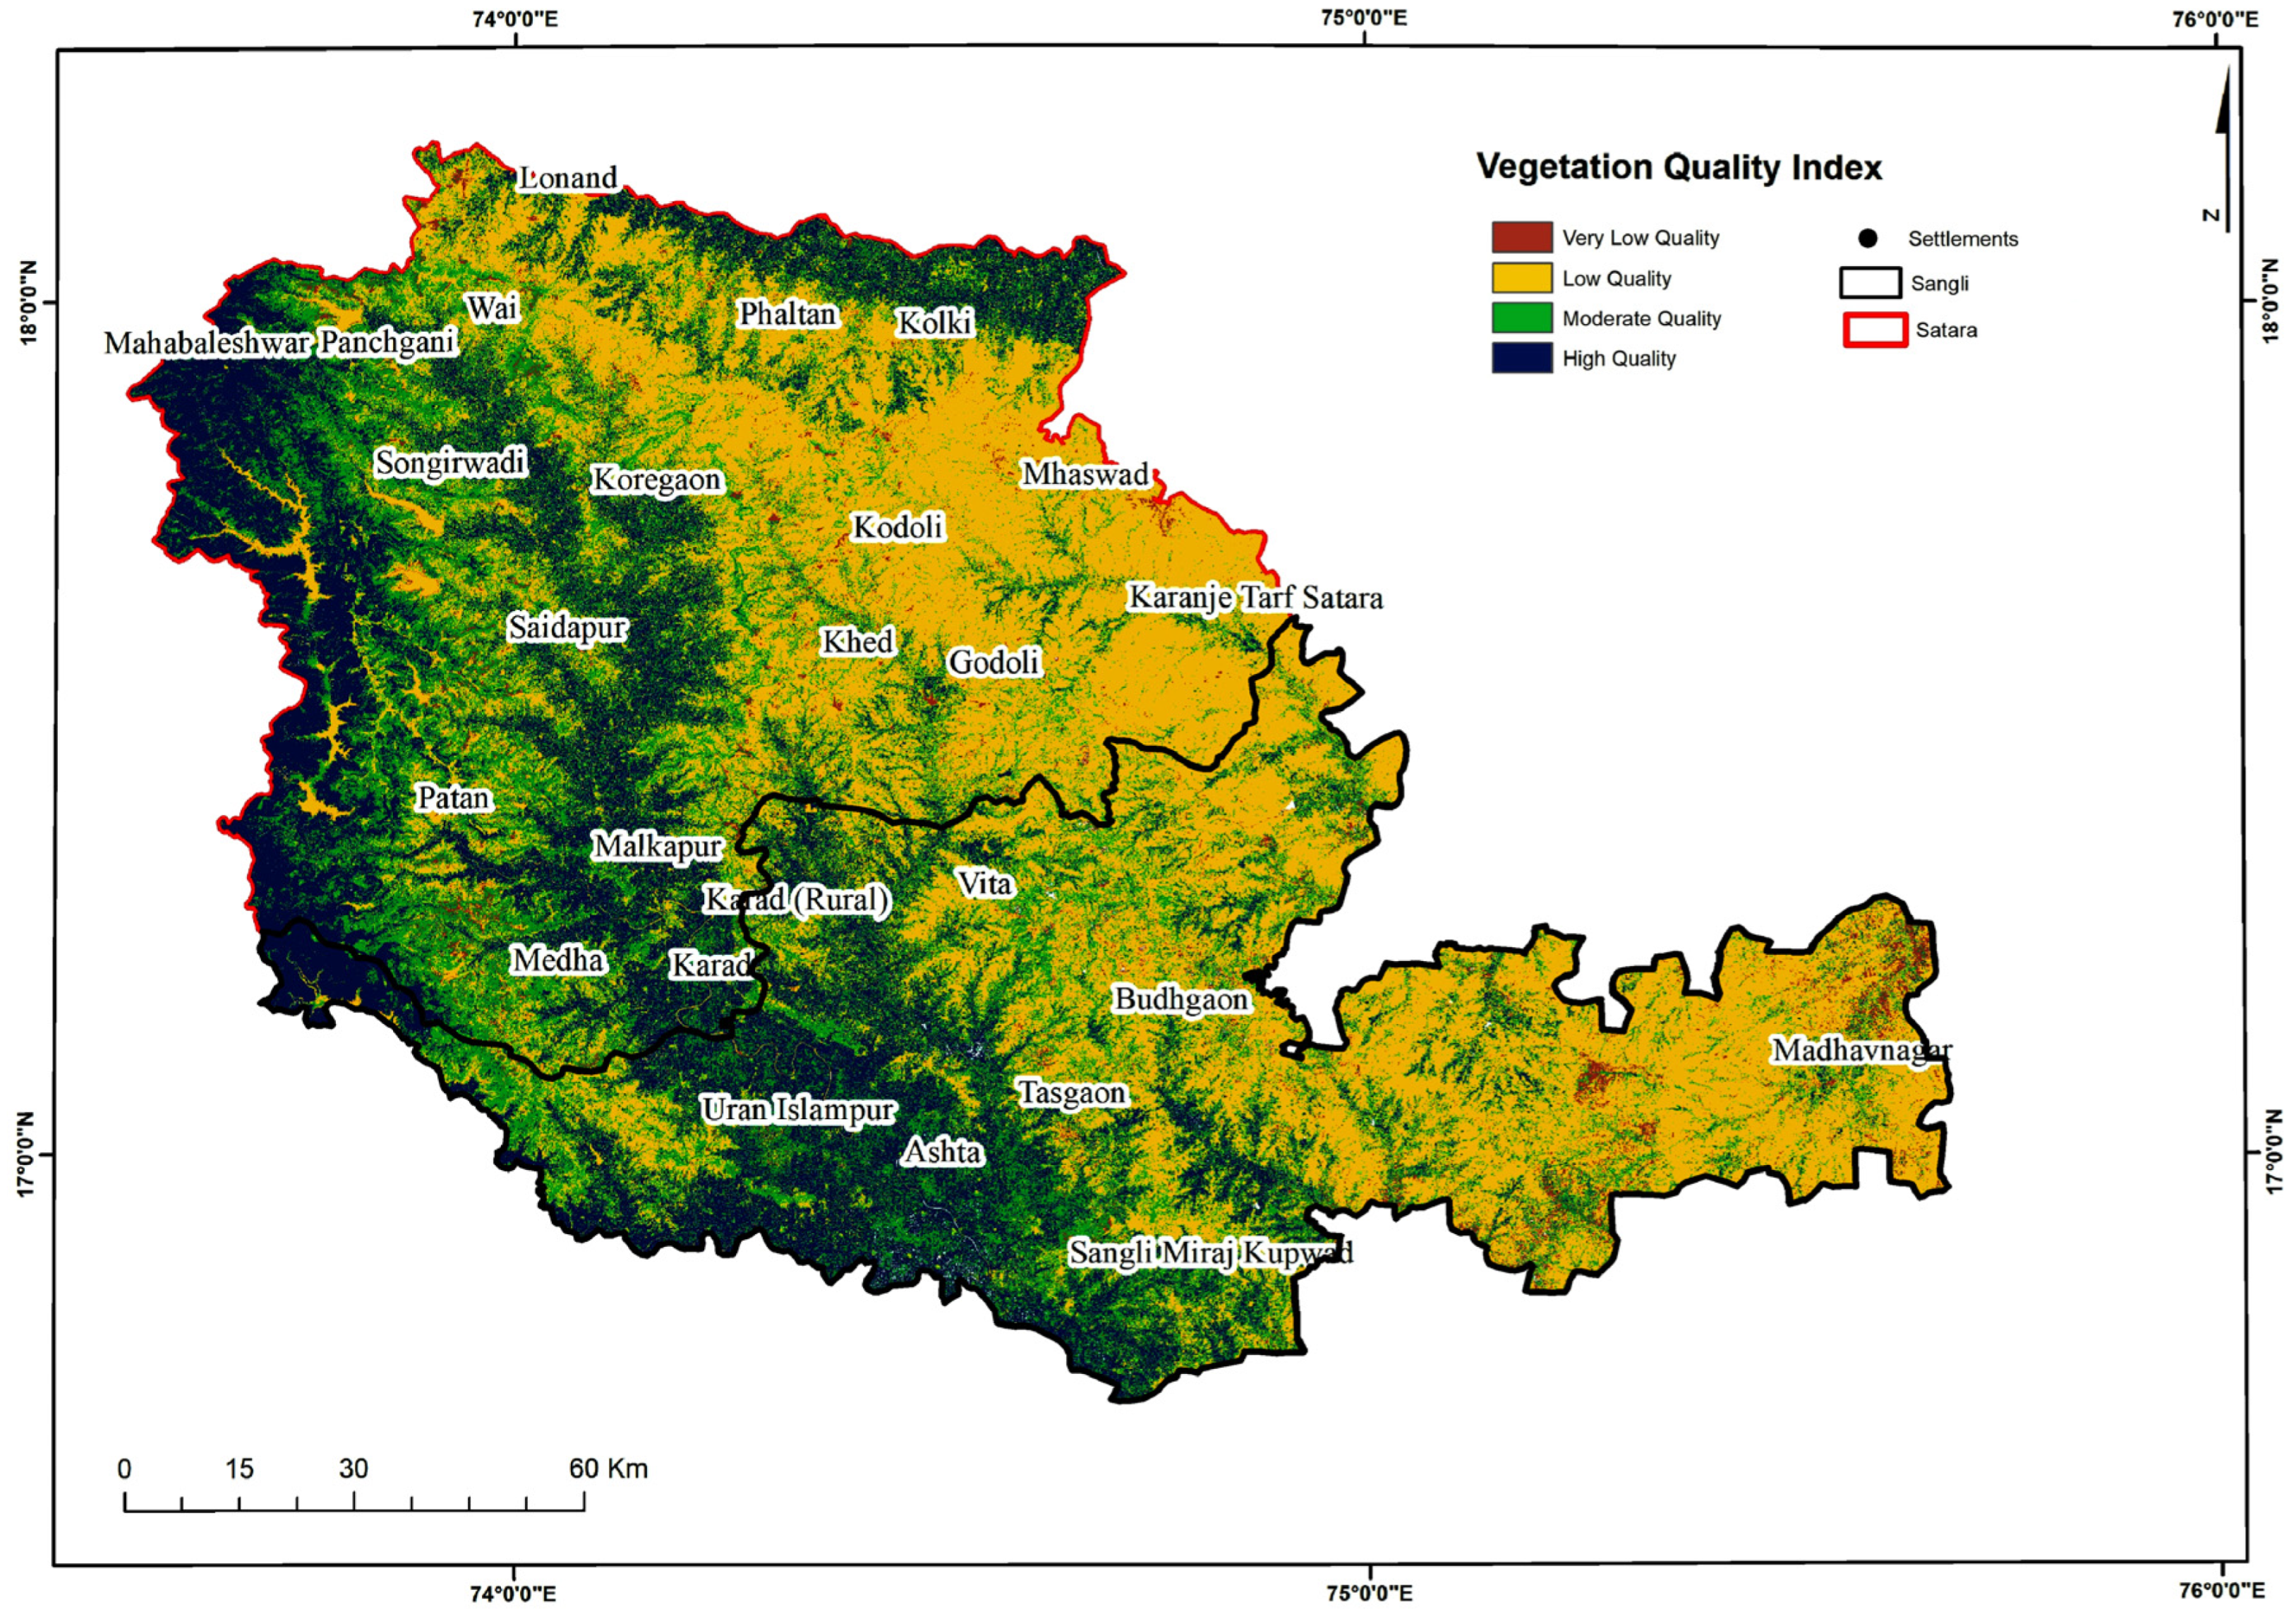
Figure 8 shows the spatial pattern of vegetation quality index and Table 4 shows its area statistics. The result shows that high-quality vegetation is found in some parts of the Satara and Sangli districts, representing only one-fourth the proportion of the study area. Whereas around half of the study area mainly located over the eastern parts represents low-quality vegetation (48.80%) portions of both the districts.

3.3. Results of the Parameters Used for Climate Quality Index

3.3.1. Average Annual Rainfall, Air Temperature and PET

Climatic conditions with low rainfall and high evapotranspiration will decrease soil moisture for plant growth. Figure S5 exhibited that high rainfall is found in Sangli district and low to medium rainfall is found in Satara district. Air temperature is a factor used to determine water stress, transpiration of the growing vegetation, soil water evaporation, soil salinity, and soil alkalinity. Higher temperatures will have a negative effect on desertification [48]. Temperatures in Satara district are high while the Sangli district experiences low to medium temperatures (Figure S6).
The potential evapotranspiration (PET) indicator is an important tool in assessing areas that are sensitive to desertification as a result of soil salinization. It measures the ability of the atmosphere to remove water from land surfaces through evaporation (such as from the soil and plant canopy) and plant transpiration. If PET is greater than precipitation, then the climate is considered arid. Areas with high evapotranspiration are more susceptible to desertification [49]. The average annual potential evapotranspiration (PET) is shown in Figure S7. High PET levels were found in the Satara district, while the Sangli district showed low PET levels.

3.3.2. Aridity Index and Wind Speed

The aridity index reflects the relationship between climate and water availability. A higher aridity index means higher water scarcity and variability, making areas more vulnerable to desertification over time [50]. It was found that PET is more in Satara and hence the aridity index is also higher in Satara in comparison to the Sangli district (Figure 9). In both arid and semi-arid regions, if there is an increase in wind speed above the critical limit, it will lead to both land degradation and desertification [16,51]. The average wind speed for March to June of 2019 was calculated which varies from 1 to 2 m per second (Figure S8). The western side of the study area showed higher wind speed (>1.7 m/s) and hence vulnerable to desertification.

3.3.3. Rain Erosivity and Slope Aspect

High rain erosivity indicates a high capacity for water flow to cause erosion on land, leading to desertification [52]. Rain erosivity (mm/h) was calculated for a period of 2019 and depicts that the eastern side of the study area is more vulnerable to rain erosivity (Figure 10). The corresponding slope aspect of the study area is presented in Figure S9. The aspects such as south, southeast, southwest, and west are given higher weightage than the flat, north, northeast, east, and northwest aspects (Table S5).

3.3.4. Climate Quality Index (CQI)

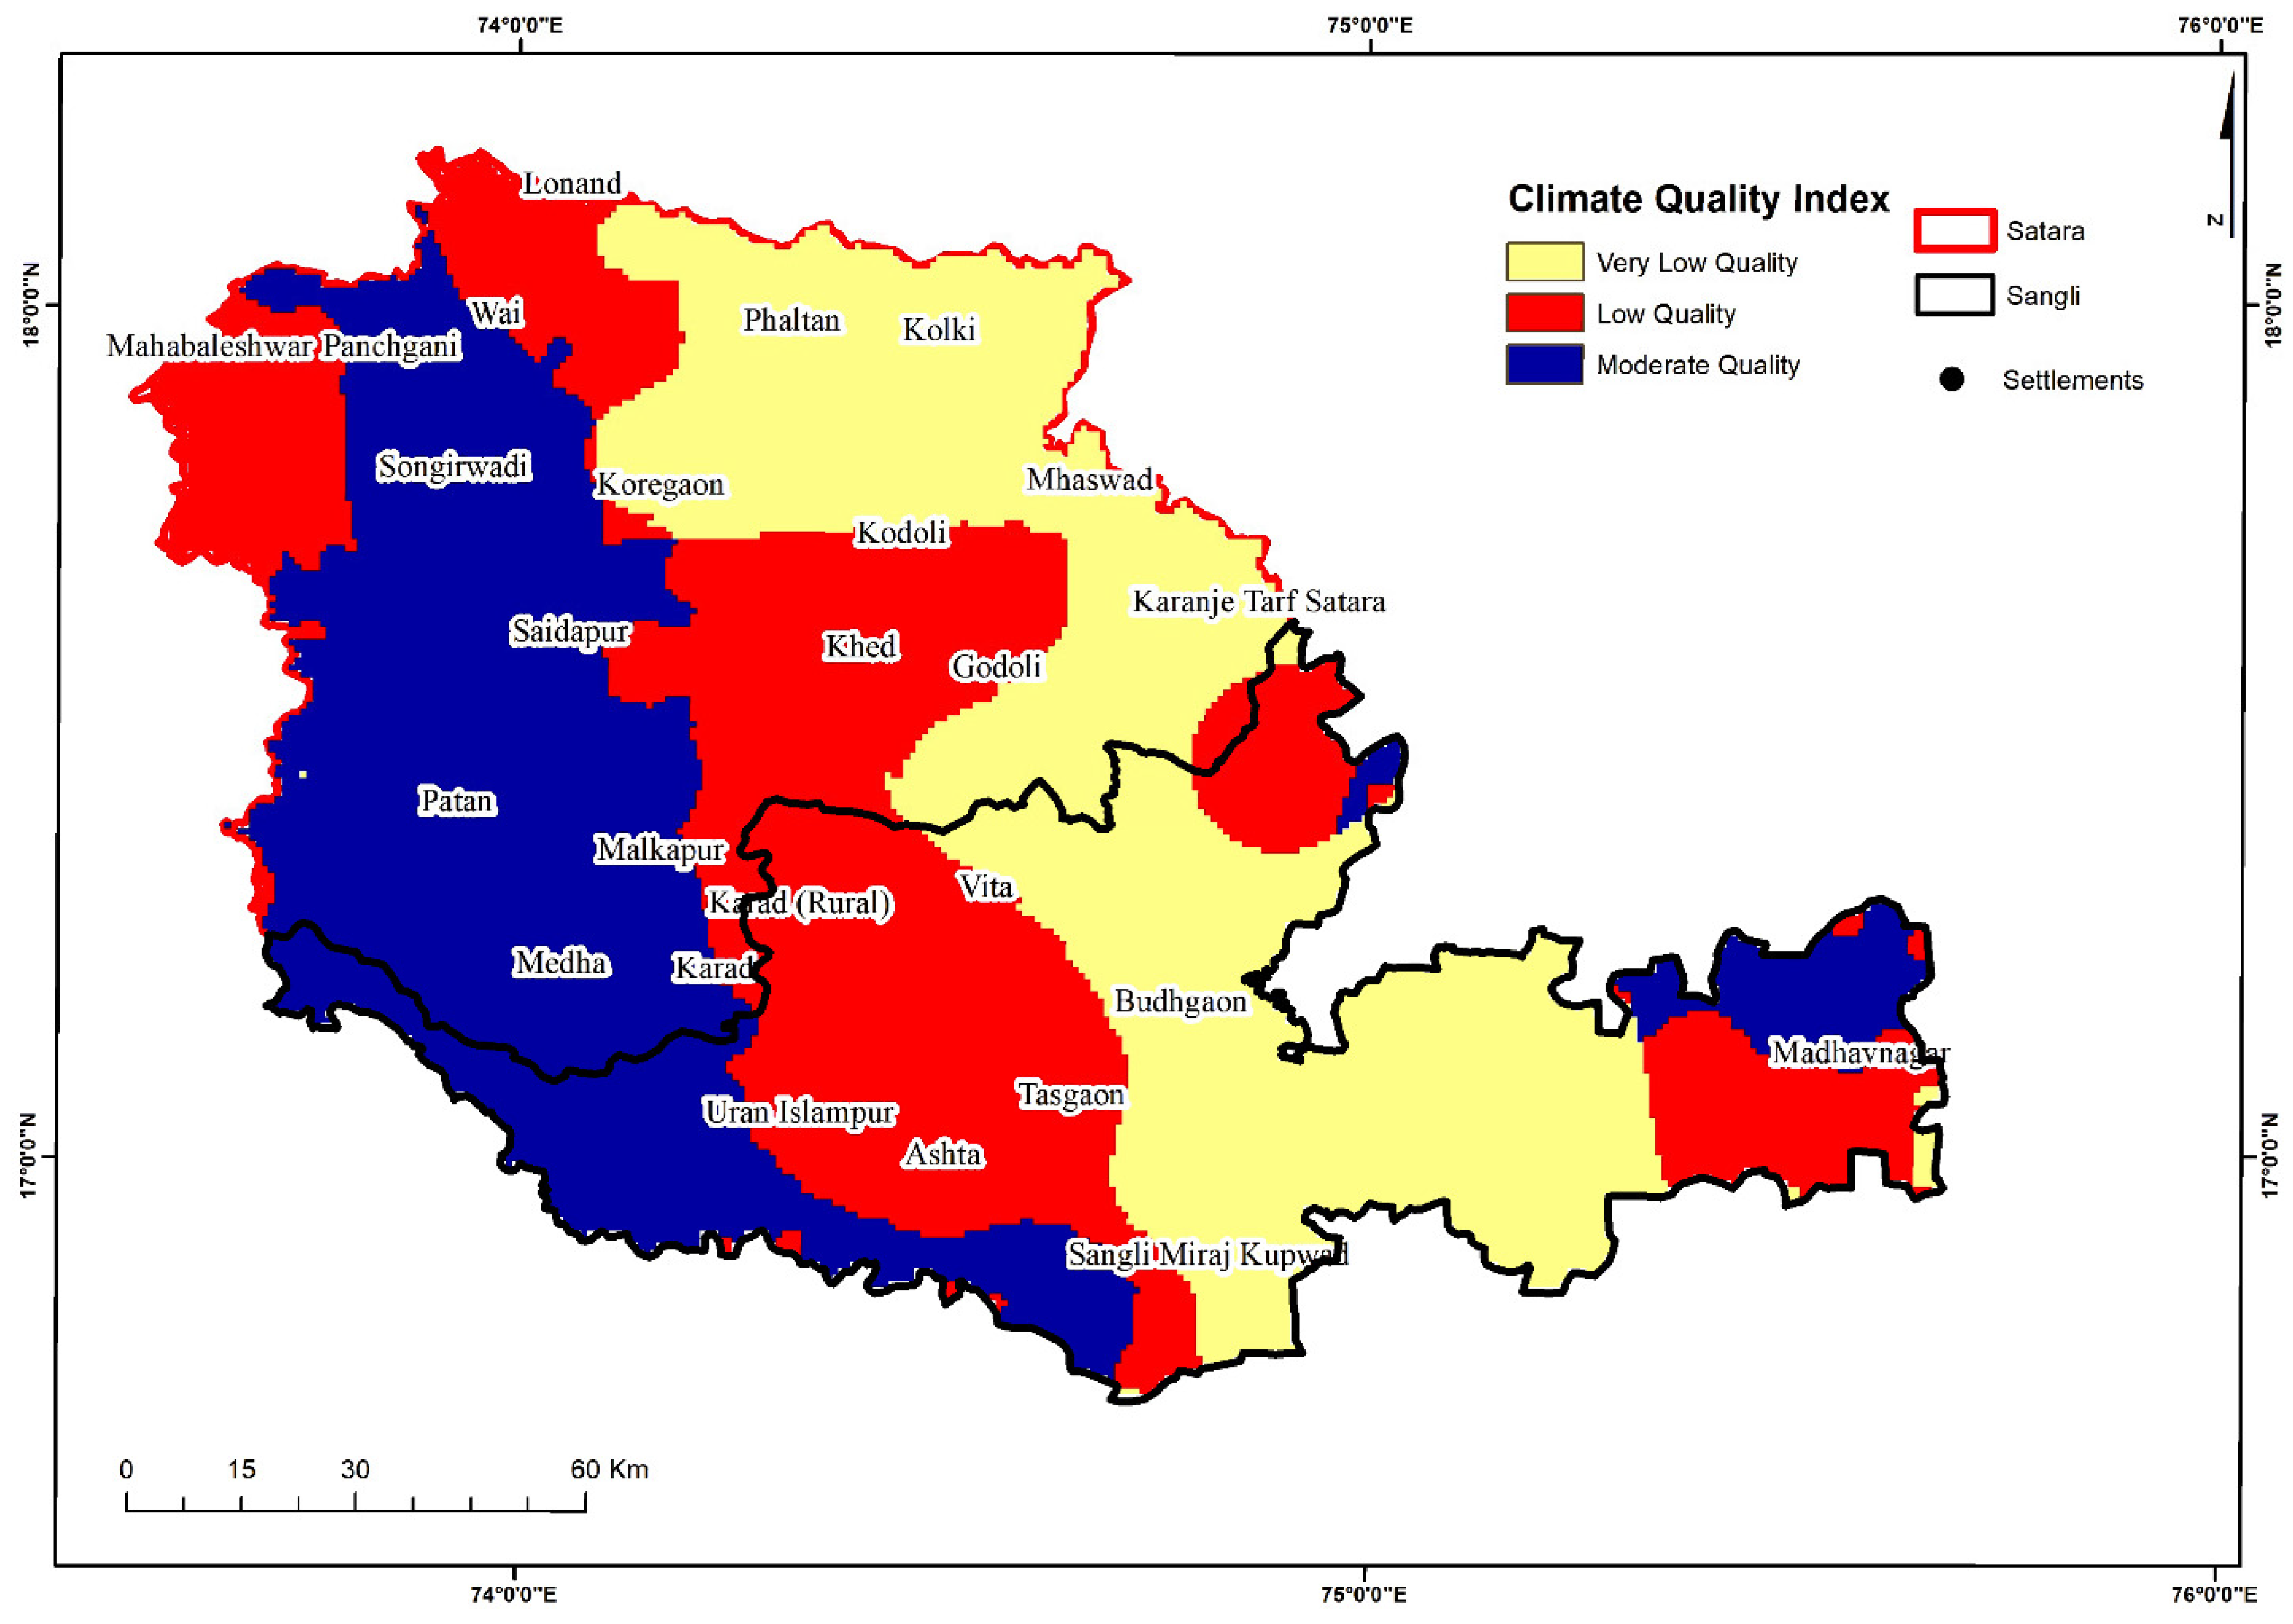
The factors that are used to assess climate quality, their classes, and assigned weights are described in Table S3. The climate quality index is shown in Figure 11 and Table 5 shows the area percentage of the climate quality index. Nearly 68% of the areas exhibited very low to low category of CQI, which are mainly distributed all over the two districts except for the western side of the study area. The moderate quality of climate was mainly co-located with the forest-dominated areas. Areas classified as very low quality (34.73%) exhibited climatic conditions that were highly unfavorable or extreme, posing significant challenges to human habitation, agriculture, and ecosystem functioning. These areas experience extreme temperatures, erratic rainfall patterns, prolonged droughts, or other climatic extremes that severely impact livelihoods, water availability, and agricultural productivity. Low-quality areas (33.20%) exhibited seasonal variations in temperature and precipitation, with occasional droughts, floods, or other climatic disturbances affecting local communities and ecosystems. Moderate quality area (32.06%) demonstrated relatively favorable and stable climatic conditions conducive to human well-being, agricultural productivity, and ecosystem resilience. These areas may experience mild temperatures, adequate rainfall, and moderate humidity levels, supporting diverse ecosystems, agricultural activities, and socio-economic development.

3.4. Result of Socio-Economic Quality Index

Block-Wise Population Density, Population Growth Rate (%), Illiteracy Rate (%), and Work Participation Rate

Areas with high population density directly contribute to desertification by eroding soil or experiencing water stress, leading to low plant cover due to overexploitation of natural resources [47,53]. Block-wise population density is shown in Figure S10. The range of population density 6–50 represents low to moderate density, indicating sparse to moderately populated regions. Areas classified in the range of 50–100 exhibited moderate population density, indicating moderately populated regions. The range of 100–300 represents relatively high population density, indicating densely populated regions. Area classified in the range of 300–784.15 exhibited very high population density, indicating highly densely populated urban centers or metropolitan areas.
The rapid population growth rate brings poverty and creates high pressure on natural resources. Hence, low population growth-rated areas will bring land degradation [53]. Block-wise population growth rate (%/year) was calculated and shown in Figure S11. The range of less than 3% exhibited low to moderate population growth rates, indicating relatively stable or slightly increasing populations. Areas classified in the range of 3 to 6% represent areas experiencing moderate population growth rates, with populations expanding at a moderate pace. The range of 6 to 9% exhibited relatively high population growth rates, indicating significant population expansion within a relatively short period. The range of 9 to 16% represents areas undergoing very high population growth rates, with populations expanding rapidly.
There is a huge effect of the illiteracy rate on the general economic buoyancy of the area. Basically, illiterate farmers do not want to adopt new technologies. Therefore, higher illiteracy rates will cause more land degradation and desertification [52]. Block-wise illiteracy rate (%) was calculated and is shown in Figure S12. The illiteracy in the 1.5–4% range indicates relatively low levels of illiteracy, which may include urban or semi-urban areas with higher educational attainment levels, access to educational institutions, and greater exposure to literacy programs. The illiteracy in the 4–16% range exhibited moderate levels of illiteracy, with a larger proportion of the population facing literacy challenges compared to the previous category. The illiteracy in the 16–24% range represents areas with relatively higher levels of illiteracy, indicating a significant portion of the population lacks basic literacy skills. The illiteracy in the 24–36% range exhibited the highest levels of illiteracy, with a substantial majority of the population unable to read or write.
There is a huge effect of work participation rate on the economic buoyancy of that area. Due to lower work participation, the income will be low and the relationship with the land, and therefore, with lower work participation is very insecure for increasing desertification [52]. Block-wise work participation rate (%) was calculated and is shown in Figure S13. The work participation rate of 2.4–30% indicated relatively low levels of work participation, with only a small portion of the population engaged in economic activities. The work participation rate in the 30–40% category exhibited moderate levels of work participation, with a larger proportion of the population engaged in economic activities compared to the previous category. The 40–50% category displayed relatively higher work participation rates, indicating a significant portion of the population actively participating in economic activities. The 50–60% category exhibited the highest levels of work participation, with a substantial majority of the population actively engaged in economic activities.

3.5. Socio-Economic Quality Index

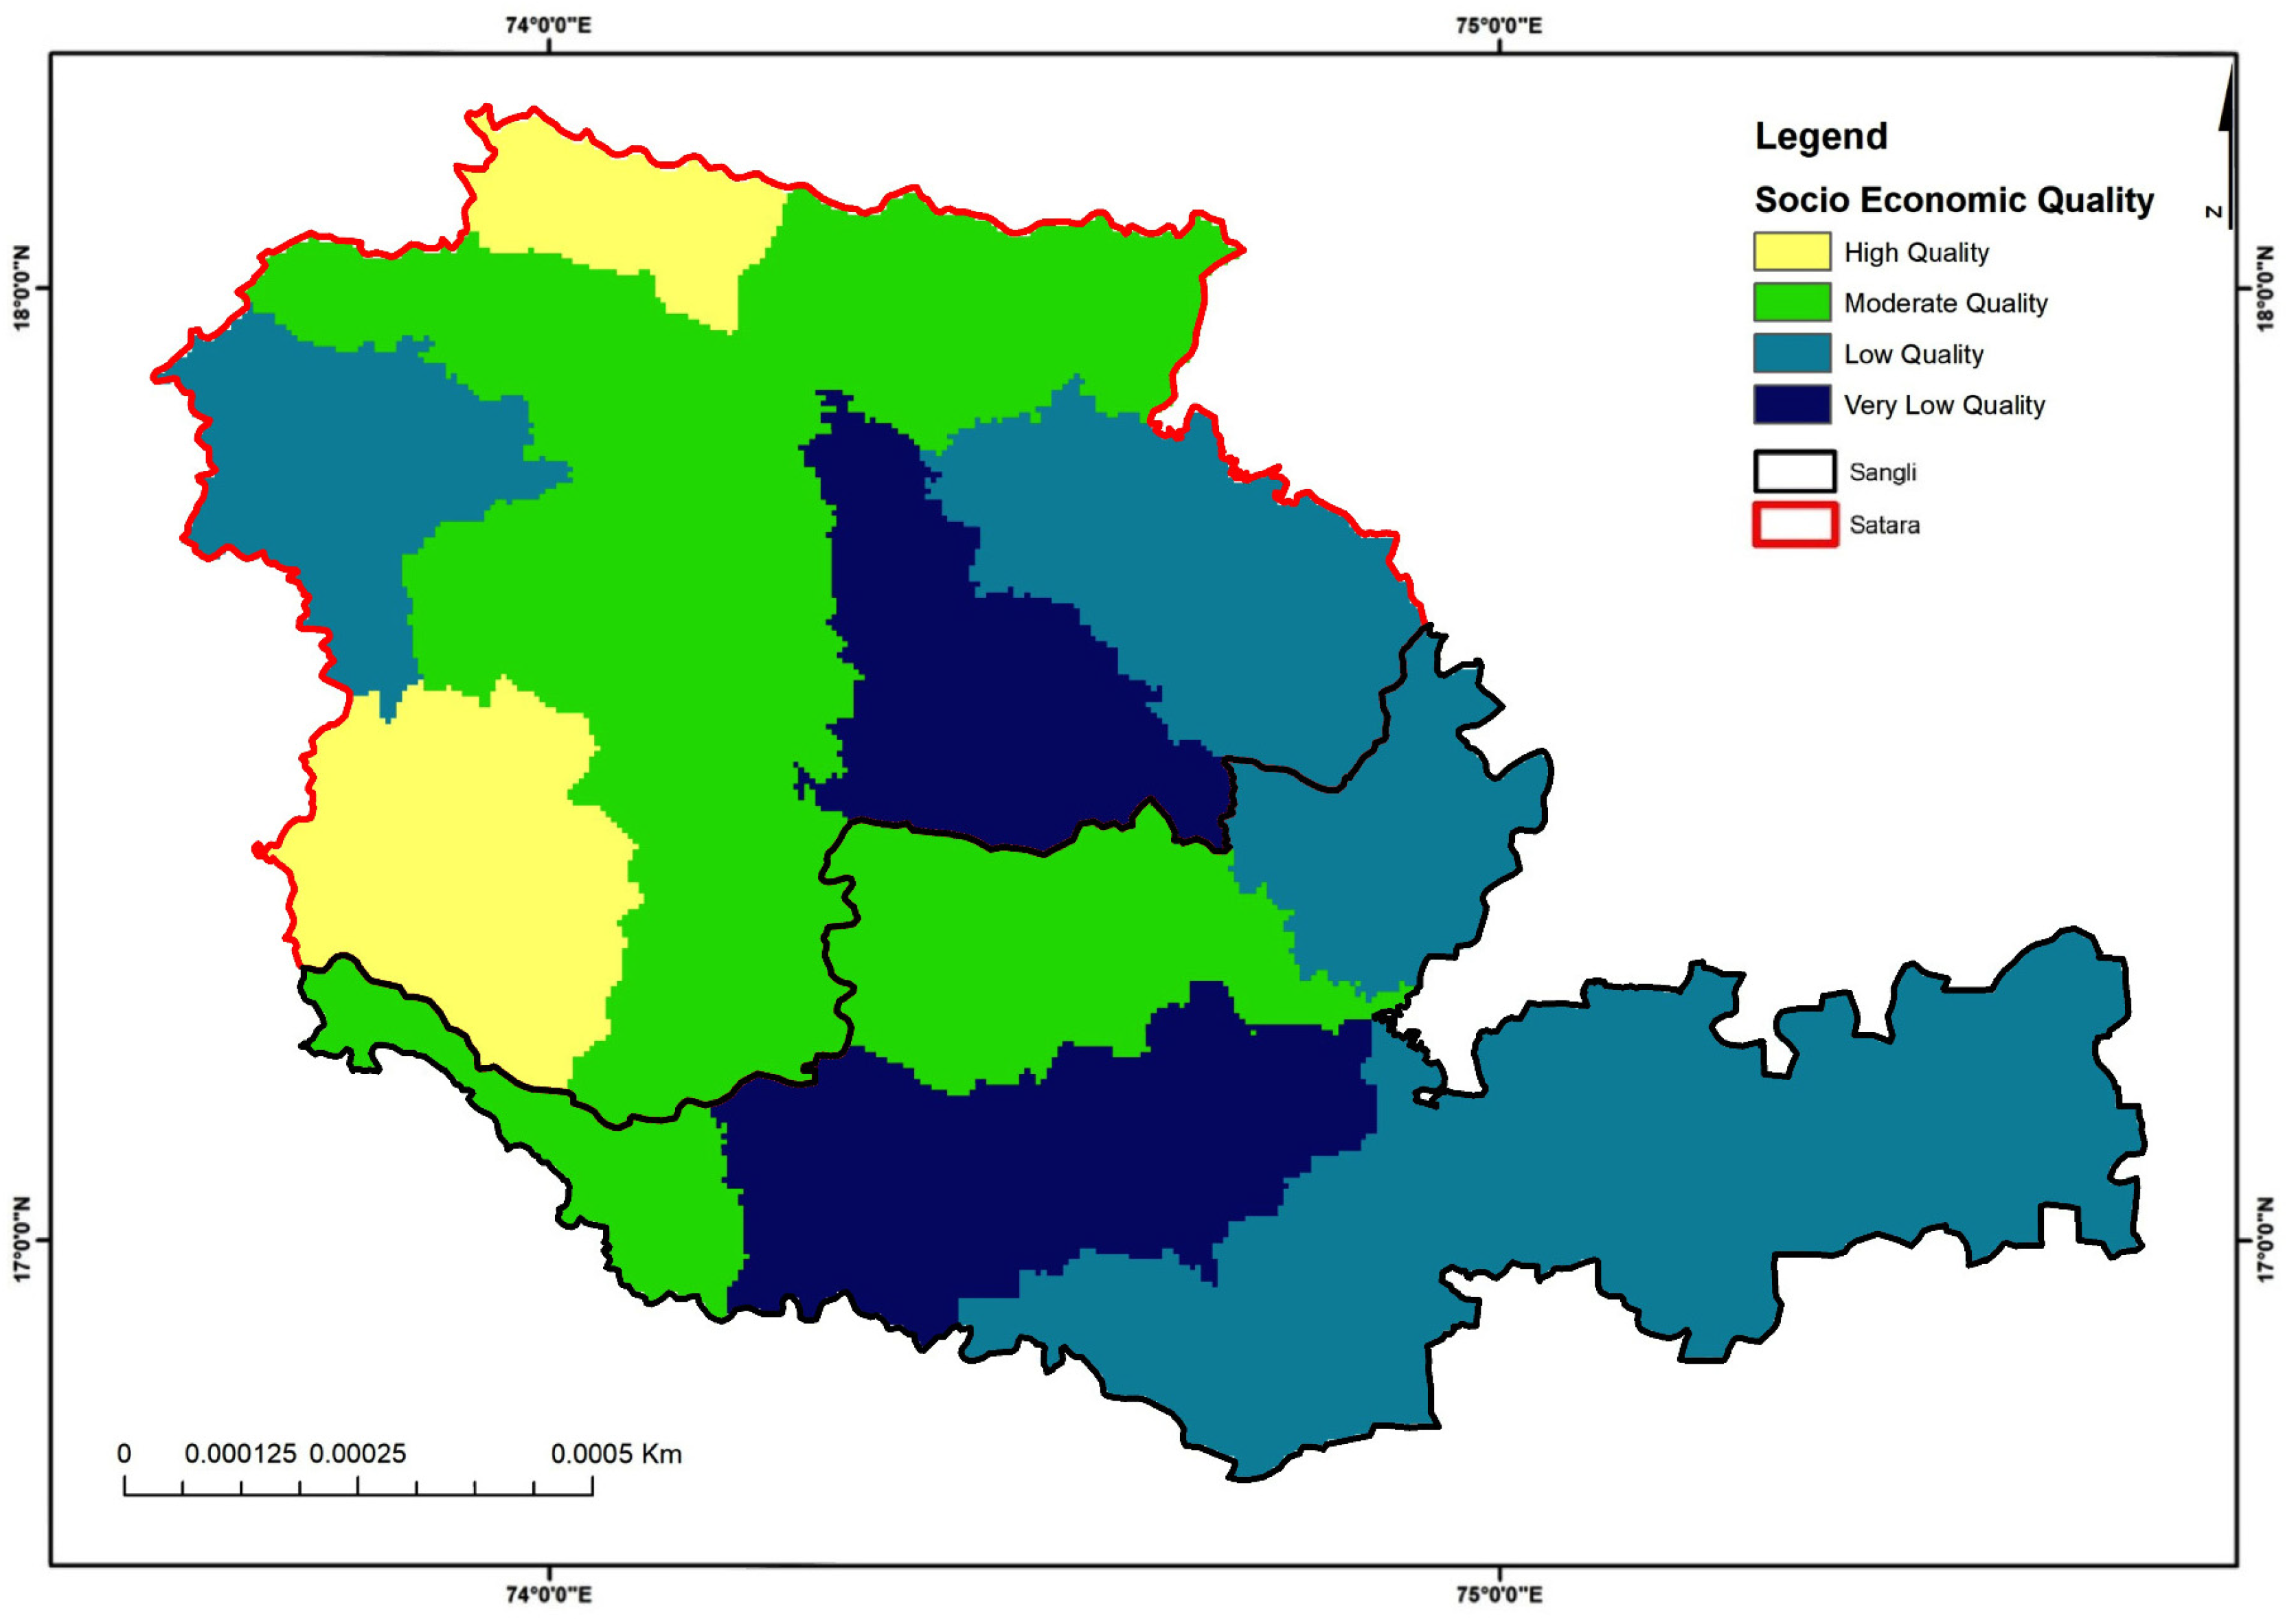
The factors that are used to assess socio-economic quality with their classes and assigned weightage are described in Table S4. Moderate to high category of SEQI was majorly found Satara district whereas very low to low was found in the Sangli district (Figure 12). The area statistics indicated that about 51.28% of the area was found under the moderate to high category of SEQI (Table 6). Areas classified as very low (13.22%) socio-economic quality represent regions facing significant socio-economic challenges and vulnerabilities. Low socio-economic quality areas encompass a larger portion of the study area, comprising approximately 35.50%. Low to very low-quality classes have a good correspondence with low to moderate illiteracy rate (<16%) and low to moderate work participation rate (<50%) that incentivize unsustainable land use practices. In particular, a lower illiteracy rate hinders for adoption of new technologies. Moderate socio-economic quality areas represent regions with relatively balanced socio-economic conditions, comprising approximately 30.99% of the study area. High socio-economic quality areas represent regions with robust socio-economic development and well-established infrastructure, comprising approximately 20.29% of the study area.

3.6. Environmental Sensitive Areas (ESA) to Desertification

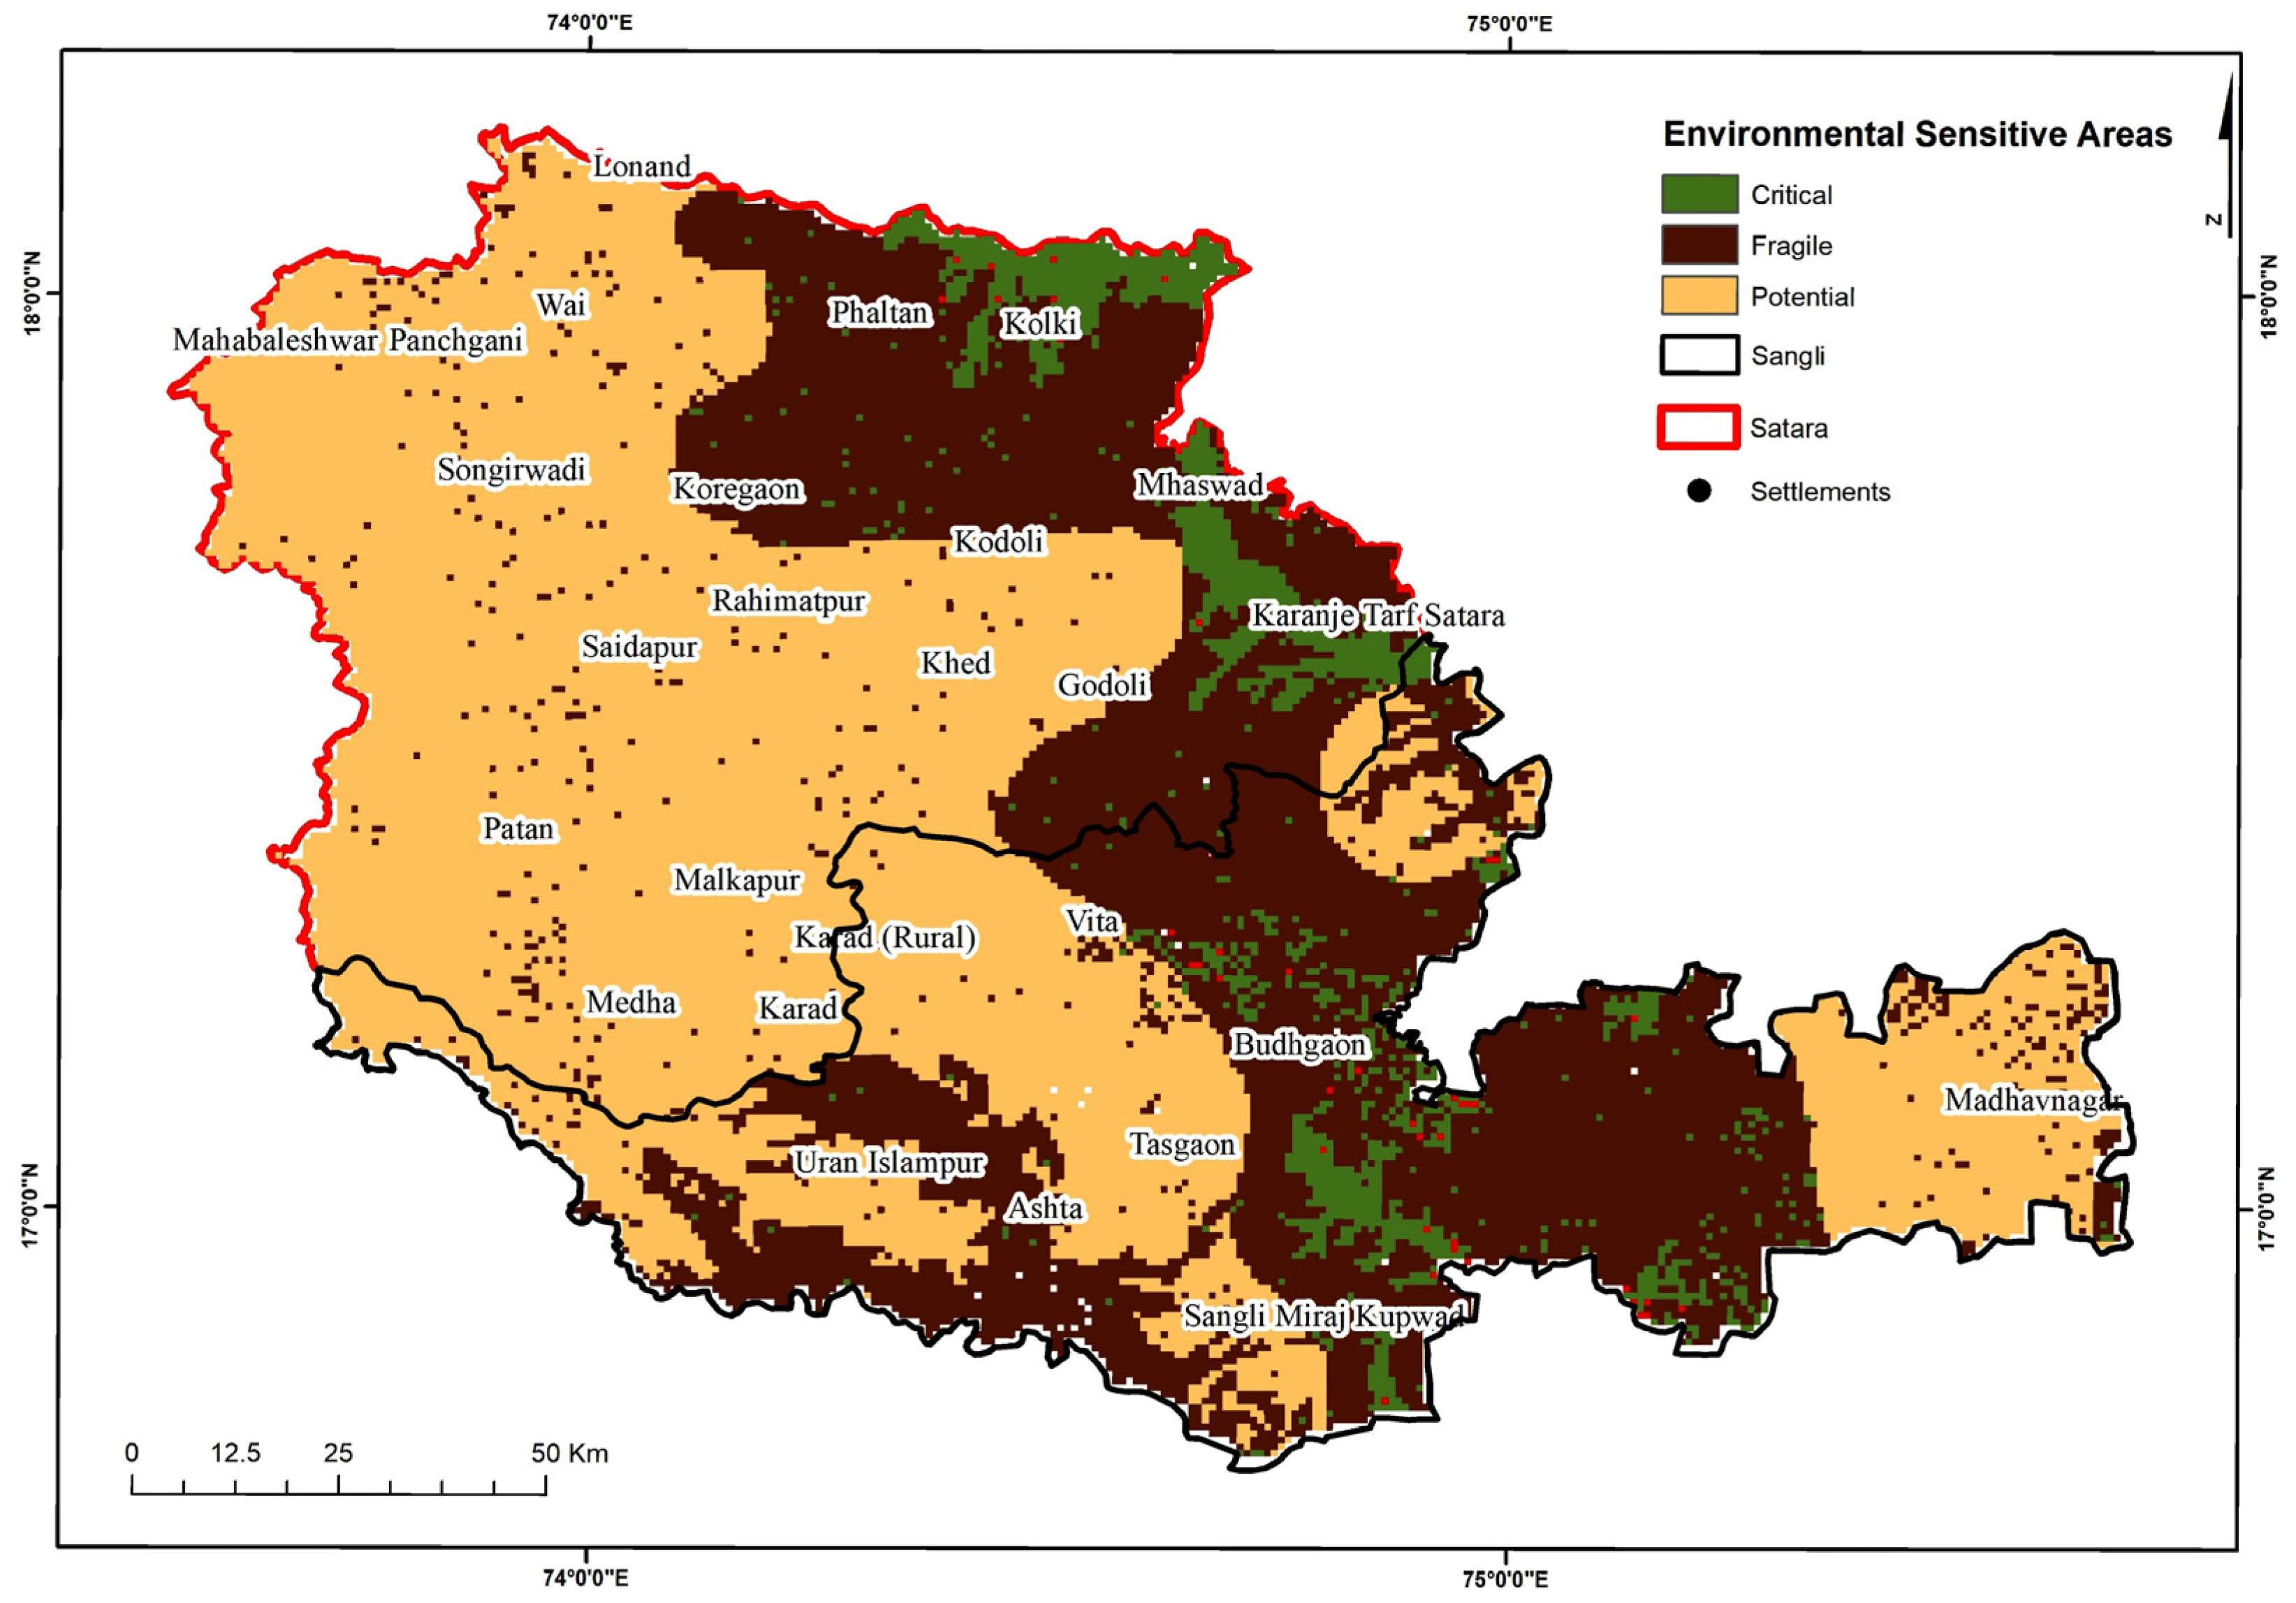
The ESA is a combined aspect of all four indicators (SQI, CQI, VQI, and SEQI) which is presented in Figure 13 and Table 7. The majority of the areas are classified under the potential category of desertification (60.32%), followed by fragile (27.87%) and critical (11.81%). The eastern part of the study area covering the Phaltan, Kolik, Mhaswad, and Karanje is majorly showing desertification, which is a fragile to critical condition. Some parts of the southern parts of the study area covering areas of Uran Islampur, Ashta, and Sangli Miraj Kupwad also showed the fragile to critical conditions of desertification. The area that is sensitive to desertification shows moderate to high soil quality, low to very low climate and vegetation quality, and high socio-economic quality. The majority of the study area falls within the potential category, indicating areas with moderate environmental sensitivity. These regions exhibit balanced soil, climate, vegetation, and socio-economic conditions, making them suitable for various land uses with moderate levels of management intervention. Fragile areas encompass approximately 27.87% of the study area and represent regions with heightened environmental sensitivity. These areas may exhibit compromised soil quality, climatic variability, degraded vegetation cover, or socio-economic vulnerabilities, rendering them susceptible to environmental degradation or disruption. Critical areas constitute a smaller portion of the study area, accounting for approximately 11.81%. These areas exhibit the highest level of environmental sensitivity, characterized by poor soil quality, extreme climatic conditions, degraded vegetation, and socio-economic challenges. Critical areas require urgent attention and targeted conservation efforts to mitigate environmental degradation and safeguard ecosystem integrity and human well-being.

4. Discussion

The geoinformatics-based MEDALUS model was utilized to analyze and map desertification risks in the Satara and Sangli districts of Maharashtra. These maps serve as crucial tools to guide conservation efforts, foster sustainable practices, and target rehabilitation projects in the region. Additionally, they enable policymakers to implement preventative measures, such as promoting drought-resistant crops. Moreover, the maps establish a baseline for monitoring desertification and evaluating the effectiveness of implemented strategies. By enhancing understanding of local desertification causes, this research facilitates targeted interventions, empowering all stakeholders to combat desertification and ensure the sustainability of the land.
The identification of areas at risk of desertification and the development of methods to stop or slow down desertification depends on the mapping of environmentally sensitive areas. Several studies have mapped environmentally sensitive areas for desertification through the integration of indices such as soil quality, climate quality, vegetation quality, and socio-economic quality using MEDALUS modeling [26,54]. Similar to this study, the previous studies provide valuable insights into the effectiveness of this approach globally and specifically in the Indian context. In a similar study by [55], a proxy global assessment of land degradation highlighted the importance of considering multiple indices, including SQI, CQI, VQI, and SEQI, to comprehensively evaluate desertification risk factors. The integration of these indices through MEDALUS modeling allowed for a more nuanced understanding of environmental sensitivity to desertification across diverse regions [54]. Kaliraj et al. (2024) also did a similar study for the semi-arid regions of southern India [26]. This aligns with the notion that a multidimensional approach is essential for effective land management and conservation efforts which is consistent with our research findings and conclusion.
Previous studies focused primarily on global and meso levels to predict the probable desertification zones, which are good for overall understanding [10,33,55,56]. Ref. [10] finds that Maharashtra encompasses the second highest area under desertification, i.e., 44.93% for the period 2011–2013. Ref. [56] conducted similar studies in Western Rajasthan and Gujrat. However, predicting and mapping environmentally sensitive areas for desertification at a micro-scale is crucial for targeted conservation efforts, resource allocation, and sustainable land management more effectively. This study is focused on predicting the areas of Satara and Sangli districts of Maharashtra sensitive to desertification and found that 11.81%, 27.87%, and 60.32% areas are in critical, fragile, and potential zones of desertification. It would help us mitigate desertification’s potential detrimental effects on the local ecosystems, biodiversity, and livelihoods. This would also be helpful in similar studies on other micro-scale areas.
The MEDALUS-based predicted desertification map using geoinformatics offers several merits. One advantage lies in its holistic approach, integrating various factors such as climate, soil, vegetation, and land use practices to assess desertification vulnerability accurately [57,58]. This comprehensive assessment of desertification vulnerability would aid policymakers and land managers in formulating targeted strategies for mitigation and adaptation. Incorporating qualitative and quantitative data, it identifies vulnerable areas and prioritizes intervention measures effectively, which enhances reliability and applicability across diverse landscapes, thereby serving as a valuable tool for assessing desertification risks [59]. Despite these merits, this model has also some limitations. One notable drawback is its reliance on input data, which may be scarce or outdated, particularly in developing regions where monitoring infrastructure is limited [60]. The Census (2011) data are also old, as the latest Census data have not been released by the Government of India. Outdated data may compromise desertification mapping accuracy, diminishing the model’s utility in guiding land management decisions. Moreover, the model’s complexity and technical requirements pose challenges, potentially hindering widespread adoption and limiting its effectiveness in informing policy and management actions.
Although the MEDALUS methodology provides a solid foundation for desertification vulnerability mapping, advancements in the field offer a broader toolkit. Remote sensing and GIS enable large-scale, objective assessments, while the Land Degradation Neutrality (LDN) framework promotes a holistic approach by integrating biophysical and socio-economic factors [61]. For intricate analyses involving uncertain data, advanced techniques like fuzzy logic and artificial neural networks (ANNs) can be highly effective [62,63,64]. Agent-based models (ABMs) further enhance understanding by simulating dynamic interactions between land users and ecological processes [65]. Additionally, participatory mapping incorporates valuable local knowledge and perspectives, enriching the vulnerability assessment.
The comparison of these studies underscores the consensus that integrating multiple quality indices through MEDALUS modeling enhances the accuracy and reliability of desertification vulnerability assessments of micro-regions with some merits and limitations as discussed. Through the integration of soil health indicators, climate variables, vegetation cover metrics, and socio-economic factors, researchers can develop holistic maps. These maps facilitate informed decision-making for implementing sustainable land management practices.

5. Conclusions

Based on the MEDALUS modeling, we find that a major part of the study area comes under the potential category (60.32%) distributed over the study area followed by fragile (27.87%) and critical (11.81%) desertification. Soil drainage, plant productivity, soil erosion, water holding capacity, soil temperature, and soil fertility are greatly affected by the texture of the soil. As the slope gradient varied from 0 to 5° in the study area, it did not enhance soil erosion rates thereby, leading to lower desertification.
The greater aridity index of the area is more vulnerable to desertification. In arid and semi-arid regions, higher wind speed is also responsible for both land degradation and desertification. Higher rain erosivity is responsible for higher desertification of the region. Areas with high population densities are affected by both soil erosion and water stress leading to land degradation and desertification. There is huge pressure of rapid population growth rate on natural resources which is further responsible for poverty. The higher illiteracy rates are also responsible for higher desertification as they hinder the understanding of sustainable land use. The lower work participation rate is also responsible for both land degradation and desertification as it creates economic conditions that incentivize unsustainable land use practices.
Therefore, the regions that are vulnerable to desertification exhibit moderate soil quality, low to very low climatic quality, very low vegetation quality, and moderate to low socio-economic quality. Additionally, areas where desertification is a significant concern, are characterized by the presence of other wastelands and current fallow lands with very low soil, climate, and vegetation quality, and low socio-economic quality.
Synthesizing the results from previous studies on identifying and mapping environmentally sensitive areas for desertification using integrated indices through MEDALUS modeling highlights the importance of a holistic approach to combat land degradation challenges worldwide and specifically in the Indian context. Continued research and collaboration are essential to refine methodologies and develop targeted interventions that promote environmental resilience and sustainable development.
Supplementary Materials

The following supporting information can be downloaded at: https://www.mdpi.com/article/10.3390/geohazards5020022/s1, Figure S1: Soil texture map the study area; Figure S2: Soil depth map; Figure S3: Soil salinity map of the study area; Figure S4: Parent material map of the study area (Source: NBSS&LUP); Figure S5: Average annual rainfall map of the study area; Figure S6: Average annual air temperature map of the study area; Figure S7: Average annual potential evapotranspiration (PET) map of the study area; Figure S8: Average wind speed map of the study area; Figure S9: Slope aspect map; Figure S10: Population density block wise 2011; Figure S11: Population Growth Rate (%) 2011; Figure S12: Illiteracy Rate (%) 2011 Block Wise; Figure S13: Work Participation Rate (%) 2011; Table S1: The soil Quality Index (SQI) indicator, their classes and assigned weights; Table S2: Area under different slope gradient; Table S3: Area under different soil drainage; Table S4: The Vegetation Quality Index (VQI) indicator, their classes and assigned weights; Table S5: The Climate Quality Index (CQI) indicator, their classes and assigned weights; Table S6: The Socio-Economic Quality Index (SEQI) indicator, their classes and assigned weights.

Author Contributions

Conceptualization, investigation, methodology, software, analysis, visualization, writing—original draft, review and editing, C.S.D., D. and B.R.P.; methodology, software, supervision, analysis, visualization, writing—review and editing, A.C.P. and N.K.; analysis, visualization, writing—review and editing, R.K. All authors have read and agreed to the published version of the manuscript.

Funding

This research received no external funding.

Institutional Review Board Statement

Not applicable.

Informed Consent Statement

Not applicable.

Data Availability Statement

In this study, publicly available datasets were analyzed and can be accessed from the sources given in Table 1.

Acknowledgments

Authors are thankful to all the organizations and institutes (USGS, CEDA Archive, W3S, Census India, ESDAC and NBSS and LUP) that have provided different datasets used in the present study.

Conflicts of Interest

The authors declare no conflicts of interest.

References

  1. Kar, A. Desertification: Causes and effects. In Exploring Natural Hazards; Chapman and Hall/CRC: Boca Raton, FL, USA, 2018; pp. 159–206. [Google Scholar]
  2. Hai, L.T.; Gobin, A.; Hens, L. Risk assessment of desertification for Binh Thuan Province, Vietnam. Hum. Ecol. Risk Assess. Int. J. 2013, 19, 1544–1556. [Google Scholar] [CrossRef]
  3. Núñez, M.; Muñoz, P.; Rieradevall, J. Inclusion of soil erosion impacts in life cycle assessment on a global scale: Application to energy crops in Spain. Int. J. Life Cycle Assess. 2012, 4, 1–13. [Google Scholar] [CrossRef]
  4. Cebecauer, T.; Hofierka, J. The consequences of land-cover changes on soil erosion distribution in Slovakia. Geomorphology 2008, 98, 187–198. [Google Scholar] [CrossRef]
  5. García-Ruiz, J.M. The effects of land uses on soil erosion in Spain: A review. Catena 2010, 81, 1–11. [Google Scholar] [CrossRef]
  6. Mythili, G.; Goedecke, J. Economics of land degradation in India. In Economics of land Degradation and Improvement—A Global Assessment for Sustainable Development; Springer: Cham, Switzerland, 2016; pp. 431–469. [Google Scholar]
  7. Reining, P. Handbook on Desertification Indicators Based on the Science Associations’ Nairobi Seminar on Desertification; American Association for the Advancement of Science: Washington, DC, USA, 1978. [Google Scholar]
  8. United Nations Convention to Combat Desertification (UNCCD). UN News Global Perspective Human Stories. 2019. Available online: https://news.un.org/en/story/2019/06/1040561 (accessed on 16 January 2024).
  9. State of India’s Environment (SoE). A Report Released by the Centre for Science and Environment; CSE: New Delhi, India, 2019. [Google Scholar]
  10. Space Application Center (SAC). Desertification and Land Degradation Atlas of India (Based on IRS AWiFS Data of 2011–13 and 2003–05); Space Applications Centre ISRO: Ahmedabad, India, 2016; p. 219. Available online: https://www.sac.gov.in/SACSITE/Desertification_Atlas_2016_SAC_ISRO.pdf (accessed on 19 March 2022).
  11. Space Application Center (SAC). Desertification and Land Degradation Atlas of India (Assessment and Analysis of Changes over 15 Years Based on Remote Sensing); Space Applications Centre ISRO: Ahmedabad, India, 2021. Available online: https://vedas.sac.gov.in/static/atlas/dsm/DLD_Atlas_SAC_2021.pdf (accessed on 22 March 2022).
  12. Sardo, I.K.; Besalatpour, A.A.; Bashari, H.; Shirani, H.; Yildiz, Ö. A geographic information system-based land use impact model to map areas with risk for land degradation: Wind erosion as an example. Land Degrad. Dev. 2020, 31, 1110–1124. [Google Scholar] [CrossRef]
  13. Arora, N.K. Impact of climate change on agriculture production and its sustainable solutions. Environ. Sustain. 2019, 2, 95–96. [Google Scholar] [CrossRef]
  14. Sparsha, S.; Parida, B.R. Vegetation browning trend progressively leading to forest degradation in Eastern Himalaya in response to climatic and anthropogenic drivers. Remote Sens. Appl. Soc. Environ. 2024, 35, 101209. [Google Scholar] [CrossRef]
  15. United Nations Convention to Combat Desertification (UNCCD). Water Scarcity and Desertification. 2023. Available online: https://catalogue.unccd.int/24_loose_leaf_Desertification_water.pdf (accessed on 12 February 2024).
  16. AbdelRahman, M.A.E. An overview of land degradation, desertification and sustainable land management using GIS and remote sensing applications. Rend. Fis. Acc. Lincei 2023, 34, 767–808. [Google Scholar] [CrossRef]
  17. Ward, P.J.; De Ruiter, M.C.; Mård, J.; Schröter, K.; Van Loon, A.; Veldkamp, T.; Von Uexkull, N.; Wanders, N.; AghaKouchak, A.; Arnbjerg-Nielsen, K.; et al. The Need to Integrate Flood and Drought Disaster Risk Reduction Strategies. Water Secur. 2020, 11, 100070. [Google Scholar] [CrossRef]
  18. Pal, S.C.; Chatterjee, U.; Chakrabortty, R.; Roy, P.; Chowdhuri, I.; Saha, A.; Towfiqul Islam, A.R.M.; Alam, E.; Islam, M.K. Anthropogenic Drivers Induced Desertification under Changing Climate: Issues, Policy Interventions, and the Way Forward. Prog. Disaster Sci. 2023, 20, 100303. [Google Scholar] [CrossRef]
  19. Gavrilescu, M. Water, Soil, and Plants Interactions in a Threatened Environment. Water 2021, 13, 2746. [Google Scholar] [CrossRef]
  20. Saha, A.; Sekharan, S.; Manna, U. Superabsorbent Hydrogel (SAH) as a Soil Amendment for Drought Management: A Review. Soil Tillage Res. 2020, 204, 104736. [Google Scholar] [CrossRef]
  21. Lal, R. Restoring soil quality to mitigate soil degradation. Sustainability 2015, 7, 5875–5895. [Google Scholar] [CrossRef]
  22. Sepehr, A.; Hassanli, A.M.; Ekhtesasi, M.R.; Jamali, J.B. Quantitative assessment of desertification in south of Iran using MEDALUS method. Environ. Monit. Assess. 2007, 134, 243–254. [Google Scholar] [CrossRef] [PubMed]
  23. Verstraete, M.M.; Schwartz, M.D. Climate, soil and land use based models of desertification. Environ. Monit. Assess. 1991, 17, 47–60. [Google Scholar]
  24. Giri, C.P. Remote sensing of land use and land cover. Princip. Applic. 2016, 6, 9607–9612. [Google Scholar]
  25. Karamesouti, M.; Panagos, P.; Kosmas, C. Model-based spatio-temporal analysis of land desertification risk in Greece. Catena 2018, 167, 266–275. [Google Scholar] [CrossRef]
  26. Kaliraj, S.; Chandrasekar, N.; Parmar, M.; Rejith, R.G.; Dharumarajan, S.; Lalitha, M.; Chandramohan, K. Assessment of land degradation vulnerability in the semi-arid region of Southern India using GIS-based MEDALUS approach. In Remote Sensing of Soils; Elsevier: Amsterdam, The Netherlands, 2024; pp. 591–608. [Google Scholar]
  27. Dave, V.A.; Pandya, M.; Ghosh, R. An Assessment of the Desertification Vulnerability based on MEDALUS model. In Proceedings of the 2019 International Conference on Intelligent Computing and Remote Sensing (ICICRS), Bhubaneswar, India, 19–20 July 2019; pp. 1–6. [Google Scholar]
  28. Shao, W.; Wang, Q.; Guan, Q.; Zhang, J.; Yang, X.; Liu, Z. Environmental sensitivity assessment of land desertification in the Hexi Corridor, China. Catena 2023, 220, 106728. [Google Scholar] [CrossRef]
  29. Elwan, A.; Khalil, M. Quantitative assessment of desertification in Bahariya oasis environment, western desert, Egypt. J. Product. Dev. 2018, 23, 505–533. [Google Scholar] [CrossRef]
  30. Ogbue, C.; Igboeli, E.; Ajaero, C.; Ochege, F.U.; Yahaya, I.I.; Yeneayehu, F.; You, Y.; Wang, Y. Remote sensing analysis of desert sensitive areas using MEDALUS model and GIS in the Niger River Basin. Ecol. Indic. 2024, 158, 111404. [Google Scholar]
  31. Gholap, M.V.S.; Nalawade, D.B. Land Use Land Cover Change Detection of Satara District (MS). Using Geospatial Techniques. Change 2001, 2011, 2020. [Google Scholar]
  32. Zende, A.M.; Nagarajan, R.; Atal, K.R. Rainfall Trend in Semi arid region–Yerala river basin of Western Maharashtra. India. Int. J. Adv. Technol. 2012, 3, 137–145. [Google Scholar]
  33. Kulkarni, S.S.; Wardlow, B.D.; Bayissa, Y.A.; Tadesse, T.; Svoboda, M.D.; Gedam, S.S. Developing a Remote Sensing-Based Combined Drought Indicator Approach for Agricultural Drought Monitoring over Marathwada, India. Remote Sens. 2020, 12, 2091. [Google Scholar] [CrossRef]
  34. Kosmas, C.; Ferrara, A.M.S.; Briasouli, H.; Imeson, A. Methodology for mapping environmentally sensitive areas (ESAs) to desertification. In The Medalus Project: Mediterranean Desertification and Land Use. Manual on Key Indicators of Desertification and Mapping Environmentally Sensitive Areas to Desertification; Kosmas, C., Kirkby, M., Geeson, N., Eds.; European Union: Luxembourg, 1999; Volume 18882, pp. 31–47. [Google Scholar]
  35. Afifi, A.A.; Gad, A. Assessment and mapping areas affected by soil erosion and desertification in the north coastal part of Egypt. Int. J. Water Resour. Arid. Environ. 2011, 1, 83–91. [Google Scholar]
  36. Darwish, T.; Zdruli, P.; Saliba, R.; Awad, M.; Shaban, A.; Faour, G. Vulnerability to desertification in Lebanon based on geo-information and socioeconomic conditions. J. Environ. Sci. Eng. B 2012, 1, 851. [Google Scholar]
  37. Ait Lamqadem, A.; Pradhan, B.; Saber, H.; Rahimi, A. Desertification sensitivity analysis using MEDALUS model and GIS: A case study of the Oases of Middle Draa Valley, Morocco. Sensors 2018, 18, 2230. [Google Scholar] [CrossRef] [PubMed]
  38. Hou, J.; Wang, H.; Fu, B.; Zhu, L.; Wang, Y.; Li, Z. Effects of plant diversity on soil erosion for different vegetation patterns. Catena 2016, 147, 632–637. [Google Scholar] [CrossRef]
  39. Rouse, J.W.; Haas, R.H.; Schell, J.A.; Deering, D.W. Monitoring Vegetation Systems in the Great Plains with ERTS. NASA Spec. Publ. 1974, 351, 309. [Google Scholar]
  40. Bishop, C.M. Pattern recognition and machine learning. Antimicrob. Agents Chemother. 2014, 58, 7250–7257. [Google Scholar] [CrossRef]
  41. UNEP (United Nations Environmental Programme). The World Atlas of Desertification; Middleton, N., Thomas, D.S.G., Arnold, E., Eds.; Great Britain: Nairobi, Kenya, 1997; ISBN 0340691662. [Google Scholar]
  42. Arnoldus, H.M.J. An approximation of the rainfall factor in the Universal Soil Loss Equation. In Assessment of Erosion; De Boodt, M., Gabriels, D., Eds.; John Wiley & Sons: Chichister, UK, 1980; pp. 127–132. [Google Scholar]
  43. Pienaru, A.; Iancu, P.; Cazanescu, S. Desertification and its effect on environment agricultural production in Romania. Ann. Food Sci. Technol. 2009, 10, 624–629. [Google Scholar]
  44. Measho, S.; Li, F.; Pellikka, P.; Tian, C.; Hirwa, H.; Xu, N.; Qiao, Y.; Khasanov, S.; Kulmatov, R.; Chen, G. Soil Salinity Variations and Associated Implications for Agriculture and Land Resources Development Using Remote Sensing Datasets in Central Asia. Remote Sens. 2022, 14, 2501. [Google Scholar] [CrossRef]
  45. Soil Formation, Soil Nutrition Management Faculty for Maui County. Available online: https://www.ctahr.hawaii.edu/mauisoil/a_factor_form.aspx#:~:text=Basalt%20rock%20is%20finely%20textured,fertile%20when%20not%20highly%20weathered (accessed on 3 March 2024).
  46. Agricultural University of Athens (AUA). Description of Indicators Defined in the Various Study Sites; DESIRE Report Series; Report Number 66. 2010. Available online: http://www.desire-his.eu/index.php/en/download-documents/doc-download/161-wp21-indicators-in-the-study-sites (accessed on 19 June 2023).
  47. Agricultural University of Athens (AUA). Using Indicators for Identifying Best Land Management Practices for Combating Desertification; DESIRE Report Series, Report Number 94. 2012. Available online: https://www.desire-his.eu/index.php/en/download-documents/doc-download/228-wp22-desertification-risk-assessment-tool-install-instructions (accessed on 20 June 2023).
  48. Liu, Z.; Ma, L.; Liu, T.; Qiao, Z.; Chen, Y. Influence of Key Climate Factors on Desertification in Inner Mongolia. Atmosphere 2023, 14, 1404. [Google Scholar] [CrossRef]
  49. Mihi, A.; Ghazela, R.; Wissal, D. Mapping Potential Desertification-Prone Areas in North-Eastern Algeria Using Logistic Regression Model, GIS, and Remote Sensing Techniques. Environ. Earth Sci. 2022, 81, 385. [Google Scholar] [CrossRef] [PubMed]
  50. Deniz, A.; Toros, H.; Incecik, S. Spatial variations of climate indices in Turkey. Int. J. Climatol. 2011, 31, 394–403. [Google Scholar] [CrossRef]
  51. Gebremedhin, M.A.; Kahsay, G.H.; Fanta, H.G. Assessment of spatial distribution of aridity indices in Raya valley, northern Ethiopia. Appl. Water Sci. 2018, 8, 217. [Google Scholar] [CrossRef]
  52. Salunkhe, S.S.; Bera, A.K.; Rao, S.S.; Venkataraman, V.R.; Raj, U.; Murthy, Y.V.N.K. Evaluation of Indicators for Desertification Risk Assessment in Part of Thar Desert Region of Rajasthan Using Geospatial Techniques. J. Earth Syst. Sci. 2018, 127, 116. [Google Scholar] [CrossRef]
  53. Sterk, G.; Stoorvogel, J.J. Desertification–Scientific Versus Political Realities. Land 2020, 9, 156. [Google Scholar] [CrossRef]
  54. Kalyan, S.; Sharma, D.; Sharma, A. Spatio-temporal variation in desert vulnerability using desertification index over the Banas River Basin in Rajasthan, India. Arab. J. Geosci. 2021, 14, 54. [Google Scholar] [CrossRef]
  55. Bai, Z.G.; Dent, D.L.; Olsson, L.; Schaepman, M.E. Proxy global assessment of land degradation. Soil Use Manag. 2008, 24, 223–234. [Google Scholar] [CrossRef]
  56. Dave, V.A.; Pandya, M.; Ghosh, R. Assessment of Desertification Vulnerability Using MEDALUS Model: A Case Study from Gujarat State (India). Environ. Monit. Assess. 2019, 192, 116. [Google Scholar]
  57. Santini, M.; Caccamo, G.; Laurenti, A.; Noce, S.; Valentini, R. A multi-component GIS framework for desertification risk assessment by an integrated index. Appl. Geogr. 2010, 30, 394–415. [Google Scholar] [CrossRef]
  58. Jafari, R.; Abedi, M. Remote sensing-based biological and nonbiological indices for evaluating desertification in Iran: Image versus field indices. Land Degrad. Dev. 2021, 32, 2805–2822. [Google Scholar] [CrossRef]
  59. Gad, A. Qualitative and quantitative assessment of land degradation and desertification in egypt based on satellite remote sensing: Urbanization, salinization and wind erosion. In Environmental Remote Sensing in Egypt; New York, NY, USA, 2020; pp. 443–497. [Google Scholar]
  60. Enne, G.; Zanolla, C.; Peter, D. Desertification in Europe: Mitigation Strategies, Land-Use Planning. In Proceedings of the Advanced Study Course, Alghero, Italy, 31 May–10 June 1999. [Google Scholar]
  61. Kgaphola, M.J.; Ramoelo, A.; Odindi, J.; Mwenge Kahinda, J.M.; Seetal, A.; Musvoto, C. Social–ecological system understanding of land degradation in response to land use and cover changes in the greater Sekhukhune district municipality. Sustainability 2023, 15, 3850. [Google Scholar] [CrossRef]
  62. Yaojie, Y.; Min, L.; Lin, W.; A-Xing, Z. A data-mining-based approach for aeolian desertification susceptibility assessment: A case-study from Northern China. Land Degrad. Dev. 2019, 30, 1968–1983. [Google Scholar] [CrossRef]
  63. Safli, E.; Pacci, S.; Dengiz, O. Determination of Desertification Risk for Pasture Areas under Semi-Arid Ecological Conditions Using DIS4ME Model and Estimation with Artificial Neural Network. In Proceedings of the International Symposium on Soil Science and Plant Nutrition, Samsun, Turkey, 2–3 December 2022. [Google Scholar]
  64. Lu, A.; Tian, P.; Mu, X.; Zhao, G.; Feng, Q.; Guo, J.; Xu, W. Fuzzy logic modeling of land degradation in a Loess Plateau watershed, China. Remote Sens. 2022, 14, 4779. [Google Scholar] [CrossRef]
  65. Shin, H.; An, Y. How Agent-Based Models Offer Insights on Strategies to Mitigate Soil Degradation in North Korea: A Conversation with Dr. Yoosoon An. Review of Artificial Societies and Social Simulation. 25 October 2023. Available online: https://rofasss.org/2023/10/25/Interview-Yoosoon-An (accessed on 12 January 2024).
Figure 1. Study area—Satara and Sangli districts of Maharashtra as represented by false color composite (FCC) image (Source: Landsat-8). This represents India, the state Maharashtra and FCC of the study area.
Geohazards 05 00022 g001
Figure 2. Flowchart of methodology adopted in this study.
Geohazards 05 00022 g002
Figure 3. Slope gradient in degree (a) and soil drainage (b) maps.
Geohazards 05 00022 g003
Figure 4. Soil erosion map of the study area.
Geohazards 05 00022 g004
Figure 5. Soil quality index map of the study area.
Geohazards 05 00022 g005
Figure 6. LULC classification of the study area.
Geohazards 05 00022 g006
Figure 7. NDVI (a) and vegetation cover (b) of the study area.
Geohazards 05 00022 g007
Figure 8. Vegetation quality index (VQI) of the study area.
Geohazards 05 00022 g008
Figure 9. Aridity index map of the study area.
Geohazards 05 00022 g009
Figure 10. Rain erosivity map of the study area.
Geohazards 05 00022 g010
Figure 11. Climate quality index (CQI) map of the study area.
Geohazards 05 00022 g011
Figure 12. Socio-economic quality index (SEQI) map of the study area.
Geohazards 05 00022 g012
Figure 13. Environmental sensitive areas map of the study area.
Geohazards 05 00022 g013
Table 1. Data used in the study and its resolution.
Data UsedResolutionsPurposeSource
Landsat-8 (OLI)30 m, acquired on 4 April 2019 LULC mappingUSGS
SRTM DEM90 m SlopeUSGS
Rainfall (TRMM 3B42)0.25 × 0.25°, daily (2019)To derive CQIGiovanni
PET from CRU TS4.00.5 × 0.5°, monthly (2019)To derive CQICEDA Archive
Wind speed at 10 m height (m/s)point-based, daily (2019)To derive CQIW3S
Air temperaturePoint-based, daily (2019)To derive CQIW3S
Census 2011To derive SEQICensus 2011
Soil1:250 KTo derive SQIESDAC and NBSS and LUP
Table 2. Soil depth categories with area in percentage.
ClassSoil DepthArea (%)
1.Deep17.35
2.Very Deep8.31
3.Moderately Deep13.86
4.Moderately Shallow2.51
5.Shallow20.15
6.Very Shallow26.54
7.Extremely Shallow8.75
Table 3. Area percentage of each LULC class.
ClassLULCArea (%)
1.Waterbody4.99
2.Barren land13.62
3.Scrubland10.32
4.Fallow land25.00
5.Built-up 12.99
6.Forest8.62
7.Cropland24.46
Table 4. Vegetation quality area percentage.
ClassVegetation Quality Area (%)
1.Very Low Quality2.49
2.Low Quality48.80
3.Moderate Quality25.43
4.High Quality23.26
Table 5. Area percentage of climate quality.
ClassCQIArea (%)
1.Very Low34.73
2.Low33.20
3.Moderate32.07
Table 6. Socio-economic quality area percentage.
ClassSEQIArea (%)
1.Very Low13.22
2.Low35.50
3.Moderate30.99
4.High20.29
Table 7. Environmental sensitive area %.
ClassESAArea (%)
1.Potential59.32
2.Fragile27.87
3.Critical12.81
Disclaimer/Publisher’s Note: The statements, opinions and data contained in all publications are solely those of the individual author(s) and contributor(s) and not of MDPI and/or the editor(s). MDPI and/or the editor(s) disclaim responsibility for any injury to people or property resulting from any ideas, methods, instructions or products referred to in the content.