Communication

Quantitatively Mapping Discolored Seawater around Submarine Volcanoes Using Satellite GCOM-C SGLI Data: A Case Study of the Krakatau Eruption in Indonesia in December 2018

Graduate School of Advanced Science and Engineering, Hiroshima University, Higashi-Hiroshima 739-8527, Japan
*
Author to whom correspondence should be addressed.
GeoHazards 2023, 4(2), 107-120; https://doi.org/10.3390/geohazards4020007
Submission received: 24 November 2022 / Revised: 3 March 2023 / Accepted: 29 March 2023 / Published: 3 April 2023

Abstract

:
The final goal of this paper is to contribute to the difficult task of understanding and forecasting submarine volcanic eruption activity by proposing a method to quantify discolored water. To achieve this purpose, we quantitatively analyzed the discolored seawater seen before and after the eruption of the marine environment around the Indonesian submarine volcano “Anak Krakatau”, which erupted at the end of December 2018, from the viewpoint of the “dominant wavelength”. The atmospherically corrected COM-C SGLI data for 17 periods from the eruption from October 2018 to March 2019 were used. As a result, the following three main items were found. First, the average ± standard deviation of the entire dominant wavelength was 497 nm ± 2 nm before the eruption and 515 nm ± 35 nm after the eruption. Second, the discolored water area around the island derived from SGLI was detected from the contour line with dominant wavelengths of 500 nm and 560 nm. Third, the size of a dominant wavelength of 500 nm or more in the discolored water areas changed in a complicated manner within the range of almost 0 to 35 km2. The area of the dominant wavelength of 500 nm or more slightly increased just before the eruption. Finally, it was proven that the “dominant wavelength” from the SGLI proposed in this paper can be a very effective tool in understanding or predicting submarine volcanic activity.

1. Introduction

Submarine volcanoes have frequently erupted in recent years, such as Indonesia’s “Anak Krakatau Island” in 2018 [1], New Zealand’s “White Island” in 2019 [2], and Japan’s “Nishinoshima” [3] and “Fukutoku Okanoba” in 2021 [4]. In particular, the eruption of “Anak Krakatau Island” on 22 December 2018 caused a tsunami due to the collapse of the mountain body [5], resulting in the loss of many lives. In this way, the explosion of a submarine volcano often affects human life and the flight of airplanes; thus, eruption forecasting is an essential research theme.
Some volcanic activity forecast methods include using volcanic earthquake data and volcanic gas data [6]. However, this activity is difficult to predict even with these methods. On the other hand, for submarine volcanoes, it has been pointed out that there is a possibility to forecast using the “discoloration phenomenon” that occurs in seawater before and after the eruption of the volcano [7,8]. Although the relationship between the chemical composition of discolored water and volcanic activity has been known for a long time, research on the discolored water around submarine volcanoes is globally scarce. This is because the survey of submarine volcanoes itself is dangerous and often difficult since they are far from land. Under such circumstances, satellite remote sensing for the noncontact observation of submarine volcanoes is very helpful. In research on volcanically discolored water using satellite remote sensing, reflectance pattern analysis and visual interpretation using high-resolution satellites have been performed [9,10,11]. However, quantification related to the chemical composition and area estimation of discolored water has not been performed. Moreover, little research has been conducted on chemicals.
Discolored seawater around submarine volcanoes is presumably caused by the composition ratio of chemical substances based on iron (Fe), aluminum (Al), and silicon (Si) [7,8]. For example, when the proportion of Fe is high, it is yellow or brown, and when it is high in Al or Si, it is light blue or white. Conventionally, there are few studies on the color reaction of discolored seawater from submarine volcanoes, but there are relatively many studies on the chromatic analysis of water from hot springs. For example, Ohsawa et al. [12] and Onda et al. [13] studied typical hot spring water coloration mechanisms in Japan. In their study, the blue–green color reaction of hot spring water and crater lakes was explained with the “dominant wavelength” using the chromaticity diagram of the XYZ color system [14]. Therefore, such a research approach from a chromatic point of view is considered a critical viewpoint in quantifying the composition of discolored seawater.
On the other hand, typical global satellites that measure the sea color around submarine volcanoes include Terra/Aqua MODIS (Moderate Resolution Imaging Spectroradiometer), Sentinel-3 OLCI (Ocean and Land Color Imager), and GCOM-C SGLI (Global Change Observation Mission—Climate, The Second-Generation Global Imager). The SGLI sensor [15] launched by Japan in December 2017 has the highest resolution (250 m) and an observation cycle of about 2 days. This satellite is one that contains ocean color sensors. In the conventional satellite analysis of discolored water, satellites with a period of 10 days or more, called Terra ASTER, AVNIR-2, and Sentinel-2, are used [9,10,11]. Therefore, shorter-period analysis is required for forecasting.
Against this background, the purpose of this paper was to develop a method for quantitatively mapping the affected area of seawater. The authors recently estimated the chemical composition of discolored water using an SGLI sensor in Nishinoshima Island, Japan, as a study area [16]. As a result, a method for estimating chemical substances, which are indicators of eruptive activity from x (red) in the XYZ color system, was proposed. However, this method only captures reddish color changes and is a rudimentary method from the viewpoint of color information based on 2D chromaticity coordinates. Therefore, in this research, we focus on the “dominant wavelength” that directly corresponds to the composition of discolored seawater. We also calculate the “dominant wavelength” from the spectral reflectance information obtained from the satellite and estimate the discolored seawater area using that dominant wavelength as the threshold.

2. Materials and Methods
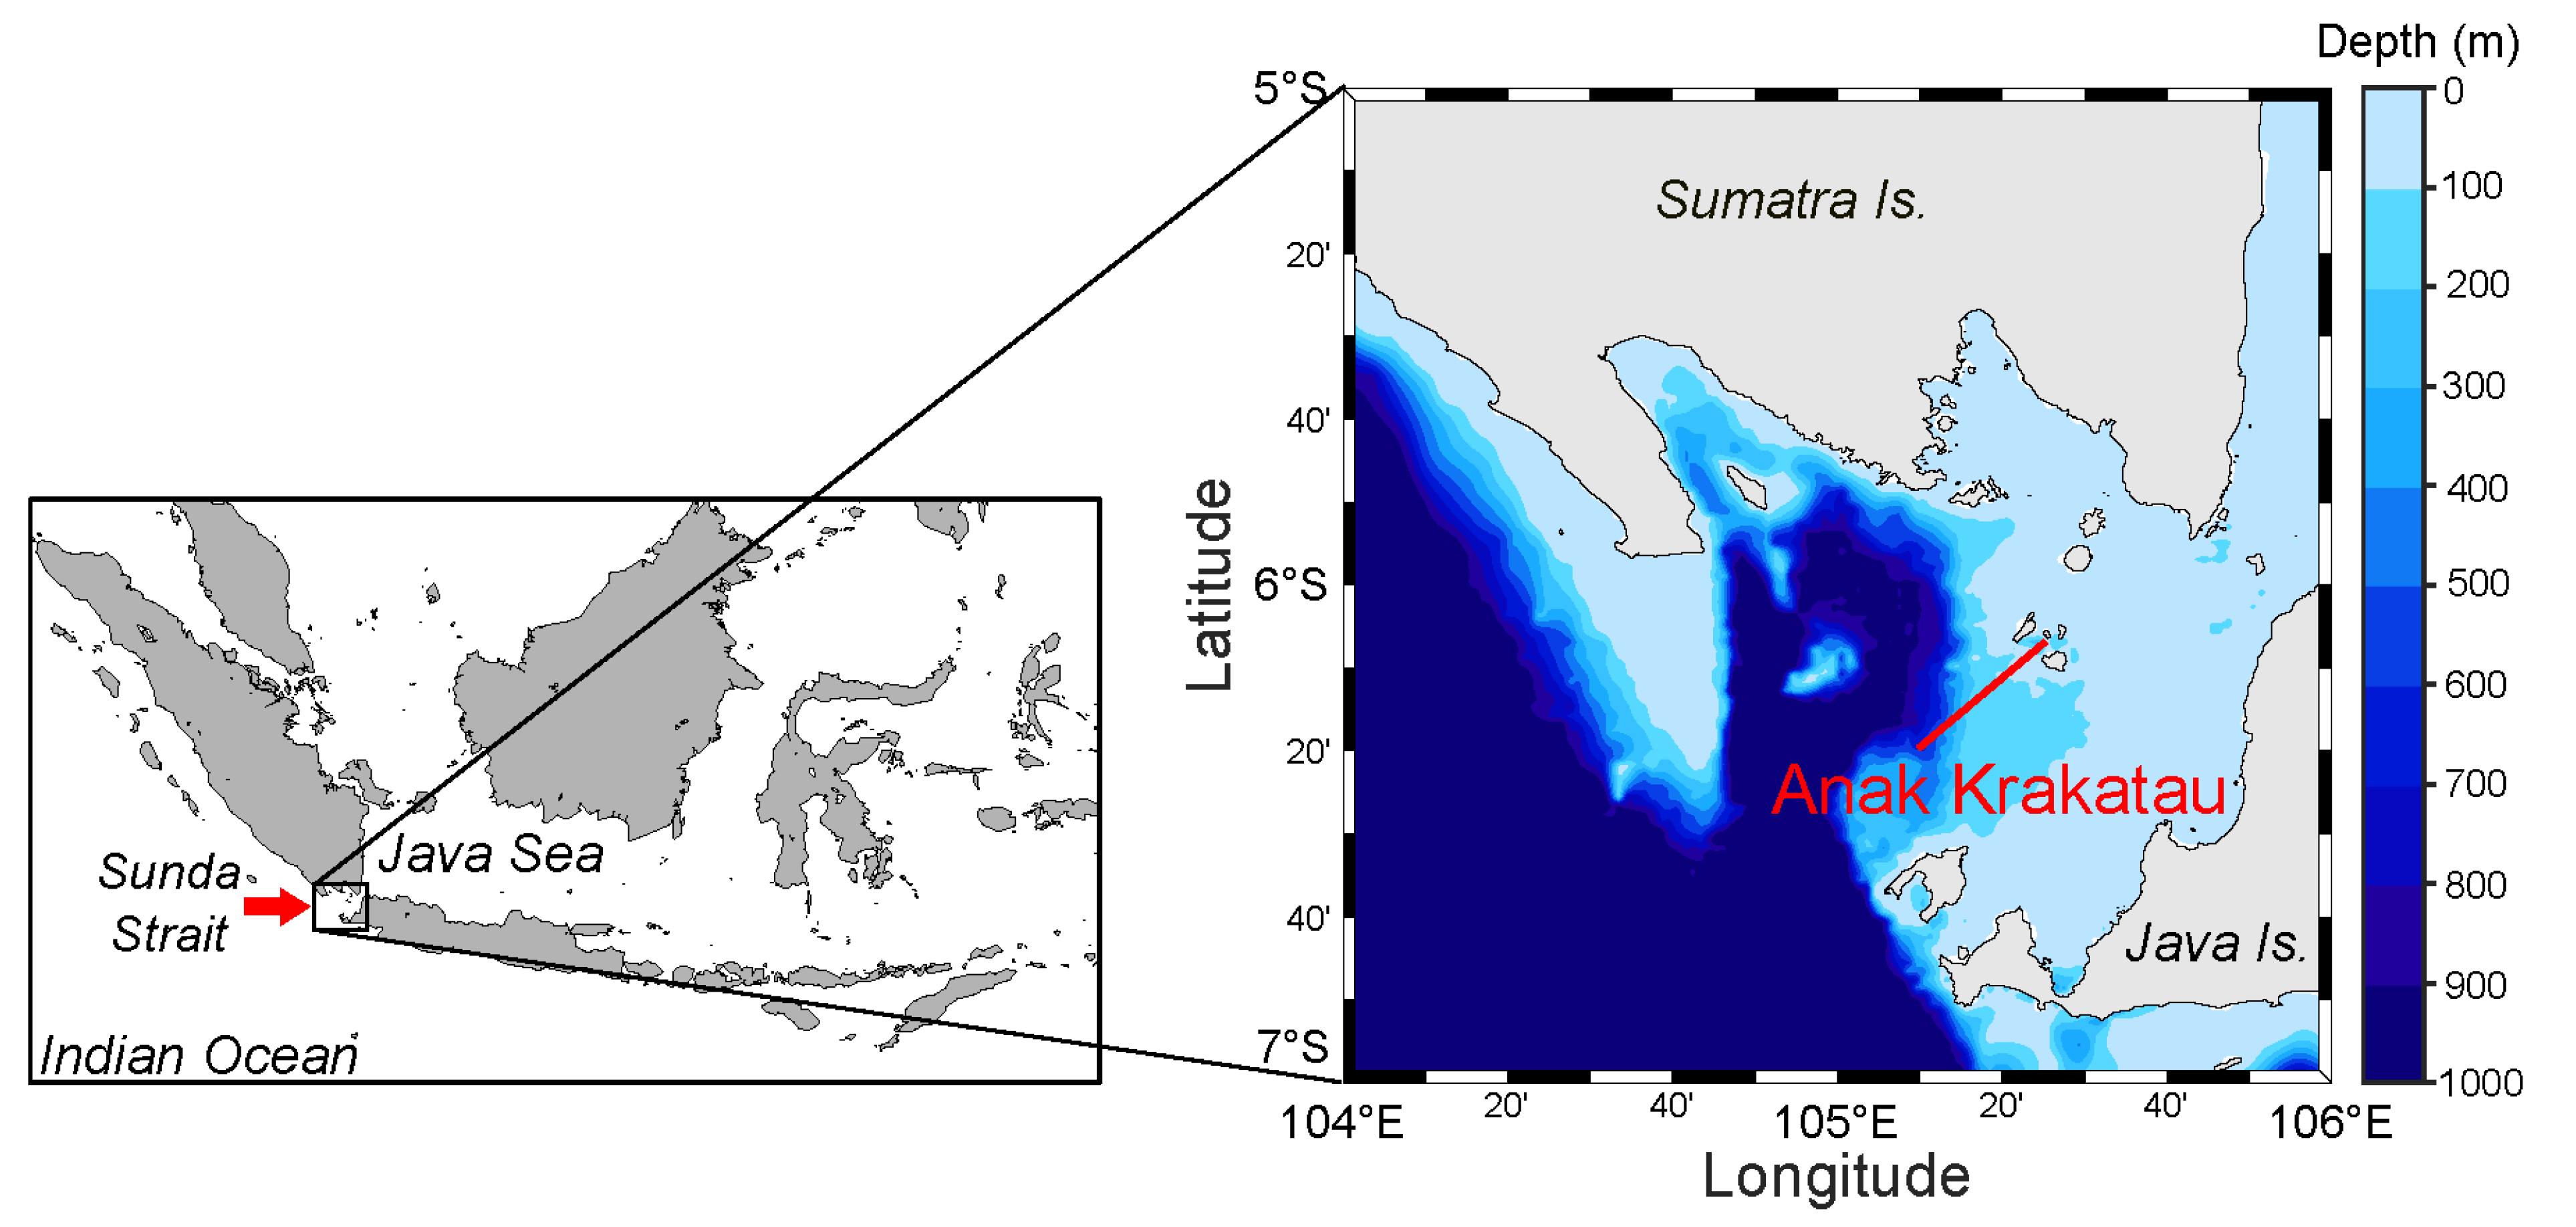
2.1. Study Area

As shown in Figure 1, the study area of Krakatau is a volcano located in the middle of the Sunda Strait between the Indonesian islands of Java and Sumatra, at the latitude of 6°6′2″ S and longitude of 105°25′29″ E. The water depth around the island is about 200–300 m [5]. This island is a relatively new volcanic island formed by the massive eruption of 1983 [17]. An eruption occurred on 22 December 2018 (around 14:00 UTC), accompanied by a tsunami [18] caused by the collapse of the mountain mass [5] from the south-western slope of the island. This tsunami caused a major disaster in the coastal area of Krakatau [19]. Novellino et al. [20] analyzed the area change derived from the coastline extraction before and after the December 2018 eruption using Sentinel-2 satellite data. The island area increased from about 2.8 km2 on 16 November 2018 to about 3.1 km2 on 3 April 2019 due to intense explosive activity after the December 2019 eruption [20]. One of the main reasons for the area’s expansion is the extension of the eastern shoreline by Surtseyan pyroclastic deposits draping the eastern flank [21].

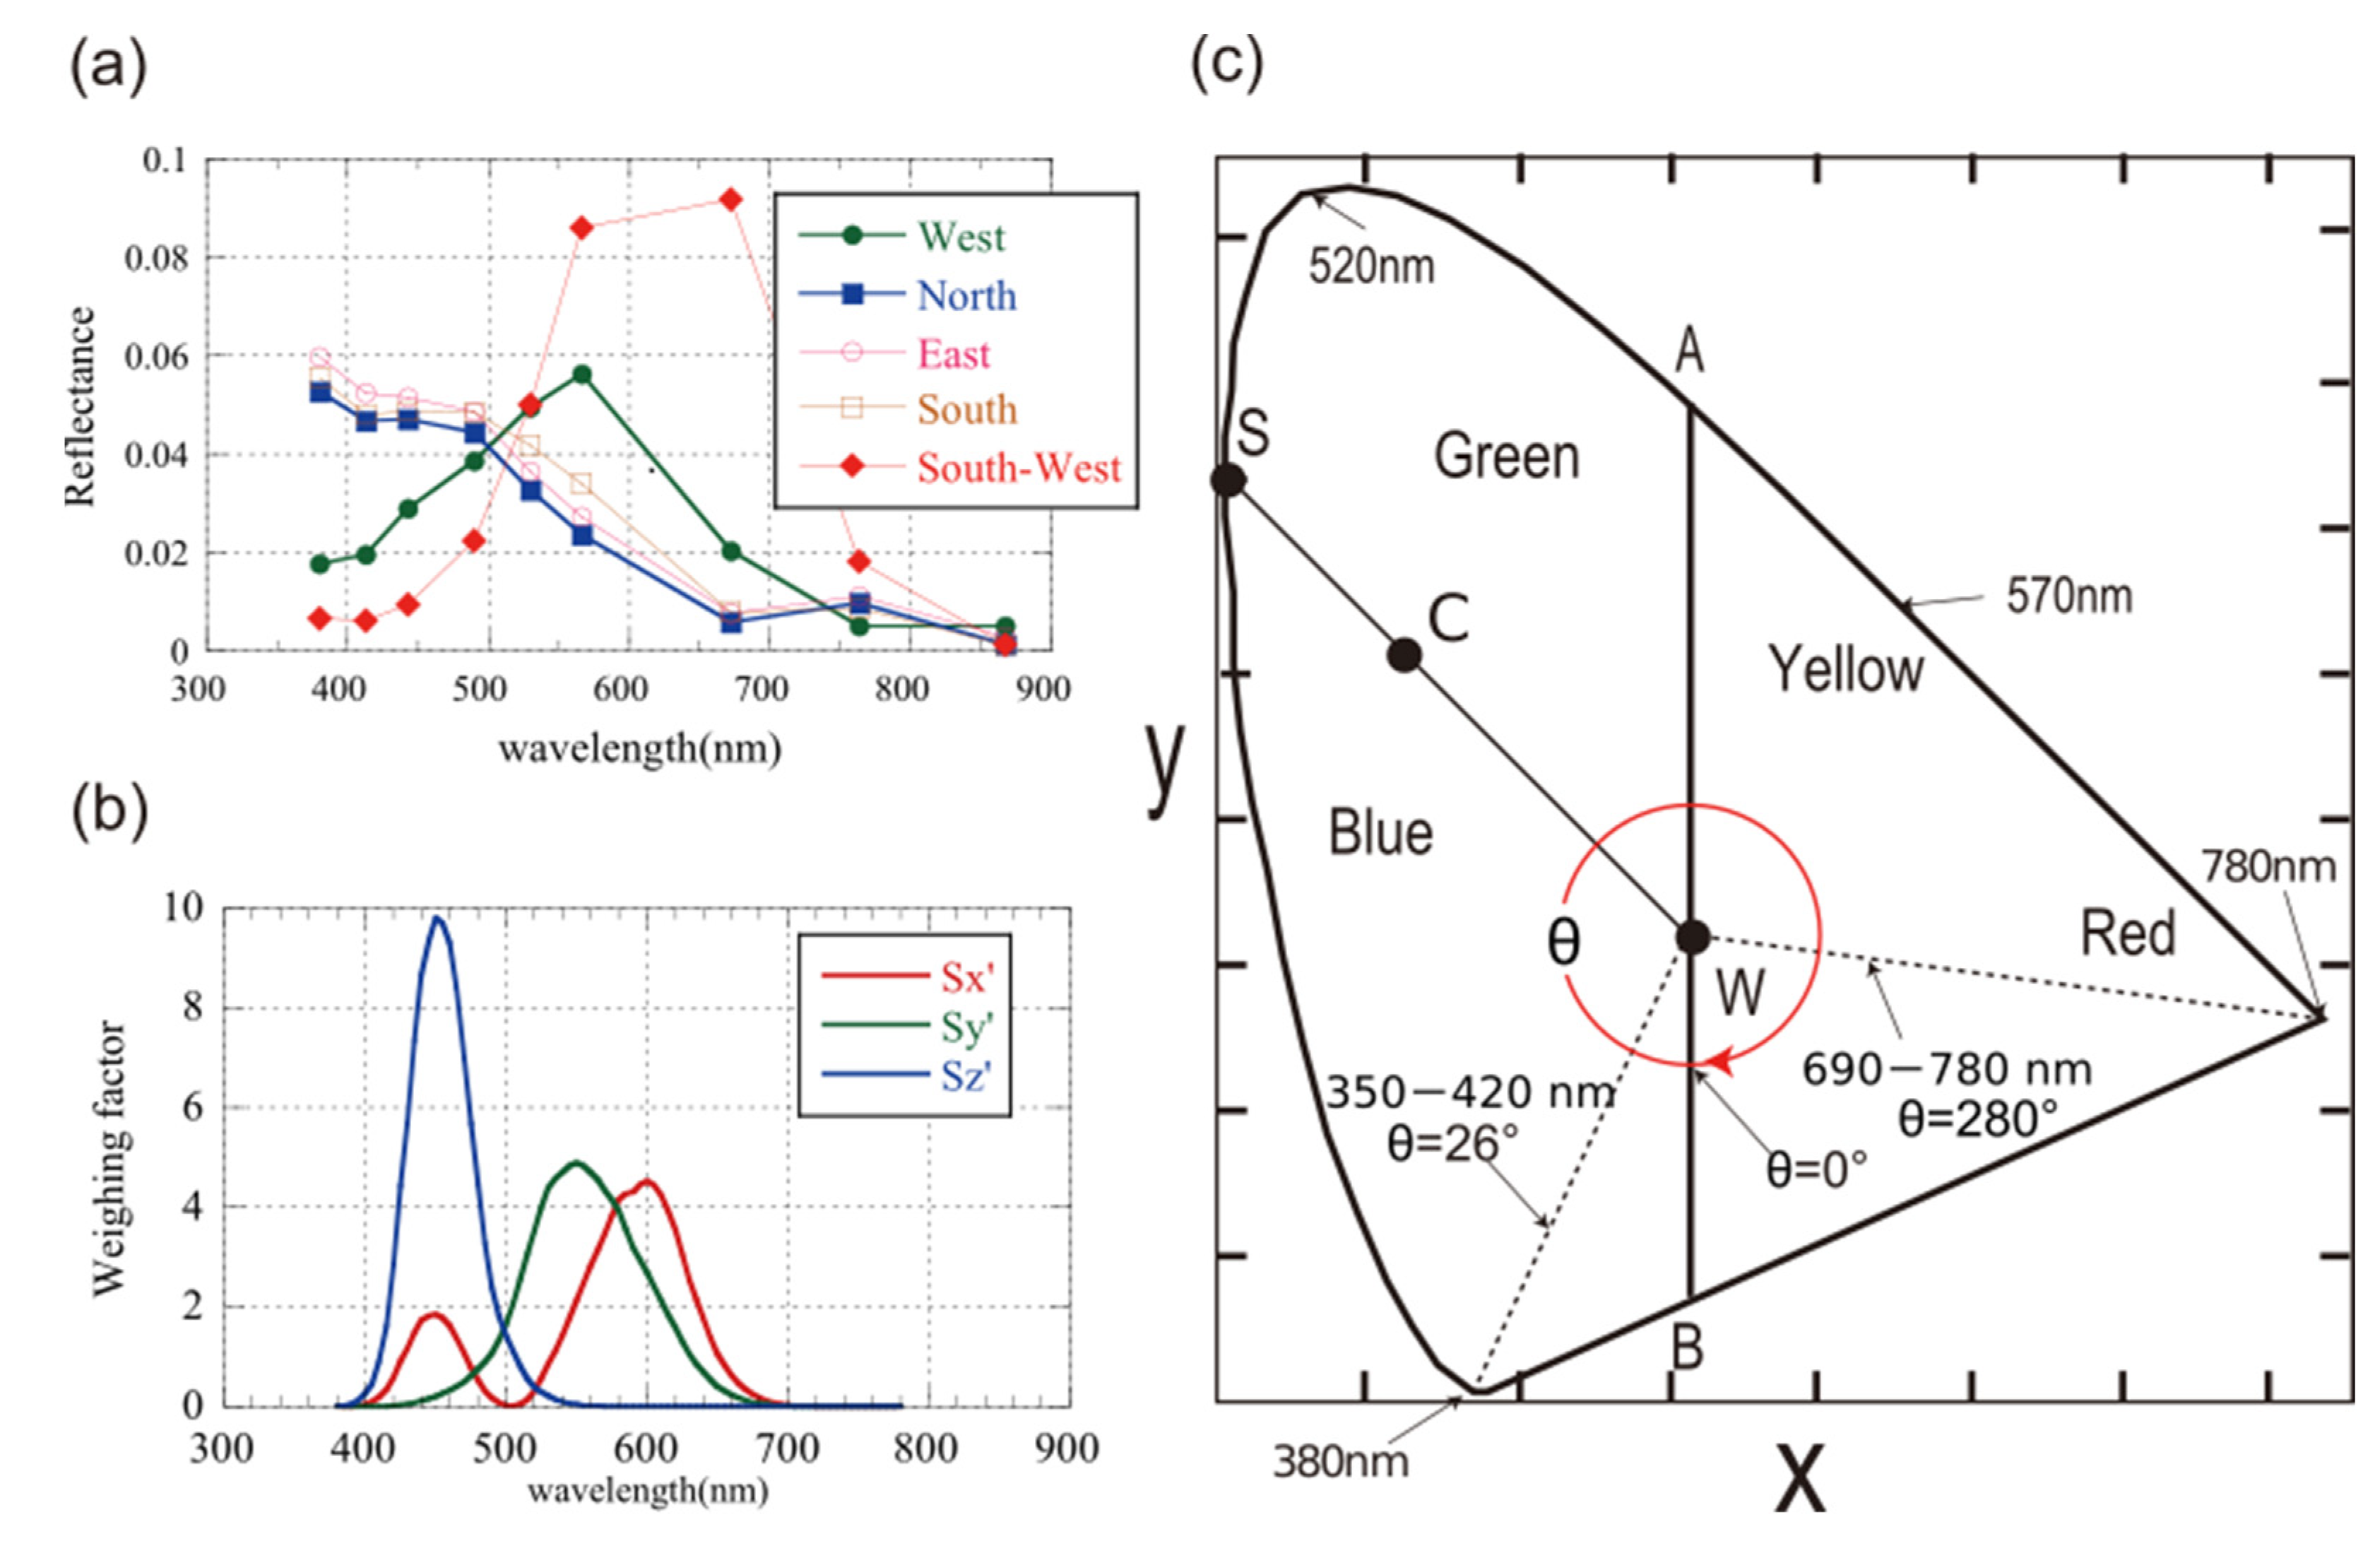
2.2. Dominant Wavelength Quantification Method

The most crucial method in this study is to derive the “dominant wavelength” from the multispectral reflectance data obtained from satellite data. The dominant wavelength is a numerical value of the wavelength of the color of light perceived by human eyes. The dominant wavelength estimation from satellite data is briefly explained below.
The color system used this time is the XYZ color system [14] adopted in 1931 by the International Commission on Illumination (CIE), which has a proven track record in the color evaluation of crater lakes and hot springs [12,13]. Although it is possible to specify an objective and accurate color by expressing it with the two numerical values (x, y) obtained by this color system, it is not easy to associate the color with the two numbers. Furthermore, there is the advantage that it is easier to explain the characteristics of discolored seawater by showing the two numbers in the image as one number (the dominant wavelength) rather than showing them separately in the image.
On the other hand, the following equation is generally used to convert the reflectance to the XYZ values (X, Y, Z) of the XYZ color system.
X = K 380 780 S ( λ ) x ( λ ) R ( λ ) d λ
Y = K 380 780 S ( λ ) y ( λ ) R ( λ ) d λ
Z = K 380 780 S ( λ ) z ( λ ) R ( λ ) d λ
Here, S is the “standard spectral distribution of light”, x′, y′, and z′ are the “color matching function”, R is the “spectral reflectance of the object”, and K is the “proportional coefficient” (in fact relative); and λ indicates the wavelength. The values of X, Y, and Z calculated in this way are further relativized by the following equations:
x = X X + Y + Z
y = Y X + Y + Z
z = Y X + Y + Z
Since the variables x, y, and z in these equations have a relationship of “x + y + z = 1”, z is not necessary for the scene that essentially expresses color. Therefore, in principle, if only R (λ) of 380 nm to 780 nm is known (commonly included in Equations (1)–(3)), the remaining coefficients can be obtained by using constants such as the Japanese Industrial Standards Handbook [22]. Thus, the sea color can be quantified by two numerical values: x and y. However, for S (λ), the standard light near the solar light source called D65 defined by CIE is used to determine the standard sea color in the field. Figure 2a,b shows the wavelength characteristics of the weighting factor [22], which is the “product of the color matching function and the standard light D65” used in Equations (2)–(4).
The x and y values obtained in this way are shown in the chromaticity coordinates shown in Figure 2c. The outer circumference of this chromaticity coordinate (the numerical value of the wavelength written on the thick black curve) corresponds to the dominant wavelength. For example, when the coordinates (x, y) of C are obtained, the dominant wavelengths are the white point W (x = 0.3333, y = 0.3333) and the point S where the extension line of C and the outer circumference intersect. The “ratio of WS and WC ([WC/WS] × 100%)” is called “purity”, and the closer it is to S, the higher the purity of the color (the purity of the S point is represented by 100%). Generally, the dominant wavelength is determined by drawing, but the numerical calculation is not open to the public. Therefore, point B, where the perpendicular line is drawn from point W and intersects with the outer circumference, is set to 0°, and the clockwise 360° is set to θ [23]. Then, a polynomial approximation is performed on the relationship between θ and the dominant wavelength obtained from the known dominant wavelength coordinates [24], as shown in Figure 3 and Appendix A, Table A1. An equation for obtaining the dominant wavelength (symbol: DWL) is created from θ. The obtained sixth-order approximation expression (R2 = 0.98) is shown in Equation (7).
DWL = 2.631 × 10⁻¹¹θ6 − 1.299 × 10⁻⁸θ5 + 3.068 × 10⁻⁸θ4 + 9.3879 × 10⁻⁴θ3 − 0.1806 × θ2 + 12.557 × θ+ 200.53
The conversion equation from the chromaticity coordinates (x, y) to θ obtained from the satellite data using Equations (1)–(6) is expressed by the following equations in the calculation format of MS Excel:
θ = IF (AND([x − 0.3333] < 0, [y − 0.3333] < 0), −θ′ − 90, 270 − θ′)
θ′ = DEGREES (ATAN2 ((x − 0.3333), (y − 0.3333)))

2.3. Satellite Data Used

GCOM-C is an earth observation satellite launched by Japan in December 2017. This satellite has 9 bands of 380 nm, 412 nm, 443 nm, 490 nm, 530 nm, 565 nm, 674 nm, 763 nm, and 869 nm in the visible/near-infrared region. All are equipped with SGLI sensors that can observe with a resolution of 250 m. This study used Level-2 data of “atmospheric corrected attenuation”, which can easily analyze the contact area between land and sea. The data used were from JAXA (Japan Aerospace Exploration Agency) EORC (Earth). The data from 7 April 2018 (immediately before the eruption) to 31 March 2019, shown in Table 1, were obtained from the G-Portal site provided by the Observation Research Center. Figure 4a,b shows the RGB color image of SGLI acquired on the same day as the Sentinel-2 color image. The SGLI reflectance image obtained has a resolution of 49 × 49 pixels around Anak Krakatau. In addition, the land/water flag of the QA (quality assurance) flag of SGLI’s vegetation index (VGI) was used to mask the land information. Here, a land mask was created from the data on 9 January 2019 (Figure 4c), which was able to carry out the cleanest land–sea separation without the influence of clouds. The reflectance data in each pixel were first converted into X, Y, and Z according to Equations (1)–(3). In particular, as shown in Figure 2a, the reflectance of the nine bands obtained from the SGLI data was linearly interpolated in 5 nm steps and then multiplied by a 5 nm weight factor (JIS Z 8781-1) and converted to chromaticity coordinates X, Y, and Z. These coordinates were converted into x and y using Equations (4) and (5). Furthermore, the principal wavelength was calculated from x and y using Equations (7)–(9). The red squares in Figure 4c are the five stations (west, north, east, south, and south-west) acquired to investigate the tendency of the sea color in the waters around Anak Krakatau. Of these, the south-east station was set as the area closest to where the collapse of the mountain [5] occurred. The size of each pixel is 3 × 3. Figure 4d is an SGLI image of 20 December 2018, just before the eruption.

3. Results

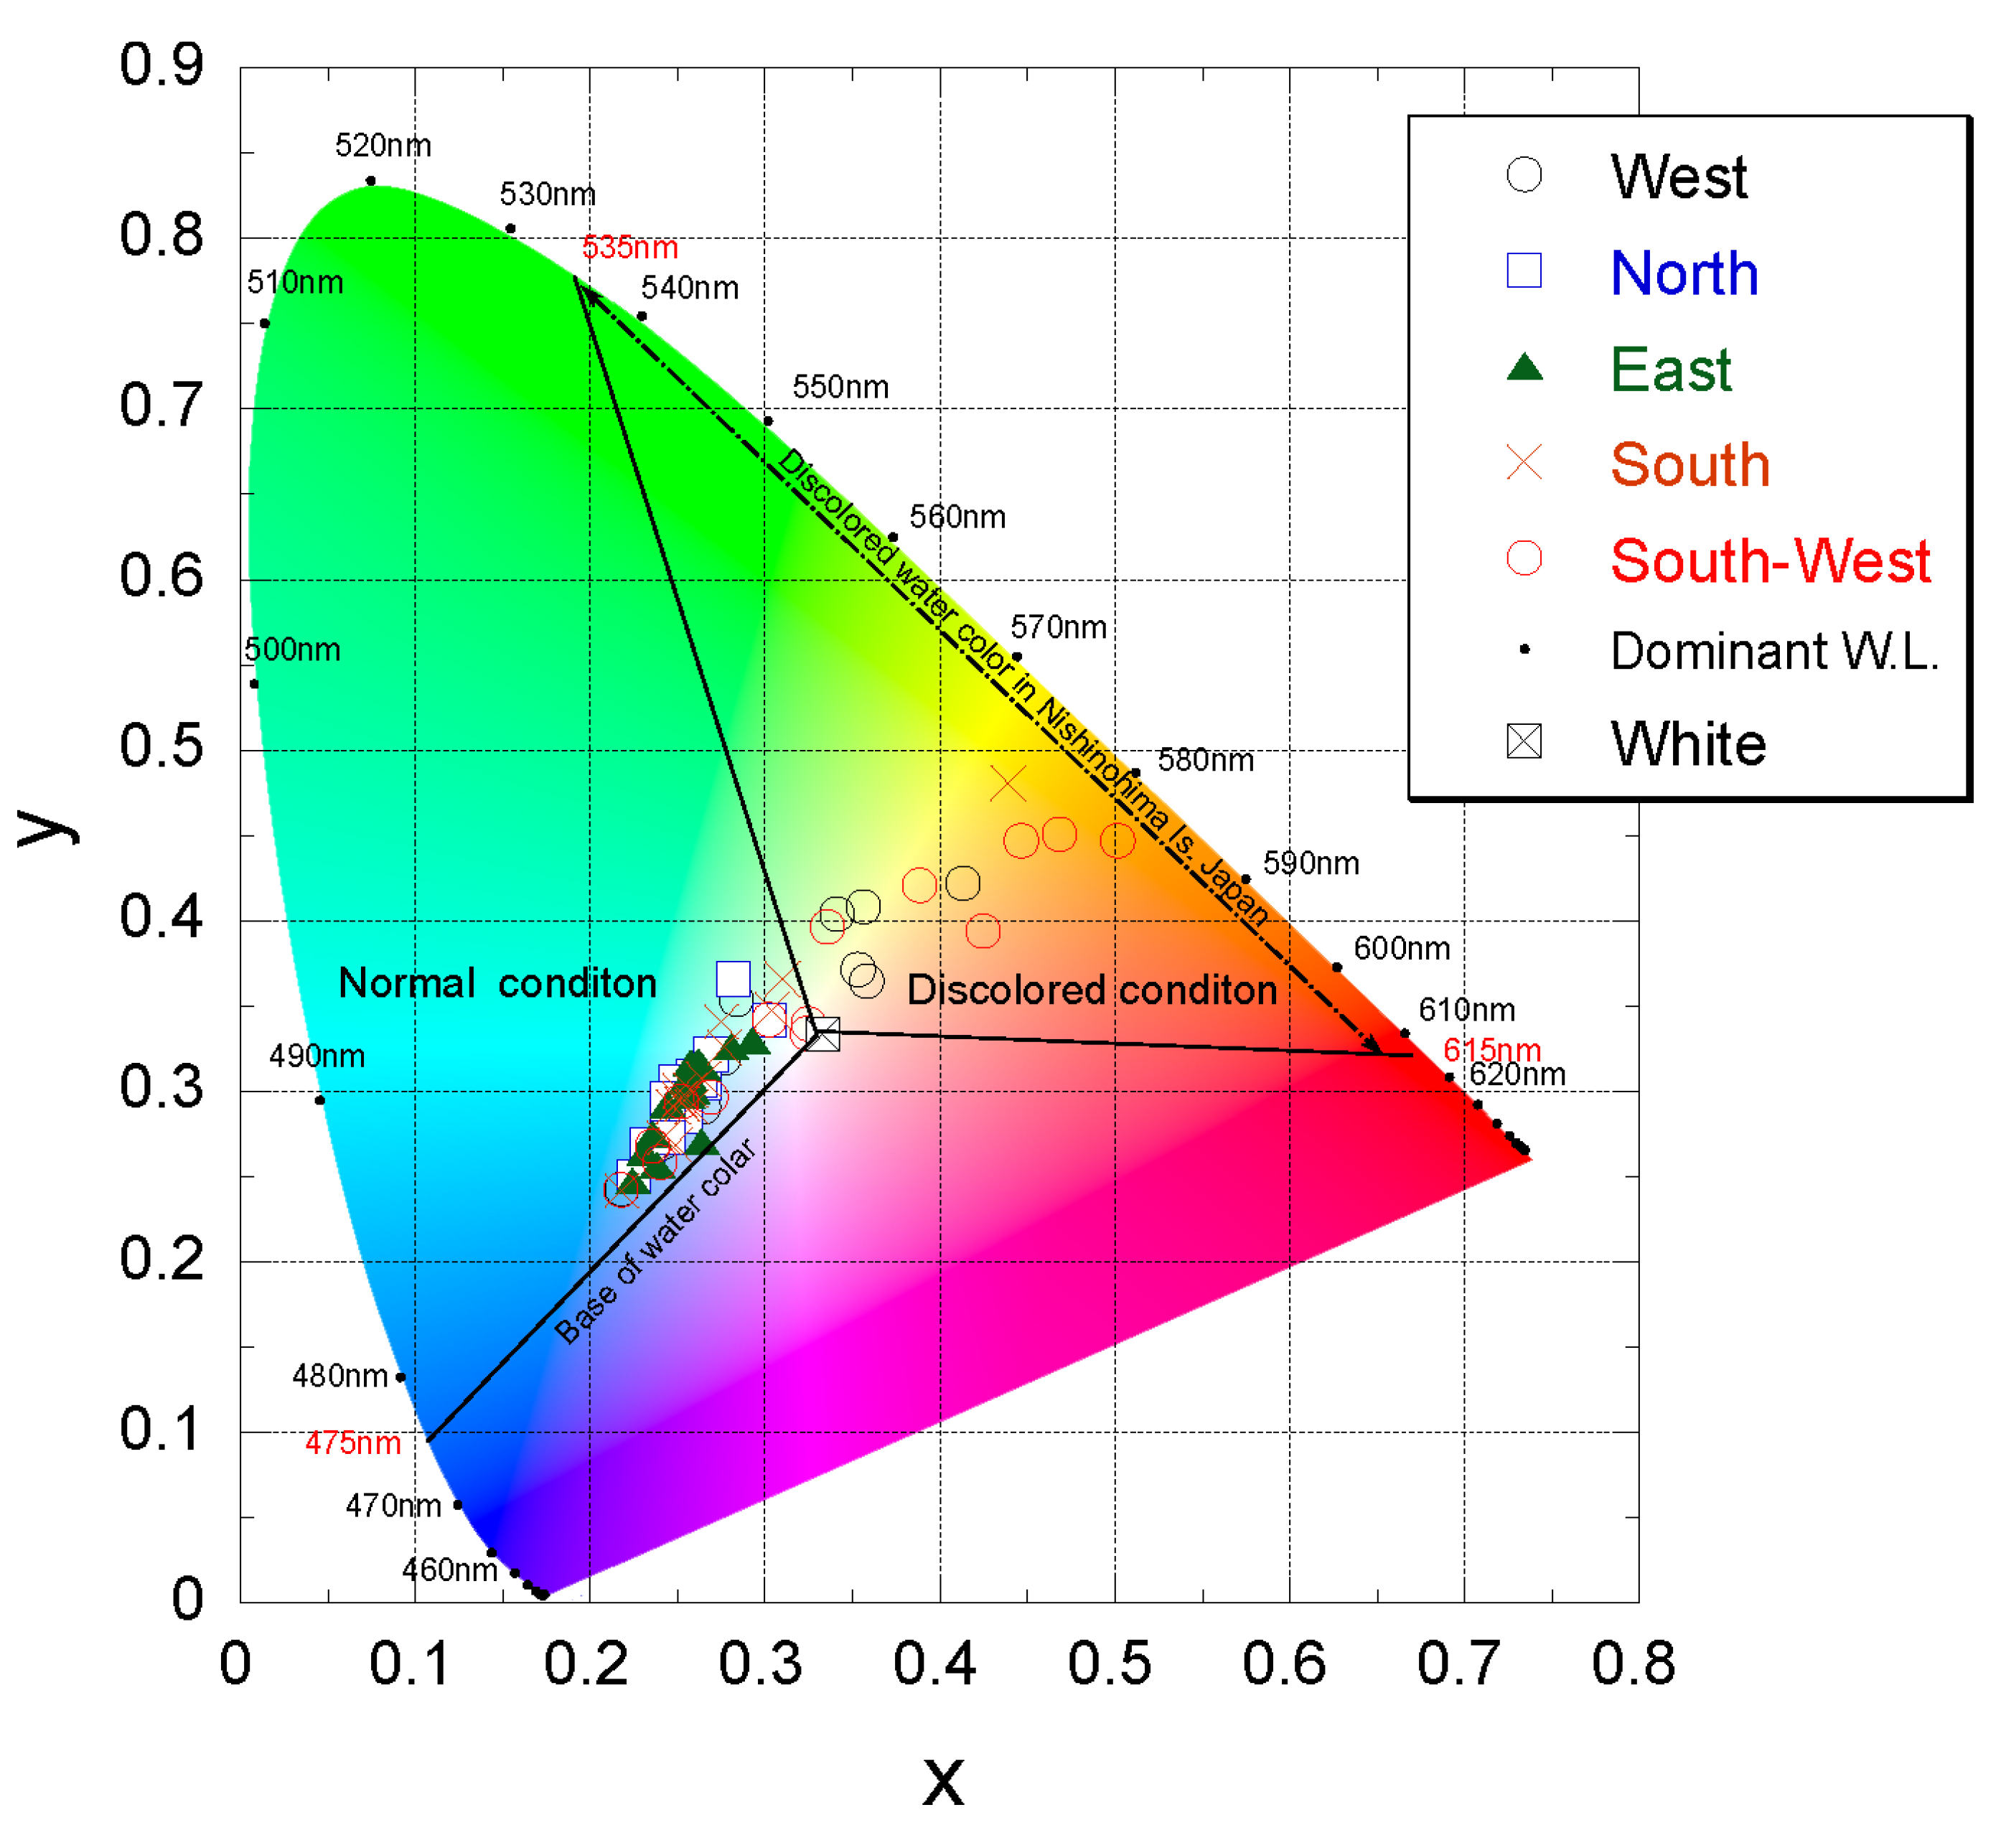
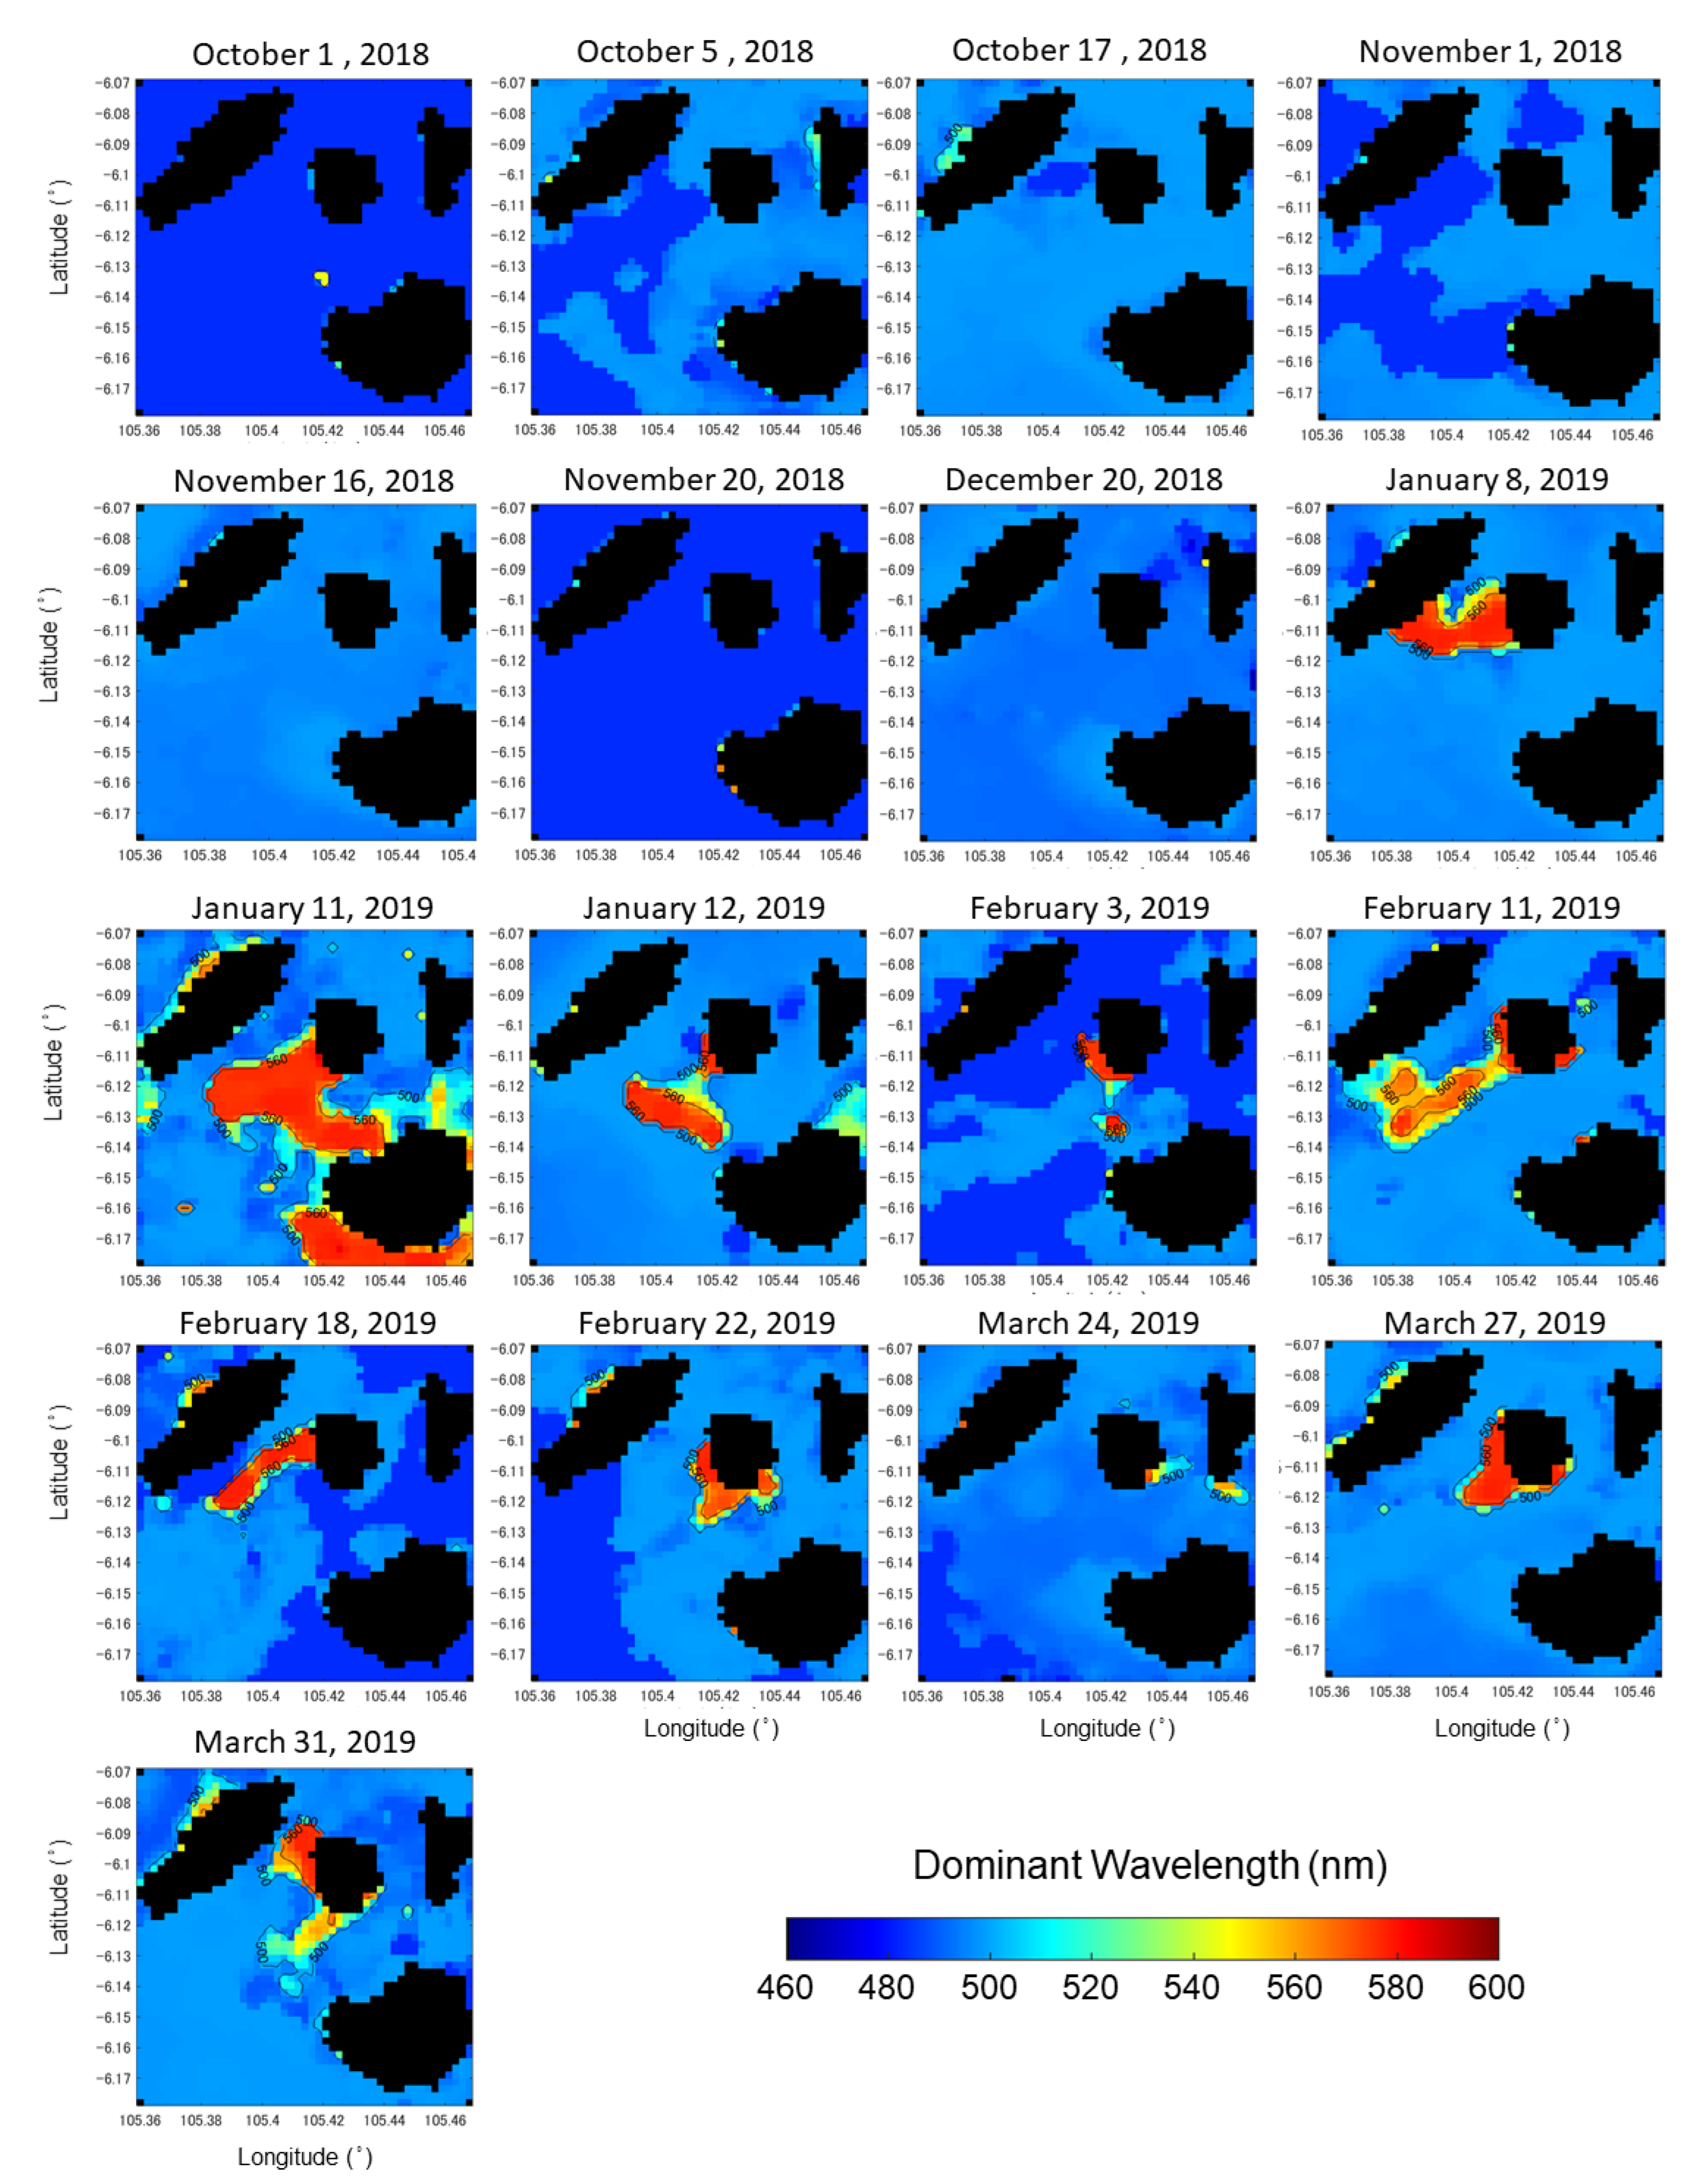
3.1. Color Characteristics of Discolored Water

We used SGLI data to characterize the dominant wavelengths of seawater around this island from April 2018 to March 2019. Figure 5 is a chromaticity diagram of the sea color at the stations around the island (west, north, east, south, and south-west) estimated from SGLI. However, data loss and data from 1 October 2018, 20 November 2018, 11 January 2019, and 3 February 2019, which deviated significantly from the chromaticity diagram, were excluded. Table 2 shows the chromaticity (x, y) and dominant wavelength statistics at each station. From this, the x and y values of the sea color changed in the range of about 0.24 to 0.38 for x and about 0.27 to 0.38 for y, and the average ± standard deviation of the entire dominant wavelength was 497 nm ± 2 nm before the eruption and 515 nm ± 35 nm after the eruption. In addition, most of the data are blue (the dominant wavelength is about 480 nm), extending from the white point W to the lower left. Eighty percent of all data have a dominant wavelength of 500 nm or less (blue to green). Apart from this, a relatively high-purity yellow–green sea color (the dominant wavelength is 560 to 580 nm) was also confirmed. Figure 5 also shows three lines showing the color characteristics of the discolored water before and after the eruption of Nishinoshima Island, a submarine volcano in Japan, in 2020 using the same method [16]. These lines indicate that the pre-eruptive baseline at Nishinoshima Island was about 475 nm, and the range of discolored water was from 535 nm to 615 nm. The sea color of Krakatau Island in this study is also within the range of these lines. Looking at the characteristics at each station (Table 2), the mean ± standard deviation of the dominant wavelength in the south-west direction after the eruption was 539 ± 42 nm, which was particularly high compared to other points. On the other hand, the dominant wavelengths at the north and east points hardly changed before and after the eruption.

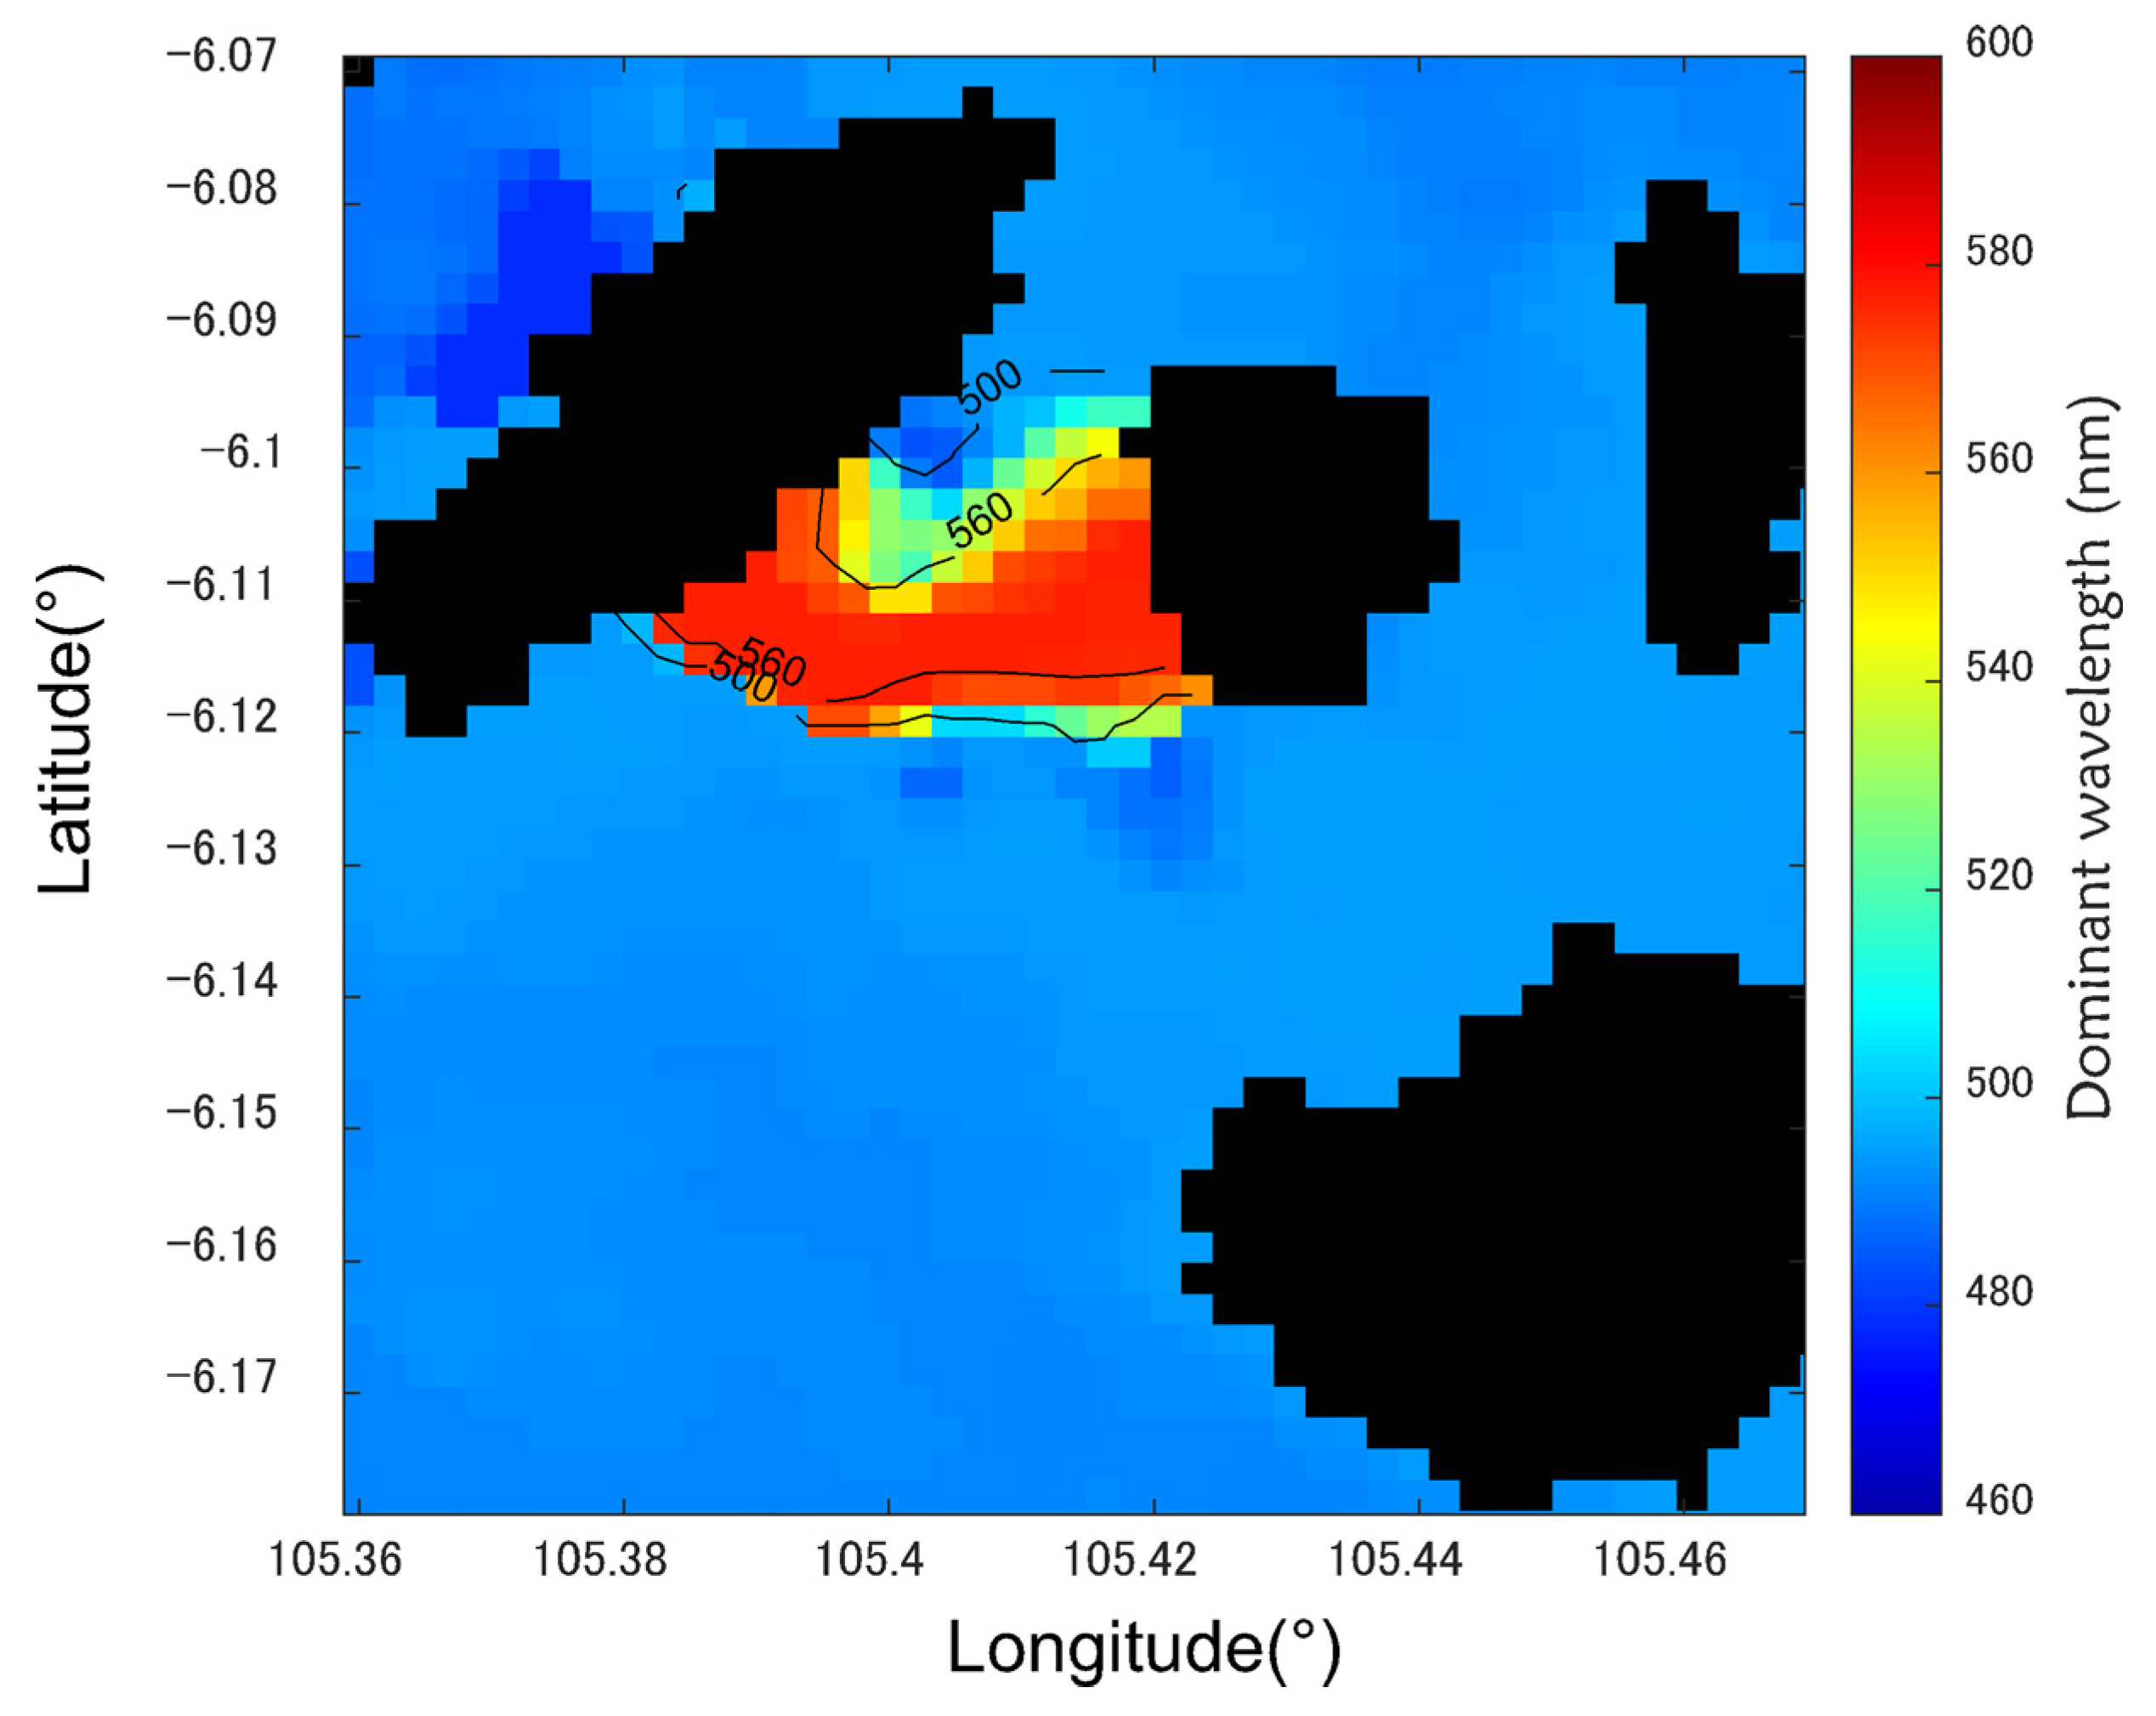
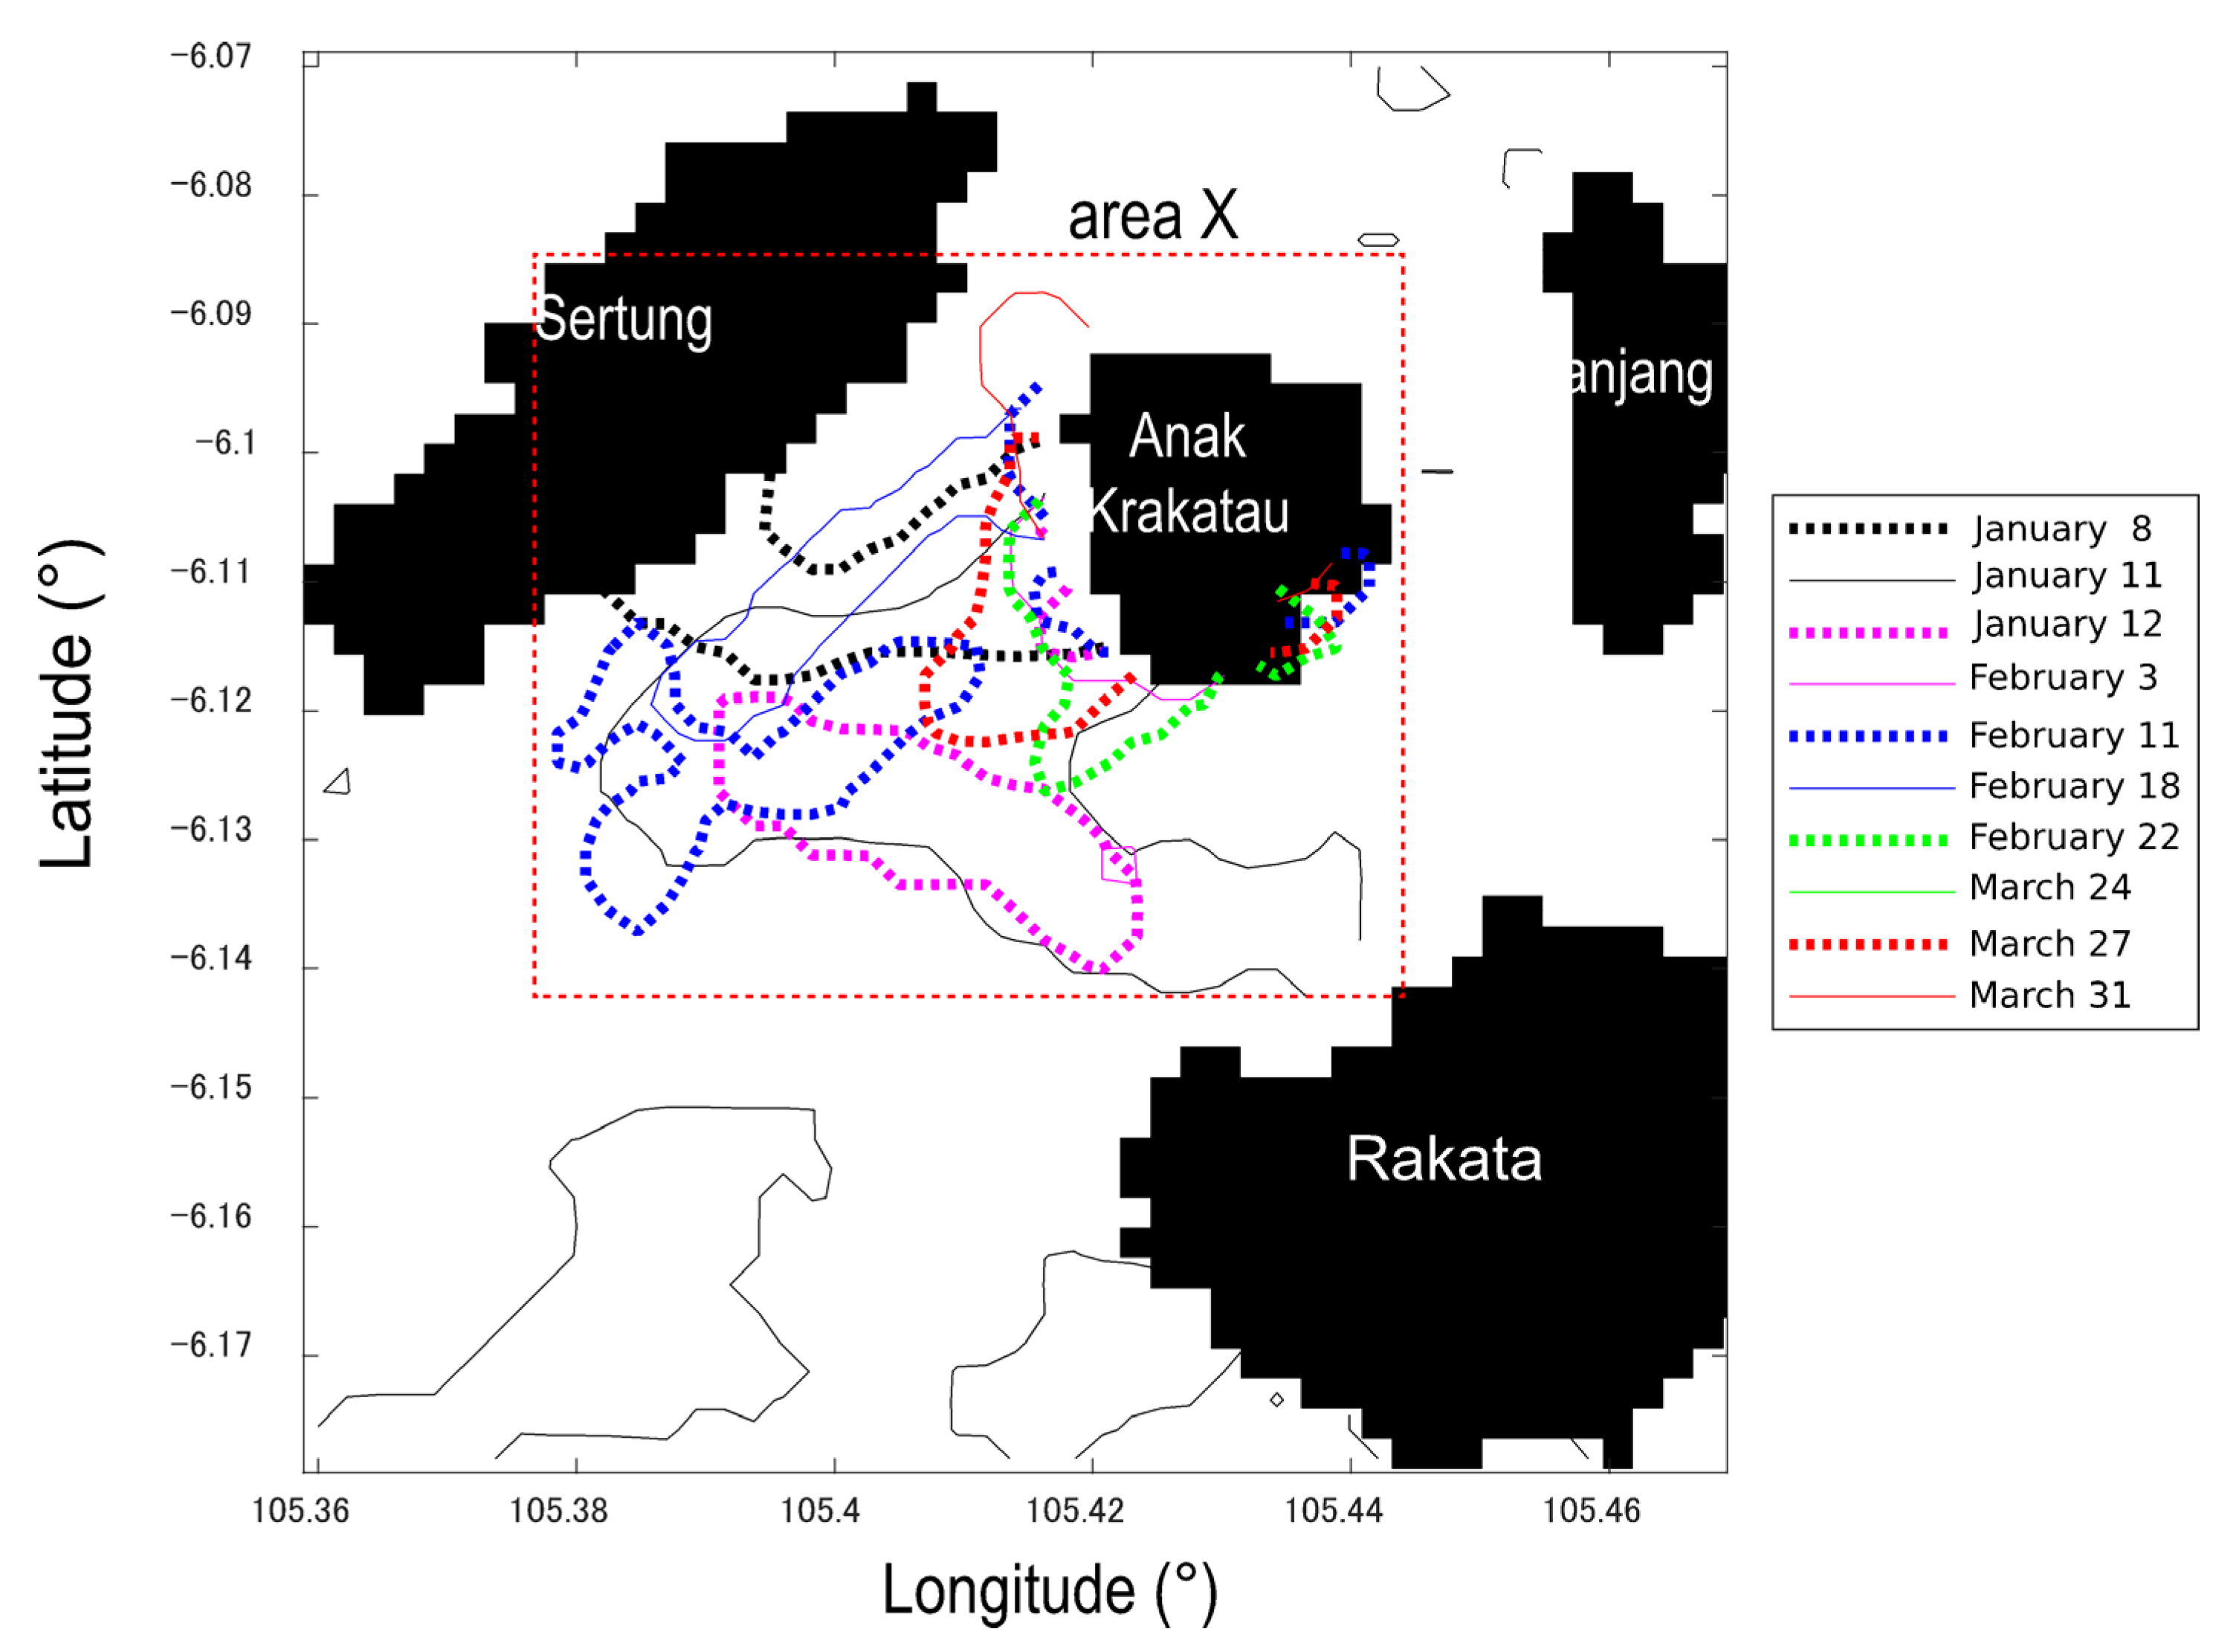
3.2. Distribution Characteristics of Discolored Water

In Section 3.1, the dominant wavelength characteristics of the partially discolored-water area near Anak Krakatau were shown. Next, we calculated the dominant wavelength distribution for each day and evaluated the distribution area quantitatively. Figure 6 is an example of the dominant wavelength distribution map calculated using SGLI data (as of 8 January 2019). This figure is roughly divided into a blue region (background water), a red region showing a relatively long dominant wavelength, and a green-to-yellow region located between blue and red. As shown in Figure 6, the boundaries of these regions almost coincided with the 500 nm and 560 nm contour lines. Figure 7 shows the results of applying the same treatment to the SGLI data 10 days after the eruption. Each day is represented by RGB color images (left) and a dominant wavelength image (right). From this, the data of each period are mainly divided into three color regions (Figure 6), and the water area indicated by the red boundary line of 560 nm is clearly detectable. However, the data on February 11 showed a highly complex pattern. Since such a peculiar pattern may significantly influence (error) the interpretation when quantifying the color change range, a more stable quantification of discolored water is needed.

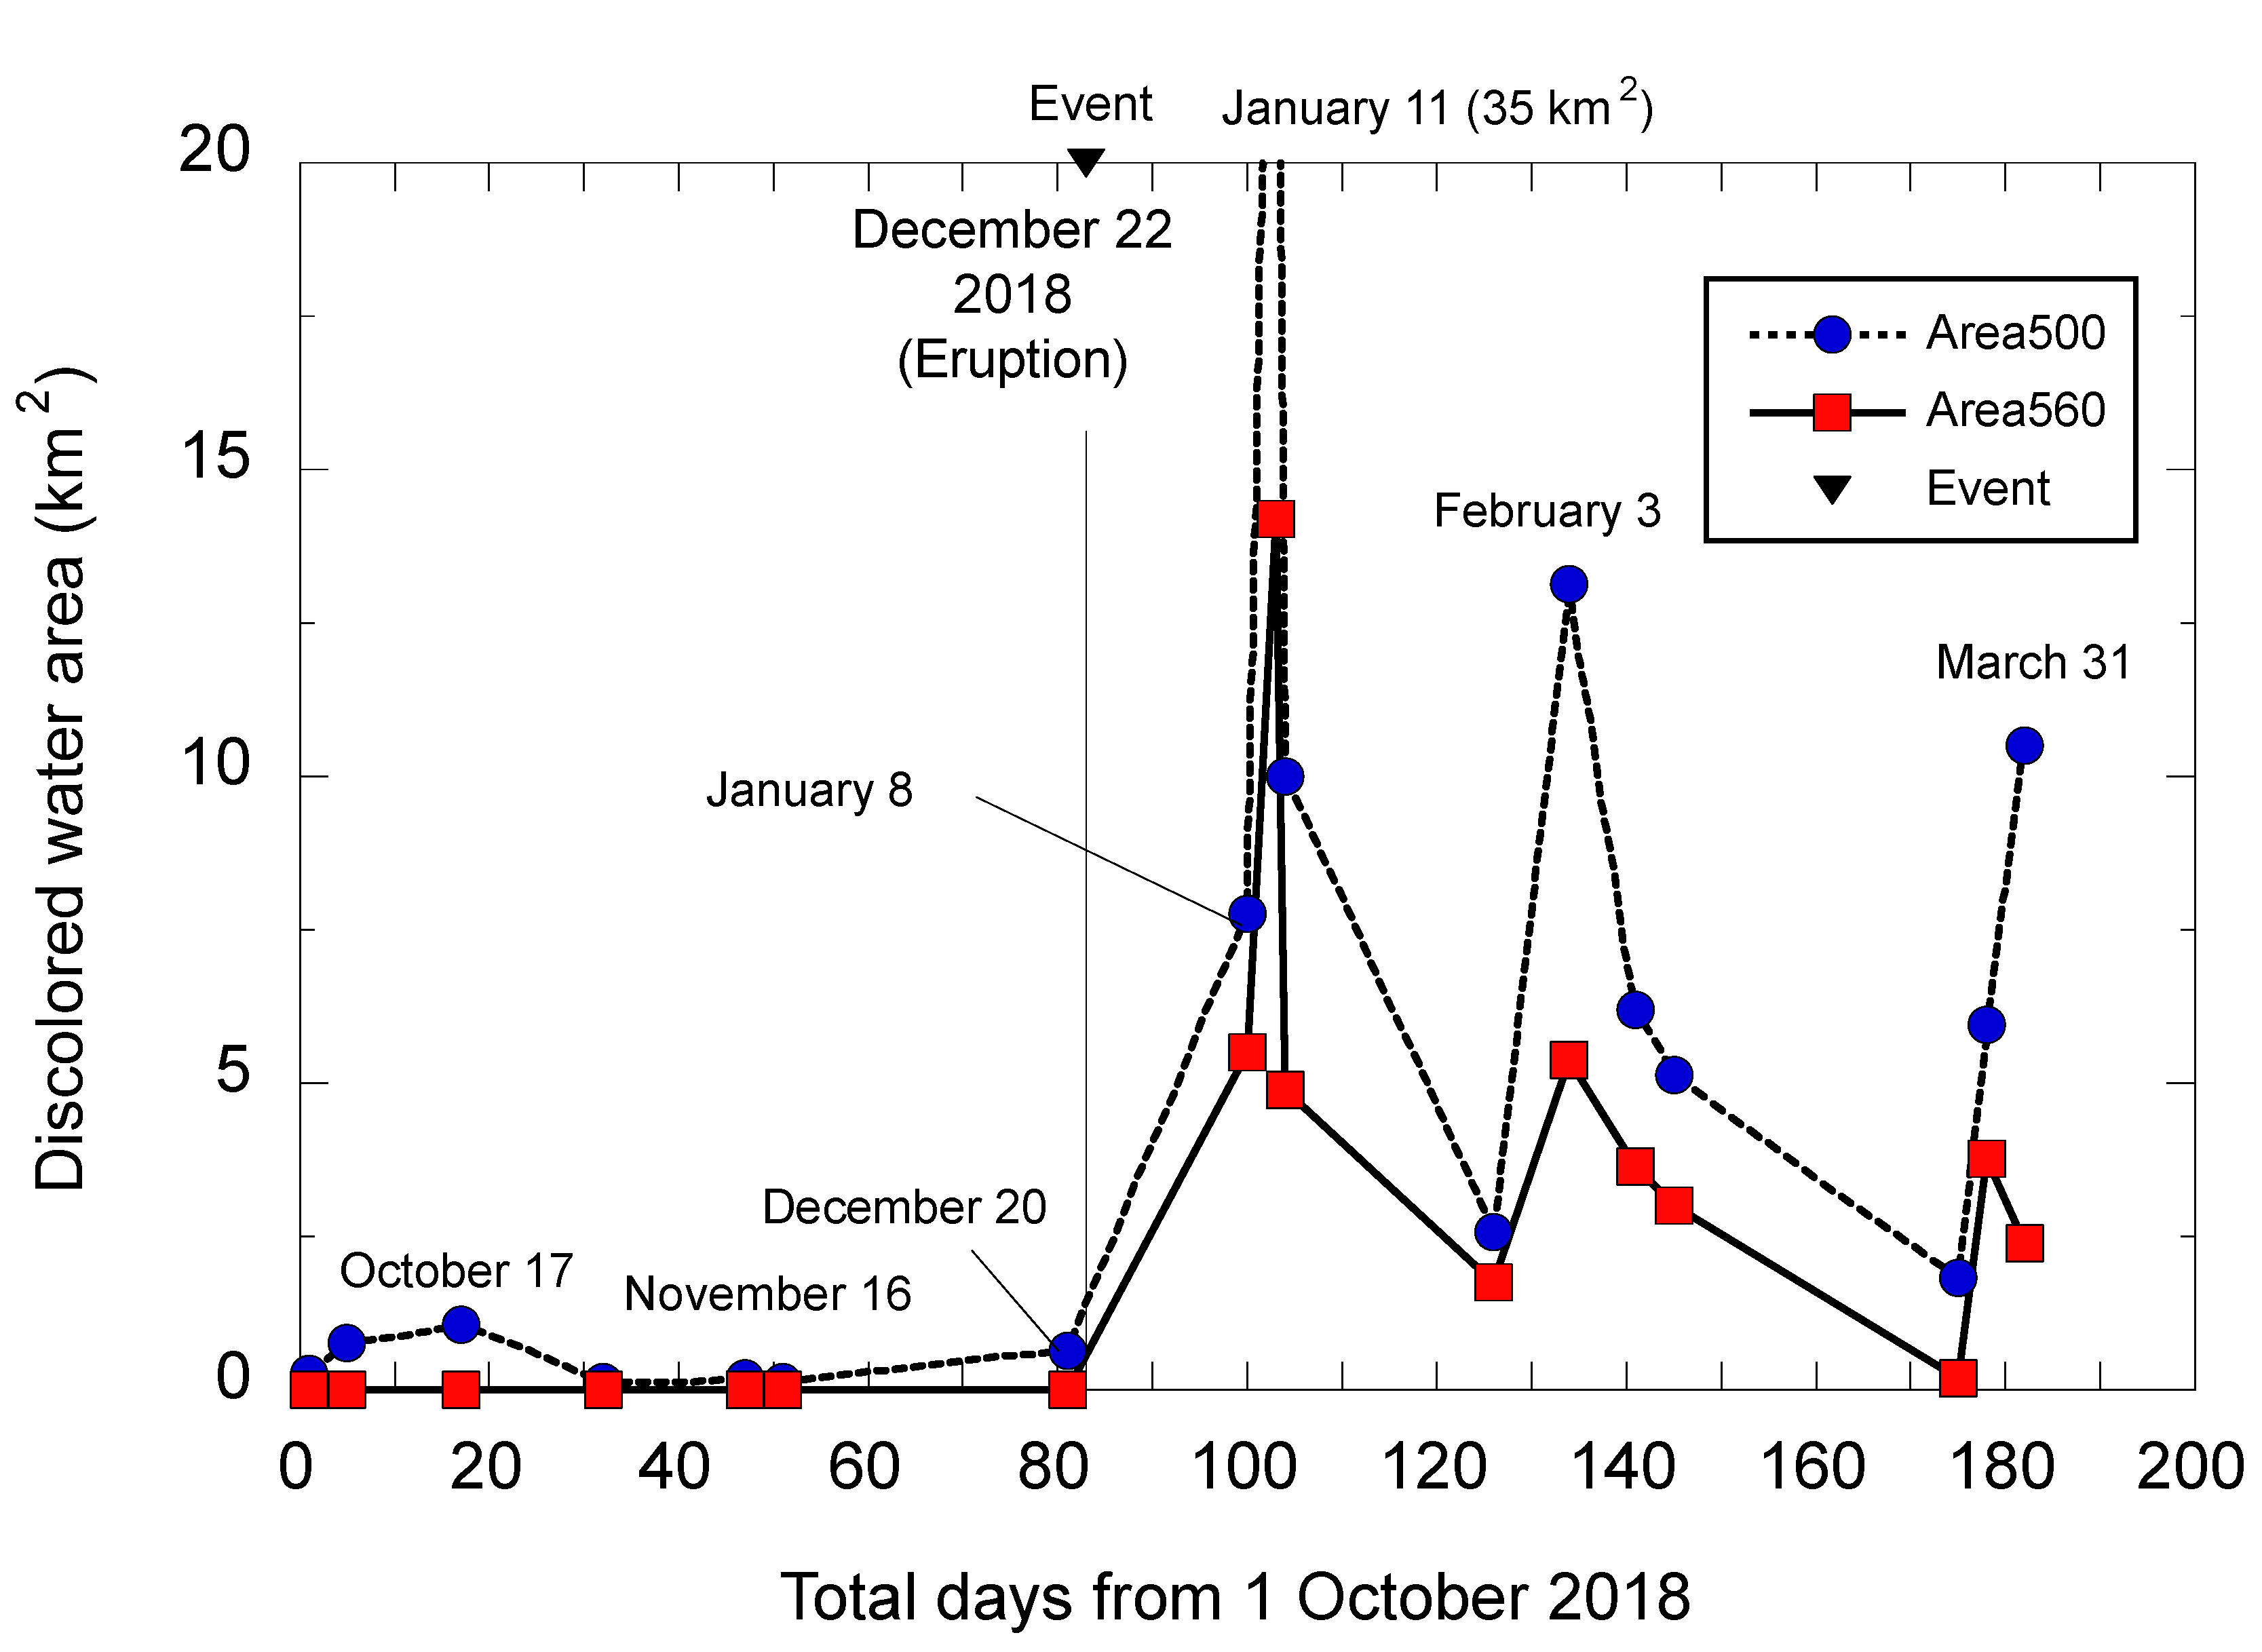
3.3. Quantification of the Discolored Water Area

As explained in Section 3.2, it can be easier to analyze the spatial change of discolored water in one image by extracting the contour line of 500 nm or 560 nm. Here, all the contour lines of discolored seawater with a dominant wavelength of 560 nm or more (hereafter referred to as the “yellow region”) are shown in Figure 8. In the water area near Anak Krakatau (area X in the figure), the distribution of the yellow area is expanded or contracted at almost the same position. As shown in Figure 8, the discolored-water area extending from the island to the south-west can be read as about 0.03° and 0.04° in the latitudinal and longitudinal directions, respectively. Assuming that the distance of 1° is about 111 km, it is estimated that the yellow region extended to approximately 5.6 km in the south-west direction. At the end of March, we could qualitatively read that this yellow area was shrinking. Therefore, to quantitatively express the size of the yellow region, changes in the size of the yellow region were investigated only in area X. Figure 9 shows the relationship between the total data from April 2018 to March 2019 and the areas more than 500 nm and more than 560 nm. These areas shown here were calculated by multiplying the number of pixels in these regions by the square of the spatial resolution of SGLI (250 m). As a result, the size of these regions changed in a complicated manner within the range of 0 to 35 km2. Immediately after the eruptive activity on 22 December 2018, the area of discolored water expanded rapidly. In addition, the fact that the area of the dominant wavelength of 500 nm or more slightly increased just before this eruption is noteworthy from the viewpoint of eruption forecasting.

4. Discussion

In this paper, an attempt was made to quantify discolored seawater originating from submarine volcanoes using the satellite GCOM-C SGLI sensor. Figure 5 and Figure 6 show that discolored water can be used with a simple numerical value of one element by using the dominant wavelength index instead of the three elements such as the RGB color of the satellite. Conventionally, satellite-based methods for quantifying discolored seawater have often been discussed in terms of the distribution of chlorophyll-a and turbidity products [9,10,25,26,27]. These parameters are often confused with the origin of phytoplankton reproduction and the runoff of turbid water from rain. For example, Whiteside et al. [28] pointed out that an increase in surface chlorophyll-a concentration after a volcanic eruption could be associated with the basalt–andesitic ash material expelled from the volcano and entrained into the ocean. Therefore, apart from these methods, quantifying the original color of discolored seawater is also considered useful for monitoring volcanic activity. The numerical value of this dominant wavelength will be discussed first.
The average ± standard deviation of the dominant wavelength obtained from SGLI was 497 nm ± 2 nm before the eruption (normal condition) and 515 nm ± 35 nm after the eruption (discolored condition), as shown in Figure 5 and Table 2. In Nishinoshima Island, where the same analysis was performed, the range of the discolored water area was about 535–615 nm [16], so it was found that this time, the dominant wavelength distribution was within a very narrow range compared to Nishinoshima. It has been considered that such a change in the dominant wavelength is due to the chemical composition of seawater and the accompanying shift in pH. For example, from the chemical analysis of hot spring water, Ohsawa et al. [12] pointed out that Si affects the blue region near the dominant wavelength of 480 nm. Al affects Si and Al in the region near 490 nm. From the chemical analysis of a crater lake, Onda et al. [13] also explained the green coloration near the dominant wavelength of 535 nm as being due to the effect of Fe2+. The study of Satsuma-Iojima Island [7] does not mention the dominant wavelength. However, the water is transparent-to-milky-white at a pH of around 2, yellowish brown at 3–5, and again white at higher pH levels. Since the seawater of Anak Krakatau also shows the yellow color of the RGB images in Figure 1 and Figure 7, the pH is estimated to be about 3–5. Assuming that the discoloration is due to the influence of chemical components, the yellow–brown color at the dominant wavelength means that there is a large amount of iron outflow from Krakatau, not aluminum or silicon. However, this time, data verifying such a chemical composition and pH value could not be obtained, which remains a topic for the future. On the other hand, the color of this seawater is not only the color of sediments formed by hydrothermal water and gas discharged from submarine volcanoes reacting with seawater, as mentioned above, but also sediments brought from land by a volcanic collapse [5,29]; the color of suspended matter in the atmosphere and the color of clouds containing volcanic gas and volcanic ash in the atmosphere may also be detected [11,30], so caution is required.
Next, we consider the viewpoint of discolored water distribution. As shown in Figure 7 and Figure 8, the discolored water distribution grew to about 5.6 km in the south-west direction of the island from January to February 2019 but shrank to about 0.5 km in late March 2019. According to Novellino et al. [20], volcanic activity was present two months after the mountain’s collapse on 22 December 2018, and the area of the island expanded, after which the volcanic activity subsided. The cause of the change in the direction of the dominant wavelength seen in Figure 5 and Table 2 is still under investigation, but it is thought to be caused by the bathymetry and submarine geology around the island. See related references [5,29,30,31,32] for this information.
Finally, we consider the limits of using SGLI. This sensor contains many bands in the visible region of 380 to 780 nm and is highly effective in determining detailed changes in ocean color. However, it must be recognized that the value includes an error because the wavelength resolution is not sufficient to correspond to the overlay coefficient of 5 nm. Additionally, as shown in Figure 4a,b, the 250 m resolution does not provide a detailed discolored water distribution pattern compared to a 10 m resolution sensor such as Sentinel-2. For these reasons, research on data fusion that combines high-resolution and low-resolution satellites will be necessary in the future.

5. Conclusions

The purpose of this study was to quantify the discolored seawater in the area around the Indonesian submarine volcano “Anak Krakatau” before and after its eruption in December 2018, from the viewpoint of the “dominant wavelength”. As a result, the following three main items were found. First, the average ± standard deviation of the dominant wavelength obtained from SGLI was 497 nm ± 2 nm before the eruption (normal condition) and 515 nm ± 35 nm after the eruption (discolored condition). Second, the average ± standard deviation of the dominant wavelength at the south-west station closest to the crater was 541 nm ± 43 nm, the longest wavelength. The discolored seawater region around the island derived from SGLI was clearly detected from the contour line, with a dominant wavelength of 500 nm or 560 nm. Third, the water area with a dominant wavelength of 500 nm or more fluctuated significantly within the range of 0 to 35 km2. Additionally, the area of the dominant wavelength of 500 nm or more slightly increased just before the eruption; this fact may be used for eruption forecasting.
It is necessary to further verify the effectiveness of this proposed method in the future. In particular, it is essential to elucidate the relationship between the main wavelength and the chemical composition. However, field surveys of active submarine volcanoes are hazardous and enormously costly. Therefore, this method will be verified in hot spring water and caldera lakes, which are relatively safe and have sufficient compositional data. Finally, we will perform a similar analysis on submarine volcanoes distributed around the world to help in the estimation of submarine volcanic activity.

Author Contributions

Conceptualization and methodology, Y.S.; formal analysis and visualization, S.H. and Y.S.; supervision, Y.S. and N.T.; investigation and writing—original draft preparation, Y.S.; writing—review and editing, all authors. All authors have read and agreed to the published version of the manuscript.

Funding

This research was funded by JSPS KAKENHI, grant numbers 19H04292, 20KK0141, and 21H03650.

Data Availability Statement

Data available upon request.

Acknowledgments

The Sentinel-2 product used in this paper was supplied by the Earth Explorer System (https://earthexplorer.usgs.gov/ (accessed on 28 March 2023)) of USGS.

Conflicts of Interest

The authors declare no conflict of interest.

Appendix A

Table A1. Approximate values of chromaticity coordinates [24] and θ at representative wavelengths.
Wavelength
(nm)
xyθ (°)Wavelength
(nm)
Xyθ (°)
3800.17410.0050265800.51250.4866230
3900.17380.0049265900.57520.4242250
4000.17330.0048266000.62700.3725263
4100.17260.0048266100.66580.3340270
4200.17140.0051266200.69150.3083274
4300.16890.0069276300.70790.2920276
4400.16440.0109286400.71900.2809278
4500.15660.0177296500.72600.2740279
4600.14400.0297326600.73000.2700279
4700.12410.0578376700.73200.2680279
4800.09130.1327506800.73340.2666280
4900.04540.2950836900.73440.2656280
5000.00820.53841227000.73470.2653280
5100.01390.75021437100.73470.2653280
5200.07430.83381537200.73470.2653280
5300.15470.80591597300.73470.2653280
5400.22960.75431667400.73470.2653280
5500.30160.69231757500.73470.2653280
5600.37310.62451887600.73470.2653280
5700.44410.55472077700.73470.2653280
7800.73470.2653280

References

  1. Walter, T.R.; Haghighi, M.H.; Schneider, F.M.; Coppola, D.; Motagh, M.; Saul, J.; Babeyko, A.; Dahm, T.; Troll, V.R.; Tilmann, F.; et al. Complex hazard cascade culminating in the Anak Krakatau sector collapse. Nat. Commun. 2019, 10, 4339–4350. [Google Scholar] [CrossRef] [PubMed] [Green Version]
  2. Yates, A.S.; Savage, M.K.; Jolly, A.D.; Caudron, C.; Hamling, I.J. Volcanic, coseismic, and seasonal changes detected at White Island (Whakaari) volcano, New Zealand, using seismic ambient noise. Geophys. Res. Lett. 2019, 46, 99–108. [Google Scholar] [CrossRef] [Green Version]
  3. Tamura, Y.; Ishizuka, O.; Sato, T.; Nichols, A.R. Nishinoshima volcano in the Ogasawara Arc: New continent from the ocean? Isl. Arc 2019, 28, e12285. [Google Scholar] [CrossRef]
  4. Yoshida, K.; Tamura, Y.; Sato, T.; Hanyu, T.; Usui, Y.; Chang, Q.; Ono, S. Variety of the drift pumice clasts from the 2021 Fukutoku-Oka-no-Ba eruption, Japan. Isl. Arc. 2022, 31, e12441. [Google Scholar] [CrossRef]
  5. Hunt, J.E.; Tappin, D.R.; Watt, S.F.L.; Susilohadi, S.; Novellino, A.; Ebmeier, S.K.; Cassidy, M.; Engwell, S.L.; Grilli, S.T.; Hanif, M.; et al. Submarine landslide megablocks show half of Anak Krakatau island failed on December 22nd, 2018. Nat. Commun. 2021, 12, 2827. [Google Scholar] [CrossRef]
  6. Schmincke, H.-U. Vulkanismus, Wissenschaftliche Buchgesellschaft Darnstadt; Sumita, M., Nishimua, Y., Eds.; Kokon-shoin: Tokyo, Japan, 2016. (In Japanese) [Google Scholar]
  7. Nogami, K.; Yoshida, M.; Ossaka, J. Chemical composition of discolored seawater around Satsuma-Iwojima, Kagoshima, Japan. Bull. Volcanol. Soc. Jpn. 1993, 38, 71–77. [Google Scholar]
  8. Ossaka, J.; Adachi, N.; Tsuchide, N.; Nogami, K. Chemical compositions of discolored sea water around Izu-Oshimaat the 1986 Eruption. Bull. Volcanol. Soc. Jpn. 2000, 38, 71–77. [Google Scholar]
  9. Urai, M.; Machida, S. Discolored seawater detection using ASTER reflectance products: A case study of Satsuma-Iwojima, Japan. Remote Sens. Environ. 2005, 99, 95–104. [Google Scholar] [CrossRef]
  10. Urai, M. Time series analysis of discolored seawater reflectance observed by Advanced Visible and Near infrared Radiometer type 2 (AVNIR-2) at Fukutoku-Okonaba submarine volcano, Japan. J. Volcanol. Geotherm. Res. 2014, 269, 23–27. [Google Scholar] [CrossRef]
  11. Prata, A.T.; Folch, A.; Prata, A.J.; Biondi, R.; Brenot, H.; Cimarelli, C.; Corradini, S.; Lapierre, J.; Costa, A. Anak Krakatau triggers volcanic freezer in the upper troposphere. Sci. Rep. 2020, 10, 3584–3597. [Google Scholar] [CrossRef] [Green Version]
  12. Ohsawa, S.; Kawamura, T.; Takamatsu, N.; Yusa, Y. Rayleigh scattering by aqueous colloidal silica as a cause for the blue color of hydrothermal water. J. Volcanol. Geotherm. Res. 2002, 113, 49–60. [Google Scholar] [CrossRef]
  13. Onda, Y.; Ohsawa, S.; Takamatsu, N. A colorimetric and geochemical study of the coloration factor of hyper-acid active crater lakes. Jpn. J. Limnol. 2003, 64, 1–10. [Google Scholar] [CrossRef]
  14. Larrain, R.E.; Schaefer, D.M.; Reed, J.D. Use of digital images to estimate CIE color coordinates of beef. Food Res. Int. 2008, 41, 380–385. [Google Scholar] [CrossRef]
  15. Hori, M.; Murakami, H.; Miyazaki, R.; Honda, Y.; Nasahara, K.; Kajiwara, K.; Nakajima, T.Y.; Irie, H.; Toratani, M.; Hirawake, T.; et al. GCOM-C data validation plan for land, atmosphere, ocean, and cryosphere. Aerospace Technology Japan. Trans. Jpn. Soc. Aeronaut. Space Sci. Aerosp. Technol. Jpn. 2018, 16, 218–223. [Google Scholar]
  16. Sakuno, Y. Trial of chemical composition estimation related to submarine volcano activity using discolored seawater color data obtained from GCOM-C SGLI. A case study of Nishinoshima Island, Japan, in 2020. Water 2021, 13, 1100. [Google Scholar] [CrossRef]
  17. Fiantis, D.; Ginting, F.I.; Nelson, M.; Van Ranst, E.; Minasny, B.; Minasny, B. Geochemical characterization and evolution of soils from Krakatau islands. Eurasian Soil Sci. 2021, 54, 1629–1643. [Google Scholar] [CrossRef]
  18. Ren, Z.; Wang, Y.; Wang, P.; Hou, J.; Gao, Y.; Zhao, L. Numerical study of the triggering mechanism of the 2018 Anak Krakatau tsunami: Eruption or collapsed landslide? Nat. Hazards 2020, 102, 1–13. [Google Scholar] [CrossRef]
  19. Muhari, A.; Heidarzadeh, M.; Susmoro, H.; Nugroho, H.D.; Kriswati, E.; Wijanarto, A.B.; Wijanarto, A.B.; Imamura, F.; Arikawa, T. The December 2018 Anak Krakatau Volcano tsunami as inferred from post-tsunami field surveys and spectral analysis. Pure Appl. Geophys. 2019, 176, 5219–5233. [Google Scholar] [CrossRef] [Green Version]
  20. Novellino, A.; Engwell, S.L.; Grebby, S.; Day, S.; Cassidy, M.; Madden-Nadeau, A.; Watt, S.; Pyle, D.; Abdurrachman, M.; Edo Marshal Nurshal, M.; et al. Mapping recent shoreline changes spanning the lateral collapse of Anak Krakatau Volcano, Indonesia. Appl. Sci. 2020, 10, 536. [Google Scholar] [CrossRef] [Green Version]
  21. Grilli, S.T.; Tappin, D.R.; Carey, S.; Watt, S.F.; Ward, S.N.; Grilli, A.R.; Engwell, S.L.; Zhang, C.; Kirby, J.T.; Muin, M. Modelling of the tsunami from the December 22, 2018 lateral collapse of Anak Krakatau volcano in the Sunda Straits, Indonesia. Sci. Rep. 2019, 9, 11946. [Google Scholar] [CrossRef] [Green Version]
  22. Japanese Standard Association. JIS Handbook; Japanese Standards Association: Tokyo, Japan, 2010; Volume 61. (In Japanese) [Google Scholar]
  23. Kuge, Y. Conversion between Chromaticity Coordinates and Dominant Wavelength, Purity of XYZ Colorimetric System. J. Jpn. Soc. Colour Mater. 1985, 58, 591–593. [Google Scholar] [CrossRef] [Green Version]
  24. National Astronomical Observatory of Japan. Chronological Scientific Tables; Maruzen: Tokyo, Japan, 2020. [Google Scholar]
  25. Eugenio, F.; Martin, J.; Marcello, J.; Fraile-Nuez, E. Environmental monitoring of El Hierro Island submarine volcano, by combining low and high resolution satellite imagery. Int. J. Appl. Earth Obs. Geoinf. 2014, 29, 53–66. [Google Scholar] [CrossRef]
  26. Caballero, I.; Román, A.; Tovar-Sánchez, A.; Navarro, G. Water quality monitoring with Sentinel-2 and Landsat-8 satellites during the 2021 volcanic eruption in La Palma (Canary Islands). Sci. Total Environ. 2022, 822, 153433. [Google Scholar] [CrossRef] [PubMed]
  27. Mantas, V.M.; Pereira, A.J.S.C.; Morais, P.V. Plumes of discolored water of volcanic origin and possible implications for algal communities. The case of the Home Reef eruption of 2006 (Tonga, Southwest Pacific Ocean). Remote Sens. Environ. 2011, 115, 1341–1352. [Google Scholar] [CrossRef]
  28. Whiteside, A.S.; Dupouy, C.; Singh, A.; Bani, P.; Frouin, R. Impact of ashes from the 2022 Tonga volcanic eruption on satellite ocean color signatures. Front. Mar. Sci. 2023, 10, 2566–2581. [Google Scholar] [CrossRef]
  29. Williams, R.; Rowley, P.; Garthwaite, M.C. Reconstructing the Anak Krakatau flank collapse that caused the December 2018 Indonesian tsunami. Geology 2019, 47, 973–976. [Google Scholar] [CrossRef] [Green Version]
  30. Gouhier, M.; Paris, R. SO2 and tephra emissions during the December 22, 2018 Anak Krakatau eruption. Volcanica 2019, 2, 91–103. [Google Scholar]
  31. Deplus, C.; Bonvalot, S.; Dahrin, D.; Diament, M.; Harjono, H.; Dubois, J. Inner structure of the Krakatau volcanic complex (Indonesia) from gravity and bathymetry data. J. Volcanol. Geotherm. Res. 1995, 64, 23–52. [Google Scholar] [CrossRef]
  32. Paris, A.; Heinrich, P.; Paris, R.; Abadie, S. The December 22, 2018 Anak Krakatau, Indonesia, landslide and tsunami: Preliminary modeling results. Pure Appl. Geophys. 2020, 177, 571–590. [Google Scholar] [CrossRef] [Green Version]
Figure 1. Study area with bathymetry information.
Geohazards 04 00007 g001
Figure 2. Schematic of dominant wavelength calculation. (a) Spectral reflectance from SGLI data, (b) color weighting function of the CIE 1931, (c) chromaticity diagram of the CIE 1931, and the relationship between θ and the dominant wavelength (circumferential wavelength trajectory).
Geohazards 04 00007 g002
Figure 3. Relationship between θ (Figure 2c) and the dominant wavelength.
Geohazards 04 00007 g003
Figure 4. Comparison of the satellite data used. The Sentinel-2 image (a) was acquired on the same day as the SGLI image (b) (31 March 2019), QA flag image (c) of the SGLI VGI product, and the SGLI image (d) before the eruption. The square surrounded by red in Figure 3c is the discolored seawater area where the chromaticity judgment of SGLI was performed.
Geohazards 04 00007 g004
Figure 5. Colorimetric data of seawater at the five directions (west, north, east, south, and south-west) around Anak Krakatau from October 2018 to March 2019 using GCOM-C SGLI data.
Geohazards 04 00007 g005
Figure 6. An example of a dominant wavelength map with 500 nm and 560 nm contours on 8 January 2019.
Geohazards 04 00007 g006
Figure 7. Dominant wavelength map around Anak Krakatau from 1 October 2018 to 31 March 2019.
Geohazards 04 00007 g007
Figure 8. Dominant wavelength contour map of 560 nm around Anak Krakatau from 8 January to 31 March 2018 extracted by using SGLI data.
Geohazards 04 00007 g008
Figure 9. Area change of discolored seawater around Anak Krakatau.
Geohazards 04 00007 g009
Table 1. A list of the GCOM-C SGLI data used in this study.
No.DateData Name
11 October 2018GC1SG1_20181001D01D_T0928_L2SG_RSRFQ_3001.h5
25 October 2018GC1SG1_20181005D01D_T0928_L2SG_RSRFQ_3001.h5
317 October 2018GC1SG1_20181017D01D_T0928_L2SG_RSRFQ_3001.h5
41 November 2018GC1SG1_20181101D01D_T0928_L2SG_RSRFQ_3001.h5
516 November 2018GC1SG1_20181116D01D_T0928_L2SG_RSRFQ_3001.h5
620 November 2018GC1SG1_20181120D01D_T0928_L2SG_RSRFQ_3001.h5
720 December 2018GC1SG1_20181220D01D_T0928_L2SG_RSRFQ_3001.h5
88 January 2019GC1SG1_20190108D01D_T0928_L2SG_RSRFQ_3001.h5
911 January 2019GC1SG1_20190111D01D_T0928_L2SG_RSRFQ_3001.h5
1012 January 2019GC1SG1_20190112D01D_T0928_L2SG_RSRFQ_3001.h5
113 February 2019GC1SG1_20190203D01D_T0928_L2SG_RSRFQ_3001.h5
1211 February 2019GC1SG1_20190211D01D_T0928_L2SG_RSRFQ_3001.h5
1318 February 2019GC1SG1_20190218D01D_T0928_L2SG_RSRFQ_3001.h5
1422 February 2019GC1SG1_20190222D01D_T0928_L2SG_RSRFQ_3001.h5
1524 March 2019GC1SG1_20190324D01D_T0928_L2SG_RSRFQ_3001.h5
1627 March 2019GC1SG1_20190327D01D_T0928_L2SG_RSRFQ_3001.h5
1731 March 2019GC1SG1_20190331D01D_T0928_L2SG_RSRFQ_3001.h5
Table 2. Average and standard deviation (SD) for x and y, dominant wavelengths (DWL), and the number of data (N) for each station. The data of 1 October 2018, 20 November 2018, 11 January 2019, and 3 February 2019, when the values obviously deviated from the chromaticity diagram or the missing data, were excluded from the statistical data.
Stn. *Stat. **October–December 2018January–March 2019
xyDWL (nm)NxyDWL (nm)N
WAVE0.240.2749740.320.365399
SD0.020.0230.060.0542
NAVE0.250.2949750.260.314969
SD0.010.0220.020.034
EAVE0.240.2949750.260.3049610
SD0.010.0320.020.024
SAVE0.240.2849750.290.3350510
SD0.010.0230.060.0626
SWAVE0.240.2849740.380.3854110
SD0.020.0330.080.0643
AllAVE0.240.28497230.300.3451548
SD0.020.0220.070.0635
* Stn.: stations, W: west, N: north, E: east, S: south, SW: south-west; ** Stat.: statistics, AVE: average, SD: standard deviation, DWL: dominant wavelength, N: number of data.
Disclaimer/Publisher’s Note: The statements, opinions and data contained in all publications are solely those of the individual author(s) and contributor(s) and not of MDPI and/or the editor(s). MDPI and/or the editor(s) disclaim responsibility for any injury to people or property resulting from any ideas, methods, instructions or products referred to in the content.

