Article

Integrated Runoff-Storm Surge Flood Hazard Mapping Associated with Tropical Cyclones in the Suburbs of La Paz, Baja California Sur, México

by
Miguel Angel Imaz-Lamadrid
1,*,
Jobst Wurl
2,
Ernesto Ramos-Velázquez
2 and
Jaqueline Rodríguez-Trasviña
2
1
Departamento Académico de Ingeniería en Pesquerías, UABCS, La Paz 23085, BCS, Mexico
2
Departamento Académico de Ciencias de La Tierra, UABCS, La Paz 23085, BCS, Mexico
*
Author to whom correspondence should be addressed.
GeoHazards 2022, 3(1), 1-15; https://doi.org/10.3390/geohazards3010001
Submission received: 21 November 2021 / Revised: 4 December 2021 / Accepted: 23 December 2021 / Published: 28 December 2021

Abstract

:
Floods are amongst the most frequent and destructive type of disaster, causing significant damage to communities. Globally, there is an increasing trend in the damage caused by floods generated by several factors. Flooding is characterized by the overflow of water onto dry land. Tropical cyclones generate floods due to excess water in rivers and streams and storm surges; however, the hazard of both phenomena is presented separately. In this research we present a methodology for the estimation of flood hazards related to tropical cyclones, integrating runoff and storm surge floods. As a case study, we selected the south-western suburbs of the city of La Paz, the capital of the state of Baja California Sur in northwest Mexico. The city has experienced in recent years an expansion of the urban area. In addition, there is an infrastructure of great importance such as the transpeninsular highway that connects the capital with the north of the state, as well as the international airport. Our results indicate that urban areas, agricultural lands, as well as the air force base, airport, and portions of the transpeninsular highway are in hazardous flood areas, making necessary to reduce the exposure and vulnerability to these tropical cyclone-related events. A resulting map was effective in defining those areas that would be exposed to flooding in the face of the impact of tropical cyclones and considering climate change scenarios, which represents an invaluable source of information for society and decision-makers for comprehensive risk management and disaster prevention.

1. Introduction

Floods are amongst the most frequent and destructive types of disaster, causing significant damage to communities [1,2,3]. According to the United Nations Office for Disaster Risk Reduction [2], floods were the most frequent disaster for the period 1998–2017, affecting two billion people, causing 142,088 deaths, and economic impacts of US$ 656 billion. Globally, there is an increasing trend in the damage caused by floods, the main causes being deforestation of valleysand increasing economic activity on territories at risk, global warming [2,4], expansion of urban areas [5] and installation of irregular settlements in hazardous areas. In the context of climate change, there is forecast of an increase of frequency and intensity of tropical cyclones and a sea-level rise, which may lead to an increase of floods, therefore generating negative impacts to economies, livelihoods, infrastructure among others.
Flooding is characterized by the overflow of water onto dry land [5,6]. Inland floods can be originated by abnormal runoff of rivers and creeks as a result of excessive rain from tropical cyclones, persistent thunderstorms, and snowmelt, while on the coastline they may occur as a result of geologic, oceanographic and hydrometeorological processes such as abnormal tides, storm surges and tsunamis [1]. In this context, tropical cyclones can generate floods related to extreme rainfall and storm surges. The processes that generate floods are complex and depend on several spatial and temporal factors related to the event that triggers them. Overflows in streams and creeks are complex processes that depend on factors such as rainfall patterns, topography, geology, sedimentology, and geomorphology [6]. In urban environments where the landscape is ever-changing, spatial factors such as ground cover, green spaces, and drainage systems have a significant impact [6,7]. On the other hand, storm surges are considered among the most disastrous marine/coastal hazards especially in combination with astronomical high tides and waves [8,9,10]. The processes which drive these phenomena are related to factors such as atmospheric pressure and surface stress [11], while impacts inland are further related to bathymetry and topography of the coastal area, angle of approach, vegetation, and urbanization [12,13,14]. The difference between the factors involved in each requires different methodologies to characterize their hazards. A river-creek flooding hazard can be determined by geomorphological approaches [15], GIS analysis [5,16], and hydraulic modeling in 1-D or 2-D [3,17,18]. In the case of storm surges, statistical approaches [19] andnumerical modeling [10,20] are used to define the height of the surge, while a DEM-GIS approach [21,22] and hydrodynamic modeling [23,24] can define storm surge inundation.
In terms of flood risk and risk management, detailed flood hazard mapping is an alternative to improve management of the situation with increased exposure and vulnerability [3]; however, in the context of runoff flooding and storm surge inundation, hazard calculation and mapping are presented separately, although they can be generated by the same hydrometeorological event.
In this context, we propose a new methodology for the integration of both events in a single runoff-storm surge hazard map. As a case study, we selected the southwestern portion of the city of La Paz, the capital of Baja California Sur state (BCS) in northwestern Mexico, which is frequently affected by tropical cyclones. Flooding hazard maps for the study area have been presented by [25,26]; however, they lack detail. In addition to generating a novel methodology, our work allows us to quantify in greater detail the hazard in the study area, which will help decision-makers to implement mitigation and adaptation actions.

2. Materials and Methods
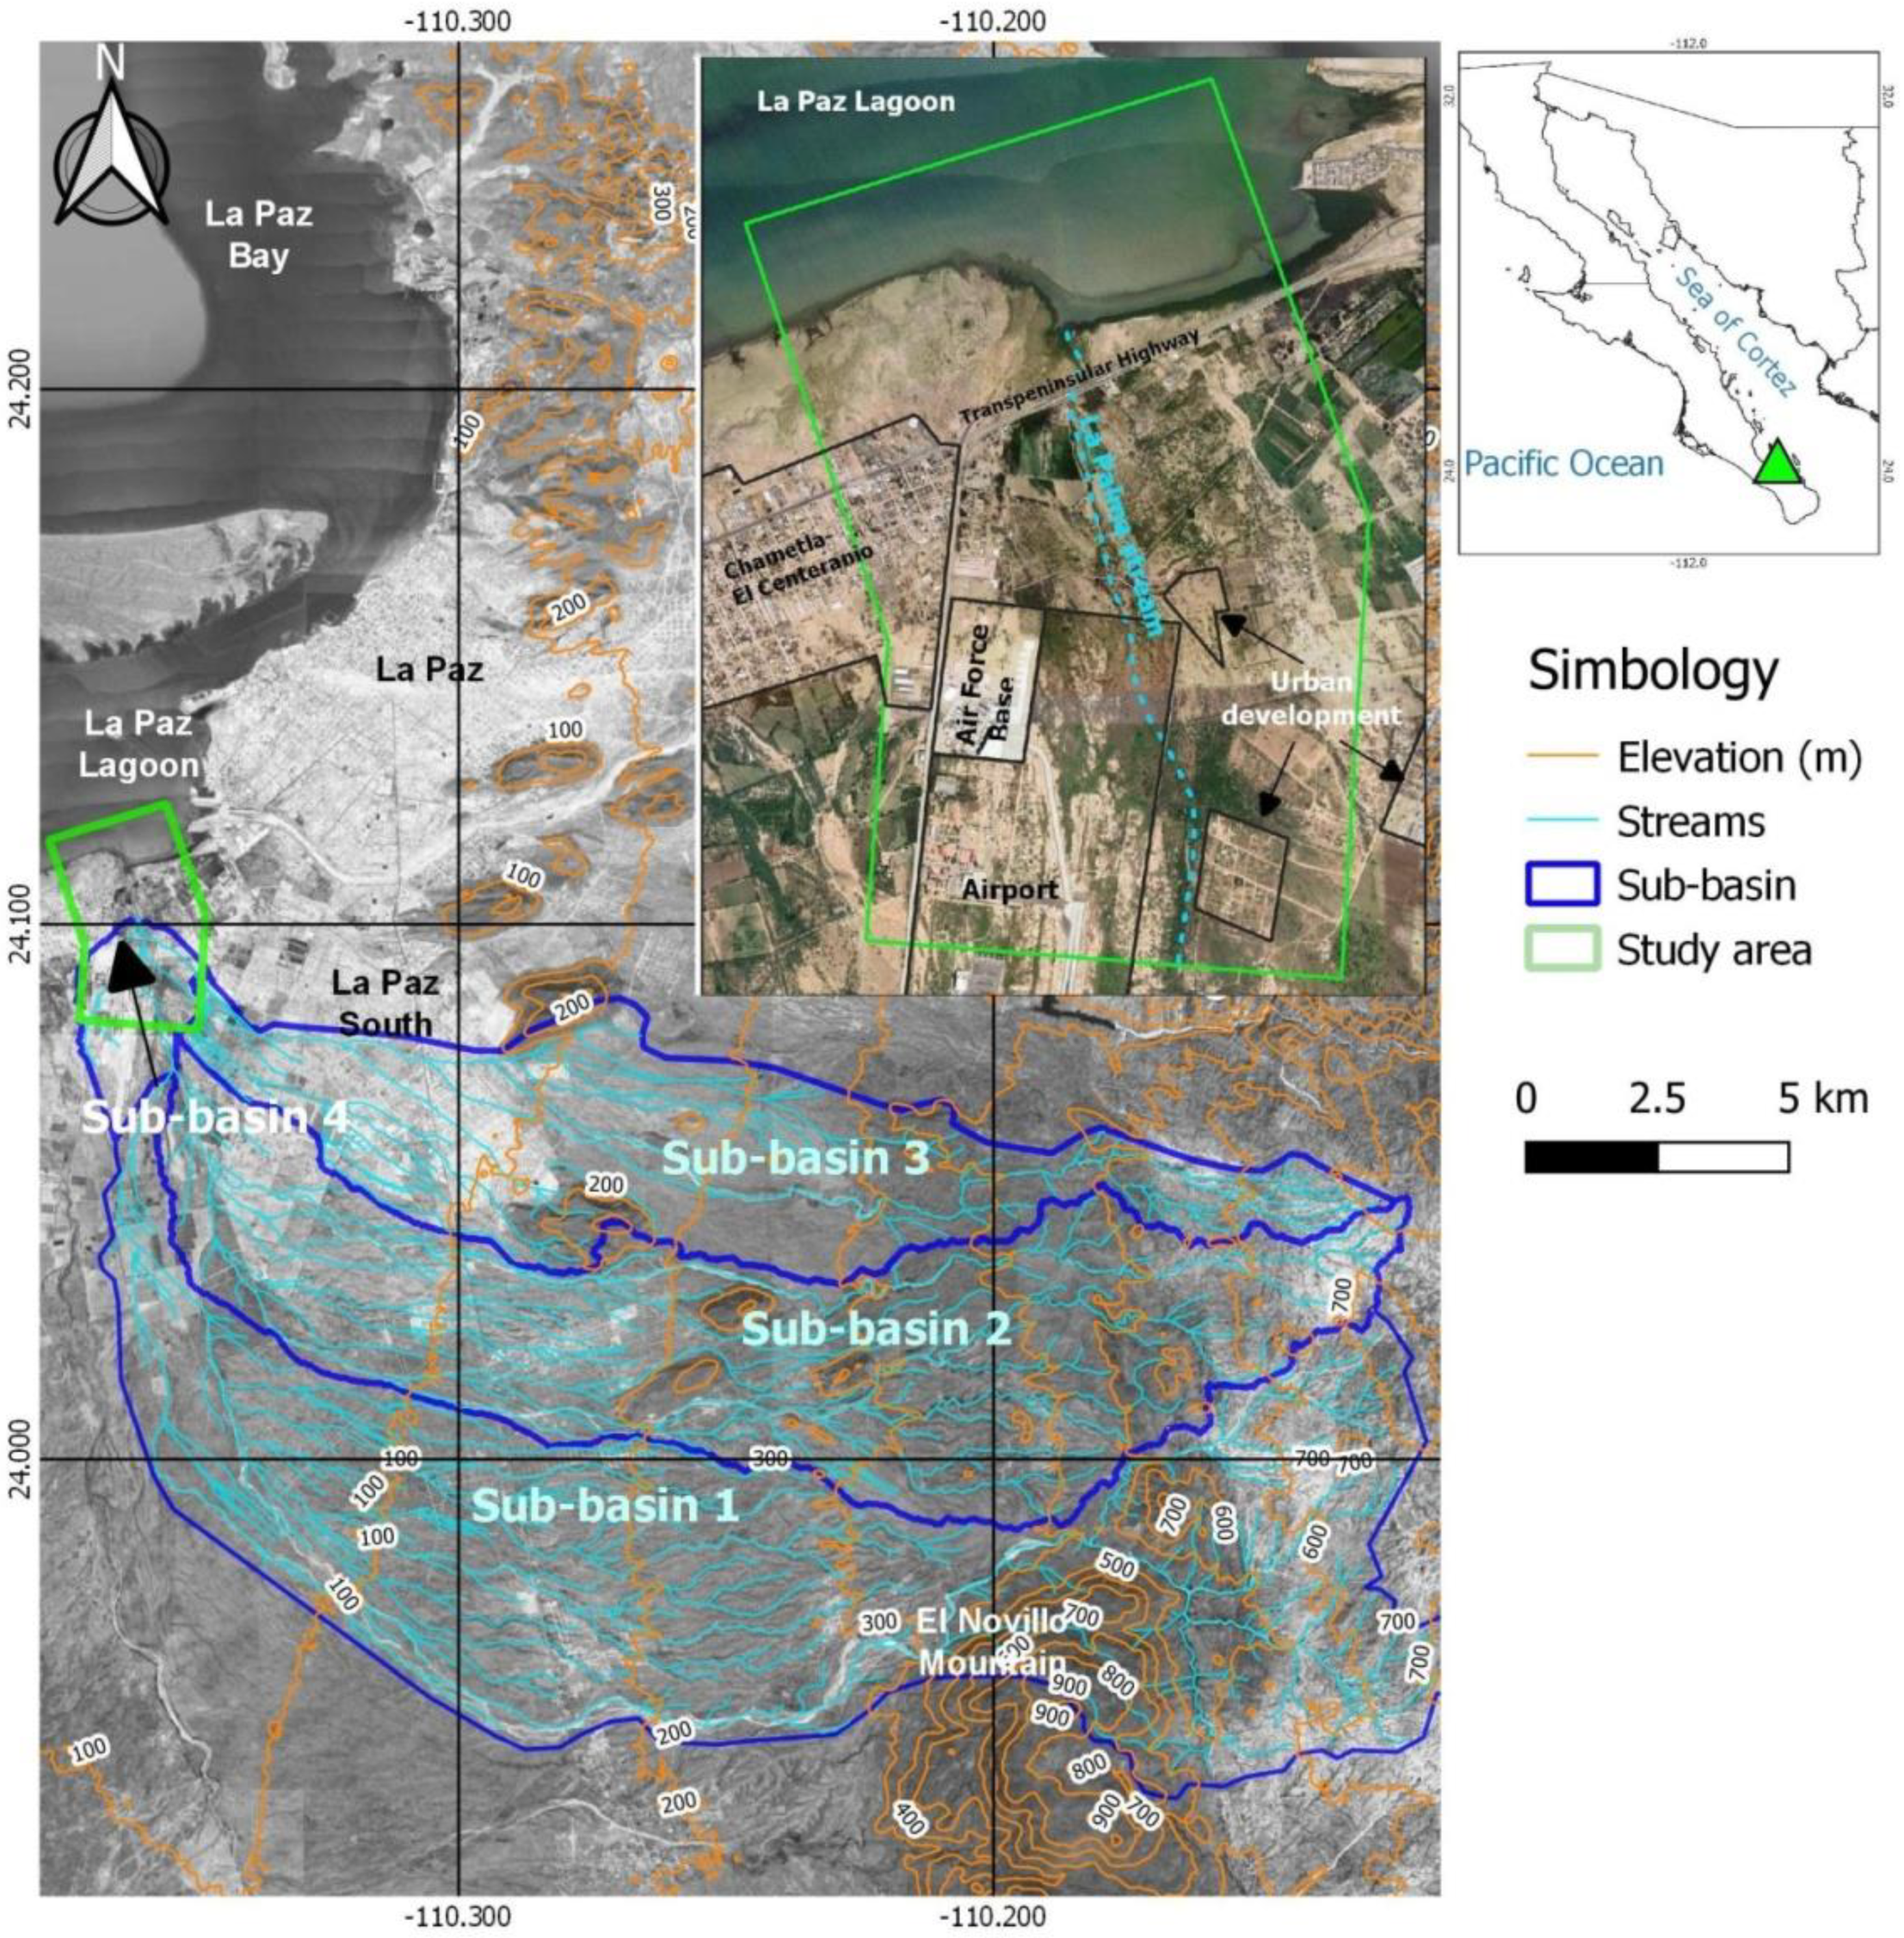
2.1. Study Area

The study area of 8.6 km2 is located in the southwestern portion of the city of La Paz, which is the capital of Baja California Sur state in western Mexico.
Baja California Sur is the state in northern Mexico most affected by hydrometeorological events due to their trajectory and formation (mainly tropical storms and hurricanes) [27]. An example of this situation occurred when hurricane Liza impacted the city of La Paz in 1976, causing the death of at least 600 people and with 20,000 victims [27]. More recently, hurricane Odile impacted the south of the state as a category III storm on the Saffir-Simpson scale, resulting in 10,978 homes and 923 damaged schools, as well as having various effects on primary infrastructure (power and water supply), and local industry, causing an economic impact of US$ 1.2 billion [28]. Extreme events such as hurricanes Liza and Odile may occur more frequently, since climate change scenarios for the region predict that the frequency and intensity of tropical cyclones could increase in the future [29].
The city together with the metropolitan has an area of 122.72 km2 and has experienced high population growth rate, increasing from 215,178 inhabitants in 2010 to 270,846 inhabitants by 2020, representing an increase of 25% [30,31]. The study area is of vital importance for the city since it is the access point to the international airport and the highway that connects the capital with the north of the state. The area is also a pole of urban expansion since, for 5 years, real estate projects have been developed towards the east, closer to the flooding zone of the La Palma stream [32]. Agricultural activity is also present in the area [32]. Geomorphologically, the study area represents an alluvial flat with 0.25% of slope and a maximum elevation of 14 m in the southern boundary. Towards the coast, there are marshes with the predominating vegetation being mangroves (Figure 1).
From a geological point of view, the city of La Paz is located in a half-graben structure defined by the El Carrizal fault to the west and the crystalline block of the Sierra de Las Cruces to the east [33]. The oldest rocks correspond to the Sierra de Las Cruces and comprise an intrusive suite of granite rocks from the Cretaceous, ranging from gabbro to granite [34]. Overlaying the crystalline Cretaceous rocks, a sedimentary sequence from the Oligocene-Early Miocene, composed of conglomerate and aeolian sandstone outcrops, in a discordant way [35]. Overlying these sedimentary rocks there is a sequence composed of volcanogenic rocks from the Middle Miocene, which covers most of the southern part of the Baja California peninsula, constituting the Sierra de la Giganta and known as the Comondú Group [36]. In the La Paz region, this sequence outcrops more extensively to the north, in the Punta Coyote region, and to the south it forms isolated hills dissected by stream channels [37,38]. The younger geological units comprise the topographically lower areas and are located mainly towards the central part of the La Paz basin. These units are conformed by several generations of alluvial fans, as well as eolian and beach sediment deposits [32].
From a hydrological point of view, the city of La Paz is located within two main hydrological basins (RH06Ae and RH06AF), which, in turn, are subdivided into the El Cajoncito, La Huerta, La Palma, and El Novillo and additional sub-basins. The study area is located within the La Palma basin, with a surface area of 309.45 km2, is exorheic, and is subdivided into three main sub-basins, each with surfaces of 146.1, 98.95, and 64.4 km2. The maximum elevation in the basin is 700 m and the mean slope is 2% [39].
The main channel is the La Palma stream with a length of 44.4 km, which runs from the Sierra de las Cacachilas, and El Novillo to its river-mouth in the La Paz lagoon. The drainage network in the basin tends to be dendritic in the mountainous zone and parallel to subparallel in the lower parts. The mean annual runoff volume of the basin is 2.9 × 10⁶ m3, calculated from the isohyets of mean annual precipitation of INEGI [39], and has a runoff coefficient of 0.5% [39].
The climate is very dry and warm with an average annual temperature between 18 and 22 °C, which can exceed 40 °C during the summer [40]. The average annual rainfall is 200 mm/year in the valley and over 400 mm/year in the mountainous area [40]. Summer rains tend to be of great intensity and short duration, especially in August and September [41], due to the approach of tropical cyclones to the southern part of the Baja California Peninsula [42,43,44]. La Paz is also a municipality that is one of the most frequently impacted by tropical cyclones, with a return period of 5.6 years for category 1 hurricanes (according to the scale Saffir-Simpson) [27,45].

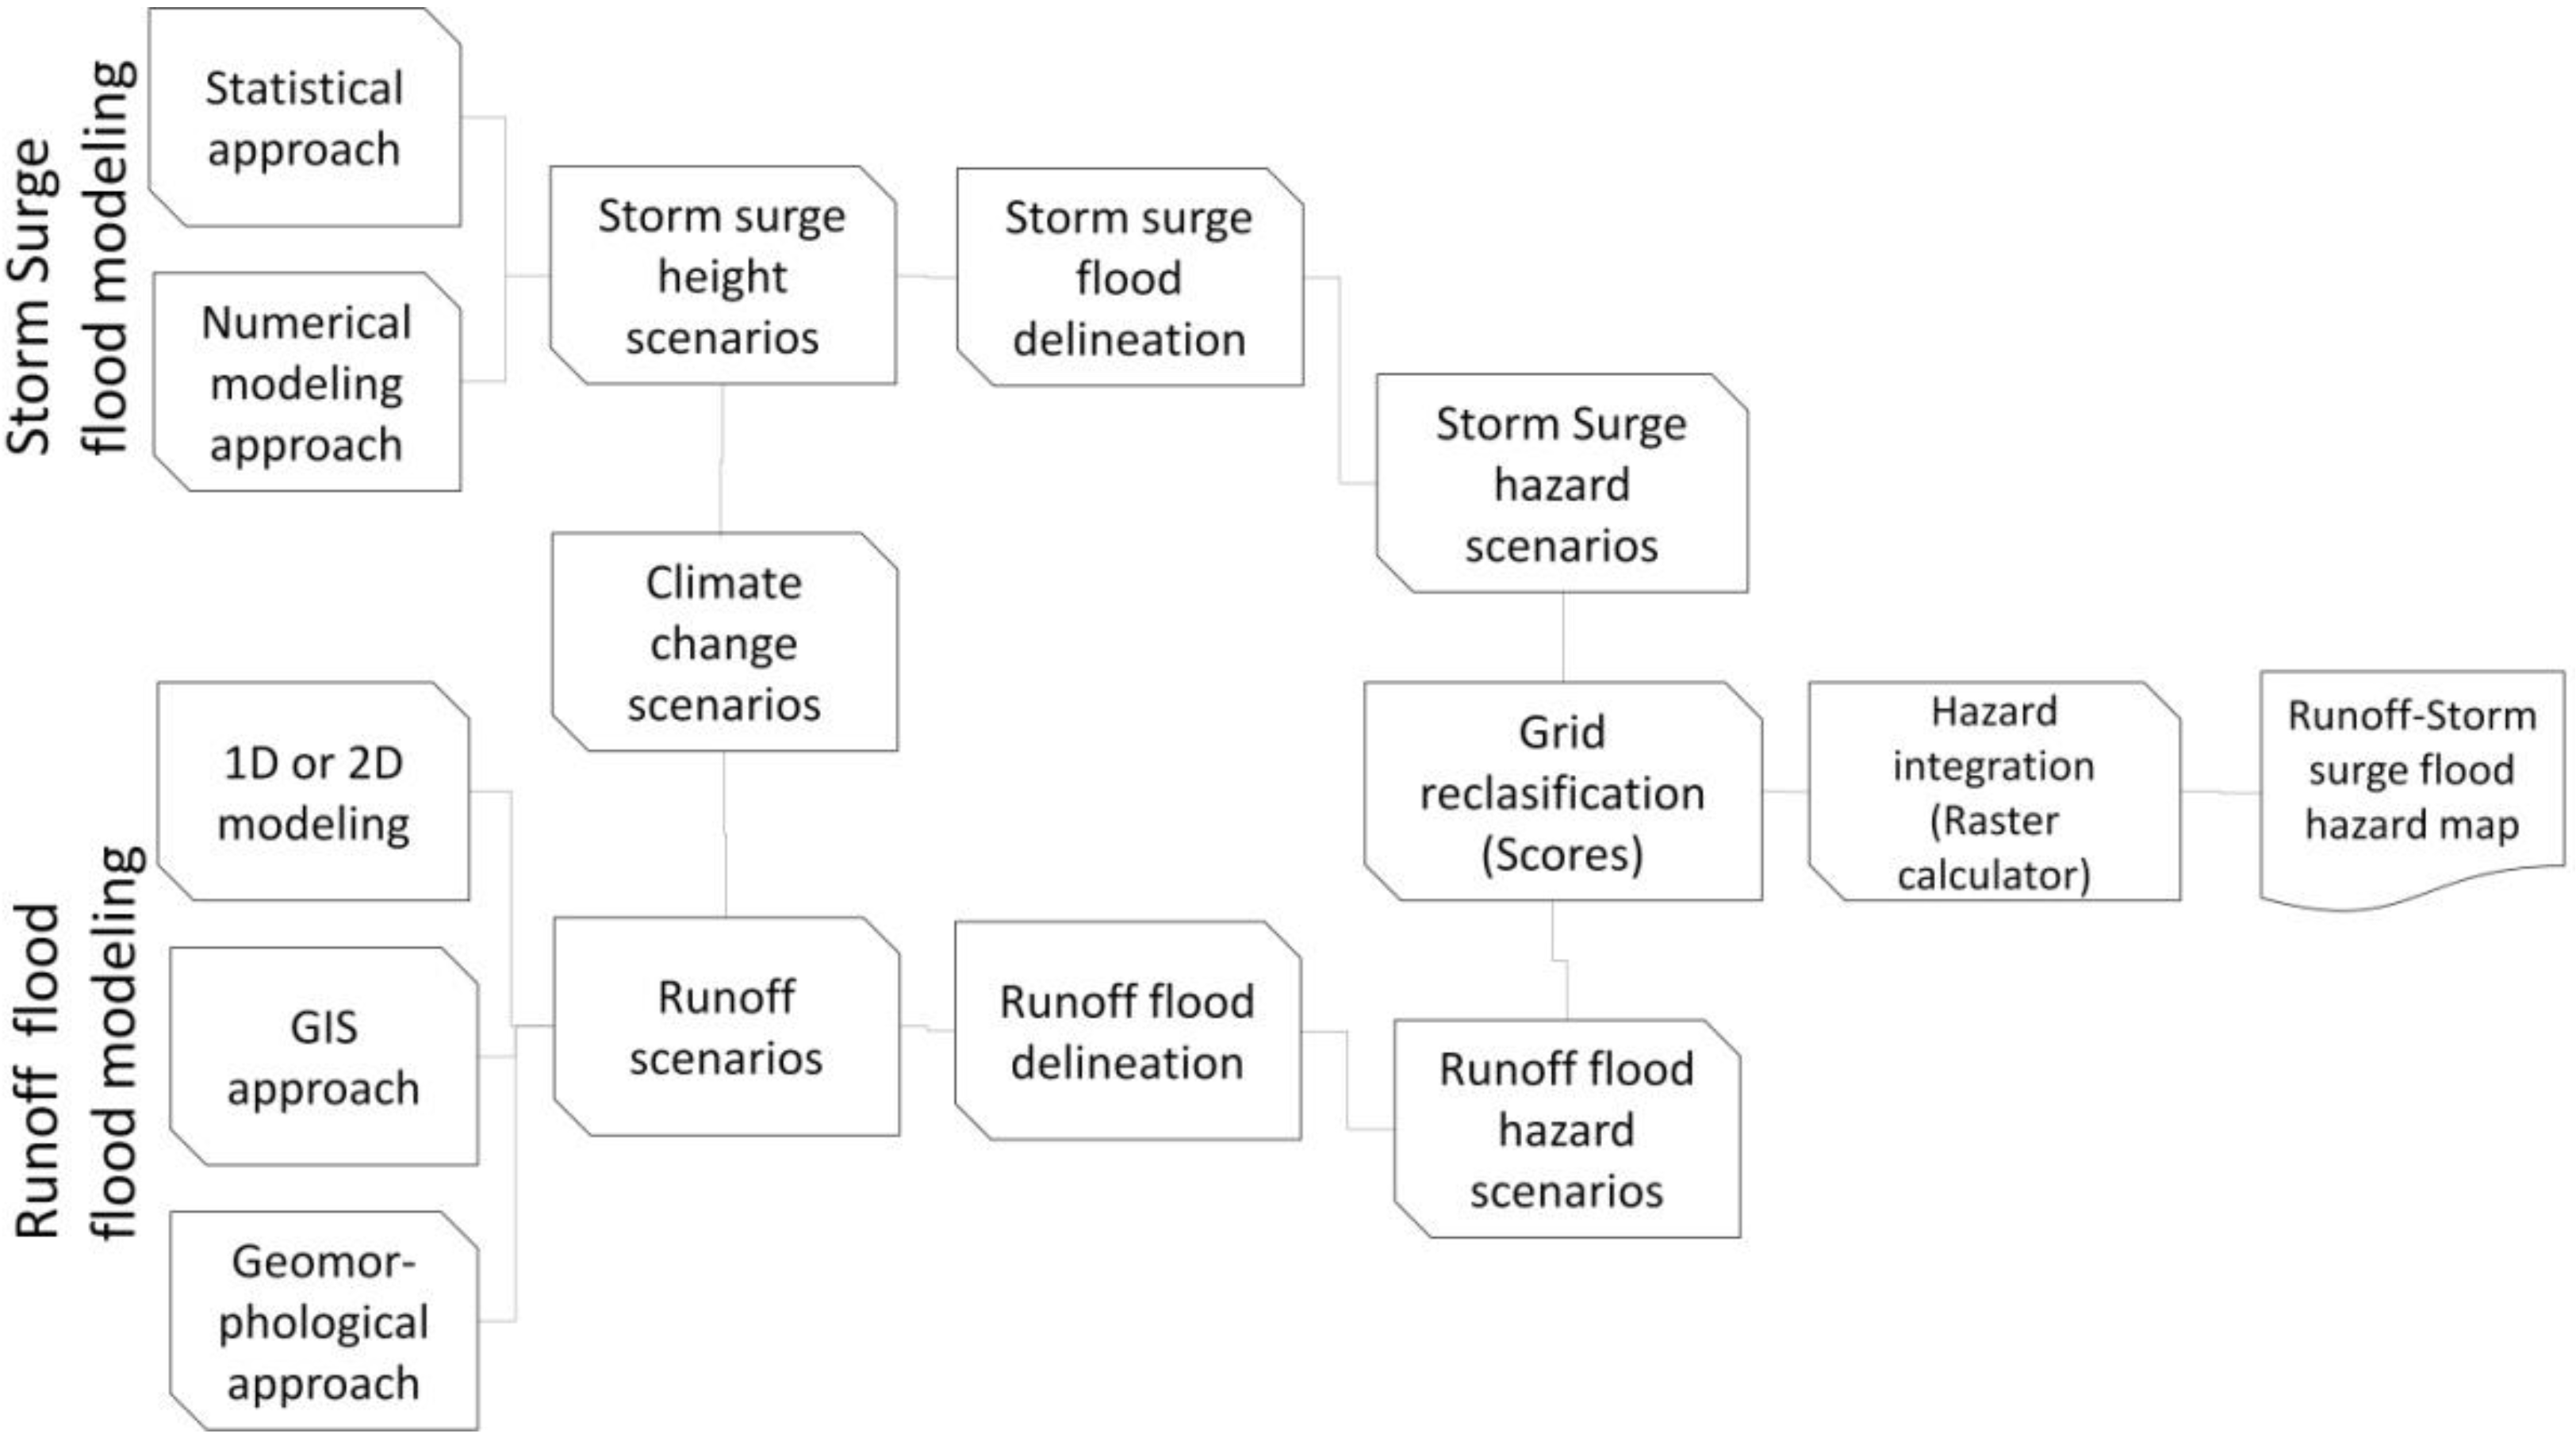
2.2. Methodology Conceptualization

The processes that lead to floods in rivers and streams, and those causing storm surges, are different but may occur at the same time. Their magnitudes are on a different scale and have different units. Calculating the hazards individually allows the results to be on the same scale, facilitating their integration in a single runoff-storm surge hazard map.
The first step consists of individually defining possible storm surge and runoff scenarios either from previous studies carried out in the study area or by calculating them from established methodologies such as numerical models and statistical analyses (storm surges), hydrological and statistical models for runoff (Figure 2).
Subsequently, once the scenarios for both phenomena have been defined, it is necessary to determine the flood that they could generate. In the case of storm surges, mathematical models or GIS approaches can be used to define the extent of the flood under different scenarios. In the case of runoffs, 1-D or 2-D modeling isthe most widely used methodology to determine the extent of the flood, although it can also be done through GIS analysis. All the results must be in raster format (Figure 2).
The next step consists in determining the hazard for each phenomenon individually. Four levels of hazards are considered: very high, high, moderate, and low, with scores of 4 to 1, respectively. The assignation of scores is performed directly on the resulting grids, performing a grid reclassification process in GIS software. As a result, the quantitative estimation of hazard for both phenomena are in the same scale.
Finally, both maps are integrated (sum of maps) using GIS (raster calculator or map algebra), resulting in the runoff-storm surge flood hazard map (Figure 2).

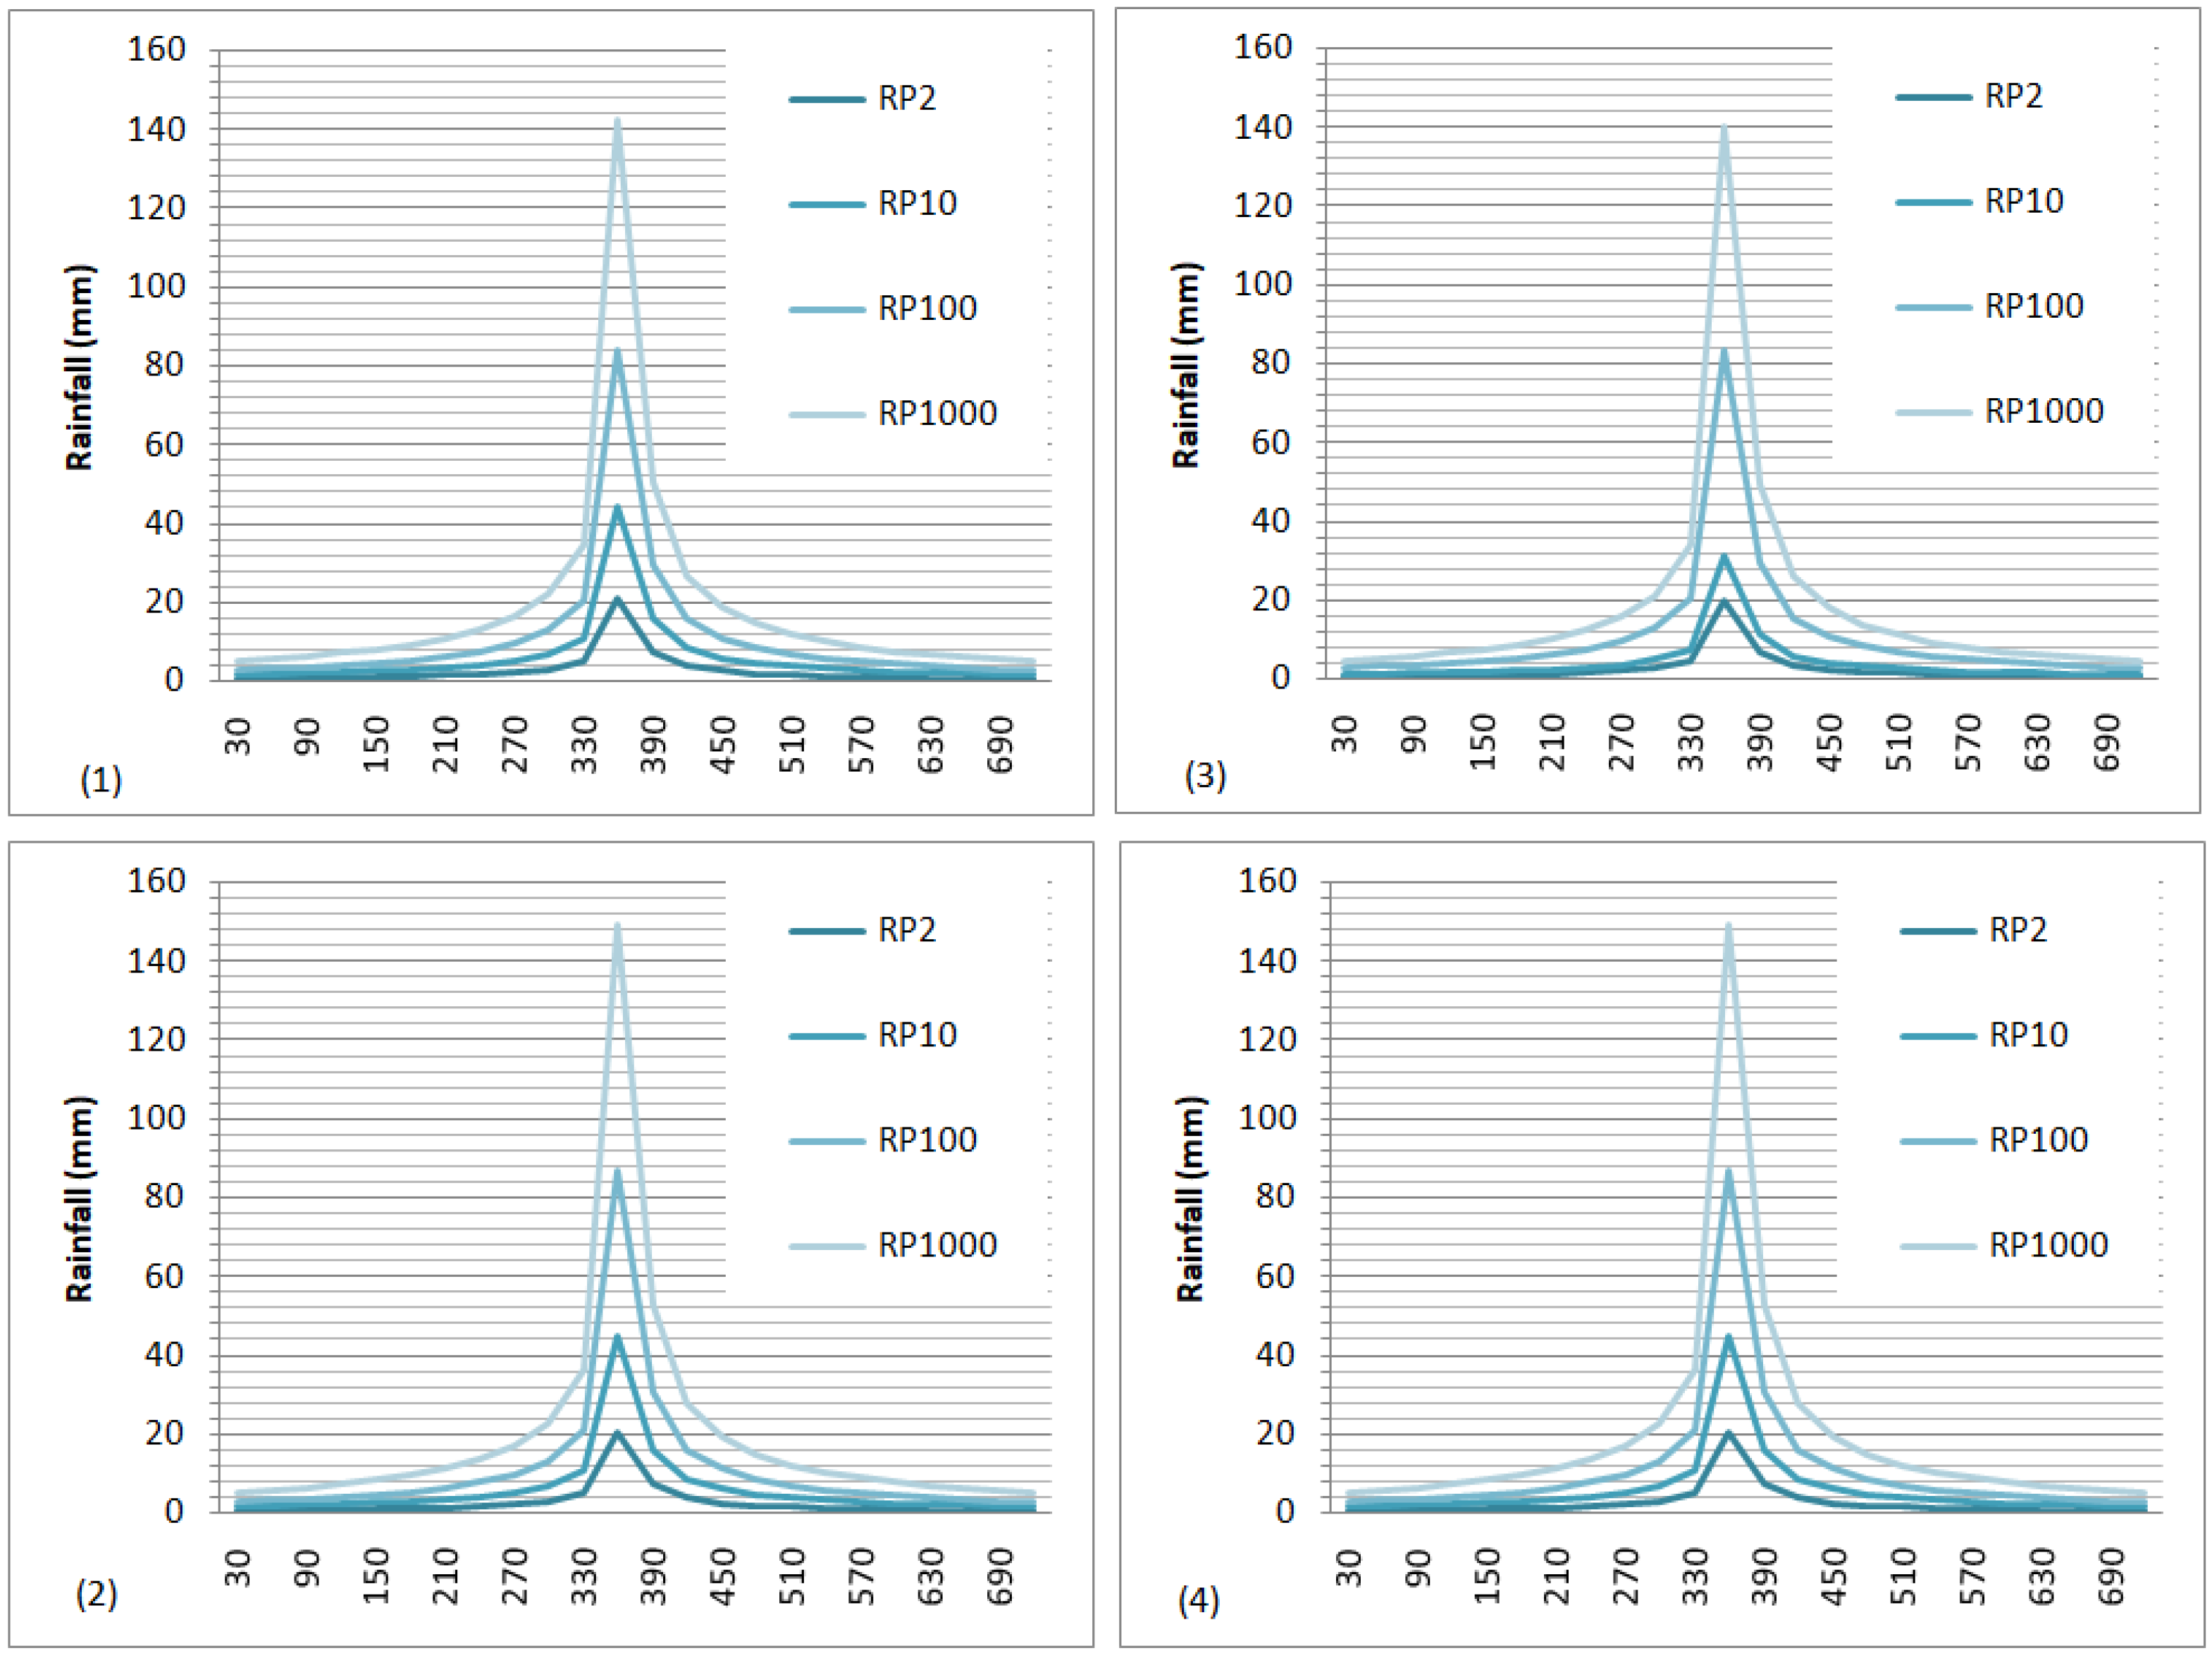
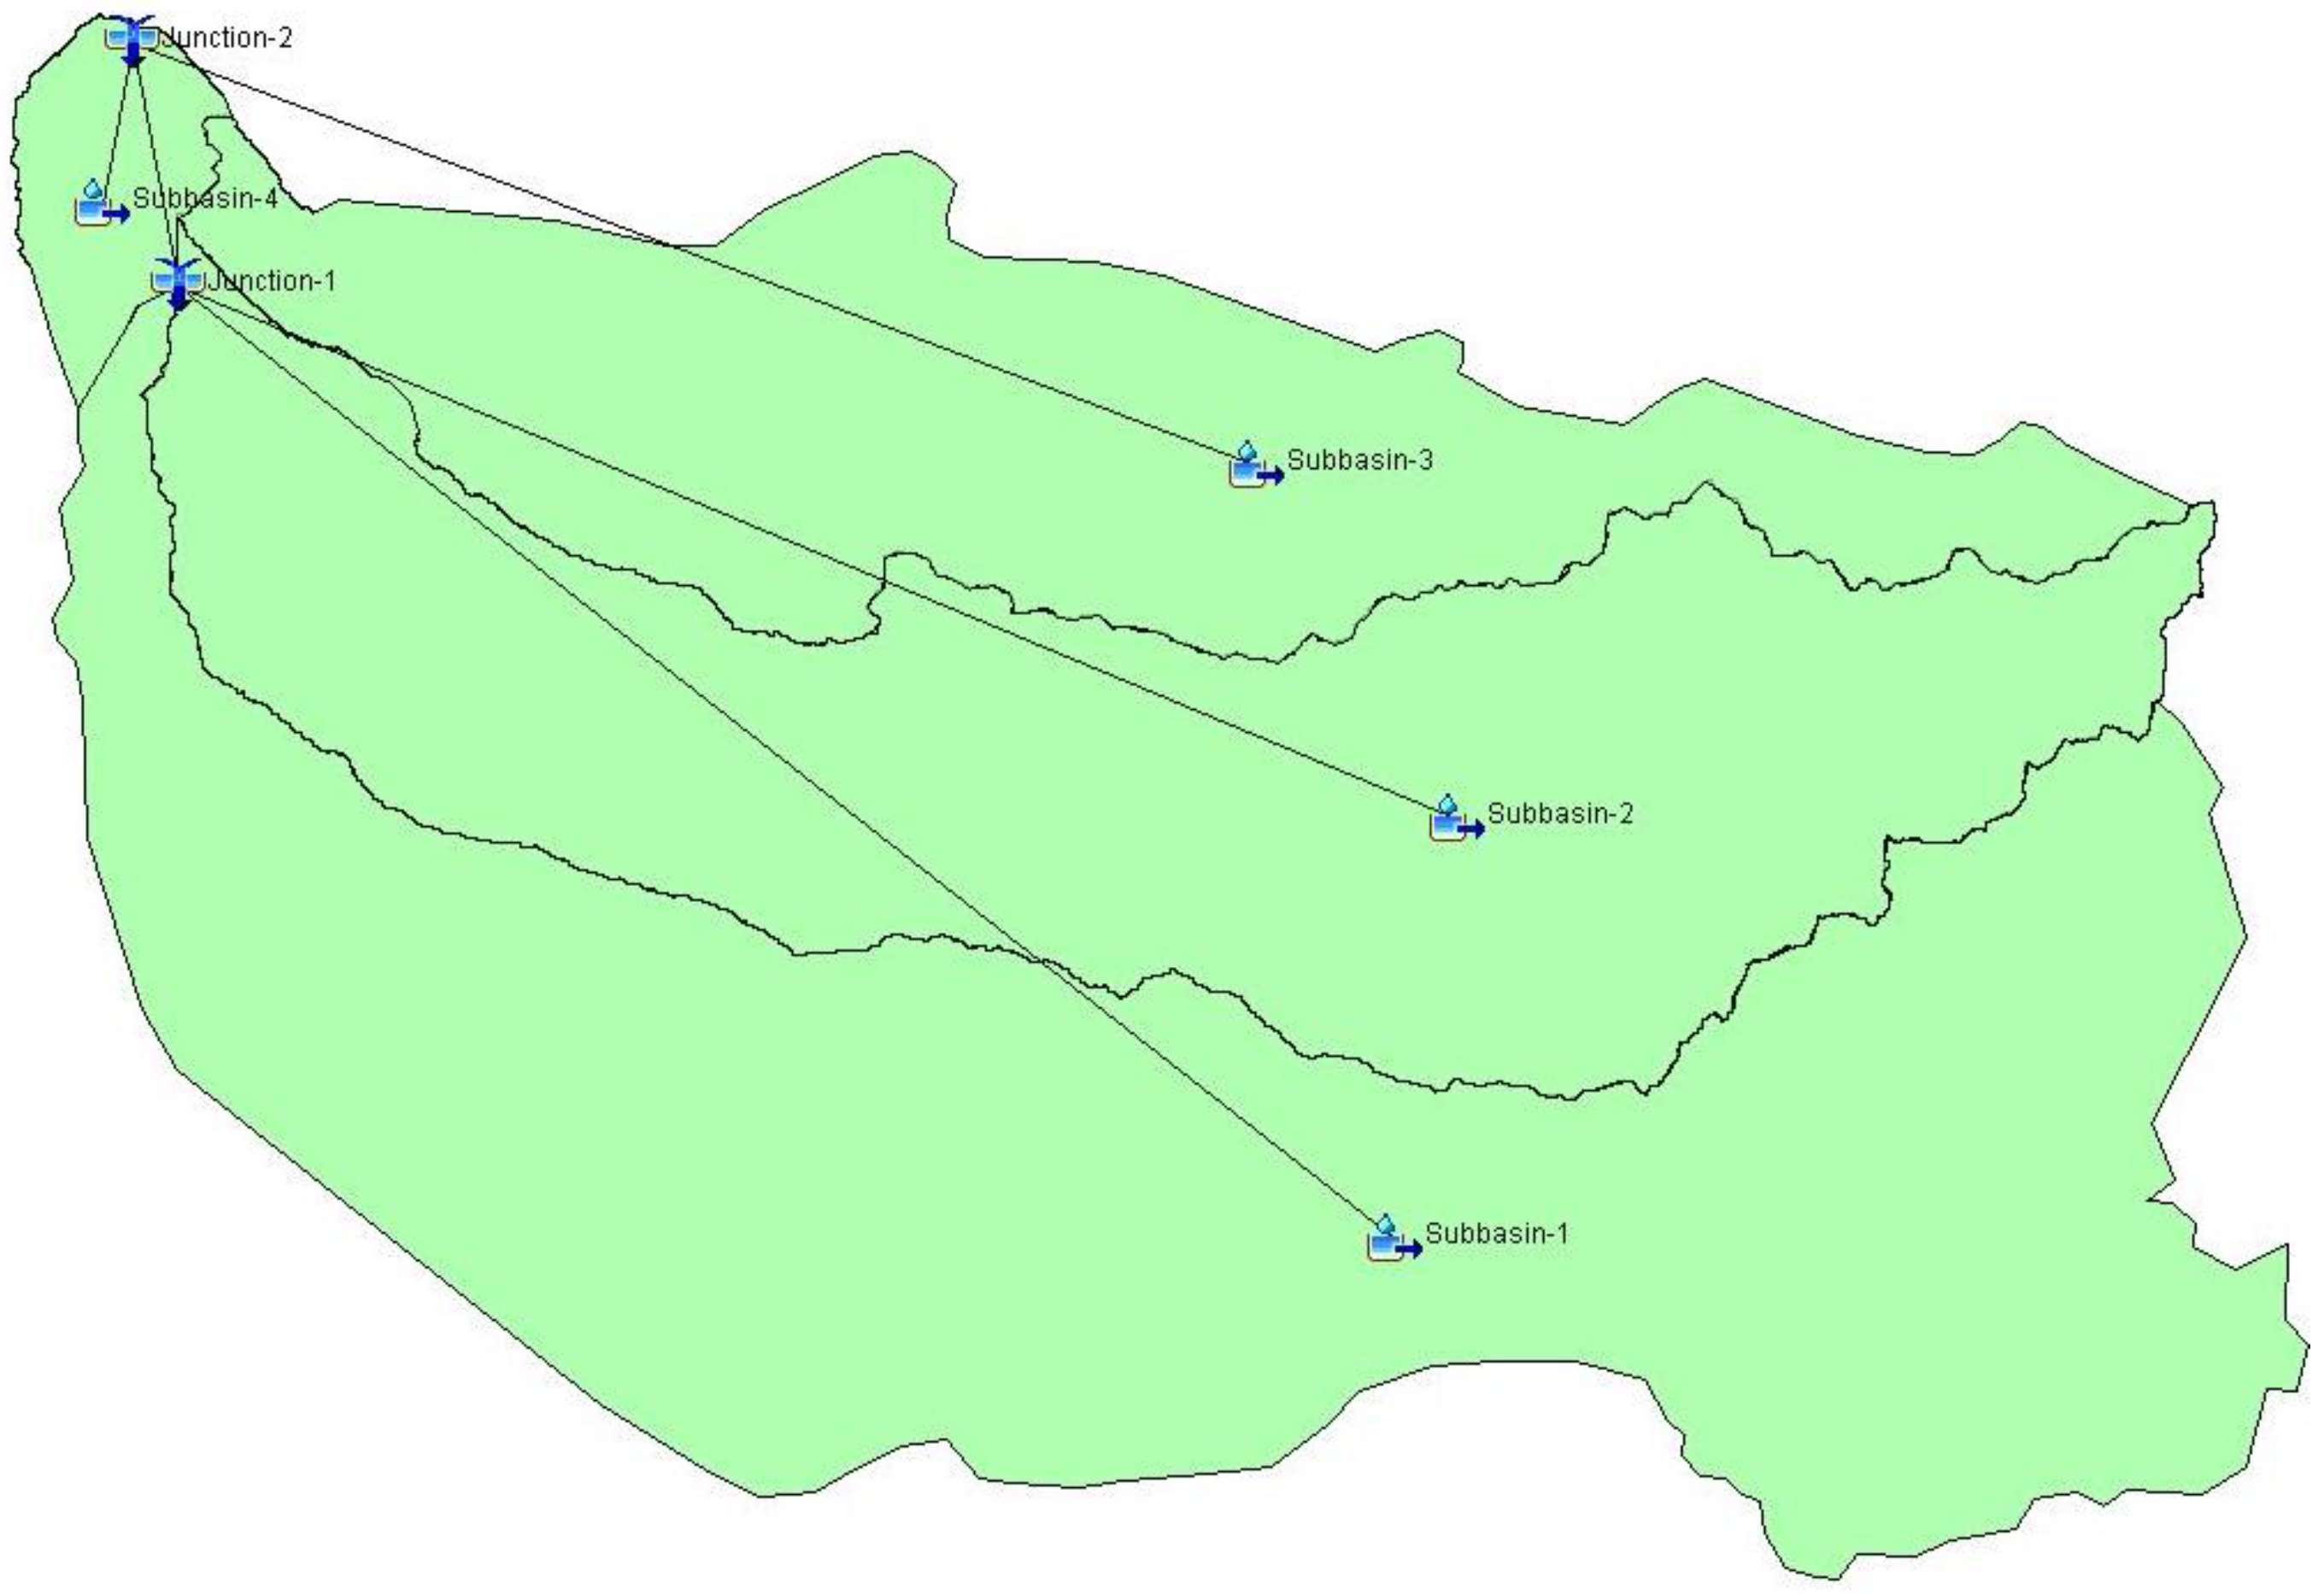
2.3. La Palma River Mouth Flood Modeling

To generate the runoff flooding areas under different storm flow conditions and rainfall events, an integrated flood modeling approach was used, coupling hydrologic and hydraulic simulations. This approach has been used in different environments and climates (for example [18,46,47]).
The initial step consisted of collecting and analyzing 24-h maximum rainfall records from 10 meteorological stations operated by the National Meteorological Service (SMN) [40] (Table 1). Years with incomplete records, as well as anomalous values in comparison to neighboring stations, were excluded. The resulting data were entered into the program “Calculation of extremes 2.0” developed by the Flumen Institute of the Universitat Politécnica de Catalunya to determine the return periods for 2, 10, 100, and 1000 years considering the functions Gumbel, Log-Pearson III, and SQRT—ETMax (Table 2).
Isohyets were generated for each return period by IDW interpolation using QGIS software [48]. With these isohyets, the precipitation was estimated for each return period and each sub-basin, considering the range of precipitation and the extension of the area covered within the sub-basin.
The next step consisted of developing design storms using the program “Design storm calculation through the alternate blocks method” developed by the Flumen Institute of the Universitat Politécnica de Catalunya [49]. The alternating block method developed by Chow et al. [50] was used to develop a hyetograph from the incremental precipitation values (blocks). After dividing the rainfall duration T(h) by the ∆t time-interval, the rainfall intensities for the rainfall durations ∆t, 2∆t, 3∆t, … were estimated [50]. The cumulative rainfall distribution can be derived, calculating the product of the rainfall intensity and the duration for each rainfall duration [50]. The rainfall intensity can then be obtained as the difference between the successive cumulative rainfall depths [50].
The scenario used for the calculation was a storm duration of 720 min divided into periods of 30 min, and the precipitation obtained for each return period and sub-basin. The resulting hyetographs are presented in Figure 3.
To simulate the precipitation-runoff relationship, hydrological models were built for each sub-basin and return period using HEC-HMS software version 4.4 (California, United States), developed by the Hydrologic Engineering Center of the US Army Corps of Engineers [51] (Figure 4). The curve number (CN) was obtained from theoretical tables [52] based on the units of soil and rock types, density and type of vegetation, and the land use for each sub-basin. The concentration-time was calculated for each sub-basin using the Kirpich formula [53]. The evapotranspiration was defined at 5.47 mm/day [32] and the algorithm used was the SCS Unit Hydrograph Model.
The hydraulic model was built with HEC-RAS software version 5.0.7 (California, United States), developed by the Hydrologic Engineering Center of the US Army Corps of Engineers [54]. The stream geometry was defined from a 5 m digital elevation model from [39].The number of points on each section of the geometry was filtered and a Manning coefficient of 0.05 was assigned for the plains and 0.03 for the main channel. The number of points on each section of the geometry was filtered and a Manning coefficient of 0.05 was assigned for the plains and 0.03 for the main channel. Peak runoff volumes for the river mouth of La Palma basin were obtained from the hydrographs generated from the precipitation-runoff modeling with HEC-HMS, resulting in 99.3, 487.6, 1578.0, and 3267.83 m3/s for RP2, RP10, RP100, and RP1000, respectively. A simulation of constant flow was performed. Calibration of the model was made using the active channel extension defined from satellite images and the resulting flood extension for the return period of 2 years.

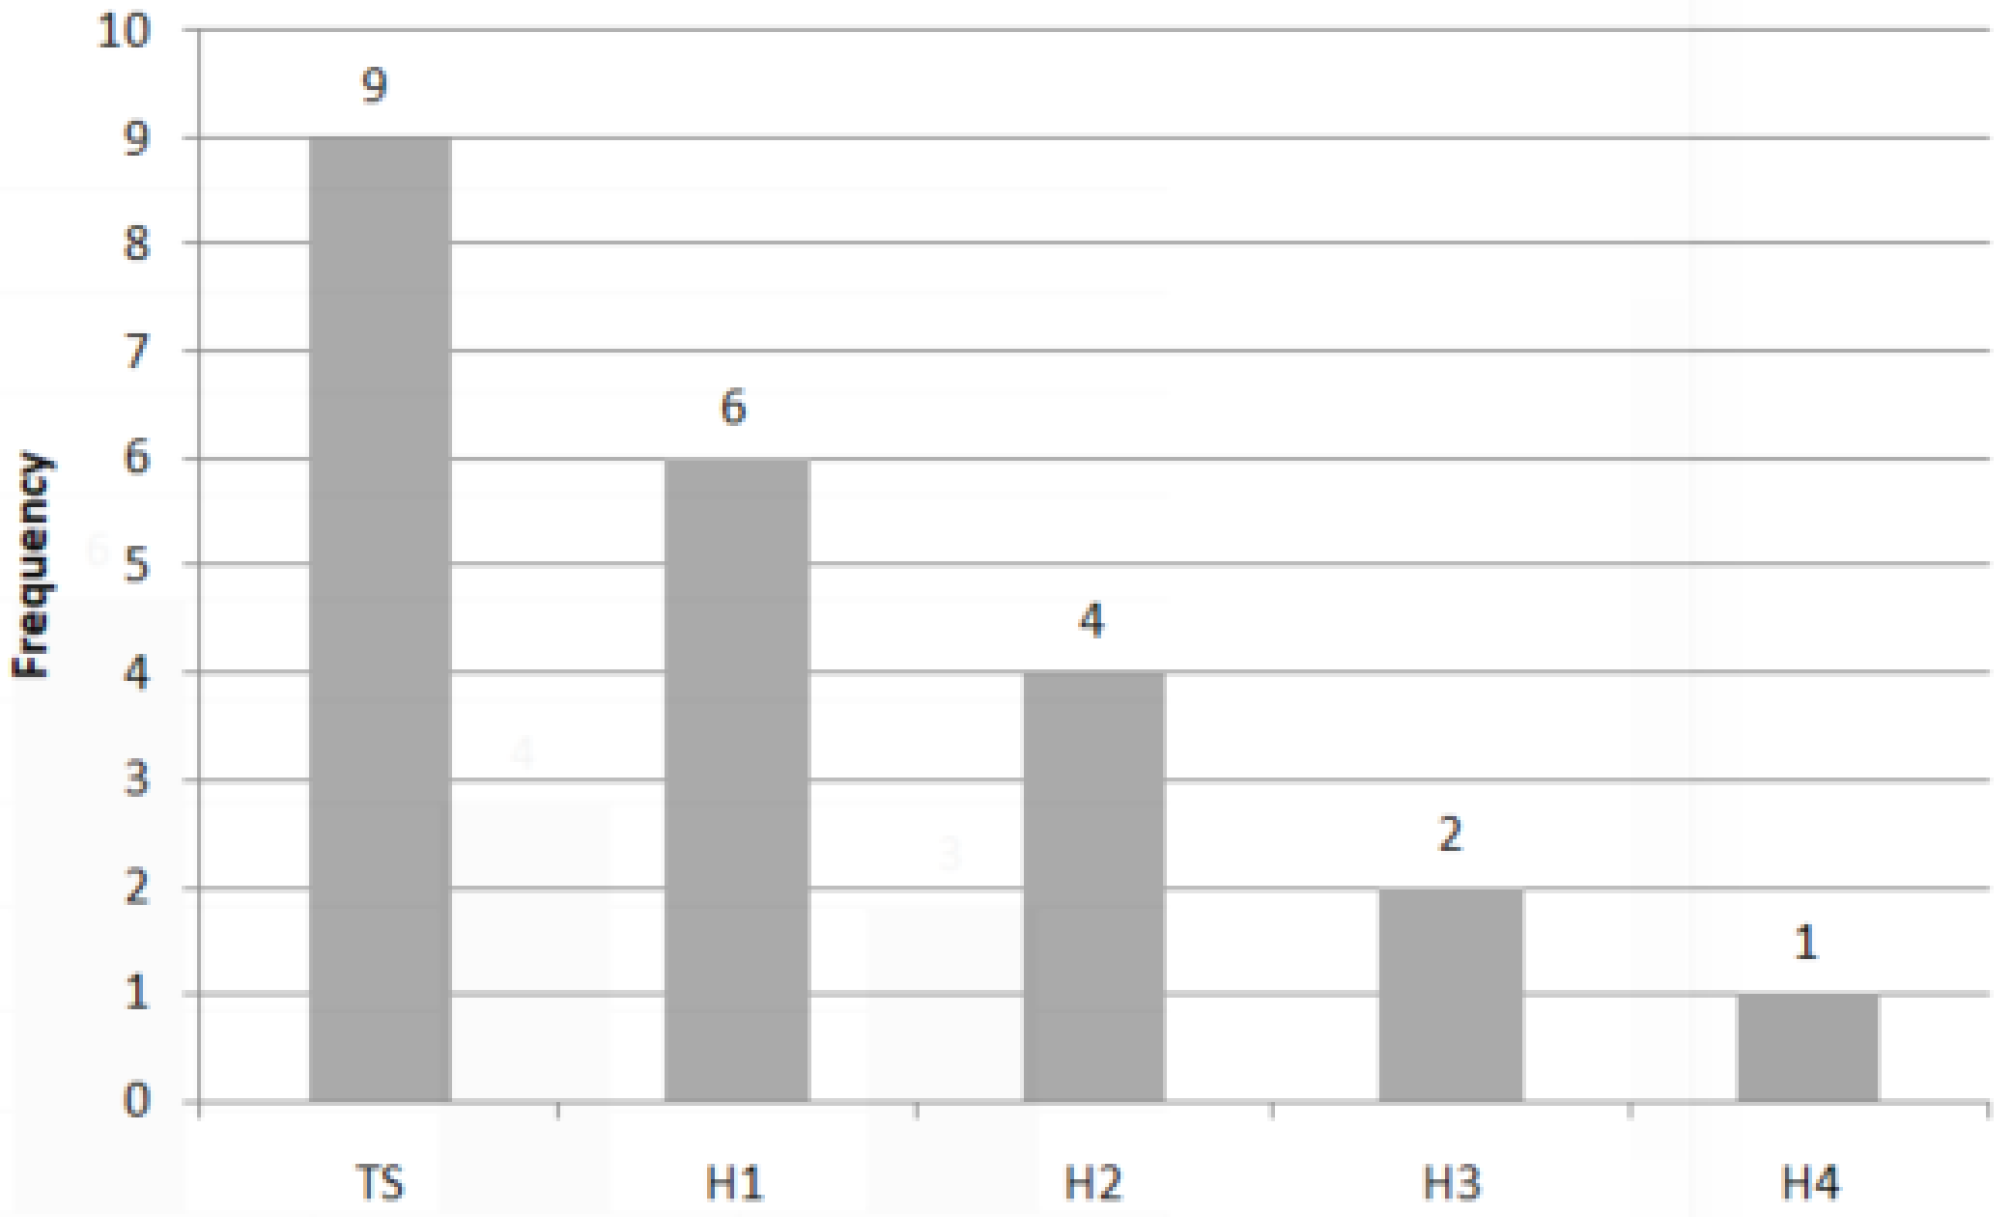
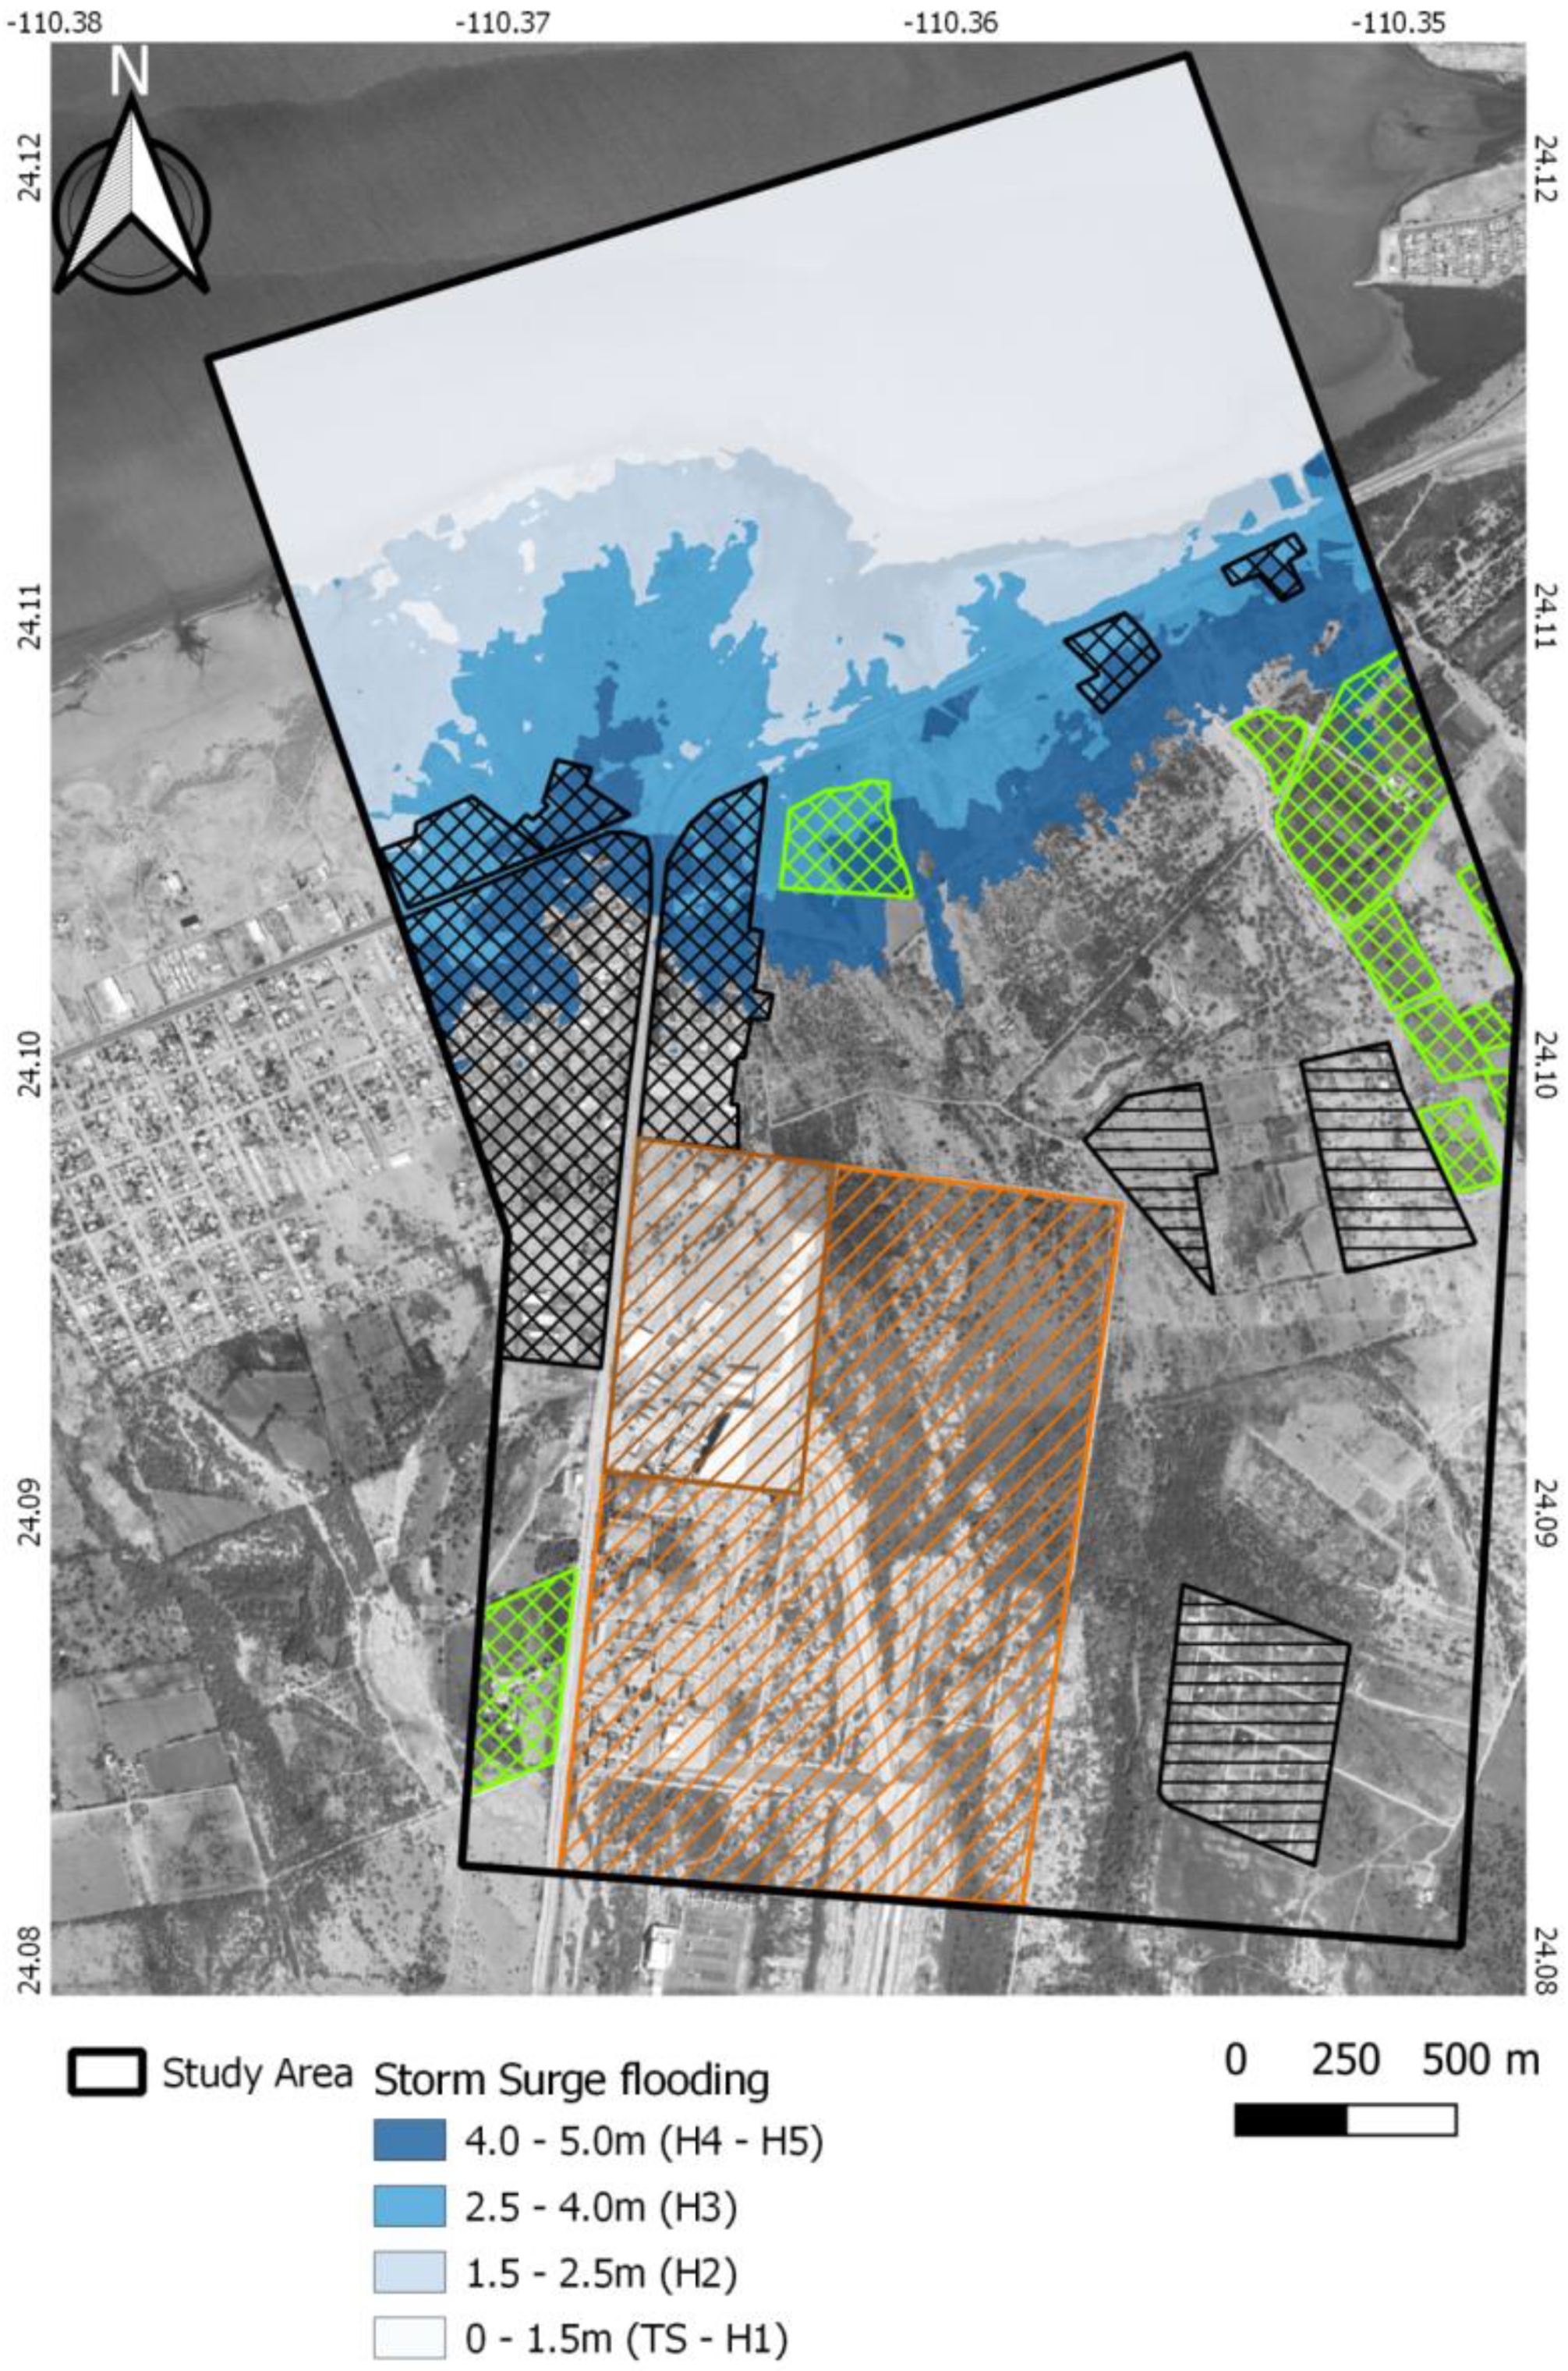
2.4. Storm Surge Scenarios

For this research, previous works that addressed storm surges in the study area were used to define scenarios for the estimation of the flood hazard.
Meza Padilla et al. [55] used a hydrodynamic model based on synthetic events of cyclonic events making landfall in the Mexican Coastline. Atmospheric pressure and wind speed maps were constructed using the formula of Emmanuel and Rotunno [56]. The mean sea level was used as a reference, and astronomic tides were omitted. Their results indicate that the southern portion of the Baja Peninsula presents maximum values of 0.5 m of storm surge which may pose a serious threat together with high waves. In the same study, Meza Padilla et al. [55] presented a map showing a Significant Wave Height (SWH) of 4 m for a 100-year return period in the study area.
Romero-Vadillo [20] performed numerical modeling of storm surges for the southern portion of BCS state including La Paz Bay. A statistical analysis was made to estimate the frequency of tropical cyclones affecting BCS, as well as the variation of sea levels during the approach of storms. Standard Project Hurricane and Wes Implicit Flooding models were used to simulate storm waves and sea currents related to tropical cyclones. According to their results, a maximum storm surge height in a range of 0.30 to 2 m resulted after the simulation of eight historical cyclones. Finally, they simulated two extreme hurricanes (Saffir-Simpson 5 events) resulting in storm surges exceeding 2 m in the study area.
Another aspect to consider in the definition of storm surge scenarios is the sea-level rise as a result of climate change. No studies on sea-level rise have been carried out in the study area; however, Kirtman et al. [57] forecast a global sea-level rise in a range of +0.26 m (RCP 2.6) to 1.4 m (RCP 8.5) for the year 2100, while Vermeer and Rahmstorf [58] proposed sea-level rise in a range of +0.75 (B1) to 1.9 m (A2) for the same year.
The storm surge hazard was assessed correlating the probability of occurrence of tropical cyclones and the expected storm surge according to Romero-Vadillo [20] and Meza-Padilla [55] plus a conservative 0.5 m of sea-level rise related with climate change (Table 3). According to Farfán et al. [59] and NOAA [60], 22 tropical cyclones have impacted BCS state, nine as tropical storms, six as a hurricane category 1, four as a hurricane category 2, two as category 3, and finally one as category 4. (Figure 5).
The flood zones for each storm surge scenario were superimposed on a 5 m elevation model obtained from [39].

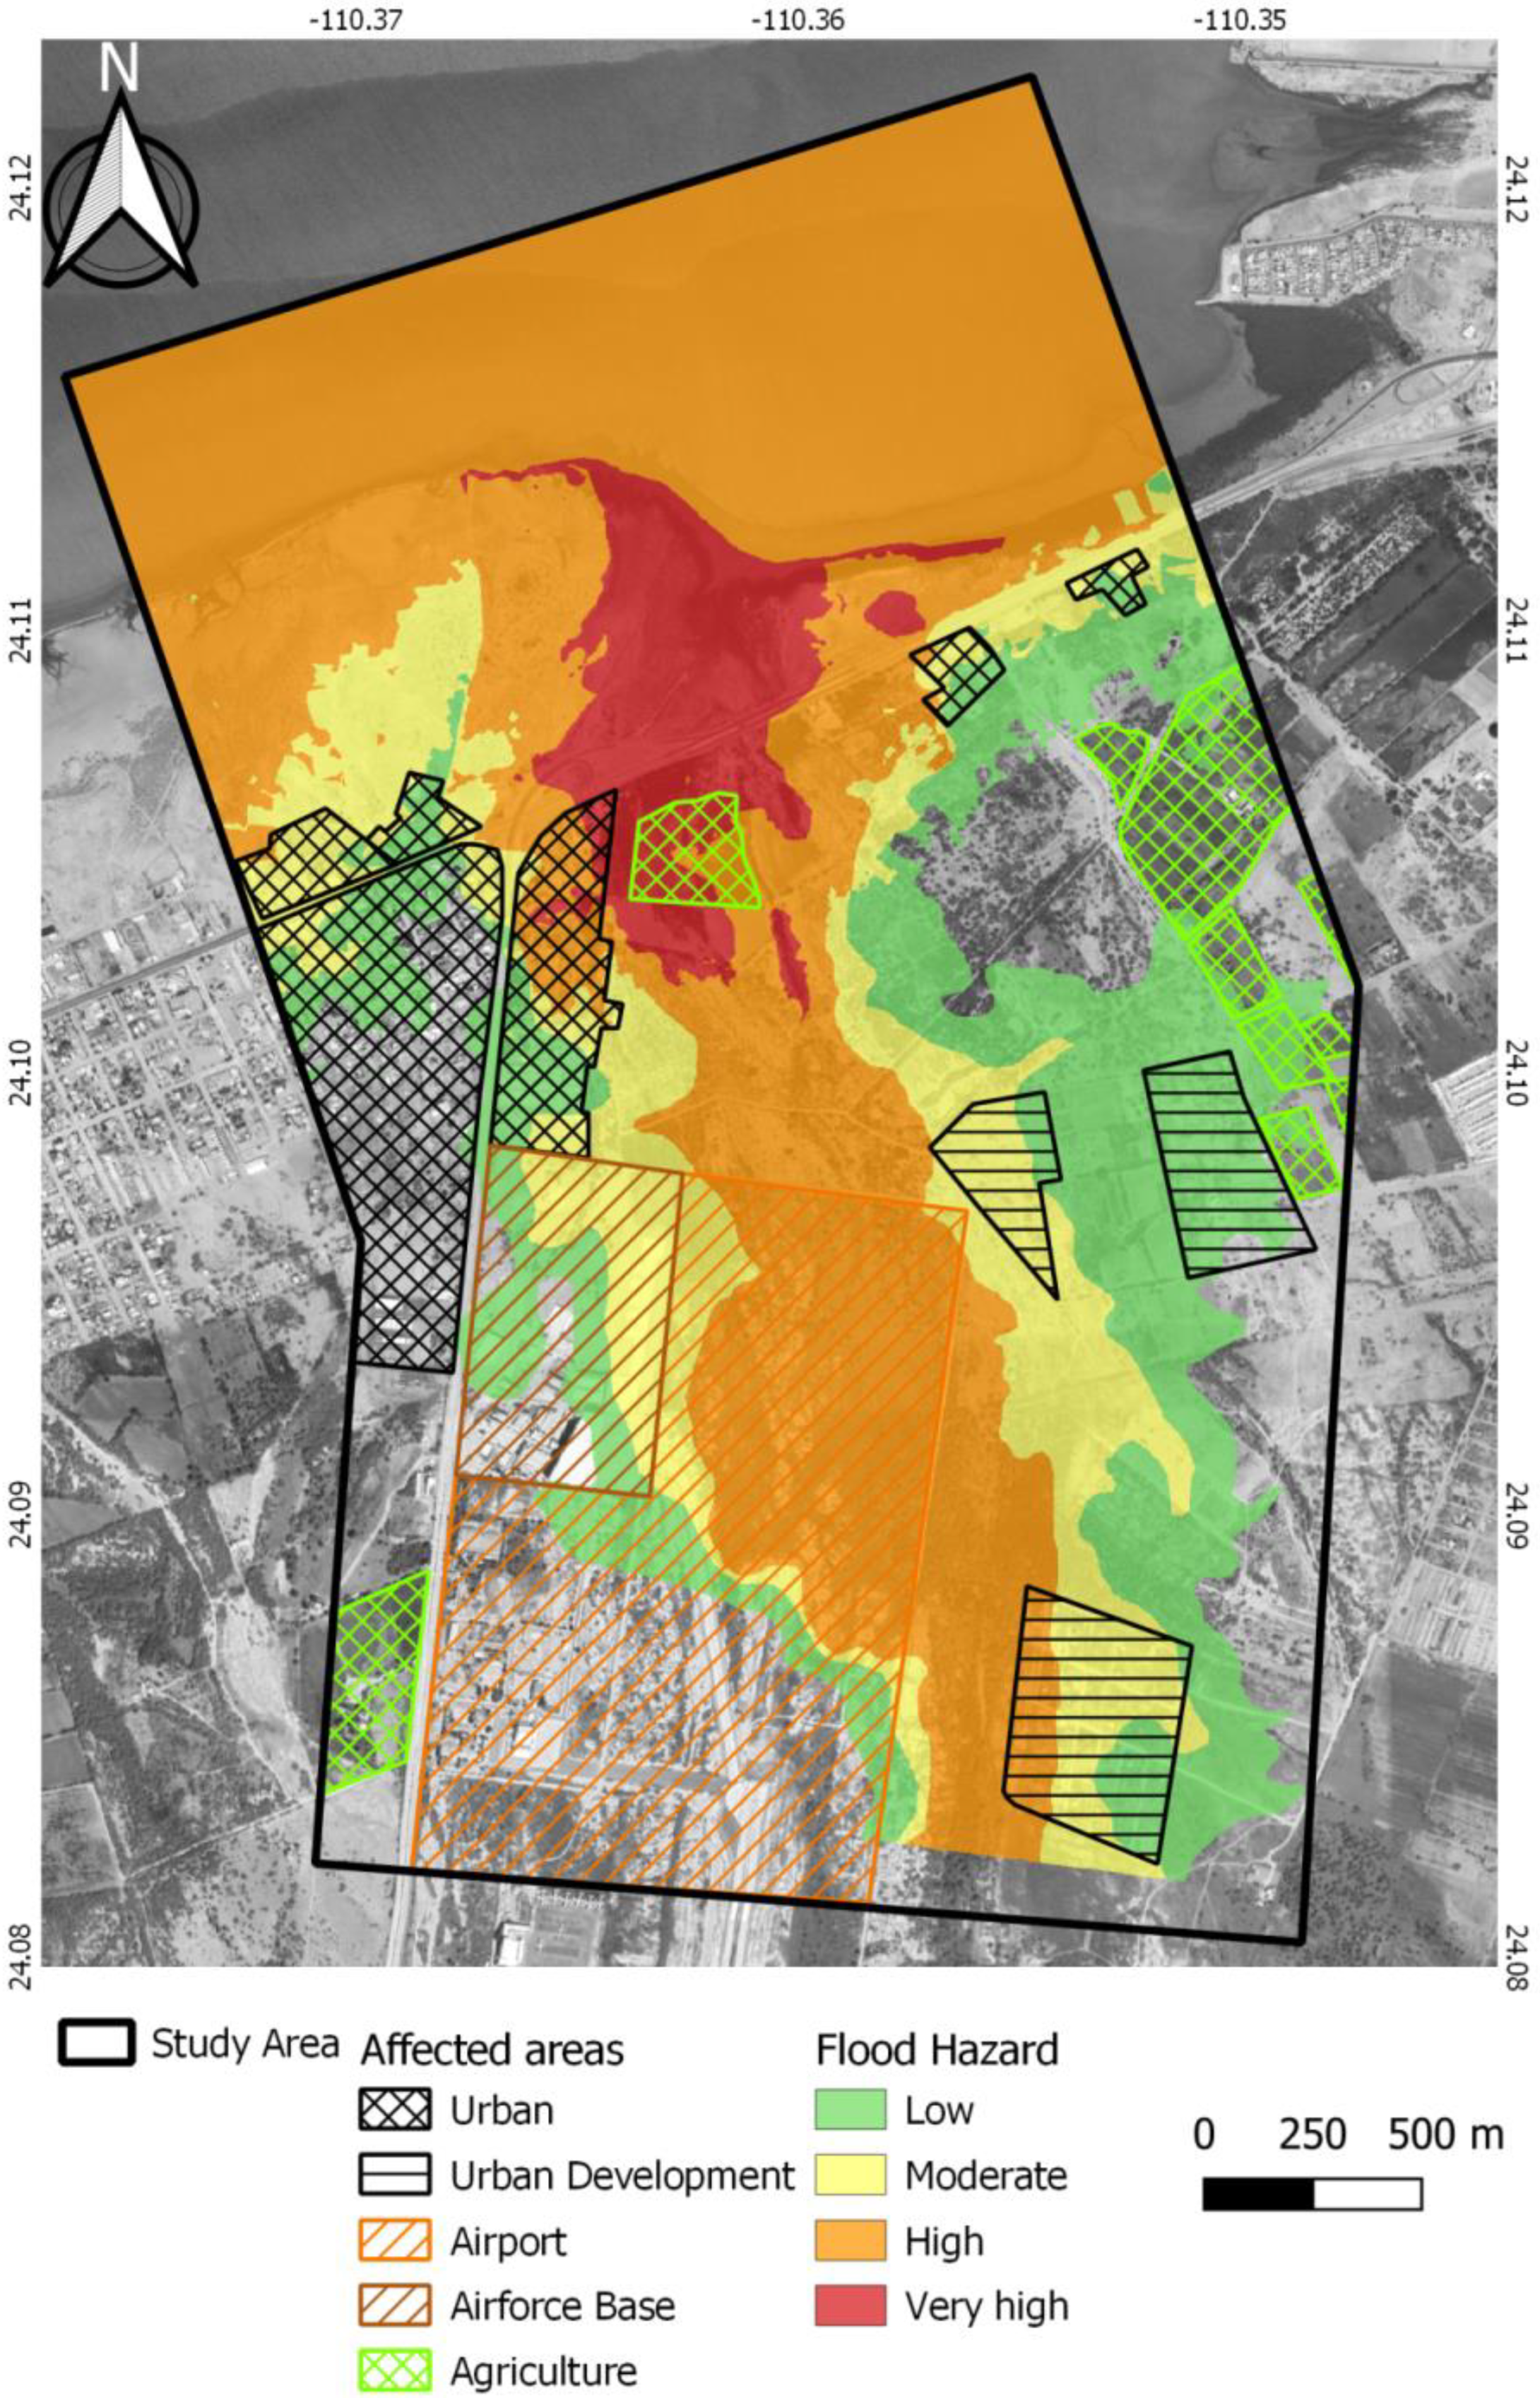
2.5. Runoff-Storm Surge Flood Hazard Map Integration

As a result of the modeling process of the river mouth of the La Palma stream and the storm surges scenarios, maps of depth and extension in raster format were obtained. Due to the nature of each modeled event, the results have different magnitudes; therefore, it was necessary to assign scores to complete the integration. Scores were assigned according to the probability of occurrence (Table 4). The next step was the reclassification of the grids with the assigned scores in QGIS using the “reclassify values” algorithm [48]. Once the grids were reclassified, the QGIS raster calculator [48] was used to make a summation of maps, resulting in four hazard ranges with values between 0 and 8 (Table 4)

3. Results

3.1. Flooding in La Palma Creek River Mouth

Simulations were executed with the hydrological model resultingin peak flows for the four sub-basins and the river mouth of the La Palma creek (Table 3).
For the 2-year return period (RP2) the flood reached an average elevation of 0.89 m and a maximum of 1.72 m. The maximum flow velocity was 1.37 m/s and the extent of the flood covered 0.97 km2. For the 10-year return period (RP10), the mean flood elevation was 0.95 m and a maximum of 2.48 m. The maximum flow velocity was 1.60 m/s and the flood area extended to 1.68 km2. For the 100-year return period (RP100) the flood reachedan average elevation of 1.34 m and a maximum of 2.58 m. The maximum velocity reached 1.73 m/s and the flood extended for 2.83 km2. Finally, for the 1000-year return period (RP1000), the average elevation was 1.64 m, while the maximum reached 4.22 m, the maximum flow velocity reached 3.81 m/s and the extension of the flood covers 3.50 km2 (Figure 6).
The flooding for the RP2 scenario extends into the main channel affecting 244 m of the transpeninsular highway, 0.035 km2 of agriculture lands, 0.004 km2 of urban areas, and 0.325 km2 of airport lands. For the RP10 scenario, the flood affects 0.359 m of the transpeninsular highway, 0.066 km2 of agriculture lands, 0.031 km2 of urban areas, and 0.549 km2 of airport lands. In the case of the RP100 scenario, the flood affects 640 m of the transpeninsular highway, 0.035 km2 of agriculture lands, 0.117 km2 of urban areas, 0.228 km2 of urban developments, 0.131 km2 of the air force base, and 0.622 km2 of airport land. Finally, for the RP1000 scenario, the flood affects 958 m of the transpeninsular highway, 0.102 km2 of agricultural lands, 0.193 km2 of urban areas, 0.402 km2 of urban development areas, 0.282 km2 of the air force base, and 0.784 km2 of airport land.

3.2. Flooding by Storm Surge

In the storm surge flood maps, it can be observed for scenario TS-H1 that the advance of the water is limited to 100 m from the coastline, where the marshes are located. For scenario H2, a maximum advance of 420 m is observed, specifically in the river mouth and west of the study area. For this scenario the flood extends mainly in the marshes; however, a small portion of the transpeninsular highway and urban areas are affected. In the case of scenario H3, the flood extends in a range of 254 to 1168 m from the coastline. The effect of this scenario reaches a portion of 2.1 km of the transpeninsular highway as well as 0.098 km2 of urban areas and 0.036 km2 of agricultural land. Finally, for scenario H4–H5 the flood extends in a range of 527 to 1255 m from the coastline and affects 2724 m of the transpeninsular highway, 0.358 km2 of urban areas, and 0.051 km2 of agricultural land (Figure 7).

3.3. Runoff-Storm Surge Flood Hazard Map

The runoff-storm surge hazard map represents the hazard of storm surges and flood combined, in La Palma creek. In this context, the area with a very high flooding hazard is the intersection between the RP2 flood in the creek and storm surge scenarios (H2, H3, and H4–H5 mainly). This hazardous area affects 0.029 km of agricultural land, 0.015 km2 of urban areas, and 471 m of the transpeninsular highway. In the high flood hazard zone, there are 0.078 km2 of urban areas, 0.054 km2 of urban development areas, 0.549 km2 of airport land, and 622 m of the transpeninsular highway. Within the moderate flood hazard zone, there are 868 m of the transpeninsular highway, 0.083 km2 of urban areas, 0.177 km2 of urban development areas, 0.125 km2 of the air force base, and 0.135 km2 of airport land. Finally, with the low flood hazard, there are 0.198 km2 of urban areas, 0.177 of urban development areas, 0.119 km2 of the air force base, 0.122 km2 of the airport land, 0.042 km2 of agricultural land, and 277 m of the transpeninsular highway (Figure 8).
Considering an extension of the study area of 8.134 km2 (excluding the lagoon), 6% are within the very high flooding hazard zone, 25% within the high hazard zone, 16% within the moderate flooding hazard zone, 14% within the low flooding hazard zone, and the remaining 39% are outside of the hazard zones (Figure 8).

4. Discussion

4.1. Benefits and Limitations of the Model

The methodology presented in this research made it possible to generate a flood hazard map caused by runoffs and storm surges, including climate change scenarios.
The integrated representation of the results makes it possible to visualize the combined impact of floods generated by tropical cyclones in the coastal zone instead of them being presented separately. The integrated representation of the hazards represents innovation and an invaluable source of information for the population living in hazardous zones, as well as for decision-making by the authorities specified in the context of adaptation and mitigation measures, the design and implementation of civil protection protocols before, during, and after hydrometeorological events.
The main limitation of the model is based on the method for unification of the hazard, excluding the hydraulic effect that could be generated from the interaction of both phenomena, for example, in the area of very high hazard where runoffs and storm surges occur. However, and even with this limitation, we consider the model valid and applicable to other areas affected by tropical cyclones.

4.2. Impact of Runoff-Storm Surge Hazard in the Study Area

Several studies have been carried out concerning changes in sea level, which can be expected due to storm surges at the coast of the city of La Paz, and the La Paz Lagoon [20,55]; however, no detailed investigations were found addressing the impact inland including the National Risk Atlas nor Municipal Risk Atlas [25,26], even though the city of La Paz is frequently affected by tropical cyclones. In this context, this investigation represents the first hazard model to attend to this problem. Due to the topographic configuration, the urban area located north of the study area and bordering the La Paz lagoon would be susceptible to storm surge events generated by high-intensity tropical cyclones. Likewise, access to the international airport and communication with the north of the state would be affected, complicating the actions of authorities in the case of a possible disaster. On the other hand, and in the context of flooding due to runoff, the city of La Paz has experienced in recent years an expansion of its urban area towards the south and southwest of downtown. Some of these developments are currently located in areas of low to moderate hazard, highlighting the development south of the study area, which is only a few meters from the La Palma stream and, therefore, in a highly hazardous area. Urban settlements located north of the air force base are also located in highly hazardous areas. In the case of the international airport, the northern portion of the property would eventually be affected, although the runway and terminal buildings would be safe.

5. Conclusions

Our methodology allowed the generation of a hazard map integrating flood events due to runoff and storm surges from pre-existing scenarios, climate change forecasts, and their integration through GIS. The resulting map was effective in defining those areas that would be exposed to flooding in the face of the impact of tropical cyclones and considering climate change scenarios, and represents an invaluable source of information for society and decision-makers for comprehensive risk management and disaster prevention.
In the case of the study area, it was possible to identify those areas and land uses located in areas of high hazard due to floods. It is essential to limit urban development in areas with some degree of hazard, both on the coastline and the banks of streams. It is also important to build additional bridges, roads, and highways in a way that communication will not be interfered with and ensure that the new primary infrastructure is located outside of hazardous areas or, at least, that they are designed to withstand the expected water depths and velocities. The hazard maps will also help to promote a culture of civil protection in La Paz. Likewise, it is essential to continue with the models for other areas of the capital such as the Chametla-Centenario-Comitán corridor, and the coastline near the inner city.

Author Contributions

Conceptualization, M.A.I.-L., J.R.-T., J.W., E.R.-V.; methodology, M.A.I.-L.; validation, M.A.I.-L., J.W. and E.R.-V.; writing—original draft preparation, M.A.I.-L., J.W.; writing—review and editing, M.A.I.-L., J.W., E.R.-V. All authors have read and agreed to the published version of the manuscript.

Funding

This research received no external funding.

Institutional Review Board Statement

Not applicable.

Informed Consent Statement

Not applicable.

Data Availability Statement

The data presented in this study are available on request from the corresponding author.

Acknowledgments

To the Autonomous University of Baja California Sur, especially to the Earth Sciences Department, Engineering of Fisheries Department and Engineering of Disaster Prevention and Civil Protection.

Conflicts of Interest

The authors declare no conflict of interest.

References

  1. WBG (World Bank Group). Methods in Flood Hazard and Risk Assessment; International Bank for Reconstruction and Development: Washington, DC, USA, 2016; 28p. [Google Scholar]
  2. United Nations Office for Disaster Risk Reduction (UNISDR). Economic Losses, Porverty& Disasters 1998–2017; Centre for Research on the Epidemiology of Disasters (CRED): Brussels, Belgium, 2017; 31p. [Google Scholar]
  3. Romero-Monteiro, L.; Innocente-Dos Santos, C.; Kobiyama, M.; Weber-Corseuil, C.; Borges-Chaffe, P.L. Effects of return periods on flood hazard mapping: An analysis of the UFSC Campus Basin, Florianópolis city, Brazil. Braz. J. Water Resour. 2021, 26, 9. [Google Scholar] [CrossRef]
  4. Ionita, M.; Nagavciuc, V. Extreme floods in the Eastern Part of Europe: Large-Scale Drivers and Associated Impacts. Water 2021, 13, 1122. [Google Scholar] [CrossRef]
  5. Darabi, H.; Haghighi, A.T.; Mohamadi, M.A.; Rashidpour, M.; Ziegler, A.D.; Hekmatzadeh, A.A.; Klove, B. Urban flood risk mapping using data-driven geospatial techniques for a flood-prone case area in Iran. Hydrol. Res. 2019, 51, 127–142. [Google Scholar] [CrossRef] [Green Version]
  6. Singh, A.; Dawson, D.; Trigg, M.; Wright, N. A review of modelling methodologies for flood source area (FSA) identification. Nat. Hazards 2021, 107, 1047–1068. [Google Scholar] [CrossRef]
  7. O’Donnell, E.; Thorne, C.; Ahilan, S.; Arthur, S.; Birkinshaw, S.; Butler, D.; Dawson, D.; Everett, G.; Fenner, R.; Glenis, V.; et al. The blue-green path to urban flood resilience. Blue-Green Syst. 2020, 2, 28–45. [Google Scholar] [CrossRef] [Green Version]
  8. Doocy, S.; Dick, A.; Daniels, A.; Kirsch, T.D. The human impact of tropical cyclones: A historical review of events 1980–2009 and systematic literature review. PLoS Curr. 2013, 5, 5. [Google Scholar] [CrossRef] [PubMed]
  9. Maspataud, A.; Ruz, M.-H.; Vanhée, S. Potential impacts of extreme storm surges on a low-lying densely populated coastline: The case of Dunkirk area, Northern France. Nat. Hazards 2013, 66, 1327–1343. [Google Scholar] [CrossRef]
  10. Liu, Q.; Ruan, C.; Guo, J.; Li, J.; Lian, X.; Yin, Z.; Fu, D.; Zhong, S. Storm Surge Hazard Assessment of the Levee of a Rapidly Developing City-Based on LiDAR and Numerical Models. Remote Sens. 2020, 12, 3723. [Google Scholar] [CrossRef]
  11. Bertin, X. Storm Surges and coastal flooding: Status and challenges. Houille Blanche 2016, 102, 64–70. [Google Scholar] [CrossRef]
  12. Sheng, P.Y.; Lapentina, A.; Ma, G. The reduction of storm surge by vegetation canopies:Three dimensional simulations. Geophys. Res. Lett. 2012, 39, 20. [Google Scholar] [CrossRef] [Green Version]
  13. Ellis, J.T.; Sherman, D.J. Chapter 1—Perspectives on coastal and marine Hazards and Disasters. In Coastal and Marine Hazards, Risks, and Disasters; Elsevier: Amsterdam, The Netherlands, 2015; pp. 1–13. [Google Scholar] [CrossRef]
  14. Knutson, T.R. Tropical Cyclones and hurricanes. In Encyclopedia of Atmospheric Sciences; Elsevier: Amsterdam, The Netherlands, 2015; pp. 65–76. [Google Scholar] [CrossRef]
  15. Aranud-Fassetta, G.; Astrade, L.; Bardou, E.; Corbonnois, J.; Delahaye, D.; Fort, M.; Gautier, E.; Jacob, N.; Peiry, J.; Piégay, H.; et al. Fluvial geomorphology and flood-risk management. Géomorphol. Relief Process. Environ. 2009, 2, 109–128. [Google Scholar] [CrossRef] [Green Version]
  16. Cai, S.; Fan, J.; Yang, W. Flooding Risk Assessment and Analysis Based on GIS and the TFN-AHP Method: A Case Study of Chongqing, China. Atmosphere 2021, 12, 623. [Google Scholar] [CrossRef]
  17. Khattak, M.S.; Anwar, F.; Saeed, T.U.; Sharif, M.; Sheraz, K.; Ahmed, A. Floodplain Mapping Using HEC-RAS and ArcGIS: A Case Study of Kabul River. Arab. J. Sci. Eng. 2016, 41, 1375–1390. [Google Scholar] [CrossRef]
  18. Abdessamed, D.; Abderrazak, B. Coupling HEC-RAS and HEC-HMS in rainfall–runoff modeling and evaluating floodplain inundation maps in arid environments: Case study of Ain Sefra city, Ksour Mountain. SW, Algeria. Environ. Earth Sci. 2019, 78, 586. [Google Scholar] [CrossRef]
  19. Islam, R.; Lee, C.-Y.; Mandli, K.T.; Takagi, H. A new tropical cyclone surge index incorporating the effects of coastal geometry, bathymetry and storm information. Sci. Rep. 2021, 11, 16747. [Google Scholar] [CrossRef]
  20. Romero-Vadillo, E. Modelación de Numérica de Ondas de Tormenta en la Bahía de La Paz y Cabo San Lucas, Baja California Sur. Ph.D. Thesis, Centro Interdisciplinario de Ciencias Marinas del Instituto Politécnico Nacional, La Paz, Mexico, 2003. [Google Scholar]
  21. Tate, C.A.; Frazier, T.G. A GIS Methodology to Assess Exposure of Coastal Infraestructure to Storm Surge & Sea-Level Rise: A CaseStudy of Sarasota County, Florida. J. Geogr. Nat. Disasters 2013, 3, 1–12. [Google Scholar] [CrossRef] [Green Version]
  22. Johnston, J.; Cassalho, F.; Miesse, T.; Ferreira, C.M. Projecting the effects of land subsidence and sea level rise on storm surge flooding in Coastal North Carolina. Sci. Rep. 2021, 11, 21679. [Google Scholar] [CrossRef]
  23. Veeramony, J.; Condon, A.; Van-Ormont, M. Forecasting Storm Surge and Inundation: Model Validation. Weather Forecast. 2017, 32, 2047–2063. [Google Scholar] [CrossRef]
  24. Machineni, N.; Sinha, V.S.P.; Singh, P.; Reddy, N.T. The impact of distributed land use information in hydrodynamic model application in storm surge inundation. Estuarine Coast. Shelf Sci. 2019, 231, 106466. [Google Scholar] [CrossRef]
  25. Secretaría de Desarrollo Social (SEDESOL). Atlas de Riesgos y Peligros Naturales del Municipio de La Paz, BCS; Soluciona Arquitectura y Construcción S.A. de C.V.: Hermosillo, Mexico, 2012; 271p. [Google Scholar]
  26. Atlas Nacional de Riesgos. Available online: http://atlasnacionalderiesgos.gob.mx/archivo/visor-capas.html (accessed on 9 September 2021).
  27. Romero Vadillo, E.; Romero Vadillo, I.G. Estimación del riesgo en las viviendas de Baja California Sur ante el impacto de ciclones tropicales. Teor. Prax. 2016, 12, 50–73. [Google Scholar] [CrossRef]
  28. Muria-Avila, D. Investigación y Desarrollo. In El Huracán Odile y sus Efectos en la Infraestructura del sur de la Península de Baja California; Instituto de Ingeniería de la UNAM: Ciudad de México, Mexico, 2015; pp. 1–3. [Google Scholar]
  29. Romero-Vadillo, E.; y Romero-Vadillo, I.G. Ciclones Tropicales: Tendencias y potencial de afectación en Baja California Sur. In Baja California Sur ante el Cambio Climático: Vulnerabilidad, Adaptación y Mitigación (PEAC-BCS); UABCS-SEMARNAT-CIBNOR-CICESE-INECC-IPN-CICIMAR: La Paz, Mexico, 2013; 43p. [Google Scholar]
  30. Censo de Vivienda INEGI 2010. Available online: https://www.inegi.org.mx/programas/ccpv/2010/#Tabulados (accessed on 3 September 2021).
  31. Censo de Vivienda INEGI 2020. Available online: https://www.inegi.org.mx/programas/ccpv/2020/#Tabulados (accessed on 3 September 2021).
  32. Rodríguez-Trasviña, J. Modelación de Análisis por Inundaciones para Diferentes Periodos de Retorno en el Arroyo La Palma, en la Ciudad de La Paz, Baja California Sur, México. Bachelor’s Thesis, Universidad Autónoma de Baja California Sur, La Paz, Mexico, June 2021. [Google Scholar]
  33. Ramos-Velázquez, R. Características de la Deformación en las Rocas Cristalinas Cretácicas de la Región E-SE de la Ciudad de La Paz, B.C.S., México. Master’s Thesis, Centro de Investigación Científica y de Educación Superior de Ensenada, Ensenada, Mexico, 1998. [Google Scholar]
  34. Ramos-Velázquez, E.; Iriondo, A.; Cota-Lau, H.G.; Díaz-Gutiérrez, J.J. Evolución tectónica de la suite intrusiva de Las Cruces, BCS: Control temporal a partir de geocronología U-Pb en circones. In Proceedings of Reunión Anual de la Unión Geofísica Mexicana A.C.; UGM: Puerto Vallarta, Mexico, 2013. [Google Scholar]
  35. Puy y Alquiza, M.D.J. Caracterización de Facies, Ambientes Sedimentarios y Procesos de Depósito de la Sucesión Volcanosedimentaria El Coyote, Baja California Sur, México. Ph.D. Thesis, Instituto Politécnico Nacional, Centro Interdisciplinario de Ciencias Marinas, Departamento de Oceanología, La Paz, Mexico, 2006. [Google Scholar]
  36. Umhoefer, P.J.; Dorsey, R.J.; Willsey, S.; Mayer, L.; Renne, P. Stratigraphy and geochronology of the Comondú Group near Loreto, Baja California Sur, Mexico. Sedim. Geol. 2001, 144, 125–147. [Google Scholar] [CrossRef]
  37. Hausback, B.P. Geology of the Baja California Peninsula: Pacific Section. In Cenozoic Volcanic and Tectonic Evolution of Baja California Sur, México, in Frizzell, 1st ed.; Society of Economic Paleontologists and Mineralogists: Los Angeles, CA, USA, 1984; pp. 219–236. [Google Scholar]
  38. Aranda Gómez, J.J.; Pérez Venzor, J.A. Estratigrafía del complejo cristalino de la región de Todos Santos, estado de Baja California Sur, Universidad Nacional Autónoma de México. Inst. Geol. Rev. 1989, 8, 149–170. [Google Scholar]
  39. Geographical and Statistical Information of Mexico (INEGI). Available online: https://www.inegi.org.mx/ (accessed on 4 May 2021).
  40. Climatologic Database Servicio Meteorológico Nacional. Available online: https://smn.conagua.gob.mx/es/climatologia/informacion-climatologica/informacion-estadistica-climatologica (accessed on 3 September 2021).
  41. Cruz-Falcón, A.; Vázquez-González, R.; Ramírez-Hernández, J.; Nava-Sánchez, E.; Troyo-Diéguez, E. Rainfall and recharge in the basin of La Paz, B.C.S, México. Univ. Cienc. 2011, 27, 251–263. [Google Scholar]
  42. Wurl, J.; Martínez-García, C.N.; Imaz-Lamadrid, M.A. Flood hazard assessmentof La Purísima Oasis in Baja California Sur, México. Investig. Geogr. Bol. Inst. Geogr. UNAM 2015, 87, 76–87. [Google Scholar]
  43. Imaz-Lamadrid, M.A.; Wurl, J.; Ramos-Velázquez, E. Future of Coastal Lagoons in Arid Zones under Climate Change and Anthropogenic Pressure. A Case Study from San Jose Lagoon, Mexico. Resources 2019, 8, 57. [Google Scholar] [CrossRef] [Green Version]
  44. Imaz-Lamadrid, M.A.; Wurl, J.; Arizpe-Covarrubias, O.; Romero-Vadillo, E. Deterioration of oases subject to climate change and coastal development: The case of Todos Santos Oasis, Baja California Sur, Mexico. Groundwater for Sust. Groundw. Sustain. Dev. 2020, 11, 100401. [Google Scholar] [CrossRef]
  45. Marín-Monroy, E.A.; Trejo-Hernández, V.; Romero-Vadillo, R.; Ivanova-Boncheva, A. Vulnerability and risk factors due to tropical cyclones in coastal cities of Baja California Sur, Mexico. Climate 2020, 8, 144. [Google Scholar] [CrossRef]
  46. Thakur, B.; Parajuli, R.; Kalra, A.; Ahmad, S.; Gupta, R. Coupling HEC-RAS and HEC-HMS in precipitation runoff modeling and evaluating flood plain inundation map. In Proceedings of the World Environmental and Water Resources Congress, Sacramento, CA, USA, 21–25 May 2017; pp. 240–251. [Google Scholar]
  47. Natarajan, S.; Radhakrishnan, N. An integrated hydrologic and hydraulic flood modeling study for a medium-sized ungauged urban catchment area: A case study of Tiruchirappalli City Using HEC-HMS and HEC-RAS. J. Inst. Eng. (India) Ser. A. 2020, 101, 381–398. [Google Scholar] [CrossRef]
  48. QGIS.org. QGIS Geographic Information System. Open Source Geospatial Foundation Project. 2021. Available online: http://qgis.org (accessed on 13 November 2021).
  49. Flumen Institute. Design Storm Calculation through the Alternate Blocks Methods. 2021. Available online: https://www.flumen.upc.edu/en/documents/software/bloques.rar/view (accessed on 24 October 2021).
  50. Chow, V.T.; Maidment, D.R.; Mays, L.W. Applied Hydrology; McGraw-Hill: New York, NY, USA, 1988; p. 572. [Google Scholar]
  51. HEC-HMS Technical Reference Manual. Available online: https://www.hec.usace.army.mil/confluence/hmsdocs/hmstrm (accessed on 16 November 2021).
  52. Cronshey, R. Urban Hydrology for Small Watersheds; United States Agriculture Department (USDA): Washington, DC, USA, 1986. [Google Scholar]
  53. Kirpich, Z.P. Time of concentration of small agricultural watersheds. Civil. Eng. 1940, 10, 362. [Google Scholar]
  54. Hydrologic Engineering Center. Hec-Ras River Analysis System; Hydrologic Engineering Center: Davis, CA, USA, 2020; 705p. [Google Scholar]
  55. Meza-Padilla, R.; Appendini, C.M.; Pedrozo-Acuña, A. Hurricane induced waves and storm surge modeling for the Mexican coast. Ocean Dyn. 2015, 65, 1199–1211. [Google Scholar] [CrossRef]
  56. Emanuel, K.; Rotunno, R. Self-Stratification of Tropical Cyclone Outflow. Part I: Implications for Storm Structure. J. Atmos. Sci. 2011, 68, 2236–2249. [Google Scholar] [CrossRef]
  57. Kirtman, B.; Power, S.B.; Adedoyin, J.A.; Boer, G.J.; Bojariu, R.; Camilloni, I.; Doblas-Reyes, F.J.; Fiore, A.M.; Kimoto, M.; Meehl, G.A.; et al. Near-term Climate Change: Projections and Predictability. In Climate Change 2013: The Physical Science Basis. Contribution of Working Group I to the Fifth Assessment Report of the Intergovernmental Panel on Climate Change; Stocker, T.F., Qin, D., Plattner, G.-K., Tignor, M., Allen, S.K., Boschung, J., Nauels, A., Xia, Y., Bex, V., Midgley, P.M., Eds.; Cambridge University Press: Cambridge, UK; New York, NY, USA, 2013; pp. 1137–1215. Available online: https://www.ipcc.ch/pdf/assessment-report/ar5/wg1/WG1AR5_Chapter11_FINAL.pdf (accessed on 29 October 2020).
  58. Vermeer, M.; Rahmstorf, S. Global sea level linked to global temperature. Proc. Natl. Acad. Sci. USA 2009, 106, 21527–21532. [Google Scholar] [CrossRef] [PubMed] [Green Version]
  59. Farfán, L.M.; Alfaro, E.J.; Cavazon, T. Characteristics of tropical cyclones making landfall on the Pacific Coast of Mexico: 1970–2010. Atmosfera 2013, 26, 163–182. [Google Scholar] [CrossRef] [Green Version]
  60. National Hurricane Center’s Tropical Cyclone Reports. Available online: https://www.nhc.noaa.gov/data/tcr/index.php?season=2021&basin=epac (accessed on 26 November 2021).
Figure 1. Localization of study area.
Geohazards 03 00001 g001
Figure 2. Flowchart for the elaboration of the runoff-storm surge flood hazard Map.
Geohazards 03 00001 g002
Figure 3. Hyetographs for sub-basin LP1 (1), sub-basin LP2 (2), sub-basin LP3 (3), and sub-basin LP4 (4), and different return periods (RP) in years.
Geohazards 03 00001 g003
Figure 4. Catchment diagram used in HEC-HMS for the hydrologic modeling.
Geohazards 03 00001 g004
Figure 5. Impact of tropical cyclones in Baja California Sur state for the period 1970–2020.
Geohazards 03 00001 g005
Figure 6. Flooding water elevation maps according to different return periods (RP) in years. (A) = RP2, (B) = RP10, (C) = RP100, and (D) = RP1000.
Geohazards 03 00001 g006
Figure 7. Extent of flooding in the coast as a result of different scenarios of storm surge. Dark blue represents the scenario with less probability of occurrence, light blue is the scenario with the higher probability of occurrence.
Geohazards 03 00001 g007
Figure 8. Runoff-Storm surge flood hazard map for study area.
Geohazards 03 00001 g008
Table 1. Statistical analysis of rainfall data from SMN weather stations.
Weather Station IDYears of RecordsMin (mm/24 h)Max (mm/24 h)Average (mm/24 h)Standard Deviation
31101978–201718.0173.057.542.4
31671982–201730.0237.082.050.7
30771961–201716.0240.065.742.1
30151962–20176.0493.051.968.7
30361944–201720.0360.084.564.6
30111965–201724.0347.598.877.8
30231953–201734.5220.076.838.6
30581945–201736.0221.083.544.3
30741940–201722.9137.056.427.4
31041977–201723.0359.097.279.8
Table 2. Return periods calculated for each weather station considering the maximum rainfall in 24 h yearly.
Weather Station IDRP2 (mm/24 h)RP10 (mm/24 h)RP100 (mm/24 h)RP1000 (mm/24 h)
311044.9108.4219.5377.8
316768.53144.9273.9452.1
307755.0117.1213.8563.3
301534.7108.0278.8563.3
303666.3158.8318.3542.9
301176.9193.4383.8625.3
302366.9124.2218.1345.0
305871.9138.2248.3399.0
307449.891.2153.1226.6
310473.4192.5416.5768.0
Table 3. Scenarios of storm surge and their relationship with the intensity of tropical cyclones and their probability of occurrence.
Intensity of Tropical CycloneProbability of OccurrenceStorm Surge Scenario
TS-H10.6701.5 m
H20.1802.5 m
H30.0904.0 m
H4-H50.0455.0 m
Table 4. Integration of the results for La Palma model and storm surge scenarios.
La Palma Model ResultsRunoff Hazard ScoreStorm Surge ScenariosStorm Surge Hazard ScoreRunoff-Storm Surge Flood MapRunoff-Storm Surge Flood Hazard
TR241.5 m48–4Very High
TR1032.5 m34–2High
TR10024.0 m22–1Moderate
TR100015.0 m11–0.1Low
Publisher’s Note: MDPI stays neutral with regard to jurisdictional claims in published maps and institutional affiliations.

