Abstract
Surface fault displacement due to an earthquake affects buildings and infrastructure in the near-fault area significantly. Although approaches for probabilistic fault displacement hazard analysis have been developed and applied in practice, there are several limitations that prevent fault displacement hazard assessments for multiple locations simultaneously in a physically consistent manner. This study proposes an alternative approach that is based on stochastic source modelling and fault displacement analysis using Okada equations. The proposed method evaluates the fault displacement hazard potential due to a fault rupture. The developed method is applied to the 1999 Hector Mine earthquake from a retrospective perspective. The stochastic-source-based fault displacement hazard analysis method successfully identifies multiple source models that predict fault displacements in close agreement with observed GPS displacement vectors and displacement offsets along the fault trace. The case study for the 1999 Hector Mine earthquake demonstrates that the proposed stochastic-source-based method is a viable option in conducting probabilistic fault displacement hazard analysis.
1. Introduction
In the near-fault region, surface fault displacement due to an earthquake rupture can cause major damage to buildings and urban infrastructures, disrupting their services and functionalities [1,2]. In particular, surface fault displacement hazard is important for safe installation and operation of nuclear facilities [3,4]. To evaluate the extent and likelihood of ground deformation, probabilistic fault displacement hazard analysis (PFDHA) has been developed in [5] for normal faulting earthquakes and has been extended to other faulting types, such as strike-slip events [6] and reverse events [7,8,9]. The key element of PFDHA is an empirical predictive relationship of surface fault displacement, which is established based on historical fault rupture data. Equations for predicting fault displacement distinguish on-fault (principal) and off-fault (distributed) surface ruptures [5,6,8,9,10,11]. To improve the predictive power of the empirical relationships, global efforts have been made to create more extensive surface rupture databases [12,13].
Youngs et al. [5] proposed two approaches for PFDHA. Firstly, the earthquake approach evaluates the occurrence of surface displacement at a site in relation to the earthquake characteristics (e.g., magnitude and distance from the fault trace). Its formulation resembles that of probabilistic seismic hazard analysis by replacing empirical ground motion models with empirical prediction equations of surface fault displacement for principal and distributed surface ruptures. PFDHA extensions [6,7,8] fall under this category. Secondly, the displacement approach combines the rate of surface displacement events and the distribution for surface displacement based on the geologic features of a fault. In this approach, fault ruptures are not divided into principal and distributed types. Although the existing PFDHA approaches are well accepted in practice, the current methodologies face several challenges [4,10]:
- (i)
- The surface displacement equation is dependent on a faulting mechanism (i.e., normal, strike-slip, and reverse), and is based on different assumptions and approaches;
- (ii)
- There is large scatter of fault displacement data around the empirical equation;
- (iii)
- The prediction equation does not distinguish three translational components of the fault displacement (e.g., E-W, N-S, and U-D); and
- (iv)
- The method is mainly applicable to a single site, and no correlation of prediction errors of the fault displacement prediction equation has been characterized for applying it to multiple sites.
The limitations of the current PFDHA approaches prevent some important applications. For instance, in the near-fault region, horizontal and vertical displacements need to be separated for engineering design (e.g., foundation). On the other hand, differential fault displacements at multiple sites (caused by the same event) are needed for assessing the safety and integrity of linear civil structures (e.g., long-span bridges and pipelines). However, spatial dependence of surface fault displacements at two locations is not fully characterized.
This study presents an alternative approach for PFDHA, which is based on stochastic source modelling [14]. The main differences of the proposed method in comparison with the current methods include the following: stochastic source models, having different fault geometry and slip distributions, are generated using statistical earthquake source scaling relationships [15] and earthquake slip synthesis [16,17], and the Okada equations [18] are evaluated to obtain surface fault displacements in three directions within an area of interest for each generated earthquake source model. A notable difference of the proposed method with respect to existing PFDHA methods is that the focus is the assessment of fault displacement potential due to an earthquake rupture and this is not necessarily the prediction of occurrence of surface fault rupture and its offset displacement. In the proposed approach, uncertainty of the surface fault displacement is captured by the variability of the fault plane geometry and the heterogeneity of earthquake slip, while the physical consistency of the calculated surface fault displacements in different directions and at different locations is retained, allowing the calculations of differential fault displacements between selected sites. Furthermore, the proposed method can be applied to multi-segment rupture cases and adapted to active seismic regions with complex fault systems, such as Uniform California Earthquake Rupture Forecast, Version 3 (UCERF3) in California [19]. The stochastic-source-modelling-based PFDHA can be performed for retrospective and prospective evaluations. For retrospective evaluations, a historical event is focused upon and representative earthquake source models can be generated by achieving a satisfactory match between observed and modelled fault displacements. Conceptually, this is similar to earthquake source inversion. For prospective assessments, multiple stochastic source models can be generated from the acceptable scaling relationships of earthquake source models and corresponding surface displacement fields can be simulated. By generating numerous realizations of the surface fault displacement at target sites and incorporating the frequency of the simulated seismic events, a full site-specific surface fault displacement curve as well as a differential surface displacement curve for two selected sites can be obtained. The key features of the proposed PFDHA are described in Section 2.
In this study, the retrospective PFDHA is carried out by focusing on the 1999 Hector Mine earthquake. This historical event is chosen because various displacement data are available (e.g., GPS data [20,21] and fault offset data [22]), and several source inversions have been conducted by using the available ground displacement data [23,24,25]. The key features of the observations and existing source models for the 1999 Hector Mine earthquake are summarized in Section 3. Subsequently, the main results from the retrospective PFDHA based on stochastic source modelling are presented in Section 4. Finally, conclusions as to how the proposed PFDHA can be improved and extended are discussed in Section 5. The main goal of this study is to demonstrate that the new PFDHA method based on stochastic source modelling serves as a viable alternative for the existing PFDHA methods from retrospective perspectives. This work will be extended in a future study to conduct a prospective PFDHA due to a fault rupture zone by incorporating the earthquake occurrence model and the magnitude-recurrence distribution.
2. Methodology
2.1. Formulation
The new method for evaluating the likelihood of surface fault displacement D adopts the following formulation:
where νD(D ≥ d) is the mean annual occurrence rate that D exceeds a certain threshold d. is the annual occurrence rate of earthquakes having magnitudes greater than or equal to Mmin, while fM is the conditional probability distribution of earthquake magnitude M above Mmin. fSM|M is the probability density function of source models SM given M. The uncertainty associated with variable source characteristics can be represented by statistical prediction models of earthquake source parameters and stochastic synthesis of heterogeneous earthquake slip (see Section 2.2). P(D ≥ d|sm) is the fault displacement function given an earthquake source model and can be evaluated by applying Okada equations for a finite rectangular source to simulated earthquake source models. Although the variables M and SM are expressed as continuous random variables in Equation (1), they can be evaluated in a discrete manner. In such cases, integration in Equation (1) should be replaced by summation. In addition, Equation (1) considers single fault source only and does not explicitly show epistemic uncertainty of random variables.
The proposed PFDHA method is compatible with the earthquake and displacement approaches [5]. It can be viewed as an integrated version of the existing two approaches with the core element (i.e., empirical predictive relationship of surface fault displacement) being replaced by stochastic source models and fault displacement analysis based on Okada equations. In the new method, the distribution for surface fault displacement at a site of interest is directly characterized by displacements calculated using Okada equations (thus no distinction of on-fault and off-fault ruptures is necessary). It is also important to emphasize that the calculated displacements do not necessarily mean the occurrence and displacement extent of surface fault rupture, which is the main concern in the existing PFDHA methods. Four major advantages of the new method are that: (i) all faulting mechanisms (e.g., strike-slip, normal, and reverse) can be incorporated by specifying rake angles of the fault rupture; (ii) multi-segment fault ruptures can be considered; (iii) three translational displacements can be obtained for a given location (via Okada equations); and (iv) physically consistent fault displacements at multiple locations can be obtained for a given earthquake scenario. The last feature allows the estimation of the differential fault displacement at two sites.
The proposed PFDHA method can be implemented for two types of investigations, i.e., retrospective and prospective evaluations. The retrospective evaluation is conducted for a historical event or scenario, and focus is given to evaluating in Equation (1). The fault displacement due to a historical event of interest is typically estimated by determining/identifying suitable earthquake source models to match the observed fault displacements. A procedure for conducting a retrospective evaluation of surface fault displacement is shown in Figure 1. The evaluation begins by specifying a scenario in terms of earthquake magnitude and fault plane geometry (e.g., strike, dip, and rake). Subsequently, numerous stochastic source models are generated by using statistical scaling relationships of earthquake source parameters (e.g., fault length, fault width, mean slip, and maximum slip [15]) and then by synthesizing heterogeneous earthquake slip distributions [16,17]. For each source model, fault displacement fields in three orthogonal directions can be calculated using the analytical formula by Okada [18]. The suitability of the simulated source models and corresponding fault displacement fields is assessed by comparing the simulated results with the observed displacements. Source models that produce a poor match with the observations are discarded, while multiple models that are in close agreement with the observations can be accepted. The criteria are defined based on a performance metric or score in relation to existing benchmark earthquake source models. The search process is continued until a required number of suitable earthquake source models are identified. Using the acceptable earthquake sources and calculated fault displacements, can be evaluated quantitatively. This type of investigation is useful for evaluating the methodological performance in characterizing the surface fault displacement.
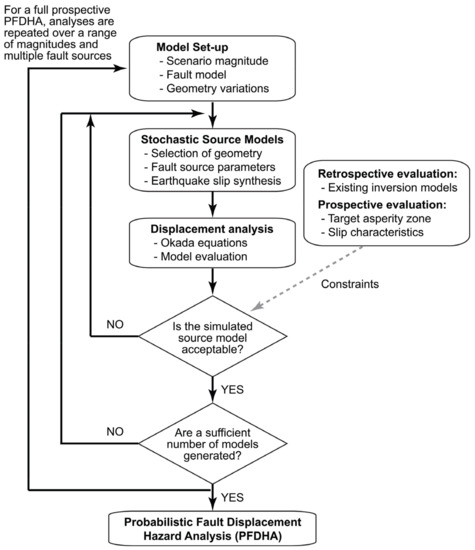
Figure 1.
Probabilistic fault displacement hazard analysis based on stochastic source modelling.
In contrast, the prospective assessment is applicable to situations where general seismological/geological information is available to define an earthquake scenario of interest. It involves the evaluation of Equation (1) as a whole and requires the information related to the earthquake occurrence model and magnitude distribution (i.e., and fM). The final product of the assessment is the fault displacement hazard curve νD(D ≥ d). To carry out the prospective assessment of fault displacement hazard, multiple earthquake scenarios with a range of earthquake magnitudes need to be considered (see Figure 1).
2.2. Stochastic Source Modelling and Fault Displacement Modelling
The first step of the fault displacement analysis is to define a magnitude and fault plane model for a rupture scenario. The fault plane model is discretized into multiple subfaults and can be composed of multiple segments. Their geometrical parameters, such as strike, dip, and rake angles, can be specified by accounting for possible alternative cases.
Next, a stochastic source model is generated by sampling eight source parameters, i.e., fault length (L), fault width (W), mean slip (Da), maximum slip (Dm), Box-Cox parameter (λBC), along-strike correlation length (CL), along-dip correlation length (CW), and Hurst number (H) from the statistical scaling relationships and by synthesizing a heterogeneous earthquake distribution based on the simulated source parameters. For the generation of the eight source parameters, scaling relationships developed in [15] can be considered and are summarized in Table 1. Among the eight parameters, six parameters are correlated with the correlation matrix shown in the table.

Table 1.
Statistical scaling relationships of eight earthquake source parameters that are applicable to earthquakes with normal/strike-slip/reverse faulting mechanisms.
The sampled values of L and W, together with strike and dip angles, define the fault plane geometry. When L and W can be smaller than the overall fault plane model of the considered scenario, the simulated fault can be floated within the target source region. The simulated values of Da, Dm, and λBC specify the marginal distribution of earthquake slip over a fault plane, whereas the simulated values of CLL, CLW, and H define the spatial heterogeneity of earthquake slip over a fault plane based on von Kármán wavenumber spectra [16]. A synthesis of a heterogeneous earthquake slip distribution can be performed based on the simulated wavenumber spectrum and random phase angles using the Fourier integral method [16]. To obtain a heterogeneous earthquake slip distribution with realistic positive skewness, the synthesized slip distribution is converted via Box-Cox transformation using the simulated value of λBC, and is adjusted to achieve the target mean and maximum slips Da and Dm. Then, consistency among the simulated values of L, W, and Da can be checked by comparing the target seismic moment and the simulated seismic moment. Due to the variability in L, W, and Da, in case a simulated source model does not achieve consistency in terms of seismic moment, the generated source model is abandoned and a new source model is generated. Further details of the source parameters and earthquake slip distribution synthesis can be found in [15].
Finally, Okada equations for finite rectangular source are used to calculate the fault displacements due to a synthesized earthquake source model. The Okada equations analytically compute surface fault displacements due to tectonic fault movements in a homogeneous semi-infinite medium (see Equations (25)–(30) in ref. [18]). The slip vector for each subfault is specified by the slip and rake angle. When the earthquake source model consists of multiple subfaults with assigned slip values, ground deformations due to each subfault rupture can be estimated by applying Okada equations individually and then are summed to obtain the total fault displacements. It is noteworthy that the calculated fault displacements originate from tectonic movements of the fault and do not account for earthquake-triggered settlement and sliding of surface soil.
3. 1999 Hector Mine Earthquake
The M7.1 Hector Mine earthquake occurred on 16 October 1999 in the Mojave Desert of Southern California. The faulting mechanism was of the right lateral strike-slip type and ruptured on the Lavic Lake and Bullion faults over circa 50 km [22]. A map of the fault rupture trace, which is digitized based on [22], and GPS coseismic displacement vector plots [20,21] are shown in Figure 2a. Various geological and geophysical observations are available for this event (e.g., strong motion data, teleseismic data, fault offsets, GPS displacements, and InSAR images). This is ideal for applying the proposed PFDHA method from the retrospective perspective. In particular, the fault offset data were collected in [22], and this dataset was used in developing the empirical fault displacement prediction equation for strike-slip events [6]. Figure 2b shows the horizontal and vertical fault displacement offsets; the start (NNW) and the end (SSE) points of the fault trace are indicated in Figure 2a, noting that the distance along the fault trace (total distance of 48 km) is defined based on a straight line between the two points. Large horizontal offsets of 5+ m were recorded near the junction point between the Lavic Lake and Bullion faults (i.e., trace distance of circa 20 km).
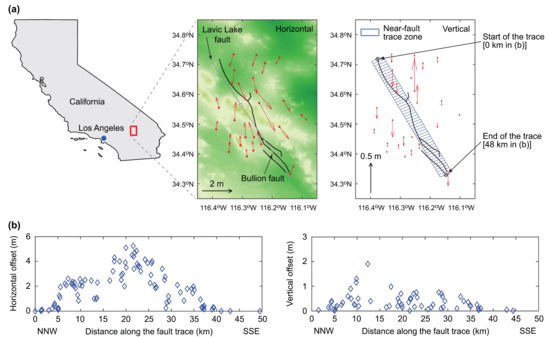
Figure 2.
(a) Fault trace of the 1999 Hector Mine earthquake [22] and GPS displacement vectors [20,21] and (b) displacement offsets along the fault trace [6,22].
The rupture process of the 1999 Hector Mine earthquake has been studied by several researchers. Figure 3 shows three inverted earthquake source models from [23,24,25]. Ji et al. [23] carried out joint source inversion using strong-motion data, P and SH teleseismic body wave data, GPS displacement vectors, and fault offsets. The Ji et al. model consists of three segments, with more gently dipping Lavic Lake fault (dip = 75°) and more steeply dipping Bullion fault (dip = 85°) (Figure 3a). The large slip concentrations were estimated near the junction between the Lavic Lake and Bullion faults. Jonsson et al. [24] carried out a source inversion analysis using satellite radar and GPS displacement data; their rupture model is relatively complex, consisting of nine segments with the constant dip angle of 83° (Figure 3b). The overall earthquake slip distribution is similar to [23]. On the other hand, Salichon et al. [25] developed their 4-segment rupture model using InSAR data, GPS displacement data, and teleseismic data (Figure 3c). The dip angles range from 75° to 86° and their inferred slip distribution is generally consistent with the Ji et al. and Jonsson et al. models. All three studies indicated the importance of constraining the source models based on fault displacement data along the fault trace (e.g., Figure 2b).
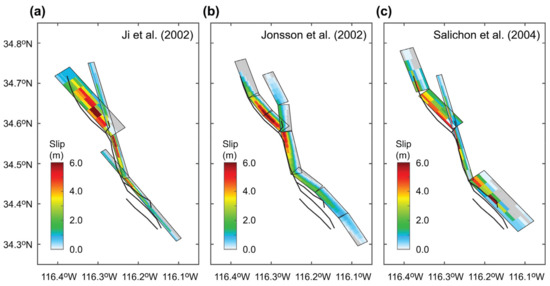
Figure 3.
Existing inverted earthquake source models: (a) Ji et al. [23], (b) Jonsson et al. [24], and (c) Salichon et al. [25]. Note that the source models for [24,25] were obtained from the SRCMOD database [26].
To compare the fault displacements predicted by the existing source models for the 1999 Hector Mine earthquake with the observations, the Ji et al. model is utilized (note: the same analyses were carried out for other source models; using the Ji et al. model, observed displacement data can be well reproduced). The results of computed displacements for three components (E-W, N-S, and U-D), GPS displacement vectors, and horizontal and vertical displacement offsets along the trace are shown in Figure 4.
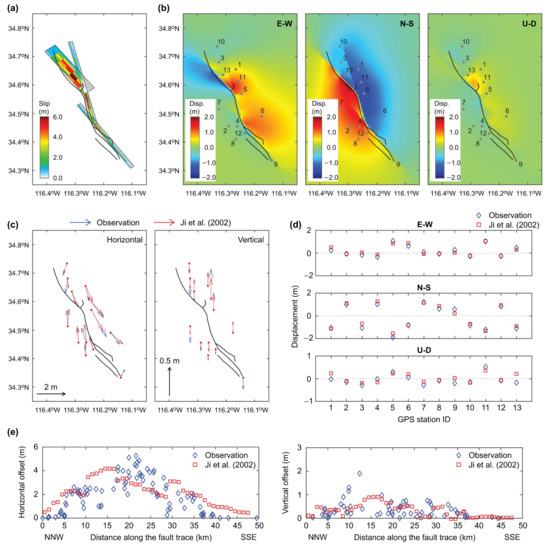
Figure 4.
Model results based on Ji et al. [23]: (a) source model, (b) displacements for three components (E-W, N-S, and U-D), (c) comparison of GPS displacement vectors with observations, (d) comparison of displacements at GPS stations with observations, and (e) comparison of horizontal and vertical offsets along the fault trace with observations. The numbers indicated in (b) correspond to the GPS station numbers that are indicated in (d).
It is noteworthy that the fault offset data provided by [6] (as shown in Figure 2b) are indicated along the fault trace distance, but not at specific geographical coordinates. In obtaining the horizontal and vertical fault offset values from the modelled results, the following calculation steps are considered. First, the Okada displacements (i.e., Figure 4b) are computed with 0.005° grid interval (circa 0.5 km) and then the differential displacements with respect to the neighboring 8 points are computed at every grid point. Second, rectangular zones having 1 km length and 4 km width are defined along the fault trace (see Figure 2a), and for each zone (starting from NNW to SSE), the displacement data point that has the largest differential displacement in the zone is identified as a representative location for the zone. It is noted that the grid spacing of the Okada calculation results is comparable with the data spacing indicated in [6]. Although the rectangular zones have 4 km width (2 km each side with respect to the central fault trace line; see Figure 2a), the maximum differential displacement occurs near the central fault trace line.
The comparison of the GPS displacement data shows good agreement between the observations and modelled results (Figure 4c,d). For the fault offset data (Figure 4e), the observed overall trends of the fault offset displacements are well captured by the predicted results, with some notable deviations for the fault trace distance range between 10 km and 20 km. Several reasons can be mentioned for the differences. There are uncertainties associated with the observation data and the observed displacements (as compiled in [6]) are projected along the main fault trace, while the predicted displacements are computed as the maximum fault offsets at grid locations that have comparable spacing to the observed data. In addition, the Okada calculations are based on several simplifications, such as uniform half-space and elastic material behavior.
4. Retrospective Fault Displacement Hazard Analysis of the 1999 Hector Mine Earthquake
4.1. Model Set-Up
To carry out a retrospective PFDHA of the 1999 Hector Mine earthquake, a fault plane model is set up. By referring to the fault trace indicated by [22] and the 4-segment model by [25] (Figure 3c), the base fault plane model is defined by considering the geometrical information summarized in Table 2. The overall fault length and width are 60 km and 19 km, respectively, and for this study, these two parameters are treated as deterministic variables. This base fault plane is shown in Figure 5b. Four individual fault plane segments are discretized into subfaults with 1 km by 1 km. As seen in the existing source models of the 1999 Hector Mine earthquake (Figure 3), the strike, dip, and rake angles of the four fault segments can be considered as variable. To account for possible variations of these geometrical parameters with respect to the base values (Table 2), three relative variations of strike angle (−5°, 0°, +5°), three relative variations of dip angle (−5°, 0°, +5°), and six relative variations of rake angle (−25°, −15°, −5°, +5°, +15°, +25°) are considered for each of the four segments. The ranges of the parameters are consistent with the existing source models of the 1999 Hector Mine earthquake. Several cases of the varied geometrical parameters are shown in Figure 5. It is noted that in generating stochastic source models, variations of the geometrical parameters are implemented independently for the four segments. After generating a stochastic source model (Section 2.2), the fault displacements are computed with 0.005°.
Table 2.
Base fault plane information for the 1999 Hector Mine earthquake.
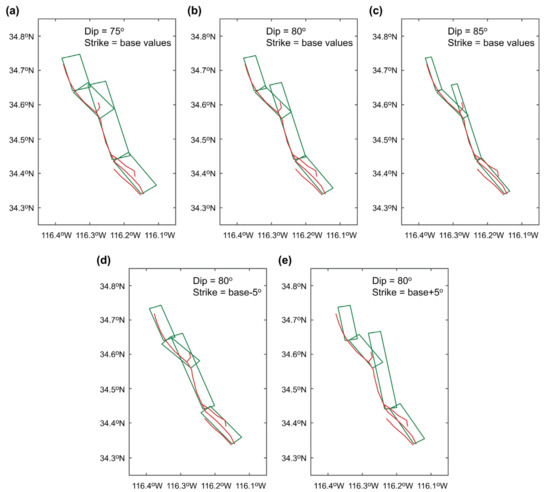
Figure 5.
Variations of fault segment geometry: (a) dip = 75° with base strike angles, (b) dip = 80° with base strike angles, (c) dip = 85° with base strike angles, (d) dip = 80° with base strike angles minus 5°, and (e) dip = 80° with base strike angles plus 5°.
The target moment magnitude for the stochastic source modelling is set to M7.15 with plus and minus 0.1-unit tolerance, noting that the moment magnitude of the 1999 Hector Mine earthquake is reported to be M7.1, while specific inverted source models for this earthquake from [26] range between M7.14 and M7.24. For the retrospective PFDHA, the main objective is to generate stochastic source models that produce fault displacement results similar to the observations. To guide this process, the modelled results based on [23] (as well as other inverted models) are considered as a benchmark. More specifically, the model performance metric or score for the Ji et al. model is calculated by considering:
It is noted that the summation for GPS data is performed for three directions and for 13 stations, indicated in Figure 4b, whereas the summation for fault offset data is performed for the horizontal and vertical displacements and for 48 rectangular zones, indicated in Figure 2a. wGPS in Equation (2) is used to adjust the relative weighting of the sum of squared errors for GPS and offset data (note: there are 39 (=13 × 3) GPS data points, while there are 96 (=48 × 2) displacement offset data points, and GPS data are generally smaller than offset data). In this study, wGPS = 5 is considered (note: several preliminary analyses were performed to examine the sensitivity of the final results to the weighting parameter, and the results do not differ significantly for the range of wGPS = 2 to 8). By applying the model performance score equation to the Ji et al. model (Figure 4), the score in Equation (2) is calculated as 61.15. Based on this benchmark score, the stochastic source modelling for the 1999 Hector Mine earthquake is carried out to obtain 1000 source models that have performance scores smaller than 50.
4.2. Results
For the 1999 Hector Mine earthquake, 1000 stochastic models with performance scores less than 50 are generated. To obtain the final set of 1000 stochastic source models, more than 3.4 million source models are evaluated. The histogram of the simulated stochastic source model scores is shown in Figure 6. As expected, the frequency of the better (smaller) scores decreases exponentially. For instance, there are 303, 60, and 10 source models that achieve performance scores less than 45, 40, and 35, respectively.
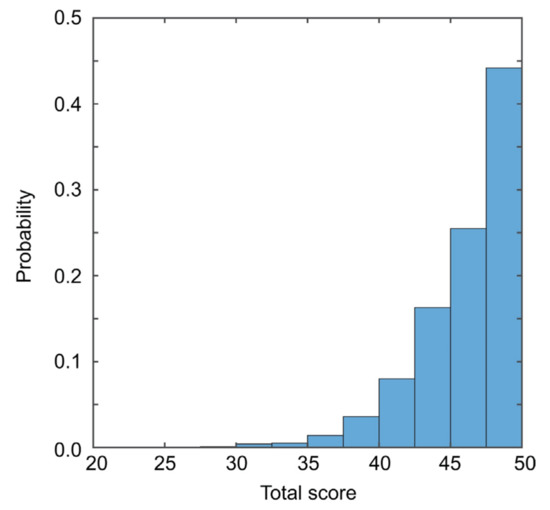
Figure 6.
Histogram of total scores of 1000 stochastic source models.
To make the comparison of a refined subset of the simulated stochastic source models with the observations, 24 stochastic source models that have total performance scores less than 40 and the performance scores for the vertical offset displacement less than 3 are focused upon. Selecting stochastic source models that have a reasonable match for vertical offset displacement results in a more balanced set of stochastic source models. Figure 7 shows the comparison of the simulated displacements at GPS stations based on the top 24 stochastic source models with the observations. The results indicate that the top 24 stochastic source models match well with the GPS observations and the variability of the individual models is not particularly large. Moreover, a similar comparison for the simulated horizontal and vertical offsets along the fault trace is shown in Figure 8. For the horizontal displacement offsets, the top 24 models match the observed fault offset data closely. On the other hand, the simulated vertical displacement offsets based on the top 24 models are more variable; some models can match local large vertical offset observations at 13 km fault trace distance, while other models predict near zero vertical fault offsets (note: this tends to occur when the rake angle becomes 180°). Overall, it can be concluded that the refined set of the stochastic source models can generate fault displacements that are in close agreement with the observed data (even better than the inverted source models; Figure 4).
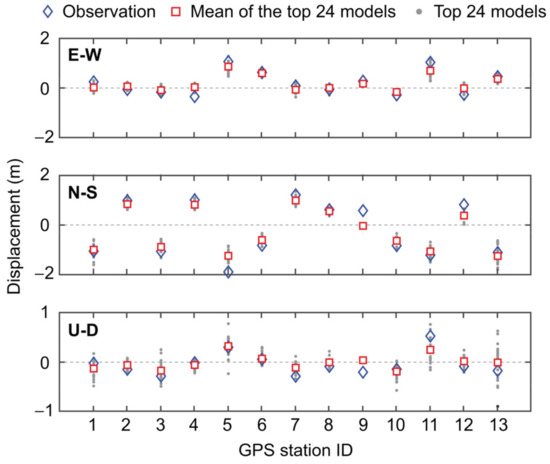
Figure 7.
Comparison of simulated displacements at GPS stations based on the top 24 stochastic source models with observations. The individual results of the top 24 models are shown in grey points, while the average GPS displacements of the top 24 models are shown with red squares.
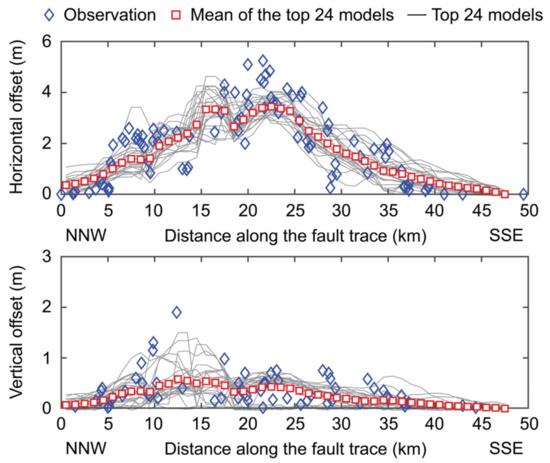
Figure 8.
Comparison of simulated horizontal and vertical offsets along the fault trace based on the top 24 models with observations.
Finally, it is useful to compare the fault displacement results based on the best matching stochastic models with the observations. Figure 9, Figure 10 and Figure 11 show the modelled results of the top three stochastic source models, i.e., model 8 (total score = 32.37), model 149 (total score = 31.81), and model 775 (total score = 31.68), respectively. As expected, despite differences of the source models (i.e., strike and dip angles) shown in Figure 9a, Figure 10a and Figure 11a, these top three stochastic source models can produce fault displacement results similar to the observations, demonstrating the non-uniqueness of the source models to match the same data. These three models predict the large concentrations of earthquake slips along the Lavic Lake fault and near the junction between the Lavic Lake and Bullion faults.
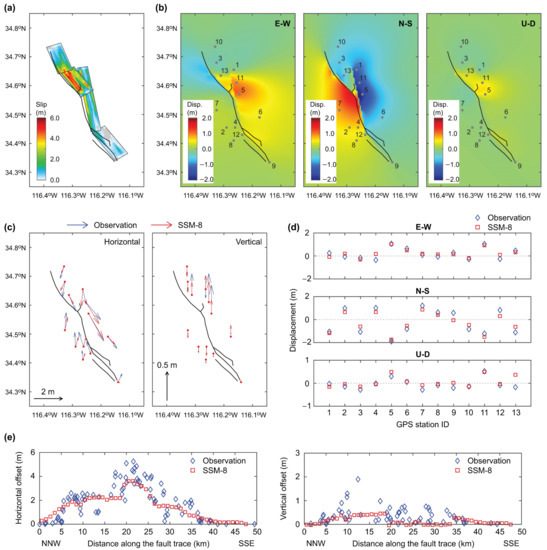
Figure 9.
Model results based on the stochastic source model 8 (total score = 32.37): (a) source model, (b) displacements for three components (E-W, N-S, and U-D), (c) comparison of GPS displacement vectors with observations, (d) comparison of displacements at GPS stations with observations, and (e) comparison of horizontal and vertical offsets along the fault trace with observations.
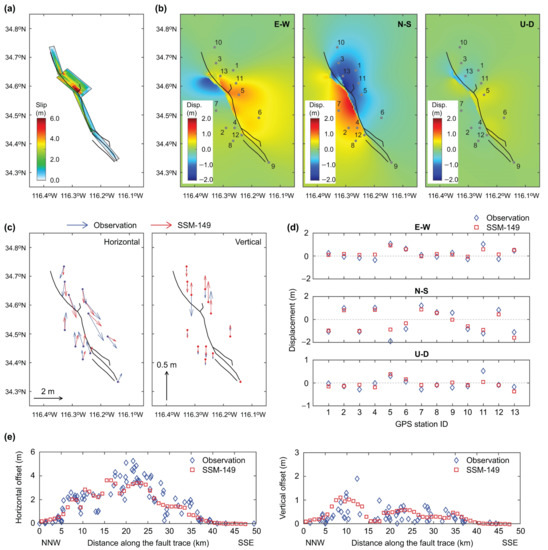
Figure 10.
Model results based on the stochastic source model 149 (total score = 31.81): (a) source model, (b) displacements for three components (E-W, N-S, and U-D), (c) comparison of GPS displacement vectors with observations, (d) comparison of displacements at GPS stations with observations, and (e) comparison of horizontal and vertical offsets along the fault trace with observations.
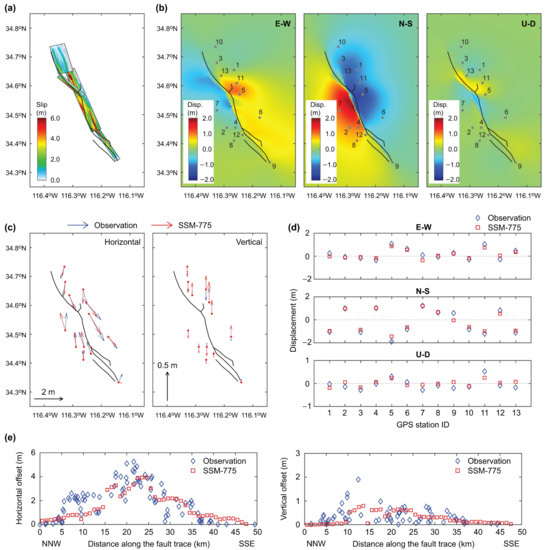
Figure 11.
Model results based on the stochastic source model 775 (total score = 31.68): (a) source model, (b) displacements for three components (E-W, N-S, and U-D), (c) comparison of GPS displacement vectors with observations, (d) comparison of displacements at GPS stations with observations, and (e) comparison of horizontal and vertical offsets along the fault trace with observations.
4.3. Comparison with the Current Probabilistic Fault Displacement Hazard Analysis
It is informative to compare the simulated fault displacements based on the stochastic-source-based PFDHA method with the existing empirical prediction model of the total offset for strike-slip earthquakes in [6]. For this purpose, the simulated horizontal offset displacements are compared with the median as well as median plus/minus 1.0 and 1.5 standard deviations of the Petersen et al. model. For the Petersen et al. model, the bilinear shape function is considered (i.e., Equations (7)–(9) in ref. [6]). These results are compared in Figure 12. The comparison indicates that the Petersen et al. median model underestimates the total displacement offset for the fault trace distance less than 35 km, whereas the confidence interval between the median plus/minus 1.5 standard deviations contains the observation. It is also important to point out that the Petersen et al. model is not specifically calibrated for the 1999 Hector Mine earthquake data (which was one of the eight strike-slip earthquakes). In the fault trace distance range between 5 km and 18 km, the observed total offset corresponds to circa 84th percentile, while in the peak range of the total offset, the observed total offset corresponds to circa 95th percentile. For the case of the 1999 Hector Mine earthquake, the comparison indicates that the observed fault offset displacement cannot be accurately characterized by the standard fault offset function and the consideration of the prediction error is essential. A major challenge of the current state-of-the-art fault displacement prediction equation is that the model does not capture the correlation of fault displacements at two locations. When the detailed stochastic source models that are calibrated against the observed displacement data are adopted (both conventional source inversion models and stochastic source models), the match is significantly improved (as anticipated).
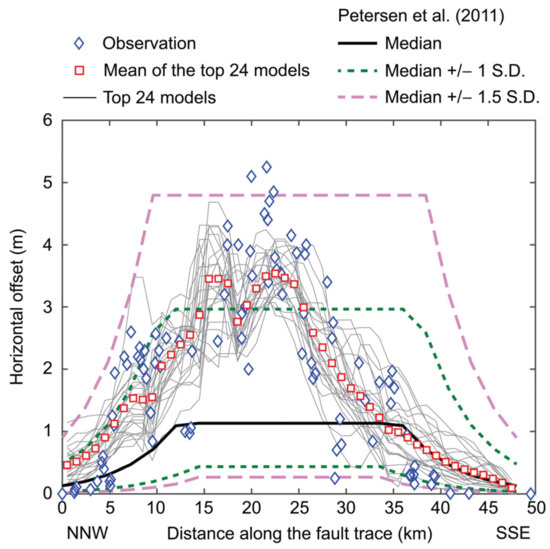
Figure 12.
Comparison of simulated total offsets along the fault trace based on the top 24 models with observations and predictions based on [6] for the 1999 Hector Mine earthquake.
5. Conclusions
A new method for probabilistic fault displacement hazard analysis (PFDHA) has been developed by replacing empirical prediction equations of surface displacement for on-fault and off-fault ruptures with stochastic source models and Okada-based fault displacements. The method predicts the fault displacement hazard potential at both on-fault and off-fault sites and brings in significant advantages over the state-of-the-art PFDHA approaches, including: (i) all faulting types can be accommodated by specifying rake angles; (ii) multi-segment ruptures can be taken into account; (iii) fault displacements in E-W, N-S, and U-D directions can be evaluated; and (iv) differential fault displacements between two locations can be estimated in a physically consistent manner. The method can be adopted for both retrospective and prospective evaluations. This study focused upon the retrospective assessment of the historical 1999 Hector Mine earthquake in Southern California.
The results obtained from the Hector Mine case study indicated that stochastic source modelling can be applied to identify numerous source models that generate fault displacements similar to the observations and can further refine existing source inversion results. This study demonstrated that when the source models are calibrated against the displacement data, the stochastic-source-based PFDHA can produce accurate fault displacement predictions. It is encouraged to conduct retrospective investigations of past historical events using the stochastic-source-based PFDHA method to gain more confidence in reproducing the observed fault displacements for more events. It is also important to recognize that the Okada equations predict the fault displacement hazard potential, rather than the occurrence and extent of the surface fault rupture. In this regard, the applicability of the proposed PFDHA is clearer in regard to principal ruptures along the main fault trace, compared to distributed ruptures off the main fault trace. In future, the applicability to the distributed ruptures should be investigated by overlaying known geological fault structures over predicted fault displacement hazard potential.
The future study should investigate the application of the stochastic source modelling and Okada-based fault displacement analysis to prospective assessments. Such evaluations require the earthquake occurrence and magnitude models to develop site-specific fault displacement hazard curves as well as differential fault displacement hazard curves for multiple locations.
Author Contributions
This is a solo work by the author. All authors have read and agreed to the published version of the manuscript.
Funding
The work is funded by the Canada Research Chair program (950-232015) and the NSERC Discovery Grant (RGPIN-2019-05898). The APC was funded by the same funding programs.
Institutional Review Board Statement
Not applicable.
Informed Consent Statement
Not applicable.
Conflicts of Interest
The author declares no conflict of interest.
References
- Oettle, N.K.; Bray, J.D. Geotechnical Mitigation Strategies for Earthquake Surface Fault Rupture. J. Geotech. Geoenvironmental Eng. 2013, 139, 1864–1874. [Google Scholar] [CrossRef] [Green Version]
- Cheng, Y.; Akkar, S. Probabilistic permanent fault displacement hazard via Monte Carlo simulation and its consideration for the probabilistic risk assessment of buried continuous steel pipelines. Earthq. Eng. Struct. Dyn. 2016, 46, 605–620. [Google Scholar] [CrossRef]
- Katona, T.; Tóth, L.; Győri, E. Fault Displacement Hazard Analysis Based on Probabilistic Seismic Hazard Analysis for Specific Nuclear Sites. Appl. Sci. 2021, 11, 7162. [Google Scholar] [CrossRef]
- Valentini, A.; Fukushima, Y.; Contri, P.; Ono, M.; Sakai, T.; Thompson, S.C.; Viallet, E.; Annaka, T.; Chen, R.; Moss, R.E.S.; et al. Probabilistic Fault Displacement Hazard Assessment (PFDHA) for Nuclear Installations According to IAEA Safety Standards. Bull. Seism. Soc. Am. 2021, 111, 2661–2672. [Google Scholar] [CrossRef]
- Youngs, R.R.; Arabasz, W.J.; Anderson, R.E.; Ramelli, A.R.; Ake, J.P.; Slemmons, D.B.; McCalpin, J.; Doser, D.I.; Fridrich, C.J.; Swan, F.H.; et al. A Methodology for Probabilistic Fault Displacement Hazard Analysis (PFDHA). Earthq. Spectra 2003, 19, 191–219. [Google Scholar] [CrossRef]
- Petersen, M.D.; Dawson, T.E.; Chen, R.; Cao, T.; Wills, C.; Schwartz, D.P.; Frankel, A.D. Fault Displacement Hazard for Strike-Slip Faults. Bull. Seism. Soc. Am. 2011, 101, 805–825. [Google Scholar] [CrossRef] [Green Version]
- Moss, R.E.S.; Ross, Z.E. Probabilistic Fault Displacement Hazard Analysis for Reverse Faults. Bull. Seism. Soc. Am. 2011, 101, 1542–1553. [Google Scholar] [CrossRef]
- Takao, M.; Tsuchiyama, J.; Annaka, T.; Kurita, T. Application of Probabilistic Fault Displacement Hazard Analysis in Japan. J. Jpn. Assoc. Earthq. Eng. 2013, 13, 17–36. [Google Scholar] [CrossRef]
- Nurminen, F.; Boncio, P.; Visini, F.; Pace, B.; Valentini, A.; Baize, S.; Scotti, O. Probability of Occurrence and Displacement Regression of Distributed Surface Rupturing for Reverse Earthquakes. Front. Earth Sci. 2020, 8, 3. [Google Scholar] [CrossRef]
- Wells, D.L.; Kulkarni, V.S. Probabilistic and deterministic fault displacement hazard analysis—Sensitivity analyses and recom-mended practices for developing design fault displacements. In Proceedings of the 10th National Conference in Earthquake Engineering, Anchorage, AK, USA, 21–25 July 2014. [Google Scholar]
- Wesnousky, S.G. Displacement and Geometrical Characteristics of Earthquake Surface Ruptures: Issues and Implications for Seismic-Hazard Analysis and the Process of Earthquake Rupture. Bull. Seism. Soc. Am. 2008, 98, 1609–1632. [Google Scholar] [CrossRef]
- Baize, S.; Nurminen, F.; Sarmiento, A.; Dawson, T.; Takao, M.; Scotti, O.; Azuma, T.; Boncio, P.; Champenois, J.; Cinti, F.R.; et al. A Worldwide and Unified Database of Surface Ruptures (SURE) for Fault Displacement Hazard Analyses. Seism. Res. Lett. 2019, 91, 499–520. [Google Scholar] [CrossRef] [Green Version]
- Sarmiento, A.; Madugo, D.; Bozorgnia, Y.; Shen, A.; Mazzoni, S.; Lavrentiadis, G.; Dawson, T.; Madugo, C.; Kottke, A.; Thompson, S.; et al. Fault Displacement Hazard Initiative Database; Report GIRS-2021-08; University of California: Los Angeles, CA, USA, 2021. [Google Scholar] [CrossRef]
- Goda, K. Probabilistic characterization of seismic ground deformation due to tectonic fault movements. Soil Dyn. Earthq. Eng. 2017, 100, 316–329. [Google Scholar] [CrossRef] [Green Version]
- Goda, K.; Yasuda, T.; Mori, N.; Maruyama, T. New Scaling Relationships of Earthquake Source Parameters for Stochastic Tsunami Simulation. Coast. Eng. J. 2016, 58, 1650010–1650011. [Google Scholar] [CrossRef] [Green Version]
- Mai, P.M.; Beroza, G.C. A spatial random field model to characterize complexity in earthquake slip. J. Geophys. Res. Space Phys. 2002, 107, ESE 10-11. [Google Scholar] [CrossRef]
- Goda, K.; Mai, P.M.; Yasuda, T.; Mori, N. Sensitivity of tsunami wave profiles and inundation simulations to earthquake slip and fault geometry for the 2011 Tohoku earthquake. Earth, Planets Space 2014, 66, 105. [Google Scholar] [CrossRef] [Green Version]
- Okada, Y. Surface deformation due to shear and tensile faults in a half-space. Bull. Seism. Soc. Am. 1985, 75, 1135–1154. [Google Scholar] [CrossRef]
- Field, E.H.; Arrowsmith, R.J.; Biasi, G.P.; Bird, P.; Dawson, T.E.; Felzer, K.R.; Jackson, D.D.; Johnson, K.M.; Jordan, T.H.; Madden, C.; et al. Uniform California Earthquake Rupture Forecast, Version 3 (UCERF3)—The Time-Independent Model. Bull. Seism. Soc. Am. 2014, 104, 1122–1180. [Google Scholar] [CrossRef]
- Scientists of the U.S. Geological Survey, Southern California Earthquake Center, and California Division of Mines and Geology y (USGS, SCEC, and CDMG) Preliminary report on the 10/16/1999 M 7.1 Hector Mine, California earthquake. Seismol. Res. Lett. 2000, 71, 11–23. [Google Scholar]
- Agnew, D.C. Coseismic Displacements from the Hector Mine, California, Earthquake: Results from Survey-Mode Global Positioning System Measurements. Bull. Seism. Soc. Am. 2002, 92, 1355–1364. [Google Scholar] [CrossRef]
- Treiman, J.A. Primary Surface Rupture Associated with the Mw 7.1 16 October 1999 Hector Mine Earthquake, San Bernardino County, California. Bull. Seism. Soc. Am. 2002, 92, 1171–1191. [Google Scholar] [CrossRef]
- Ji, C. Source Description of the 1999 Hector Mine, California, Earthquake, Part II: Complexity of Slip History. Bull. Seism. Soc. Am. 2002, 92, 1208–1226. [Google Scholar] [CrossRef]
- Jonsson, S. Fault Slip Distribution of the 1999 Mw 7.1 Hector Mine, California, Earthquake, Estimated from Satellite Radar and GPS Measurements. Bull. Seism. Soc. Am. 2002, 92, 1377–1389. [Google Scholar] [CrossRef]
- Salichon, J. Slip History of the 16 October 1999 Mw 7.1 Hector Mine Earthquake (California) from the Inversion of InSAR, GPS, and Teleseismic Data. Bull. Seism. Soc. Am. 2004, 94, 2015–2027. [Google Scholar] [CrossRef]
- Mai, P.M.; Thingbaijam, K.K.S. SRCMOD: An Online Database of Finite-Fault Rupture Models. Seism. Res. Lett. 2014, 85, 1348–1357. [Google Scholar] [CrossRef]
Publisher’s Note: MDPI stays neutral with regard to jurisdictional claims in published maps and institutional affiliations. |
© 2021 by the author. Licensee MDPI, Basel, Switzerland. This article is an open access article distributed under the terms and conditions of the Creative Commons Attribution (CC BY) license (https://creativecommons.org/licenses/by/4.0/).