Abstract
Flash floods occur almost exclusively in small basins, and they are common in small Mediterranean catchments. They pose one of the most common natural disasters, as well as one of the most devastating. Such was the case of the recent flood in Euboea island, in Greece, in August 2020. A field survey was accomplished after the 2020 flash floods in order to record the main impacts of the event and identify the geomorphological and man-made causes. The flash flood susceptibility in the urbanized alluvial fans was further assessed using a Geographic Information System (GIS)-based approach. Our findings suggest that a large portion of the alluvial fans of Politika, Poros and Mantania streams are mainly characterized by high and very high hazard. In fact, ~27% of the alluvial fans of Politika and Poros streams are characterized with very high susceptibility, and ~54% of Psachna area. GIS results have been confirmed by field observations after the 2020 flash flood, with significant damages noted, such as debris flows and infrastructure damages, in buildings, bridges and the road networks. In addition, even though the adopted approach may be more time-consuming in comparison to purely computational methods, it has the potential of being more accurate as it combines field observations and the effect of past flooding events.
1. Introduction
The term ‘‘flood’’ refers to the overflow of the natural bed of a river, stream or artificial canal and the consequential covering of areas with water, which would normally be dry [1]. According to the EU directive [2], the term flood refers to “the temporary covering by water of land not normally covered by water”. Floods are a natural phenomenon and comprise an important part of the hydrological processes of a river basin; however, human activities and climate change increase their occurrence and impacts [2]. A flood is an outcome of many factors, the most important of which are intense rainfall, ice melting, high water level (due to natural or man-made barriers in the riverbed), deforestation or fires and dam failure [3,4,5,6,7].
A flash flood is an intense flood that is caused by heavy rainfall in a short period of time. These phenomena occur almost exclusively in small basins (up to a few hundred square kilometers) and they are common in small Mediterranean catchments. They pose one of the most common natural disasters, as well as one of the most devastating [8,9,10,11,12,13], often inducing multiple fatalities, infrastructure damages and dramatic economic losses, especially in large towns. Additionally, a significant part of the European population resides in areas that are susceptible to floods [14].
Flash flood hazards are affected by many factors, amongst which the most important are rainfall intensity, drainage basin characteristics and morphology, geological formations of the area, human interventions and land use [4,5,6,7,15,16,17]. However, as stated above, flash floods mostly occur in small catchments, where there are usually very few gauging and/or monitoring stations and instruments, hence the scarcity of data, both climatic (i.e., rainfall and/or storm frequency and intensity) and hydrological (i.e., flood frequency and intensity and river discharges) [18]. Additionally, such floods are hard to monitor, due to the short time of their occurrence [19,20]. It is also worth mentioning that flash floods are often recorded and/or described alongside landslides, and thus their segregation is often hard [21]. Yet, recently, new technologies are available when determining the impacts of flash floods, such as unmanned aerial vehicles (i.e., drones), thus rendering both the monitoring of the phenomena and the recording of their effects easier and more time-sparing [22]. What is more, several hydraulic models, calculating peak flows, have been proposed and existing ones have been improved, so that many physiographical factors can be considered, such as channel roughness [23]. Flood hazard mapping can also be aided by other methods, such as satellite images and fieldwork observations of the flood effects [24]. According to Hoyois et al. [25] and the Centre for Research on the Epidemiology of Disasters (CRED) [26], floods represent 31.6% of global natural disasters and 32.7% of disasters in Europe, causing correspondingly 9.2 and 2% of the total fatalities and 27.1 and 34.2% of the total financial losses owed to natural disasters. According to Paprotny [27], in Europe, there has been an increase in the number of flash floods per year from 1870 to 2010, among others due to increased urban activity and anthropogenic interventions in the channel beds [6,28]. It is estimated that in the time period 1995–2014, floods have affected approximately 2.3 billion people, whereas the average number of floods has increased in comparison with the previous decades [29]. Costs related to flood damage have been increasing, and partly due to the increasing exposure of people and assets [30]. Kron [31] shows an increase in the number of large flood events and in economic losses and insured losses.
In Europe, between 1870 and 2016, 1564 flood events occurred, 879 (56%) of which were flash floods, owed to river or stream overflow and lasting for less than 24 h. 606 (39%) were normal river floods, whereas 56 (4%) were coastal ones and 23 (1.5%) were mixed flood events. Between 1998 and 2002, more than 100 damaging floods occurred, composing 43% of the total number of natural disasters of that period. They resulted in the death of 700 people and the immigration of approximately half a billion people in countries other than Europe. Damage cost was estimated at 25 billion euros [32]. According to Kundzewicz et al. [6,33], in Europe, between 1985–2016, 304 major flood events were been recorded, corresponding to a rate of about 10 floods per year, and 85 even more severe ones, the rate being 2.5 floods per year. Hoyois et al. [25] have estimated that, between 2000 and 2004, a total of 1,452,740 natural disasters occurred in Europe, 34% of which were floods, 39% were windstorms, 18% were droughts and only 9% were geological ones (e.g., earthquakes). The said disasters caused an average of 66 fatalities per year, 43% of which were owed to floods, 20% to windstorms, 28% to droughts and 9% to geological disasters. The total economic loss was estimated at 9.99 billion (US 2006) dollars, 68% of which were caused by floods, 24% by droughts, 5% by windstorms and 3% by geological ones.
In this framework, the purpose of this study is to evaluate the geomorphological and hydrological features of the August 2020 flash flood events in Central Euboea and examine their causes, both natural and anthropogenic, focusing on the impact of human interventions on the flood hazard. In addition, our study aims to assess the flash flood susceptibility in the urbanized alluvial fans using a GIS-based approach and compare the results with field data obtained after the August 2020 flood.
2. Study Area
Euboea is Greece’s second largest island and lies in the Aegean Sea, central Greece. The study area includes the drainage basins of Messapios river, and Politika, Poros and Mantania streams in central Euboea (Figure 1, Table 1). The areas mainly hit by the August 2020 flash flood are represented by two alluvial fans located in the area of Politika, and the alluvial/coastal plain of the Lelas and Messapios rivers.
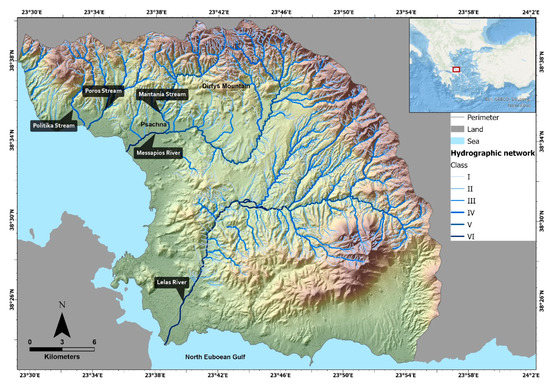
Figure 1.
Location of the study area. Our study focuses on Messapios river, and Politika, Poros and Mantania streams. Location of Lelas river is also indicated, as one of the areas impacted by the 2020 flash flood.

Table 1.
Basic characteristics of the hydrological regime of the studied streams.
The Alpine formations of Central Euboea belong to the Sub-Pelagonian geotectonic zone. They include carbonate rocks of the Triassic-Jurassic age, an ophiolite complex of Late Jurassic–Early Cretaceous age and a Late Jurassic–Early Cretaceous schist-chert formation. The Post-Alpine formations include flysch and fluvio-lacustrine deposits of Upper Miocene and Pleistocene age (Figure 2) [34].
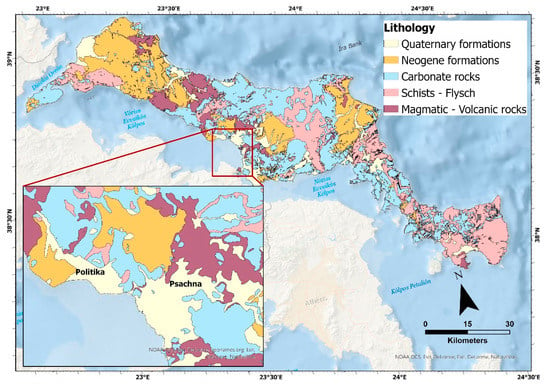
Figure 2.
Lithological map of the study area.
In the study area, there is a succession of mountain ranges, reaching up to 1700 m in height, and low elevation plains, consisting of alluvial deposits [34]. The valleys of the area are generally in the maturity stage, as they are open V-shaped and characterized by gentle slopes, well developed tributaries and flood plain, and meandric development in several parts.
The Messapios river springs from Dirfys Mountain, flowing in a general direction from East to West. Messapios flows into the North Euboean Gulf near the town of Psachna. This town is built at the confluence of the Mantania stream with the Messapios river, where a wide alluvial fan is present.
2.1. Historical Floods
Flood events are common in the study area (Table 2). The most severe recent floods that have hit the area are those of 1998, 2002, 2006 and 2009 [35] and bore a major impact on many municipalities, especially Dirfys-Messapia municipality [36]. For the first two flood events, there is insufficient data. The 30 October 2006 flood struck the areas of Makrykapa, Kastella and Psachna in the municipality of Dirfys-Messapia [36].

Table 2.
Main historical floods in the study area.
2.2. The 2020 Flood Event
Between 5 and 9 August 2020, the storm “Thalia” occurred, mainly due to a mid/upper-tropospheric low-pressure system above the southern part of the Adriatic Sea and the Ionian Sea. The cut-off center in the first morning hours of Saturday (8 August 2020) was above the Ionian Sea, and 12 h later it moved southeastwards and over the mainland Greece and in the morning of Sunday 9 August, it was located over the Aegean Sea. During the night of Saturday 8 August 2020, a low-level convergence zone developed in the Central Aegean Sea, triggering convection of highly unstable air masses [37]. Τhe complex topography of Central Greece had a significant effect on this and long-lasting and stationary supercells developed due to strong vertical wind shear and storm-relative helicity above Euboea. On Saturday 8 August 2020 after 19:00 UTC the first storm cells were detected in North Euboea and within less than 2 h, an almost stationary Mesoscale Convective System (MSC) had developed [37]. The main flood event in Euboea occurred on Sunday 9 August. In particular, the meteorological station of Steni recorded 75 mm rainfall quantity between 23:20 and 02:40, 24 mm between 02:40 and 03:30, and 200 mm between 03:30 and 07:30, reaching at total of 299 mm [37].
3. Materials and Methods
The methodology used in this work is two-fold: (a) geomorphological observations after the 2020 flash flood event and (b) a GIS-based approach to assess the flash flood susceptibility in the studied urbanized alluvial fans. The results of the GIS approach were assessed based on the geomorphological observations of the 2020 flash flood. A general workflow for the present work is illustrated in Figure 3.
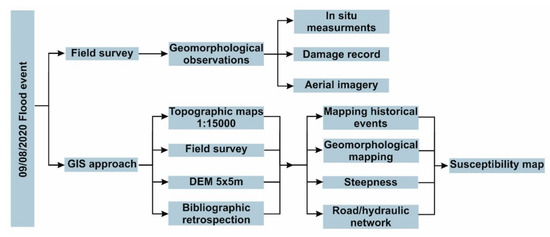
Figure 3.
Workflow illustrating the methodology adopted in this work.
3.1. Field Survey
A field survey took place following the flash flood of 9 August, focusing on the areas mostly affected, namely the alluvial fans of Psachna and Politika. The field survey included the following:
- (a)
- In situ measurements and observations regarding the water height level and extent of the most characteristics sites, in the upper part, the urbanized part, and the lower part of the drainage network (i.e., approximately 1.6 km2 at Psachna, and 1.7 km2 at Politika). Maximum water level marks indicating peak discharge were measured at various parts of the flooded area, using a rigid folding meter (8 measurements). High water marks were identified by lines of dried mud on several surfaces, the presence of leaves, limbs and other plant fragments stuck on various places, seed lines, wrack, and debris lines.
- (b)
- Qualitative documentation of damages caused by the flash floods, both at human structures and infrastructures and at agricultural areas.
- (c)
- An RTK-GNSS equipment (SPECTRA SP-80) was used, with accuracy 0.2 m, in order to create topographic cross-sections perpendicular to the normal stream flow, in order to determine with accuracy, the topographic apex position, in all studied streams.
- (d)
- Documentation of damages using a commercial U.A.V. (DJI Mavic Mini). Flight elevation ranged between 50–70 m for detailed photos and 90–110 m for panoramic views. The route of the flights was planned in a way so that the areas of interest could be captured, and a sufficient number (80) of photographic and video material could be obtained, so that the flood limit and the impacts of the event could be determined.
For the recognition and characterization of the alluvial fan landforms we performed geomorphological analysis in the field of scale 1:5000 and in GIS, through DEM analysis, using ArcGIS Pro v. 2.8. All scale maps (historical events, geomorphology, steepness, and road/hydraulic network condition; Figure 4 and Figure 5) were set up by a Digital Elevation Model (DEM) 5 × 5 m, which was derived from topographic maps of scale 1:5000. Contour lines, slopes, and identification of any other physical or artificial parameters, were derived from the aforementioned DEM.
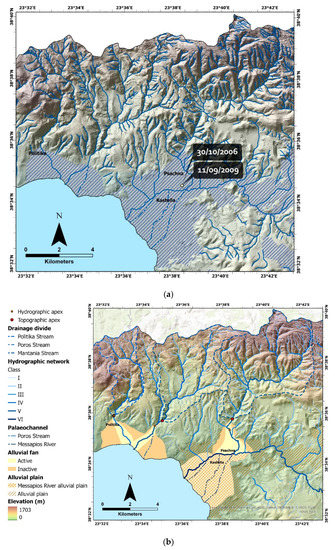
Figure 4.
(a) The historical flood events and the affected areas. The yellow dot indicates the most recent flash flood events that took place near the town of Psachna. The sketching area indicates the general affected area by a historical flood events; (b) Map of the main geomorphological characteristics of the study area.
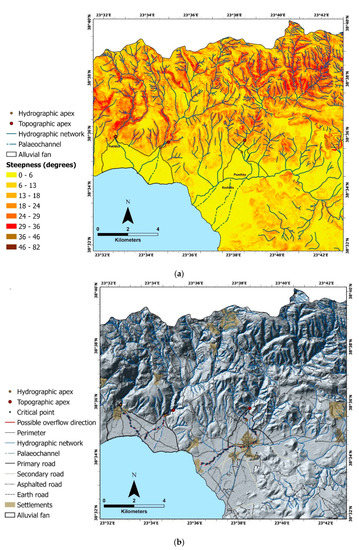
Figure 5.
(a) Slope map of the study area; (b) The road/hydraulic network of the study area.
Topographic and geomorphological analysis maps were used to delimit the alluvial plain, by the changes in the shape of the contour lines and separate the active and inactive lobes, establishing the potential flooding area. The separations of the lobes were mapped by identifying the topographic and hydrographic apex [38,39], with the active lobe being considered to be downstream of the hydrographic apex near the main channel. Field surveys allowed us to verify the channel condition, the sedimentary characteristics, the height of fluvial stratigraphic deposition, and the state of activity of fans.
3.2. Flash Flood Susceptibility Assessment
A GIS-based flash flood susceptibility assessment was accomplished on the alluvial fans of Politika and Psachna areas, following the methodology of Santangelo et al. [40].
Geomorphological observations in the field in combination with large scale maps were used to synthesize thematic maps in each study area, which included historical events (Figure 4a), geomorphology (Figure 4b), steepness (Figure 5a), and road/hydraulic network condition (Figure 5b). These thematic maps represent the main critical factors for flood propagation and are used to produce a flooding susceptibility map using a GIS procedure based on a susceptibility matrix [28,40]. In particular, the susceptibility matrix considers the main steepness classes, and associates them with historical events, geomorphology, and road/hydraulic network condition. The historical events factor considers their presence or absence in the study area. The geomorphology factor takes into account whether it is the active or inactive part of the alluvial fan, and therefore the potential flooding area. The road/hydraulic network factor includes the presence of settlements, the road network, and the possible overflow direction through the critical points.
Three steepness classes get a score from 1 to 3, corresponding to 3 zones of different susceptibility, i.e., low, medium and high. Following this, the other critical factors are considered, each corresponding to a score of 1. Based on the absence or presence of one or more of the critical factors (i.e., historical events, geomorphology, and road/hydraulic network condition), three other levels, from 1 to 3, are defined corresponding to four categories of flood susceptibility (Table 3) [40]. For instance, in the case of low steepness with a score 1, if two more predisposing factors are present, there is a score 3, then the corresponding area is characterized by high susceptibility.

Table 3.
Susceptibility matrix considers the main steepness classes, and associates them with historical events, geomorphology, and road/hydraulic network conditions.
4. Results
4.1. Geomorphological Observations
Based on field observations, three critical points were identified regarding the flash floods of 9 August 2020: the human interventions along the river channel, the arbitrary constructions on alluvial fans and the excessive rainfall rate (Figure 6a,b) (300 mm within 8 h; [37]).
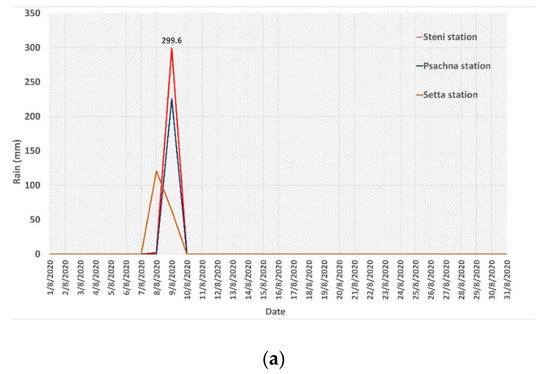
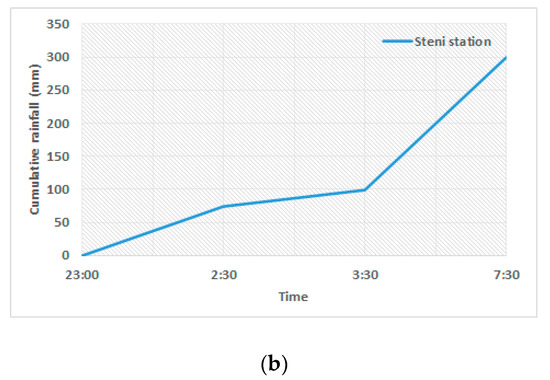
Figure 6.
(a) Rainfall data from three stations near the study area for August of 2020 (data acquired from http://meteosearch.meteo.gr/ (accessed on 13 November 2021)); (b) Cumulative rainfall data from Steni station from 23:00 of 8 August 2020 to 10:00 of 9 August 2020 (based on [37]).
Human structures (bridge, road, etc.) along the river channels of the study area reduced the critical cross-sections of the rivers, causing local overflows and intensification of the phenomenon, whereas the limited constructions of protection dams upstream did not suffice to reduce the dynamics of the flow downstream. On the other hand, alluvial fans are very prone to flooding when heavy rainfall occurs, given that they consist of debris deriving from previous flood events. The constructions perpendicular to the flow and on the said alluvial fans interrupted the smooth drainage of the area. As a result, the human interventions and constructions, in combination with the intense rainfall and the 2019 fires in the broader area, increased the area’s vulnerability to flooding.
The main alluvial fans were active, and a copious amount of sediment was transported downstream (Figure 7). The sediments at the mouths of the two streams were transported towards the west by an east to west coastal drift, at the same time increasing sea level temporarily for a few tens of centimeters, thus flooding the coastal areas. Deposition was extensive over most of the active channels, occupying a large part of the valley floor in all sites. The sediments consisted of mud, silt, gravels and debris. Mud, silt, gravels and debris were deposited in the control cross-section during the event, resulting in an increase of the stream’s datum by some cm. The sediments are usually graded, given that the coarser material moves as bedload and the finer grains in suspension. Some very large concrete blocks, their diameter exceeding 2 m, were moved at least 250 m into the center of the channel.


Figure 7.
Aerial photographs illustrating the damages caused by the 2020 flash flood. (a) Activation of an alluvial fan of Messapios River, which led to channel incision and deposition in the channel and on the fan surface. The red arrows show the direction of the flow. The yellow line shows the dispersion of fine-grained material in the marine environment after 20 days. (b,c) Damages within the settlement of Politika. (d) Damages at rural environment of Psachna.
4.2. The 2020 Flood Impacts on the Settlements and Rural Environment
The flood bore severe social and economic impacts and caused damage to several buildings and infrastructure, loss of property, water pollution, as well as seven fatalities. At the locations where the flow of the water was impeded due to human constructions, the water level rose above the critical level, causing the overflow of the rivers. The impact on settlements was enhanced as the channels were constrained by walls and embankments, hence the height of the runoff water (up to 2 m over the surface, Figure 8). Figure 8 shows debris, consisting of timber and plant fragments, which have destroyed various infrastructures, including bridges, roads and buildings.
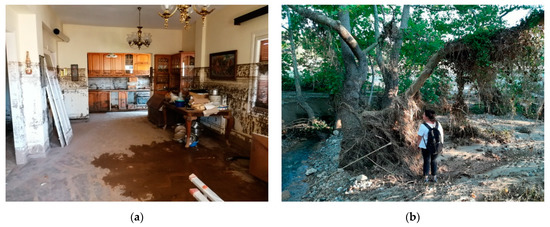
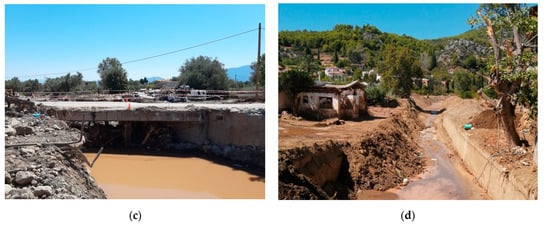
Figure 8.
(a) Mudlines at 1.8 m, indicating the peak discharge of the flash flood (Politika stream—Politika); (b) seed lines (Politika stream—Drosia); (c) Impacts of debris floods on a bridge (Politika stream—Politika); (d) Impacts of debris floods on buildings (Politika stream—Politika).
Additionally, several landslides took place due to the heavy rainfall, and thus many roads were closed. Figure 9 shows the highway connecting Central and North Euboea, which was covered with landslide material in the area between Psachna and Drosia. These materials were derived from slopes which burned out during previous fires.
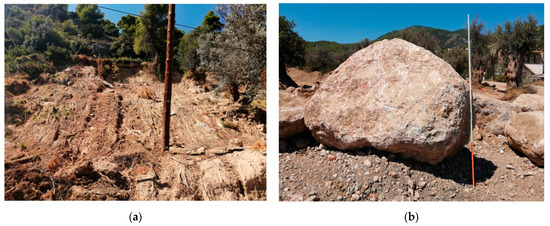
Figure 9.
(a) The highway connecting Central and North Euboea, covered by landslide materials (Politika stream—Drosia); (b) A large boulder with a diameter of more than 2 m, carried away by the flow (Politika stream—Politika).
Table 4 presents the impacts of the flood event on each of the study areas. The regions mostly affected were agricultural ones, while extensive damage was caused to several settlement areas and the road network (bridges, roads) as well.

Table 4.
Judgment matrix on the field survey findings of flash flood impacts on each study area.
The damages caused by the Messapios river flood concerned Psachna and Kastella settlements, as the river flow was impeded due to human constructions. The maximum levels of high-water marks (HWM) in the settlements (mud and debris line) were between 1 to 2 m. In the estuary area, the dimension of the flooded area was expanded, as it forms the river delta.
Although the Politika drainage network is restricted in comparison to the others of the study area, its flooding caused equally significant damages. The combination of the vast amount of rainfall over a short period of time, the high slopes upstream of the river, the 2019 fires and the enclosure of the river along the settlement caused landslides upstream and significant damage at several properties, as water height overcame 2 m in some areas. Many roads and bridges were also destroyed, as well as agricultural damages near the estuary.
4.3. Alluvial Fan Susceptibility Mapping
The largest part of the study area is characterized by smooth slopes, with 56% and 49% of Politika and Psachna areas, respectively, having slopes of 0–2°, about 20% of Politika and Psachna having 2–5° slopes, and 24% and 30% of Politika and Psachna, respectively, with slopes higher than 5°. Artificial surfaces, covering or replacing the stream beds are a critical factor along with the critical points where overflows may occur; along Mantania stream 13 such critical points were mapped, 22 along Messapios river, 13 at Poros stream and 15 at Politika stream (Figure 4b). In addition, the alluvial fans of Politika, Poros and Mantania streams have all been affected by previous flood events (Figure 4a). In terms of geomorphology, both the active and inactive parts of the alluvial fans are important factors for the flash flood susceptibility of the study area.
The GIS-based approach to assess the flash flood susceptibility in the studied urbanized alluvial fans has shown that the alluvial fans of Politika, Poros and Mantania streams are mainly characterized by high and very high susceptibility (Figure 10). In particular, ~27% of the alluvial fans of Politika and Poros streams are characterized with very high susceptibility, and ~54% of the Psachna area.
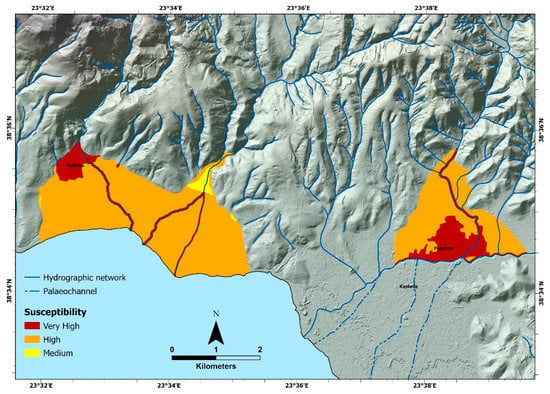
Figure 10.
Flash flood susceptibility calculated for the alluvial fans of Politika, Poros and Mantania streams.
Very high susceptibility is noted on areas where the main critical factors for flood propagation are present. In particular, the very high values are present along the streams and within the settlements of Politika and Psachna. At the area of Politika, the very high susceptibility zone is located on the upper part of the active alluvial fan, where the town has been built, and along the course of Politika and Poros streams. At the area of Psachna, the very high susceptibility zone is identified along the main course of Mantania stream and Messapios river and on the settlement (Psachna town). A significant part of the study area is also characterized by high susceptibility, within the active alluvial fans, i.e., 56% of Politika and 46% of Psachna.
We should note that the flood susceptibility assessment was accomplished only on the alluvial fans of the study area. However, this does not suggest that the alluvial plain of Messapios river, is not susceptible to flooding. Although the GIS model did not include this area, the alluvial plain has been affected by previous and the August 2020 flood (Figure 4a). Damage was lower in relation to Politika and Psachna areas, with flood water containing fine grained material that affected agricultural areas.
5. Discussion
Geomorphological analysis in flood hazard studies can assist in answering two important questions: where flooding could happen and how severe it can be [28]. The combination of geomorphological mapping, GIS, history of past floods as well as post-event surveys can provide a powerful tool to answer the previous questions and the assessment of flash flood hazard.
The flash flood of August 2020 in Euboea was an extreme flooding event; within 8 h 300 mm of rain were recorded. The flash flood susceptibility map produced in this study is well correlated with geomorphological observations after the recent flooding event (Figure 10). As already noted, a significant portion of the study area is characterized by very high to high flash flood susceptibility. These areas have also been affected by previous flood events (Figure 4a) and by the August 2020 flash flood. For instance, agricultural areas located downstream, both at Psachna and Politika, have also suffered significant damages, from flows carrying more fine-grained material. During the flash flood of August 2020, the Politika area suffered significant damages, which included debris flow, transportation of tree trunks and boulders larger than 2 m in diameter, destruction of buildings and bridges, and damages within buildings with water reaching even 2 m in height (Figure 8). At the area of Psachna, significant damages were noted areas along the main course of Mantania stream and Psachna town, with water marks inside buildings between 1–2 m, and debris flows.
Small basins are prone to flash floods, and the urbanization of the alluvial fans in the study area makes these areas more sensitive to such events. At alluvial fan areas, apart from high water heights, considerable sediment transport of various granulometric size can occur, which is capable of producing significant damage to infrastructure and people [41]. Flood risk induced by climate change may be further increased due to urbanization and the presence of more impermeable surface [42], by vegetation cover changes [43], as well as forest fires that result to increased runoff erosion [44]. In the Mediterranean, many rivers are characterized by small and steep drainage basins [45,46]. The particular topography of the Mediterranean makes the area prone to intense precipitation events, particularly during autumn [18,47], with disastrous flash floods in small drainage basins, smaller than 2000–3000 km2 in size [47]. The impacts are more extensive in urbanized areas, downstream of such basins [18,48]. Due to increasing presence of urban areas and infrastructure in floodplains, citizens are more exposed to flood damage and economic impacts are higher [49]. With climate change leading to more unpredictable flash floods, especially in intermittent and ephemeral streams, the risk and potential damage of river floods in the Mediterranean Basin has significantly increased [50].
These facts call for better preparedness intervention priorities and planning risk mitigation works. The identification and mapping of flood-prone areas is amongst the most important measures in order to establish early warning systems [51], develop mitigation plans and proper resource allocation for potential future flood events [52]. Different approaches exist in the literature for flash flood hazard analysis, including morphometric analysis [53], different GIS models [54,55,56], remote sensing in combination with GIS, [57,58] and post-event surveys [41,59,60]. Santo et al. [41] produced a post-event geomorphological map after a flash flood in southern Italy, which can assist in planning detailed risk mitigation strategies. A similar post-event survey by Dinis et al. [59], after moderate rainfall events at southern Africa, allowed to determine that socio-economic conditions were most likely the main reasons of disastrous flood damage. Our work, through geomorphological analysis, GIS, and history of past floods, allows us to identify flood-prone areas, where actions may be required, such as mitigation measures or early warning systems, in order to prevent future damaging floods.
6. Conclusions
The two-fold adopted approach in this work has shown that amongst the most critical factors in flash flood susceptibility is the urbanization of the alluvial fans and the presence of artificial surfaces, covering or replacing the stream beds, which is common in the settlements of the study area. The produced susceptibility map suggests that the alluvial fans of Politika, Poros and Mantania streams are mainly characterized by high and very high susceptibility. In fact, 56% of Politika and 46% of Psachna areas are characterized by high susceptibility, while ~27% of the alluvial fans of Politika and Poros streams are characterized by a very high susceptibility, and ~54% of Psachna area. The adopted approach answers two important questions, where flooding could occur and how severe it can be. Similar flash flood susceptibility maps provide crucial information for the development of mitigation measures in flood prone areas. Our study further highlights that the combination of geomorphological mapping, GIS, history of past floods as well as post-event surveys can provide a powerful tool for the assessment of flash flood hazard.
Author Contributions
Conceptualization, N.E. and A.K.; methodology, N.E. and N.S.; investigation, A.K., N.E., A.P., M.T., E.S., L.L., H.M.; writing—original draft preparation, A.K., N.E., A.P., E.S.; writing—review and editing, A.K., N.E., N.S., H.M.; visualization, M.T.; supervision, N.E. All authors have read and agreed to the published version of the manuscript.
Funding
This research received no external funding.
Institutional Review Board Statement
Not applicable.
Informed Consent Statement
Not applicable.
Data Availability Statement
Data are contained within the article.
Acknowledgments
We would like to thank two anonymous reviewers and the academic editor whose comments improved an earlier version of this manuscript.
Conflicts of Interest
The authors declare no conflict of interest.
References
- IPCC. Managing the Risks of Extreme Events and Disasters to Advance Climate Change Adaptation; Field, C.B., Barros, V., Stocker, T.F., Qin, D., Dokken, D.J., Ebi, K.L., Mastrandrea, M.D., Mach, K.J., Plattner, G.K., Allen, S.K., et al., Eds.; Cambridge University Press: Cambridge, UK, 2012. [Google Scholar]
- European Union Directive. 2007/60/EC of the European Counil and European Parliment of 23 October 2007 on the assessment and management of flood risks. Off. J. Eur. Union 2007, 288, 27–34. [Google Scholar]
- Andjelkovic, I. Guidelines on Non-Structural Measures in Urban Flood Management; International Hydrological Programme (IHP); United Nations Educational: Paris, France, 2001. [Google Scholar]
- Diakakis, M. Flood Hazard Assessment with the Use of Modeling Techniques; National and Kapodistrian University of Athens: Athens, Greece, 2012. [Google Scholar]
- Koutsovili, E.-I. Investigation of Flood Risk in an Intermittent Flow Stream in Pefkochori, Chalkidiki; Aristotle University of Thessaloniki: Thessaloniki, Greece, 2018. [Google Scholar]
- Kundzewicz, Z.W.; Pińskwar, I.; Brakenridge, G.R. Changes in river flood hazard in Europe: A review. Hydrol. Res. 2018, 49, 294–302. [Google Scholar] [CrossRef]
- Sofia, G.; Nikolopoulos, E.I. Floods and rivers: A circular causality perspective. Sci. Rep. 2020, 10, 5175. [Google Scholar] [CrossRef] [PubMed]
- Barredo, J.I. Major flood disasters in Europe: 1950–2005. Nat. Hazards 2007, 42, 125–148. [Google Scholar] [CrossRef]
- Barredo, J.I. Normalised flood losses in Europe: 1970–2006. Nat. Hazards Earth Syst. Sci. 2009, 9, 97–104. [Google Scholar] [CrossRef]
- Ahmadalipour, A.; Moradkhani, H. A data-driven analysis of flash flood hazard, fatalities, and damages over the CONUS during 1996–2017. J. Hydrol. 2019, 578, 124106. [Google Scholar] [CrossRef]
- Flack, D.; Skinner, C.; Hawkness-Smith, L.; O’Donnell, G.; Thompson, R.; Waller, J.; Chen, A.; Moloney, J.; Largeron, C.; Xia, X.; et al. Recommendations for Improving Integration in National End-to-End Flood Forecasting Systems: An Overview of the FFIR (Flooding From Intense Rainfall) Programme. Water 2019, 11, 725. [Google Scholar] [CrossRef]
- Hosseinzadehtalaei, P.; Tabari, H.; Willems, P. Satellite-based data driven quantification of pluvial floods over Europe under future climatic and socioeconomic changes. Sci. Total Environ. 2020, 721, 137688. [Google Scholar] [CrossRef]
- Khajehei, S.; Ahmadalipour, A.; Shao, W.; Moradkhani, H. A Place-based Assessment of Flash Flood Hazard and Vulnerability in the Contiguous United States. Sci. Rep. 2020, 10, 448. [Google Scholar] [CrossRef]
- EEA. Flood Risks and Environmental Vulnerability: Exploring the Synergies between Floodplain Restoration, Water Policies and Thematic Policies; European Environment Agency: Copenhagen, Denmark, 2016. [Google Scholar]
- Wilson, E.M. Engineering Hydrology; Macmillan Education: London, UK, 1990. [Google Scholar]
- Smith, K.; Ward, R. Floods: Physical Processes and Human Impacts; John Wiley & Sons Ltd.: London, UK, 1998; ISBN 978-0-471-95248-0. [Google Scholar]
- Mimikou, M.; Baltas, E. Engineering Hydrology, 4th ed.; Papasotiriou: Athens, Greece, 2006. [Google Scholar]
- Gaume, E.; Borga, M.; Llassat, M.C.; Maouche, S.; Lang, M.; Diakakis, M. Mediterranean extreme floods and flash floods. Mediterr. Reg. Clim. Chang. A Sci. Updat. 2016, 72, 133–144. [Google Scholar]
- Anagnostou, E.N.; Grecu, M.; Anagnostou, M.N. X-band Polarimetric Radar Rainfall Measurements in Keys Area Microphysics Project. J. Atmos. Sci. 2006, 63, 187–203. [Google Scholar] [CrossRef][Green Version]
- Gaume, E.; Borga, M. Post-flood field investigations in upland catchments after major flash floods: Proposal of a methodology and illustrations. J. Flood Risk Manag. 2008, 1, 175–189. [Google Scholar] [CrossRef]
- Vennari, C.; Parise, M.; Santangelo, N.; Santo, A. A database on flash flood events in Campania, southern Italy, with an evaluation of their spatial and temporal distribution. Nat. Hazards Earth Syst. Sci. 2016, 16, 2485–2500. [Google Scholar] [CrossRef]
- Tamminga, A.D.; Eaton, B.C.; Hugenholtz, C.H. UAS-based remote sensing of fluvial change following an extreme flood event. Earth Surf. Process. Landforms 2015, 40, 1464–1476. [Google Scholar] [CrossRef]
- Smith, M.W.; Carrivick, J.L.; Hooke, J.; Kirkby, M.J. Reconstructing flash flood magnitudes using ‘Structure-from-Motion’: A rapid assessment tool. J. Hydrol. 2014, 519, 1914–1927. [Google Scholar] [CrossRef]
- Baker, V.; Kochel, R.C.; Patton, P.C. Flood Geomorphology; Wiley-Interscience: New York, NY, USA, 1988; ISBN 0-471-62558-2. [Google Scholar]
- Hoyois, P.; Below, R.; Scheuren, J.M.; Guha-Sapir, D. Annual Disaster Statistical Review: Numbers and Trends 2006; Center for Research on the Epidemiology of Disasters: Brussels, Belgium, 2007. [Google Scholar]
- CRED. Europe-Disaster Statistics Region Profile for Natural Disasters from 1980–2008 Emergency Events Database EM-DAT: The OFDA/CRED International Disaster Database; Center for Research on the Epidemiology of Disasters: Brussels, Belgium, 2008. [Google Scholar]
- Paprotny, D.; Morales-Nápoles, O.; Jonkman, S.N. HANZE: A pan-European database of exposure to natural hazards and damaging historical floods since 1870. Earth Syst. Sci. Data 2018, 10, 565–581. [Google Scholar] [CrossRef]
- Santangelo, N. Geomorphological Contribution to Flash Floods Hazard Evaluation: Examples from Campania (Southern Italy). J. Environ. Sci. Allied Res. 2019, 2, 44–50. [Google Scholar] [CrossRef]
- CRED. The Human Coast of Weather-Related Disasters 1995–2015; Center for Research on the Epidemiology of Disasters: Brussels, Belgium, 2015. [Google Scholar]
- Kundzewicz, Z.W.; Kanae, S.; Seneviratne, S.I.; Handmer, J.; Nicholls, N.; Peduzzi, P.; Mechler, R.; Bouwer, L.M.; Arnell, N.; Mach, K.; et al. Flood risk and climate change: Global and regional perspectives. Hydrol. Sci. J. 2014, 59, 1–28. [Google Scholar] [CrossRef]
- Kron, W. Changing Flood Risk–A Re-insurer’s Viewpoint. In Changes in Flood Risk in Europe; Kundzewicz, Z.W., Ed.; CRC Press: London, UK, 2012; pp. 459–490. ISBN 9780203098097. [Google Scholar]
- Tasoulas, G. Natural and Man-Made Disasters: The Case of Floods; University of Thessaly: Thessaly, Greece, 2020. [Google Scholar]
- Kundzewicz, Z.W.; Pińskwar, I.; Brakenridge, G.R. Large floods in Europe, 1985–2009. Hydrol. Sci. J. 2013, 58, 1–7. [Google Scholar] [CrossRef]
- Valkanou, K.; Karymbalis, E.; Papanastassiou, D.; Soldati, M.; Chalkias, C.; Gaki-Papanastassiou, K. Μorphometric Analysis for the Assessment of Relative Tectonic Activity in Evia Island, Greece. Geosciences 2020, 10, 264. [Google Scholar] [CrossRef]
- Antoniadis, Z. Scale Development for Flash Flood Impacts; National and Kapodistrian University of Athens: Athens, Greece, 2016. [Google Scholar]
- Sideris, N.; Papageorgiou-Torpidi, N.; Skokou, T.; Papanikolaou, G.; Foteinopoulos, B. Special Secretariat for Water. Available online: https://floods.ypeka.gr/index.php?option=com_content&view=article&id=15&Itemid=507 (accessed on 30 December 2020).
- Lekkas, E.; Spyrou, N.-I.; Kotsi, E.; Filis, C.; Diakakis, M.; Lagouvardos, K.; Cartalis, C.; Kotroni, V.; Dafis, S.; Vassilakis, E.; et al. The August 9, 2020 Evia (Central Greece) Flood; Newsletter of Environmental; Disaster and Crises Management Strategies: Athens, Greece, 2020. [Google Scholar]
- Blair, T.C.; McPherson, J.G. Processes and Forms of Alluvial Fans. In Geomorphology of Desert Environments; Parsons, A.J., Ed.; Springer Netherlands: Dordrecht, The Netherlands, 2009; pp. 413–467. [Google Scholar]
- Hooke, R.L. Processes on arid-region alluvial fans. J. Geol. 1967, 75, 438–460. [Google Scholar] [CrossRef]
- Santangelo, N.; Santo, A.; Di Crescenzo, G.; Foscari, G.; Liuzza, V.; Sciarrotta, S.; Scorpio, V. Flood susceptibility assessment in a highly urbanized alluvial fan: The case study of Sala Consilina (southern Italy). Nat. Hazards Earth Syst. Sci. 2011, 11, 2765–2780. [Google Scholar] [CrossRef]
- Santo, A.; Santangelo, N.; Forte, G.; De Falco, M. Post flash flood survey: The 14th and 15th October 2015 event in the Paupisi-Solopaca area (Southern Italy). J. Maps 2017, 13, 19–25. [Google Scholar] [CrossRef]
- de Roo, A.P.J.; Gouweleeuw, B.; Thielen, J.; Bartholmes, J.; Bongioannini-Cerlini, P.; Todini, E.; Bates, P.D.; Horritt, M.; Hunter, N.; Beven, K.; et al. Development of a European flood forecasting system. Int. J. River Basin Manag. 2003, 1, 49–59. [Google Scholar] [CrossRef]
- Robinson, M.; Cognard-Plancq, A.L.; Cosandey, C.; David, J.; Durand, P.; Führer, H.W.; Hall, R.; Hendriques, M.O.; Marc, V.; McCarthy, R.; et al. Studies of the impact of forests on peak flows and baseflows: A European perspective. For. Ecol. Manag. 2003, 186, 85–97. [Google Scholar] [CrossRef]
- Lasda, O.; Dikou, A.; Papapanagiotou, E. Flash flooding in Attika, Greece: Climatic change or urbanization? Ambio 2010, 39, 608–611. [Google Scholar] [CrossRef]
- Tarolli, P.; Borga, M.; Morin, E.; Delrieu, G. Analysis of flash flood regimes in the North-Western and South-Eastern Mediterranean regions. Nat. Hazards Earth Syst. Sci. 2012, 12, 1255–1265. [Google Scholar] [CrossRef]
- Tramblay, Y.; Mimeau, L.; Neppel, L.; Vinet, F.; Sauquet, E. Detection and attribution of flood trends in Mediterranean basins. Hydrol. Earth Syst. Sci. 2019, 23, 4419–4431. [Google Scholar] [CrossRef]
- Amponsah, W.; Ayral, P.-A.; Boudevillain, B.; Bouvier, C.; Braud, I.; Brunet, P.; Delrieu, G.; Didon-Lescot, J.-F.; Gaume, E.; Lebouc, L.; et al. Integrated high-resolution dataset of high-intensity European and Mediterranean flash floods. Earth Syst. Sci. Data 2018, 10, 1783–1794. [Google Scholar] [CrossRef]
- Llasat, M.C.; Llasat-Botija, M.; Prat, M.A.; Porcú, F.; Price, C.; Mugnai, A.; Lagouvardos, K.; Kotroni, V.; Katsanos, D.; Michaelides, S.; et al. High-impact floods and flash floods in Mediterranean countries: The FLASH preliminary database. Adv. Geosci. 2010, 23, 47–55. [Google Scholar] [CrossRef]
- Geijzendorffer, I.R.; Galewski, T.; Guelmami, A.; Perennou, C.; Popoff, N.; Grillas, P. Mediterranean Wetlands: A Gradient from Natural Resilience to a Fragile Social-Ecosystem. In Atlas of Ecosystem Services; Springer International Publishing: Cham, Switzerland, 2019; pp. 83–89. [Google Scholar]
- Fader, M.; Giupponi, C.; Burak, S.; Dakhlaoui, H.; Koutroulis, A.; Lange, M.A.; Llasat, M.C.; Pulido-Velazquez, D.; Sanz-Cobeña, A. Water. In Climate and Environmental Change in the Mediterranean Basin–Current Situation and Risks for the Future. First Mediterranean Assessment Report; Cramer, W., Guiot, J., Marini, K., Eds.; Union for the Mediterranean, Plan Bleu, UNEP/MAP: Marseille, France, 2020; pp. 181–236. [Google Scholar]
- Piacentini, T.; Carabella, C.; Boccabella, F.; Ferrante, S.; Gregori, C.; Mancinelli, V.; Pacione, A.; Pagliani, T.; Miccadei, E. Geomorphology-Based analysis of flood critical areas in small hilly catchments for civil protection purposes and earlywarning systems: The case of the feltrino stream and the Lanciano Urban Area (Abruzzo, Central Italy). Water 2020, 12, 2228. [Google Scholar] [CrossRef]
- Janizadeh, S.; Avand, M.; Jaafari, A.; Van Phong, T.; Bayat, M.; Ahmadisharaf, E.; Prakash, I.; Pham, B.T.; Lee, S. Prediction success of machine learning methods for flash flood susceptibility mapping in the Tafresh watershed, Iran. Sustainability 2019, 11, 5426. [Google Scholar] [CrossRef]
- Esper Angillieri, M.Y. Morphometric analysis of Colangüil river basin and flash flood hazard, San Juan, Argentina. Environ. Geol. 2008, 55, 107–111. [Google Scholar] [CrossRef]
- Tsanakas, K.; Gaki-Papanastassiou, K.; Kalogeropoulos, K.; Chalkias, C.; Katsafados, P.; Karymbalis, E. Investigation of flash flood natural causes of Xirolaki Torrent, Northern Greece based on GIS modeling and geomorphological analysis. Nat. Hazards 2016, 84, 1015–1033. [Google Scholar] [CrossRef]
- Pham, B.T.; Avand, M.; Janizadeh, S.; van Phong, T.; Al-Ansari, N.; Ho, L.S.; Das, S.; Le, H.; Amini, A.; Bozchaloei, S.K.; et al. GIS based hybrid computational approaches for flash flood susceptibility assessment. Water 2020, 12, 683. [Google Scholar] [CrossRef]
- Curebal, I.; Efe, R.; Ozdemir, H.; Soykan, A.; Sönmez, S. GIS-based approach for flood analysis: Case study of Keçidere flash flood event (Turkey). Geocarto Int. 2016, 31, 355–366. [Google Scholar] [CrossRef]
- Abdo, H.G. Evolving a total-evaluation map of flash flood hazard for hydro-prioritization based on geohydromorphometric parameters and GIS–RS manner in Al-Hussain river basin, Tartous, Syria. Nat. Hazards 2020, 104, 681–703. [Google Scholar] [CrossRef]
- Abdelkareem, M. Targeting flash flood potential areas using remotely sensed data and GIS techniques. Nat. Hazards 2017, 85, 19–37. [Google Scholar] [CrossRef]
- Dinis, P.A.; Huvi, J.; Pinto, M.C.; Carvalho, J. Disastrous flash floods triggered by moderate to minor rainfall events. Recent cases in coastal Benguela (angola). Hydrology 2021, 8, 73. [Google Scholar] [CrossRef]
- Psomiadis, E.; Soulis, K.X.; Zoka, M.; Dercas, N. Synergistic approach of remote sensing and gis techniques for flash-flood monitoring and damage assessment in Thessaly plain area, Greece. Water 2019, 11, 448. [Google Scholar] [CrossRef]
Publisher’s Note: MDPI stays neutral with regard to jurisdictional claims in published maps and institutional affiliations. |
© 2021 by the authors. Licensee MDPI, Basel, Switzerland. This article is an open access article distributed under the terms and conditions of the Creative Commons Attribution (CC BY) license (https://creativecommons.org/licenses/by/4.0/).
