Article

Assessing the Climatological Relationship between Heatstroke Risk and Heat Stress Indices in 47 Prefectures in Japan

1
Graduate School of Biosphere-Geosphere Science, Okayama University of Science, 1-1 Ridai-cho, Kita-ku, Okayama City 700-0005, Japan
2
Faculty of Biosphere-Geosphere Science, Okayama University of Science, 1-1 Ridai-cho, Kita-ku, Okayama City 700-0005, Japan
*
Author to whom correspondence should be addressed.
GeoHazards 2021, 2(4), 321-331; https://doi.org/10.3390/geohazards2040017
Submission received: 20 September 2021 / Revised: 27 October 2021 / Accepted: 28 October 2021 / Published: 29 October 2021

Abstract

:
This study provides a decade-long link between summer heatstroke incidence and certain heat stress indices in 47 prefectures of Japan. The results for each prefecture were determined from the age-adjusted heatstroke incidence rate (TRadj) with heatstroke patients transported by ambulance, as well as from the daily maximum temperature (TEMPmax), maximum wet-bulb globe temperature (WBGTmax), and maximum universal thermal climate index (UTCImax) recorded from July to September of 2010–2019. The UTCImax relatively increased the vulnerability in many prefectures of northern Japan more distinctly than the other indices. In the following analysis, the ratio of the TRadj of the hottest to coolest months using the UTCImax was defined as the heatstroke risk of the hottest to coolest (HRHC). Overall, the HRHC varied approximately from 20 to 40 in many prefectures in the past decade. In contrast, for the same analysis performed in each month, HRHC ratios in July and August fell within 2–4 in many prefectures, whereas in September, the average and maximum HRHC ratios for all prefectures were 7.0 and 32.4, respectively. This difference can be related to the large difference in UTCImax between the maximum and minimum for a decade.

1. Introduction

Human health damage due to heatstroke is recognised as a worldwide issue resulting from global warming and urban heat islands. Between 2030 and 2050, climate change is expected to cause 250,000 additional deaths per year from malnutrition, malaria, diarrhoea, and heat stress [1]. Owing to the hot and humid summer climate in Japan, over 50,000 people suffering from heatstroke are transported by ambulance every year [2]. In particular, 95,137 heatstroke transports were recorded during the severe hot summer of 2018. Many studies have reported that heatstroke transport or fatalities can be related to temperature and heat indices for specific prefectures or cities in Japan [3,4,5,6,7,8,9,10,11]. Fujibe et al. [12] investigated the relationship between heatstroke mortality and temperature in all 47 prefectures of Japan from 1990 to 2014. Moreover, the number of Japanese heatstroke patients increased after 2010 due to an increase in the number of elderly people [13].
Not only the human microscale but country-scale analyses have also frequently used a comprehensive index, such as the modified discomfort index (MDI), the physiological equivalent temperature (PET), the wet-bulb globe temperature (WBGT), and the universal thermal climate index (UTCI) to evaluate heat-related illnesses around the world [14,15,16,17,18,19,20,21,22,23,24]. Napoli et al. [22] effectively used the UTCI to evaluate heat-related health risks covering the entire region of Europe in the summer, and identified the effect of heat stress in countries latitudinally as an important parameter. In Japan, humidity changes with latitude besides temperature possibly complicate the UTCI distributions. Willett and Sherwood [18] predicted a heat stress excess using the WBGT on a global scale (15 regions) due to the increase in absolute humidity in the future warming scenario.
As mentioned above, most studies investigating the relationship between heatstroke risk and heat stress indices in Japan were subjected to the human microscale, urban district scale, or regional scale in a city, except in the aforementioned Fujibe et al. [12,25]. However, specifications for a better indicator to assess heatstroke risk in 47 prefectures of Japan remain an issue. Moreover, this study aims to reveal whether Japanese heatstroke patients transported by ambulance in the last decade (2010–2019), prior to people’s behavioural change enforced by the infamous COVID-19 pandemic, relates to several heat stress indices in all 47 prefectures of Japan (Figure 1), characterised by different climates. Another novelty is that the differences in heatstroke risk between hot and cool summers, which are quantitatively related to heat stress indices in each prefecture, will be compared among prefectures. Understanding the change in heatstroke risk accompanying yearly climate difference is expected to be crucial, considering the risk threats once normalcy is achieved post-COVID-19 or for future climate change.

2. Materials and Methods

2.1. Heatstroke Transport Data

The monthly data of heatstroke patients transported by ambulance were aggregated by the Fire and Disaster Management Agency (FDMA) in the Japanese goverment office [26]. The FDMA has reported the monthly number of heatstroke patients transported by ambulance in 47 prefectures. Each prefecture dataset was classified into age groups: 0–6, 7–17, 18–64, and over 65 for July, August, and September in the summer season from 2010 to 2019.
For analyses in this study, the number of heatstroke transports for each age group was converted into the age-adjusted transport rate (TRadj) to eliminate yearly changes and differences in prefecture population based on age group by using
T R a d j = k ( M R k · P k ) k P k
where k denotes the aforementioned separated age group number. MRk and Pk correspond to the transport rate and standard population for a specific age group k, respectively. The 2015 population age group structure was adopted as Pk: 8.1% for ages 0–6, 9.2% for 7–17, 56.0% for 18–64, and 26.7% for over 65, which was stated as recent typical age categories. The TRadj was calculated per 100,000 people in each prefecture.
In Figure 1, a location map of the 47 prefectures is shown with eight-region division used conventionally in Japan: Hokkaido, Tohoku, Kanto, Chubu, Kinki, Chugoku, Shikoku, and Kyushu regions. The prefecture names corresponding to the number are shown in Tables S1–S7.

2.2. Heat Stress Indices

In this study, the daily maximum temperature (TEMPmax), maximum WBGT (WBGTmax), and maximum UTCI (UTCImax) were used as potential heatstroke risk indicators. The WBGT is known as a heat stress index that is influenced by radiation and humidity besides temperature [27], which was developed to prevent summer heatstroke, and is often used worldwide to evaluate heatstroke risk in sports, daily routine, and work. Meanwhile, the UTCI is frequently used as a human thermal comfort index [28,29,30], which can be applied to assess a wide range of climate zones, from extremely cold to extremely hot conditions [31]. The UTCI index is totally calculated from the meteorological parameters (radiation, temperature, humidity, wind, etc.) and human thermophysiological model. Numerous studies conducted in various countries have confirmed the availability and robustness of both indices [18,32,33,34,35,36].
Figure 1. The 47-prefecture map of Japan Island. Eight regions shown here are colour-coded. Prefectural names are listed in Tables S1–S7 with the prefectural number shown in this figure.
Geohazards 02 00017 g001
The TEMPmax, WBGTmax, and UTCImax indices in each prefecture were calculated from the primitive meteorological data measured by the Japan Meteorological Agency (JMA) observational sites that were published on the JMA website [37]. In particular, the UTCI value was calculated from these data using an approximate polynomial equation developed by Bröde et al. [31]. In contrast, the WBGT value was directly obtained from the observational data for each prefecture, which was available on the Japanese Ministry of the Environment (MOE) website [38]. For analysis, the daily TEMPmax, WBGTmax, and UTCImax were averaged as each monthly value from July to September in the hot season, for the same period as the TRadj analysis. There were many observational sites in each prefecture; for the analysis we chose a site located in the most-populated city of a prefecture, because heatstroke patients are expected to be naturally concentrated there due to high population.

3. Results and Discussion

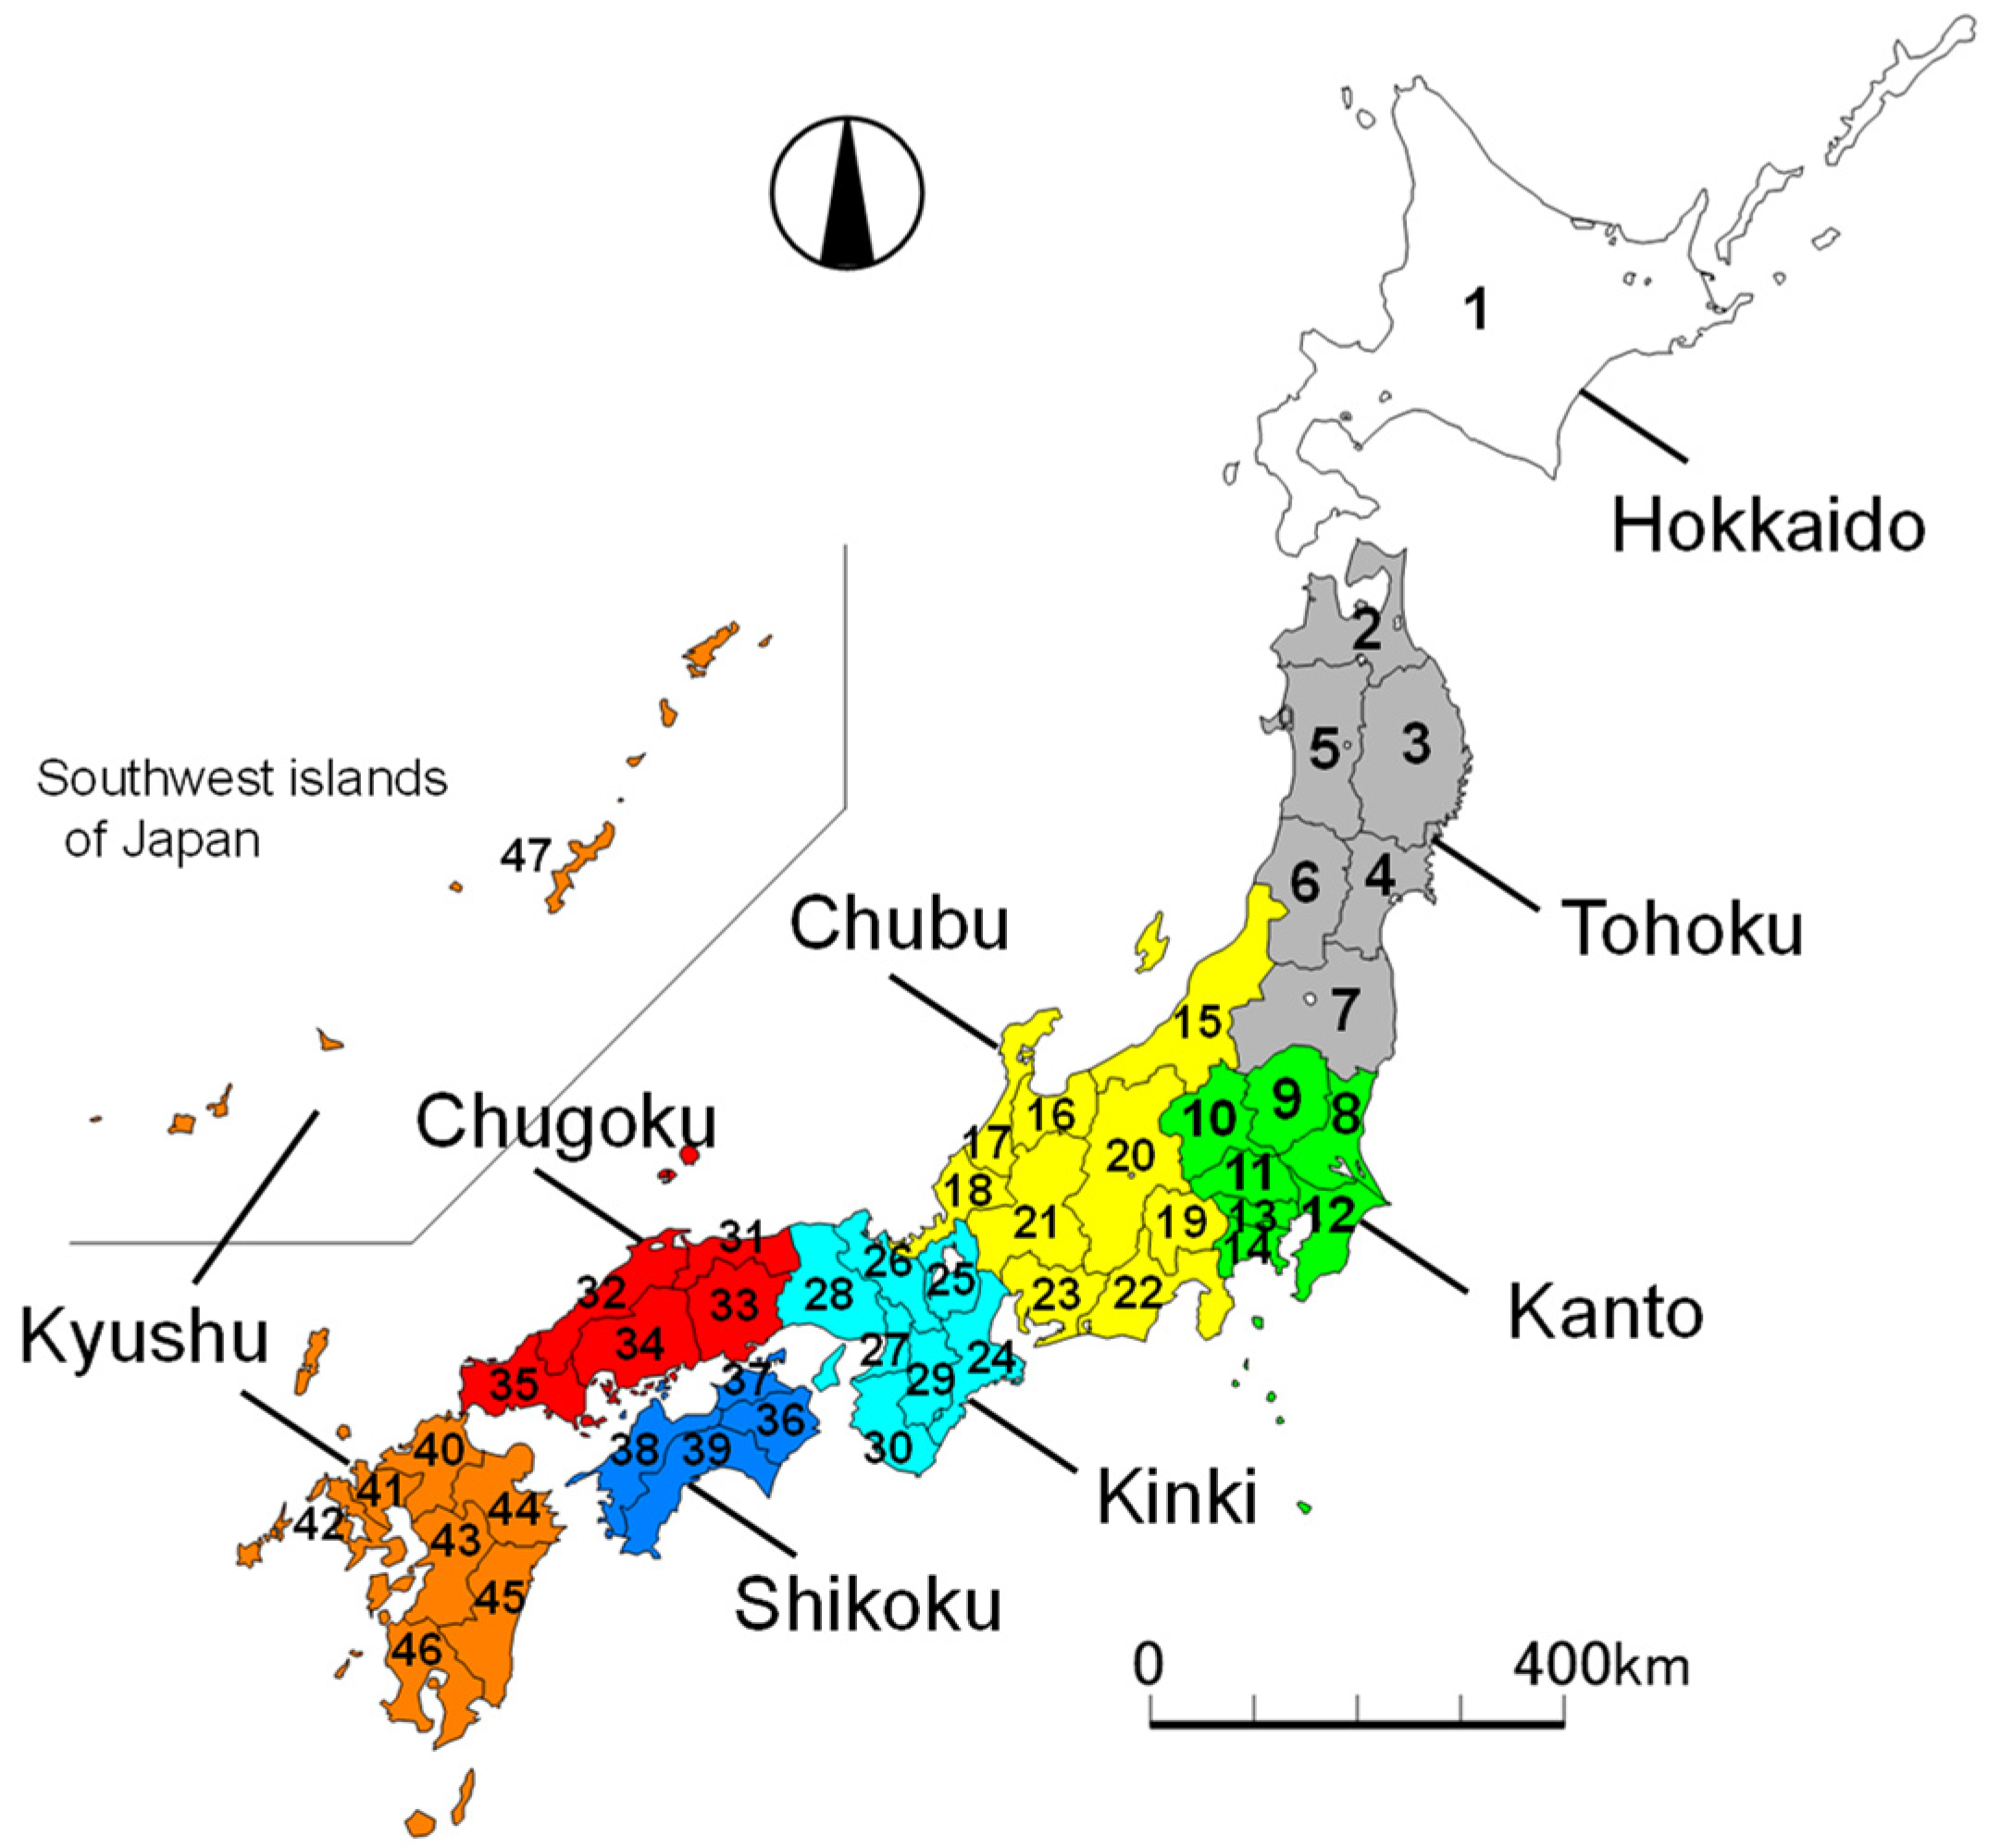
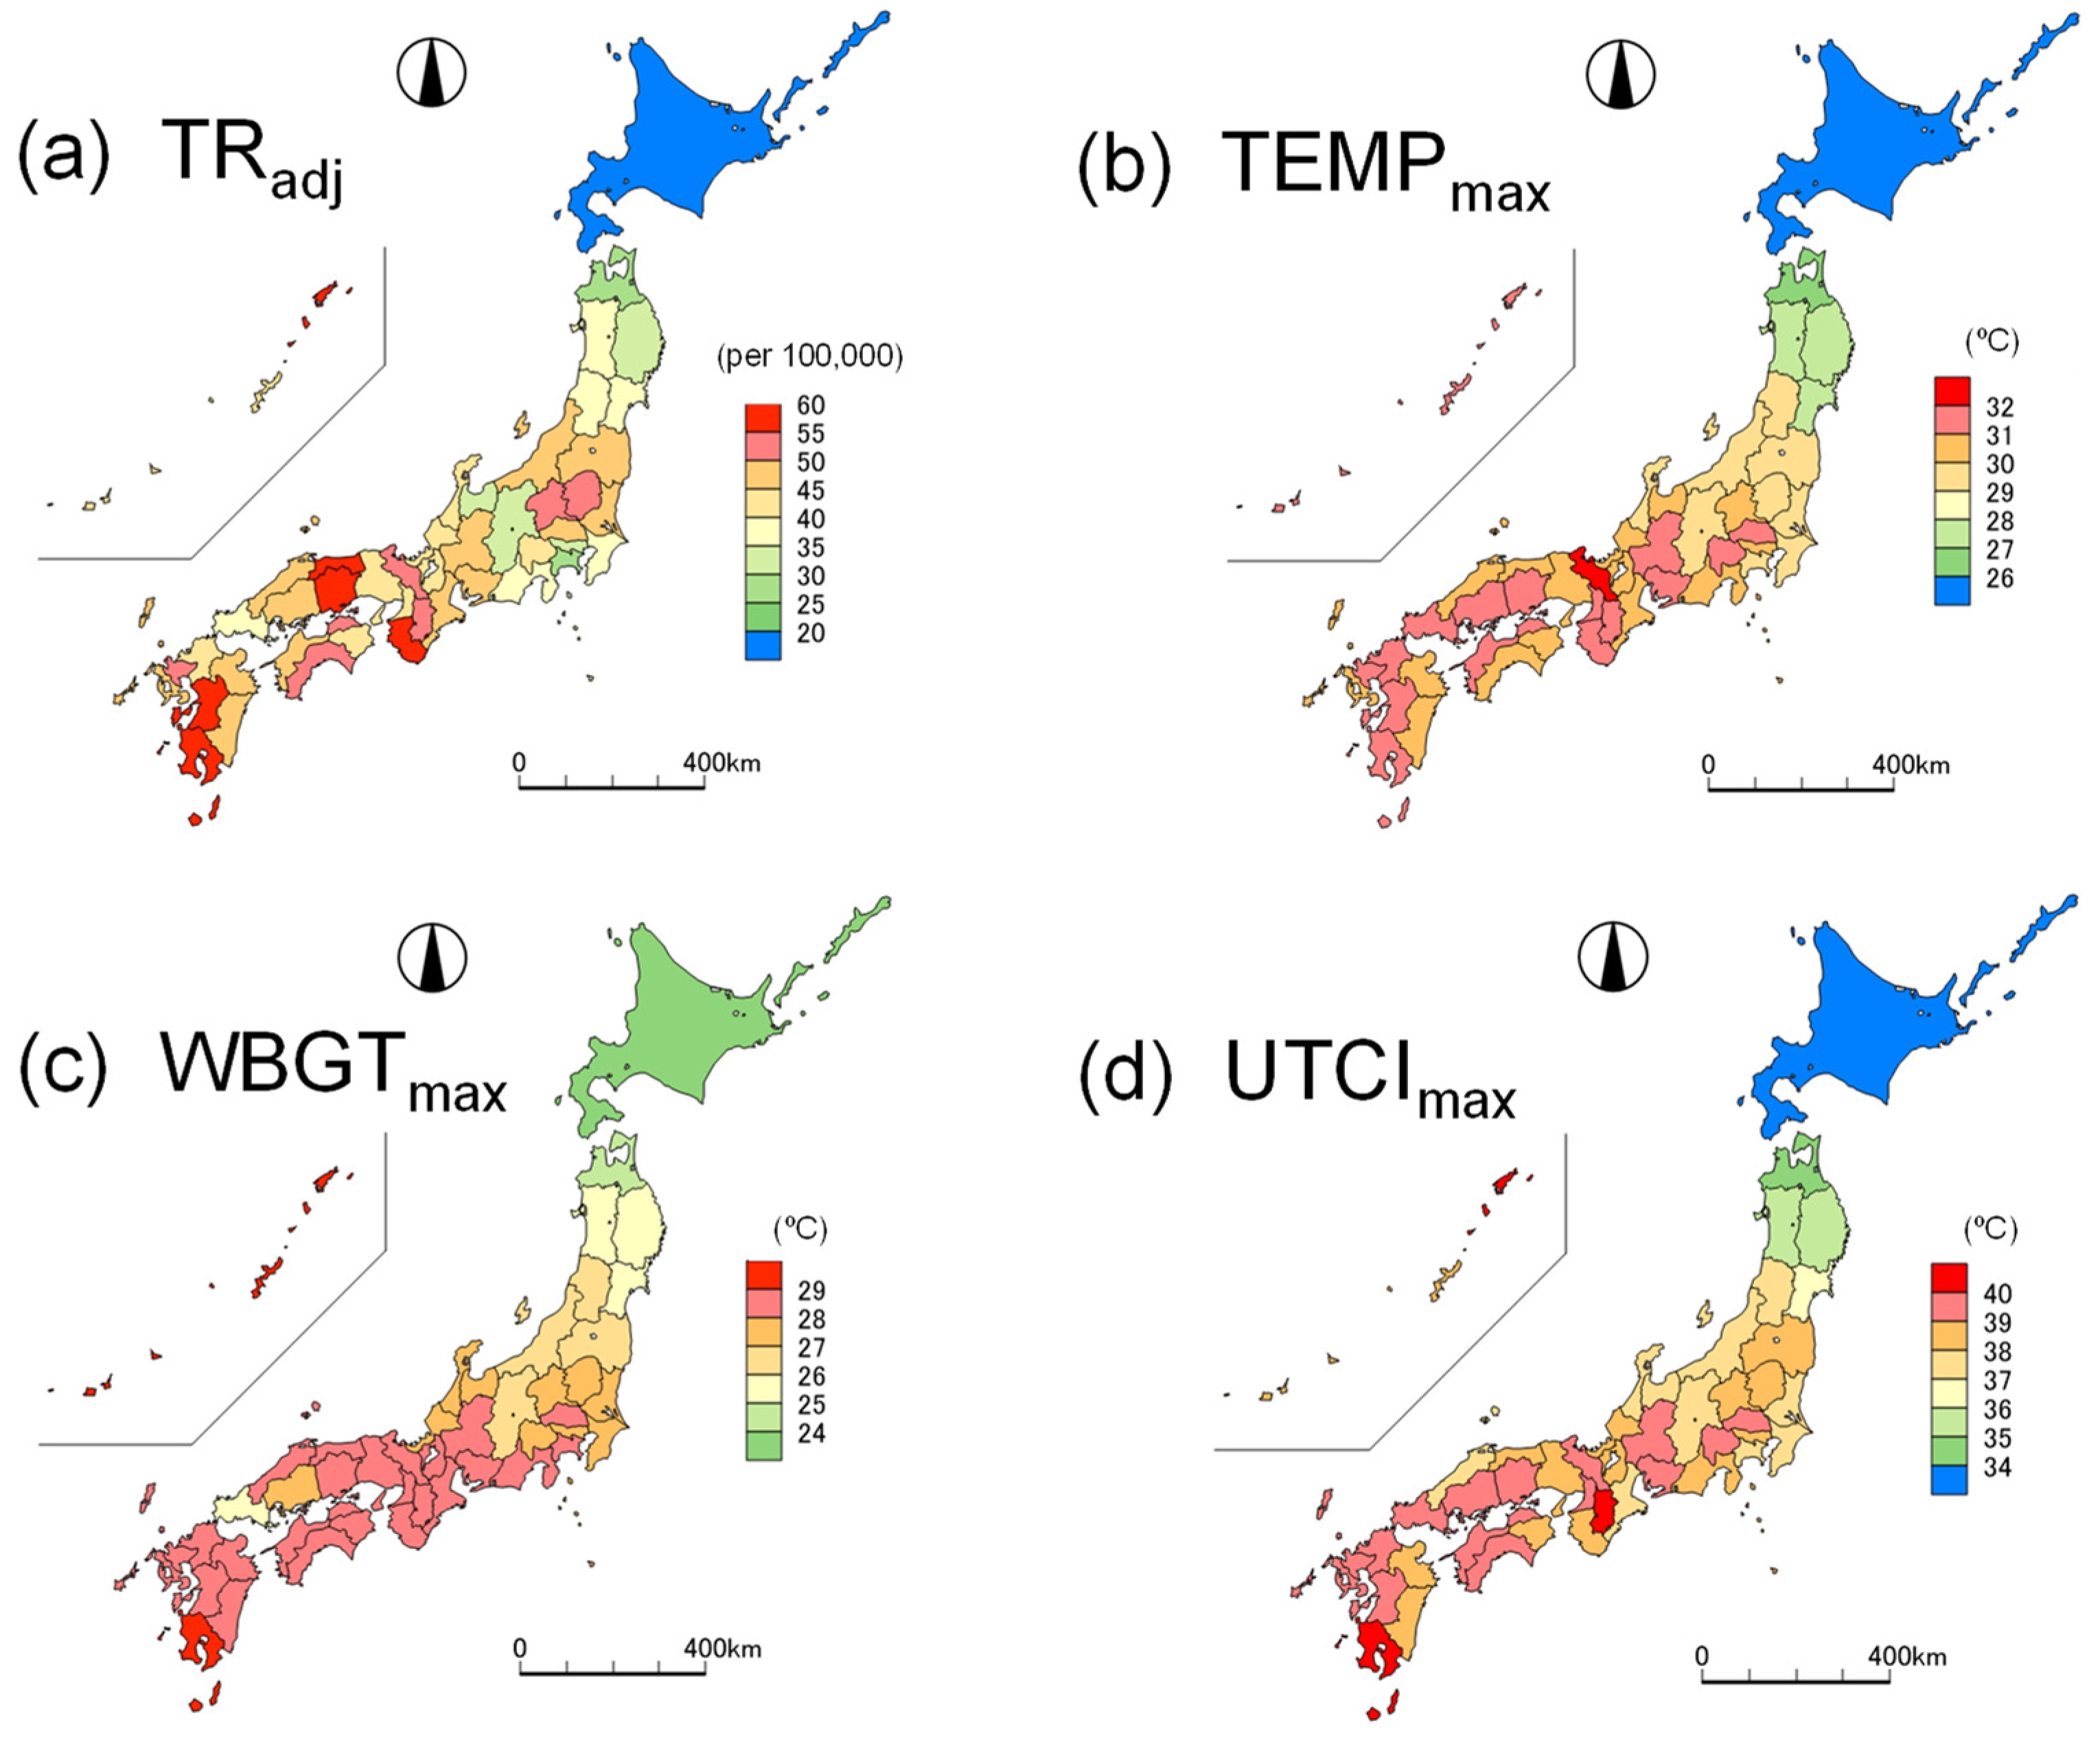
3.1. Decade Distributions in 47-Prefecture Scale

As a preview of the long-term mean appearance, Figure 2 shows the decade-old projections of heatstroke incidence (TRadj) and heat stress indices (TEMPmax, WBGTmax, and UTCImax) aggregated for three months in 47 prefectures. The value of TRadj increased southward or westward in Japan (Figure 2a), with a particularly high incidence in Kyoto (26 in Figure 1) and Wakayama (32) in the Kinki region, Tottori (31) and Okayama (33) in the Chugoku region, and Kumamoto (43) and Kagoshima (46) in the Kyushu region. Eight of the top ten prefectures corresponded to the regions of Kinki and westward. In addition, the values of the three indices were higher southward or westward of Japan (Figure 2b–d). For TEMPmax, WBGTmax, and UTCImax, seven, ten, and eight prefectures among the top ten belonged to the regions of Kinki and westward, with values ranging from 31.5 to 32.1 °C, 28.6 to 30.1 °C, and 39.5 to 40.2 °C, respectively. These ranges in the WBGT and UTCI correspond to ‘very hot or danger’ (28–31 °C) and ‘very strong heat stress’ (38–46 °C), respectively [39,40]. This indicates the significant increase in heatstroke risk in spite of the three-month (July–September) average of the daily maximum value; as the UTCI can be regarded as a ‘feels like’ temperature, residents were exposed to dangerous conditions in the summer climate in many prefectures of western Japan.
Although quantitative relationships between TRadj and the three indices indicated a positive correlation (Figure 3), the third-order regression curve was the best fit for UTCImax. Fujibe et al. [25] also analysed the relationship between TEMPmax (for July and August) and TRadj from 2008 to 2018 and found a positive linear relationship, if Hokkaido (1) and Okinawa (47) were excluded. The UTCImax was strongly correlated with TEMPmax (r = 0.96; p < 0.01). Hence, when discussing heatstroke risk in each prefecture as far as decade averaging feature, TEMPmax can be used as an indicator for year-to-year scales, alternative to WBGTmax and UTCImax. This feature results from the fact that Japanese climatological conditions (without humidity) are significantly characterised by latitude. As mentioned in the introduction, the importance of latitude on the heat stress index has been reported in large continents such as Europe [22]. Notably, the values of heat stress indices depend on latitude even if an island country is distributed in a north–south direction such as Japan.

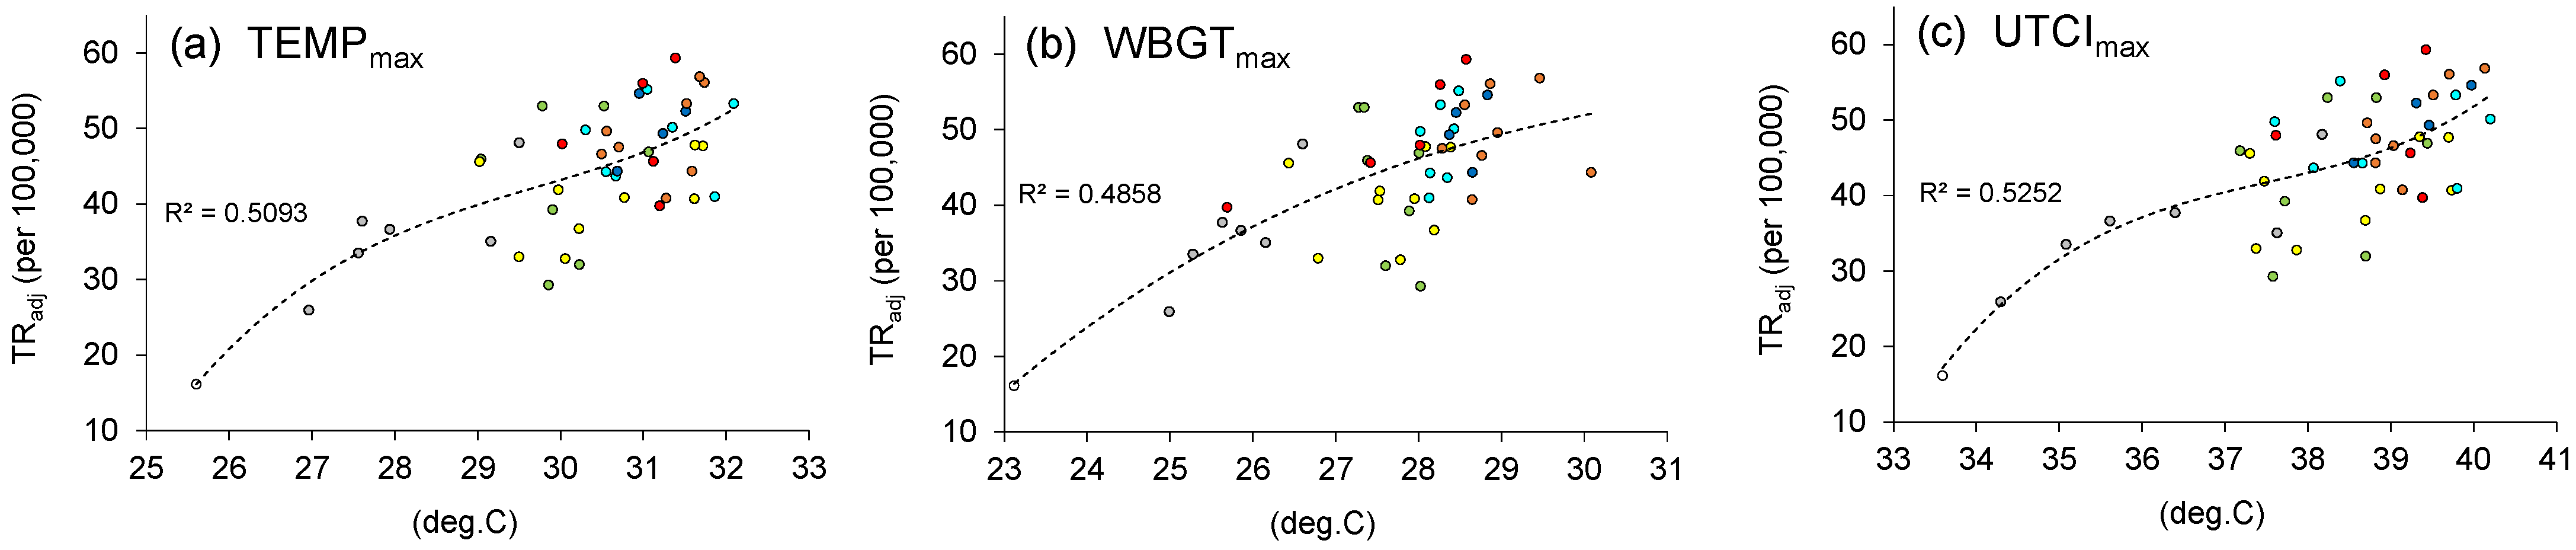
3.2. Vulnerability to Heat Stress Conditions

Here, the monthly heatstroke incidences and heat stress indices every year (i.e., 30 months) were analysed for each prefecture. Figure 4 demonstrates the correspondence between the monthly TRadj and the monthly heat stress indices (here, TEMPmax and UTCImax) for a decade. Each dot in the graph represents a particular month in a particular year. For example, the results for the seven prefectures are shown in this figure: Hokkaido (1), Miyagi (4), Tokyo (13), Aichi (23), Osaka (27), Hiroshima (34), and Fukuoka (40), which have regions in cities that are densely populated. The logarithmic axis for TRadj in the figure and a linear relation of TRadj to heat stress indices (TEMPmax and UTCImax in the figure) indicates that TRadj of a specific prefecture exponentially increases with monthly heat stress index values.
y = a e b x
where x and y are the values of the heat stress index and TRadj, respectively. This feature appeared in all prefectures, with an exponential regression curve having a high coefficient of determination (R2). Hence, the slope of the regression line corresponds to the degree of rapid increase (i.e., heatstroke response) of TRadj to heat stress increase, which is represented by the constant b of the exponential part in Equation (2), characterising the heat stress vulnerability of the prefectural residences; a prefecture with a high value of b suggests that TRadj increases rapidly with an increase in the heat stress index.
In Figure 5, the values of constant b (vulnerability) in Equation (2) for the mapped 47 prefectures are exhibited for TEMPmax, WBGTmax, and UTCImax. Fujibe et al. [12] performed a similar analysis for heatstroke mortality for three roughly divided regions in Japan. The average range of b for 47 prefectures in each figure is indicated in white. For the vulnerability estimated from the TEMPmax (Figure 5a), five prefectures in the top ten corresponded to the regions of Chubu and east or northward, which was different from the result indicated in Figure 2b. Among these prefectures, the three (Hokkaido (1), Akita (5), and Niigata (15)) in northern Japan also showed high vulnerability. Moreover, prefectures with low TEMPmax values averaged over a decade (Figure 2) showed high vulnerability (b). This result suggests a high-temperature vulnerability of prefectural residents living in cool climates to heat wave exposure. The geographical distribution of vulnerability represented by the WBGTmax (Figure 5b) was seemingly different from that of TEMPmax; very high vulnerability was concentrated in the regions of Kinki and westward, which was found in three (Kagawa (37), Ehime (38), and Kochi (39)) of the four prefectures constructing the Shikoku region. However, the UTCImax (Figure 5c) relatively increased the vulnerability in many prefectures of northern Japan more distinctly than the other indices, despite showing a similar trend to TEMPmax as demonstrated in Figure 5a. These results suggest that the vulnerability distributions in 47 prefectures of Japan depend on the type of index applied.

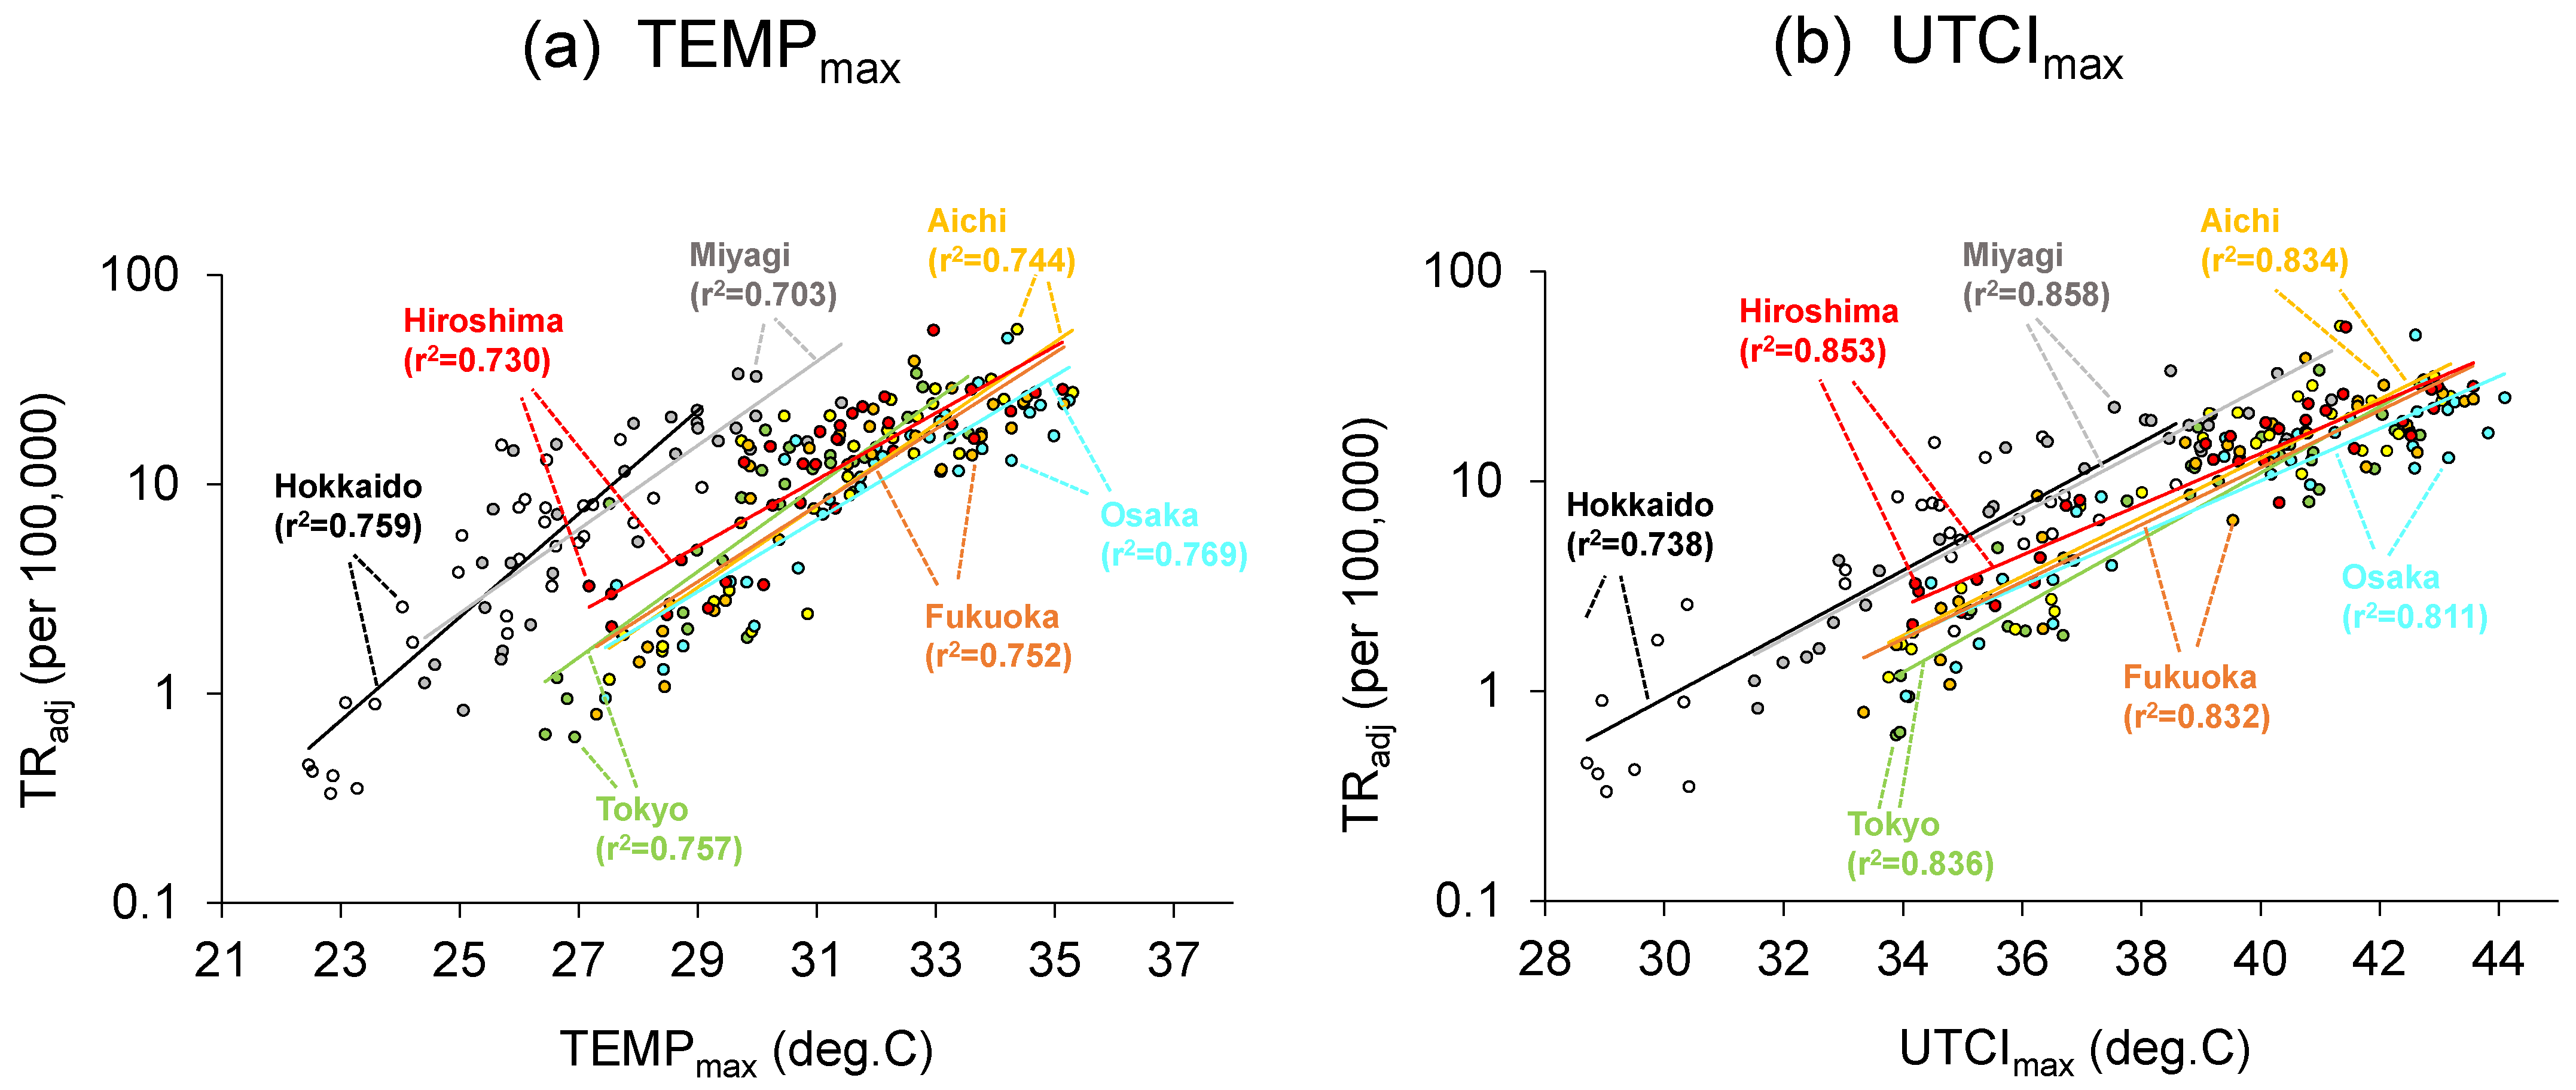
3.3. Heatstroke Risk of Hot to Cool Months

The difference in TRadj between hot and cool months was quantitatively investigated here. This evaluation will provide a perspective of future heatwave encounters and predictions of the heatstroke risk. The heat stress index values recorded in the coolest and hottest months are summarised in Tables S1–S7, which correspond to the lower-left and upper-right plots in a specific prefecture in Figure 4. This study defined the ratio of heatstroke risk during hot to cool months (HRHC) over the last decade in Japan. Thus, the HRHC was calculated by dividing the TRadj recorded in the hottest month by that in the coolest month for each prefecture (Figure 6). Here, UTCImax was chosen as an indicator of ‘cool’ or ‘hot’ because of the importance of comprehensive meteorological exposure to human heat stress [30,31].
Figure 6 reveals a large difference between the coolest and hottest months in all prefectures: the TRadj ranged from 0.23 to 4.29 and 9.65 to 38.42 (per 100,000 people) for the coolest and hottest months, respectively. Consequently, the HRHC ratio was approximately 20–40 in many prefectures but exceeded 100 in a few prefectures. In this analysis, August appeared to be the hottest month of the three months, whereas September was the coolest of the three months in all prefectures, which was influenced by a seasonal climate transition. Extreme climates that occurred over the total 30 months in the decade should be discerned as an outlier by a rare occurrence. Therefore, outliers in each prefecture were detected using a robust Z-score [41,42],
Z = x i x m e d N I Q R
Here, xi and xmed indicate UTCImax or TRadj in the i-th month of 30 months and the median of UTCImax or TRadj for 30 months in a specific prefecture, respectively. The NIRQ in Equation (3) is a normalised interquartile range of UTCImax or TRadj for 30 months. When the outlier of UTCImax or TRadj is assumed as the absolute value of Z greater than 3.0 [43,44], outliers of UTCImax were absent in the prefectures and outliers of TRadj were detected in July 2018 in 13 prefectures. However, these outliers of TRadj did not correspond to the hottest or coolest month of the decade.
The HRHC, shown in Figure 6, is divided into each month from July to September, as shown in Figure 7. In July, the HRHC ratio was approximately 2–4 in many prefectures, which means that the heatstroke risk in the hottest July year was 2–4 times higher than that in the coolest July year. However, the HRHC for Kinki and eastward regions appeared at approximately four, whereas Chugoku and westward regions were comparatively low at approximately two. In August, although the HRHC ratio was 2–4 in many prefectures, those in Kinki and eastward regions were relatively low compared to July, except for three Tohoku prefectures (Aomori (2), Iwate (3), and Miyagi (4)). In contrast, the September HRHC was higher than that in July and August in most prefectures, with an average value of 7.0, and a maximum of 32.4. In particular, high-risk appearances in the Chubu and Shikoku regions were remarkable, accompanied by extreme values in Niigata (15) and Kagawa (37). Thus, the geographical heterogeneity of the September HRHC in Japan tended to be large compared to that of the previous months.
Several studies have reported a significant increase in heatstroke patients in early summer (June to July) in Japan due to heat vulnerability without acclimatisation [11,45]. The result of Figure 7 provides valuable information for children and the elderly, who are especially vulnerable to hot environments. Figure 8 relates the monthly HRHC to the difference in UTCImax, which is summarised by using percentiles for the results of the 47 prefectures (i.e., Figure 7). In July, the monthly difference in UTCImax between the maximum and minimum for a decade was in the same range as August (for 25 and 75 percentiles, 2.7–3.4 °C in July and 2.7–3.8 °C in August, respectively). However, the corresponding HRHC ratio in July was higher than that in August, with the 25 and 75 percentiles of 2.3–3.9 and 2.0–3.2, respectively. This higher HRHC in July can be attributed to the previously mentioned heat vulnerability in early summer. In contrast, the September HRHC was the highest (4.2–7.4 for the 25 and 75 percentiles), as also indicated in Figure 8. The results indicate that the largest difference in September UTCImax between the maximum and minimum (3.0–3.9 °C for the 25 and 75 percentiles) induced the highest HRHC ratio of the three months. This results from the fact that the minimum values (averaged monthly) of UTCImax in July and August corresponded to a level of ‘very strong heat stress’ (38–46 °C) for most months and prefectures, while those in September were included at the level of ‘strong heat stress’ (32–38 °C). In particular, a year encountering the coolest September can be regarded as an autumn-like climate.
From the further analysis of FDMA data [2], Japanese heatstroke patients of 8388, 43,060, and 7085 in July, August, and September were transported in 2020, while in 2019 those of 16,431, 36,755, and 9532 occurred. Despite the pandemic year of COVID-19, the heatstroke patients in August 2020 largely exceeded those prior. Because the public data of weekly floating population [46] indicated a decrease of 16–23% nationwide in August 2020 relative to August 2019, outdoor human activities in Japan were lower in August, 2020. In fact, the heatstroke incidence in 2020 increased in the house (38.6% in 2019 to 43.4% in 2020 of the entire incidence) and decreased in outdoors (12.5 to 9.4%) [47]. This result suggests that indoor activities remain at risk of heatstroke.

4. Conclusions

This study provided a decade-long relationship between summer heatstroke incidence and certain heat stress indices in 47 prefectures of Japan. The results were determined using heatstroke patients transported via ambulance, the daily maximum temperature (TEMPmax), maximum WBGT (WBGTmax), and maximum UTCI (UTCImax) for each prefecture (all 47 prefectures) from July to September of 2010–2019. The main results are summarised by three different analyses.
 
(1)
Analysed results obtained from the decade averaging preview.
The age-adjusted heatstroke incidence rate (TRadj) in a specific prefecture increased with higher heat stress indices, which was induced by the climate characteristics of Japan. For evaluating the long-term average, the TEMPmax was sufficient to represent TRadj instead of the WBGT and UTCI indices that required multiple climatological parameters. This result is probably attributed to the fact that the Japanese climate conditions (without humidity) significantly depend on latitude. Hence, latitudinally distributed countries similar to Japan can choose temperature as the primitive parameter to assess heatstroke risk for long-term mean appearance.
 
(2)
Analysed results obtained from monthly averaging—heat vulnerability.
The response of TRadj to the heat stress indices in each prefecture was defined as resident vulnerability to the heat environment, which depended on the choice of index. TEMPmax and UTCImax detected strong vulnerability in the northern prefectures of Japan. In particular, the UTCImax relatively increased the vulnerability in many prefectures of northern Japan more distinctly than the other indices, despite a similar trend observed in the result of TEMPmax.
 
(3)
Analysed results obtained from monthly averaging—heatstroke risk.
The ratio of TRadj of the hottest to the coolest months for a decade was defined as the HRHC, using the UTCImax. For the three months analysed, the HRHC ratio was approximately 20–40 in many prefectures but exceeded 100 in a few prefectures. Such a large HRHC was induced by seasonal proceedings from July to September. In fact, for the same analysis conducted each month, the HRHC in July and August was approximately 2–4 in many prefectures, whereas in September, the average HRHC for prefectures was 7.0, and a maximum of 32.4 was observed for all prefectures. This difference can be related to the large difference in UTCImax between the maximum and minimum for a decade.
 
This study revealed that the difference in the heat level of yearly summer climate induced the significant difference of heatstroke risk by year and prefecture. The UTCI can also be a useful indicator to evaluate the heatstroke risk in Japan. If social normalcy of human behaviour returns after the COVID-19 pandemic, the future of global warming progresses, and elderly people are vulnerable to the heat increase, the HRHCs will be greater than those of 2010–2019 estimated in this study.

Supplementary Materials

The following are available online at https://www.mdpi.com/article/10.3390/geohazards2040017/s1, Tables S1–S7 are available for supporting information.

Author Contributions

Conceptualization, Y.O. and Y.I.; methodology, Y.O.; formal analysis, Y.I.; data curation, Y.I.; writing—original draft preparation, Y.I. and Y.O.; writing—review and editing, Y.O.; visualization, Y.I and Y.O.; supervision, Y.O.; funding acquisition, Y.O. All authors have read and agreed to the published version of the manuscript.

Funding

This research was funded by the Japan Society for the Promotion of Science, KAKENHI Grant-in-Aid for Scientific Research (B) number 20H03949.

Institutional Review Board Statement

Not applicable.

Informed Consent Statement

Not applicable.

Data Availability Statement

The data presented in this study are available on request from the corresponding author.

Acknowledgments

MANDARA10 (http://ktgis.net/mandara/download/index.html, accessed on 20 September 2021) was used to illustrate the maps.

Conflicts of Interest

The authors declare no conflict of interest.

References

  1. World Health Organization. Ten Threats to Global Health in 2019. Available online: https://www.who.int/news-room/spotlight/ten-threats-to-global-health-in-2019 (accessed on 19 September 2021).
  2. Fire and Disaster Management Agency. Disaster Information. Available online: https://www.fdma.go.jp/disaster/heatstroke/ (accessed on 19 September 2021). (In Japanese)
  3. Nakai, S.; Itoh, T.; Morimoto, T. Deaths from heat-stroke in Japan: 1968–1994. Int. J. Biometeorol. 1999, 43, 124–127. [Google Scholar] [CrossRef]
  4. Makie, T.; Harada, M.; Kinukawa, N.; Toyoshiba, H.; Yamanaka, T.; Nakamura, T.; Sakamoto, M.; Nose, Y. Association of meteorological and day-of-the-week factors with emergency hospital admissions in Fukuoka, Kapan. Int. J. Biometeorol. 2002, 46, 38–41. [Google Scholar] [CrossRef] [PubMed]
  5. Hoshi, A.; Inaba, Y. Meteorological conditions and sports deaths at school in Japan, 1993–1998. Int. J. Biometeorol. 2005, 49, 224–231. [Google Scholar] [CrossRef] [PubMed]
  6. Ooka, R. Recent development of assessment tools for urban climate and heat-island investigation especially based on experiences in Japan. Int. J. Climatol. 2007, 27, 1919–1930. [Google Scholar] [CrossRef]
  7. Fujibe, F. Detection of urban warming in recent temperature trends in Japan. Int. J. Climatol. 2009, 29, 1811–1822. [Google Scholar] [CrossRef]
  8. Ohashi, Y.; Kikegawa, Y.; Ihara, T.; Sugiyama, N. Numerical simulations of outdoor heat stress index and heat disorder risk in the 23 wards of Tokyo. J. Appl. Meteorol. Climatol. 2014, 53, 583–597. [Google Scholar] [CrossRef]
  9. Takaya, A.; Morioka, Y.; Behera, S.K. Role of climate variability in the heatstroke death rates of Kanto region in Japan. Sci. Rep. 2014, 4, 5655. [Google Scholar]
  10. Akatsuka, S.; Uno, T.; Horiuchi, M. The relationship between the heat disorder incidence rate and heat stress indices at Yamanashi Prefecture in Japan. Adv. Meteorol. 2016, 2016, 9492815. [Google Scholar] [CrossRef] [Green Version]
  11. Sato, T.; Kusaka, H.; Hino, H. Quantitative assessment of the contribution of meteorological variables to the prediction of the number of heat stroke patients for Tokyo. SOLA 2020, 16, 104–108. [Google Scholar] [CrossRef]
  12. Fujibe, F.; Matsumoto, J.; Suzuki, H. Spatial and temporal features of heat stroke mortality in Japan and their relation to temperature variations, 1999–2014. Geogr. Rev. Jpn. Ser. B 2018, 91, 17–27. [Google Scholar]
  13. Ministry of the Environment. How Much Heatstroke Is Occurring? Available online: https://www.wbgt.env.go.jp/pdf/envman/1-3.pdf (accessed on 19 September 2021). (In Japanese)
  14. Moran, D.S.; Shapiro, Y.; Epstein, Y.; Matthew, W.; Pandolf, K.B. A modified discomfort index (MDI) as an alternative to the wet bulb globe temperature (WBGT). Environ. Ergon. 1998, 8, 77–80. [Google Scholar]
  15. Jendritzky, G.; Maarouf, A.; Staiger, H. Looking for a Universal Thermal Climate Index UTCI for outdoor applications. In Proceedings of the Windsor-Conference on Thermal Standards, Windsor, UK, 5–8 April 2001; pp. 353–367. [Google Scholar]
  16. Nastos, P.T.; Matzarakis, A. Human-biometeorological effects on sleep disturbances in Athens, Greece: A preliminary evaluation. Indoor Built Environ. 2008, 17, 535–542. [Google Scholar] [CrossRef]
  17. Solymosi, N.; Torma, C.; Kern, A.; Maróti-Agóts, A.; Barcza, Z.; Könyves, L.; Berke, O.; Reiczigel, J. Changing climate in Hungary and trends in the annual number of heat stress days. Int. J. Biometeorol. 2010, 54, 423–431. [Google Scholar] [CrossRef] [PubMed]
  18. Willett, K.M.; Sherwood, S. Exceedance of heat index thresholds for 15 regions under a warming climate using the wet-bulb globe temperature. Int. J. Climatol. 2012, 32, 161–177. [Google Scholar] [CrossRef]
  19. Kershaw, S.E.; Millward, A.A. A spatio-temporal index for heat vulnerability assessment. Environ. Monit. Assess. 2012, 184, 7329–7342. [Google Scholar] [CrossRef]
  20. Giannaros, T.M.; Melas, D.; Matzarakis, A. Evaluation of thermal bioclimate based on observational data and numerical simulations: An application to Greece. Int. J. Biometeorol. 2015, 59, 151–164. [Google Scholar] [CrossRef]
  21. Basarin, B.; Lukic, T.; Matzarakis, A. Quantification and assessment of heat and cold waves in Novi Sad, Northern Serbia. Int. J. Biometeorol. 2016, 60, 139–150. [Google Scholar] [CrossRef]
  22. Napoli, C.D.; Pappenberger, F.; Cloke, H.L. Assessing heat-related health risk in Europe via the universal thermal climate index (UTCI). Int. J. Biometeorol. 2018, 62, 1155–1165. [Google Scholar] [CrossRef] [PubMed] [Green Version]
  23. Tomczyk, A.M.; Bednorz, E.; Matzarakis, A. Human-biometeorological conditions during heat waves in Poland. Int. J. Climatol. 2020, 40, 5043–5055. [Google Scholar] [CrossRef]
  24. Vinogradova, V. Using the Universal Thermal Climate Index (UTCI) for the assessment of bioclimatic conditions in Russia. Int. J. Biometeorol. 2021, 65, 1473–1483. [Google Scholar] [CrossRef] [PubMed]
  25. Fujibe, F.; Matsumoto, J.; Suzuki, H. Regional features and temporal variations of heat-stroke ambulance transport rates in Japan –Comparison with mortality. J. Heat Isl. Inst. Int. 2020, 15, 1–13. (In Japanese) [Google Scholar]
  26. Fire and Disaster Management Agency. Heatstroke Information. Available online: http://www.fdma.go.jp/neuter/topics/fieldList9_2.html (accessed on 19 September 2021). (In Japanese)
  27. Yaglou, C.P.; Minard, C.D. Control of heat casualties at military training centers. AMA Arch. Indust. Health 1957, 16, 302–316. [Google Scholar]
  28. Jendritzky, G.; Maarouf, A.; Fiala, D.; Staiger, H. An update on the development of a Universal Thermal Climate Index. In Proceedings of the 15th Conference on Biometeorological Aerobiology and 16th ICB02, American Meteorological Society, Kansas City, MO, USA, 27 October–1 November 2002; pp. 129–133. [Google Scholar]
  29. Błażejczyk, K.; Jendritzky, G.; Bröde, P.; Fiala, D.; Havenith, G.; Epstein, Y.; Psikuta, A.; Kampmann, B. An introduction to the universal thermal climate index (UTCI). Geog. Pol. 2013, 86, 5–10. [Google Scholar] [CrossRef] [Green Version]
  30. Jendritzky, G.; Höppe, P. The UTCI and the ISB. Int. J. Biometeorol. 2017, 61, S23–S27. [Google Scholar] [CrossRef]
  31. Bröde, P.; Fiala, D.; Błażejczyk, K.; Holmér, I.; Jendritzky, G.; Kampmann, B.; Tinz, B.; Havenith, G. Deriving the operational procedure for the Universal Thermal Climate Index (UTCI). Int. J. Biometeorol. 2012, 56, 481–494. [Google Scholar] [CrossRef] [PubMed] [Green Version]
  32. Budd, G.M. Wet-bulb globe temperature (WBGT)—Its history and its limitations. J. Sci. Med. Sport 2018, 11, 20–32. [Google Scholar] [CrossRef]
  33. Błażejczyk, K.; Kuchcik, M.; Błażejczyk, A.; Milewksi, P.; Szmyd, J. Assessment of urban thermal stress by UTCI—Experimental and modelling studies: An example from Poland. DIE ERDE 2014, 145, 16–33. [Google Scholar]
  34. Provençal, S.; Bergeron, O.; Leduc, R.; Barrette, N. Thermal comfort in Quebec City, Canada: Sensitivity analysis of the UTCI and other popular thermal comfort indices in a mid-latitude continental city. Int. J. Biometeorol. 2016, 60, 591–603. [Google Scholar] [CrossRef]
  35. Hosokawa, Y.; Adams, W.M.; Belval, L.N.; Davis, R.J.; Huggins, R.A.; Jardine, J.F.; Katch, R.K.; Streams, R.L.; Casa, D.J. Exertional heat illness incidence and on-site medical team preparedness in warm weather. Int. J. Biometeorol. 2018, 62, 1147–1153. [Google Scholar] [CrossRef] [PubMed]
  36. Zare, S.; Hasheminejad, N.; Shirvan, H.E.; Hemmatjo, R.; Sarebanzadeh, K.; Ahmadi, S. Comparing Universal Thermal Climate Index (UTCI) with selected thermal indices/environmental parameters during 12 months of the year. Weather Clim. Extrem. 2018, 19, 49–57. [Google Scholar] [CrossRef]
  37. The Japan Meteorological Agency. The Past Meteorological Data. Available online: https://www.data.jma.go.jp/obd/stats/etrn/index.php (accessed on 19 September 2021). (In Japanese)
  38. The Ministry of the Environment. Heat Illness Prevention Information. Available online: https://www.wbgt.env.go.jp/wbgt_data.php (accessed on 19 September 2021).
  39. Błażejczyk, K.; Epstein, Y.; Jendritzky, G.; Staiger, H.; Tinz, B. Comparison of UTCI to selected thermal indices. Int. J. Biometeorol. 2012, 56, 515–535. [Google Scholar] [CrossRef] [PubMed] [Green Version]
  40. Zare, S.; Shirvan, H.E.; Hemmatjo, R.; Nadri, F.; Jahani, Y.; Jamshidzadeh, K.; Paydar, P. A comparison of the correlation between heat stress indices (UTCI, WBGT, WBDT, TSI) and physiological parameters of workers in Iran. Weather Clim. Extrem. 2019, 26, 100213. [Google Scholar] [CrossRef]
  41. Agresti, A.; Finlay, B. Statistical Methods for the Social Sciences, 4th ed.; Pearson-Prentice Hall: Upper Saddle River, NJ, USA, 2009. [Google Scholar]
  42. Huynh, H.; Meyer, P. Use of robust z in detecting unstable items in item response theory models. Pract. Assess. Res. Eval. 2010, 15, 2. [Google Scholar]
  43. Puwastien, P. Issues in the development and use of food composition databases. Public Health Nutr. 2002, 5, 991–999. [Google Scholar] [CrossRef] [PubMed] [Green Version]
  44. Tripathy, S.S.; Saxena, R.K.; Gupta, P.K. Comparison of statistical methods for outlier detection in proficiency testing data on analysis of lead in aqueous solution. Am. J. Theor. Appl. Stat. 2013, 2, 233–242. [Google Scholar] [CrossRef]
  45. Ono, M. Heat stroke and the thermal environment. Jpn. Med. Assoc. J. 2013, 56, 199–205. [Google Scholar]
  46. V-RESAS, Agoop Corp. Visualisation of the Influence of COVID-19 on Regional Economy. Available online: https://v-resas.go.jp/#population (accessed on 19 September 2021). (In Japanese)
  47. Ministry of Internal Affairs and Communications. Summary Report of Heatstroke Transport in 2020. Available online: https://www.soumu.go.jp/main_content/000713462.pdf (accessed on 19 September 2021). (In Japanese)
Figure 2. Preview maps of (a) TRadj, (b) TEMPmax, (c) WBGTmax, and (d) UTCImax aggregated for the hot season from July to September in 2010–2019. The TRadj averaged the accumulated value for three months per year, while the TEMPmax, WBGTmax, and UTCImax averaged the mean value for the three months per year.
Geohazards 02 00017 g002
Figure 3. Relationship between TRadj and (a) TEMPmax, (b) WBGTmax, and (c) UTCImax in the 47 pre Figure 2. The dashed line indicates a third-order regression curve with a coefficient of determination (R2). Colours in the mark correspond to those of the region shown in Figure 1.
Geohazards 02 00017 g003
Figure 4. Relationship between TRadj and (a) TEMPmax and (b) UTCImax for the hot season from July to September in 2010–2019. Seven prefectures here have cities with million population in each region. The TRadj is a monthly value for each year, while the TEMPmax, WBGTmax, and UTCImax are the monthly averaged value for each month in each year. TRadj is represented as a logarithmic axis. The solid line indicates a regression line with a coefficient of determination (R2).
Geohazards 02 00017 g004
Figure 5. 47 prefecture maps of constant b (vulnerability) in Equation (2), obtained from using (a) TEMPmax, (b) WBGTmax, and (c) UTCImax, with result for the hot season from July to September in 2010–2019. The maximum, average, and minimum b values of the 47 prefectures are also listed in the bottom of map.
Geohazards 02 00017 g005
Figure 6. Respective TRadj (bars) in the maximum and minimum months of UTCImax and its ratio (HRHC; line with circles) of the maximum to minimum in the 47 prefectures, with result for the hot season from July to September in 2010–2019.
Geohazards 02 00017 g006
Figure 7. Monthly ratio in TRadj of the maximum UTCImax to the minimum (HRHC), which is divided by each month for Figure 6, with result for 2010–2019 in the 47 prefectures. The maximum, average, and minimum HRHC of the 47 prefectures are also listed in the upper portion of the graph.
Geohazards 02 00017 g007
Figure 8. Relationship between the monthly ratio in TRadj of the maximum UTCImax to the minimum (HRHC) and the monthly difference in UTCImax between the maximum and minimum in the decade. The 25, 50, and 75 percentiles (numerals) for results in the 47 prefectures are depicted for each month.
Geohazards 02 00017 g008
Publisher’s Note: MDPI stays neutral with regard to jurisdictional claims in published maps and institutional affiliations.

