Article

Soil Fertility and Carbon Stock Variability for Defining Management Zones in Tropical Agricultural Systems

by
Paulo Daniel Filho
* and
Eduardo Barretto de Figueiredo
Department of Rural Development, Centro do Ciências Agrárias, Federal University of São Carlos (UFSCar), Rodovia Anhanguera, km 174, P.O. Box 153, Araras 13600-970, Brazil
*
Author to whom correspondence should be addressed.
AgriEngineering 2025, 7(9), 308; https://doi.org/10.3390/agriengineering7090308
Submission received: 18 August 2025 / Revised: 8 September 2025 / Accepted: 18 September 2025 / Published: 22 September 2025

Abstract

The definition of management zones is an essential strategy for optimizing agricultural productivity, enabling the efficient use of inputs and the minimization of environmental impacts. This study aims to identify and classify management zones in a cultivated area, considering spatial variations in soil fertility and carbon content. The methodology employed includes the analysis of spatial data through geotechnologies, combined with fuzzy logic for categorizing areas into management classes. The results indicate that lower-quality regions present distinct edaphic characteristics, being mostly composed of dystrophic Red-Yellow Argisol, which negatively affects productivity due to lower water retention capacity and poor fertility. In addition, a correlation between soil carbon content and fertility was identified, showing that areas with lower carbon stocks tend to be less productive. The application of these techniques allowed for a more precise approach to agricultural management, promoting sustainable practices that enhance productive efficiency and reduce environmental degradation.

1. Introduction

Climate change is one of the main environmental challenges of the 21st century, driven primarily by anthropogenic activities such as the burning of fossil fuels, deforestation, and conventional agricultural practices. According to the Sixth Assessment Report of the Intergovernmental Panel on Climate Change [1], the global average temperature has already increased by 1.1 °C compared to pre-industrial levels, intensifying extreme weather events and compromising food security, biodiversity, and socioeconomic stability. In this context, sustainable agricultural practices are increasingly recognized as key strategies for mitigating greenhouse gas (GHG) emissions, restoring degraded soils, and increasing the resilience of production systems.
Brazilian conventional agriculture, particularly in tropical regions, has played a significant role in GHG emissions due to intensive soil use and degradation of organic matter. In response, alternatives such as low-carbon agriculture and precision agriculture have gained ground for offering efficient management strategies that combine productivity with sustainability [2]. Among these approaches, the delineation of management zones stands out. These are defined as areas with similar edaphic attributes, allowing for localized input application and rational planning of agricultural practices.
Precision agriculture relies on technologies such as remote sensors, geographic information systems (GIS), drones, and spatial analysis to understand and manage intra-field variability. These tools enable detailed collection and interpretation of spatial data, supporting more accurate and environmentally responsible agronomic decisions [3]. Classification methods based on fuzzy logic have proven particularly effective in delineating management zones, as they allow for gradual analysis of continuous variables such as soil fertility and carbon stock [4,5].
In tropical soils, spatial variability of fertility and organic carbon is a critical limiting factor that directly influences productivity potential. Dystrophic Red-Yellow Argisols, predominant in pasture and eucalyptus monoculture regions in Central Brazil, have unfavorable chemical and physical characteristics, such as high acidity and low water retention. These factors justify the adoption of differentiated and integrated management practices focused on preserving soil quality and maximizing productivity.
Given this context, the present study aims to delineate management zones based on soil fertility and carbon stock in four different land use systems located in the state of Goiás, Brazil: Pasture 1 (P1), Pasture 2 (P2), Livestock-Forestry Integration (IPF), and Eucalyptus Monoculture (Silviculture—EM). For this purpose, the study evaluates physical and chemical properties of the soil in these areas, aiming to recommend appropriate management practices for each identified zone and assess the correlation between fertility and carbon stock. The goal is to integrate geotechnology and spatial modeling tools with knowledge from soil science and agronomy, contributing to more efficient input use and the sustainability of tropical agricultural systems.

2. Materials and Methods

2.1. Study Area Characterization

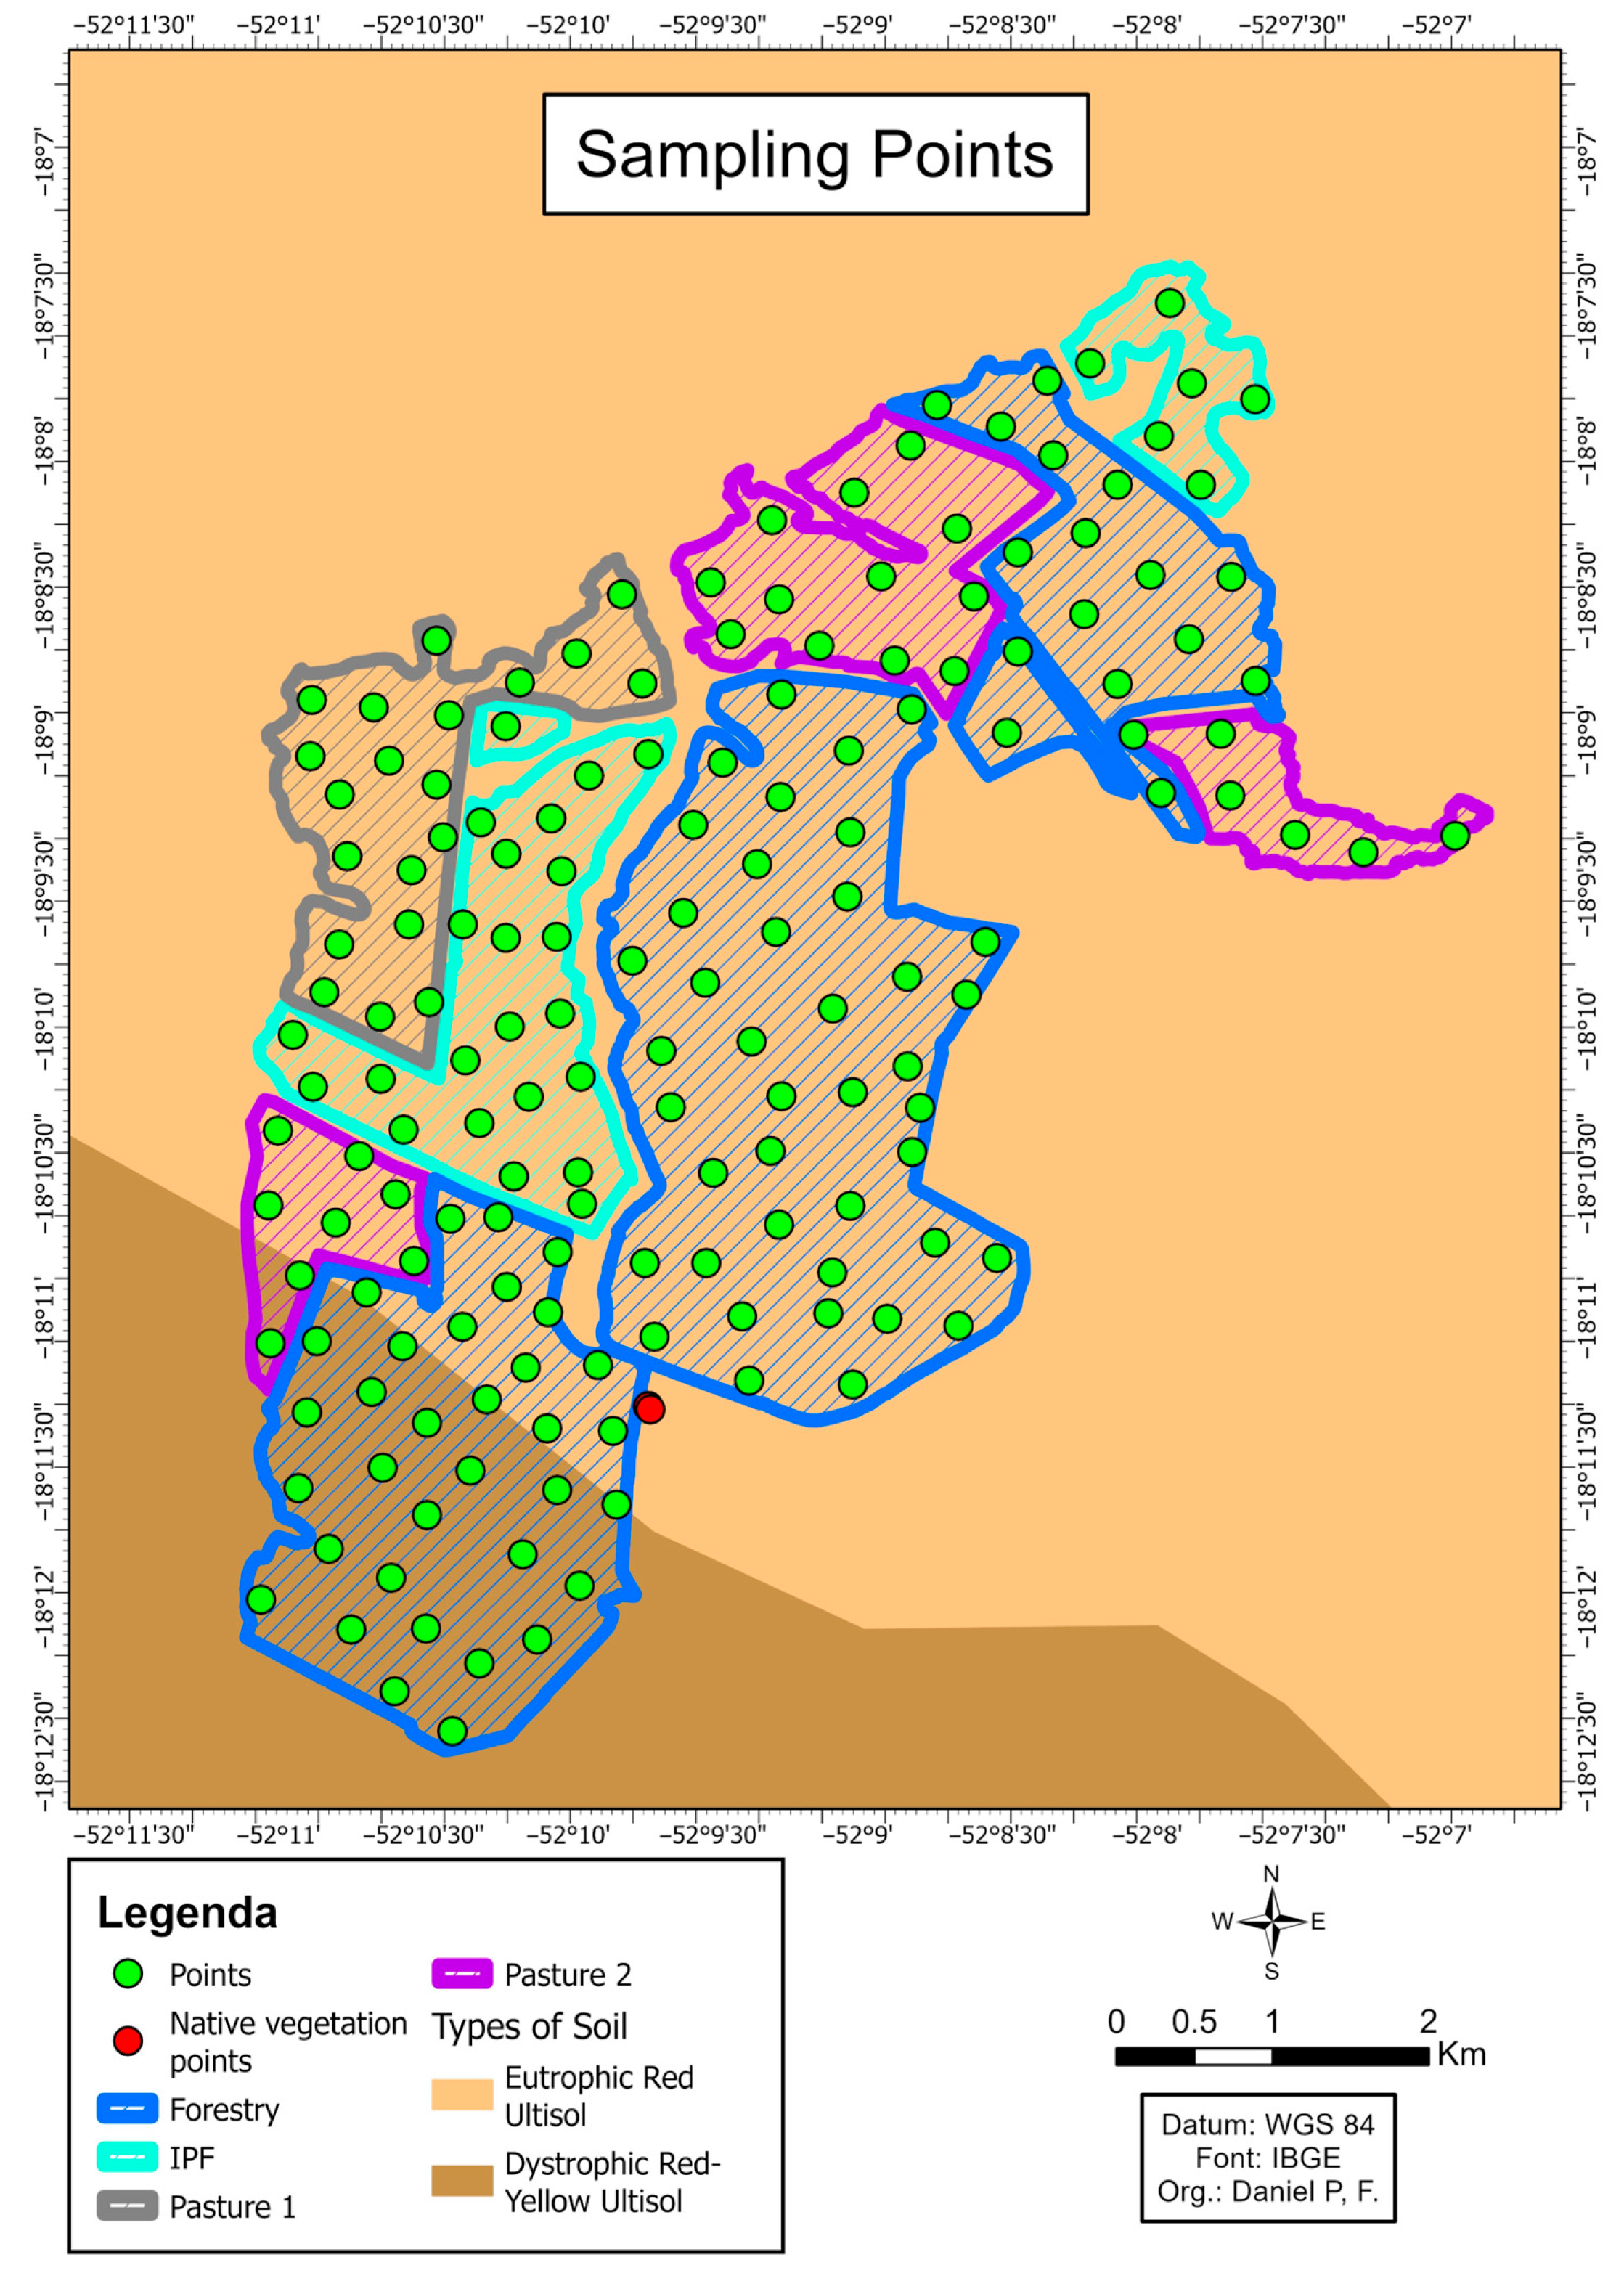
This study was conducted on a farm located in the municipality of Serranópolis, in the state of Goiás, Brazil, covering a total area of 2972.42 hectares, at the coordinates −18°09′10.14″ latitude and −52°09′03.96″ longitude (Figure 1). The area was selected due to its heterogeneity and the diversity of land use and soil management systems, which allow for an in-depth comparative analysis of the effects of these practices on soil chemical attributes and carbon stocks.
Located within the Cerrado biome, the region features a tropical seasonal climate with well-defined dry and rainy seasons and vegetation ranging from open grasslands to dense forests [6]. The soils of the Cerrado are mostly acidic and naturally low in nutrients, requiring agronomic corrections such as liming and fertilization to ensure productive viability [7].
In the study area, two predominant soil classes were identified: Eutrophic Red Argisol and Dystrophic Red-Yellow Argisol (Figure 2). The former has higher natural fertility, favorable physical structure, and responds well to conservation practices [8]. The latter is characterized by high acidity, low base saturation, and greater susceptibility to leaching, requiring intensive and technically adjusted management [8].
These edaphic distinctions justify the adoption of differentiated agricultural management strategies, reinforcing the need for integrated approaches that simultaneously consider the physical, chemical, and biological aspects of the soil to promote sustainable and resilient production systems [9].

2.1.1. Description of the Evaluated Production Systems

The study area is subdivided into four representative land use and management systems. This segmentation enabled a detailed comparative analysis of the impacts of these systems on both soil fertility and soil carbon stocks.
The Livestock-Forestry Integration system (IPF) covers 419.52 hectares (14% of the total area) and combines Urochloa decumbens with eucalyptus plantations (clone VM01, Eucalyptus urophylla × E. camaldulensis), aiming to promote synergies between conservation and productivity. This consortium favors shading, erosion control, and organic matter accumulation in the soil, optimizing land use.
Pasture 1 (P1), with 305.25 hectares (10%), represents a traditional monoculture system, also based on Urochloa decumbens, known for its high resistance to trampling and adaptability to low-fertility soils, which justifies its use in extensive management environments.
In contrast, Pasture 2 (P2) covers 454.02 hectares (16%) and adopts a more complex model, combining three grasses: Urochloa brizantha MG5, Panicum maximum ‘Massai’, and Urochloa decumbens ‘Basilisk’. This approach aims to enhance functional diversity, promote nutrient cycling, and improve soil resilience to climate variability.
The Monoculture Silviculture system (EM), with 1751.85 hectares (60% of the area), is composed of eucalyptus hybrids (VM01, I144, GG100/I1224, I144/GG100) and Corymbia citriodora, prioritizing high wood productivity. Despite its production efficiency, this monocultural system imposes limitations on biodiversity maintenance and the sustainability of edaphic attributes.
All systems were mapped through precise georeferencing, allowing for high-resolution spatial analyses (Figure 2). The selection of plant species was based on criteria of local adaptability and productive performance, with emphasis on genetic diversity as a mechanism to enhance ecological resilience, carbon sequestration, and the sustainability of managed agroecosystems.

2.1.2. Definition of Sampling Points

The sampling methodology adopted was based on spatial analysis conducted with the aid of geotechnologies, using Geographic Information Systems (GIS) and remote sensing. This approach enabled the construction of a representative shapefile of the study area (2972 ha), which served as the basis for the systematic and random definition of 170 sampling points, with 166 located in agricultural areas and 4 in native vegetation areas (Figure 2).
Samples were collected up to a depth of 60 cm, stratified into five layers: 0–10 cm, 10–20 cm, 20–30 cm, 30–40 cm, and 40–60 cm. For physical-chemical and carbon analyses, emphasis was placed on the surface layer (0–20 cm), recognized for its relevance in organic carbon accumulation and nutrient cycling processes. At each sampling point, approximately 300 g of soil were collected—an amount suitable for subsequent laboratory procedures.
Laboratory analyses were conducted by Agrorobótica (São Carlos, SP, Brazil), a company specialized in Laser-Induced Breakdown Spectroscopy (LIBS) associated with artificial intelligence algorithms. The partnership with EMBRAPA reinforces the methodological innovation of the study, integrating applied science with high-precision soil analysis.
In total, 996 disturbed samples were processed: 166 for soil fertility analysis and 830 for carbon quantification, in addition to 20 samples from native vegetation (forest). Furthermore, 680 undisturbed samples were obtained to determine soil bulk density, 664 from cultivated areas and 16 from native areas.
Disturbed samples were dried and sieved (2 mm mesh) prior to analysis. Undisturbed samples were collected using stainless steel rings of 91 cm3 (4.8 cm internal diameter and 5.0 cm height), ensuring the preservation of the soil’s physical characteristics.
Carbon stock was determined using the standardized equation:
Cstock = OC × Dsoil × E/10
where:
  • Cstock: soil carbon stock (Mg ha−1),
  • OC: soil organic carbon content (g kg−1),
  • Dsoil soil bulk density (kg dm−3),
  • E: layer thickness (cm).
Although widely used, this method presents limitations as it assumes a fixed depth for different soil conditions, which may lead to distortions in areas with varying degrees of compaction [10].
To overcome these limitations, the calculation of equivalent soil mass was adopted based on data from native vegetation (reference area), disregarding the absolute values of cultivated areas, which show significant compaction [11].
The formula for calculating soil mass is:
Msoil = Ds × L × 10.000 m2 ha−1
where:
  • Msoil: soil mass per hectare (Mg ha−1),
  • Ds: soil bulk density (Mg m−3),
  • L: thickness of the evaluated layer (m).
This methodological adjustment is aligned with the recommendations of the PECUS network (Sustainable Livestock) protocol and aims to ensure comparability between systems by using bulk density values under native vegetation as the reference for all carbon stock calculations.

2.2. Soil Sample Preparation and LIBS Analysis

2.2.1. Soil Collection

The multielemental characterization of the soil was performed using Laser-Induced Breakdown Spectroscopy (LIBS), a technique applied both to chemical fertility analysis and organic carbon quantification. The instrumental system used included a pulsed Nd:YAG laser (1064 nm, 20 mJ per pulse, 10 Hz), coupled with a high-resolution spectrometer (0.1 nm) covering a spectral range from 180 to 950 nm, and a CCD detector sensitive to the radiation emitted by the plasma.
The methodology is based on the generation of surface microplasmas by the incidence of laser pulses, which promote the electronic excitation of the elements present in the soil matrix. The subsequent spectral emission—specific to each element—is captured and processed for identification and quantification purposes. For each sample, three sequential shots were performed: the first to remove surface impurities, and the next two to collect spectral data.
To minimize the effects of the soil’s intrinsic physical-chemical heterogeneity, each pellet was subjected to approximately 60 measurements distributed across different points of its surface. The analyses were carried out under standard environmental conditions, with no need for a controlled atmosphere, which enables the large-scale applicability of the technique. This strategy ensured high reproducibility and precision in the analyses, providing robustness to the spectral quantification of soil fertility attributes and carbon stock.

2.2.2. Soil Sample Preparation for LIBS Analysis

Sample preparation followed strict protocols to ensure reproducibility and minimize analytical artifacts. The steps included: air-drying under cover in a ventilated environment for 48 h until constant mass was achieved; grinding and homogenization using an automated mill, reducing the material to particles smaller than 2 mm in diameter; manual removal of visible organic residues; and the production of pressed pellets, with standardized parameters for mass, diameter, and thickness to ensure physical and mechanical consistency among samples.

2.3. Reference Method for the LIBS System

To validate the data obtained by LIBS, total organic carbon content was determined by elemental analysis using dry combustion with the CHNS/O Perkin Elmer 2400 Series II system, following standardized procedures established by Embrapa Instrumentation. This approach serves as the reference method for the quantitative calibration of LIBS spectra.
Additionally, soil physical properties were determined through particle size analysis using the pipette method, allowing for textural classification according to Embrapa criteria [11]. The samples were classified into the following textural classes: sandy, silty, medium, clayey, and very clayey. The results showed variations in sand: 635 to 919 g kg−1, clay: 9 to 360 g kg−1, and carbon content: 3.5 to 50 g kg−1.

2.4. Evaluated Soil Fertility Parameters

Five parameters were selected for the integrated analysis of soil fertility and quality across the 2972 hectares of the study area, based on their agronomic and environmental relevance. Soil pH was considered due to its direct influence on nutrient availability and microbial activity; it can reduce nutrient efficiency and increase toxicity from aluminum and manganese. Phosphorus (P), although essential, exhibits high fixation in tropical soils, requiring continuous monitoring for efficient fertilization management. Cation exchange capacity (CEC) was used as an indicator of the soil’s ability to retain and supply cations, reflecting its chemical stability, especially in clayey soils. Base saturation (V%), which expresses the proportion of basic cations in relation to total CEC, promotes better root development and nutrient uptake. Additionally, soil carbon stock (Cstock) was included as a key parameter due to its importance in both fertility and agro-environmental sustainability, as it reflects the soil matrix’s carbon sequestration capacity.
To enable spatial analysis and facilitate applied interpretation of the data, the values obtained were reclassified into five equally divided ranges, following the example methodology of Raij [12]. This standardization allowed for the construction of thematic maps representing the spatial distribution of fertility and carbon stocks in the agricultural landscape under study.

2.5. Development of Soil Fertility and Soil Carbon Stock Maps

All spatial processing steps were carried out using QGIS 3.34, selected for its ability to integrate analytical modules, ensure workflow reproducibility, and efficiently perform interpolation, fuzzy analysis, and vectorization routines.
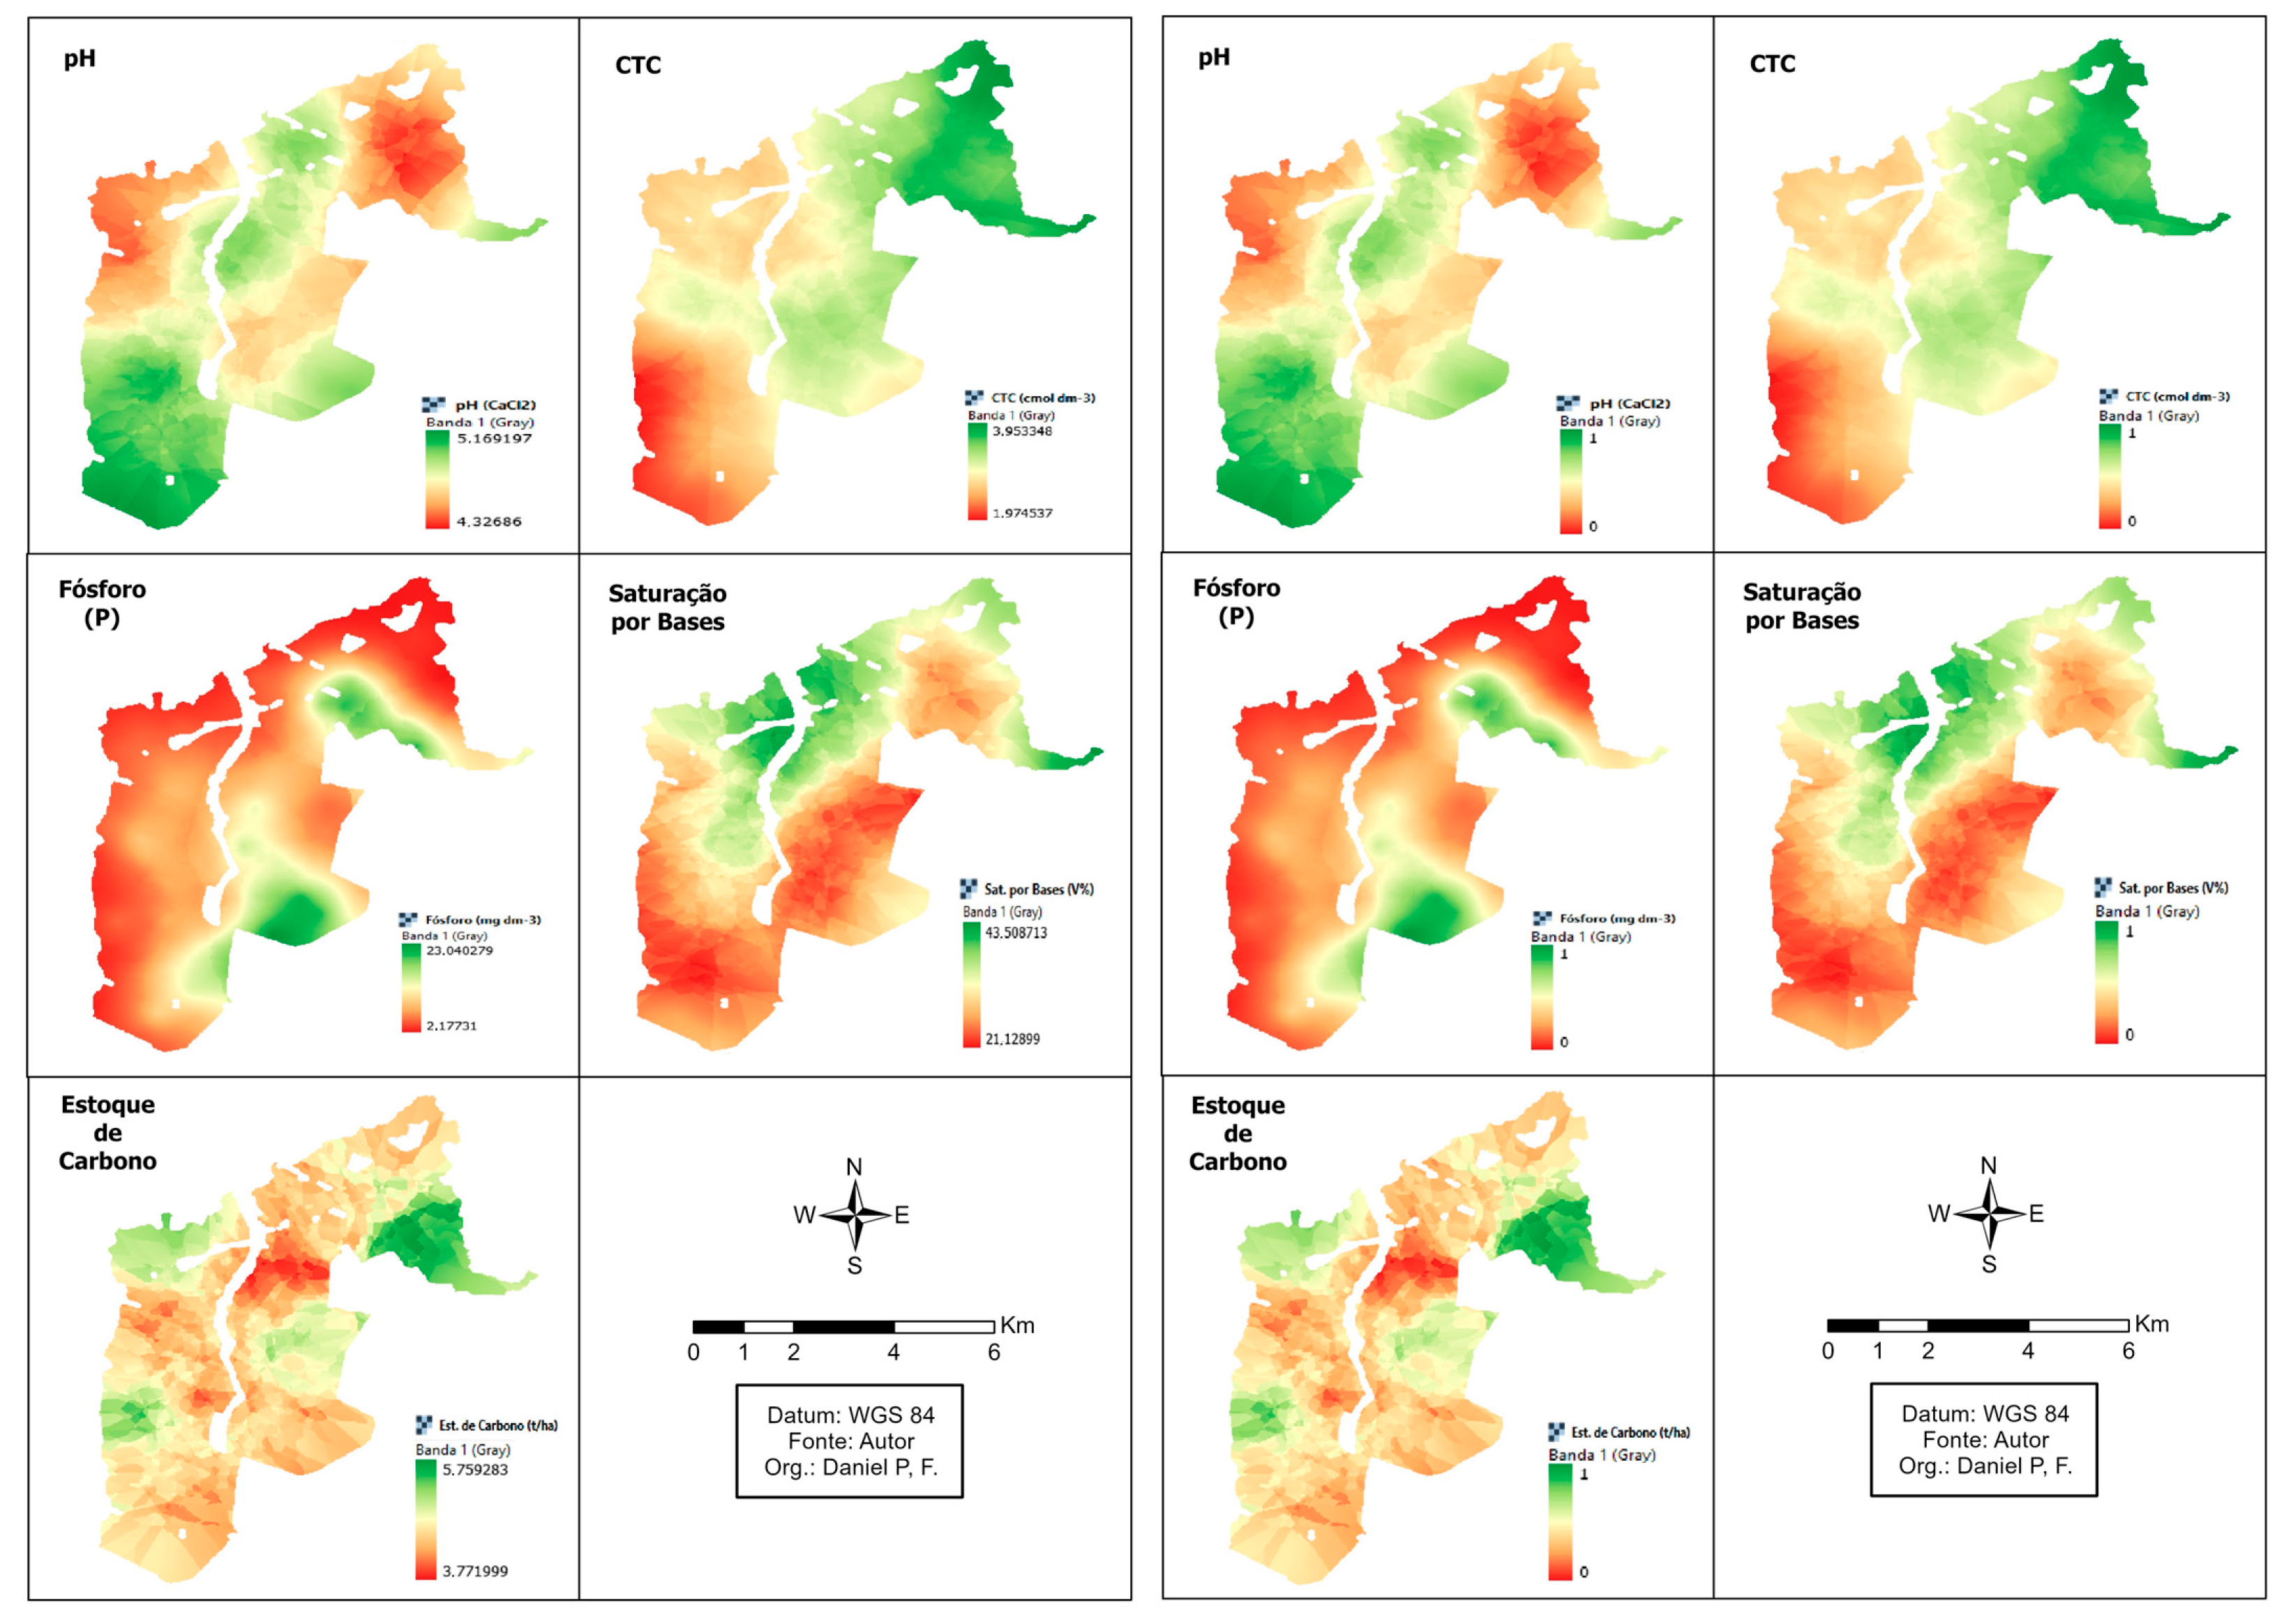
The maps of soil pH, phosphorus (P), cation exchange capacity (CEC), base saturation (V%), and soil carbon stock (Cstock) were generated through Ordinary Kriging, using a spherical variogram model adjusted and implemented with the Smart-Map plugin. For the fuzzy normalization process, a linear membership function was chosen instead of Gaussian or sigmoidal functions. This decision was based on its simplicity of application and its ability to provide a direct correspondence between observed values and membership degrees, which proved particularly suitable for representing the gradual spatial variation of soil attributes without introducing additional curvature that could distort result interpretation.
It is important to emphasize that all sampling points were included in the interpolation process, with no exclusion of outliers or any other type of filtering. This approach was intended to preserve the natural variability of the soil, ensuring that the analyses accurately reflected the real conditions of the study area.

2.5.1. Application of Fuzzy Logic to Interpolated Soil Fertility and Soil Carbon Stock Maps

The normalization of the values from the generated maps was performed using fuzzy logic, with the goal of transforming the different attribute scales into a common scale from 0 to 1. This step was carried out using the Raster Fuzzify (linear membership) tool within the QGIS environment.
The adopted linear fuzzy function is defined by two parameters: the lower limit (value 0) and the upper limit (value 1). The minimum and maximum values observed in each interpolated map (pH, CEC, P, V%, Cstock) were set as the limits for modeling the fuzzy sets. This process allowed for the construction of increasing or decreasing membership functions according to the distribution of each variable.

2.5.2. Overlay of Soil Fertility Maps

From the interpolated and normalized (fuzzy) maps, the integration of attributes related to soil fertility (pH, P, CEC, and V%) was performed using the Raster Calculator tool. This overlay resulted in a single soil fertility map.
According to Filipini [13], this type of multivariate integration is essential to reveal emerging spatial patterns, often imperceptible when parameters are analyzed in isolation. The resulting fertility map was again processed using fuzzy logic to ensure coherence in the final interpretation.

2.5.3. Creating Management Zones Through Reclassification of Soil Fertility and Soil Carbon Stock Maps

The overlaid soil fertility map and the soil carbon stock map were subjected to a reclassification process into five equivalent management zones. As a methodological reference, the classification model proposed by Raij [12] was considered, which organizes soil attributes into five fertility classes. However, in this study, the reclassification did not follow Raij [12] specific thresholds but instead adopted a division into five equal-width classes, categorizing the normalized continuous values (0 to 1) into: very low, low, medium, high, and very high (Table 1). This approach was chosen to preserve all variations observed in the data and to ensure that no classification range was excluded, thereby maintaining the full representativeness of the analyzed attributes.

2.5.4. Conversion of Raster Maps to Vectors (Polygons)

For more refined quantitative analyses and compatibility with agricultural planning systems, the reclassified maps were converted into polygon vector format using the “Raster to Vector (polygonize)” tool. This transformation enabled precise quantification of areas by class (in hectares), generation of percentage statistics of the spatial distribution of attributes, and intersection with other geographic layers, such as land use, topography, and property boundaries. As discussed by Filipini [13], vectorizing the maps allows for advanced spatial analyses and greater applicability in real-world land management scenarios.

2.6. Analysis Method for Soil Fertility and Soil Carbon Stock Maps

This project adopted an approach aimed at creating a composite data map based on the analysis of four soil fertility elements (pH, Phosphorus, CEC, and Base Saturation). The objective was to observe the correlation between soil fertility levels and soil carbon stock concentrations.
The analyses were conducted using the overlay map of soil fertility and a map representing the soil carbon stock of the study area. This enabled a direct evaluation of the correlation between soil fertility levels and soil carbon stock, providing a more comprehensive understanding of the relationship between these factors and supporting informed decision-making in environmental and sustainable agriculture projects.

2.7. Statistical Analyses

Pearson Correlation

The Pearson correlation was applied to assess the linear relationship between soil fertility and soil carbon stock across four land uses (IPF, Forestry, Monoculture Pasture P1, and Polyculture Pasture P2). This method, suitable for continuous data with an approximately normal distribution, quantifies the strength and direction of the linear association, with values ranging from −1 (perfect negative correlation) to 1 (perfect positive correlation), and values close to zero indicating a weak or nonexistent correlation [14].
Statistical significance was verified using the p-value, with results below 0.05 considered significant, although correlation does not imply causation. Data from 166 sampling points were analyzed, correlating values from the fertility and carbon stock maps for each land use, providing an initial overview of possible associations and supporting more detailed studies [15].

3. Results

3.1. Analysis of Soil Chemical Properties for Different Uses and Managements

The analysis of the means of soil chemical and physical properties (pH, base saturation [V%], phosphorus [P], cation exchange capacity [CEC], and carbon stock [CS]) across different land uses (P1, P2, IPF, and Eucalyptus) revealed that pH, CEC, and CS show little variation among the systems, indicating stability in these attributes. For pH, the highest mean was observed in P2 (4.95), followed by IPF (4.70) and Silviculture (4.69), while the lowest value was in P1 (4.34). The difference between the extreme values was only 0.61, highlighting uniformity in soil acidity among the analyzed uses.
Phosphorus content showed more pronounced variation among the land uses. The lowest mean was in P1 (4.11 mg dm−3) and the highest in Silviculture (6.83 mg dm−3), followed by IPF (5.95 mg dm−3) and P2 (4.80 mg dm−3). These results suggest a possible influence of factors such as soil type, especially the presence of Eutrophic Red Argisol, on phosphorus availability [16].
Base Saturation (V%) varied widely among land uses, with the highest mean in IPF (38.58%) and the lowest in Silviculture (25.81%), while P2 and P1 showed 35.73% and 32.09%, respectively. These values reflect the influence of management and soil type on the availability of exchangeable bases and indicate that, as all are below 50%, liming is necessary, preferably at variable rates to optimize costs and reduce CO2 emissions [16].
CEC showed slight variation among land uses, with the highest mean in IPF (3.28 cmolc dm−3), followed by P2 (3.07 cmolc dm−3), Silviculture (2.81 cmolc dm−3), and P1 (2.75 cmolc dm−3). The results indicate relative stability among the systems, with small differences possibly related to the chemical conditions and management of each area [17].
The highest P contents were recorded in EM and the lowest in P1, indicating that applying phosphorus at variable rates can optimize costs and land use. Phosphorus availability may be influenced by management, soil type, and application of phosphate fertilizers [18].

Analysis of Soil Carbon Stocks for Different Uses and Managements

Soil carbon stocks (0–0.20 m) showed little variation among the land uses. The highest values were observed in P2 (5.01 t ha−1) and P1 (4.67 t ha−1), while IPF (4.36 t ha−1) and Silviculture (4.53 t ha−1) recorded the lowest. These differences may be related to organic matter dynamics, management practices, higher biomass input, and the absence of soil tillage in pasture areas.
P1 and P2 areas present favorable conditions for soil carbon accumulation, standing out as strategic alternatives for sustainable management. This potential is associated with higher carbon input from biomass and reduced losses due to the lack of soil tillage over long periods. Together, they occupy a small portion of the study area: P1 covers approximately 305 ha (10% of the total), and P2 about 454.02 ha (16%). According to Segnini [19], even though these areas are smaller and have no livestock management, the characteristics of pastures without intense soil disturbance create ideal conditions for carbon sequestration. The dynamics in these areas favor the accumulation of organic matter—formed by roots and decomposing aboveground biomass—a process essential to maintaining and increasing carbon stocks, especially in the surface layers. The absence of frequent disturbances preserves the soil’s physical structure, making it more efficient in sequestering CO2 compared to intensive agricultural systems.
The accumulation of organic matter is a direct indicator of soil quality and is closely linked to the management applied. According to Favoretto [20], soil carbon content is fundamental for assessing ecosystem sustainability under different management practices. In managed pasture areas, low soil disturbance combined with continuous input of organic residues provides a solid basis for long-term carbon accumulation, enhancing soil fertility and resilience. In the Cerrado, the use of brachiaria is an efficient practice to increase carbon stocks, often surpassing the results obtained by conventional agricultural systems, due to high root biomass production, which favors carbon sequestration and improves soil structure. Therefore, when managed with conservation practices and adapted species such as brachiaria, P1 and P2 play a strategic role in mitigating climate change through atmospheric CO2 sequestration, while simultaneously promoting sustainable land use [21].
Thus, P1 and P2 not only confirm the potential of sustainable management to improve soil quality but also emphasize the importance of adopting practices that maximize carbon sequestration and the preservation of natural resources, especially in sensitive ecosystems such as the Cerrado.

3.2. Interpolated and Normalized Maps of Soil Fertility and Soil Carbon Stock

Through the interpolation of the data analyzed for each sampling point across the entire study area, a soil fertility map was generated for each previously described parameter. Initially, a total of five interpolated maps were produced: one for each soil fertility parameter (pH, phosphorus, CEC, and base saturation), and one for soil carbon stock (Figure 3).
The application of fuzzy logic to normalize the values of the five interpolated maps (pH, cation exchange capacity, phosphorus, base saturation, and soil carbon stock) is essential for integrated and accurate analysis (Figure 3). According to Souza [22], this method converts the data from each map to a common scale from zero (minimum) to one (maximum), allowing for a more coherent interpretation of the results.

3.2.1. Soil Fertility Overlay Map

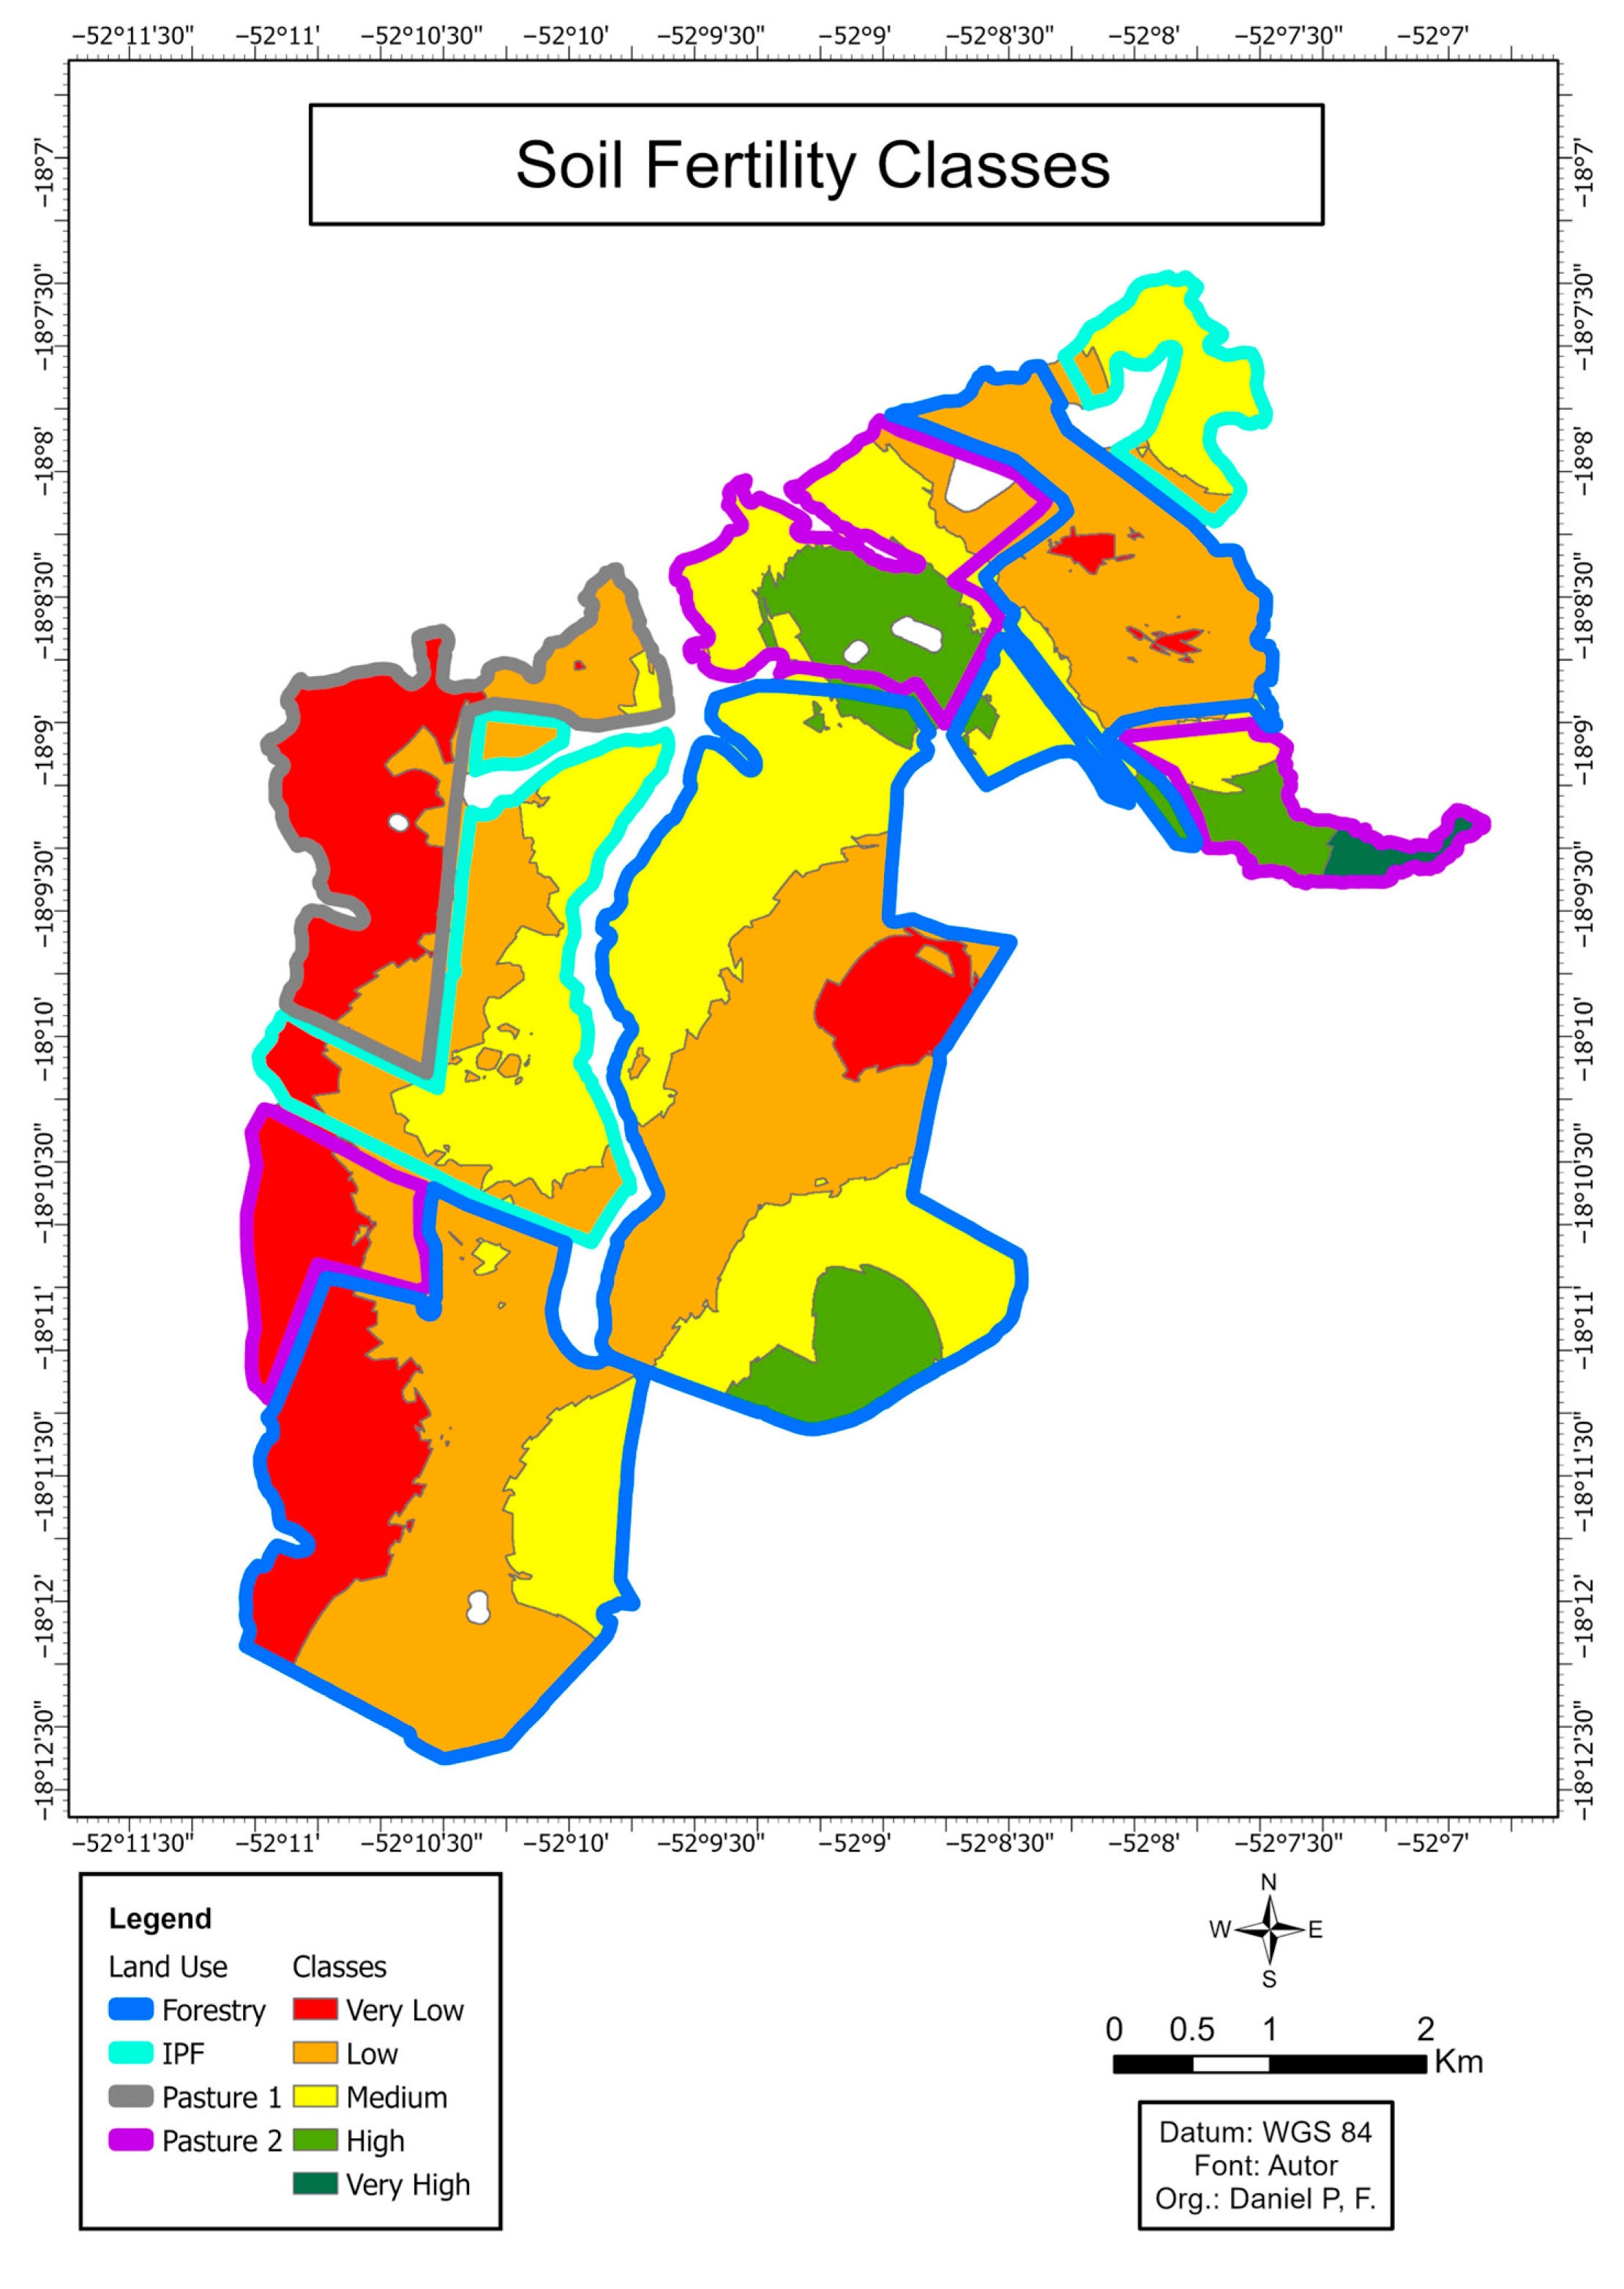
The four soil fertility indicators—pH (CaCl2), cation exchange capacity (CEC), phosphorus, and base saturation (V%)—were combined into a single soil fertility map (Figure 4). This map was reclassified into five categories (Very Low to Very High), resulting in the creation of management zones and allowing for the quantification of fertility in hectares (Table 2).
In the analysis of the total area of 2972.42 ha, most of the land falls under the “Low” category, covering 1233.07 ha (41%). In contrast, the “Very High” class accounts for only 1% of the area, or 21.57 ha, highlighting the predominantly low fertility levels in the region (Table 2).
The comparison between the Soil Fertility Classes map and the Land Use types reveals that Pasture 2 (P2) has the highest percentages of areas with high fertility: 29% “High” and 5% “Very High” (Figure 4), indicating that the management in this area favors soil quality. According to Favoretto [17], fertility levels are crucial for assessing the impact of management on soil quality.
In Livestock-Forest Integration (LFI), 58% of the area was classified as “Medium,” assisting in the definition of management strategies (Figure 4). In Forestry, particularly with Eucalyptus, 50% of the area was classified as “Low,” indicating nutritional limitations that require corrections such as fertilization and liming.
Pasture 1 (P1) presents the most critical scenario, with 58% of the area in “Very Low” fertility (Figure 4), indicating soil degradation and the need for interventions to restore land productivity.
The low soil fertility observed in Pasture 1 (P1) is directly linked to the absence of proper management, which leads to nutrient depletion. The lack of practices such as fertilization and the replenishment of basic cations, particularly calcium and magnesium, aggravates this condition, especially in tropical soils characterized by high acidity and intense leaching. According to Moreira and Siqueira [23], unmanaged soils face nutritional limitations due to the continuous export of biomass without adequate nutrient replacement. In addition, Raij [24] emphasizes that excessive acidity immobilizes phosphorus and reduces cation availability, thereby hindering nutrient uptake by plants.
In this context, the adoption of balanced management practices is essential to restore soil fertility. Malavolta [25] highlights that the integration of organic matter with proper nutrient replenishment ensures soil sustainability, maintaining productivity, environmental conservation, and long-term quality. It is also worth noting that although liming is required in all environments studied, applying lime according to specific management zones makes it possible to identify areas that demand higher corrective doses, thus optimizing costs and reducing environmental impacts, particularly with regard to emissions associated with lime application.

3.2.2. Soil Carbon Stock

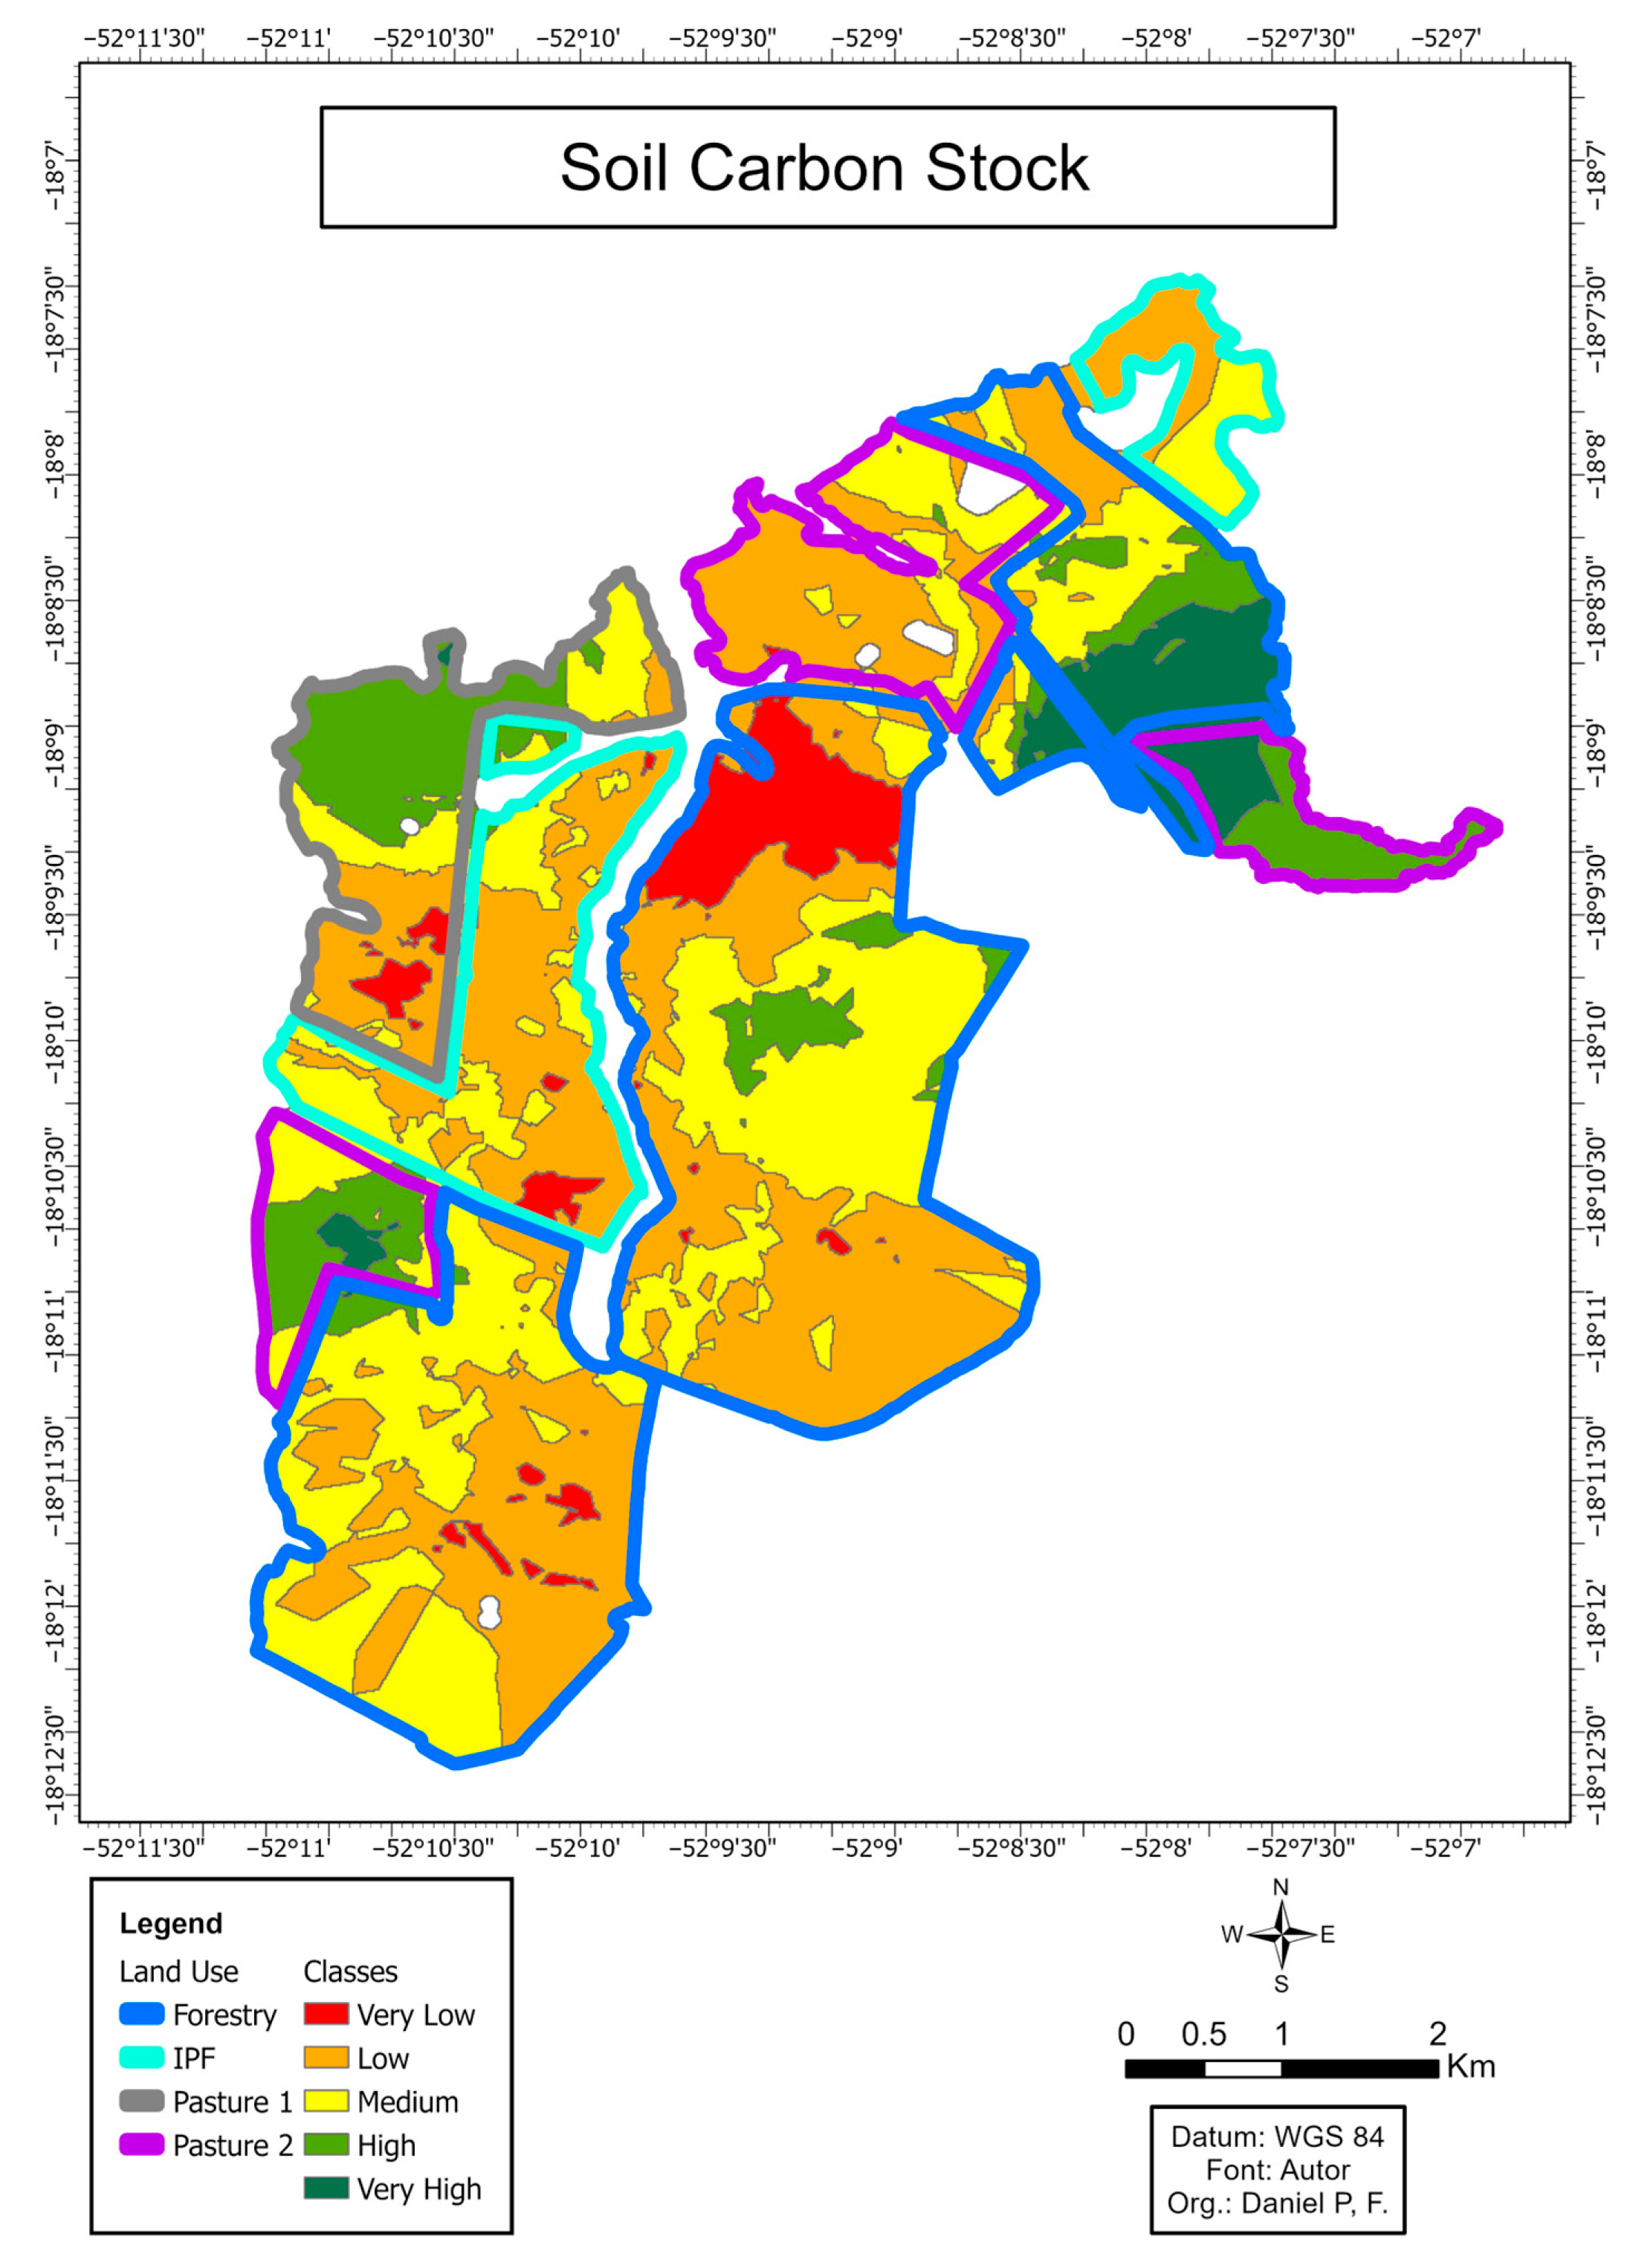
A large portion of the total Carbon Stock in the study area is classified as “Medium,” with 49% of the entire area in hectares (Table 3), showing a more equitable distribution.
Unlike the soil fertility map, which was created by overlaying parameters, the Soil Carbon Stock map was generated through interpolation of the collected data. After that, fuzzy logic was applied to standardize the values and allow for a coherent analysis. The data was then reclassified into five classes, creating the soil carbon stock management zones.
The categorization followed the example model of Raij [26], with five classes: Very Low, Low, Medium, High, and Very High. This process resulted in the map of soil carbon stock management zones, representing the distribution of carbon levels in the study area (Figure 5).
In Pasture 1 (P1), 40% of the area has carbon stock classified as “High” and only 6% as “Very Low” (Figure 5), indicating high potential for carbon sequestration, possibly linked to effective management practices [27]. In Pasture 2 (P2), 27% of the area is in the “High” class and 35% in “Low,” suggesting variations in management or soil characteristics that affect carbon storage [28].
In Livestock-Forest Integration (LFI), 59% of the area is classified as “Low” and 35% as “Medium” (Figure 5), reflecting intermediate sequestration levels, possibly due to the stage of vegetation and forest density [29]. In Eucalyptus Monoculture Forestry (EM), 41% of the area is classified as “Low” and 39% as “Medium” (Figure 5). Despite the potential of eucalyptus, the low stocks may be linked to the cutting cycle and biomass management [30].

3.3. Analyses

Pearson Correlation

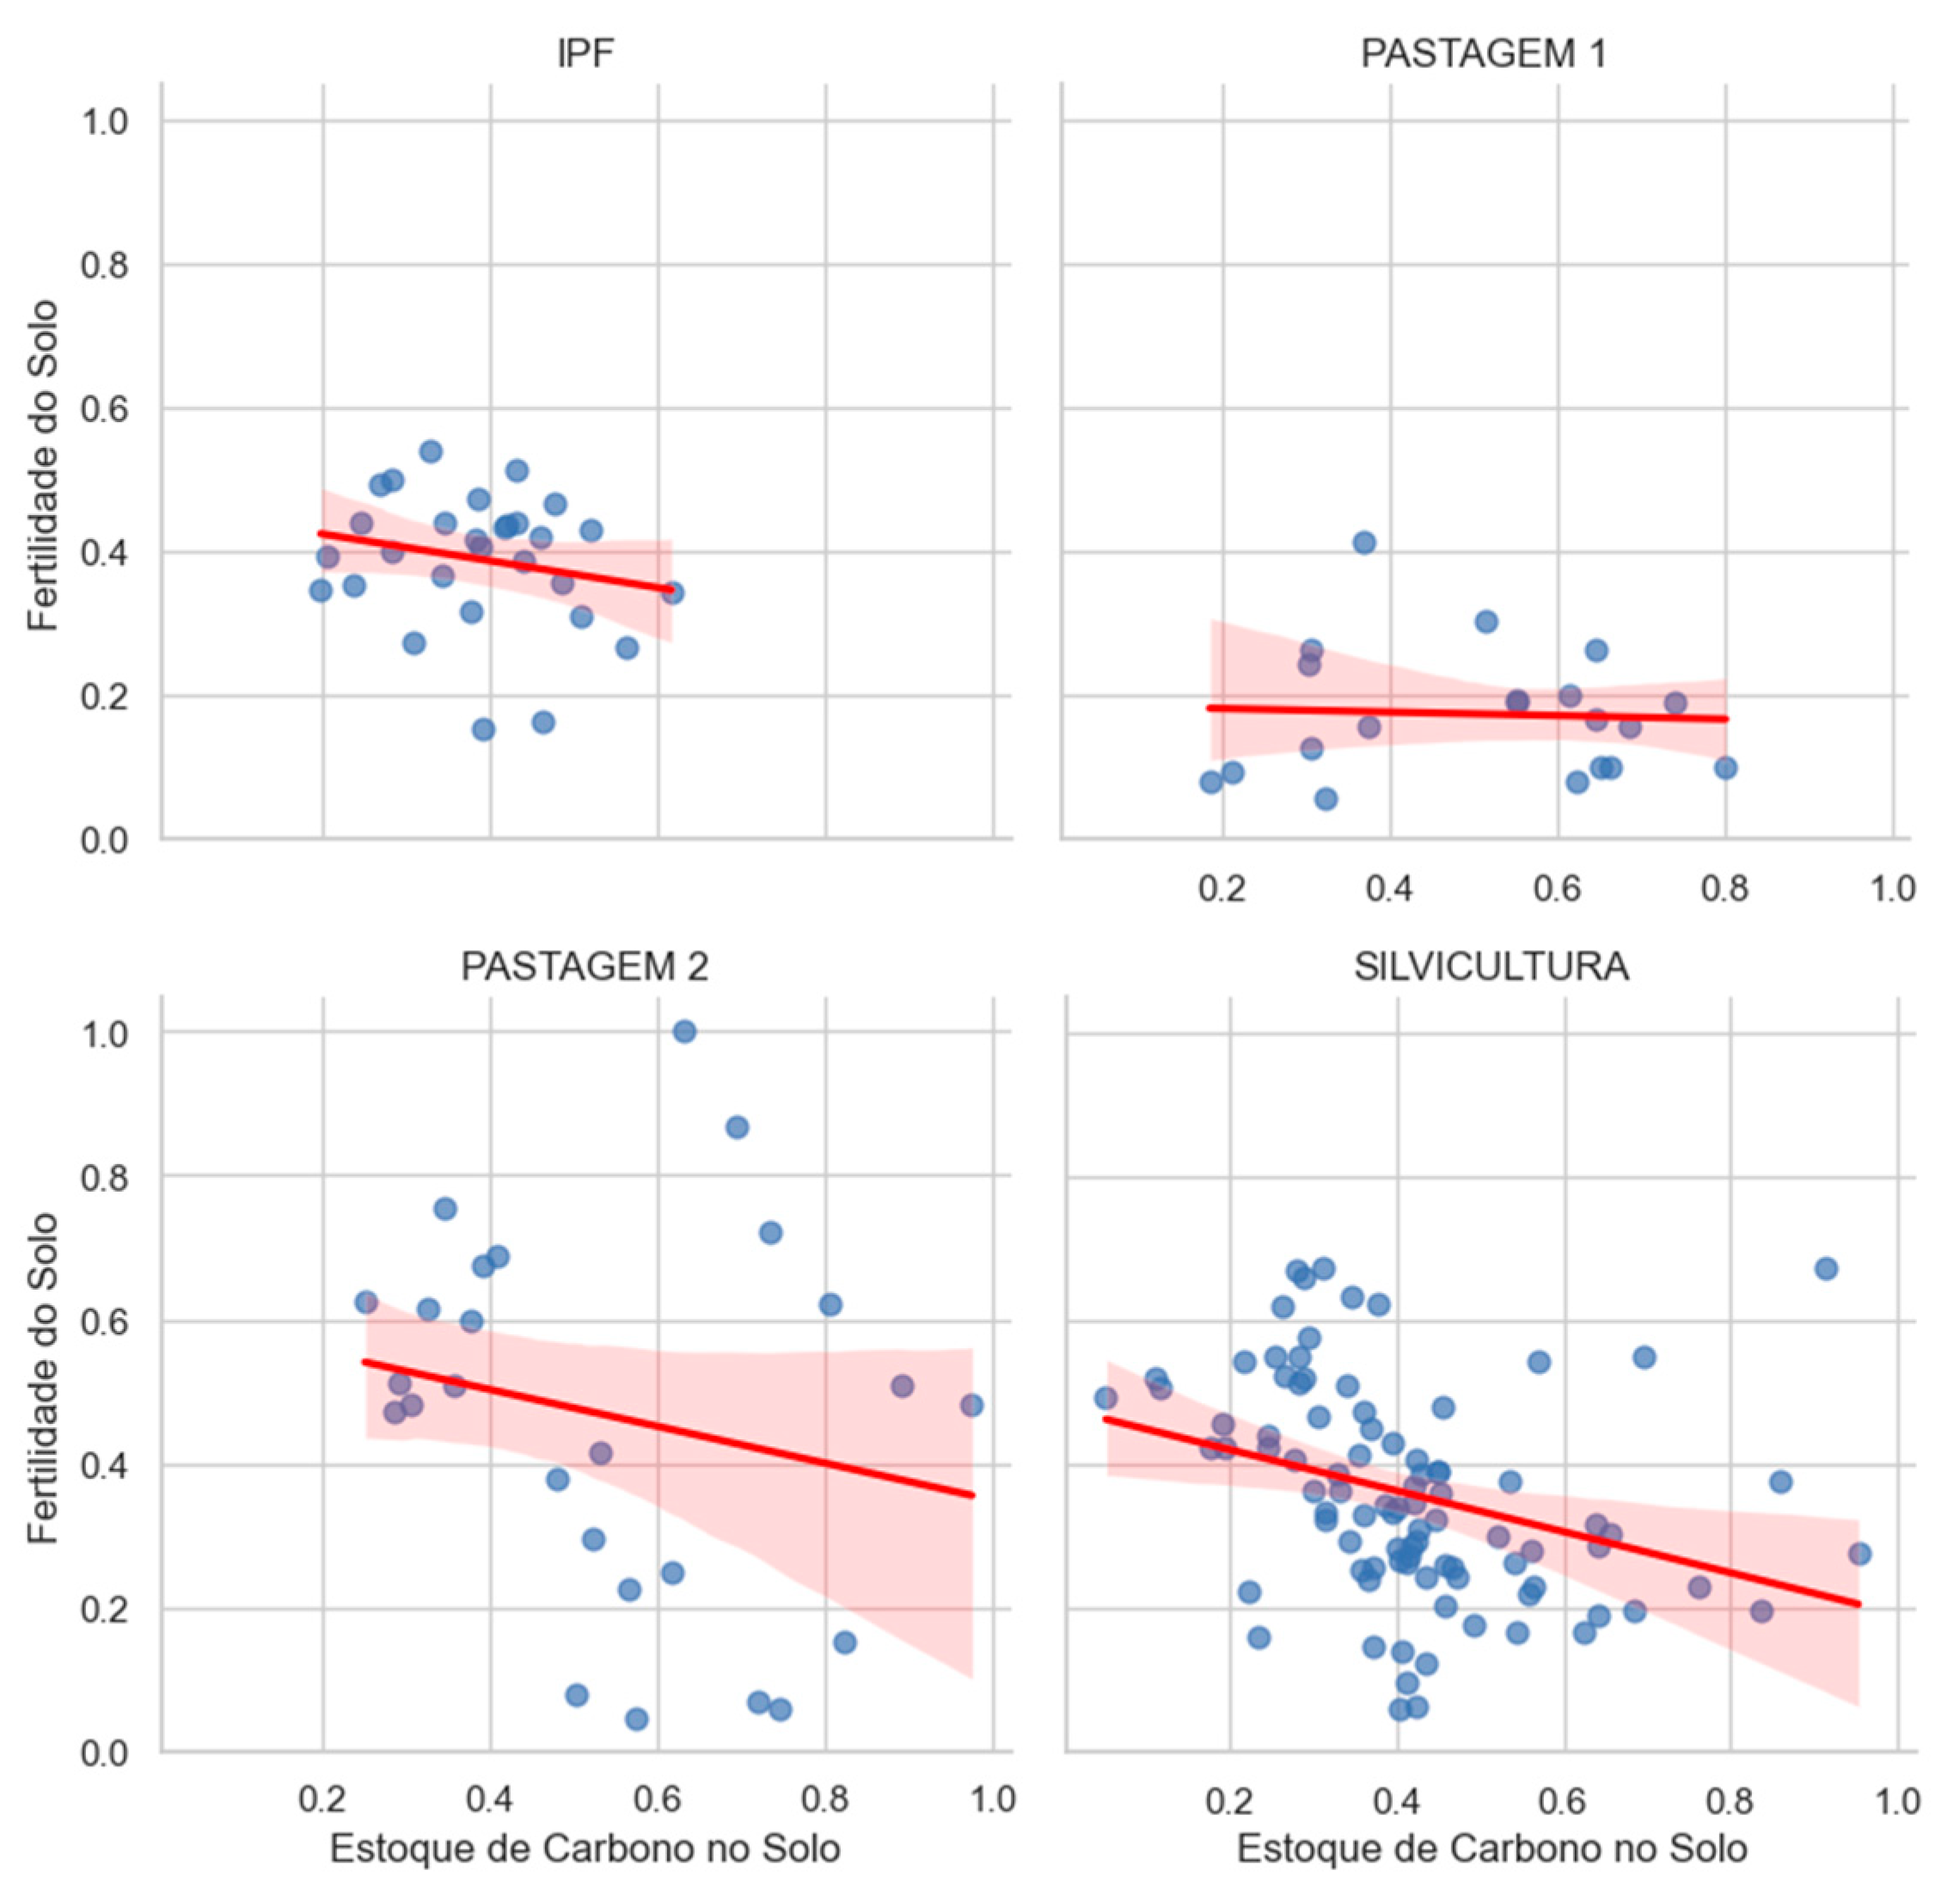
The Pearson correlation between soil fertility and carbon stocks was evaluated for IPF, Silviculture, monoculture pasture P1, and polyculture pasture P2 (Figure 6). In the IPF management system, the obtained coefficient was −0.21, indicating a weak negative correlation. However, the p-value (0.2710) exceeded the 0.05 significance level, showing that the relationship is not statistically significant and may be due to chance [15].
In Silviculture, a moderate negative correlation (r = −0.32) between fertility and carbon stocks was identified, with a p-value of 0.0017, below 0.05, indicating a statistically significant linear association between the variables [31].
In P1, the correlation coefficient was −0.05, indicating an almost negligible correlation. The p-value of 0.8301 reinforces the lack of statistical significance, suggesting no evidence of a relationship between fertility and carbon in this type of land use [32].
Finally, in P2, the correlation was −0.20, weak and negative. With a p-value of 0.3171, the relationship between the variables was not statistically significant, indicating no strong evidence of an association between them [33].
The results indicate that, although all management systems showed negative correlations between fertility and carbon stocks, only Silviculture exhibited a statistically significant association. It should be emphasized that correlation does not imply causation [15,16,17,18,19,20,21,22,23,24,25,26,27,28,29,30,31,32,33].

3.4. Relationships Between the Soil Fertility Map and the Soil Carbon Stock Map

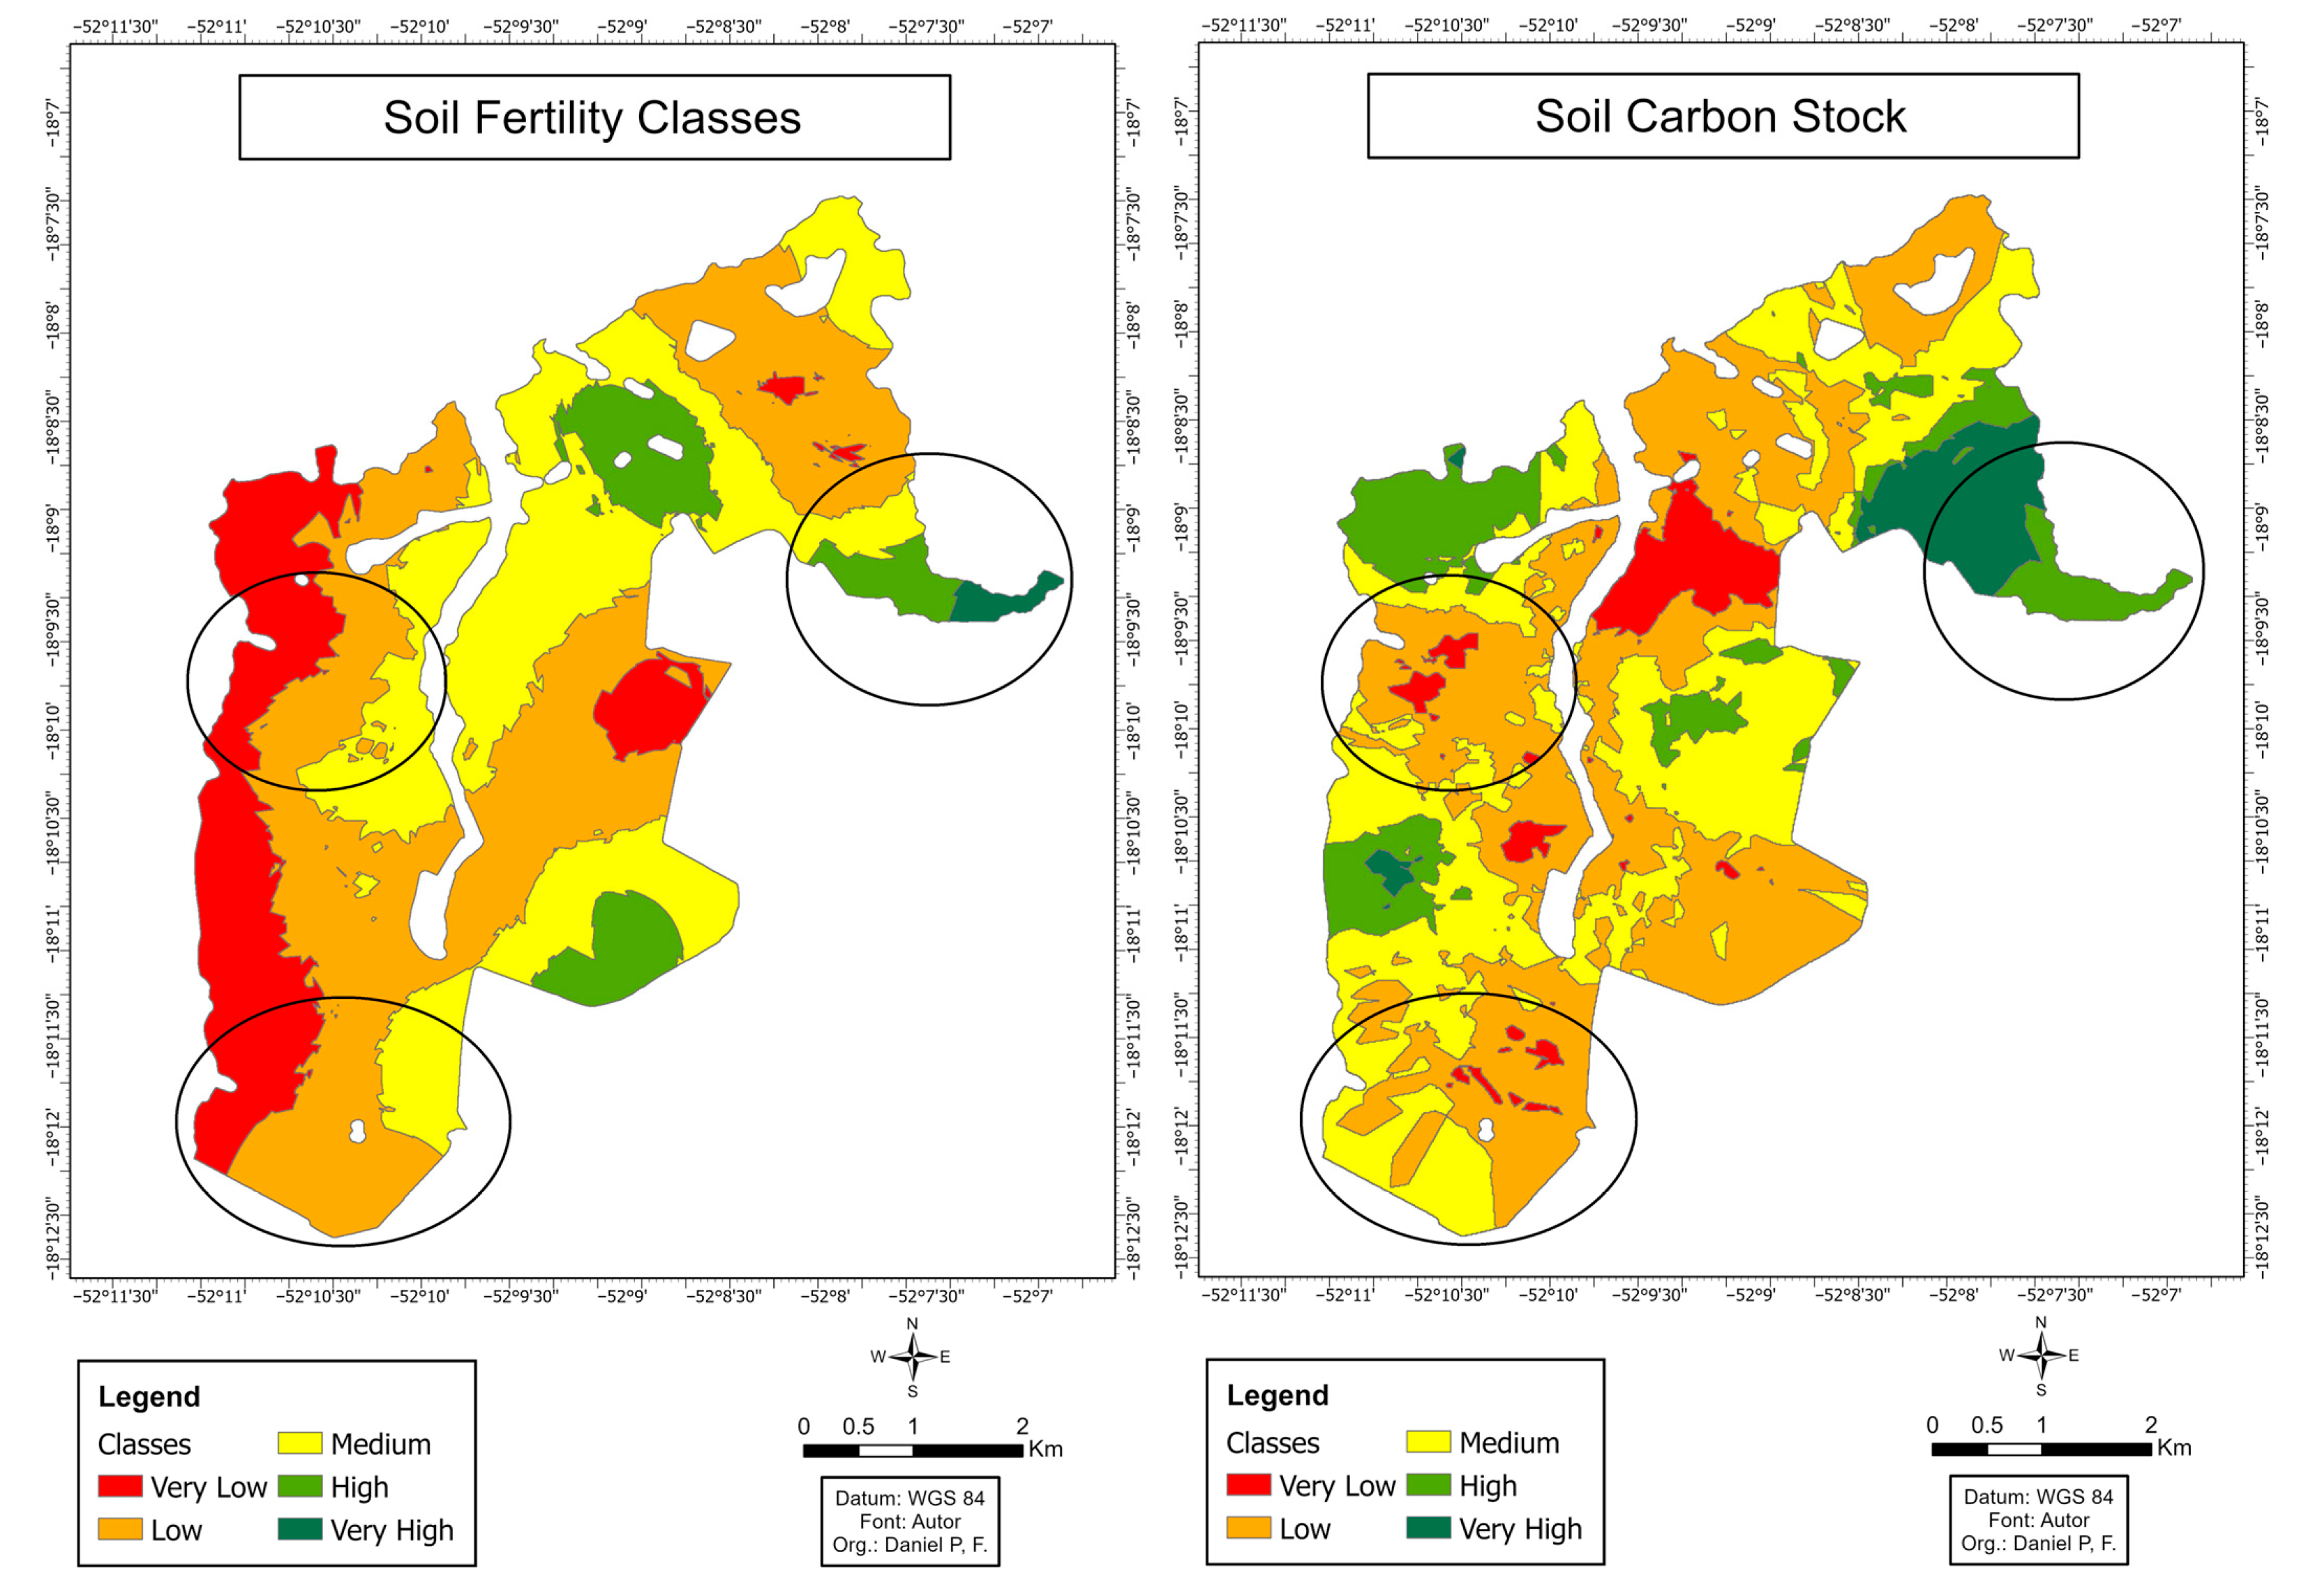
The analysis of the soil fertility and carbon stock maps highlights possible correlations, indicating interdependence between soil characteristics (Figure 7). Despite the observed variations, the patterns are similar: areas with high fertility generally coincide with high carbon stocks, as noted by Donagema, Santos, and Montanari [34].
There is also consistency in regions with low classifications, where physical limitations, such as compaction and low water retention, coincide with low fertility and carbon stocks. These areas coincide with Red-Yellow Dystrophic Argisol, naturally less fertile and more susceptible to degradation [8].
Salton, Mielniczuk, and Bayer [35] emphasize the importance of integrated management aimed at improving both chemical and physical properties to enhance both fertility and carbon stock. The similarity between the maps highlights the need for a joint and holistic approach to soil health (Figure 8).

4. Discussion

The results confirm the effectiveness of the fertility management zone maps in spatially characterizing agricultural areas, with data consistent with the objectives. The integration with the carbon stock mapping allowed for the identification of significant patterns, revealing a direct correlation between the chemical parameters—pH (CaCl2), CEC, available phosphorus, and V%—and carbon stocks, reinforcing the need for integrated approaches to assess soil quality and sustainability [36].
The spatial variability highlighted the influence of soil heterogeneity on productivity, with areas of low fertility and carbon associated with Red-Yellow Dystrophic Argisols. This underscores the importance of adaptive practices and precision agriculture for efficient resource use and reduced environmental impact [37].
Among the limitations, the sample scale stands out, which could be expanded for greater accuracy in modeling spatial variability [38]. It is also necessary to extend the temporal horizon to monitor the dynamics of soil parameters and assess the effects of management practices over time [39].
The findings provide a foundation for future research in precision agriculture and sustainable management. Technologies such as machine learning, field sensors, and satellite imagery can enhance soil prediction and real-time monitoring [34].
Finally, the study reinforces the importance of sustainable practices, such as rational fertilizer use and carbon conservation, for more resilient and efficient agricultural systems [40].

5. Conclusions

With the use of precision agriculture techniques and geoprocessing, reclassified maps were generated that suggest spatial differences in soil management classes across different land uses, considering the chemical properties of soil fertility and soil carbon stock. The integrated analysis of these variables allowed for the definition of specific management zones for soil fertility management.
In specific areas identified with deficiencies in soil quality parameters, recommendations for the application of lime and phosphorus at variable rates could be made, reducing input costs, increasing production efficiency, and also reducing CO2 emissions from lime application. For zones with better soil fertility, specific management practices could be recommended, reducing the use of inputs and increasing the efficiency and sustainability of the production system. Statistical analysis showed that the correlation between soil fertility and carbon stock varies from strong to negative, suggesting a linear association without a robust causal relationship.
The use of geospatial tools and precision agriculture to assess soil fertility and carbon stock parameters in agricultural and livestock areas can contribute to economic gains by reducing input usage and the number of mechanized operations, consequently reducing diesel use, phosphorus and lime application. This contributes to more efficient agro-pastoral production systems with lower relative greenhouse gas emissions and greater sustainability, further contributing to Sustainable Development Goals (SDGs) 2, Zero Hunger and Sustainable Agriculture, and SDG 13, Climate Action.

Author Contributions

Conceptualization, P.D.F. and E.B.d.F.; methodology, P.D.F.; software, P.D.F.; validation, E.B.d.F.; formal analysis, E.B.d.F.; investigation, P.D.F.; resources, P.D.F.; supervision, E.B.d.F.; project administration, P.D.F. and E.B.d.F.; funding acquisition, P.D.F. and E.B.d.F. All authors have read and agreed to the published version of the manuscript.

Funding

This research received no external funding.

Data Availability Statement

The data presented in this study are openly available in https://hdl.handle.net/20.500.14289/22262 (accessed on 17 September 2025).

Acknowledgments

I thank the company Agrorobótica for providing the data for this research.

Conflicts of Interest

The authors declare no conflicts of interest.

Abbreviations

CECCation Exchange Capacity
EMEucalyptus Monoculture
GHCGreenhouse Gas
GISGeographic Information Systems
IPFLivestock-Forestry Integration
LIBSLaser-Induced Breakdown Spectroscopy

References

  1. IPCC (Intergovernmental Panel on Climate Change). Relatório Síntese do Sexto Relatório de Avaliação (AR6): Mudança do Clima 2023; IPCC: Genebra, Switzerland, 2023. Available online: https://www.gov.br/mcti/pt-br/acompanhe-o-mcti/sirene/publicacoes/relatorios-do-ipcc/arquivos/pdf/copy_of_IPCC_Longer_Report_2023_Portugues.pdf (accessed on 20 December 2024).
  2. Gurgel, A.C.; Manzatto, C.V.; Vicente, L.E.; Perosa, B. Agricultura de baixo carbono no Brasil: Desafios para o crédito e monitoramento de emissões. In Proceedings of the 61º Congresso da Sociedade Brasileira de Economia, Piracicaba, Brazil, 23–27 July 2023. [Google Scholar]
  3. Cunha, E.; Monteiro, J.A.F. Uso de drones na agricultura de precisão. Rev. Bras. Agric. Sustentável 2021, 10, 78–90. [Google Scholar]
  4. Zimback, C.R.L. Análise Espacial de Atributos Químicos de solos para fins de Mapeamento da Fertilidade. Ph.D. Thesis, Universidade Estadual de São Paulo, Botucatu, Brazil, 2001. [Google Scholar]
  5. Santos, G.A.; Camargo, F.A.O. Fundamentos da Matéria Orgânica do solo: Ecossistemas Tropicais & Subtropicais; Genesis: Porto Alegre, Brazil, 2019. [Google Scholar]
  6. Sano, E.E.; Rosa, R.; Brito, J.L.S.; Ferreira, L.G. Mapeamento Semidetalhado do uso da terra do Bioma Cerrado; Embrapa Cerrados: Planaltina, Brazil, 2008. [Google Scholar]
  7. Haridasan, M. Nutritional adaptations of native plants of the cerrado biome in acid soils. Sci. Agric. 2000, 57, 631–640. [Google Scholar] [CrossRef]
  8. Santos, H.G. Sistema Brasileiro de Classificação de Solos, 5th ed.; Embrapa Solos: Brasília, Brazil, 2018. [Google Scholar]
  9. Lal, R. Managing soil carbon for climate change adaptation and mitigation. Geoderma 2018, 337, 1–10. [Google Scholar]
  10. Sisti, C.P.J.; Santos, H.P.; Kohhann, R.; Alves, B.J.R.; Urquiaga, S.; Boddey, R.M. Change in carbon and nitrogen stocks in soil under 13 years of conventional or zero tillage in southern Brazil. Soil Tillage Res. 2004, 76, 39–58. [Google Scholar] [CrossRef]
  11. Claessen, M.E.C. Manual de Métodos de Análise de solo, 2nd ed.; Centro Nacional de Pesquisa de Solos: Rio de Janeiro, Brazil, 1997. [Google Scholar]
  12. Raij, B.V.; Cantarella, H.; Quaggio, J.A.; Furlani, A.M.C. Recomendações de Adubação e Calagem para o Estado de São Paulo, 2nd ed.; Instituto Agronômico: Campinas, Brazil, 1997. [Google Scholar]
  13. Filipini, A.L. Modelagem SIG em agricultura de precisão: Conceitos e aplicações. In Agricultura de Precisão: Resultados de um novo Olhar; Bassoi, L.H., Ed.; Embrapa: Brasília, Brazil, 2014. [Google Scholar]
  14. Martins, F.R. Análise de Dados para Ciências Ambientais: Aplicações e Métodos Estatísticos; Ed. Atlas: São Paulo, Brazil, 2012. [Google Scholar]
  15. Cohen, J. Statistical Power Analysis for the Behavioral Sciences, 2nd ed.; Lawrence Erlbaum Associates: Hillsdale, MI, USA, 1988. [Google Scholar]
  16. Dias, F.P.M.; Leandro, W.M.; Xavier, F.A. Phosphorus lability in a Ferralsol as affected by land-use change in the Brazilian Cerrado. Biol. Agric. Hortic. 2025, 41, 35–48. [Google Scholar] [CrossRef]
  17. Gubiani, T.; Santanna, E.; Veloso, M.A.; Calegari, M.G.; Canalli, A.; Finckh, L.B.d.S.; Caner, M.R.; Rheinheimer, L.; Santos, D. Effect of 26-years of soil tillage systems and winter cover crops on carbon and nitrogen stocks in a southern Brazilian Oxisol. Rev. Bras. Ciênc. Solo 2020, 44, e018. [Google Scholar]
  18. Bernardi, A.C.d.C.; Bueno, J.O.d.A.; Laurenti, N.; Santos, K.E.L.; Alves, T.C. Effect of lime and fertilizers applied at variable rate on soil chemical attributes and production costs of a Tanzania grass pasture intensively managed. Braz. J. Biosyst. Eng. 2018, 12, 368–382. [Google Scholar] [CrossRef]
  19. Segnini, A.; Xavier, A.A.P.; Otaviani-Junior, P.L.; Oliveira, P.P.A.; Pedroso, A.D.F.; Praes, M.F.F.M.; Milori, D.M.B.P. Soil carbon stock and humification in pastures under different levels of intensification in Brazil. Sci. Agric. 2019, 76, 33–40. [Google Scholar] [CrossRef]
  20. Favoretto, C.M.; Gonçalves, D.; Milori, D.M.B.P.; Rosa, J.A.; Leite, W.C.; Brinatti, A.M.; Saab, S.C. Determination of humification degree of organic matter of an Oxisol and of its organic mineral fractions. Química Nova 2008, 31, 1994–1996. [Google Scholar] [CrossRef]
  21. Bayer, C. Estabilização do carbono no solo e mitigação das emissões de gases de efeito estufa na agricultura conservacionista. In Tópicos em Ciência do solo; Klauberg Filho, O., Ed.; Sociedade Brasileira de Ciência do Solo: Viçosa, Brazil, 2011. [Google Scholar]
  22. Souza, Z.M.; Marques Júnior, J.; Pereira, G.T.; Barbieri, D.M.; Montanari, R. Lógica fuzzy na avaliação da fertilidade do solo e produtividade do café conilon. Rev. Ciênc. Agron. 2010, 41, 1–9. [Google Scholar]
  23. Moreira, F.M.S.; Siqueira, J.O. Microbiologia e Bioquímica do Solo, 2nd ed.; UFLA: Lavras, Brazil, 2006. [Google Scholar]
  24. Raij, B.V. Fertilidade do solo e Manejo de Nutrientes; Instituto da Potassa e Fosfato: Piracicaba, Brazil, 2011. [Google Scholar]
  25. Malavolta, E. Manual de Nutrição Mineral de Plantas; Agronômica Ceres: São Paulo, Brazil, 2006. [Google Scholar]
  26. Raij, B.V. Fertilidade do solo e Manejo de Nutrientes; Instituto Agronômico: Piracicaba, Brazil, 1997. [Google Scholar]
  27. Souza, E.D. Efeito do manejo de pastagens na dinâmica do carbono do solo. Rev. Bras. Geogr. Física 2019, 12, 1–14. [Google Scholar]
  28. Carvalho, J.L.N. Dinâmica do carbono em solos manejados sob diferentes sistemas de uso. Rev. Bras. Ciênc. Solo 2017, 41, 1–10. [Google Scholar]
  29. Costa, F.S. Sequestro de carbono em sistemas integrados de produção agropecuária. Pesqui. Agropecuária Bras. 2020, 55, 1–12. [Google Scholar]
  30. Silva, A.C. Impacto da silvicultura no sequestro de carbono em diferentes tipos de solo. Ciênc. Florest. 2018, 28, 1–15. [Google Scholar]
  31. Fisher, R.A. Statistical Methods for Research Workers, 14th ed.; Oliver and Boyd: Edinburgh, Scotland, 1992. [Google Scholar]
  32. Siegel, S.; Castellan, N.J. Nonparametric Statistics for the Behavioral Sciences, 2nd ed.; McGraw-Hill: New York, NY, USA, 1998. [Google Scholar]
  33. Tabachnick, B.G.; Fidell, L.S. Using Multivariate Statistics, 5th ed.; Pearson: Boston, MA, USA, 2007. [Google Scholar]
  34. Donagema, G.K.; Santos, H.G.; Montanari, R. Manual de Métodos de Análise de Solo, 2nd ed.; Embrapa Solos: Rio de Janeiro, Brazil, 2011. [Google Scholar]
  35. Salton, J.C.; Mielniczuk, J.; Bayer, C. Teores e estoques de carbono e nitrogênio no solo em sistemas agropecuários do Mato Grosso do Sul. Rev. Bras. Ciênc. Solo 2010, 34, 1759–1773. [Google Scholar]
  36. Ribeiro, J.M.; Frazão, L.A.; Cardoso, P.H.S.; Oliveira, A.L.G.; Sampaio, R.A.; Fernandes, L.A. Fertilidade do solo e estoques de carbono e nitrogênio sob sistemas agroflorestais no Cerrado Mineiro. Ciênc. Flor. 2009, 29, 913–923. [Google Scholar] [CrossRef]
  37. Machado, P.L.O.A.; Bernardi, A.C.C.; Silva, C.A. Agricultura de Precisão para o Manejo da Fertilidade do solo em Sistema Plantio Direto, 1st ed.; Embrapa: Rio de Janeiro, Brazil, 2004. [Google Scholar]
  38. Sousa, S.S.; Moreira, S.G.; Castro, G.F. Avaliação da fertilidade do solo por Agricultura de Precisão e Convencional. Rev. Agrogeoamb. 2016, 8, 33–46. [Google Scholar] [CrossRef]
  39. Troian, D.; Rosset, J.S.; Martins, L.F.B.N.; Ozório, J.M.B.; Castilho, S.C.P.; Marra, L.M. Carbono orgânico e estoque de carbono do solo em diferentes sistemas de manejo. Rev. Agroneg. Meio Ambiente 2020, 13, 1447–1469. [Google Scholar] [CrossRef]
  40. Ronquim, C.C. Conceitos de Fertilidade do solo e Manejo Adequado para as Regiões Tropicais, 2nd ed.; Embrapa Territorial: Campinas, Brazil, 2020. [Google Scholar]
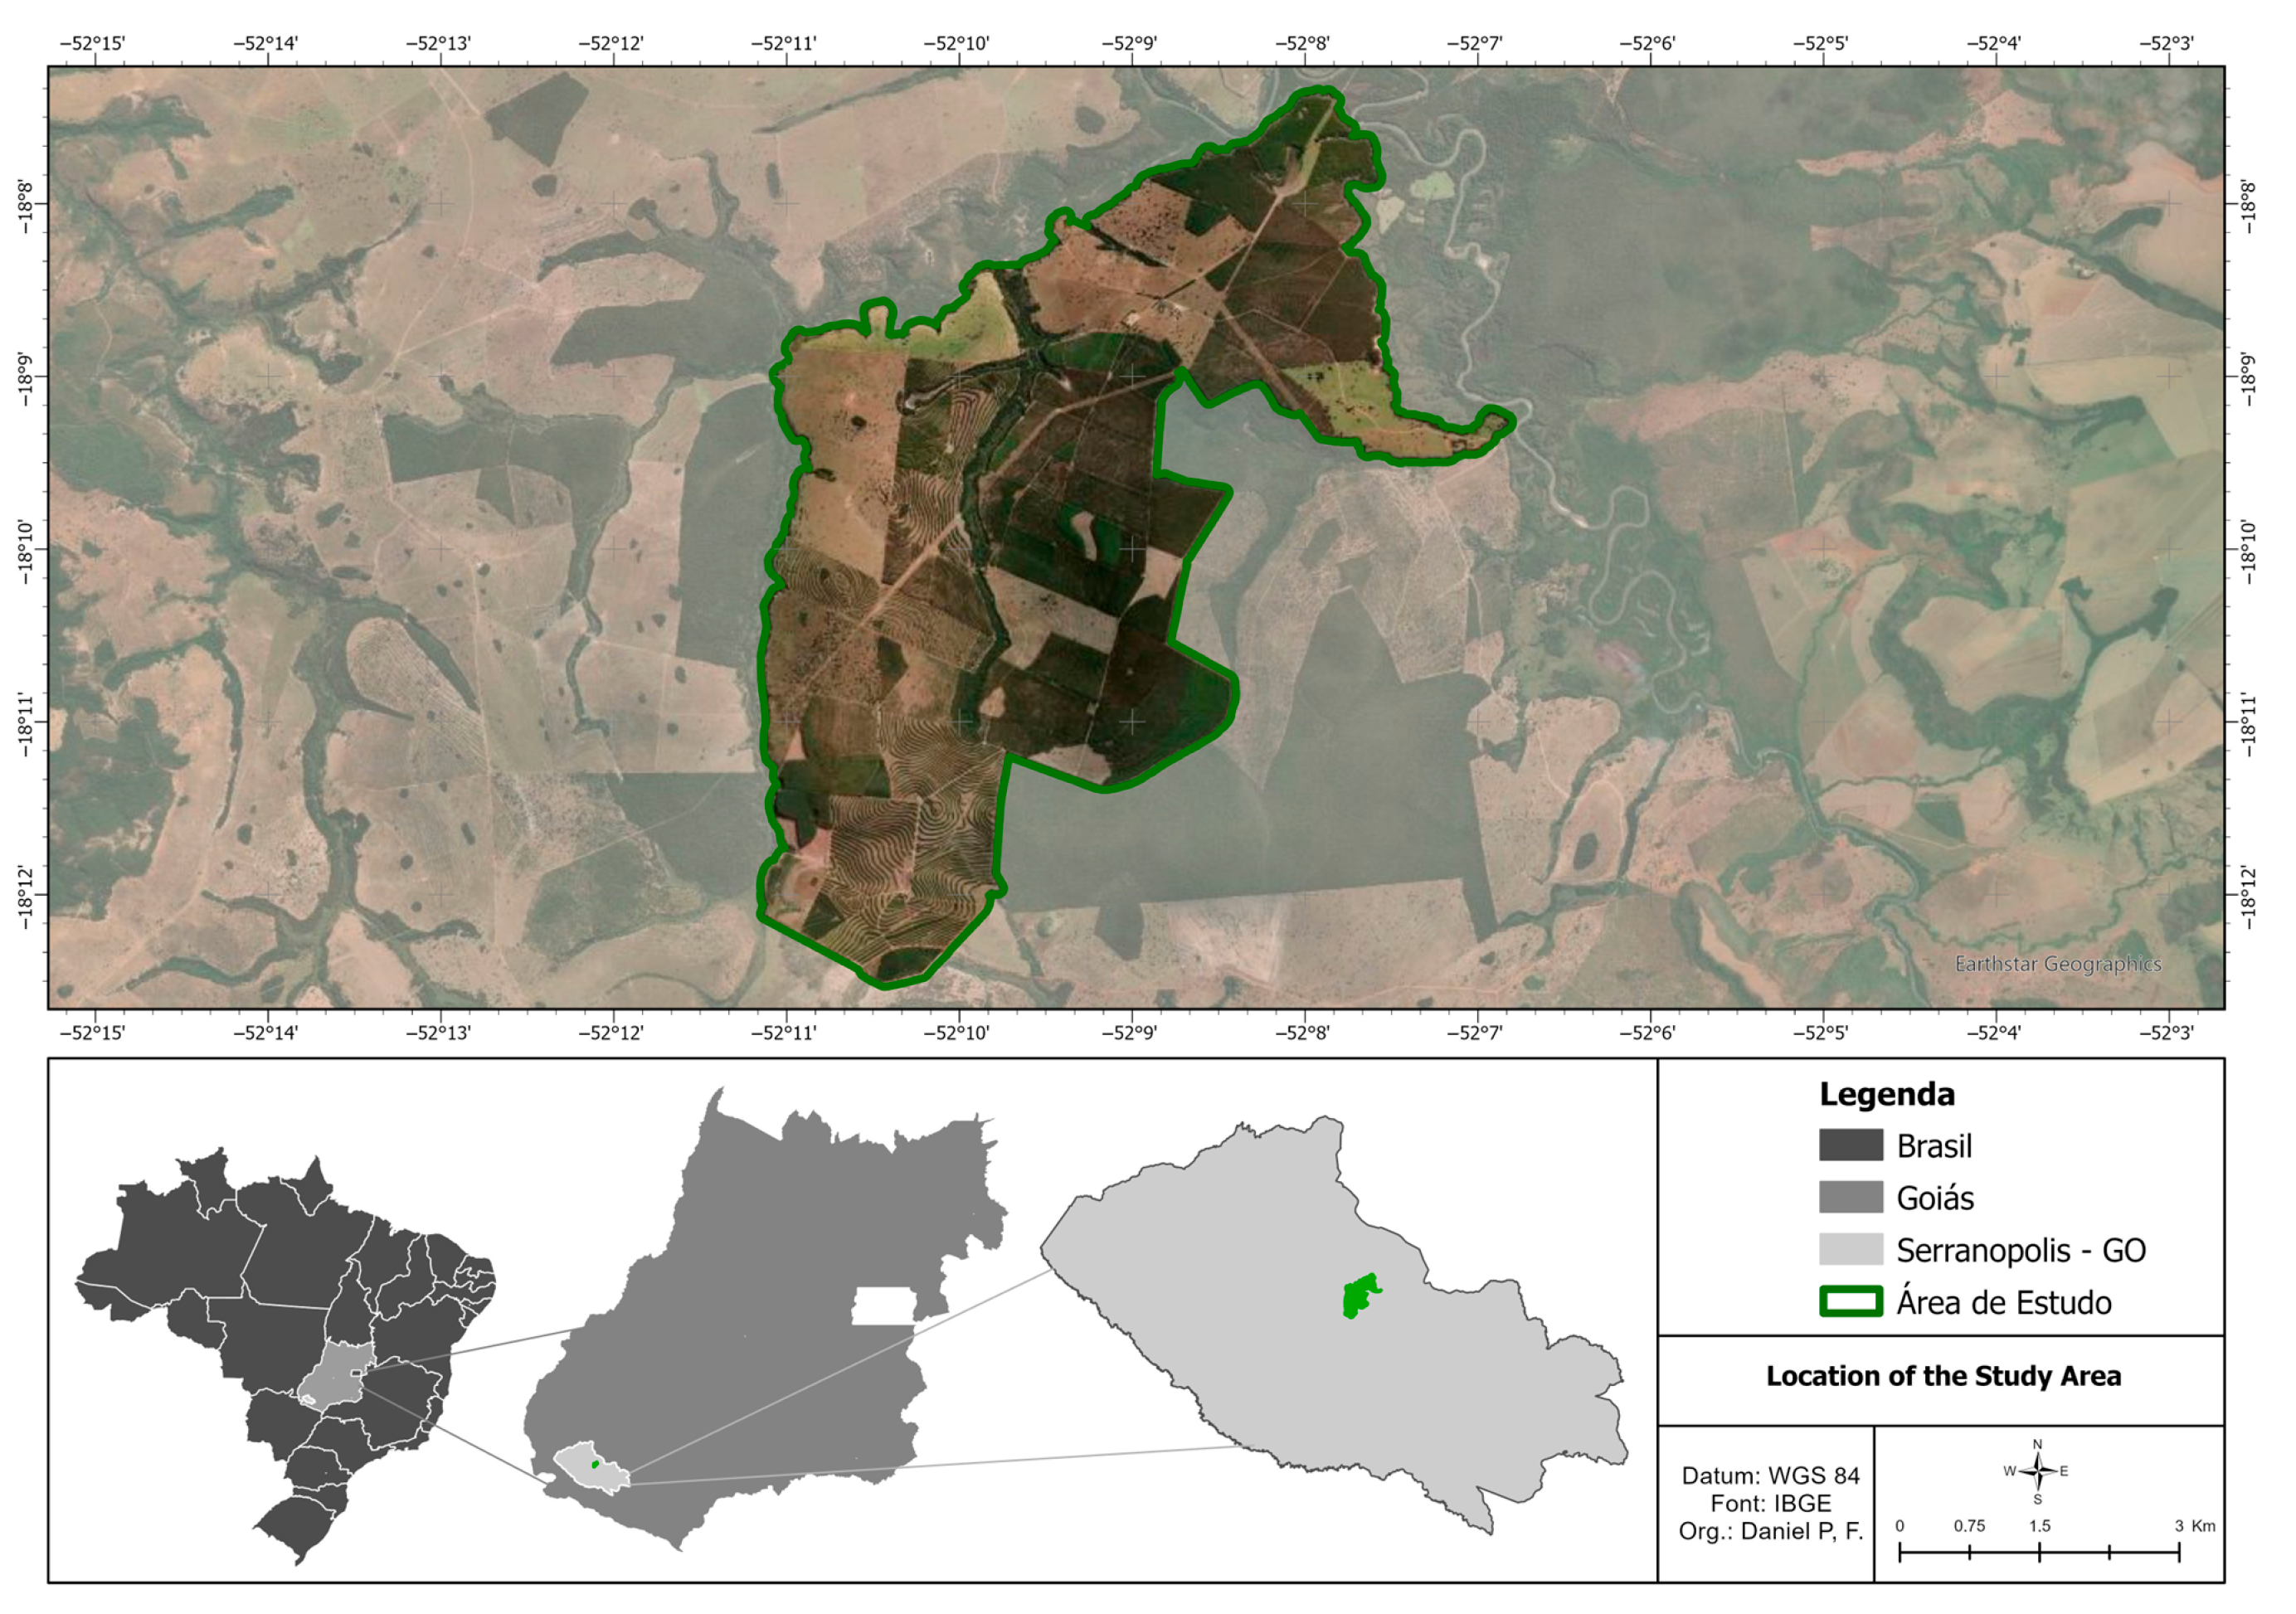
Figure 1. Location of the study area in the municipality of Serranópolis, GO.
Agriengineering 07 00308 g001
Figure 2. Map with georeferenced sampling points showing the location of the study area in Serranópolis—GO, including the four evaluated scenarios: Eucalyptus Monoculture—Silviculture (EM), Livestock-Forestry Integration (IPF), Pasture 1 (P1), and Pasture 2 (P2), according to the pedological characteristics of the study area.
Agriengineering 07 00308 g002
Figure 3. Interpolated maps, results of kriging using the Smart-Map plugin and subsequently processed with fuzzy logic: I—pH (CaCl2); II—cation exchange capacity (cmolc dm−3); III—phosphorus (mg dm−3); IV—base saturation (V%); and V—carbon stock (t ha−1), with each map represented in raster format.
Agriengineering 07 00308 g003
Figure 4. Map of soil fertility management zones according to each land use type, generated from the overlay of leveled fertility levels; I: pH (CaCl2); II: Cation Exchange Capacity (cmolc dm−3); III: Phosphorus (mg dm−3); IV: Base Saturation (V%) and reclassified into 5 equal classes.
Agriengineering 07 00308 g004
Figure 5. Map of soil carbon stock management zones with 5 classes, generated from the reclassification of the leveled soil carbon stock map for each land use type.
Agriengineering 07 00308 g005
Figure 6. Comparison among different land uses of soil fertility levels and soil carbon stocks, with the values from each sampling point in the study area.
Agriengineering 07 00308 g006
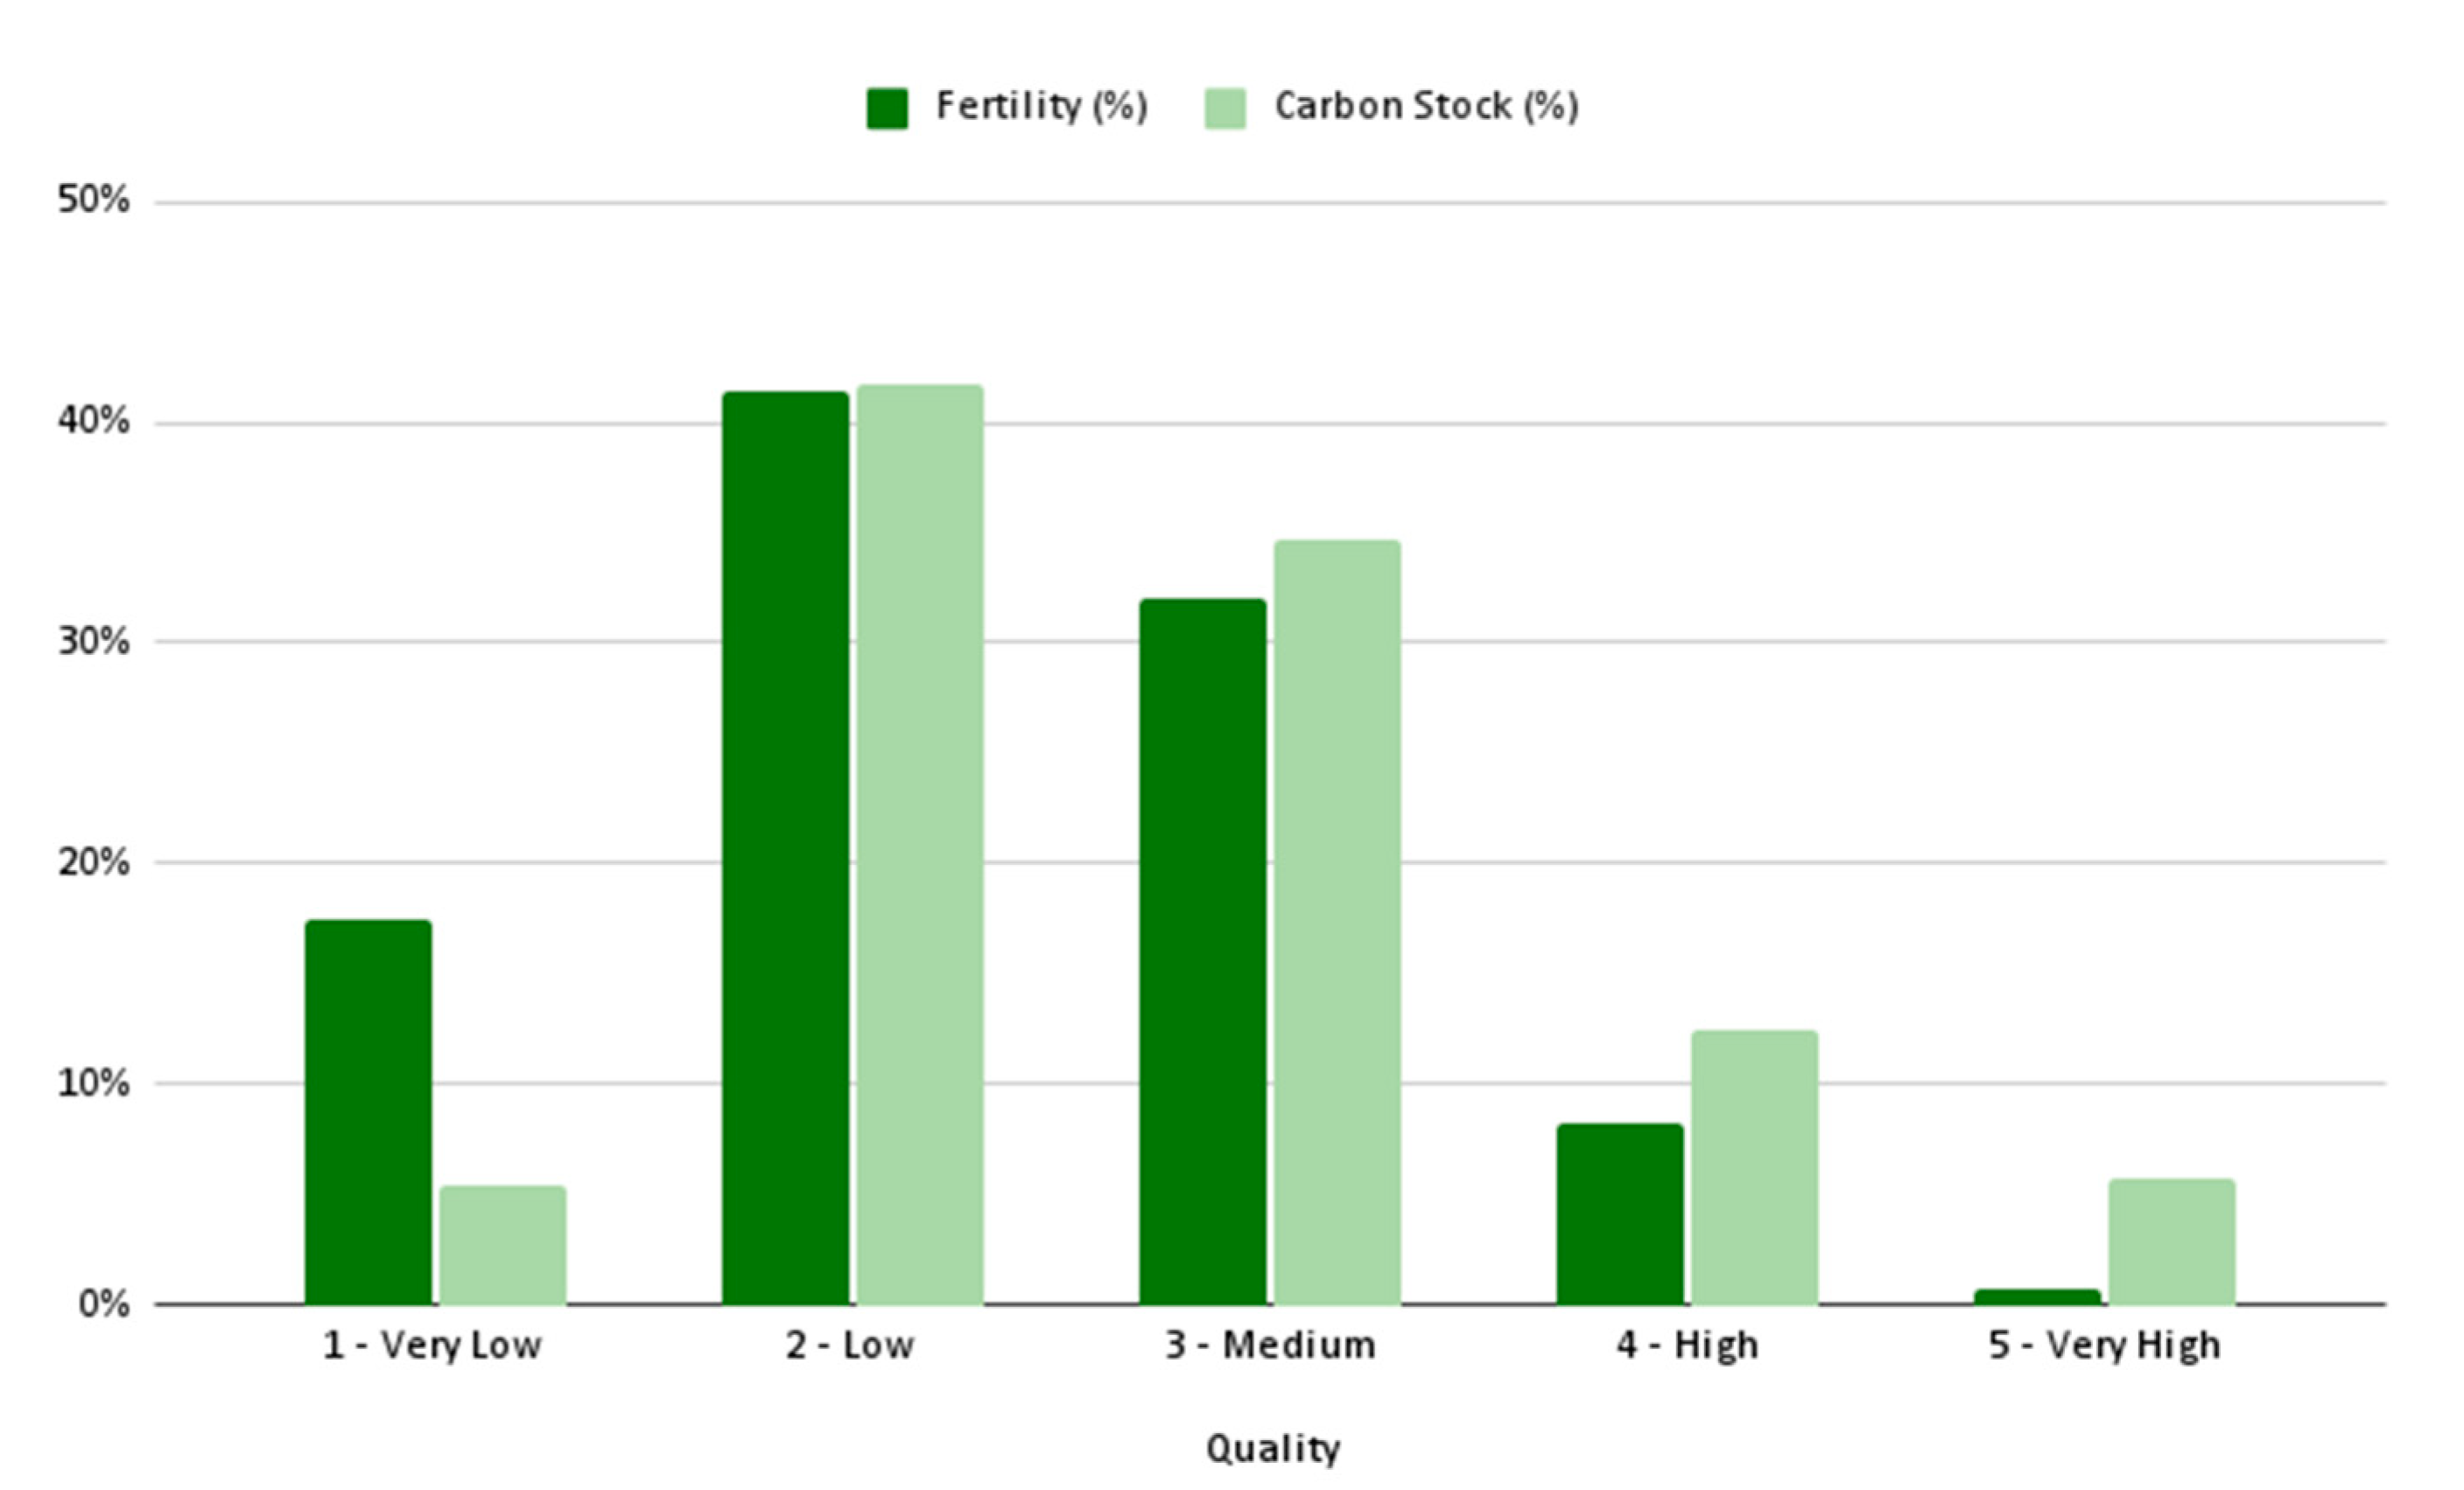
Figure 7. Comparative graph of the percentage of areas in hectares of soil fertility and soil carbon stock.
Agriengineering 07 00308 g007
Figure 8. Comparative points between the soil carbon stock map and the overlay map with soil fertility levels.
Agriengineering 07 00308 g008
Table 1. Reclassification of values from 0 to 1 for the creation of soil management zones.
ClassValue
Very Low0 to 0.2
Low0.2 to 0.4
Medium0.4 to 0.6
High0.6 to 0.8
Very High0.8 to 1
Table 2. Classification of the overlay map of soil fertility classes throughout the study area, at a depth of 0 to 20 cm, with the corresponding area in hectares.
ClassArea (ha)
Very Low519.64
Low1233.07
Medium952.58
High245.89
Very High21.57
Table 3. Classification of Soil Carbon Stock classes throughout the study area, at a depth of 0 to 20 cm, with its area in hectares.
ClassArea (ha)
Very Low162.11
Low1238.25
Medium1031.18
High368.92
Very High171.09
Disclaimer/Publisher’s Note: The statements, opinions and data contained in all publications are solely those of the individual author(s) and contributor(s) and not of MDPI and/or the editor(s). MDPI and/or the editor(s) disclaim responsibility for any injury to people or property resulting from any ideas, methods, instructions or products referred to in the content.