1. Introduction
Human population growth and climate change are factors that compromise global food security, particularly in arid lands [
1,
2,
3]. In this context, irrigated agriculture stands out as the largest consumer of fresh water on the planet, accounting for approximately 70%. For this reason, the use of brackish water (500 to 30,000 mg L
−1 of total dissolved solids), unsuitable for direct human consumption, has emerged as an alternative for the agricultural sector in arid and semi-arid regions to cope with water scarcity [
4,
5,
6,
7]. Furthermore, the rational use of this alternative water source strengthens the concept of a circular economy in irrigated agriculture, reducing the demand for potable water sources for irrigation [
8,
9].
Another relevant aspect of coping with water scarcity concerns the efficient use of water in irrigated agriculture. Drip irrigation systems stand out, applying smaller volumes of water more frequently and with high efficiency (90 to 95%) to crops through thin-walled plastic tubes with emitters placed on the soil surface along the rows of plants [
10]. However, the small dimensions of the emitter channels and labyrinths make them susceptible to clogging by physical, chemical, and biological agents, which can reduce dripper flow, uniformity of water application, efficiency, and the system’s useful life [
11,
12,
13]. Therefore, emitter clogging represents a barrier that restricts the application and promotion of drip irrigation worldwide. This process is influenced by two factors: (1) The quality of irrigation water, influenced by the presence of physical, chemical, and biological agents that act alone and in combination; and (2) The geometry of the emitter labyrinth [
14,
15,
16].
Regarding the agents that cause emitter clogging present in irrigation water, the following are possible: Physical clogging is mainly caused by suspended organic matter, phytoplankton, zooplankton, sand, silt, clay, and plastic waste, which are not retained by the filtration systems used in drip irrigation. In this sense, particles smaller than 110 μm in diameter can still be found in drippers [
17,
18,
19,
20]. Thus, concentrations of total suspended solids greater than 1250 mg L
−1 and particle sizes of 31 to 38 μm increase the physical clogging of drippers, even with the existence of filtration systems [
17,
18,
19,
20,
21]. Chemical clogging occurs due to the formation of chemical precipitates in the irrigation water, which can be deposited in the dripper labyrinths or by the formation of scale directly on the labyrinth walls. It depends mainly on pH values, electrical conductivity, water temperature, and total dissolved solids contents of carbonate, bicarbonate, Fe, Mn, Ca
2+, Mg
2+, and H
2S [
22,
23]. On the other hand, biological clogging is associated with the development of biofilms by bacteria that form inside the emitters and pipes, depending on the bacterial population level (>10,000 colony-forming units per milliliter), biofilms, and levels of organic matter and chemical elements (N, P, S, C, Fe, and Mn) in the irrigation water [
24,
25]. After attaching to the internal walls of the dripper, the bacteria secrete extracellular polymeric substances that aid in the formation of the biofilm matrix; therefore, biological fouling can also result from the activity of algae and fungi [
26,
27].
However, biofouling resulting from the combination of physical, chemical, and biological agents is complex and still requires further study, requiring innovative and integrated approaches to ensure the operational efficiency of drip irrigation systems. Thus, it is believed that the combined use of fractal metrics and scanning electron microscopy (SEM) will allow mapping the development of biofouling and detecting regions susceptible to clogging within emitters, thus providing insights for the creation of new, specific criteria for improving or creating dripper designs with greater resistance to clogging, moving beyond assessments based on dripper flow rates or hydrodynamic simulations. It is also noteworthy that the combined use of these techniques can improve hydrodynamic simulations regarding the occurrence of vortex regions and greater accuracy in estimating flow velocity within the emitter labyrinth. Thus, Euclidean geometry has been applied to accurately and effectively describe material surfaces, being widely used in various fields, and has potential for application in the description and characterization of biofouling in emitters. However, the topographical surface of biofouling cannot be adequately described using Euclidean geometry alone, due to the complexity and irregularity of its surfaces. Therefore, one way to describe the different shapes of aggregates formed in emitters is using fractal geometry, which helps in understanding the geometric behavior of more complex figures [
28,
29]. However, there is little information on the effects of fractal shapes of clogging agents in emitters using brackish water. Thus, the use of fractal analysis to describe irregular surface geometries is relatively new [
30]. Its key parameter is the fractal dimension, which is a non-integer real number and therefore differs from the more familiar analyses of Euclidean geometry or conventional topological scaling. The fractal dimension of a line with any shape ranges from one to two; for a surface, between two and three [
31]. Notably, the geometry of particles can be fully expressed by three independent properties: (1) Shape; (2) Angularity (roundness); and (C) Surface texture [
32]. Finally, the fractal dimension is an index used to describe the irregularity of complex bodies and reflects the validity of a space occupied by an irregular body. Furthermore, it describes complex and nonlinear phenomena that occur in nature [
33,
34]. It should be emphasized that fractal metrics are used in a wide range of fields (ecology, geosciences, medicine, engineering, materials science, computing, and others).
On the other hand, the assessment of the morphology of biofouling materials in emitters using SEM micrographs is widely used [
35,
36,
37,
38,
39,
40]. Micrographs can be used to analyze the sizes and shapes of organic and inorganic particles, chemical precipitates, and microorganisms. SEM provides high-resolution images of a particle’s surface, allowing detailed analysis of its morphology, size, texture, and composition, making it very useful in assessing biofouling inside emitters. However, information on the combination of fractal metrics and SEM to monitor the development of biofouling in emitters is scarce.
Given the above, arid lands face the risk of water scarcity and food insecurity, which can be mitigated with the rational use of brackish water, tolerant crops, and soil salt management in drip-irrigated agriculture. However, the formation of biofouling in emitters by physical, chemical, and biological agents is real and can be mapped and monitored by combining fractal metric and SEM techniques, along with standard hydraulic performance indices. Thus, the present study hypothesizes: the combined use of fractal metric and SEM techniques allows mapping and monitoring the development of biofouling inside irrigation system emitters using brackish and freshwater ratios. Furthermore, this study applied and evaluated statistical and mathematical techniques to analyze clogging processes in non-pressure-compensated drippers operating with brackish and freshwater ratios under open-air experimental bench conditions in the semiarid region of Rio Grande do Norte.
2. Materials and Methods
2.1. Study Site and Characteristics of the Waters Used in the Experimental Assays
The study was conducted in an experimental water reuse area located near the Laboratory of Rural Constructions and Ambience, Universidade Federal Rural do Semi-Árido, in Mossoró (UFERSA), Brazil (5°12′13.33″ S and 37°19′26.78″ W).
Water at three salinity levels was used in the experiment, namely: fresh water (FW), with lower salinity; brackish water (BW), with higher salinity; and a mixture of FW and BW. FW was obtained from the public network managed by the Rio Grande do Norte Water and Sewage Company, while the BW was collected from an artesian well on the Aquaculture Sector of the UFERSA, which collects water from the Jandaíra aquifer, classified as a free aquifer. Groundwater from artesian wells in Mossoró city has a discharge rate of 16 m
3 h
−1 and average electrical conductivity (EC) around 0.40 dS m
−1 [
41]. Transport of brackish water from the Aquaculture Sector took place weekly with the use of a 1 m
3 plastic reservoir to the experimental water reuse area.
Regarding the type of water, the irrigation system was supplied with 100% FW, 100% BW, and 50% FW + 50% BW. During the experiment period, water samples were collected from the irrigation system at 0, 80, and 160 h for analysis at a sampling point located downstream on the filtration system. Samples were characterized in relation to pH, using benchtop pHmeter; EC, using a benchtop conductivity meter; potassium (K+) and sodium (Na+) available, obtained with a flame photometer; calcium (Ca2+), magnesium (Mg2+), chloride (Cl−), carbonate (CO32−) and bicarbonate (HCO3−) available, determined by titration; total suspended solids (TSS) and total dissolved solids (TDS), by the gravimetric method.
Analyses were performed according to methodologies from the Brazilian Agricultural Research Corporation [
42] and the Standard Methods for Examination of Water and Wastewater [
43].
Based on the values of Na
+, Ca
2+, and Mg
2+, we calculated the Sodium Adsorption Ratio (SAR), proposed by [
44], and water hardness using the following equations:
In which:
SAR—Sodium Adsorption Ratio;
Har—Hardness, in mg L−1 in CaCO3; and
Na+, Ca2+, and Mg2+—Concentrations, in mmolc L−1.
2.2. Experimental Design and Hydraulic Circuit
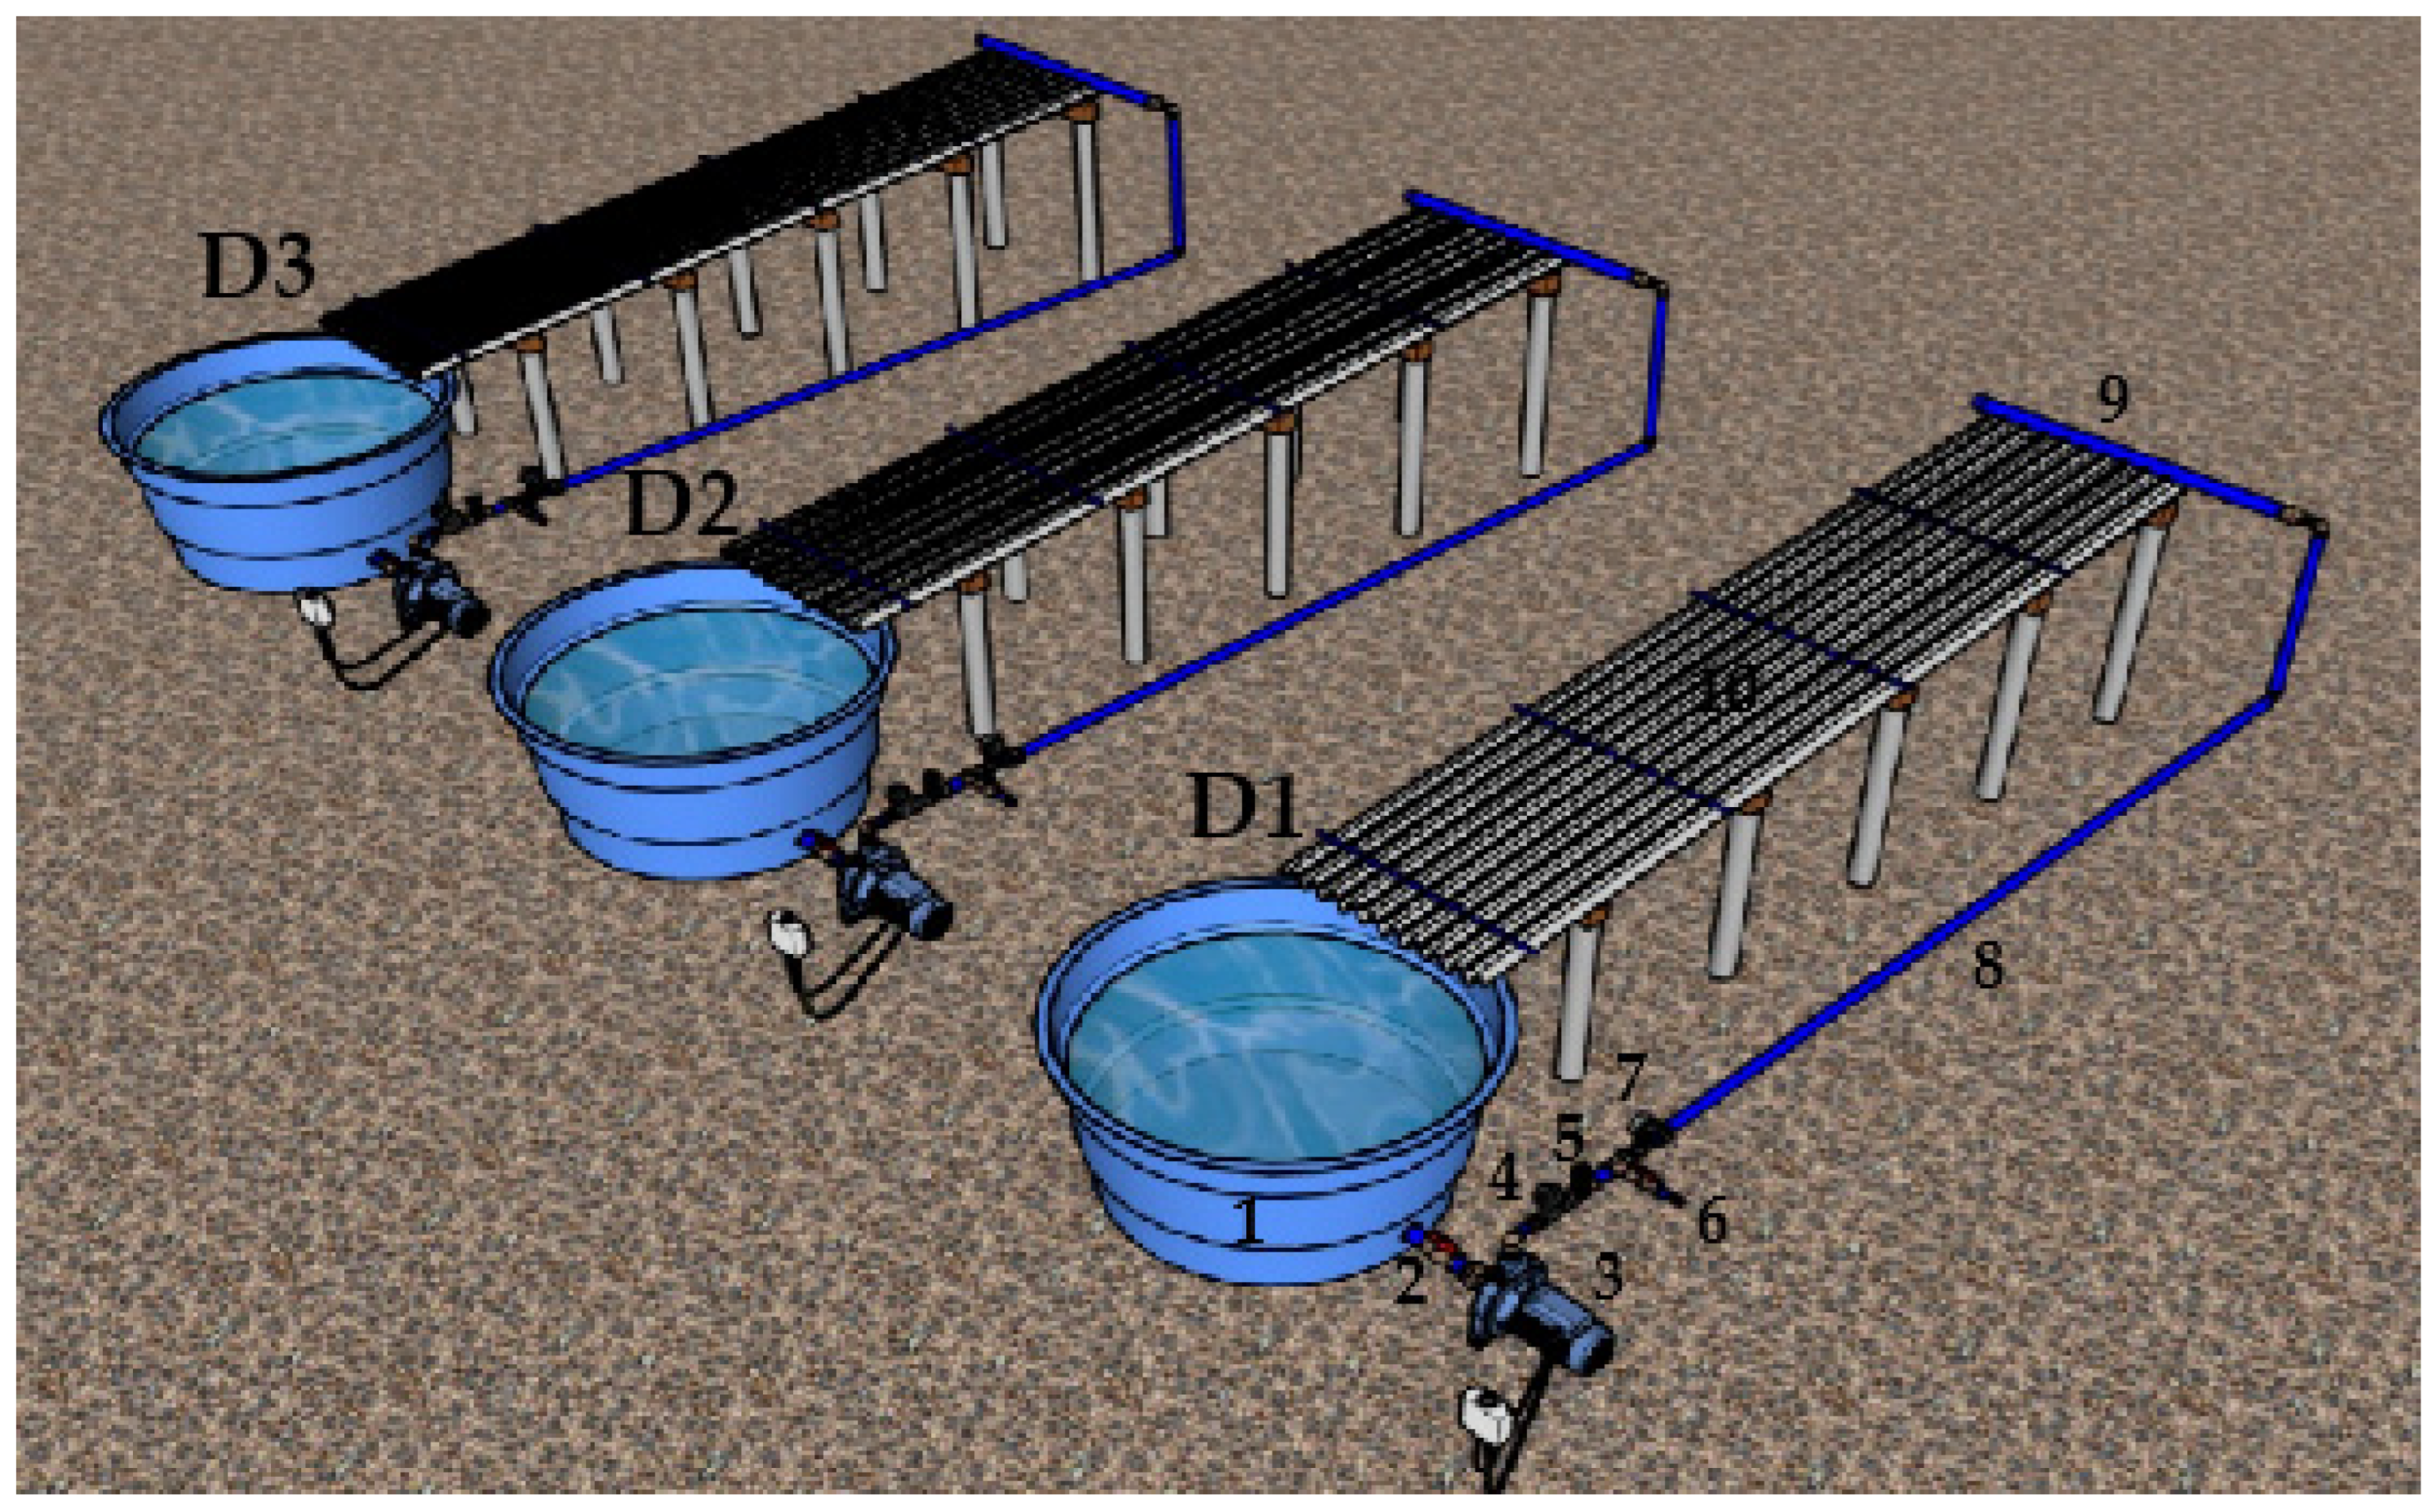
A completely randomized design with subdivided subplot layout and three replications was adopted for the experiment, using the following water sources: D1—100% fresh water (100% FW), D2—100% brackish water (100% BW), and D3—50% brackish water diluted in fresh water (50% FW + 50% BW). Three models of non-pressure-compensating drippers were used in the subplots: NJ, SL, and ST. In the sub-subplots, we set up nine evaluation times: 0, 20, 40, 60, 80, 100, 120, 140, and 160 h, as proposed by [
45,
46]. Non-self-compensating emitters are key devices in drip systems that apply small volumes of water at high frequencies, but their flow rate varies proportionally to the operating pressure. Unlike self-compensating emitters, they lack internal pressure compensation mechanisms, making them more sensitive to topographical and lateral line pressure variations, making them more suitable for flat terrain and projects with short piping runs [
20,
23,
27].
This irrigation system ran for 160 h, corresponding to a cycle of melon cultivation in the semi-arid region of Rio Grande do Norte State, Brazil. Working pressure was set at 80 kPa, a typical value used in drip irrigation systems in the semi-arid. Dripper discharge measurements were performed every 20 h, obtaining nine discharge evaluation times for each dripper model.
The hydraulic circuit consisted of three benches 1 m wide by 8 m long, with a surface area of 8.0 m
2 each. Each bench was made up of a plastic tank (0.31 m
3), a ball valve (32 mm), a motor pump (0.5 hp), a disc filter (130 μm), a 1″ drawer valve, a water sampling valve, an analog glycerin pressure gauge (0 to 400 kPa), a 10 m long main line (32 mm), a 1 m long branch line (50 mm) and nine 8 m long side lines (16 mm), with three lateral lines of each dripper model tested (
Figure 1).
We set a nominal diameter of the branch line (50 mm) higher than that of the main line (32 mm) to facilitate the insertion of the sealing rubbers and connectors, allowing proper fitting and sealing to prevent leakage.
Table 1 presents the hydraulic characteristics, dimensions, and images of the emitters and their respective labyrinths used in the experimental assays. ST and NJ emitters have a larger dimension in the orthogonal direction to the discharge pitch (1.21 mm) in relation to the SL emitter (1.05 mm). Similarly, the ST and NJ drippers have greater separation in the lower labyrinth wall: 0.89 and 0.96 mm, respectively. The SL emitter, on the other hand, has a dimension of 0.84 mm.
2.3. Average Discharge Rate, Image Generation and Classification, and Fractal Metrics
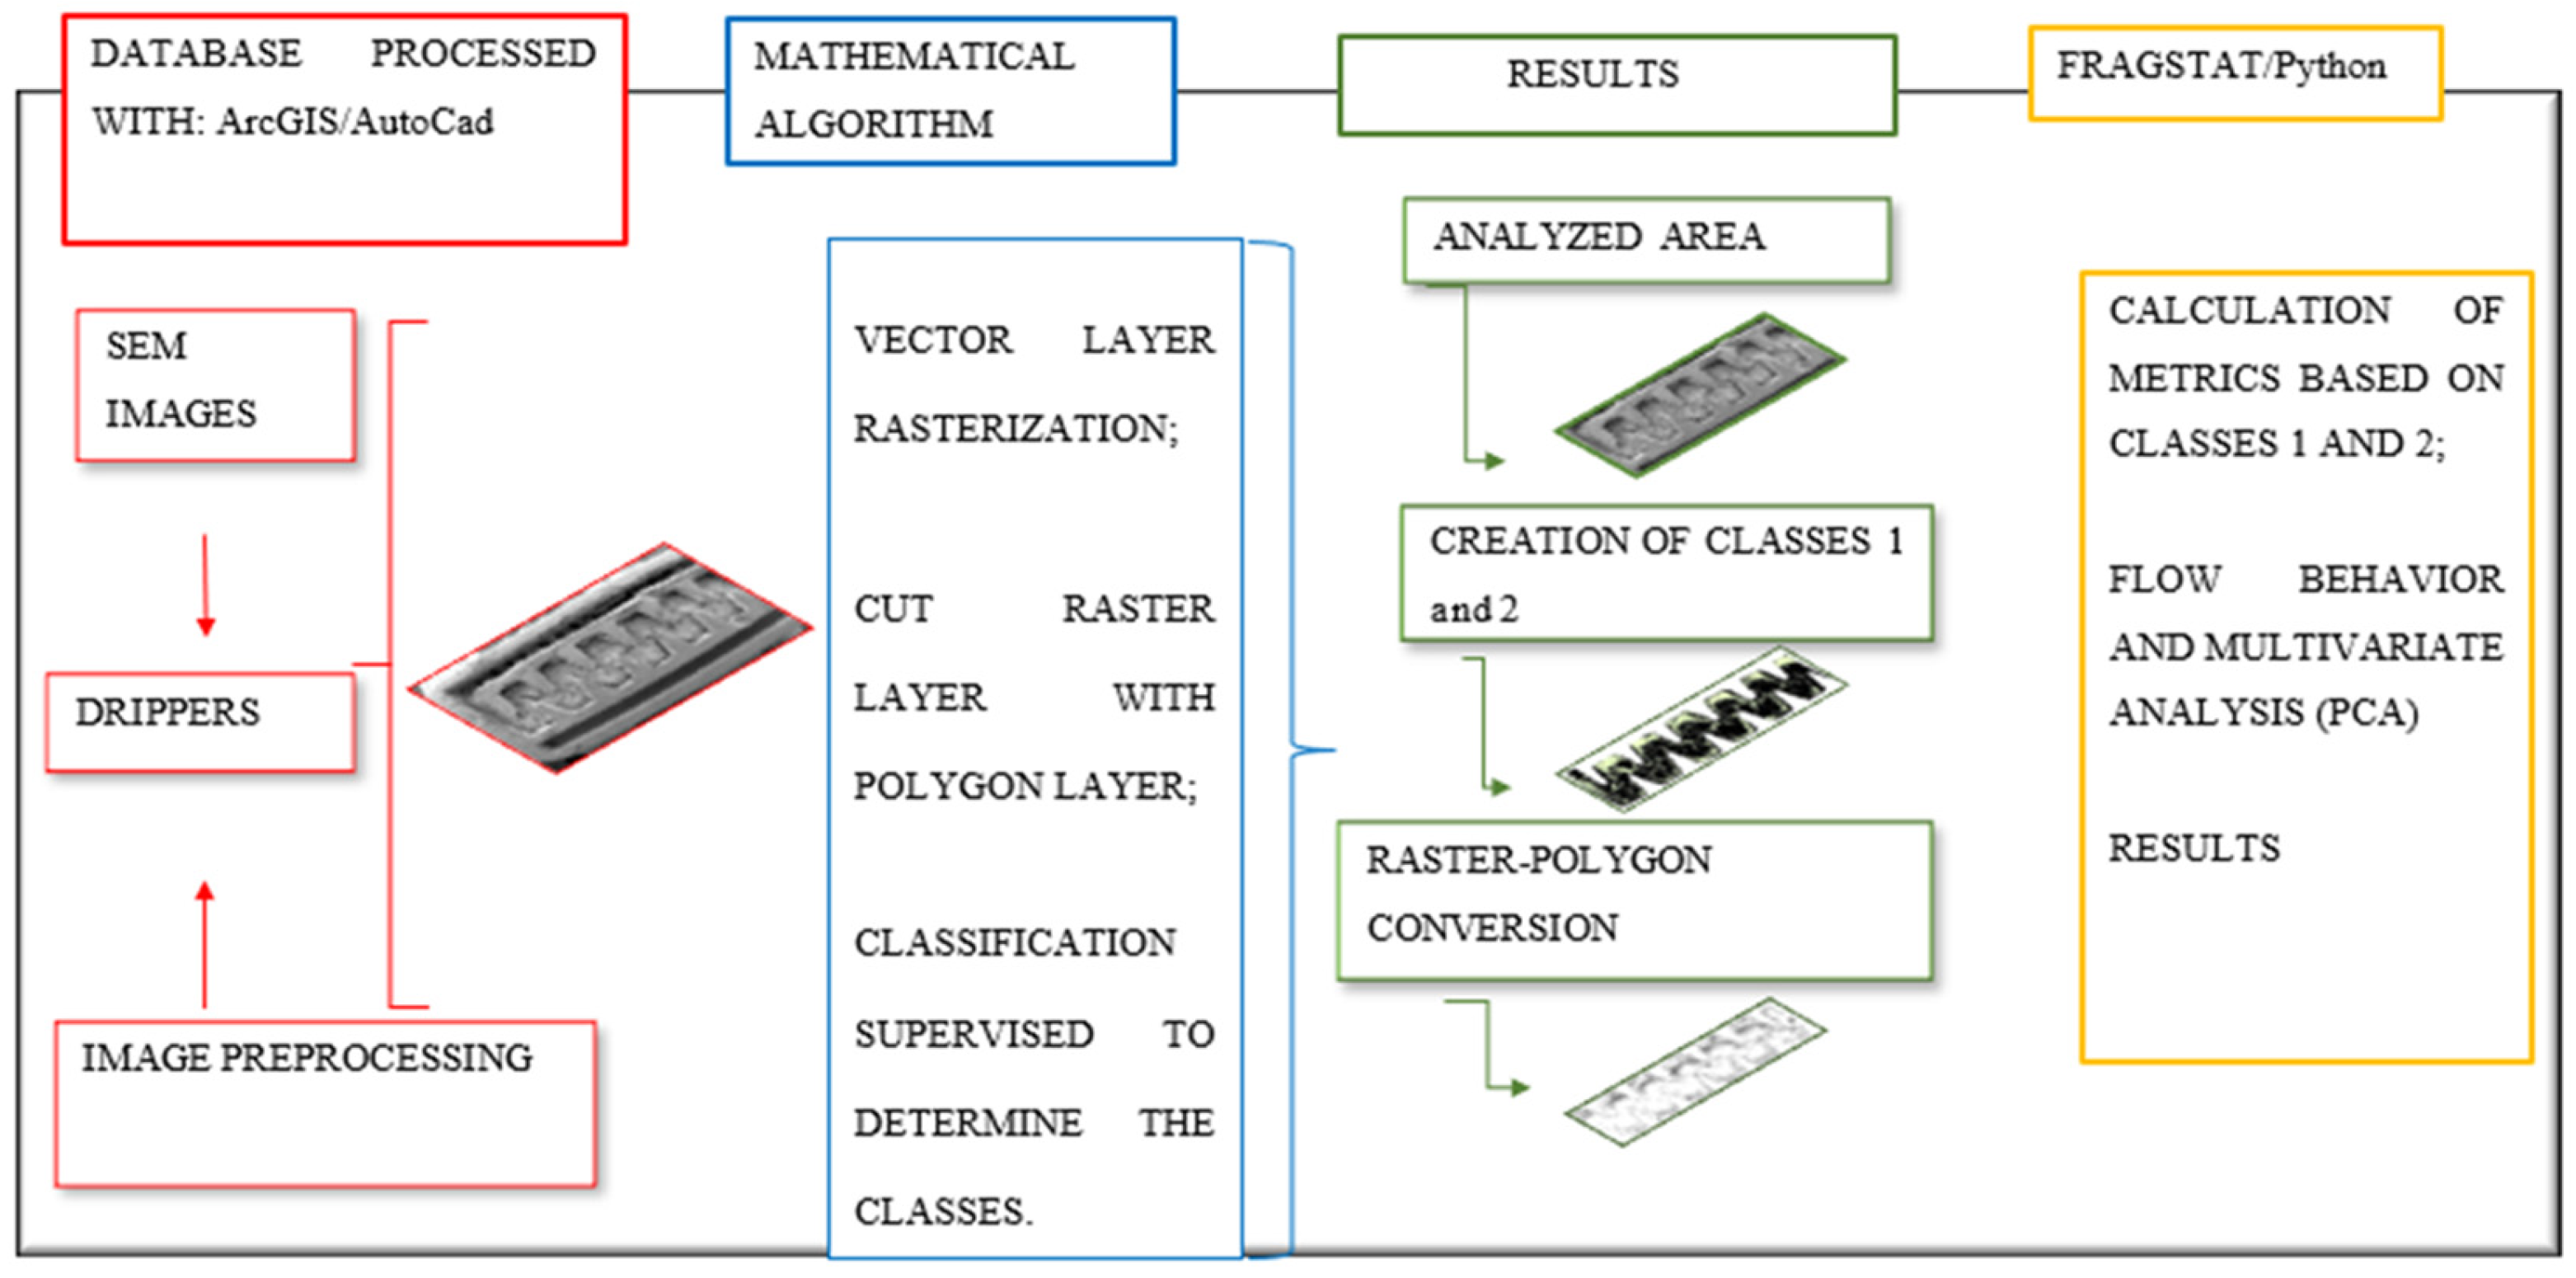
To analyze the reduction in average dripper discharge, the accumulation of material causing clogging inside the emitter and its relation with the water source and the emitter model used, we digitalized the internal part of the drippers as shown in
Figure 2.
2.3.1. Analysis of Average Dripper Discharge Rate and Clogging Detection
The experiment lasted 160 h. Every 20 h, the discharge of 16 emitters was measured in the 27 irrigation lines by collecting water at the emitter outlet in each lateral line for three minutes using 200 mL collection containers and 100 mL beakers with a 1 mL precision. Based on these data, we calculated the discharge rate according to Equation (3):
In which:
Q—Emitter discharge rate, L h−1;
V—Volume of water collected, mL; and
t—Collection time, minutes
Clogging detection through dripper discharge values was obtained by the discharge variation rate (Dra) criterion proposed by the American Society of Agricultural Engineers in 2003, where clogging occurs when the current dripper discharge is less than 75% of the initial discharge [
47].
2.3.2. Imaging Using Scanning Electron Microscopy (SEM)
At the end of the experiment (160 h), representative samples of emitters with biofouling from each experimental bench were collected in triplicate to obtain micrographs. To this end, the emitters were removed from the final third of the lateral lines, where there was the highest incidence of biofouling, and were then carefully dissected manually. Subsequently, the samples of emitters with biofouling of each water quality were left in a desiccator for 72 h to lose excess moisture.
Using high-resolution imaging as a tool to characterize, evaluate, diagnose, and even design organic and inorganic blocking agents in scenarios in which the capability of conventional microscopes is limited has been increasingly employed in many scientific fields. Scanning Electron Microscopy (SEM) stands out in this regard, whose operating principle is based on the emission of a small-diameter electron beam [
48]. In this study, SEM was used to obtain images of the surface of the material clogging the emitter labyrinths. For this purpose, after 160 h of operation, we opened the lateral lines of the drip units, selected obstructed drippers, and then dissected them.
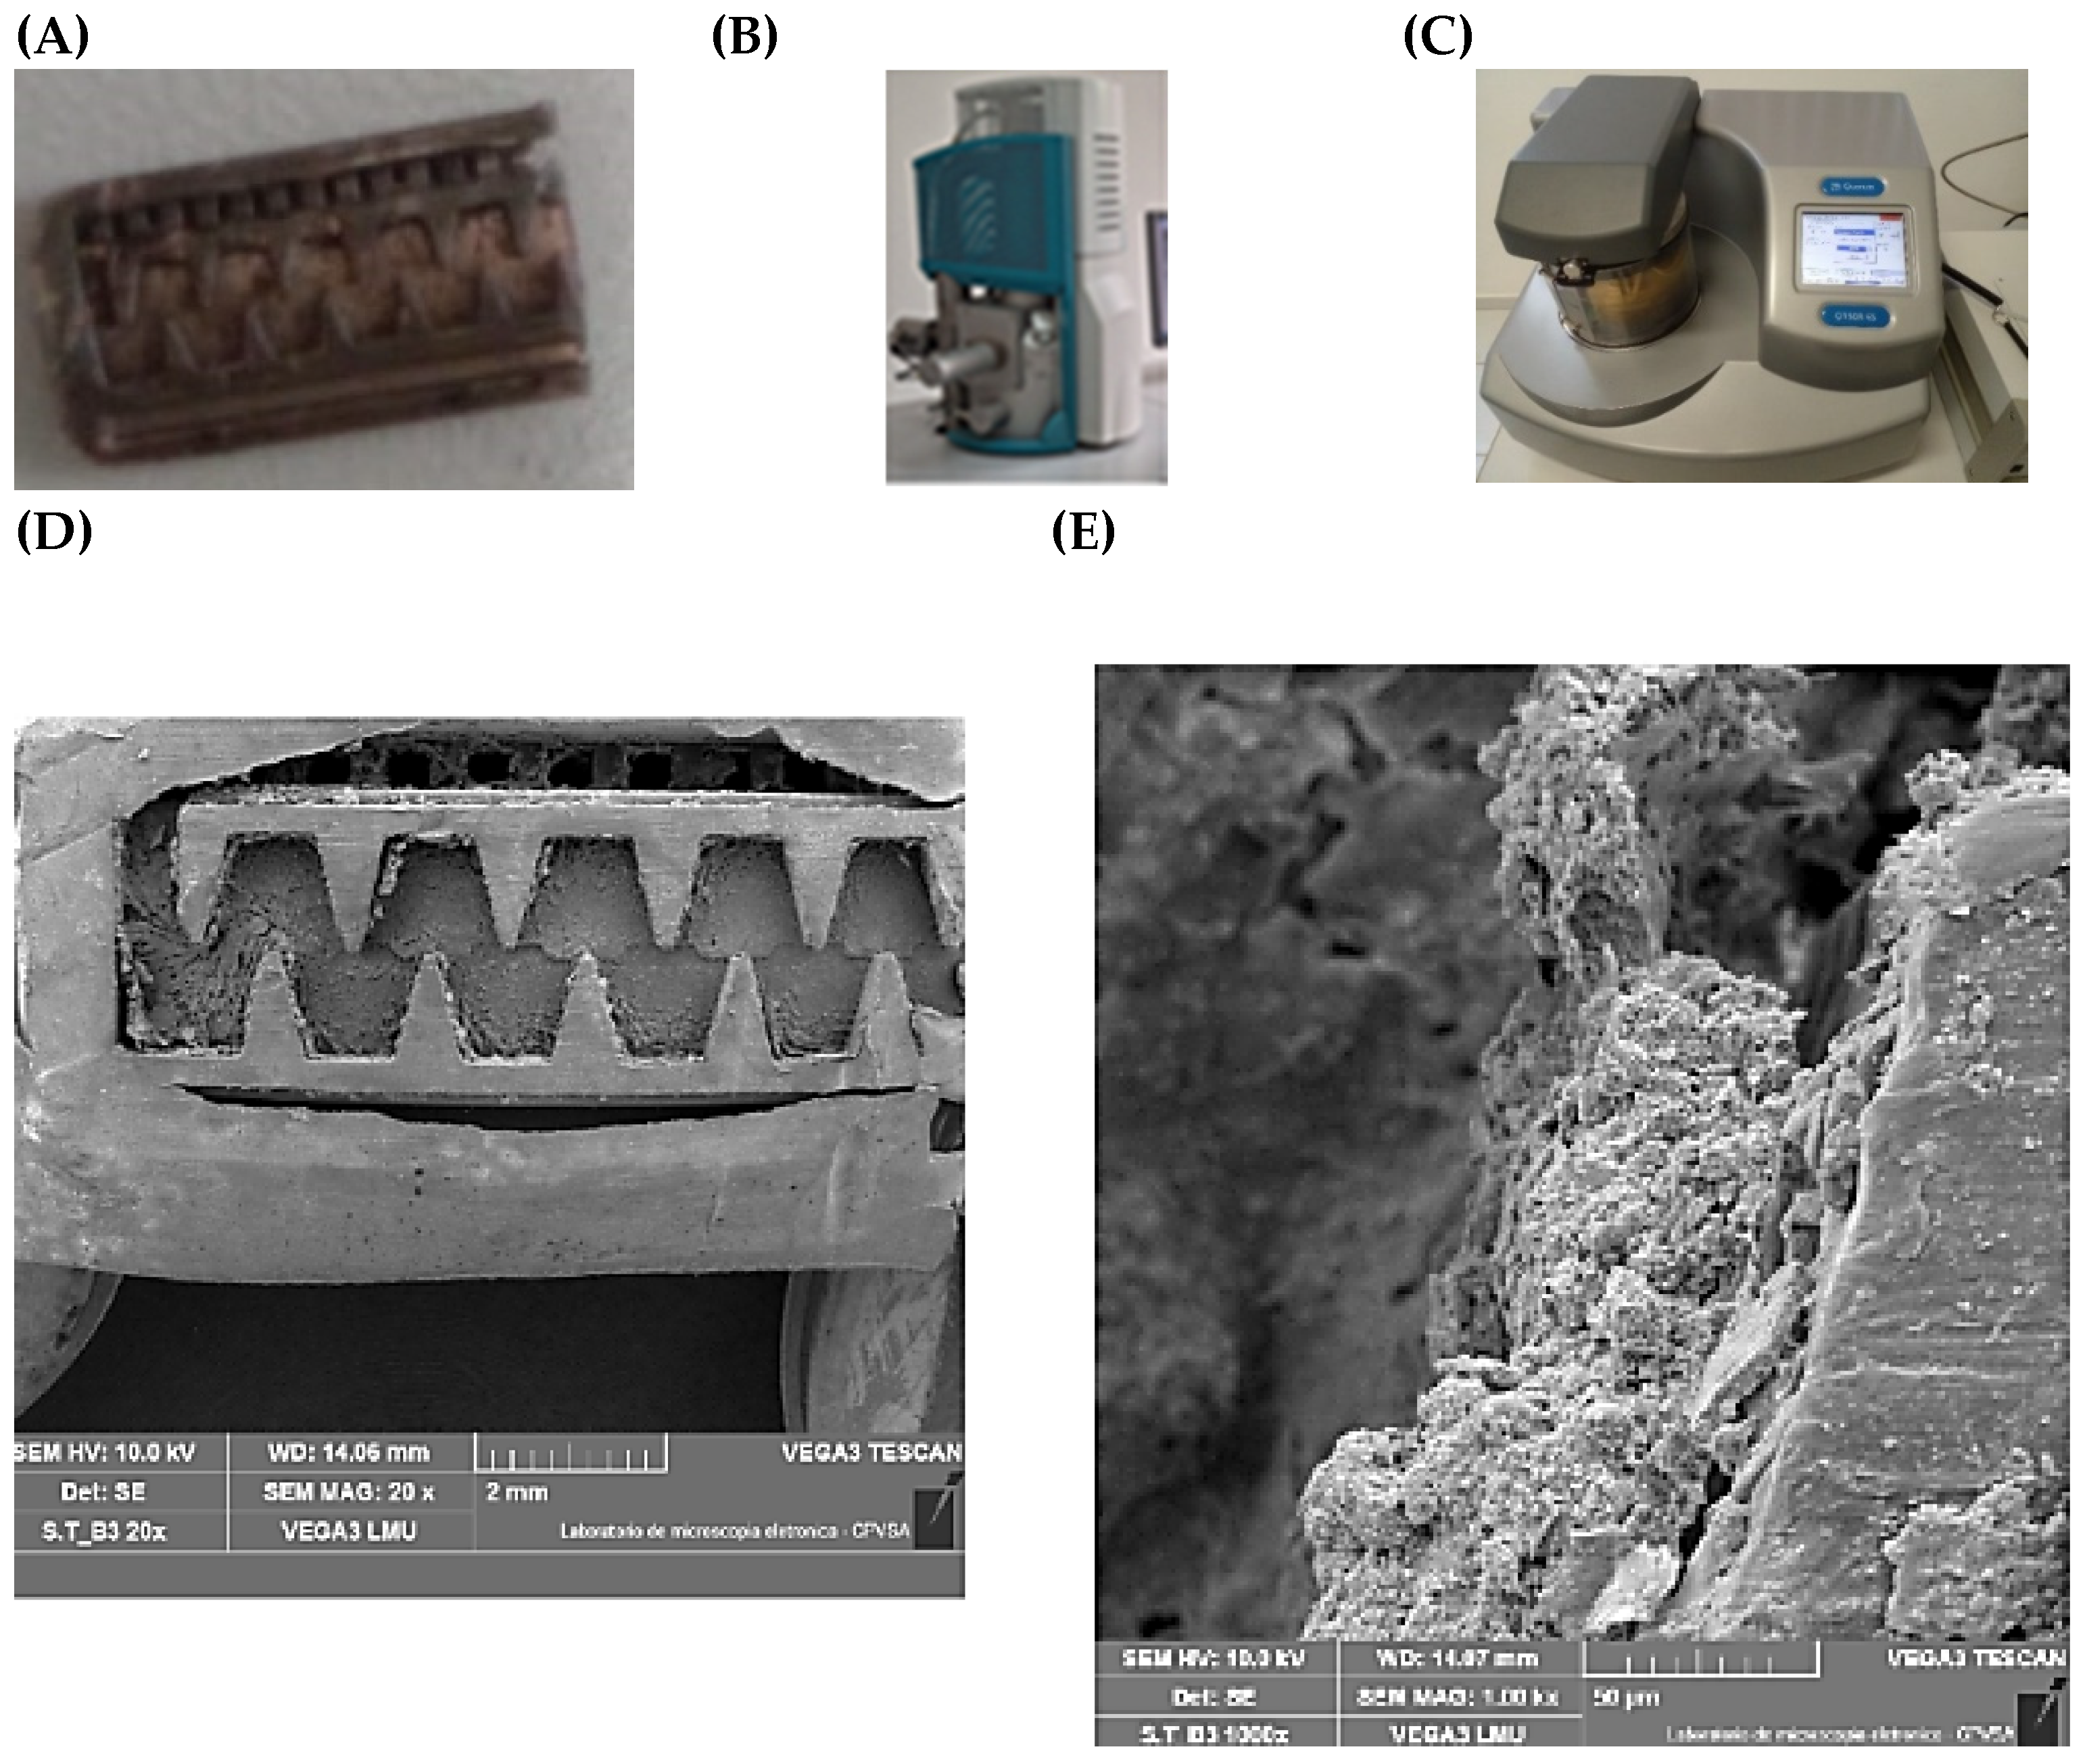
Samples from the clogged drippers were placed in a metal sample holder with conductive carbon tape (Ted Pella, Inc., PELCO Tabs™, Redding, CA, USA). As the samples are not conductive, a 9 nm thick layer of gold was applied using the metallizer (Quorum Technologies Ltd., Q150R ES, Laughton, UK), creating a conductive layer for a better dispersion of the electrons and quality of the images obtained. Subsequently, images of the dripper labyrinth were taken by a Scanning Electron Microscope (Tescan, Vega 3 LMU, Brno, Czech Republic) operating at 10 kV and using a secondary electron detector. A total of 45 images were recorded, corresponding to the three non-pressure-compensating dripper models of each bench. Images were obtained with magnifications set at 20×, 50×, 200×, 500×, and 1000×. At the highest magnification, we obtain the highest level of detail.
The SEM instrument used already has a minimum layer of 5 nm, but an additional 5 nm was subsequently added. Even so, electrons accumulated, so the layer was increased to a 9 nm layer to improve the biofouling coating. This prevented the sample’s conductivity from charging the electrons and prevented imaging. Because the biofouling on the emitters had low conductivity and the minerals were highly charged in the accumulated area, the gold coating thickness was increased.
Figure 3 shows the equipment used and the different magnifications of the produced images.
2.3.3. Classification Used for Image Pixels Processing
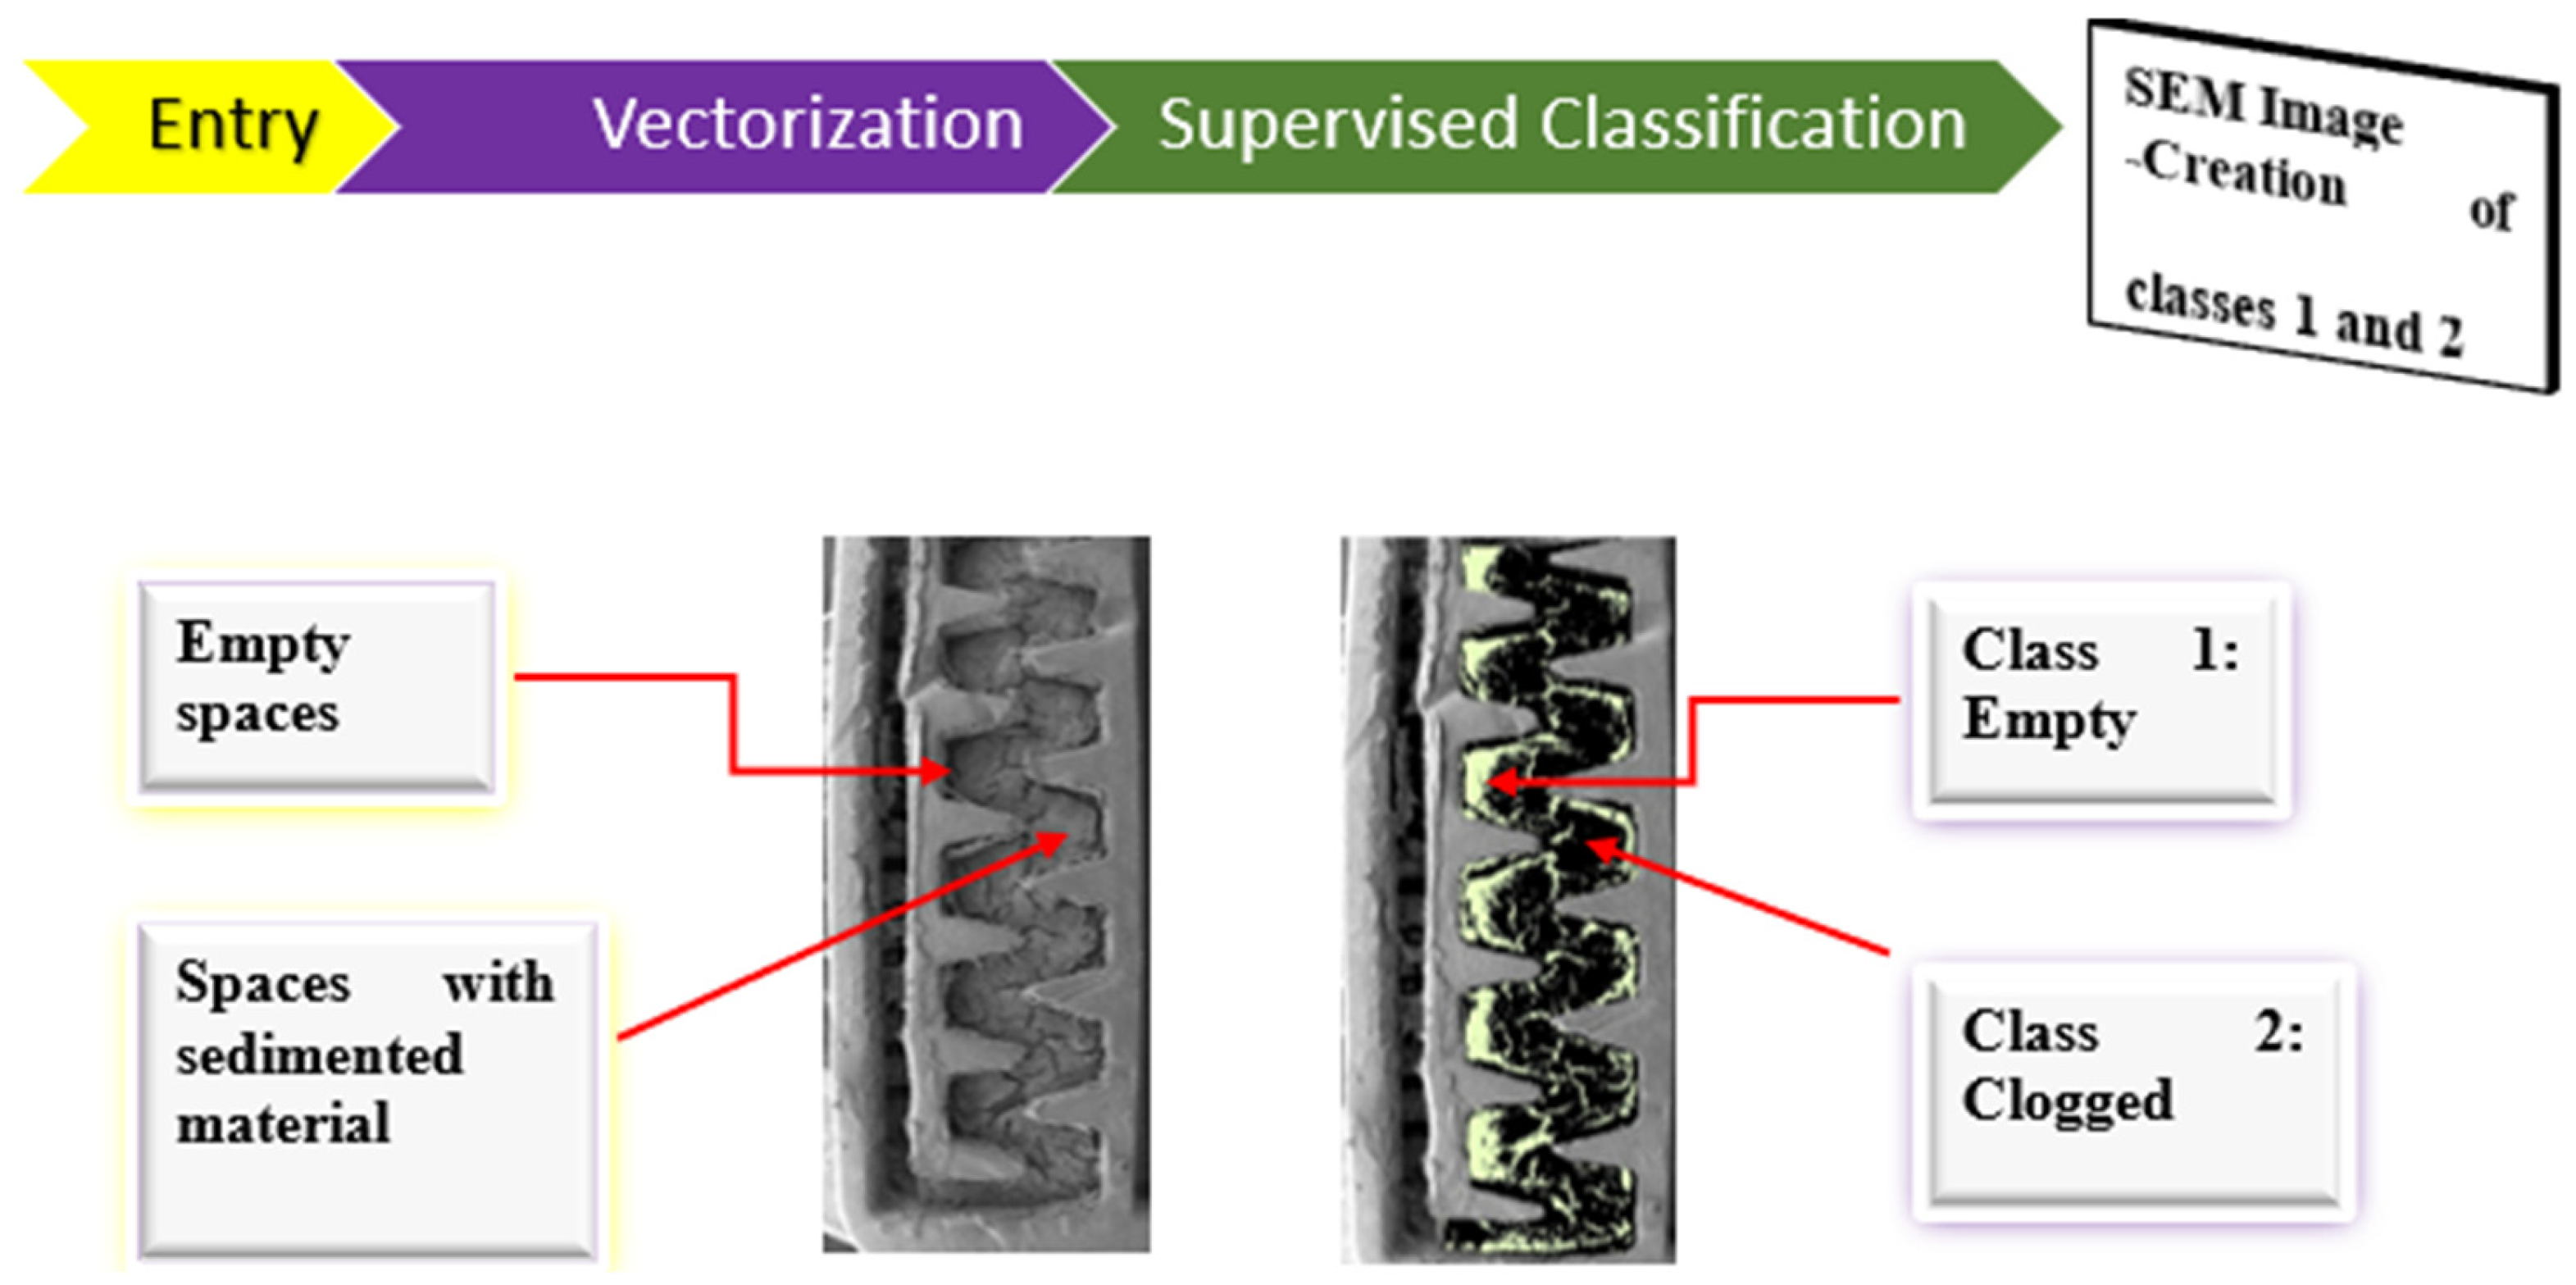
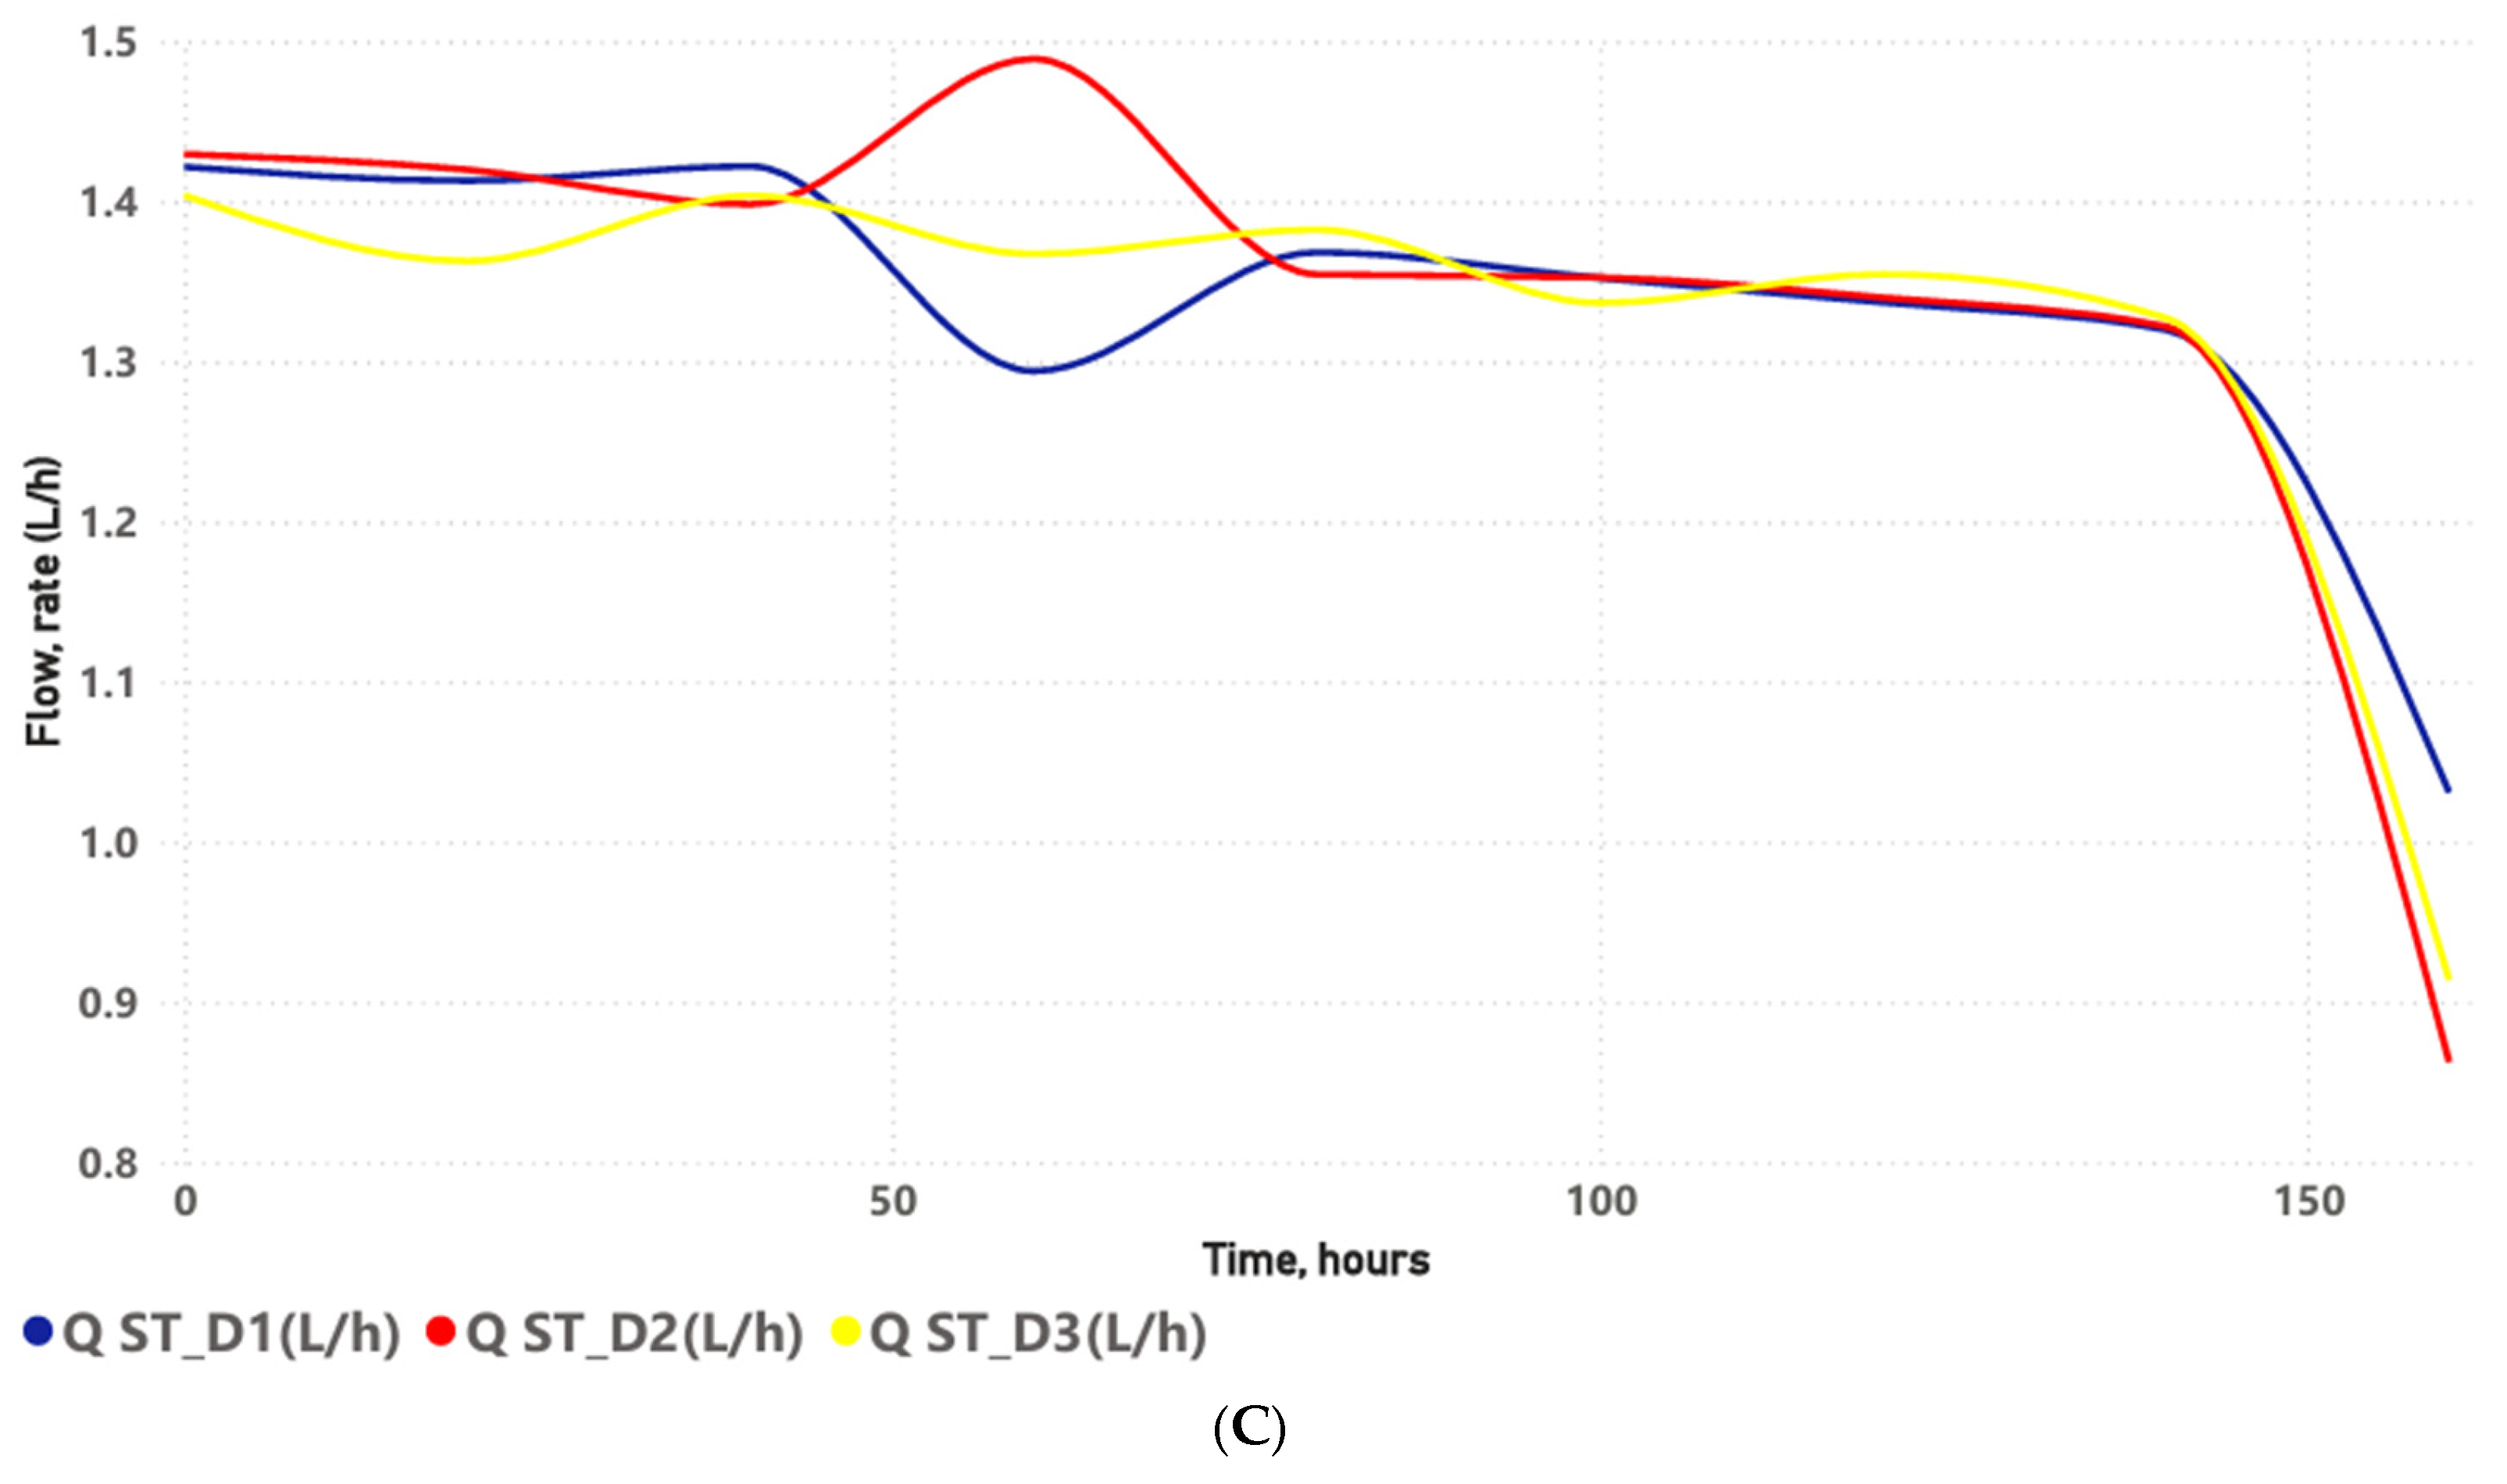
Supervised classification of the SEM images was performed using the Arcgis 10.3 program. Pixel classification aimed to assign to each cell in the study area a class predetermined by the user as follows: (A) Empty (class 1), in cases where spots are produced free of the clogging material; and (B) Clogged (class 2), when areas occupied by sedimented material are observed continuously.
With the information obtained from each class, we characterized the dynamics of dripper clogging.
Figure 4 shows the classes described.
Classes were created using the maximum likelihood estimation (MLE) method, using the ArcGis 10.3 program, which employs a training extension where the user obtains the multivariate statistics of each intended class. A map is then obtained that partitions the study area into the known classes, which correspond to training samples. These naturally occurring classes form spots, which can be statistically analyzed [
49].
MLE is performed based on two principles: (A) Bayes’ theorem; and (B) the assumption that class samples are normally distributed. If ci represents class i and v represents the vector of features extracted from the images, then, according to Bayes’ theorem, we have:
Vector of features v belongs to ci if the probability given by Equation (4) is the highest among all classes. Based on maximum likelihood, we obtain:
According to [
50], replacing (5) in (6), we have:
In which P(v|ci) is the probability of likelihood. In this study, the probability of both classes (class 1 and 2) is equal. Since v is normally distributed, P(v|ci) can be obtained using the following equation:
2.3.4. Fractal Metrics
For a group of sets of similar shapes in two-dimensional space, the perimeter ratio (L) and area (A) was as follows: ρ = L/√A if the set consists of equilateral circles, squares, and triangles, the ρ values are: 2√π, 4, and 6/31/4, respectively [
51]. Many methods have been developed to determine fractal dimensions (area/perimeter, box count, Kocak’s law, power spectrum), but most have practical or theoretical limitations [
30,
32,
33,
52]. In this study, FRAGSTAT 4.0 software was used to calculate the following fractal metrics of classes 1 and 2:
Number of Spots (NS): refers to the number of identified spots in a particular class;
Average Spot Area (ASA): the area corresponding to a set of spots identified and grouped into user-defined classes;
Fractal Shape Metric (SHAPE): the simplest and perhaps most direct measure of the complexity of form. Values equal to 1 indicate square-shaped particles. Values can increment without limit, indicating more irregular shapes. The SHAPE metric was calculated by the equation:
In which:
Pij—Perimeter of the spot ij, m; and
aij—Area of the spot ij, m2.
Related circumscribed circle (CIRCLE): it approaches 0 for circular particles and 1 for elongated and linear particles. The CIRCLE metric was calculated by the equation:
In which:
aij—Area of the spot ij, m2; and
aijs—Smallest circumscribed circle area around the spot, m2.
Occupancy percentage (PLAND): is the occupancy percentage of a given class. The PLAND metric was calculated as follows:
In which:
The subjectivity in distinguishing ‘empty’ (class 1) from ‘clogged’ (class 2) pixels in the SEM images was minimized by using a systematic, statistically grounded approach. Supervised classification was performed with the Maximum Likelihood Estimation (MLE) method in ArcGIS 10.3, which calculates the probability of each pixel belonging to a predefined class based on multivariate statistics from carefully selected training samples. This approach reduces reliance on manual judgment, ensuring that pixel assignments reflect measurable differences rather than personal interpretation.
Training samples were chosen to capture the full range of deposit patterns, including variations in density, emitter surface texture, and sediment morphology, so the classifier could reliably separate empty areas from clogged regions. The resulting maps were then quantitatively verified through fractal analysis using FRAGSTAT 4.0, which confirmed structural differences between classes 1 and 2.
To strengthen the analysis further, additional variables such as water quality (EC, TSS, TDS, SAR, Har), emitter characteristics (dimensions and hydraulic properties), and emitter operation time were incorporated through Principal Component Analysis (PCA). By combining high-resolution SEM imagery, statistical classification, and multivariate validation, the method provided a robust, reproducible way to distinguish empty and clogged areas while minimizing subjectivity in the pixel-based analysis.
2.4. Statistical Analysis
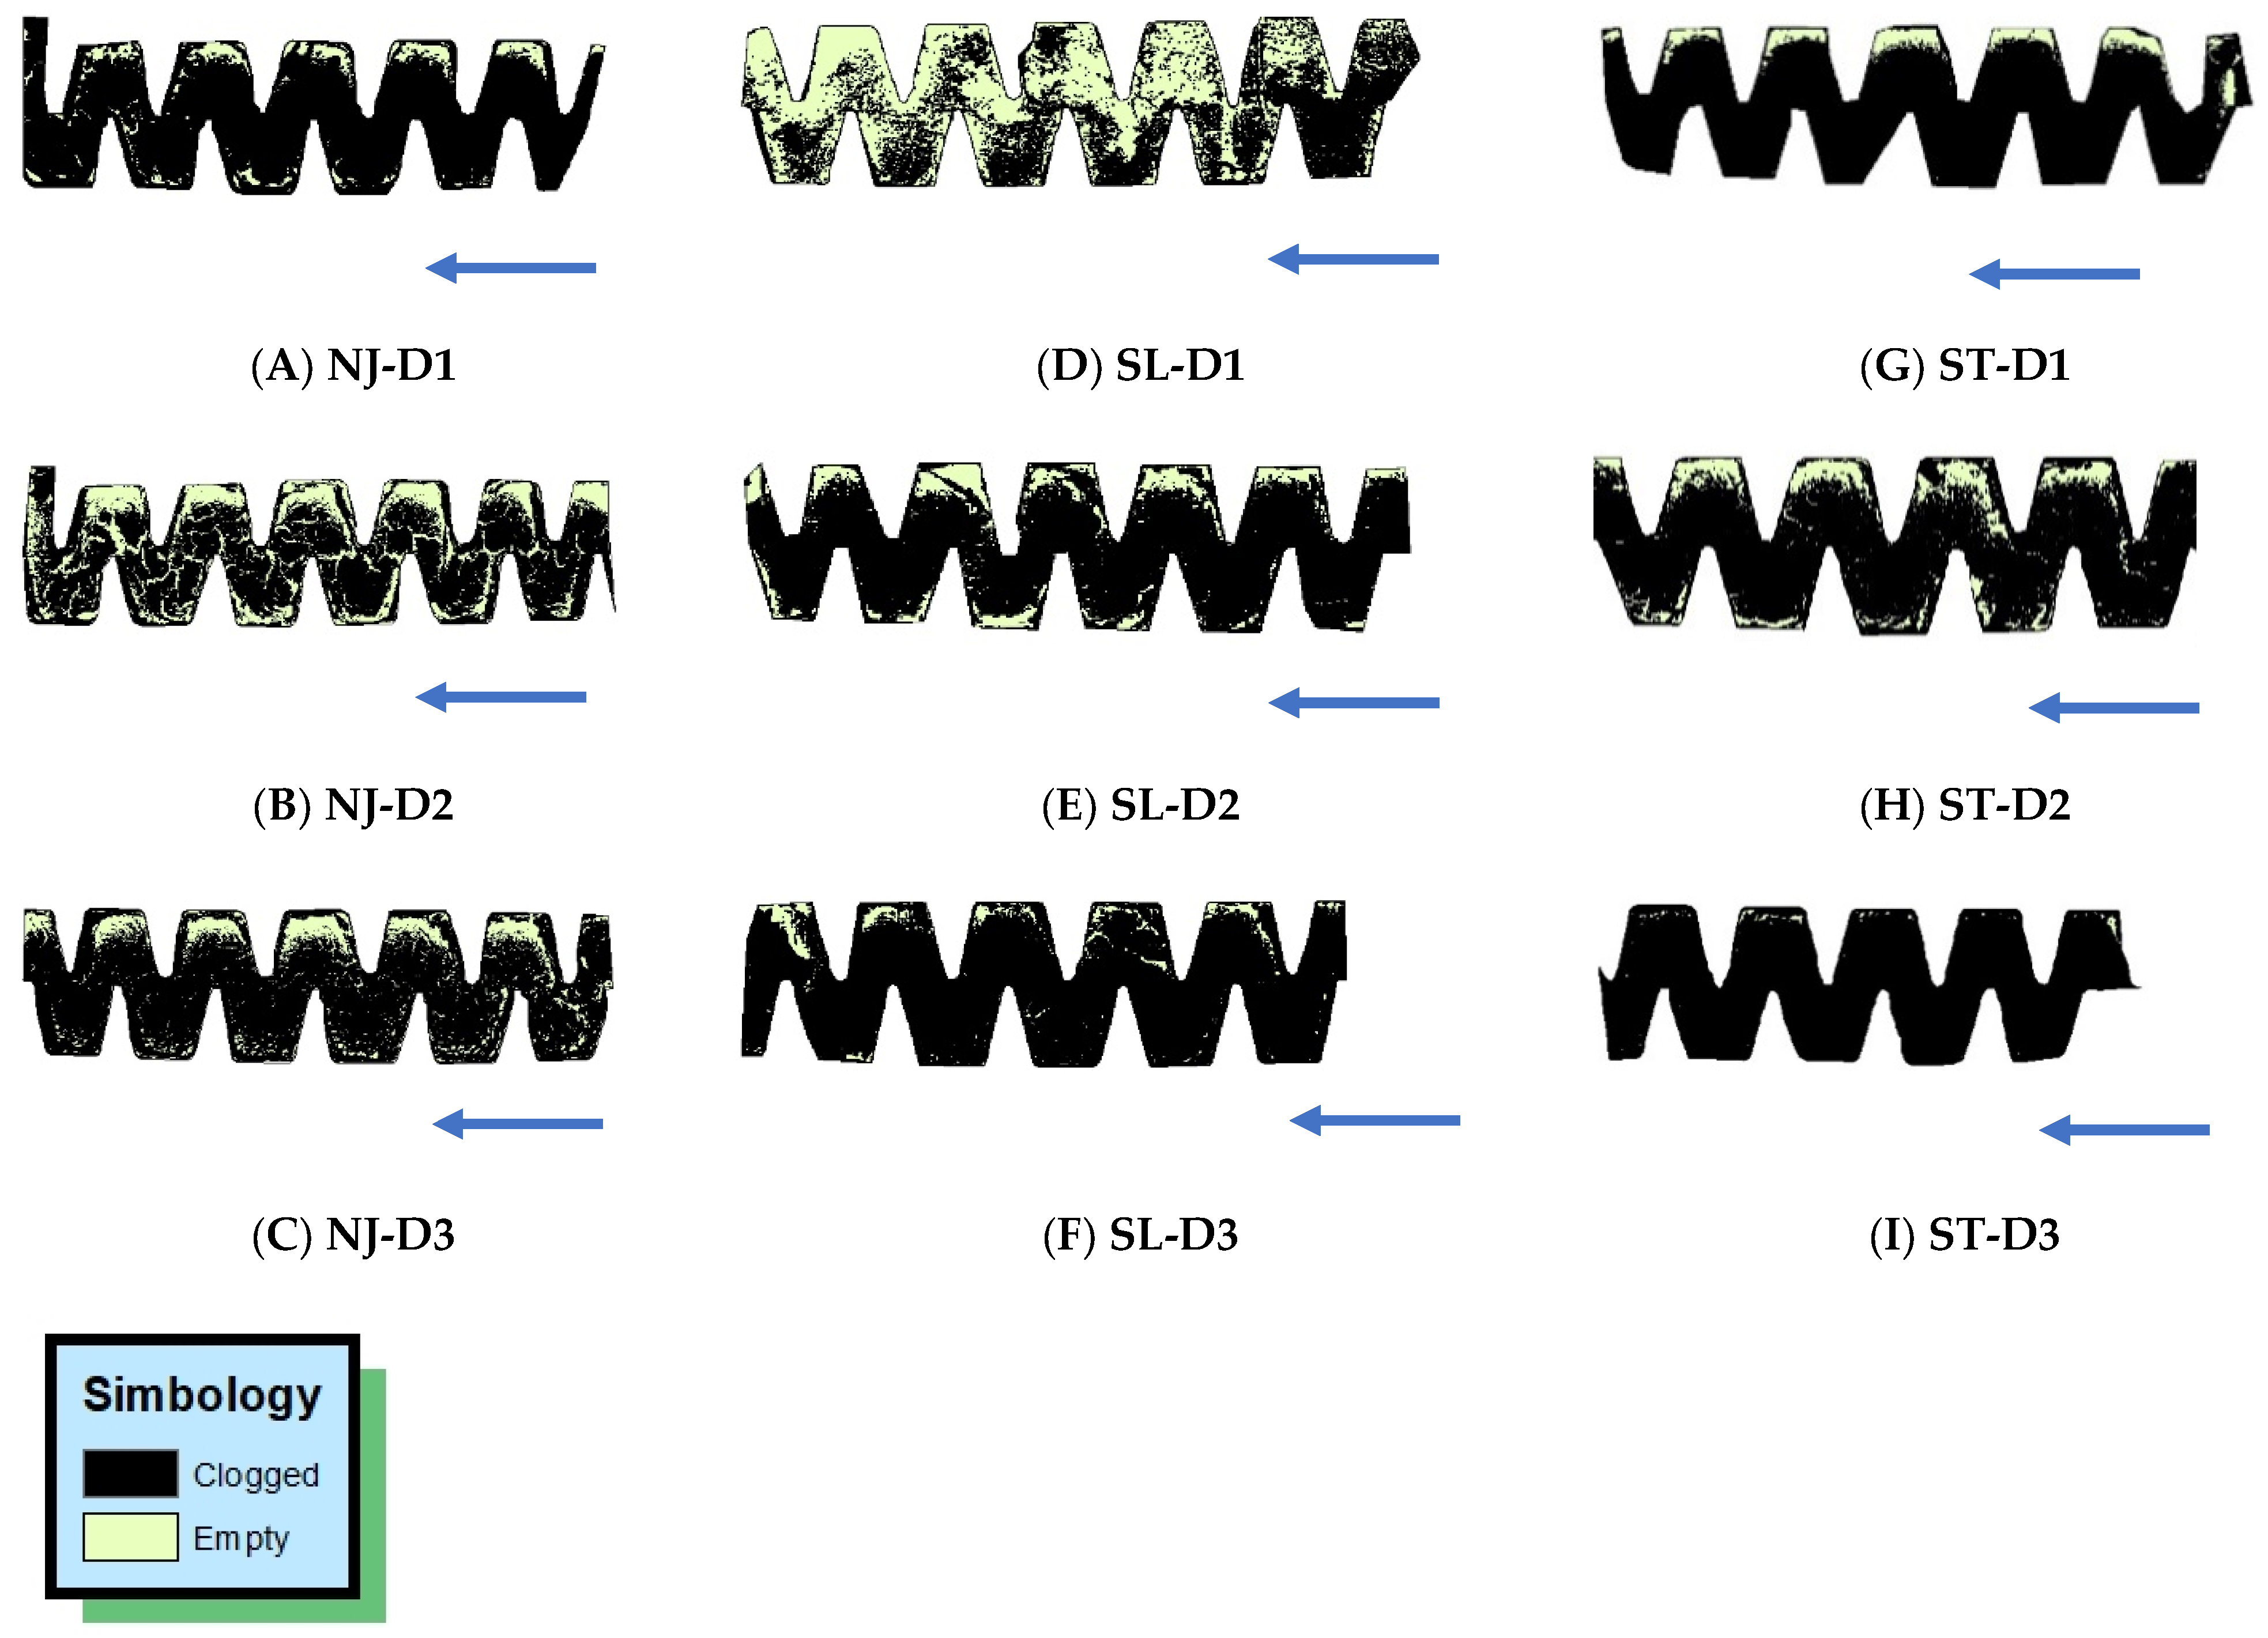
Multivariate statistical analysis was applied using Pearson’s correlation matrix, followed by factor analysis (FA) and principal component analysis (PCA), following the recommendations of [
53]. Statistical analysis considered the following variables: water source, dripper model, number of class 2 spots, average area of class 2 spots, average area of class 1 spots, class 1 PLAND metric, and average dripper discharge rates.
Pearson’s correlation matrix was applied to obtain a possible correlation between the variables, in which r-values of −1 and +1 show greater correlation between variables, whereas values close to zero indicate no correlation between the two variables analyzed [
54]. Pearson’s correlation matrix was obtained using the open-source statistical package Python 3.0 [
55,
56].
Table 2 shows the classification of the correlation coefficient (r) proposed by [
57].
Next, we proceeded with the FA, where the factor axes were rotated using the standardized Varimax method, considering factor loadings ≥ 0.70 significant for interpretation purposes. Varimax (orthogonal) rotation was used because the factors represent independent dimensions, the existence of separate groups in the biplots, clear dimensional reduction with easy scientific interpretation, without the need to allow correlation between factors.
PCA aims to extract important data information, represent it as a set of new variables called principal components, and present the pattern of similarity of observations and variables as points on a graph [
53], allowing for understanding which variables influenced the change in average discharge of the drip units supplied with saline water.
All FA and PCA analyses used their own code with open-source language Python 3.12 and Statistica® 14. For this purpose, the following Python statistical packages were used: import pandas as pd, import numpy as np, import seaborn as sns, from sklearn.decomposition import PCA, from sklearn import preprocessing, from sklearn.datasets import load_iris, import scipy.stats as stats, from factor_analyzer import Factor_Analyzer, from pca import pca, import matplotlib.pyplot as plt, and from mpl_toolkits import mplot3d.
The pandasn numpy, seaborn, matplotlib, and mpl_toolkits packages provide data structures in a fast, flexible, and expressive way, thus being able to store and manipulate data. These modules were also used for data manipulation, cleaning, analysis and visualization, allowing to detect missing values; to perform exploratory analyses using descriptive statistics (mean, median, standard deviation); to normalize data; to perform time series analysis; as well as to combine datasets, merging different values based on common columns or indexes; to improve data visualization and clarity of the complex statistical analyses obtained.
In turn, the sklearn.decomposition, scipy.stats, factor_analyzer, and pca packages are highly efficient for performing various types of data analysis, especially when dealing with high-dimensional data. These packages were used to calculate the correlation matrix, plot the scree plot, and visualize the eigenvalues of the PCA to perform the dimensional reduction, as well as to calculate Barlett’s sphericity and the Kaiser-Meyer-Olkin (KMO) test.
KMO values higher than 0.8 can be considered good, indicating that PCA will be useful for the variables studied. KMO values below 0.5 require corrective measures, either by eliminating uncorrelated variables or by including other variables [
58]. Bartlett’s sphericity test allows us to analyze the hypothesis that the correlation matrix is an identity matrix, which would indicate that the variables are not related and, therefore, unsuitable for detecting the structure.
PCA related the variables average dripper discharge, water salinity levels, and emitter models with the following fractal metrics: (A) Number of class 2 stains; (B) Average areas of spots (class 1 and 2); and (C) Occupancy percentage/PLAND (class 1). PCA considered eigenvalues equal to or greater than 1, as well as total accumulated variances equal to or greater than 70% [
54].
4. Discussion
4.1. Assessment of Water Quality for Irrigation Purposes
According to these, the pH value ranged from 7.9 to 9.1 [
59] state that pH values above 8 increase the probability of dripper clogging by providing precipitation of salts, oxides, and hydroxides, such as calcium carbonate, iron, and manganese oxides and hydroxides [
23]. During the experiment, the pH of the highly saline waters was higher than 8.0, indicating a severe risk of dripper clogging, according to [
25], except at 160 h in treatments D2 and D3, where the risk of emitter clogging was moderate in relation to pH. The pH values in the present study differ from the range of 8.43 to 8.97 found by [
46] in groundwater.
EC ranged from 0.60 to 5.5 dS m
−1, with the highest values occurring in waters with salinity levels D2 and D3, which correspond to treatments where brackish water was used. The EC values observed in this intensive study of the results of [
46]—0.64 to 0.80 dS m
−1 and by [
45]—0.72 and 0.75 dS m
−1—both in studies with treated petroleum-produced water. As for the risk of dripper clogging, CE represents: (A) severe risk for D3 (EC > 4.5 dS m
−1); (B) moderate risk for D2 (1.0 ≤ EC ≤ 4.5 dS m
−1); and (C) lower risk for D1 (EC < 1.0 dS m
−1) [
60].
Waters with salinity levels D2 and D3 showed high levels of calcium and magnesium compared with the control treatment (D1). According to Liu et al. (2023) [
36], at high concentrations of calcium and magnesium, we can obtain significant correlations between the concentration of these ions, pH, and organic and inorganic fouling in drippers that apply brackish water.
K
+ ion levels were higher in treatments D3 than in treatments D1 and D2 due to the input of K
+ from the well water, which can influence the formation of precipitates in drippers, leading to clogging problems [
61]. Phosphate fertilizers with the presence of potassium, such as monobasic potassium phosphate and monopotassium phosphate, can aggravate emitter clogging [
59]. In a study with fertilizers, ref. [
63] found that the use of potassium chloride in fertigation, both in self-compensating and non-pressure-compensating drippers, resulted in different clogging levels.
In analyzing the three levels of salinity, we observed that Na
+ and Cl
− concentrations oscillated from 98.85 to 811.55 mg L
−1 and from 85.09 to 2020.82 mg L
−1, respectively, suggesting that sodium chloride and Na
+ are present among the chemical clogging of drippers supplied with saline water [
64]. In addition to Cl
− ion being associated with soil salinity, when water with high Cl
− concentrations is used for irrigation, from the point of view of plant toxicity, the resulting Cl
− values indicate a severe degree of surface irrigation restriction in treatments D2 and D3, that is, Cl
− > 354.53 mg L
−1 [
61].
The higher values of EC, Ca
2+, Mg
2+, HCO
3−, and CO
32− observed in BW were probably essential for the formation of calcium carbonate precipitates in the dripper labyrinth [
22], thus aggravating emitter clogging when BW was applied. Corroborating our results, ref. [
62] observed that Ca
2+ played a major role in clogging drippers that applied diluted landfill leachate. Similar results were also reported by [
65], who found that Mg
2+ is a relevant element in dripper clogging.
High concentrations of bicarbonate (HCO
3−) in water increase the risk of calcium carbonate fouling formation when pH is higher than 7.5 and HCO
3− content greater than 304.94 mg L
−1 [
61]. In the present study, this condition was observed only at the beginning of the assays with 100% BW (D3). Decreased concentration of HCO
3− in water can be explained by the conversion of this ion into CO
32−, which tends to precipitate with Ca
2+, forming CaCO
3, a salt commonly found in dripper labyrinths operating with saline waters [
22].
Importantly, total suspended solids (TSS) levels did not exceed the limit of 50 mg L
−1 proposed by [
25] in the three waters evaluated, indicating a low risk of dripper clogging.
Regarding hardness, values greater than 300 mg L
−1 indicate risk of severe emitter clogging [
22], which may also explain the higher levels of clogging observed in D2 and D3 treatments. According to [
65] criterion, the risk of clogging caused by hardness in our study was classified as low in the control treatment (D1) and severe in the treatments with higher salinity levels (D2 and D3).
Higher concentrations of total dissolved solids (TDS) were observed by the end of the experiment (160 h). TDS concentration in D3 was 4475 mg L
−1, much higher than that observed in the control group (108 mg L
−1). TDS-related risk of clogging increased with operating time and an increase in salinity, and was classified as low, moderate, and severe at 160 h in treatments D1, D2, and D3, respectively [
25].
Sodium adsorption ratio (SAR) had the highest value in the control treatment (D1) at 160 h. However, when analyzing the value of SAR and EC in treatment D1 at 160 h together, the risk of reducing water infiltration into the soil was classified as low to moderate [
61], even though SAR presented the highest value.
4.2. Dripper Discharge Behavior (Average Discharge Rates) and Clog Detection
This study was conducted over a 160 h experimental period, sufficient time for the drip irrigation system, under open-air experimental bench conditions, to develop a level of clogging that could alter emitter flow rate and system efficiency. In the semiarid region of Rio Grande do Norte, this experimental period is equivalent to a melon cycle. However, the drip tapes in the irrigation systems are replaced every two to three 160 h cycles, where clogging levels differ from those obtained under experimental bench conditions. Therefore, this study performs an open-air experimental bench simulation with three water qualities commonly used for irrigating agricultural crops in the semi-arid region of Rio Grande do Norte. Clogging levels can differ from those obtained under real field conditions. Nevertheless, experimental bench tests allow for rapid and low-cost information on clogging sustainability, which can improve emitter design.
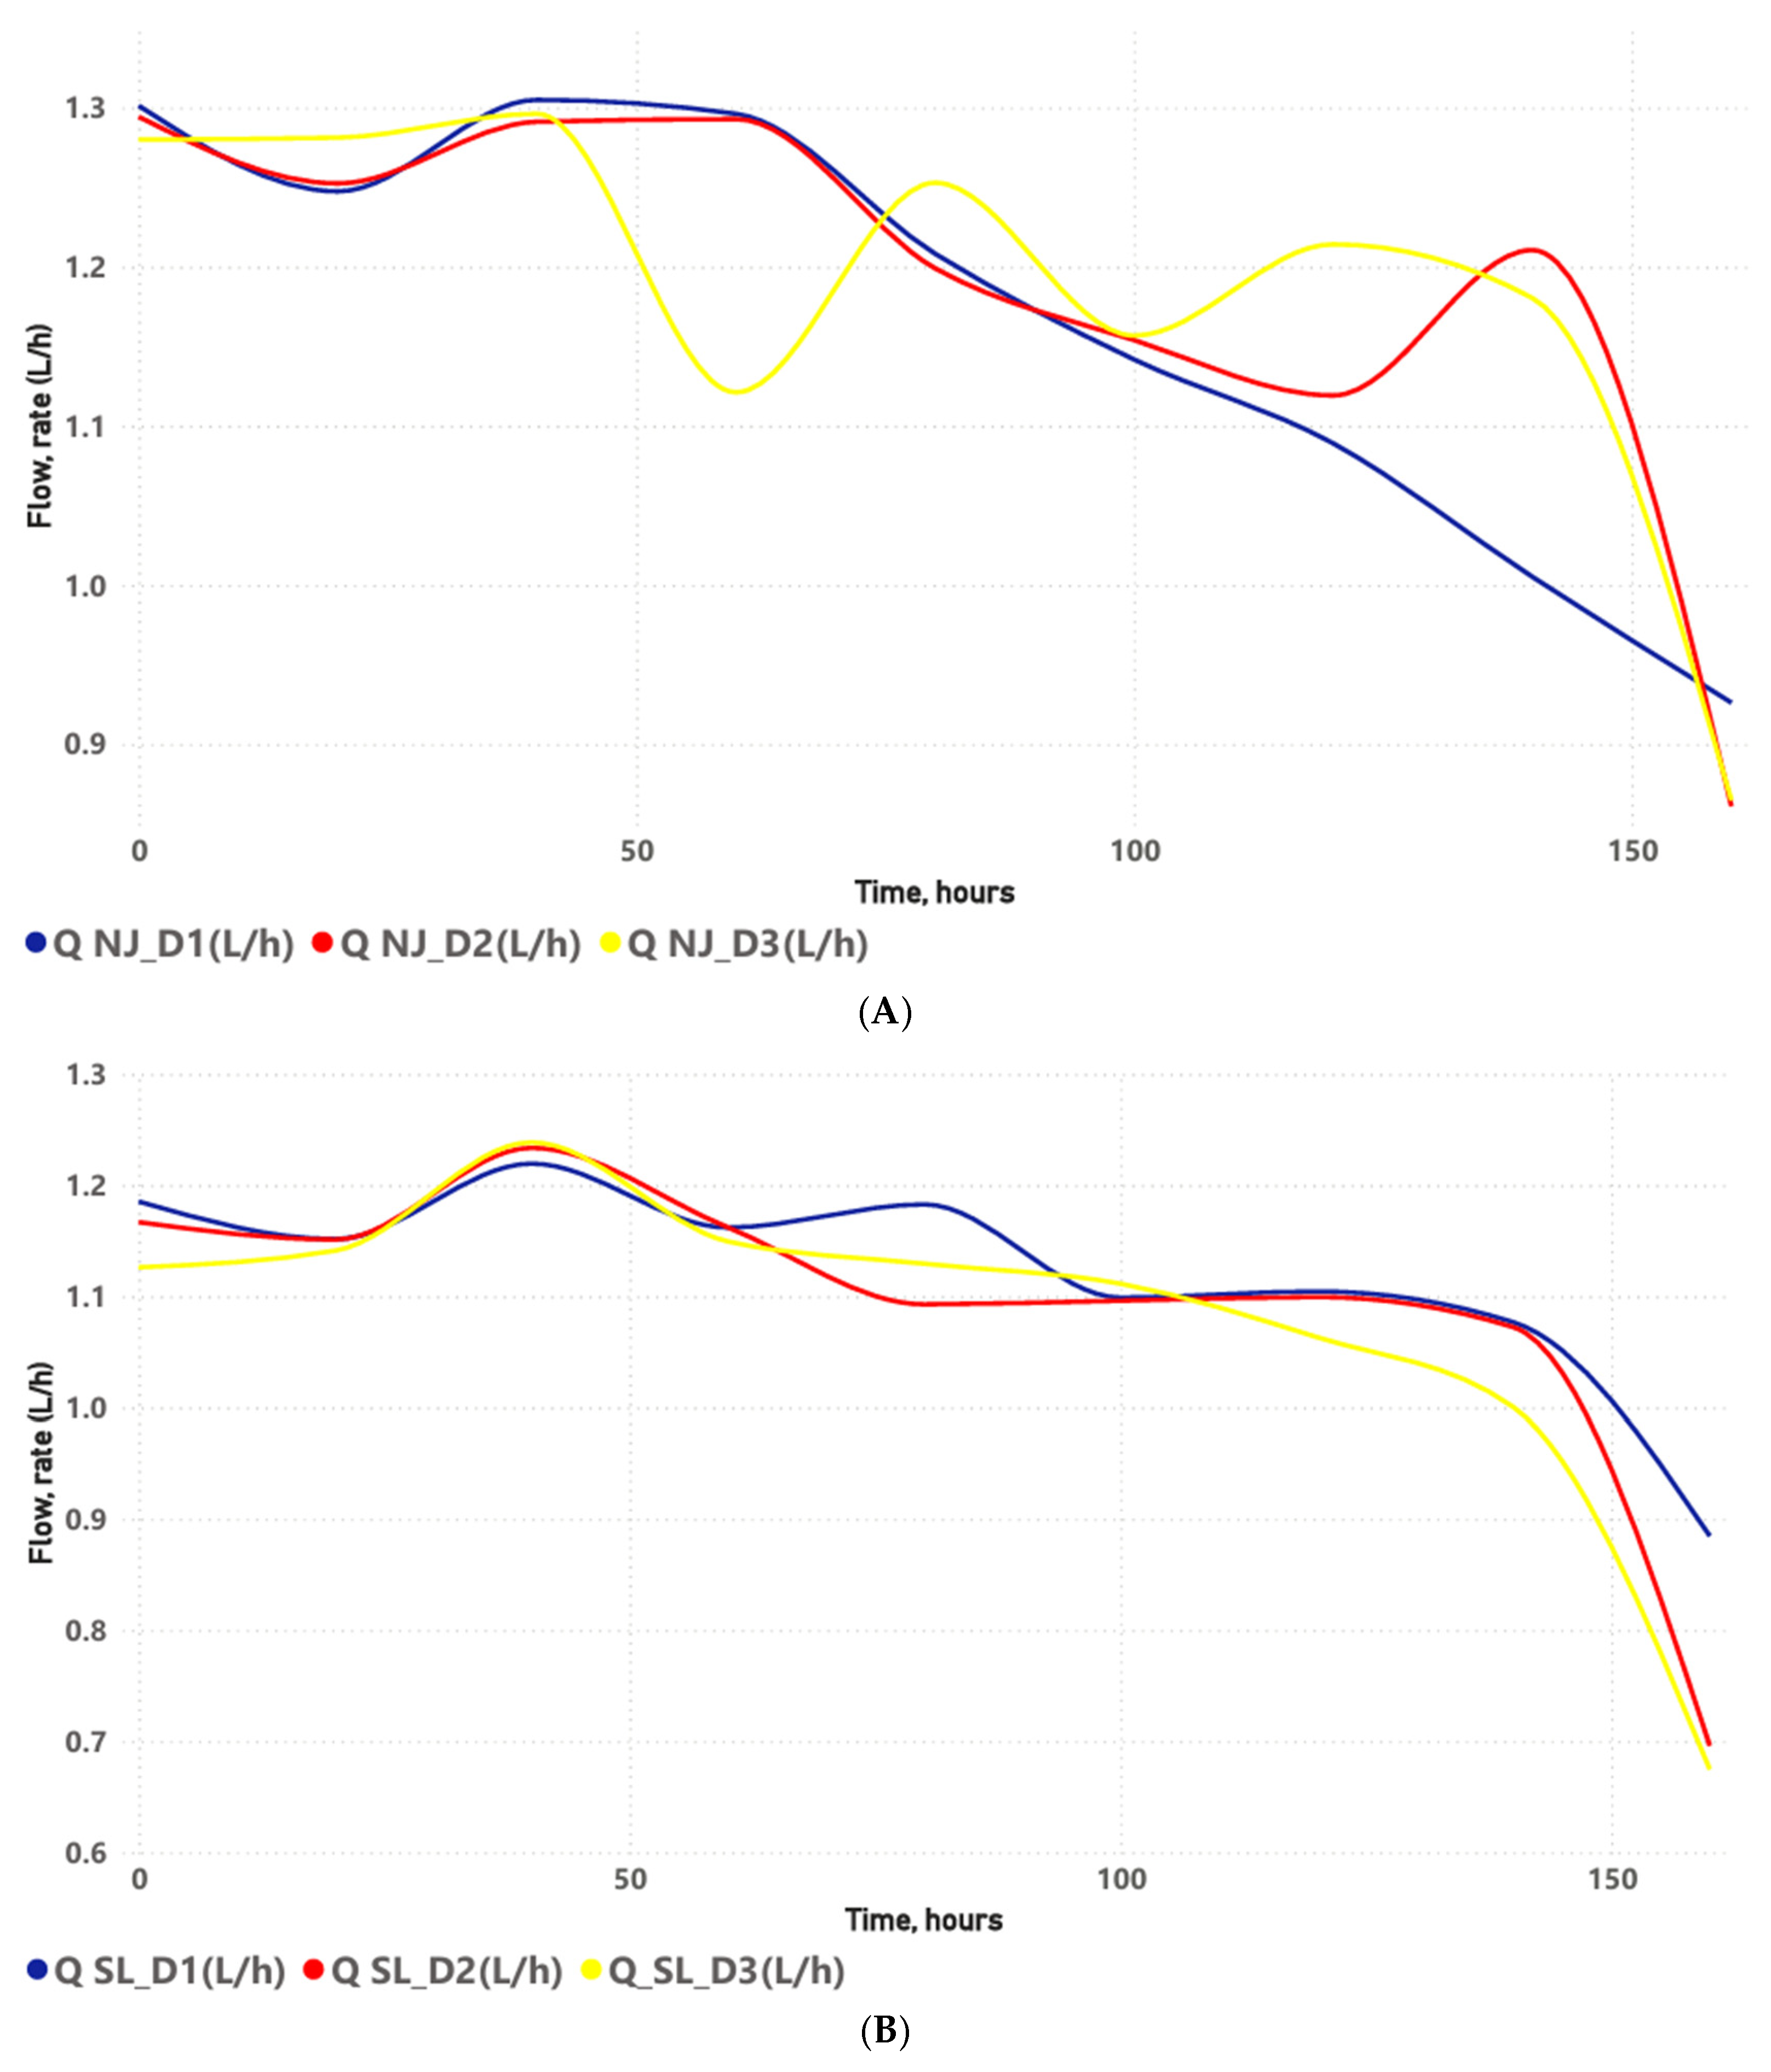
Discharge rate values of the non-pressure-compensating drippers declined throughout the operating time, reaching a peak between 140 and 160 h for all dripper models at the three water salinity levels, except in the NJ-D1 combination, where this decline intensified from 60 h onwards. Importantly, the emitter was considered clogged when the relative discharge at 160 h was less than 75% [
47].
The greater flow rate reduction under NJ-D1 can be associated with the interaction between the emitter design of NJ and water quality in D1. Therefore, NJ has an intermediate labyrinth length (16 mm) and cross-sectional area (0.40 mm2), which may favor biofilm formation, as well as the deposition of chemical precipitates due to pH > 8.0. The lower salinity of freshwater (D1) likely mitigated the effects of osmotic stress on the biofilm compared to D2 and D3. Thus, the sharp reduction in flow in NJ-D1 after 120 h may be related to the biofilm maturation phase, which generated an extracellular polymeric matrix with the capacity to retain particles and induce carbonate nucleation, generating biocrustation.
At the end of the assays (160 h), all the drip subunits with NJ, SL, and ST emitters applying brackish water presented clogging problems. The SL-D1 and ST-D1 combinations showed the lowest clogging levels, whereas the highest levels occurred in the SL-D3 and ST-D2 combinations, thus proving that the increase in salinity of the irrigation water increases the risk of dripper clogging by chemical agents, due to the values of EC, Ca
2+, Mg
2+, TDS, and hardness (
Table 3), which in water with a pH > 8 enhances the formation of precipitates, oxides, and hydroxides [
22,
23,
59]. Thus, the interaction between water salinity and operating time significantly affects the anti-clogging performance of the emitters [
22], a behavior also evidenced in the present study. Another factor that certainly contributed to the greater clogging of SL-D3 and ST-D2 was the design elements of the emitters. Where SL presented a smaller labyrinth width and length (
Table 1), resulting in a smaller flow section, which probably reduced the effect of the vortex region and flow velocity, favoring the formation of biofouling. ST was more susceptible to clogging due to its greater length among the emitters studied, thus favoring biofouling (
Table 1).
Similarly, a study with non-pressure-compensating drippers applying treated petroleum-produced water for a period of 160 h found the greatest discharge rate reduction in the SL dripper [
46]. Ref. [
66] observed an increase in dripper clogging levels when irrigation water salinity levels were increased, corroborating our results.
When water evaporates at the emitter outlet, water supersaturation occurs with respect to the inorganic salts present, increasing the formation of inorganic fouling at the outlet section. However, the presence of ions in irrigation water can also promote fouling formation within the labyrinth of the emitter channel, leading to water discharge disruption [
67]. This suggests that the processes of ionic precipitation, deposition, fouling formation, and particle sedimentation may have caused the dripper clogging in the present study.
4.3. Characterization of Fractal Metrics and Spatial Configuration of Classes 1 and 2
Fractal metrics (SHAPE and CIRCLE) are important for representing the morphology of biofouling within emitters, and the shape of the clogging material directly affects the flow resistance of the circulating fluid and susceptibility to hydraulic performance decline. Biofouling particles with SHAPE metrics are characterized by a square shape, with more irregular shapes predominating. These irregular shapes certainly offer greater friction to the flow of the circulating fluid, increasing flow resistance and consequently reducing its velocity. This alters the position and intensity of vortices and generates recirculation zones, and reduces the magnitude of turbulent flow. This enhances biofouling in the emitter regions, with the predominance of this metric. On the other hand, in biofouling with the CIRCLE metric, particles range in shape from circular to elongated, which also reduces the cross-sectional area of the labyrinth flow but offers lower surface friction and flow resistance, resulting in greater turbulent flow compared to the SHAPE metric. Finally, the PLAND metric measures the proportion of the total area occupied by biofouling within the emitter labyrinth, regardless of its shape (irregular or circular). Thus, the level of surface coverage of the emitter interior with biofouling is quantified. This is an unprecedented and direct indicator of the level of clogging in drip irrigation system emitters (the higher the PLAND metric, the greater the obstruction), which goes beyond the flow measurements commonly made in emitters to detect clogging.
The highest number of spots occurred in the classes 1 and 2 SL-D1 combination, the dripper system, which has the smallest internal labyrinth dimensions. Conversely, the lowest values for both classes were observed in the ST-D3 combination, the emitter with the largest internal labyrinth dimensions. The largest average spot areas occurred in the class 1 SL-D1 and class 2 ST-D3 combinations.
Values obtained for the SHAPE metric of class 1 ranged from 1.15 to 1.36, with a mean of 1.25. The lowest SHAPE value occurred in the ST-D3 combination, indicating less irregular shapes, whereas the maximum value occurred in the NJ-D2 combination, pointing to more irregular shapes. For class 2, SHAPE values ranged from 1.22 to 1.65, with a mean of 1.31, with the lowest value observed in the NJ-D1 combination and the highest in the ST-D3.
CIRCLE values for class 1 ranged from 0.30 to 0.51, with a mean of 0.40, indicating a tendency towards circular shapes; in class 2, values oscillated from 0.27 to 0.47, suggesting shapes with a greater tendency to be elongated. Finally, the PLAND metric for class 1 resulted in values ranging from 2.60 to 21.26, with the lowest value occurring in the ST-D3 combination and the highest in NJ-D2; in class 2, values ranged from 32.38 to 97.4, with the lowest value observed for the SL-D1 combination and the highest for the ST-D3.
Figure 6D–F depicts the formation of spots on the SL emitter, which has the smallest internal labyrinth dimensions. This dripper model showed a greater number of empty spaces in the control treatment (D1) due to better water quality (
Table 3). The smaller dimensions of SL provide higher flow velocities and shear forces on the emitter walls, mitigating adhesion and promoting biofilm detachment in the control operation condition (D1). Additionally, SL has the shortest labyrinth length compared to NJ and ST, which also mitigates biofilm formation. With a more efficient self-cleaning mechanism with D, biofilm particles are carried away by the flow instead of settling in the low-velocity regions of the labyrinth, initiating biofilm formation or forming precipitates.
When comparing treatments D2 and D3 for the SL emitter, we observed that the empty spaces in the labyrinth decreased as BW was applied in greater quantity; that is, with 50% of BW, the amount of material deposited is lower when compared with 100% BW.
Finally,
Figure 6G–I shows the formation of spots on the ST emitter. Treatments D1 and D2 present similar behavior regarding the formation of spots, whereas treatment D3 shows a greater number of spaces with material causing clogging, which can be explained by the water quality (100% BW).
Spot formation is related to particle accumulation in the labyrinth of the emitters and is consequently directly dependent on the quality of the water used in the drip units (FW is more susceptible to biofouling formation than BW) and the emitter labyrinth geometry. This suggests that the NJ and SL emitter models have a labyrinth shape that is more resistant to deposition and biofouling formation than the ST model.
4.4. Multivariate Analysis Applied to the Relation Between Dripper Mean Discharge Rate and Fractal Metrics
Analysis of the Pearson correlation matrix reveals a very strong correlation (r = 0.98) between the Class 1 PLAND metric and the number of Class 2 spots, indicating a significant presence and distribution of biofouling. On the other hand, the very strong correlation (r = 0.95) between the average area of class 1 spots and the Class 1 PLAND metric demonstrates that both the area and distribution of biofouling within the emitters progress together. The very strong correlation (r = 0.94) between the average area of class 1 spots and the number of class 2 spots highlights a higher density of biofouling spots in clogged areas. Finally, the strong correlation (r = −0.73) between water salinity levels D1, D2, and D3 and average dripper discharges highlights the influence of the chemical attributes pH, TSD, EC, HCO
3−, and Har (
Table 3) on the formation of biofouling, which reduces the amount of water applied by the emitters (
Table 7). It should be noted that biofouling resulted from the interaction between chemical and biological agents in the water sources.
Figure 3E shows the presence of extracellular polymeric substances, which aid in the formation of the biofilm matrix in the emitter labyrinth region with lower flow velocity and lower vortex incidence [
27].
The KMO (0.62) and Bartlett (0.1%) tests confirm that the data are suitable for PCA, which extracted three factors explaining 89% of the variance, highlighting clear patterns: clogging (Factor 1), different emitter designs and effects of salinity on flow rate, with a high internal correlation between obstruction variables (
Table 6 and
Table 7 and
Figure 8).
The analysis extracted three principal components that explain 89% of the total variance in the data. Factor 1 presented high negative factor loadings for the number of class 2 spots (−0.98), average area of class 1 spots (−0.92), and Class 1 PLAND (−0.98), and is characterized as an indicator of the degree of clogging of emitters with biofouling in waters with high salinity levels. Factor 2 highlighted negative factor loadings associated with emitter design types (−0.84) and the average area of Class 2 spots (−0.83), indicating inherent differences in the construction and operational characteristics between the emitters. Factor 3 had a negative correlation (−0.77) with water salinity levels and a positive correlation (0.90) with the average discharge rate of drippers, representing the relationship between water quality and hydraulic performance (
Table 7).
The biplots (
Figure 8) clearly visualize the grouping of variables. In the Factor 1 × Factor 2 plot, the variables related to biofouling formation (average area of class 1 spots, class 1 PLAND metric, and number of class 2 spots) were grouped on the left, while water salinity levels D1, D2, and D3 and average dripper discharges were positioned on the right. It should be noted that Factor 2 highlighted the variable representing the emitter construction characteristics (NJ, SL, and ST emitters) (
Figure 8A). In the F1 × F3 plane, the antagonism between water salinity levels D1, D2, and D3 and the average flow rate of the drippers was evident, in addition to confirming the cohesive grouping of the obstruction variables on the F1 axis (
Figure 8B).
Drip emitter clogging is a major challenge for sustainable irrigation, especially in arid regions where freshwater is scarce and brackish water is necessary. Traditional methods, such as visual inspections, particle size measurements, or simple statistical analyses, often fail to capture the complexity and heterogeneity of biofouling deposits. Basic imaging or water quality monitoring alone cannot fully correlate physical, chemical, and biological factors with clogging patterns. Furthermore, variables such as emitter operating time, hydraulic characteristics, and emitter dimensions play critical roles in clogging processes but are often overlooked in conventional analyses. As a result, the mechanisms underlying clogging remain poorly understood, limiting the effectiveness of traditional mitigation strategies.
This study overcomes these limitations by combining high-resolution SEM imaging with fractal analysis using FRAGSTAT 4.0, enabling the quantitative characterization of deposit structure and complexity. ArcGIS 10.3, along with the Maximum Likelihood Estimation method, was used to classify deposits and generate statistically analyzable spatial maps. Principal Component Analysis (PCA) integrated these morphological metrics with water quality variables, emitter characteristics, and different source compositions, also relating them to clogging risk categories (B = low, M = moderate, S = severe).
By combining these tools, this study provides a multiscale, quantitative, and statistically robust framework that traditional approaches cannot achieve. The results offer multiple benefits: they reveal how water chemistry, source composition, and emitter characteristics influence clogging, identify high-risk areas, and guide the selection of appropriate drippers. Furthermore, this approach contributes to better irrigation management, maximizing productivity and yield while reducing maintenance costs and economic losses caused by emitter failures. By linking scientific knowledge to practical decision-making, the study increases the efficiency and sustainability of irrigation systems.
4.5. Microbial Activity and Scalability of Results to Real Field Conditions
It should be noted that this study primarily addressed the chemical and physical clogging agents present in the water sources (
Table 3) in the formation of biofouling. Due to the presence of free residual chlorine in the control (D1) and the salinity in D2 and D3, the biological clogging agents were not monitored in the waters due to inhibitory factors. However, the presence of biofilm in the clogged drippers was detected through the morphologies recorded in scanning electron micrographs. It appears that the NJ-D1 combination enhanced biofilm formation, even with D1 having an average of 1.0 mg L
−1 of free residual chlorine. Water recirculation in the bench likely mitigated the effect of chlorine through aeration. Thus, a considerable portion of the free residual chlorine in D1 was lost during the aeration process. Free residual chlorine is a volatile substance, and agitation and contact with air during recirculation accelerate its volatilization and dissipation. Furthermore, D1 has a low salinity, approximately 6 to 9 times lower than D2 and D3, resulting in low osmotic stress on water and biofilm microorganisms.
The hydraulic performance and clogging monitoring tests of the three emitters in open-air experimental rigs with water source recirculation have a significant limitation: they do not reflect the actual operating conditions of the irrigation equipment in the field. This limitation is reinforced by the fact that recirculation increases the levels of physical and chemical parameters in the water due to evaporation losses, which are high in the semi-arid region of Rio Grande do Norte. Furthermore, in the field, the irrigation equipment receives shade from plants, which mitigates the temperature rise and expansion of the plastic devices. This does not occur in the open-air rig experiments, where the lateral lines are placed on top of fiber-cement tiles receiving solar radiation, and likely, the water temperatures inside the lateral lines differ from field conditions. The clogging dynamics of the drippers in the field are likely also different due to the longer lateral lines and shorter daily operating time. On the other hand, bench experiments allow for studies of hydraulic performance and clogging of drippers using brackish water. This is a low-cost alternative that allows for quick results. Even though these experiments are not performed under field conditions, this type of simulation provides insights into potential problems with irrigation equipment. Another positive aspect of bench experiments with open-air recirculation is the potential for increased clogging risk, which can be more severe than in field conditions. Under these conditions, the anti-biofouling measure may also work under less extreme real-world conditions. In this study, desalinated water could have been added to mitigate the effect of evaporation on the concentration of physical and chemical parameters. Furthermore, excessive heating could be avoided by operating the benches at night, and more accurate clogging simulation could be achieved by increasing the length of lateral lines to approximately 20 m and avoiding aeration of water sources during the recirculation process.
5. Conclusions
The SL-D1 and ST-D1 combinations resulted in the smallest reduction in emitter discharge, while the largest reductions occurred in the SL-D3 and ST-D2 combinations, indicating that emitter design factors and irrigation water quality alter clogging dynamics.
The reduction in flow intensified after 140 h due to the accumulation of biofouling in the emitter labyrinth, resulting from the interaction between chemical and biological agents, causing clogging.
The fractal metrics SHAPE and CIRCLE represent new indicators for detecting emitter clogging, as they represent the morphology of biofouling within the emitters, and the shape of the clogging material directly affects flow resistance. Thus, the fractal metric PLAND measures the proportion of the total area occupied by biofouling within the emitting labyrinth for both irregular and circular shapes.
Multivariate analysis revealed that biofouling in emitters is a multidimensional phenomenon, resulting from the interaction between the spatial evolution of the clogging material, emitter geometry, and irrigation water quality.
The combination of fractal metrics and scanning electron microscopy proved to be an advanced and innovative diagnostic tool for the presence and distribution of biofouling within emitters, enabling clogging monitoring and creating more realistic scenarios in hydrodynamic studies for improving or developing emitter designs.
The main limitation of this study is its focus on chemical agents causing clogging. Biofilm formation was detected solely by scanning electron microscopy, as well as the integrated use of fractal metrics and scanning electron microscopy on biofouling collected only at the end of the experiment. Future studies recommend: (1) Further exploration of the biological agents causing clogging by determining intrinsic biofilm characteristics such as microorganism diversity, density, and characterization of extracellular polymeric substances; (2) Applying fractal metrics and scanning electron microscopy to the detection and distribution of biofouling in the labyrinth of collected emitters over the longer operating time of the experimental benches; and (3) Use computational hydrodynamic modeling to generate emitter designers that are more resistant to biofouling formation based on real mapping done over time with the combined use of fractal metrics and scanning electronics.
