1. Introduction
The performance of a vehicle in straight-line motion is influenced by its ability to accelerate, decelerate, and overcome slopes. This ability depends on the balance between the tractive or braking effort transmitted by the tires and the resisting forces acting on the system [
1]. The operational efficiency of an agricultural tractor depends directly on the proper mass distribution between axles and internal tire pressure, as inadequate adjustments to these conditions can increase slippage, increase fuel consumption, and compromise the uniformity of field applications [
2]. This control becomes even more critical in the face of dynamic load variations and adverse topographic conditions, which influence mass distribution, center of gravity geometry, and traction effects on the stability and operational safety of tractors [
3].
Despite tractors being widely employed in soil preparation, crop establishment, fertilizer distribution, and spraying operations, the adoption of ballasting strategies frequently considers total system mass or tire pressure separately, without considering the interaction between these factors in a real working environment and integrated manner. Studies on mass distribution in tractors demonstrate that proper ballasting is fundamental for maximizing traction capacity and controlling wheel slippage, particularly on low-resistance soils. Ref. [
2] observed that the absence of adequate ballast causes excessive slippage under low soil cohesion conditions, reducing the tractor’s energy efficiency.
Weight distribution on conventional tractor axles occurs primarily through the addition of counterweights. In most cases, these weight modifications involve artificial mass increase or decrease based on the operator’s empirical knowledge. Few cases exist of innovative systems employing actual prototypes for this purpose. Three main problems emerge from this approach. The first refers to the absence of clearly established criteria for determining adequate weight distribution between front and rear axles. The second problem relates to the fact that adding a single counterweight frequently results in irregular weight distributions between axles. The third challenge involves the lack of accessible control systems and appropriate control strategies, which contributes to inadequate variations in loads supported by tractor axles [
4].
Furthermore, ref. [
5] showed that lower diagonal tire pressures during subsoiling operations result in reduced slippage, lower fuel consumption, and higher operational efficiency, indicating the importance of combined adjustment between mass and tire pressure. Ref. [
6] demonstrated that in 4 × 2 tractors with front-wheel drive, optimal performance condition is achieved when the front axle supports between 40% and 45% of the total mass and the speed ratio between front and rear wheels remains between 1% and 5%. However, the authors do not consider dynamic load variations occurring during the use of implements whose mass changes throughout operation, as is the case with sprayers having reservoirs at different fill levels.
Internal tire pressure exerts a significant impact on rolling resistance, sidewall deformation, and soil compaction. Ref. [
7] described that excessively low pressures increase the contact area, reducing the lead ratio and aggravating compaction, while excessively high pressures elevate slippage. Additionally, ref. [
8] pointed out that excessive tire deformation, caused by a misadjusted ballast, alters axle height relative to the ground, impairing uniformity in fertilizer and pesticide distribution. These findings indicate that tire pressure should be adjusted considering not only soil characteristics but also the dynamic mass of the tractor–implement system.
The three-point hydraulic system and ISO standards associated with implement hitching are fundamental for system stability and safety. ISO 730:2009 defines geometric parameters for three-point hitching but does not quantify how the tractor center of gravity displacement varies when the mounted implement changes its weight during operation. In this regard, ref. [
9] recorded that mounted sprayers with flexible reservoirs dynamically modify mass distribution, but few studies have measured the effect of this variation on the stability, lead ratio, and traction loss under real field conditions.
Despite advances, there remains a gap in the literature regarding the simultaneous evaluation of mounted implement mass variation and the influence of different tire pressures on the load distribution between axles, center of gravity displacement, tire contact area, and lead ratio. This absence hinders the development of practical recommendations for ballasting and tire inflation pressure in operations where implement weight varies continuously, compromising safety, energy efficiency, and soil conservation.
Consequently, this study aims to quantify mass distribution between the front and rear axles of an agricultural tractor coupled to a sprayer at three fill levels (550 kg; 850 kg; and 1150 kg) and subjected to different tire pressures (151.7 kPa; 165.5 kPa; 179.3 kPa; and 193.1 kPa), evaluate variations in front and rear tire contact areas resulting from these configurations, calculate horizontal displacement of the system’s center of gravity for each experimental condition, and determine the lead ratio obtained as a function of sprayer mass and tire pressure combinations.
2. Materials and Methods
This experiment was conducted at the physical store of Alvorada Sistemas Agrícolas, located in the municipality of Cachoeira do Sul, Rio Grande do Sul, Brazil. The experiment composition was based on the interaction between two factors: implement mass (Factor 1) and tire pressure (Factor 2). These factors were combined according to treatments described in
Table 1, resulting in 12 system configurations (treatments). Implement masses were chosen to represent the sprayer with a full, half-full, and empty tank. Tire pressures were chosen based on the load-bearing capacity of the tires.
The experimental design utilized was completely randomized blocks, with a combination of studied factor levels, resulting in a 3 × 4 factorial. Twelve treatments were evaluated, considering the following variables: front axle mass and rear axle mass, front and rear tire contact area, lead ratio, and horizontal center of gravity displacement. Each treatment was replicated 5 times for all variables, except for tire contact area, where collection was performed on one wheel from each axle. Factor interaction was analyzed through an F-test to verify the factor correlation on variables of interest. The description of the experimental treatments is shown in
Table 2.
The tractor used was a John Deere 5080 E, with 58.84 kW (80 cv) of power, a 2.05 m wheelbase, a Class 2 three-point hydraulic system, equipped with Alliance Farm Pro 18.4–30 rear tires with a maximum supportable load of 2948.35 kg at 158.579 kPa (23 psi), and Pirelli R-1 12.4–24 front tires with a maximum supportable load of 1200 kg at 165.474 kPa (24 psi). The mounted implement was a 550 kg (empty) Greensystem PV1006 sprayer with a 600 L tank capacity. The second gear of group B was used with a rotation fixed at 1700 rpm (540 rpm at PTO).
Figure 1 shows the machine-implement assembly described above.
The established tractor mass distribution was 60% on the rear axle and 40% on the front axle (due to the system containing a 4 × 2 tractor with auxiliary front-wheel drive and a mounted implement), resulting in a total weight of 3190 kg. The tractor was weighed with Presenti–Smart Farming
® pad scales. The tractor weight was standardized without any implement attached.
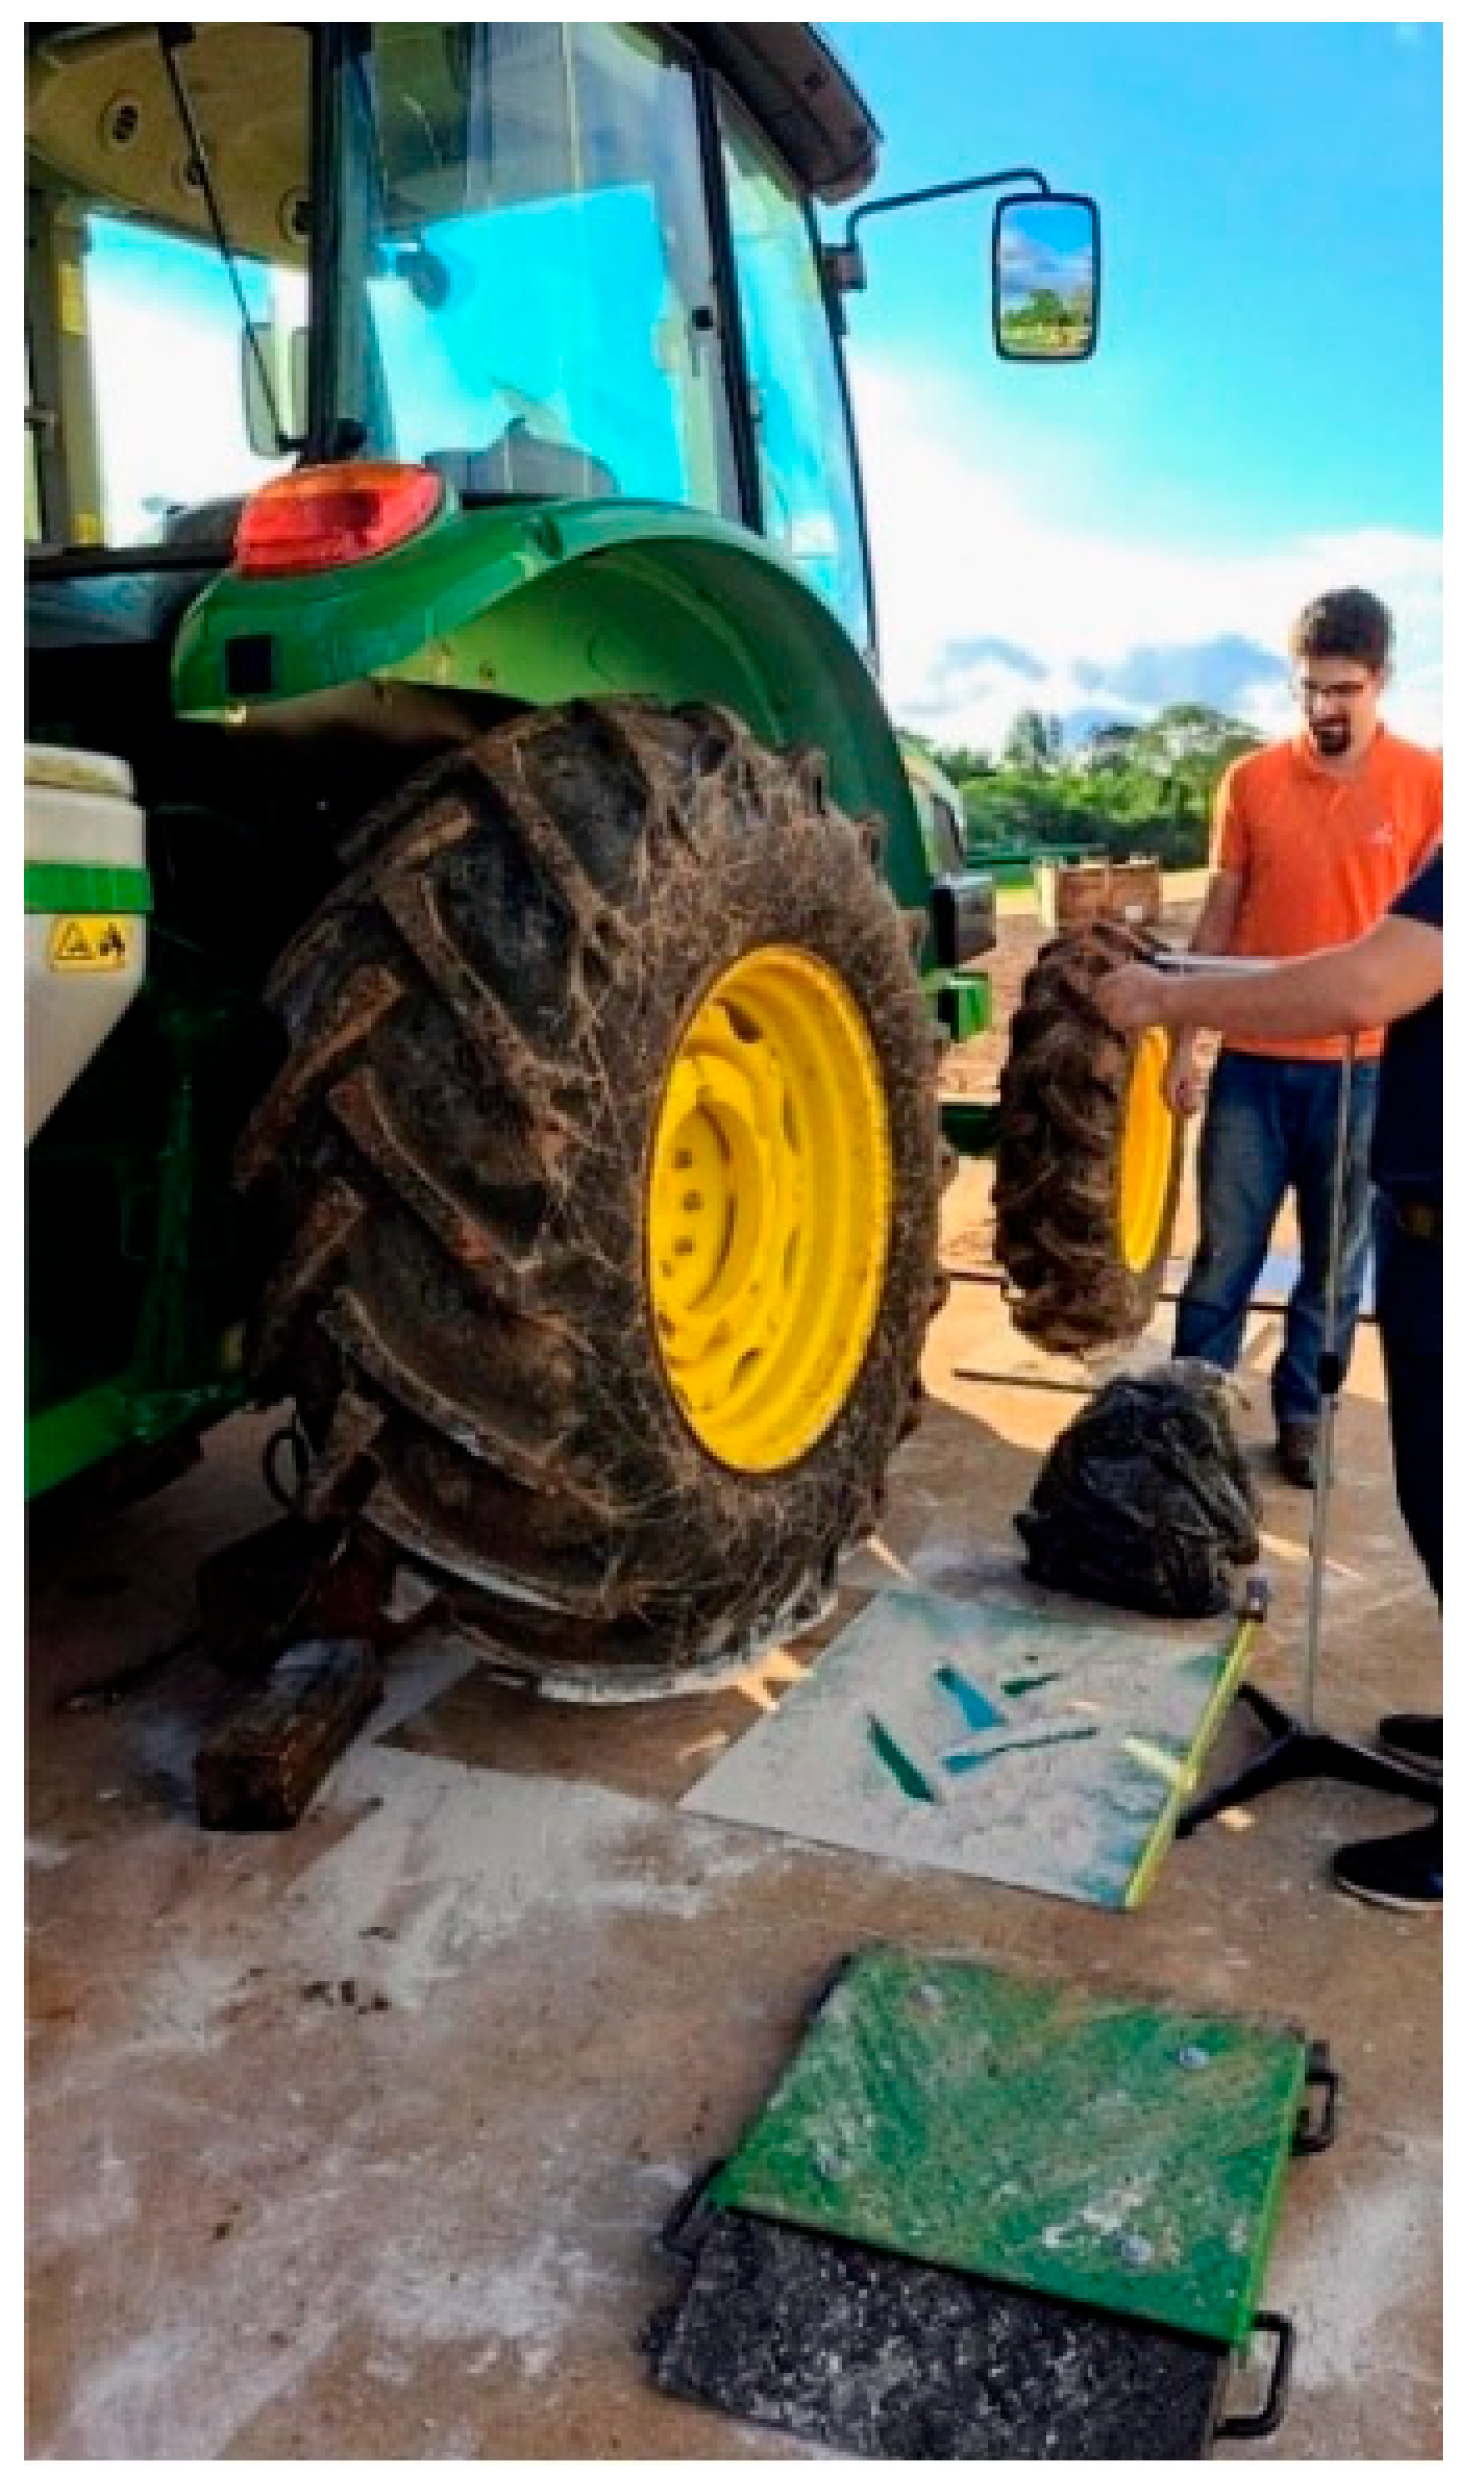
Figure 2 shows the tractor being weighed by pad scales.
Tire inflation pressure was modified using an air compressor and measured with a pressure gauge. To determine contact area, the team lifted the desired axle using a hydraulic jack and positioned a wooden plate below the tire. After plate positioning, the tractor was lowered, resting on the plate, and lime was added. Finally, the tractor was lifted again, and digital images were captured for contact area measurement using AutoCAD
® software 2022.
Figure 3 shows the measurement of tire contact area.
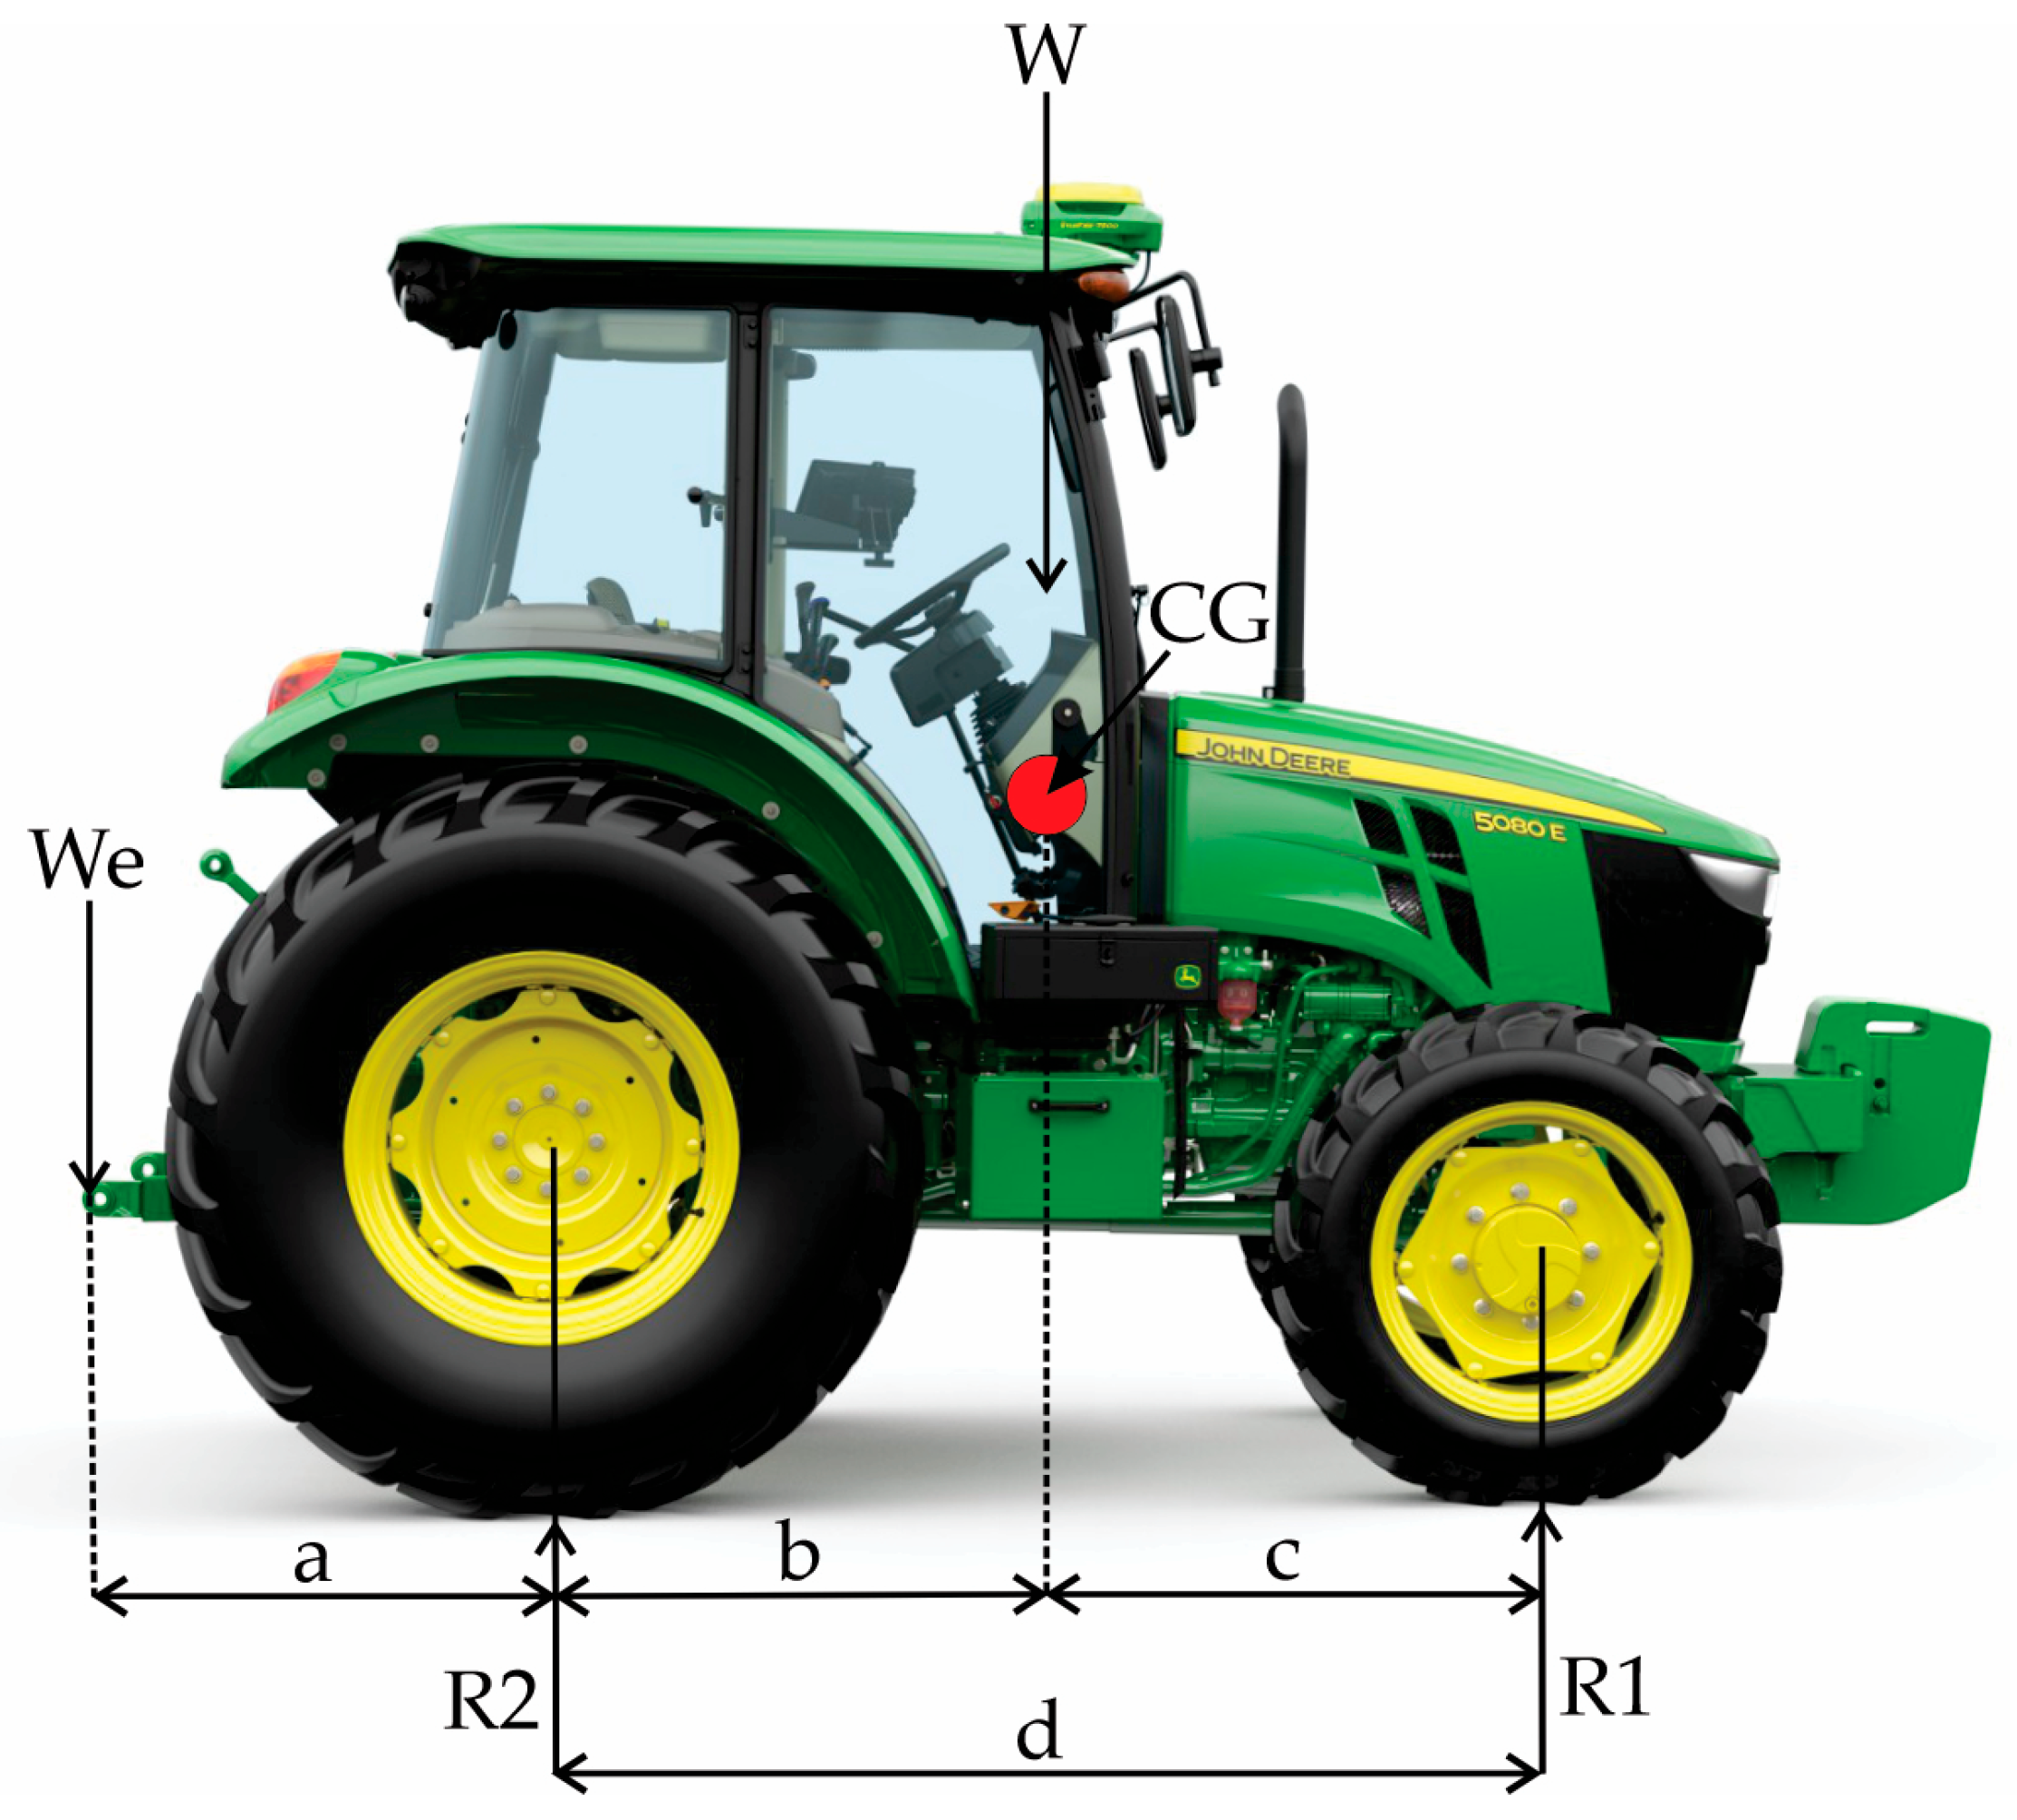
Center of gravity displacement was calculated based on Equation (1), where “b” was isolated.
Figure 4 shows the parameters adopted for center of gravity calculation.
Equation (1). Tractor weight
where
W = tractor weight;
We = mounted implement weight;
R1 = soil reaction on front axle;
a = wheelbase distance;
b = distance between rear axle and center of gravity;
d = distance between rear axle and hitch point on hydraulic system arm.
In addition to statistical analysis, a safety analysis was performed, considering the weight transfer between rear and front axles and their limits, based on Equations (2) and (3).
Equation (2). Weight transfer from front axle to rear axle (ISO/TC 22—Road vehicles)
where
Tp = weight transfer by 3-point hitch (kgf);
Pe = weight at 3-point hitch (kgf);
d = distance between rear axle and tractor 3-point hitch (mm);
a = tractor wheelbase (mm).
Equation (3). Maximum weight transfer from rear axle to front axle (ISO/TC 22—Road vehicles)
where
Tpmax = weight transfer by 3-point hitch (kgf);
P1 = front axle weight of tractor (kgf).
Five replications of the lead ratio were performed for each treatment, with each replication consisting of two passes over the same route on flat terrain, one with front-wheel drive (FWD) disengaged and another pass with FWD engaged. For lead ratio calculation, the following Equations (4) and (5) were used:
where
NTG: total number of lugs at end of displacement;
NV: total number of turns made by front tire;
NG: number of front tire lugs;
NGVI: number of excess lugs from incomplete turn.
where
A: lead ratio;
TGCT: total lugs with traction;
TGST: total lugs without traction.
3. Results
3.1. General Analysis
Statistical analyses and F-tests for each configuration are presented in
Table 3, with mean values of loads recorded on the front and rear tractor axles as a function of implement (sprayer) mass variation and different tire inflation pressures. It is observed that increasing sprayer mass coupled to the tractor rear causes significant load transfer from the front axle to the rear. With the implement at 550 kg (“empty tank”), the front axle load was 866.75 kg, while the rear axle load was 2912.25 kg. When the mass was increased to 1150 kg (“full tank”), the front axle load was reduced to 470.25 kg and the rear axle load increased to 3889.75 kg. This transfer represents a 45.8% reduction in weight supported by the front axle and a 33.6% increase in the rear axle. Additionally, the two-way ANOVA (F-test) demonstrated that both individual factors (mass and pressure) and their interaction (mass × pressure) had a statistically significant effect (
p < 0.01) on axle loads. This interaction suggests that both implement mass and tractor tire pressure should be adjusted jointly, seeking to preserve system efficiency, reduce soil compaction risk, and maintain tractor stability.
3.2. Mass Impact
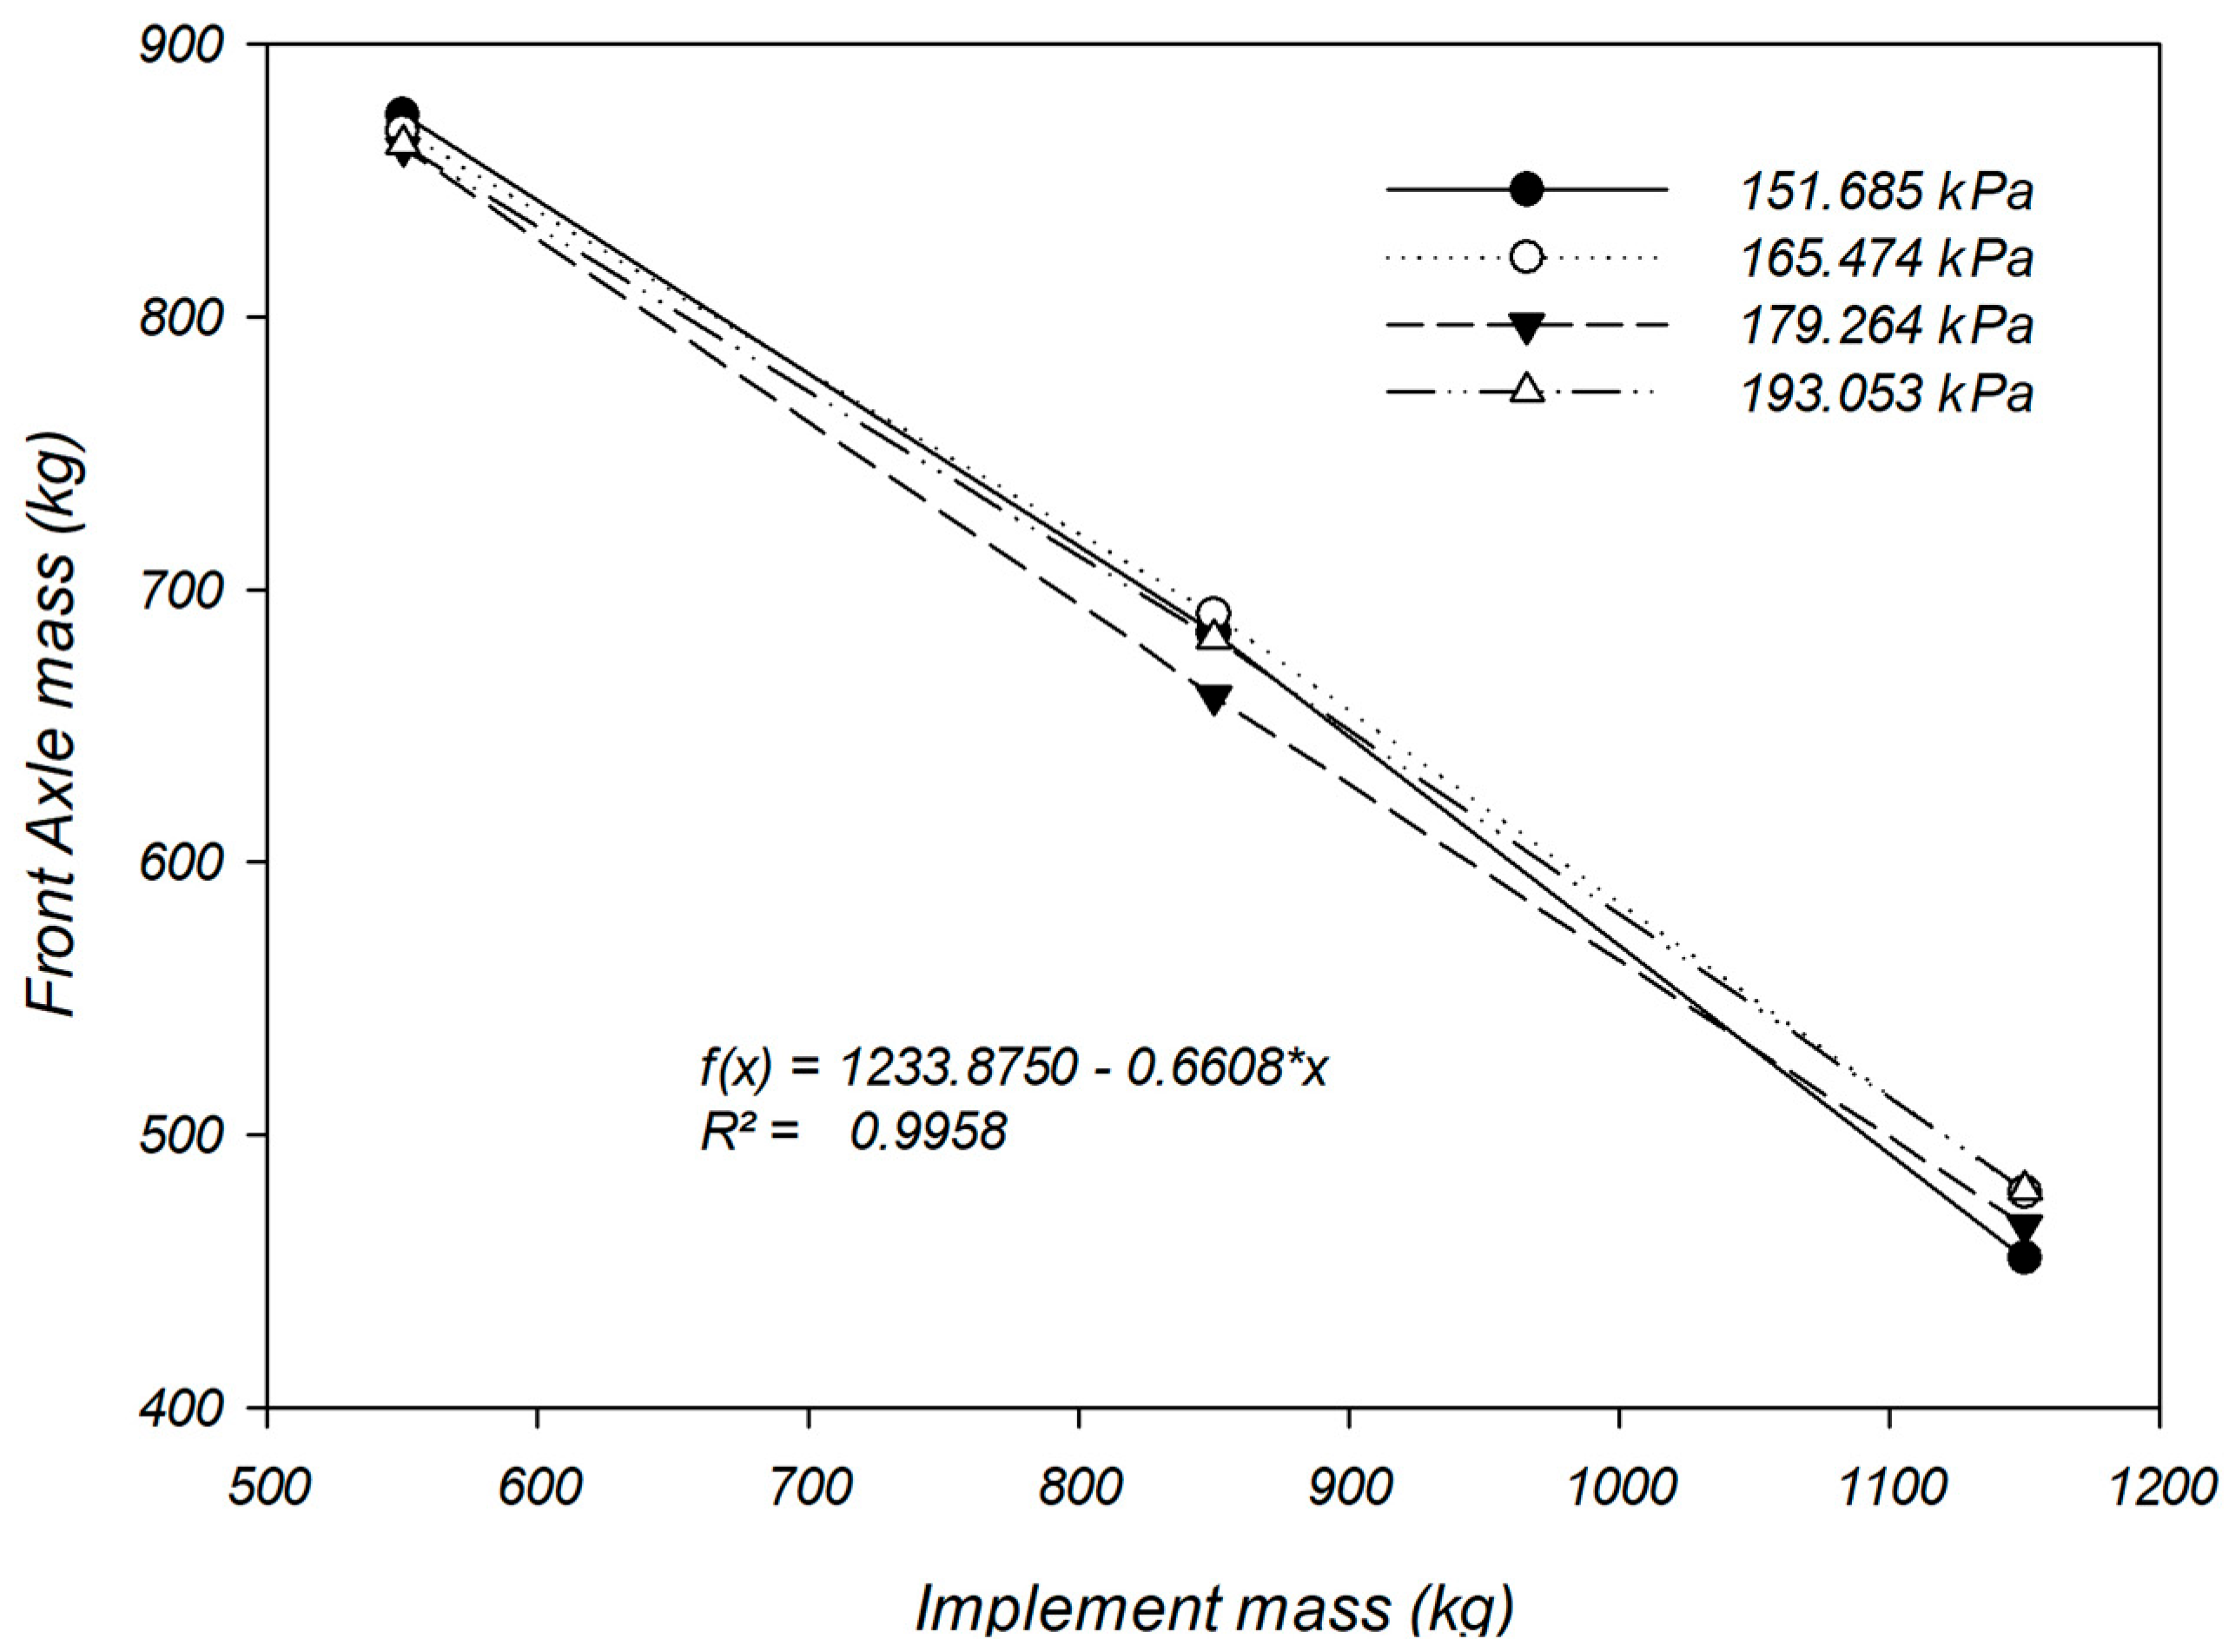
The behavior of front axle mass changes as implement mass increases, illustrated in
Figure 5, evaluates four different front tire inflation pressures (151.685; 165.474; 179.264; and 193.053 kPa). The results showed a consistent decreasing linear trend, regardless of the adopted pressure, expressed by the equation f(x) = 1233.8750 − 0.6608x (R
2 = 0.9958), configuring consistency in measured physical behavior. Numerically, for every 100 kg added to the implement, an average reduction of approximately 66 kg occurs in the front axle load. This behavior and the negative curve slope confirm the load transfer from the front axle to rear, a direct consequence of implement coupling to the tractor rear via the three-point hydraulic system. It is important to highlight that the pressure variation in tires, despite presenting a statistically significant effect according to
Table 3, had a visibly smaller effect magnitude than the mass, demonstrating that in this pressure range, the determining factor for front load is indeed the mass coupled to the implement.
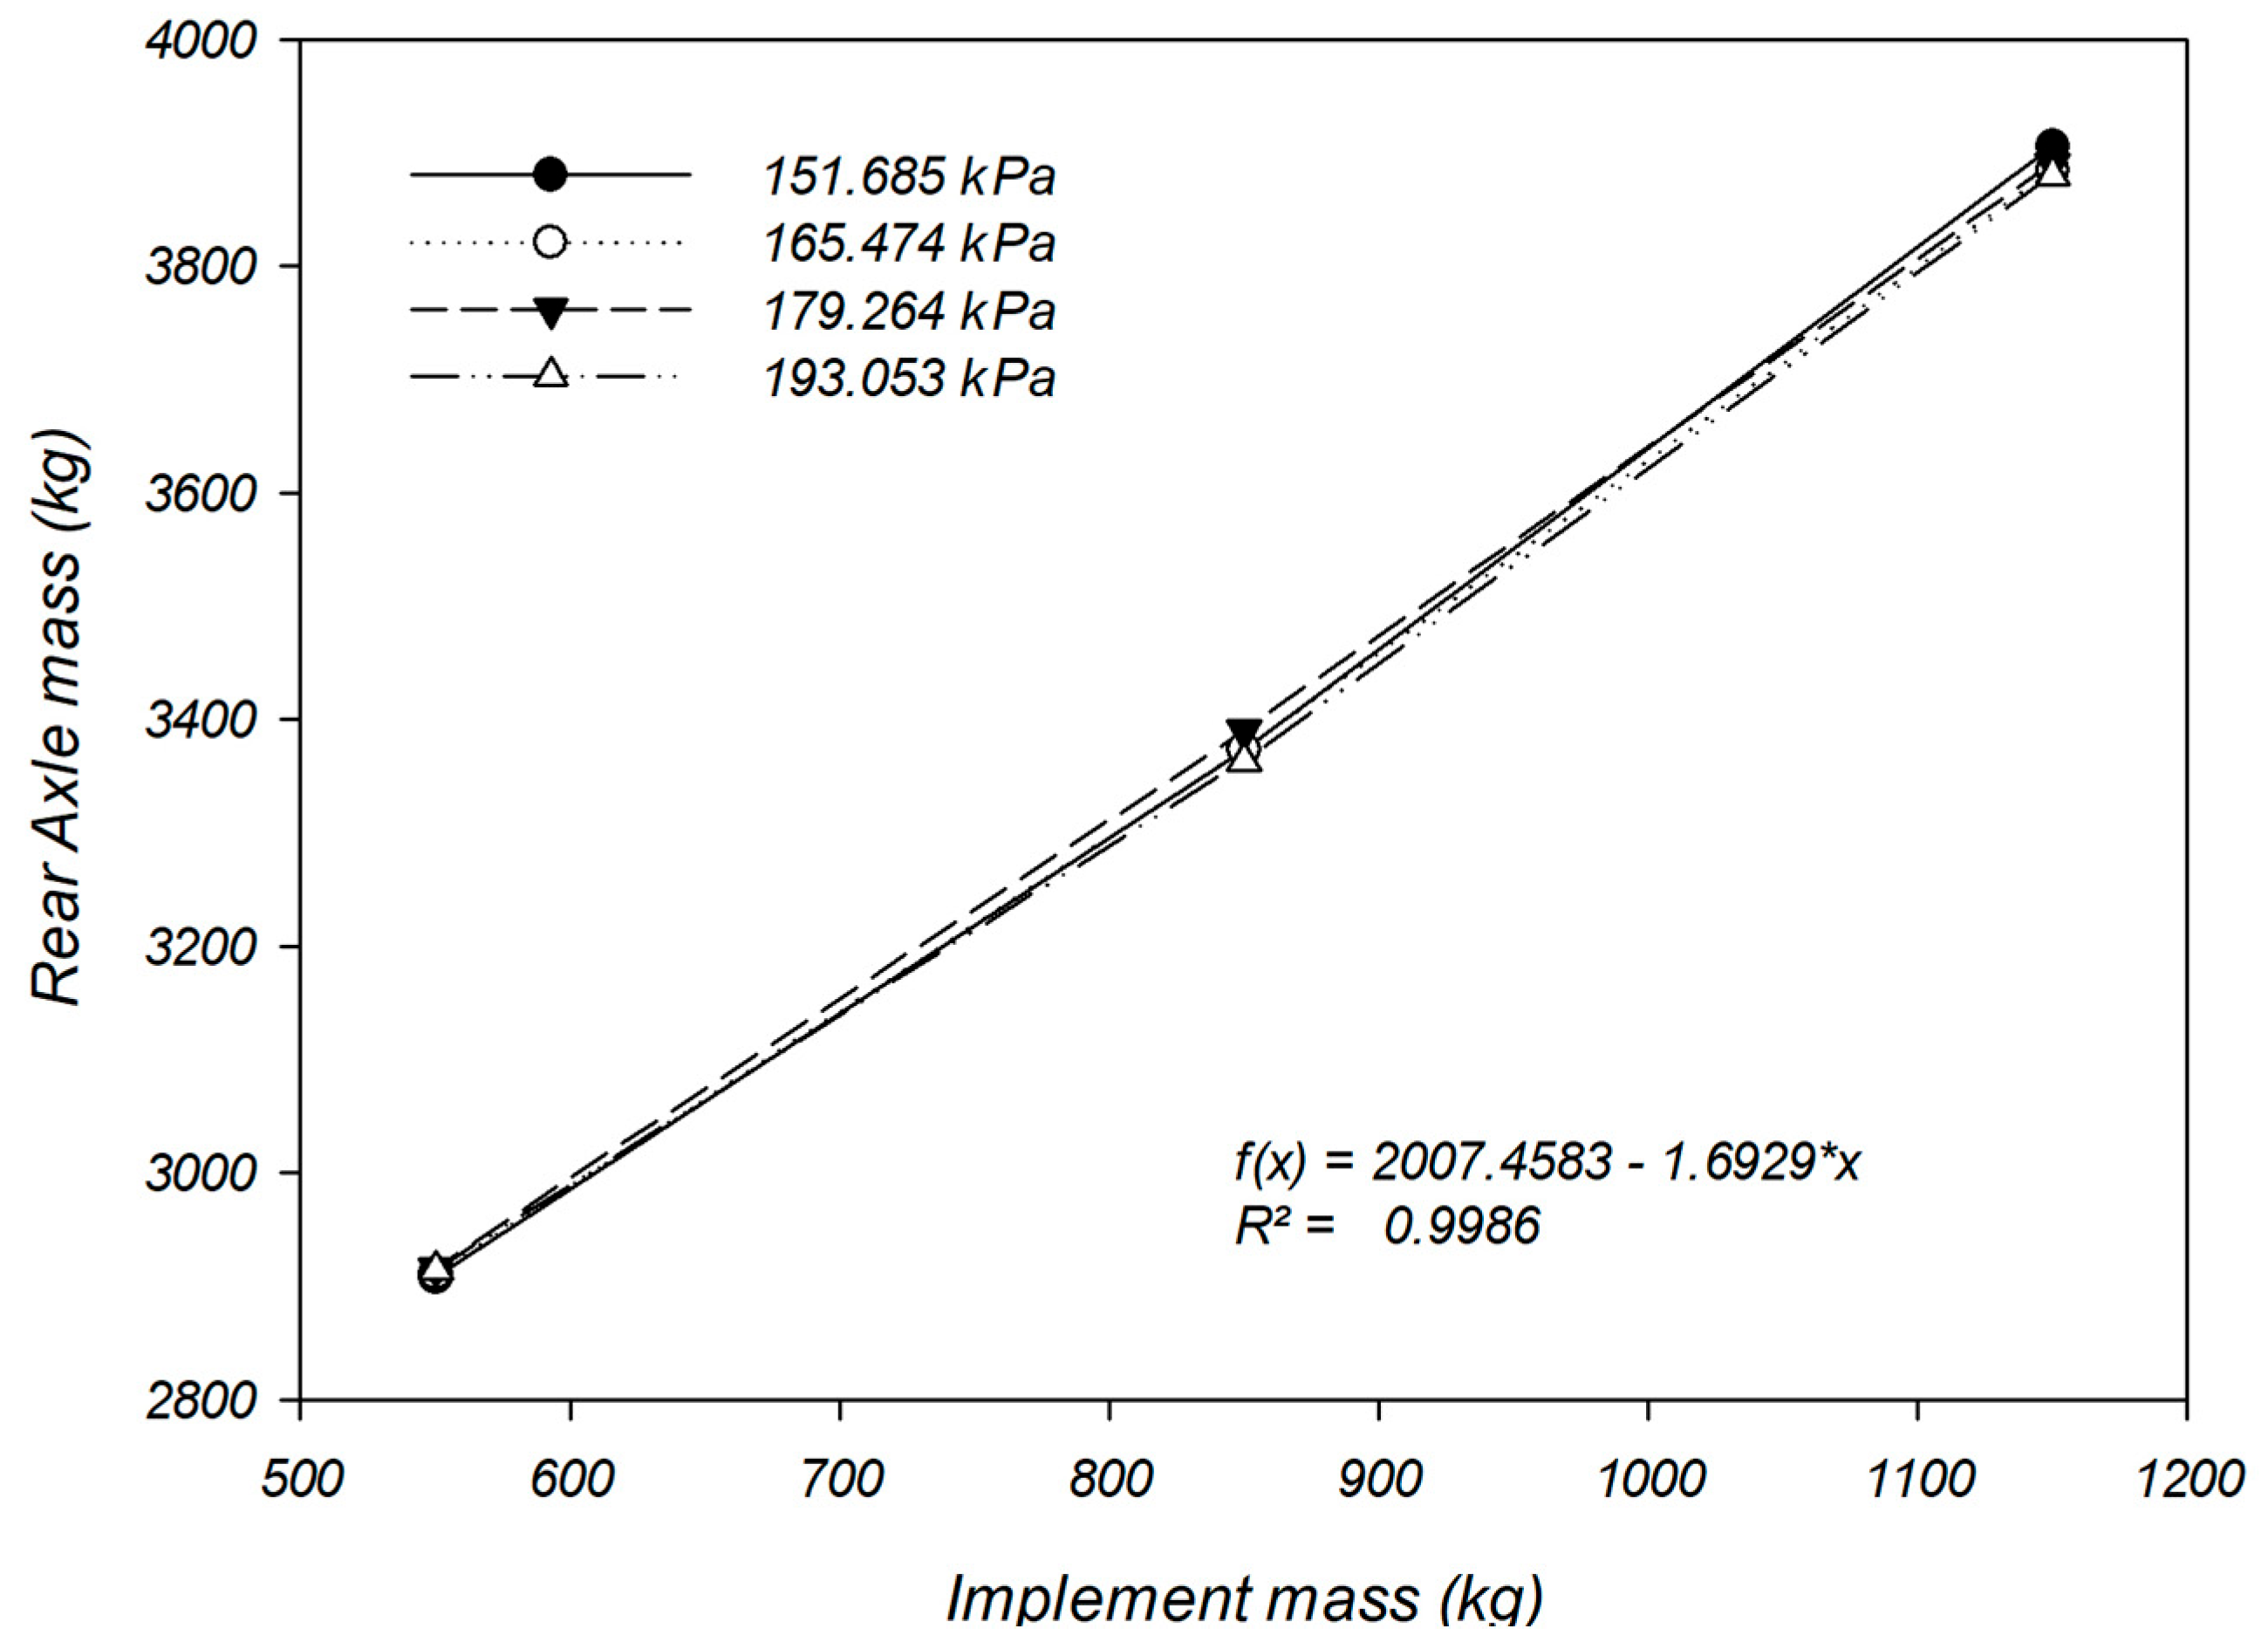
Figure 6 analyzes rear axle mass response as a function of implement mass increase under the same tire pressures evaluated in
Figure 5. Data show a growing linear relationship, modeled by the equation f(x) = 2007.4583 + 1.6292x (R
2 = 0.9986), indicating that for every 100 kg added to the implement, the rear axle load increases about 163 kg.
The results in
Table 4 demonstrate the percentage mass distribution over the front and rear tractor axles for different treatments, considering combinations between the sprayer mass (550, 850, and 1150 kg) and tire inflation pressures (151.685 to 193.053 kPa). With the sprayer at maximum load (1150 kg), the front axle participation in total system weight varied from 10.44% to 11.01%. For intermediate mass (850 kg), this participation was between 16.32% and 17.00%, and with the empty sprayer (550 kg), the range was 22.82% to 23.11%. Although the percentage variations between different pressure levels are numerically small for each mass condition, the analysis of variance (ANOVA) presented in
Table 3 revealed that the pressure effect and mass–pressure interaction on absolute load distribution (in kg) was statistically significant.
The weight transfer magnitude between axles can be better understood from the
Table 5 results, which show absolute values calculated for each treatment combination. When the sprayer had a full tank (1150 kg), the weight transfer to the rear axle reached 560.98 kgf, exceeding operational safety limits, which varied from 364 kgf to 384 kgf depending on the treatment. In intermediate scenarios (850 kg) and with an empty tank (550 kg), the transferred values were 414.63 kgf and 268.29 kgf, respectively. In these two scenarios, the weight transfer remained within established limits, since the greater residual weight over the front axle resulted in a considerably higher safety threshold (varying from 528 kgf to 699 kgf). This evidences that the most critical condition is not only the one generating the greatest load transfer but also the one that most reduces the safety limit itself by mitigating the front axle.
The data in
Table 6 indicate a direct relationship between the sprayer mass increase and elevated weight transfer rate. For treatments where the sprayer was fully loaded (1150 kg), the total system mass varied from 4357 to 4363 kg according to the tire pressure. In this condition, the weight transfer was 560.98 kgf at all pressure levels, resulting in very close percentage rates, oscillating between 12.86% and 12.88% of the total mass. The tire inflation pressure variation presented a marginal effect on the transfer rate, reflecting only small oscillations attributed to variations in tire deformation and dynamic load distribution, without significantly altering the absolute mass transfer.
In the intermediate treatments (850 kg), the total system mass was between 4045 and 4064 kg, with a weight transfer of 414.63 kgf. The transfer rates in this range varied from 10.20% to 10.25%, also without relevant differences due to tire pressure. For the treatments with the sprayer in the minimum configuration (550 kg), the total mass was approximately 45% lower than the values for the treatments at 1150 kg condition, following the same implement mass reduction ratio. The percentage rate, in turn, varied slightly with the total system mass.
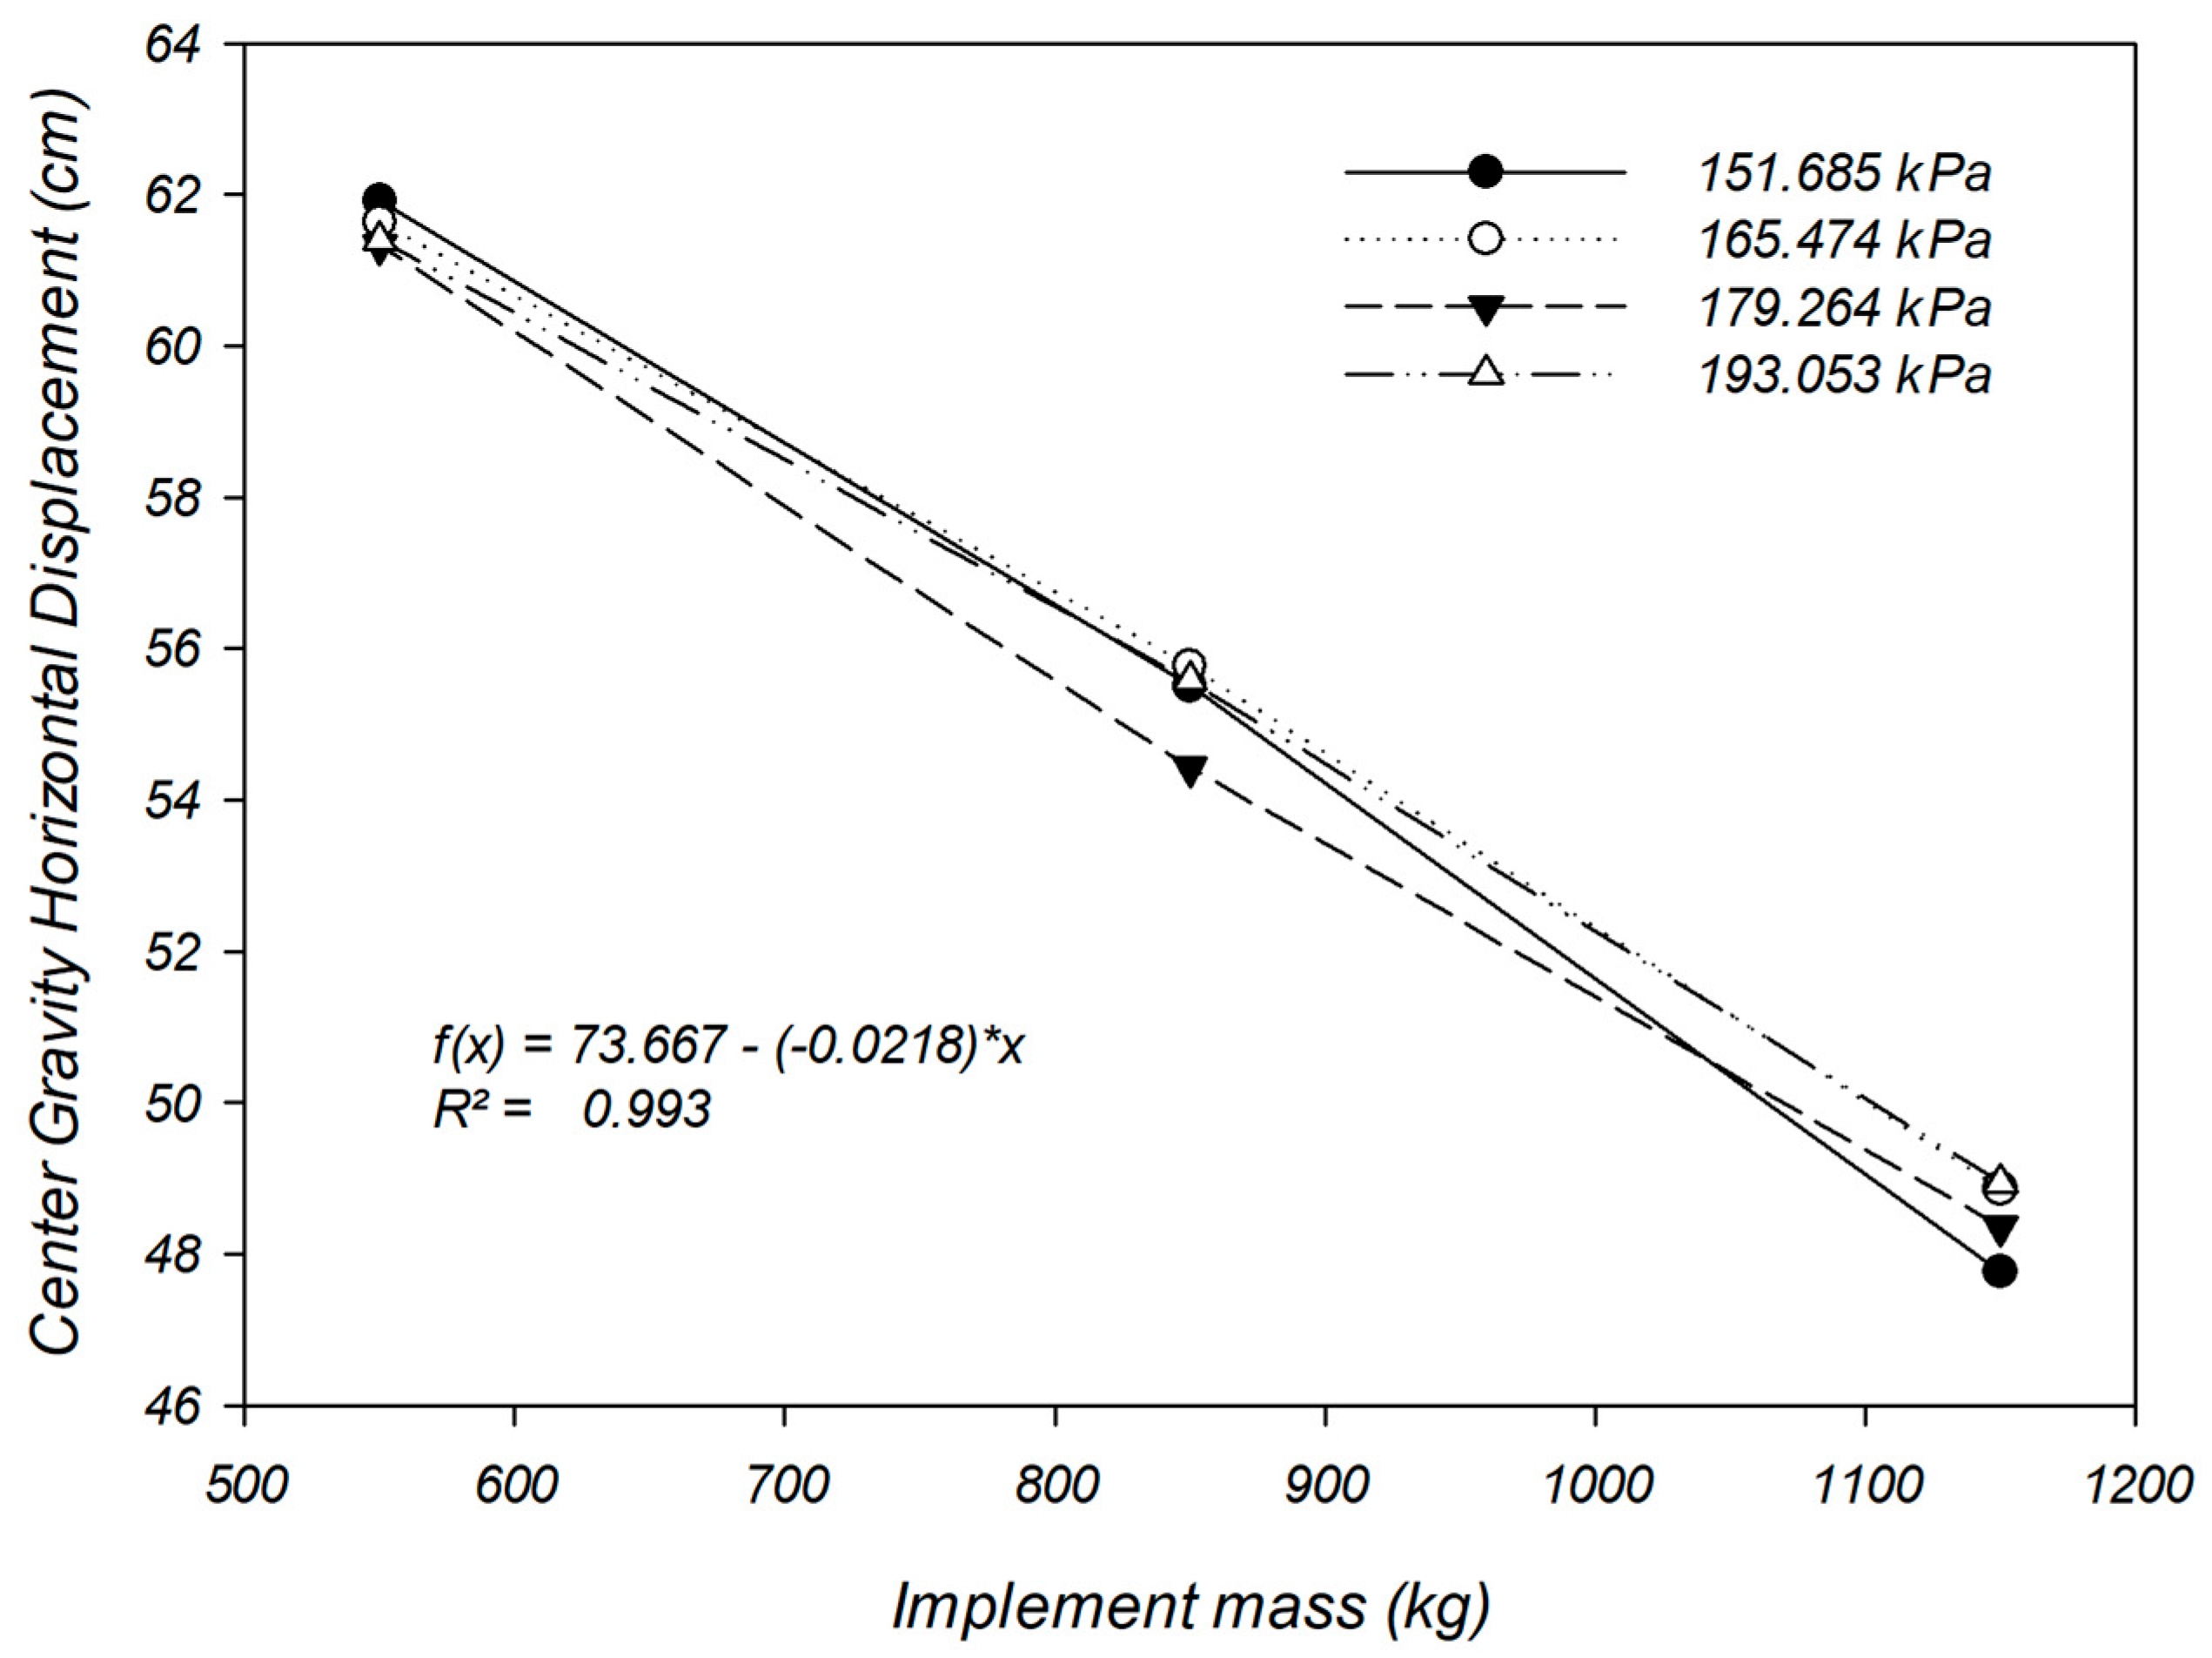
The horizontal center of gravity (CG) displacement of the tractor–sprayer system (
Figure 7) presented linear, increasing, and monotonic behavior in response to coupled sprayer mass increase. The analysis of the data in
Table 3 showed that the CG moved rearward, displaced from an average position of 61.57 cm with the implement at 550 kg to 48.49 cm at a maximum mass condition of 1150 kg, caused by mounted implement (sprayer) coupling, which altered the mechanical system configuration. Linear regression demonstrated approximately 0.0218 cm rearward movement for each kilogram added, with high correlation (R
2 ≈ 0.99), indicating that the mass increment in the hydraulic system results in systematic CG displacement toward the rear axle. Although implement mass was identified as the main factor, tire pressure and the mass × pressure interaction also had a statistically significant effect on horizontal CG displacement. In the evaluated interval, total CG rearward movement was approximately 21%, bringing the center of gravity closer to the rear axle and consequently negatively influencing the operational safety of the system.
3.3. Tire Pressure Impacts
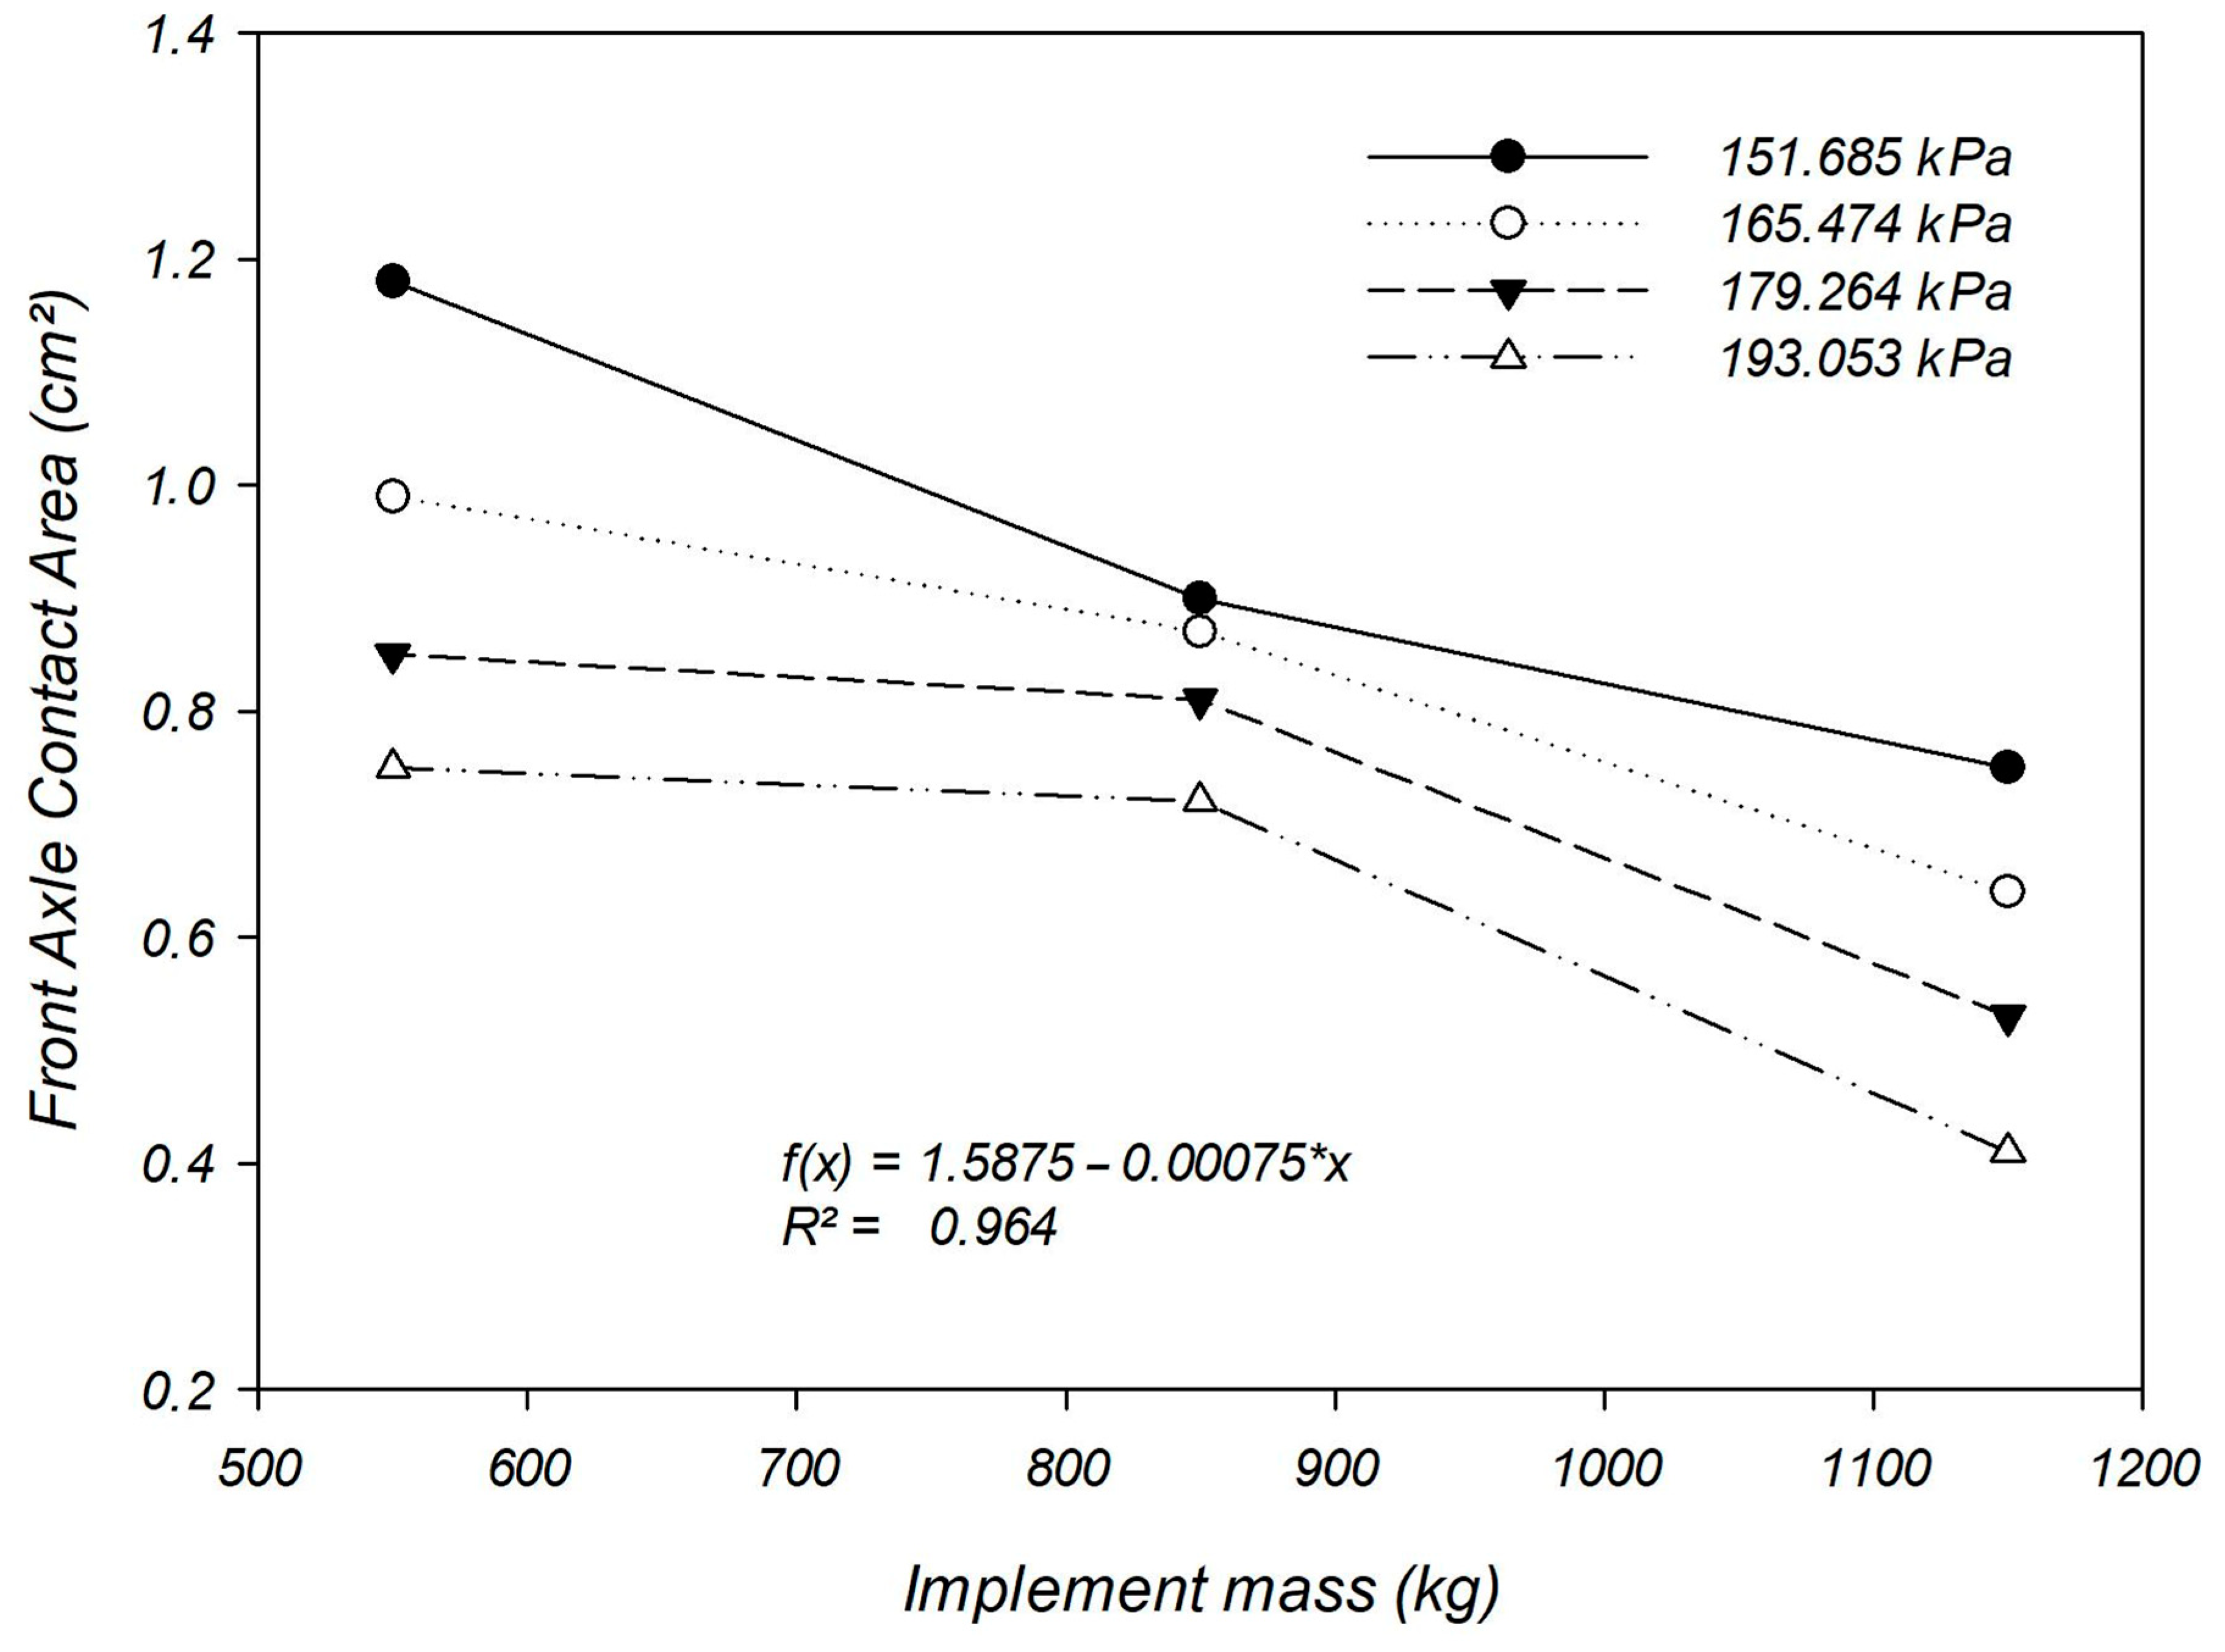
Figure 8 presents the front tire contact area values as a function of sprayer mass and tire inflation pressures. Under the lowest coupled mass (550 kg) and the lowest tire pressure (151.685 kPa), the results indicated that the contact area reached approximately 1.18 cm
2. As sprayer mass increased, this area underwent a progressive reduction, reaching approximately 0.35 cm
2 under the maximum load condition (1150 kg) and the highest tire pressure (193.053 kPa). The area decrease was systematic at all pressure levels, with the smallest areas always recorded with the combination of highest implement weight and elevated front tire pressure.
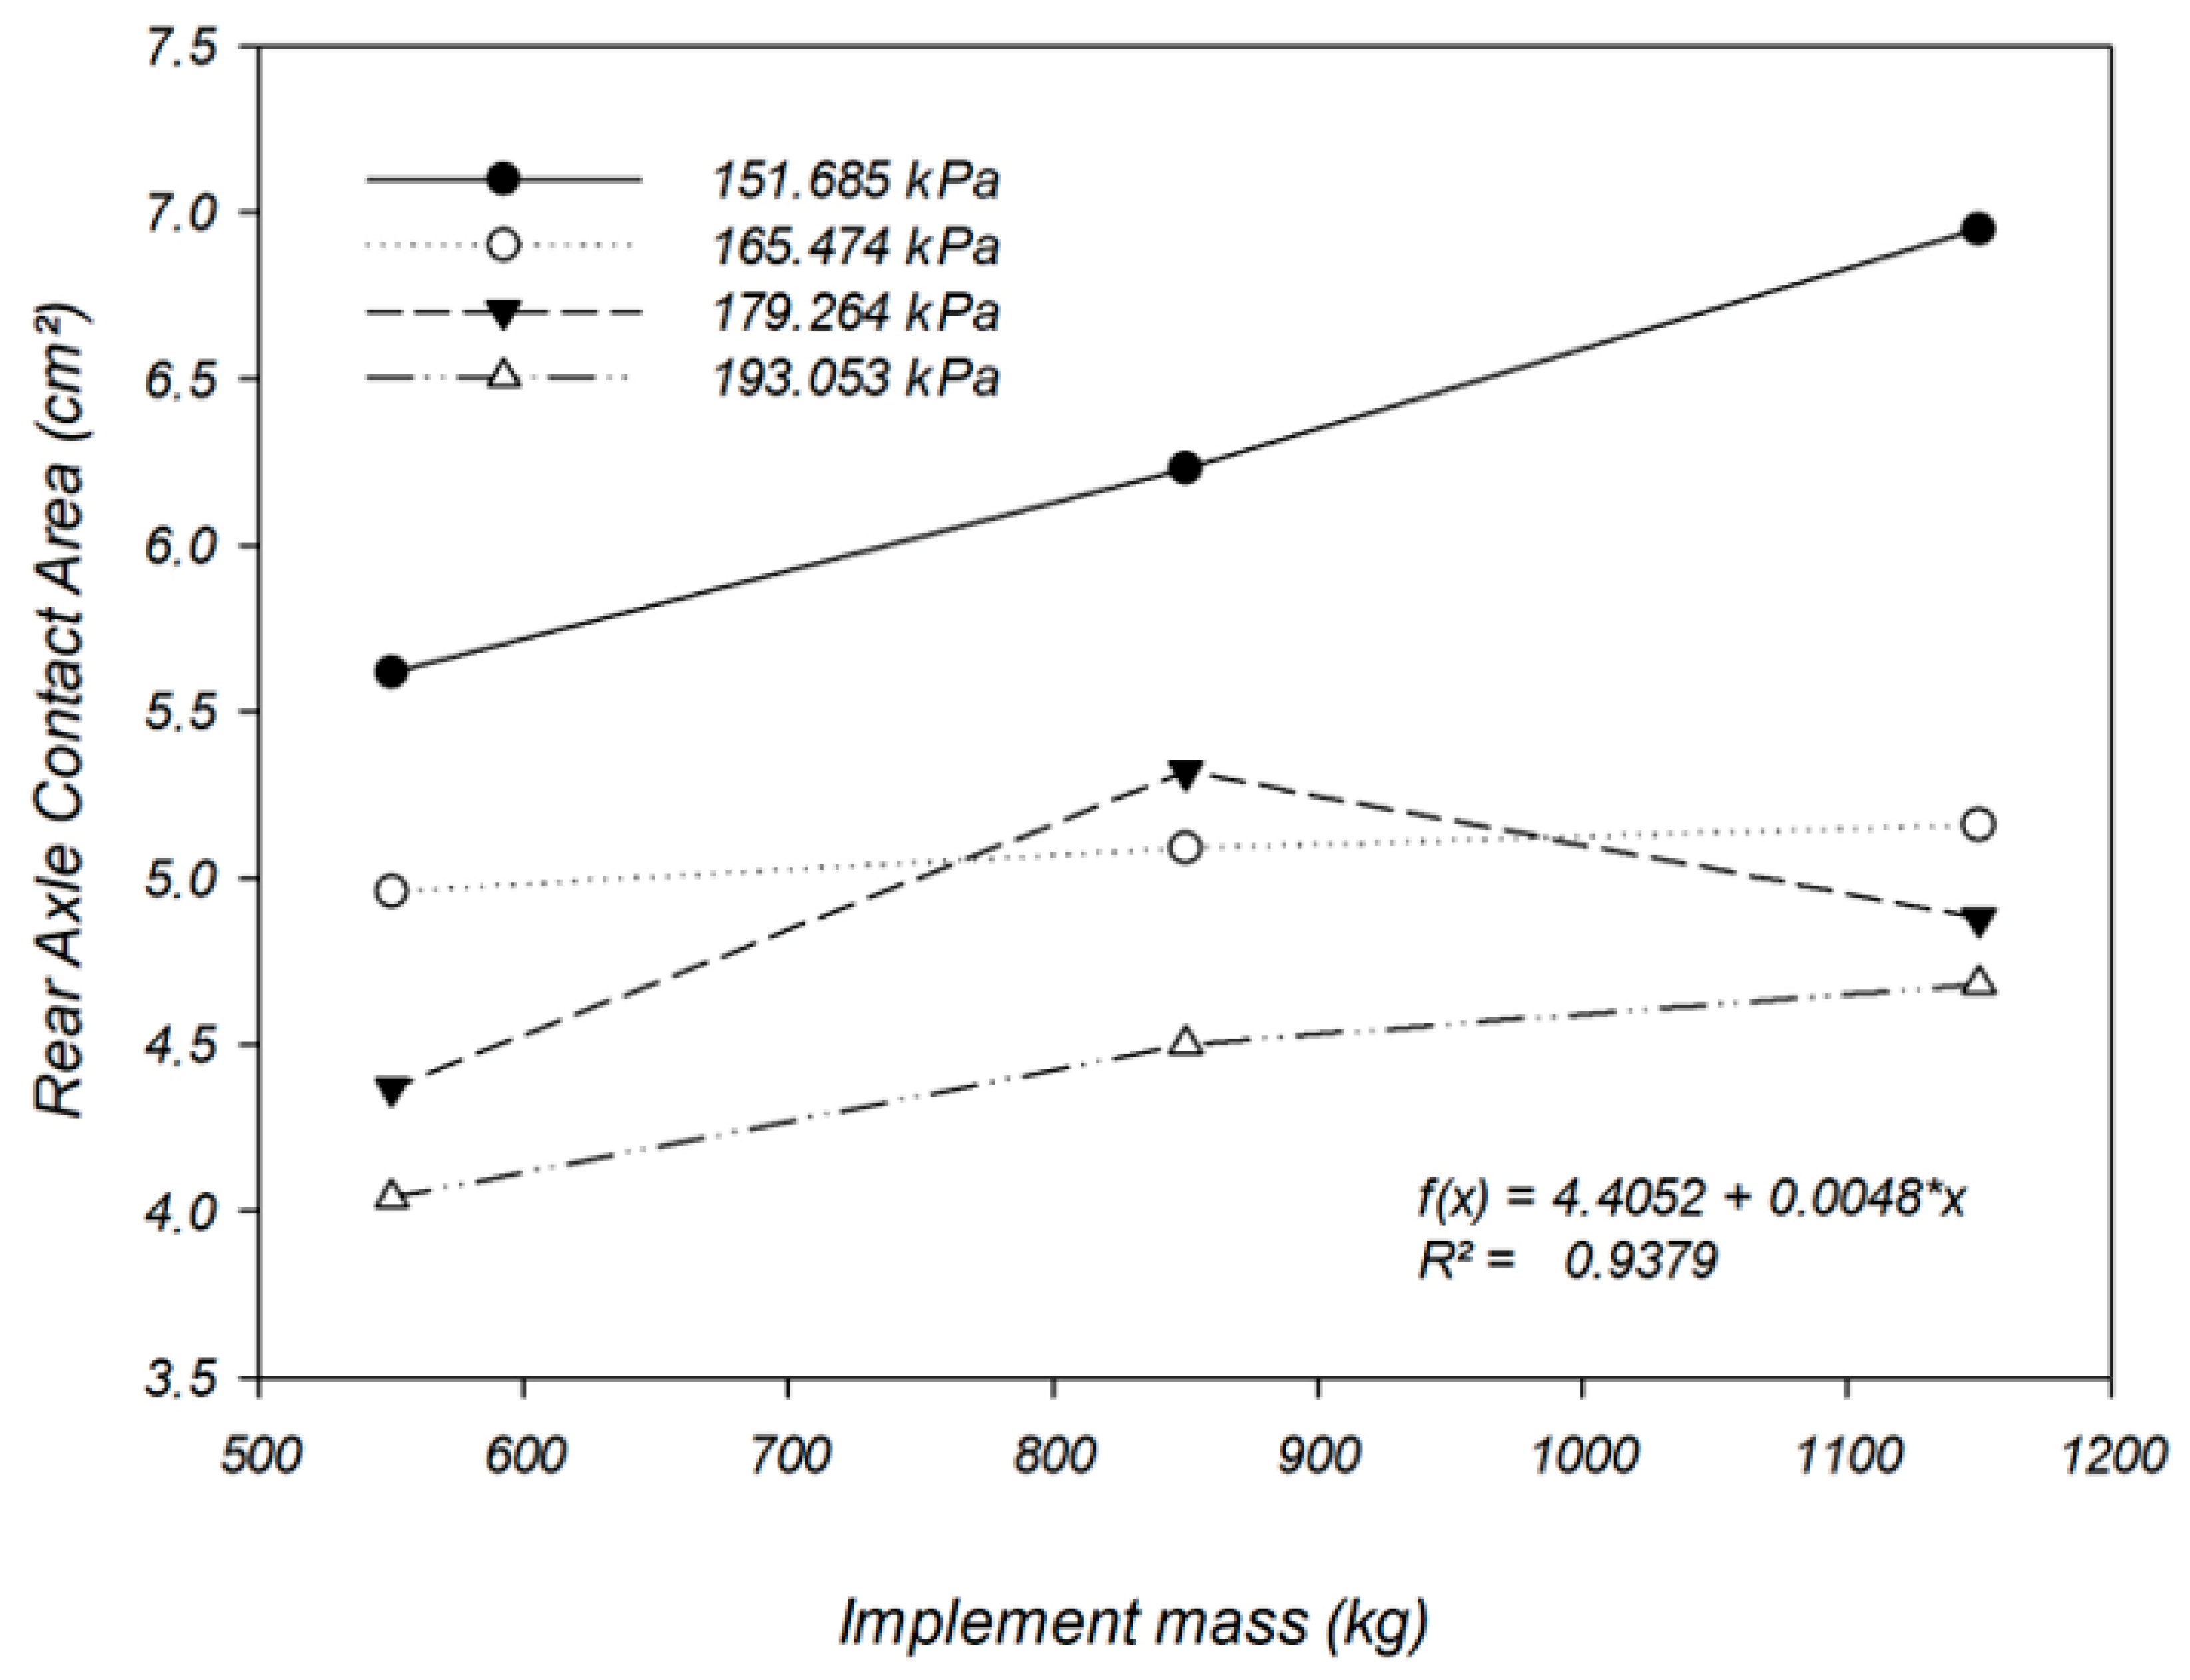
Figure 9 presents rear tire contact area variation as a function of implement mass and tire inflation pressure. At the lowest inflation pressure (151.685 kPa), the tire contact area increased from approximately 5.8 cm
2 to 7.1 cm
2 as sprayer mass was elevated from 550 kg to 1150 kg. Under this condition, the largest contact area was verified, favoring load dissipation to the soil; however, greater sensitivity to load loss was also evidenced, as indicated by the more pronounced slope of the characteristic curve. For other pressures (165.474; 179.264; and 193.053 kPa), the contact area presents smaller variations, maintaining between approximately 4.3 cm
2 and 5.6 cm
2 throughout the evaluated mass range. This occurs due to the contact area being smaller and less sensitive to load variation, demonstrating reduced deformability of more rigid tires.
The highest contact area values were always recorded under the lowest pressure and highest mass, while the smallest areas occurred at elevated pressures, even with the load increase. There is a general tendency for a contact area increase with the implement mass increment, compatible with the growing load transferred to the rear axle. The curve with the lowest pressure presents the largest contact area throughout the implement mass range, with more pronounced growth. For higher pressures, the area increase is more discrete, with almost constant behavior. This behavior is typical of non-linear tire response: above a certain load level, high-pressure tires do not proportionally increase their contact area due to greater carcass rigidity.
3.4. Lead Ratio
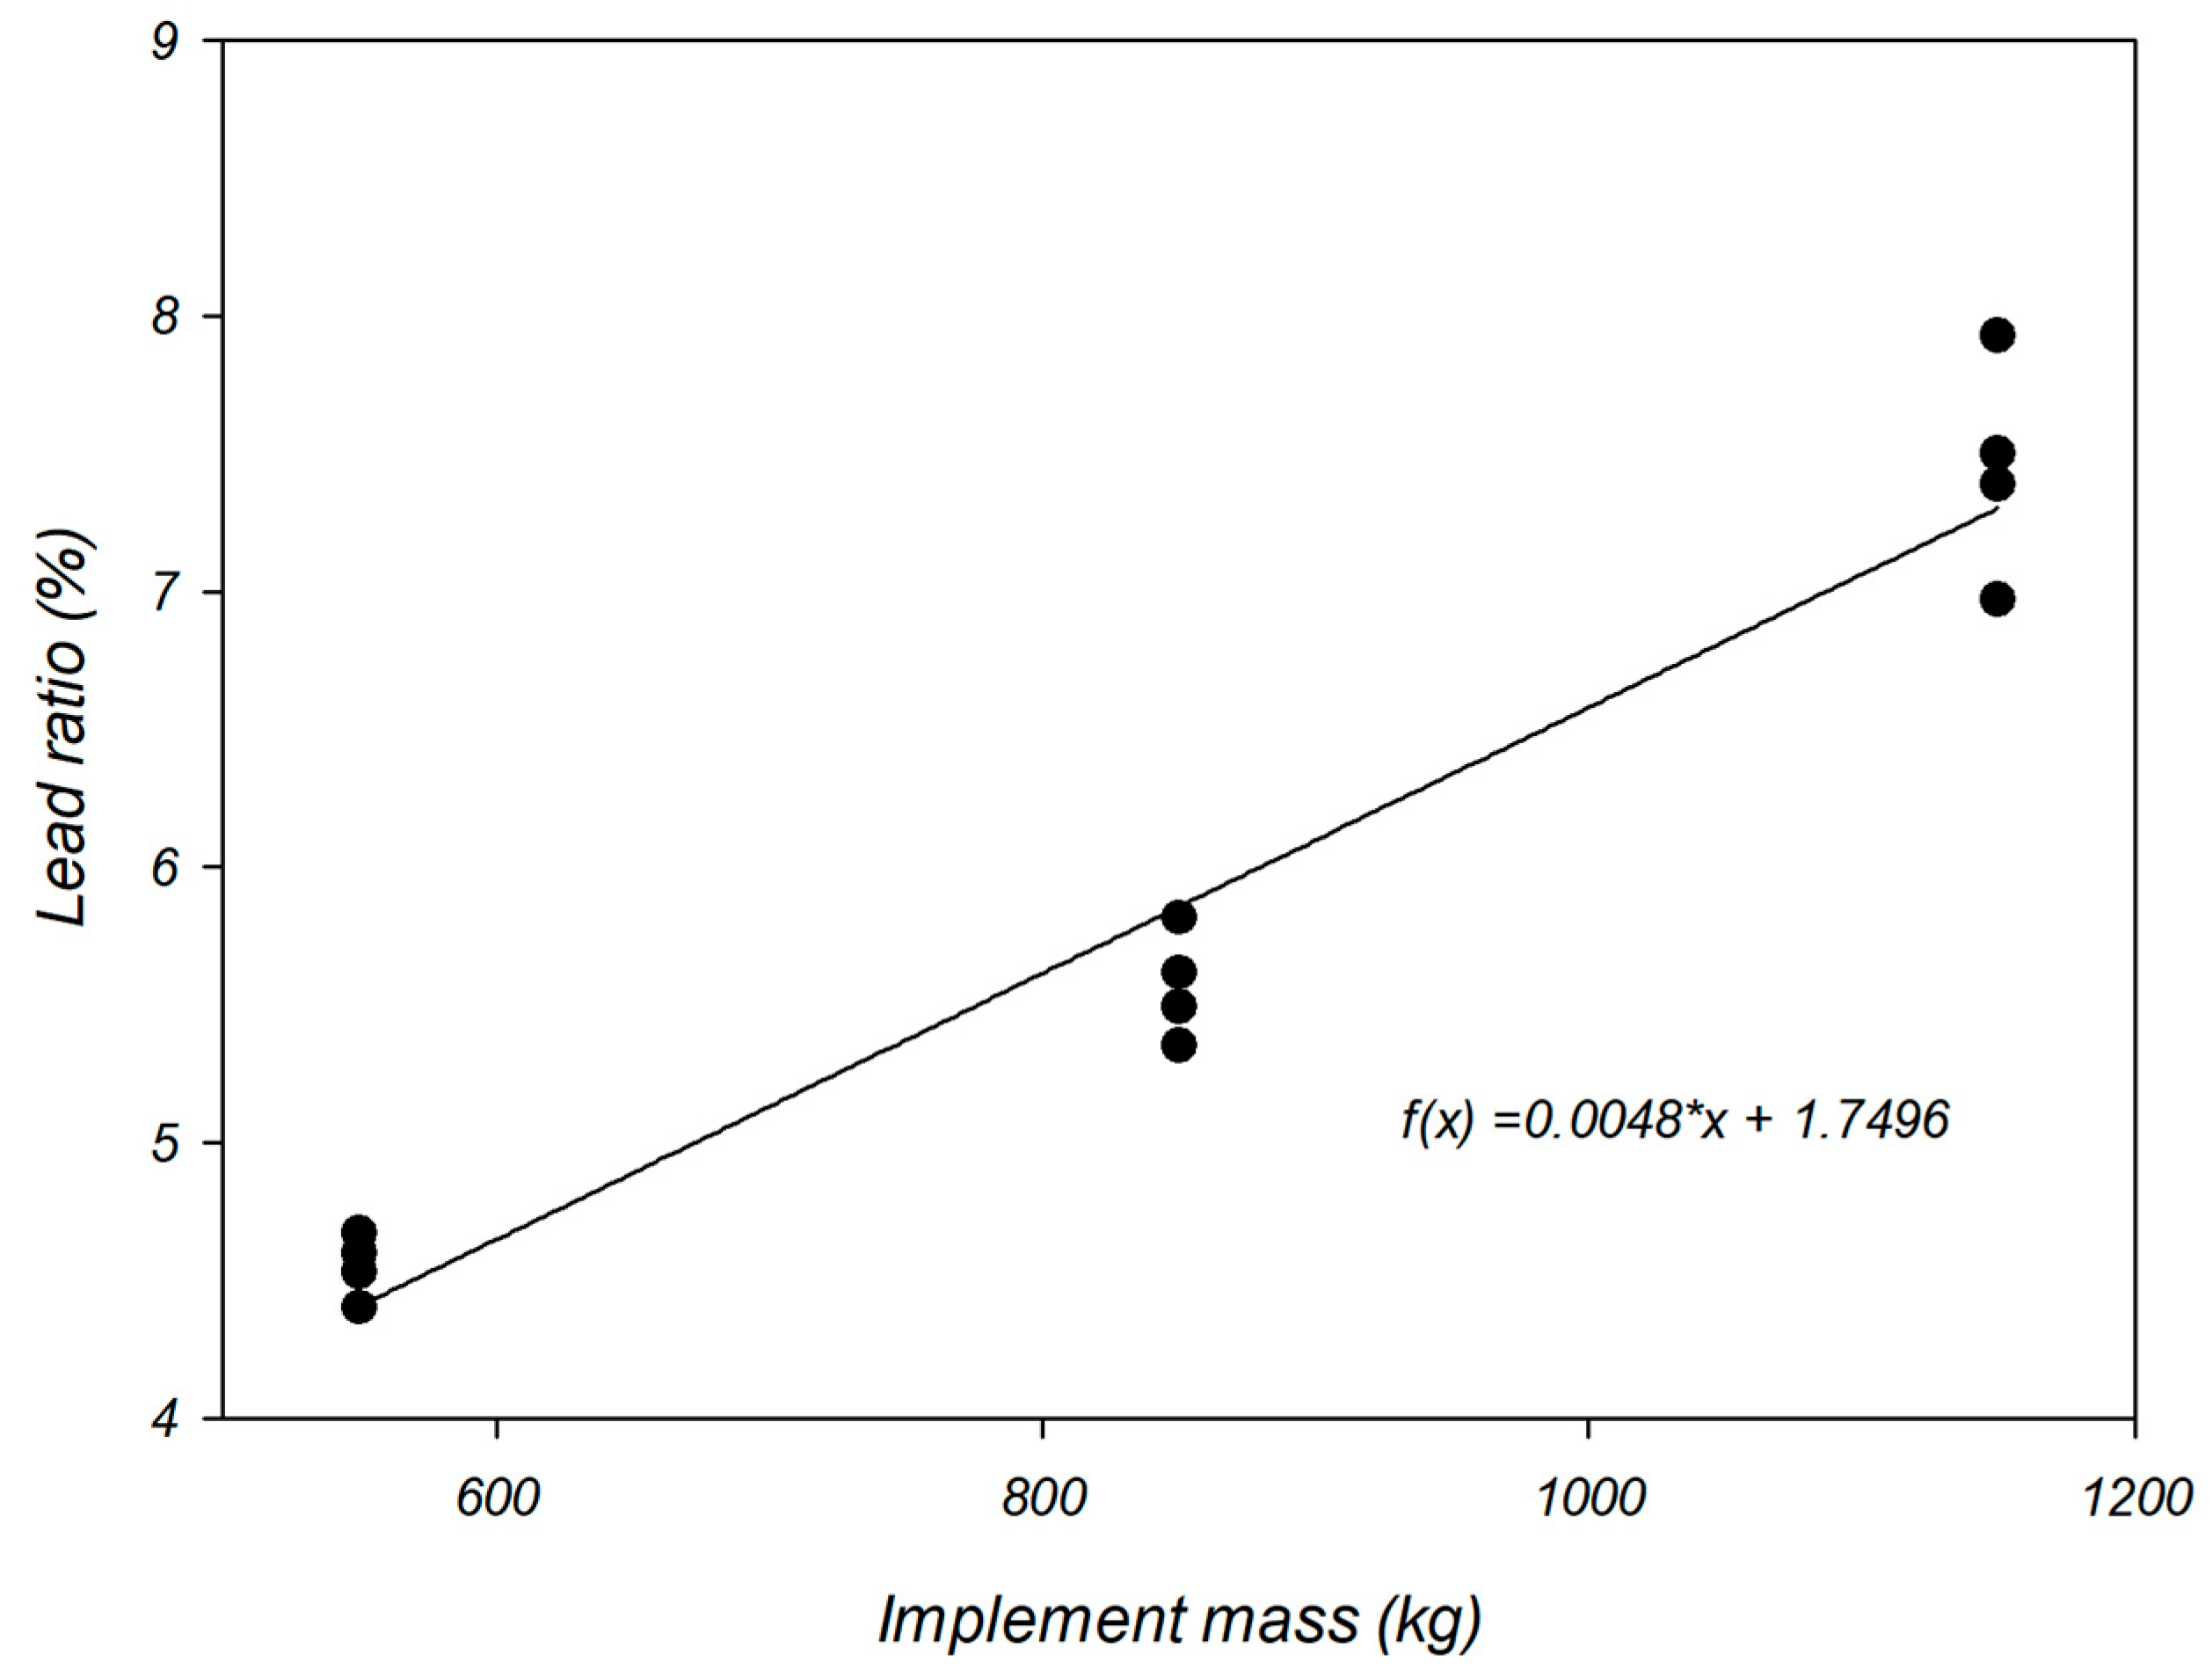
Figure 10 presents the relationship between the implement mass and tractor lead ratio. The results revealed a linear increase in the lead ratio (%) as the implement mass increased, as described by the equation f(x) = 0.0048x + 1.7496. The equation suggests that for every 100 kg added, the lead ratio increased by approximately 0.48 percentage points, which is technically significant. The lowest lead ratio value was recorded with the empty sprayer, around 1.7%, while under the highest mass condition (1150 kg), the lead ratio reached values close to 7.5% to 8%. Point dispersion indicates that the main variable influencing the lead ratio was coupled mass, with the tire pressure effect being secondary in the tested interval, a fact confirmed by the analysis of variance (
Table 3).
4. Discussion
The results obtained demonstrated predictable and linear mechanical behavior of load transfer in agricultural tractors equipped with rear implements, evidenced by determination coefficients exceeding 0.99. Additional weight force applied to the hitch by the suspended implement acts behind the tractor’s center of gravity, generating a torque moment that displaces the load to the rear axle, which acts as a lever fulcrum point.
This pattern indicates a highly mass-increment-sensitive system, reinforcing the importance of careful adjustment of operational variables such as ballasting, tire pressure, and weight distribution to ensure stability, traction, and operational safety. Mechanical behavior predictability allows operators and designers to anticipate operational risks and adopt preventive strategies that optimize tractor–implement system performance.
A substantial front axle load drop from more than 850 kg to less than 500 kg is a direct indicator of directional capacity and stability loss, particularly in maneuvers and braking. This load relief compromises front tire adhesion to soil and significantly increases the risk of the condition known as “rearing”, characterized by directional control loss. This phenomenon occurs because the torque transmission capacity from the wheel to soil is limited by the load over the wheel and the soil support capacity, observable in Equation (6):
where
m: adhesion coefficient;
FT: horizontal force transmitted;
W: weight over wheel.
Since the traffic surface was not altered and mass reduction occurred, an adhesion decrease resulted, observable in increased front-wheel rotation relative to the rear (lead ratio).
Such effects reinforce the technical recommendation to maintain at least 20% of the total tractor mass over the front axle, as a fundamental requirement to ensure safe drivability and operational stability under load transfer conditions [
10]. The R
2 equation coefficients for axle masses (approximately −0.66 and +1.63, front and rear, respectively) show that the implement load increase significantly alters tractor balance, reinforcing the need for counterbalancing through front masses. The coefficient difference indicates that not all the load lost by the front axle is directly received by the rear, as part is transferred integrally via the hitch and part is redistributed via the center of mass.
This situation demands technical countermeasures, such as applying front ballasts or implement redistribution, to restore system balance.
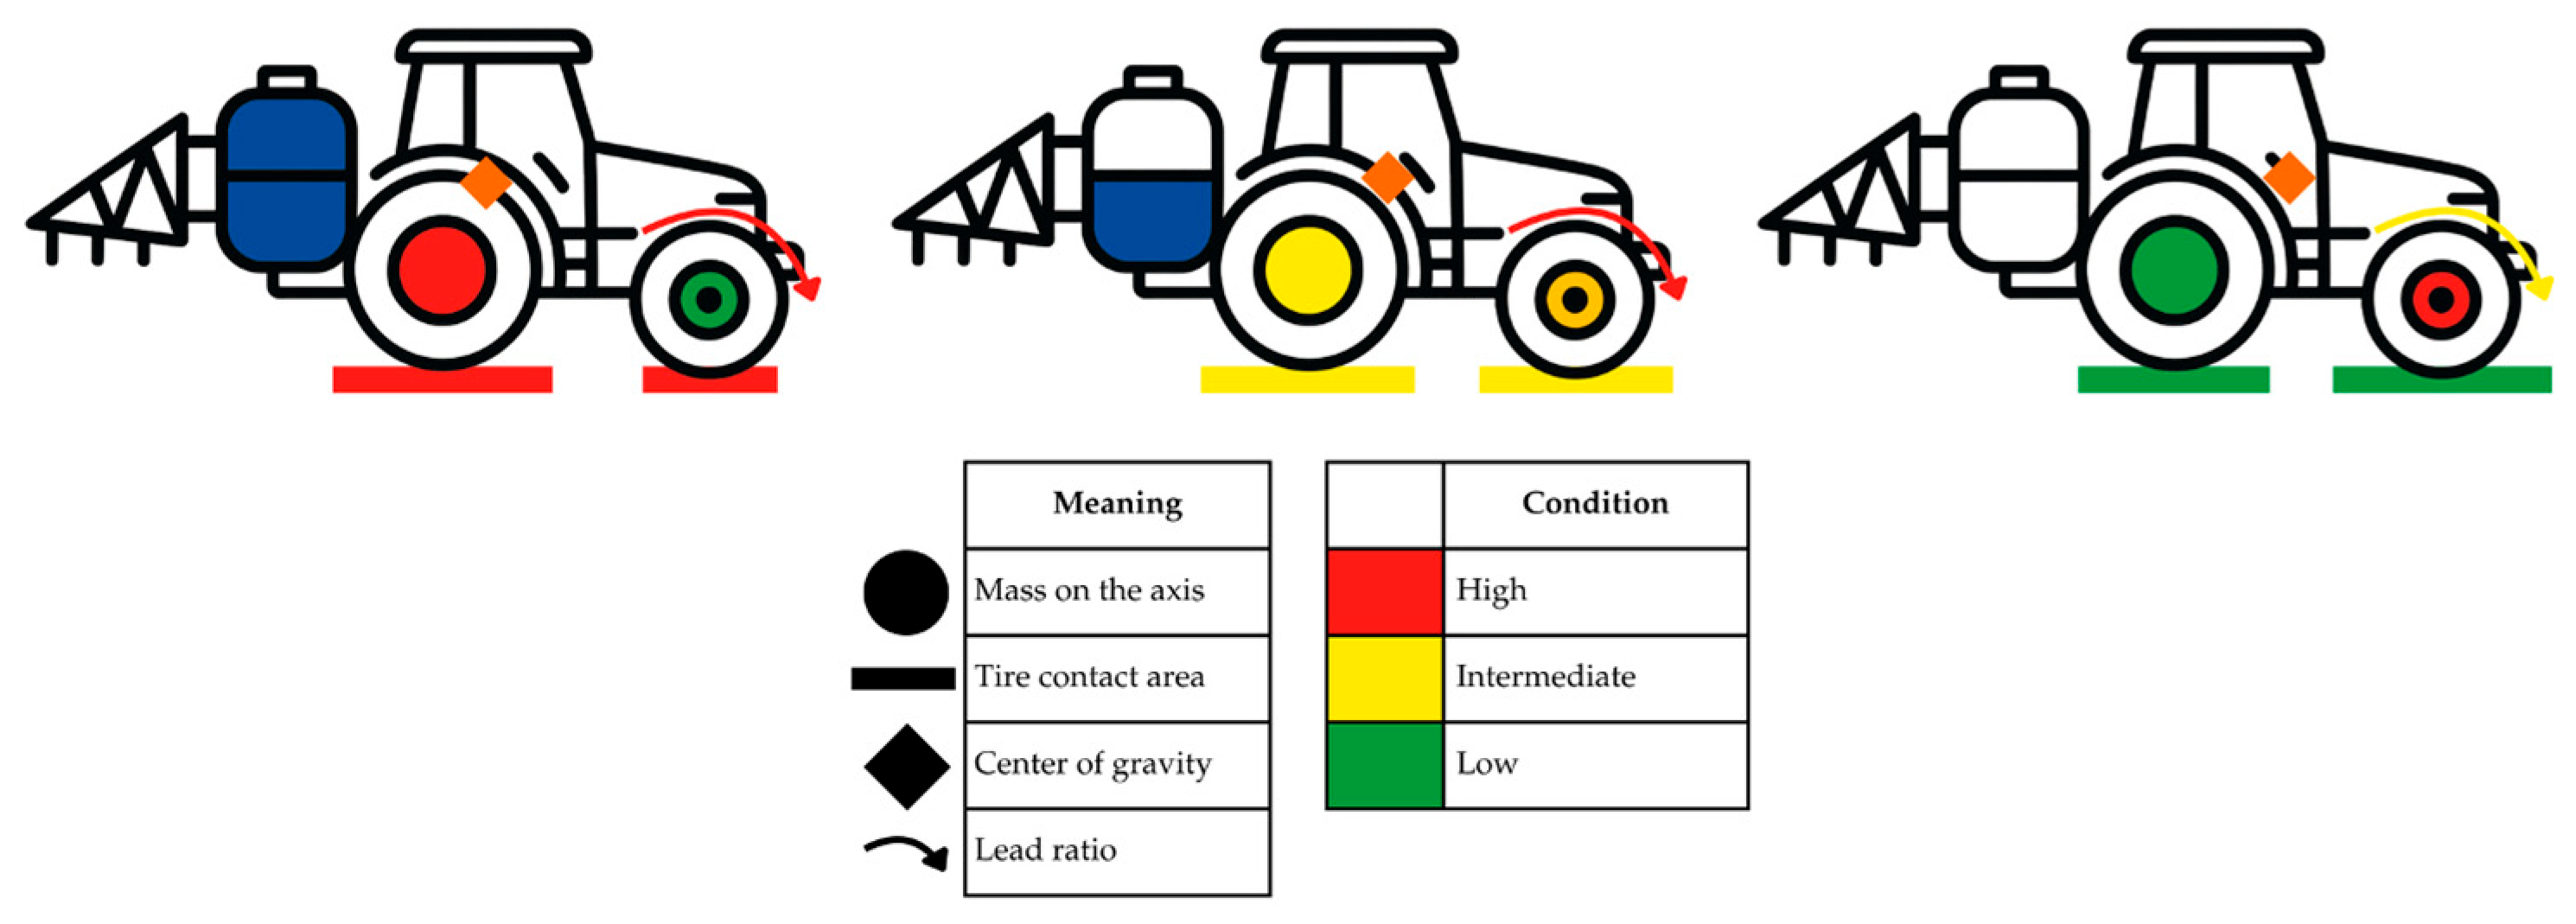
Figure 11 illustrates the sprayer–tractor unit operating conditions analyzed in this study.
Previous studies demonstrate that the load distribution between tractor axles directly influences traction performance. Various approaches have been proposed to alter this distribution, such as automatic ballasting systems with liquid transfer between reservoirs [
11] or dynamic systems applied to conventional tractors [
12]. However, not all presented effective field results or operational efficiency gains [
13].
In agricultural operations requiring sprayers with large-capacity tanks, a feasible alternative involves the installation of an auxiliary front-mounted reservoir on the tractor, allowing for a reduction in the volume of the rear-mounted tank. Additionally, embedded monitoring and dynamic adjustment technologies, such as load sensors and attitude compensation systems, have proven effective in proactively mitigating lateral instabilities in tractors operating under challenging field conditions [
14].
Nevertheless, this overload condition may elevate the risk of soil compaction and exceed the structural limits of axle components or the tires themselves. Furthermore, the increase in overall mass contributes to higher power losses associated with rolling resistance, exacerbated by the reduction in the tire dynamic radius during operation. According to [
15], elevated axle loads, combined with inappropriate tire configurations, intensify soil bulk density, degrade the soil physical structure, and restrict root development.
The statistical analysis conducted in this study demonstrated that while implement mass was the dominant factor influencing load transfer between axles, tire inflation pressure and, importantly, the interaction between both variables also exerted a statistically significant effect on the load distribution over the front and rear axles, as well as on the displacement of the center of gravity. This finding underscores that tire inflation pressure is not merely a factor for adjusting the contact area but also a critical tool with a proven impact on load distribution and, consequently, on surface compaction control.
The analysis of tire contact area further confirmed this influence, showing that reduced load on front tires, combined with elevated internal pressures, decreased tire deformation and soil traction capacity. Conversely, rear tires exhibited a substantial increase in contact area under higher loads and lower inflation pressures, favoring tractive performance. This behavior is consistent with the findings of [
16,
17], who emphasized the importance of radial tire use and appropriate inflation pressure settings to enhance the net tractive force, expand the contact area, and reduce soil contact pressures.
Another noteworthy result was the rearward displacement of the tractor–implement system’s center of gravity (CG), which exhibited a linear shift of approximately 0.022 cm per kilogram of added mass, accumulating more than 11 cm under the full-tank condition.
Moreover, an increase in the lead ratio was observed as implement mass increased, remaining within acceptable operational limits (<5%) only when the sprayer tank was empty. Lead ratios exceeding this threshold compromised traction efficiency and resulted in increased fuel consumption and accelerated wear of transmission components. These effects are attributable to the elevated lead ratio induced by rear axle overload and load redistribution, as demonstrated by [
18], who highlighted the importance of load balancing and proper tire–soil interaction to maintain tractor energy efficiency under high-draft conditions. As a direct consequence of increased lead, the relative rotational speed of the front wheels rose, given their reduced load and lower deformation, which maintained or even increased their rotational speed and, consequently, the lead ratio.
In a study by [
19], the combination of moderate tire inflation pressures with well-distributed ballast yielded significant improvements in traction efficiency without increasing energy consumption, even under controlled track conditions. Therefore, excessive tire slip resulting from improper inflation pressure settings negatively affects directional stability and reduces the tractor’s tractive capacity, particularly when operating on highly deformable soils [
20].
5. Conclusions
The mounted implement mass was identified as the primary factor responsible for load redistribution between the tractor axles, promoting a rearward shift of the system’s center of gravity. This effect compromised operational stability, exceeding regulatory safety limits under maximum load conditions. The observed behavior exhibited a linear trend, with high coefficients of determination (R2 > 0.99), highlighting the strong predictability of the phenomenon and reinforcing the reliability of the collected data. Therefore, the tractor’s structural response to implement mass is more significantly influenced by the global center of mass position and the coupling geometry than by tire stiffness.
The load transfer from the front to the rear axle altered the tire deformation patterns, consequently affecting the contact areas. The magnitude of these variations depended on the tire inflation pressure, with more pronounced changes observed at lower inflation levels.
The lead ratio was directly influenced by the increase in mass, raising the traction demand on the drive wheels. Although tire pressure did not present a statistically significant effect on the lead ratio, it proved to be a critical factor in load distribution and in determining the center of gravity position.
It can be concluded that the coupling of mounted implements affects both the static and kinematic dynamics of the tractor–implement system in a coordinated manner. The adoption of management strategies, such as proper tire pressure adjustment, additional front axle ballast optimization, and continuous lead ratio monitoring, is essential for ensuring operational efficiency, reducing energy consumption, and preserving soil physical conditions.
Author Contributions
Conceptualization, B.P.L., I.C.d.O.V., B.S.-S. and T.R.F.; methodology, B.P.L., T.R.F. and A.P.; validation, B.P.L. and T.R.F.; formal analysis, B.P.L., T.R.F. and I.C.d.O.V.; investigation, B.P.L., T.R.F. and I.C.d.O.V.; resources B.P.L., T.R.F. and A.P.; data curation, B.P.L. and T.R.F.; writing—original draft preparation, B.P.L., I.C.d.O.V., B.S.-S. and T.R.F.; writing—review and editing, B.P.L., I.C.d.O.V., B.S.-S., T.R.F., R.P.d.S. and S.P.J. All authors have read and agreed to the published version of the manuscript.
Funding
This research received no external funding.
Data Availability Statement
All data supporting the findings of this study are publicly available and are fully included in the published tables and figures of this article.
Acknowledgments
The author would like to express sincere gratitude to God for granting strength and perseverance throughout the development of this research. Special thanks are also extended to the team at Alvorada Sistemas Agrícolas for providing the equipment and experimental area essential for this study. The author is also grateful to the GTM (Agricultural Machinery Technology Group) at UFSM—Cachoeira do Sul campus—and the LAMMA (Laboratory of Agricultural Machinery and Mechanization) for their technical support and valuable contributions.
Conflicts of Interest
The authors declare no conflicts of interest.
Abbreviations
The following abbreviations are used in this manuscript:
| MF | front axle mass |
| MR | rear axle mass |
| AF | front axle tire contact area |
| AR | rear axle tire contact area |
| CG | center of gravity displacement |
References
- Wong, J.Y. Theory of Ground Vehicles, 5th ed.; John Wiley & Sons: Hoboken, NJ, USA, 2022. [Google Scholar]
- Correia, T.P.S.; Lopes, A.G.C.; de Lima, G.P.B.; de Souza, I.D.; Taveira, W.M.C.F.; Pereira, G.G. Desempenho operacional e distribuição longitudinal de sementes por semeadora de precisão submetida à diferentes calibragens do rodado. Nativa 2020, 8, 679–686. [Google Scholar] [CrossRef]
- Kim, Y.; Lee, J.; Choi, H.; Park, J.; Kang, S. Stability Analysis of a Tractor: A Review. Precis. Agric. 2022, 4, 196. [Google Scholar] [CrossRef]
- Čupera, J.; Bauer, F.; Porteš, P.; Šlimarík, D.; Fajman, M. Optimizing ploughing performance: The role of traction-control cylinder pressure on tractor wheel load. Soil Tillage Res. 2024, 237, 105456. [Google Scholar] [CrossRef]
- Lopes, A.G.C.; Correia, T.P.S.; de Lima, G.P.B.; de Souza, I.D.; Taveira, W.M.C.F.; Pereira, G.G. Operational performance of an agricultural tractor under different tire inflation pressures in the subsoiling operation. Rev. Agric. Neotrop. 2020, 7, 59–64. [Google Scholar] [CrossRef]
- Varani, M.; Mattetti, M.; Maraldi, M.; Molari, G. Mechanical devices for mass distribution adjustment: Are they really convenient? Agronomy 2020, 10, 1820. [Google Scholar] [CrossRef]
- Janulevičius, A.; Damanauskas, V. Validation of relationships between tractor performance indicators, engine control unit data and field dimensions during tillage. Mech. Syst. Signal Process. 2023, 191, 110201. [Google Scholar] [CrossRef]
- Damanauskas, V.; Janulevičius, A. Influence of adjustable front ballast on tractor fuel consumption at winter wheat stubble harrowing. In Proceedings of the Engineering for Rural development: 20 th International Scientific Conference, Jelgava, Latvia, 26–28 May 2021. [Google Scholar] [CrossRef]
- Wen, C.-K.; Ren, W.; Zhu, Q.-Z.; Zhao, C.-J.; Luo, Z.-H.; Zhang, S.-L.; Xie, B.; Meng, Z.-J. Reducing operation emissions and improving work efficiency using a pure electric wheel drive tractor. Engineering 2024, 37, 230–245. [Google Scholar] [CrossRef]
- Watanabe, M.; Kazama, K. Enhancing Stability through Passive Axle Suspension in Nonlinear Bouncing Agricultural Tractor. In Proceedings of the 21st International and 12th Asia-Pacific Regional Conference of the ISTVS, Anaheim, CA, USA, 28–31 July 2024. [Google Scholar] [CrossRef]
- Clark, R.L.; Vande Linde, G. A rapid automatic tractor ballast system. Trans. ASAE 1993, 36, 1261–1266. [Google Scholar] [CrossRef]
- Zhang, N.; Chancellor, W.J. Automatic Weight-Transfer Control for Tractor; ASAE Paper No. 88-1001; ASAE: St. Joseph, MI, USA, 1988. [Google Scholar]
- Serrano, J.M.; Peça, J.O.; Silva, J.R.; Marquez, L. The effect of liquid ballast and tyre inflation pressure on tractor performance. Biosyst. Eng. 2009, 102, 51–62. [Google Scholar] [CrossRef]
- Jiang, H.; Zhang, Y.; Liu, R.; He, D. Design and lateral stability analysis of an attitude adjustment tractor for moving on side slopes. Appl. Sci. 2024, 14, 2220. [Google Scholar] [CrossRef]
- Rivero, D.; Bonilla, C.; Bechini, L.; Castrignanò, A. Tyre configuration and axle load of front-wheel assist and four-wheel drive tractors effects on soil compaction and rolling resistance under no-tillage. Agriculture 2022, 12, 1961. [Google Scholar] [CrossRef]
- Wang, J.; Li, B.; Han, D.; Liu, W.; Zhu, Y. Evaluation of traction characteristics of tractor tires on loose soils: Simulation and experimental research. INMATEH-Agric. Eng. 2023, 71, 3. [Google Scholar] [CrossRef]
- Brennenstuhl, M.; Czarnecki, J.; Białczyk, W. Assessment of Tractor Tires Used in Forest Conditions in Terms of Traction Performance and Impact on Ground. Croat. J. For. Eng. 2024, 45, 97–114. [Google Scholar] [CrossRef]
- Shao, X.; Yang, Z.; Mowafy, S.; Zheng, B.; Song, Z.; Luo, Z.; Guo, W. Load characteristics analysis of tractor drivetrain under field plowing operation considering tire-soil interaction. Soil Tillage Res. 2023, 227, 105620. [Google Scholar] [CrossRef]
- Franceschetti, B.; Bruno, R.; Milani, M.; Guzzomi, F.G. Influence of Ballast and Tyre Inflation Pressure on Traction Performance of Agricultural Tractors Evaluated in Trials on Concrete Track. AgriEngineering 2025, 7, 109. [Google Scholar] [CrossRef]
- Janulevičius, A.; Damanauskas, V. Prediction of tractor drive tire slippage under different inflation pressures. J. Terramech. 2022, 101, 23–31. [Google Scholar] [CrossRef]
| Disclaimer/Publisher’s Note: The statements, opinions and data contained in all publications are solely those of the individual author(s) and contributor(s) and not of MDPI and/or the editor(s). MDPI and/or the editor(s) disclaim responsibility for any injury to people or property resulting from any ideas, methods, instructions or products referred to in the content. |
© 2025 by the authors. Licensee MDPI, Basel, Switzerland. This article is an open access article distributed under the terms and conditions of the Creative Commons Attribution (CC BY) license (https://creativecommons.org/licenses/by/4.0/).


