Abstract
The mismatch between the conveying capacity of sugarcane harvesters and the feeding amount is the main cause of blockages in the conveying system. To address this issue, this paper proposes a control system that integrates machine vision technology with a programmable logic controller (PLC). First, the YOLOv8n segmentation algorithm is combined with depth data to detect the cane intake amount. Then, through interactive experiments, the relationship between roller speeds and feeding amount is explored, and PLC control rules are established. The experimental results show that the system has an average detection error of 5.69%, an overall response time of 2 s, and the blockage rate at the maximum feeding amount is reduced from 17.76% (without control) to 4.32% (with control).
1. Introduction
Sugarcane, an important economic crop, is widely cultivated in regions such as Guangxi and Yunnan in China [1]. However, these areas are mostly hilly, and sugarcane planting is scattered and uneven, which makes sugarcane harvesters prone to blockages in the conveyor system when the feeding amount exceeds its maximum capacity during operation [2]. The conveying capacity of the system is related to the rotational speed of the rollers in the conveying system [3]. When the roller speed is too slow, a large amount of sugarcane remains in the conveying channel and cannot be discharged in time, which is likely to cause blockage [4]; on the other hand, when the roller speed is too fast, it leads to an increase in energy consumption costs. However, the roller speeds are generally fixed, making it difficult to adjust them promptly. Therefore, there is an urgent need to explore efficient control methods for sugarcane harvesters, which is crucial for improving both harvesting quality and efficiency.
The selection of roller speeds is closely linked to changes in the feeding amount. Currently, research on feeding amount detection methods can be categorized into those based on torque, pressure, and power [5,6,7,8]. Jiang et al. [9] performed decomposition, denoising, and reconstruction of the torque signal through wavelet transform analysis of the noise frequency range and established the fitting relationship between torque and feeding amount. Lu et al. [10] and Jie et al. [11] established a linear relationship between pressure and feeding volume by measuring the pressure on the closed hydraulic oil system or the inclined conveyor at the outlet using sensors. However, due to the complex terrain in field operations, the inclination of the combine harvester causes significant measurement errors in the pressure sensor. Sun et al. [12] developed a mathematical model relating the power of the harvester’s drive shaft to the feeding amount by detecting the power of the harvester’s drive shaft, thereby enabling rapid detection of the feeding amount. However, these feeding amount detection techniques can only indirectly reflect changes in the feeding amount and require the establishment of a strict correlation with the feeding quantity.
In recent years, the rapid development of machine vision technologies has provided new solutions for feeding amount detection. Sadeghi-Tehran et al. [13], Wang et al. [14], and Xiong et al. [15] demonstrated the feasibility of segmenting and counting crops. Dandrifosse et al. [16], based on the YOLOv5 model and the DeepMAC segmentation method, used two RGB cameras to convert the number of wheat spikes in the images into spike density, further estimating the wheat feeding amount. Chen et al. [17] predicted the feeding amount by extracting the pixel values of the rice in front. However, research on these feeding amount detection technologies has mainly focused on small-grain crops such as corn, wheat, and rice [18,19,20,21]. This approach has certain limitations when applied to sugarcane, where the top leaves are messy and easily obscure the main body of the crop, so it is difficult to accurately obtain the sugarcane density from above.
In contrast, calculating the sugarcane volume from 3D point cloud data and using it as the feeding amount standard seems feasible. Yan et al. [22] used LiDAR to perform 3D scanning of canopy features and created a 3D point cloud. They proposed a slicing convex hull method for volume estimation, summing the volumes of each slice to obtain the total canopy volume. Experimental results showed that this method’s estimates were close to the real values. Mirbod et al. [23] used two models (Faster R-CNN and Mask R-CNN) to segment the shape of apples and calculated their surface area and diameter using depth information obtained from a stereo camera. Qi et al. [24] used YOLOv8-seg to obtain masks and bounding boxes for the buds and stems and combined RGB-D data to estimate the diameter of tomato stems. Previous studies have significantly contributed to the advancement of feeding amount detection technology. Unfortunately, there has been no research on feeding amount detection for sugarcane harvesters. Therefore, to address the blockage problem caused by the mismatch between the conveying capacity and feeding amount in sugarcane harvesters, this study adopts sugarcane volume as a measure of the feeding amount. The YOLOv8 instance segmentation model is used to extract the sugarcane mask, which is then combined with depth data obtained from a binocular camera to extract the 3D point cloud of sugarcane, thereby enabling the detection of the feeding volume. Additionally, by exploring the relationship between feeding volume and roller speeds, a PLC control system based on volume detection was designed. Through volume detection experiments and control performance tests, it was evaluated whether the system could accurately detect the sugarcane feeding volume and adjust the roller speed based on the feed rate to improve blockage conditions.
2. Materials and Methods
2.1. Device Design
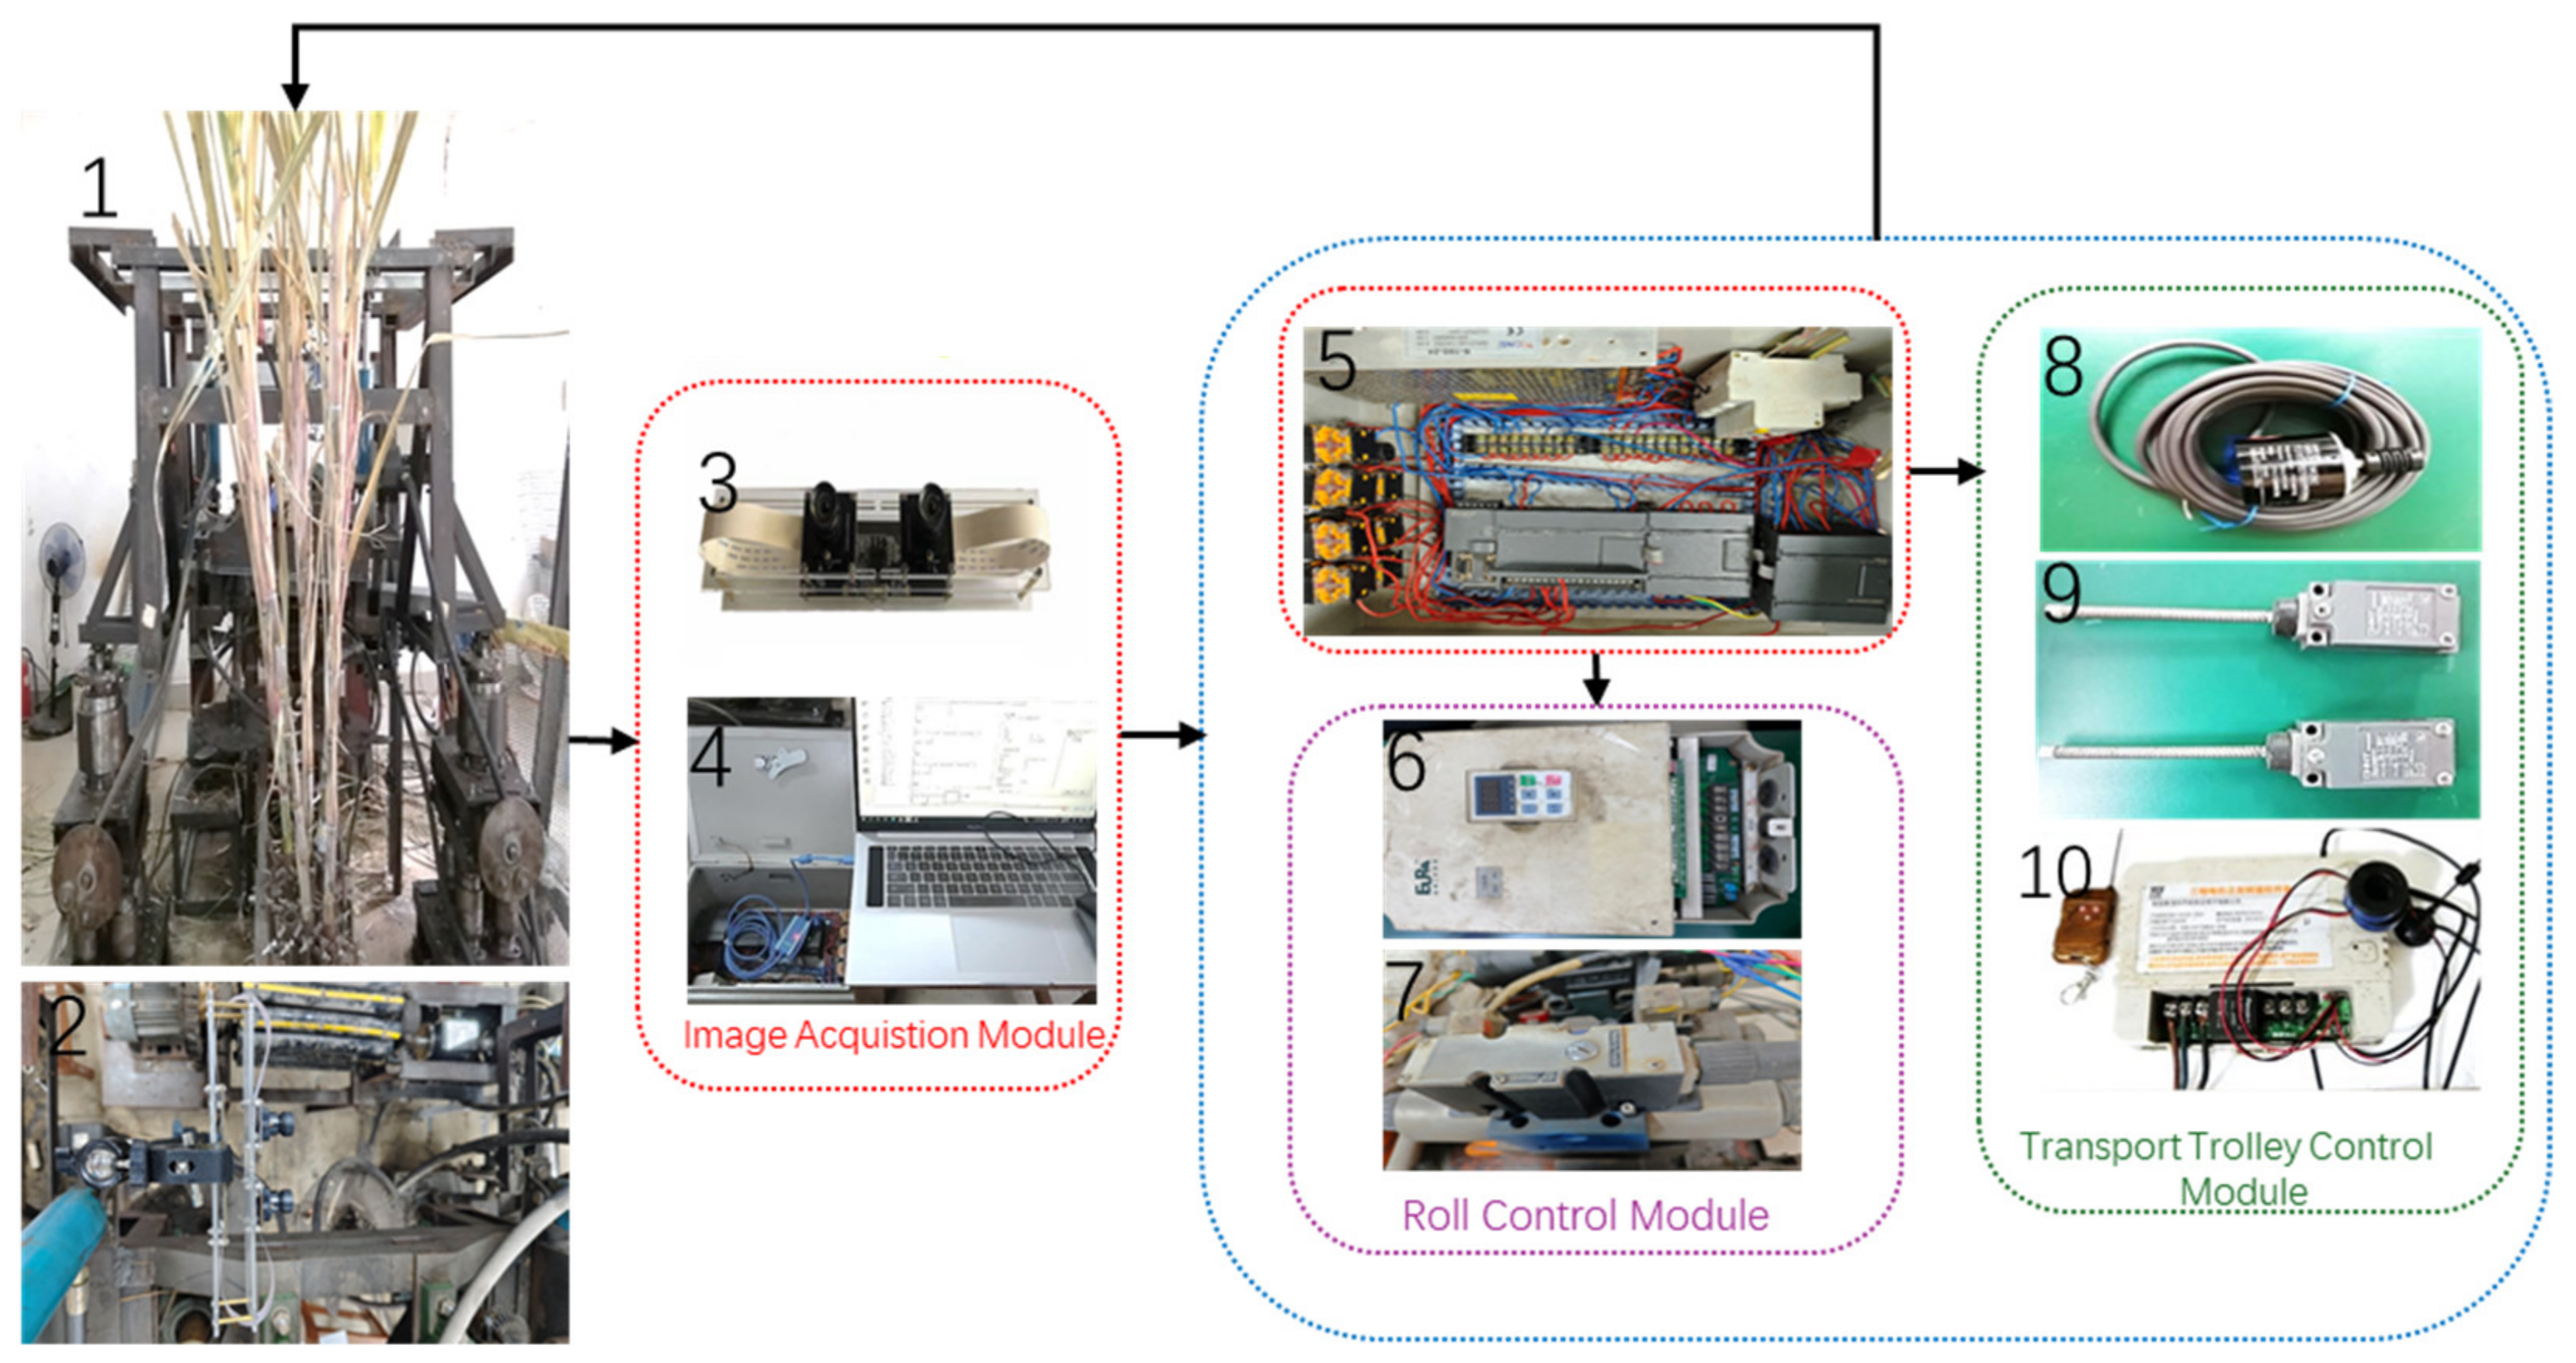
The machine vision-based conveying control system for the sugarcane harvester consists primarily of two parts: the image acquisition module and the conveyor control module, as shown in Figure 1.

Figure 1.
Sugarcane conveying test platform: 1. sugarcane harvester prototype; 2. camera mounting position; 3. binocular camera; 4. laptop; 5. PLC control box; 6. frequency converter; 7. electro-hydraulic proportional valve; 8. stroke control switch; 9. the encoder; 10. motor forward and reverse rotation controller.
- Image acquisition module: This module consists of a binocular camera and a laptop. The binocular camera (BOPIXEL, Wuhan, China) has an image resolution of 2560 × 960 pixels, a focal length of 3.4 mm, and uses the USB 3.0 protocol. The camera is installed above the blade and feed roller, with an installation angle of 60° to the ground and a distance of 800 mm from the feeding roller. The laptop (CPU: Intel Core i7; Memory: 16 GB; Graphics card: NVIDIA RTX 3060; Operating System: Windows 10) processes the image data collected by the camera to obtain the sugarcane volume information, which is then passed to the PLC controller.
- Conveyor control module: This module includes a roller control module and a conveyor trolley control module. The roller control module consists of an electro-hydraulic proportional valve (4WRAE10W30-2X/G24K31/A1, UADE, Beijing, China) and a digital frequency converter (F1000-G0075T3B, EURA DRIVES, Shandong, China). The electro-hydraulic proportional valve controls the speed of the feeding roller, while the digital frequency converter primarily controls the speed of the leaf crushing, stripping, and output rollers. The conveyor control module includes a control switch, encoder, and a motor forward/reverse rotation controller for controlling the trolley’s forward speed.
2.2. Transport Trolley Design
To better simulate the field operation of the harvester, the movement of the sugarcane transport trolley on the conveying rail was used as a substitute for the field operation of the sugarcane harvester. The experimental model of the sugarcane transport trolley was designed by incorporating the growth density of sugarcane measured and counted in the field.
2.2.1. Experiment to Measure the Growth Density of Sugarcane
Currently, sugarcane varieties No. 22 and No. 42 are commonly planted in Guangxi, with the sugarcane planted in rows and typically growing in clusters. The effective number of stalks per cluster ranges from 1 to 8. To investigate the density of sugarcane planting, this study measured the growth of sugarcane No. 42 grown at a university in Guangxi, following the JB/T 6275-2019 [25] test standard. Two random sections of sugarcane from the cane field were selected as measurement samples, each with a length of 10 m. The nest spacing and the number of stalks in each nest were measured sequentially. The results showed that the two sections contained 79 nests and 305 canes, with the height ranging from 1.54 m to 3.35 m, a mean value of 3.05 m, and a standard deviation of 0.355 m. The diameter ranged from 15 mm to 34 mm, with a mean value of 26.8 mm.
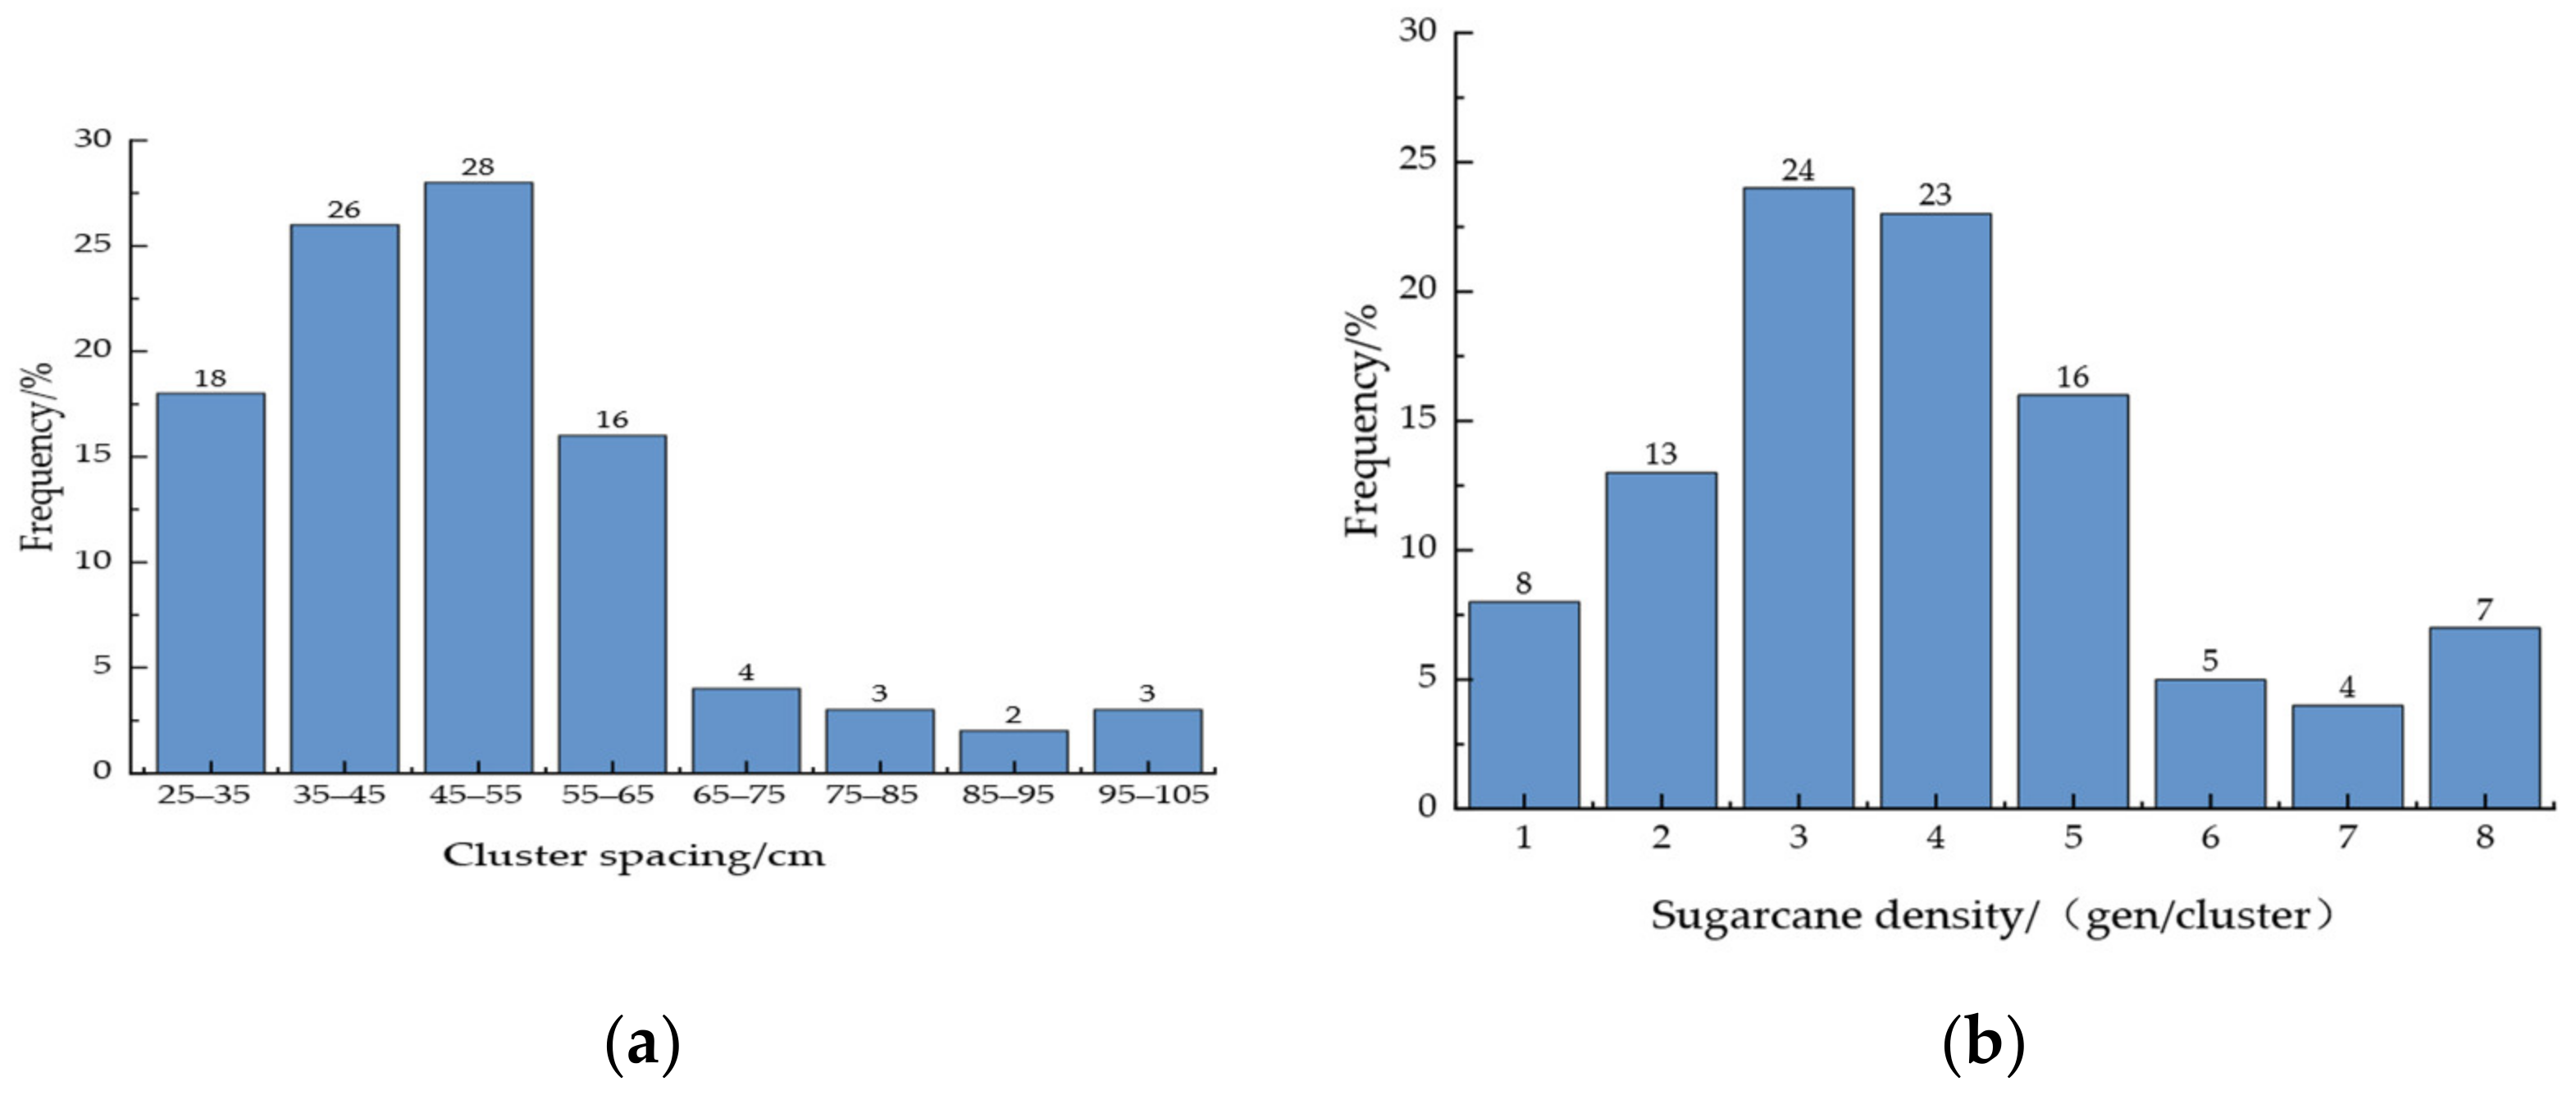
From Figure 2a, it can be observed that the nest spacing of sugarcane mainly falls within the range of 25 to 65 cm, accounting for 88% of the total frequency distribution. The frequency distribution within the range of 35 to 55 cm accounts for more than half (54%). After calculation, the arithmetic average nest spacing is found to be 54.9 cm, which can be considered as the average cluster spacing of sugarcane, approximately 55 cm. From Figure 2b, it can be seen that the planting density of sugarcane is primarily distributed within the range of 2 to 5 canes per nest, corresponding to 76% of the total frequency distribution. The frequency distribution of 3 to 4 canes per nest accounts for nearly half (47%). After calculation, the arithmetic mean number of canes per nest is 3.82, which suggests that the average number of canes per cluster is roughly 3 to 4.
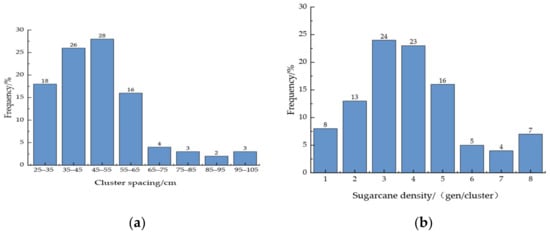
Figure 2.
Statistical results of sugarcane growth: (a) histogram of cluster spacing frequency distribution; (b) histogram of sugarcane density frequency distribution.
2.2.2. Design of Sugarcane Transport Trolley
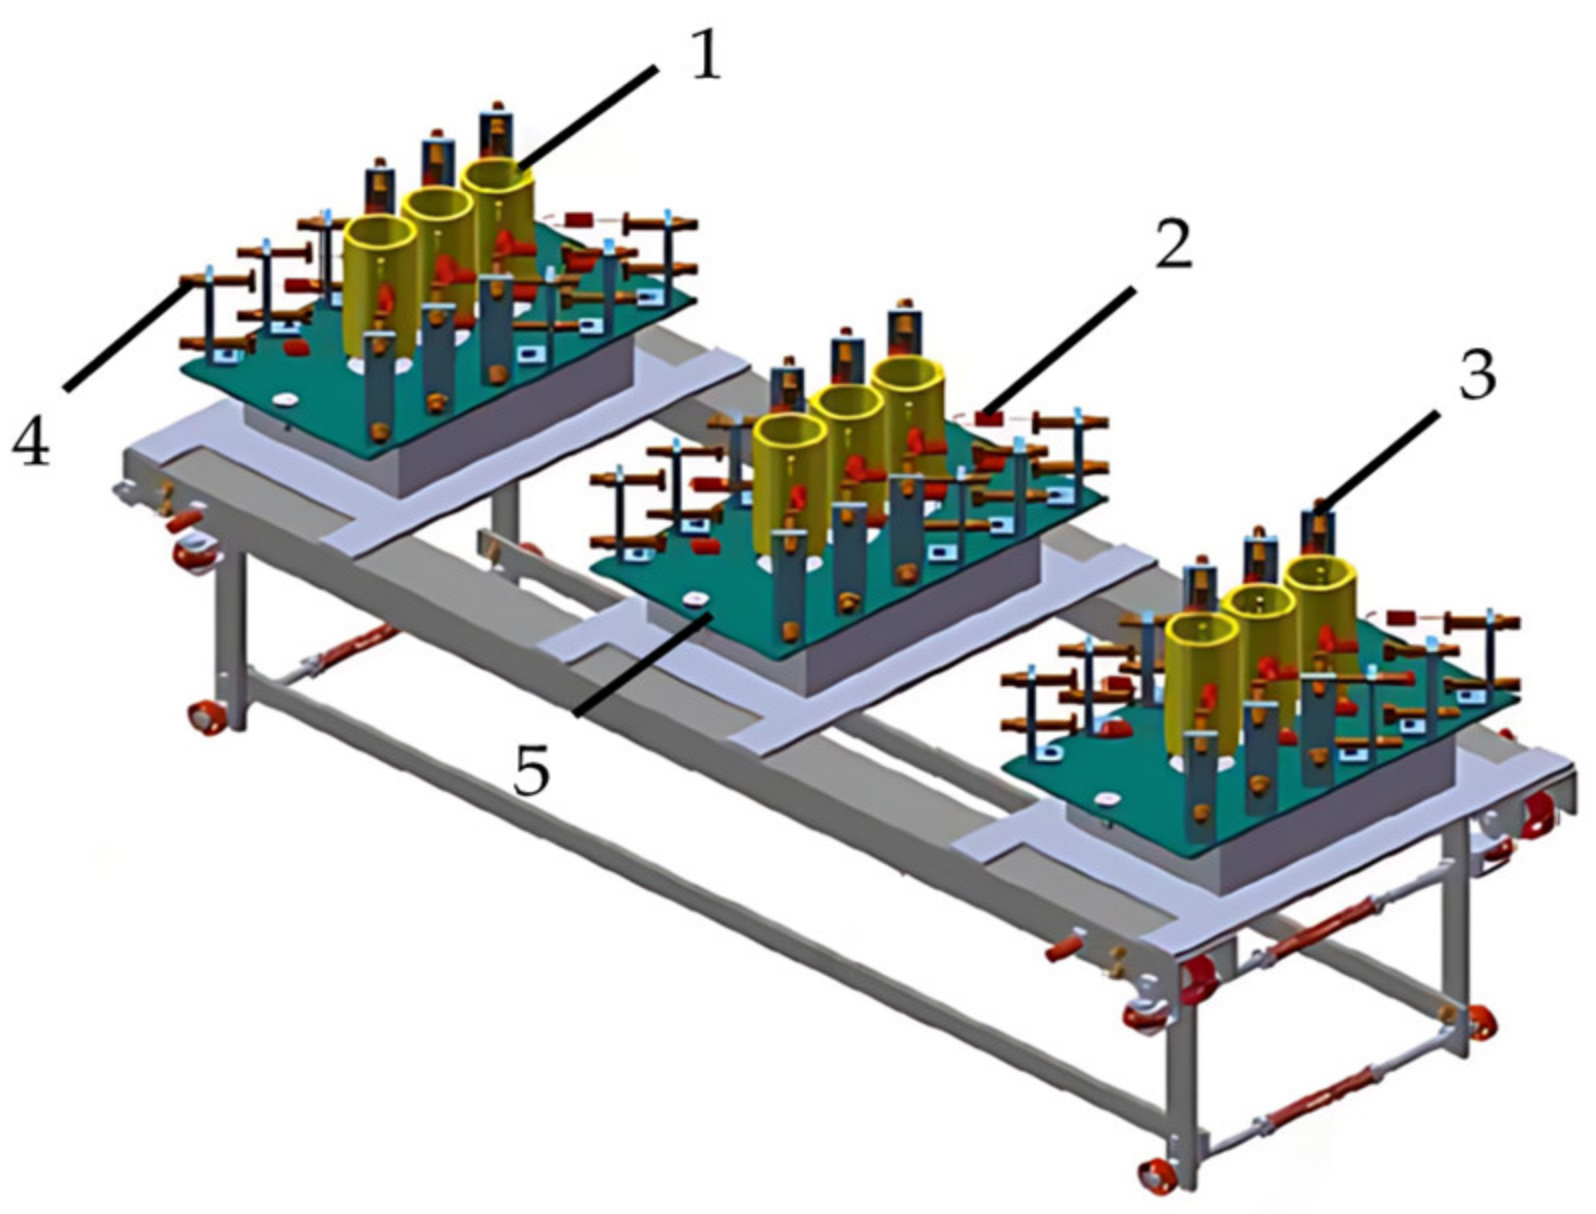
Figure 3 shows the model of a sugarcane transport trolley, which primarily consists of multiple sugarcane sleeves, tension springs, fixed brackets, bolts, sugarcane pads, and other components. To better simulate the force of stubble in the soil, the cane sleeve is fixed by 8 springs, each of which can be adjusted by bolts to modify the tightness. Threaded holes in the cane sleeve allow different diameters of the cane to be tightened by bolts, preventing the stubble from moving vertically. The trolley can transport up to 3 clusters of 9 canes at a time. The spacing between each nest of canes is adjustable, with a minimum spacing of 330 mm for two clusters and a maximum spacing of 900 mm. The minimum distance between two canes in a cluster is about 10 mm. Comparing these parameters with the sugarcane growth statistics, it can be seen that the cane conveyor trolley’s nest spacing is suitable for real-world applications.
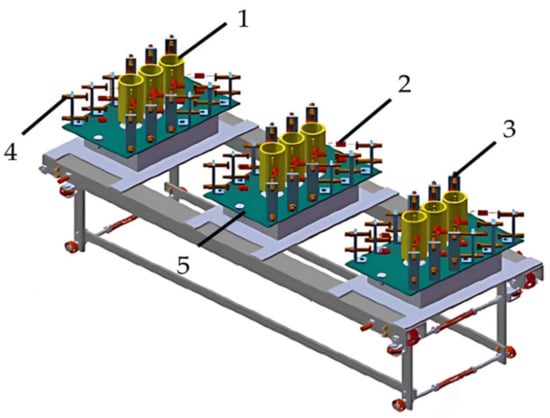
Figure 3.
Model of sugarcane transport trolley: 1. sugarcane sleeve; 2. tension spring; 3. fixed bracket; 4. bolt; 5. sugarcane pad.
2.3. Feeding Amount Detection Module
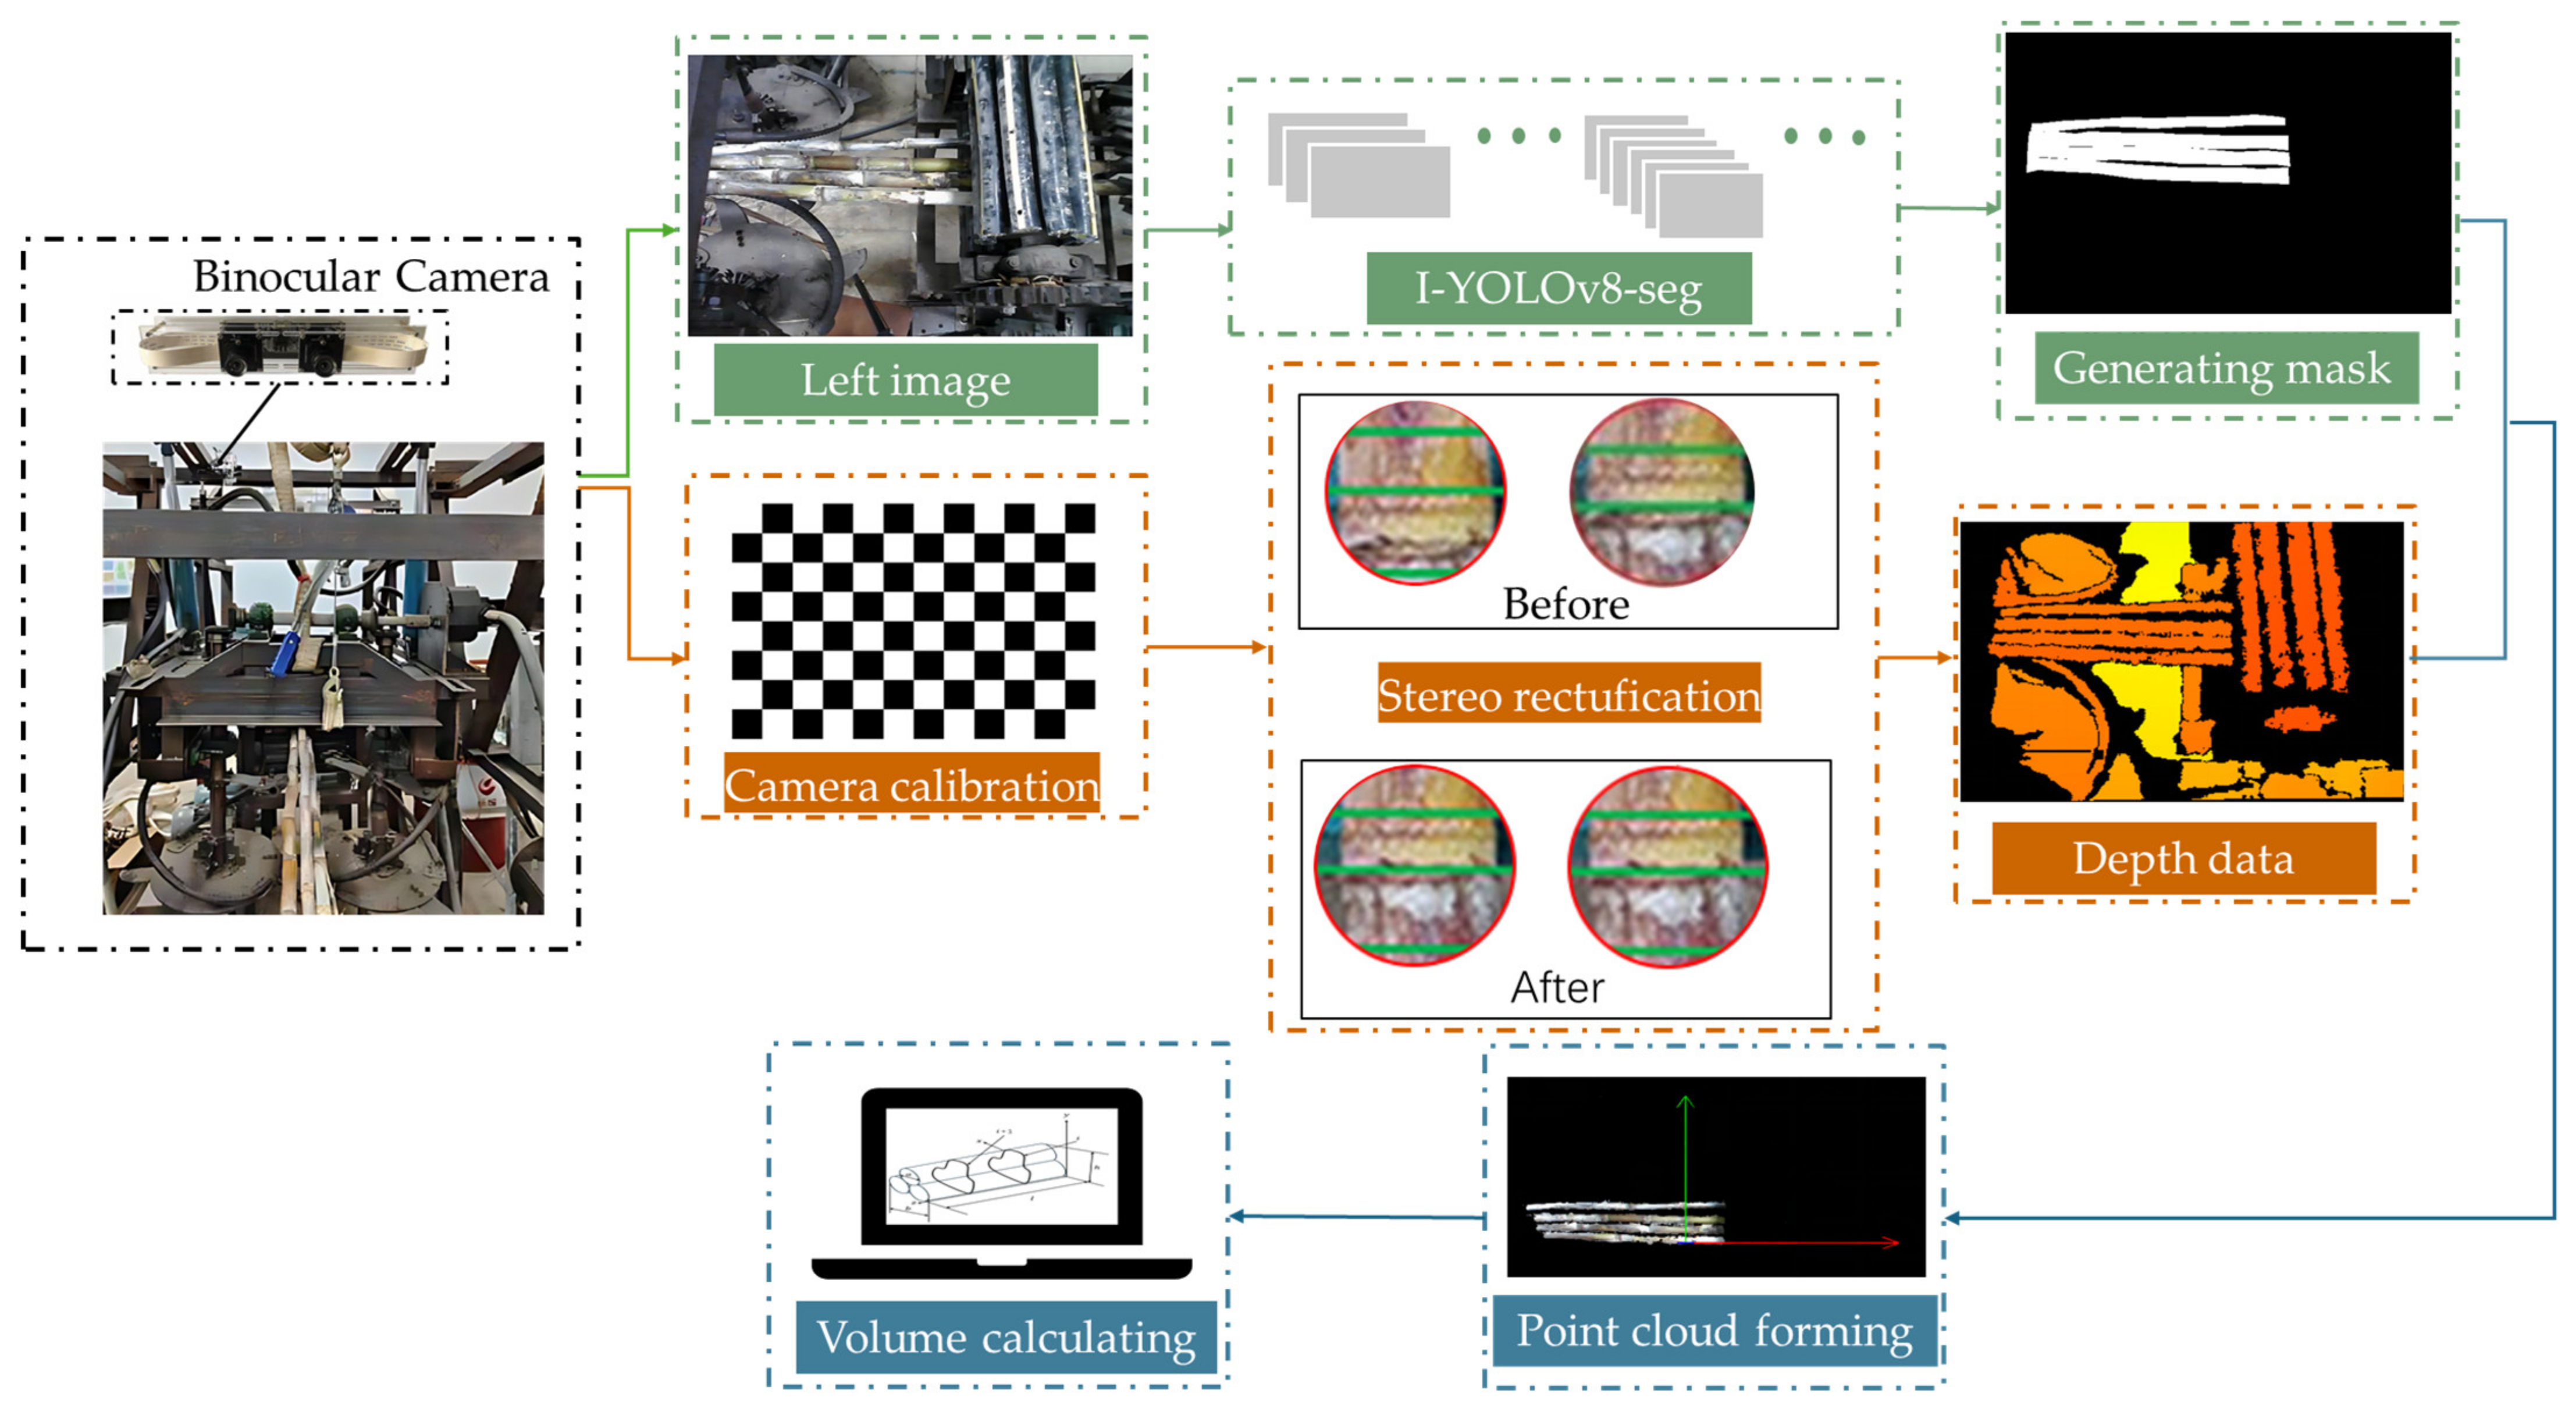
This study proposes a method that integrates instance segmentation masks and depth data to measure the sugarcane volume. The basic steps are shown in Figure 4. Binocular images of the incoming sugarcane are captured using a binocular camera, with the left image input into the proposed I-YOLOv8-seg model for instance segmentation and mask extraction. Meanwhile, depth information is calculated based on the camera parameters obtained from calibration and stereo rectification. The sugarcane mask is then aligned with the depth data to generate the point cloud of the feeding sugarcane.

Figure 4.
The basic steps of feeding sugarcane volume detection.
2.3.1. Image Acquisition and Dataset Augmentation
To improve the model’s training performance, the sugarcane data are collected using a data acquisition platform. As shown in Figure 5, the platform mainly consists of a stereo camera, conveyor rollers, and a drive motor. During the data collection process, the sugarcane moves back and forth as the conveyor rollers rotate. Compared to data collection inside the sugarcane harvester, this method allows for a more complete capture of the sugarcane’s features with minimal environmental interference.
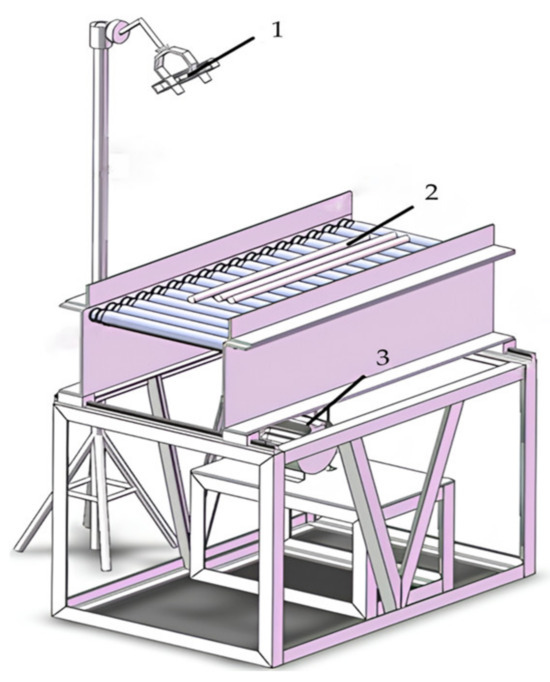
Figure 5.
Image acquisition platform: 1. binocular camera; 2. sugarcane sample; 3. drive motor.
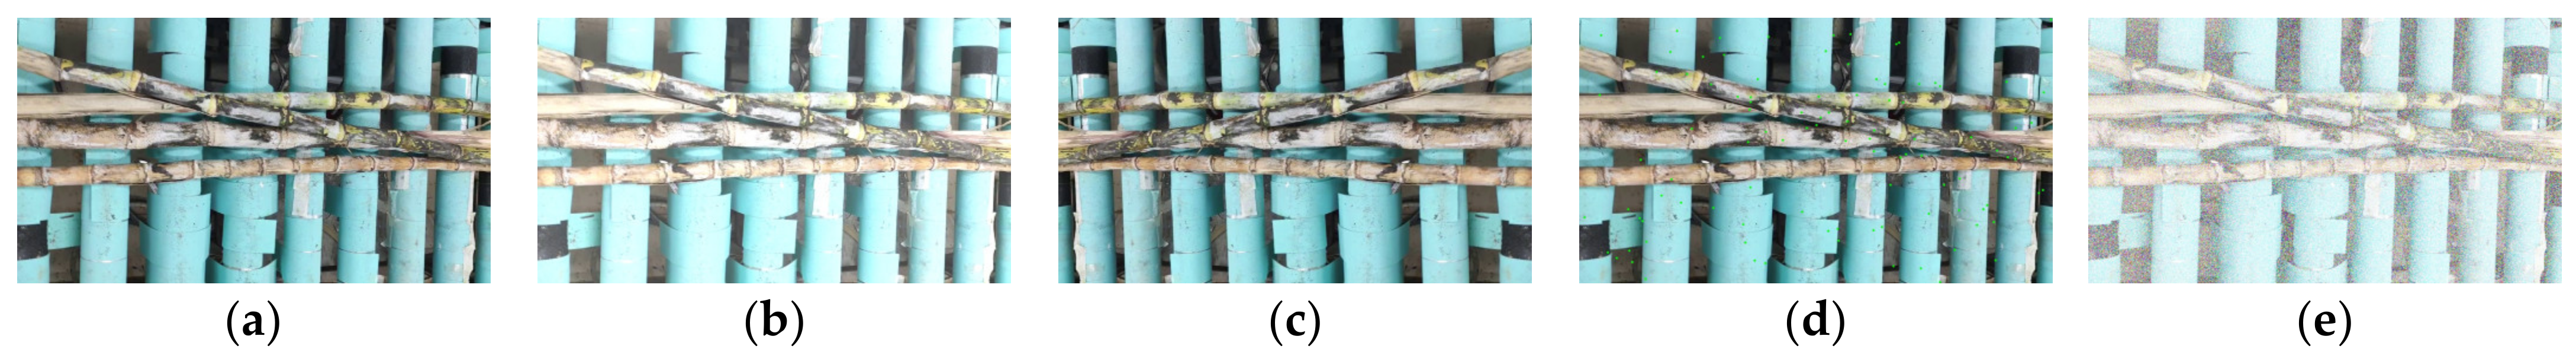
In the actual operational scenarios of the sugarcane harvester, variations in light intensity and occlusions (e.g., sugarcane leaves or stacking) can impact the accuracy of sugarcane segmentation. To enhance the model’s robustness and generalization ability, image augmentation techniques such as flipping, brightness adjustment, Gaussian noise, and random points were applied to incorporate as many complex scene types as possible, thereby increasing the diversity of the training samples. After the enhancement process, the total number of images in the dataset reached 3600. Some enhanced images are shown in Figure 6. The augmented sugarcane image dataset was labeled using LabelMe [26] and then divided into training, validation, and test sets in an 8:1:1 ratio.
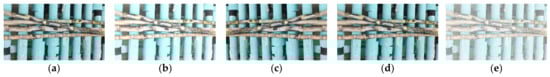
Figure 6.
Augmented image samples: (a) original image; (b) brightened transformation; (c) mirror transformation; (d) random point; (e) Gaussian noise.
2.3.2. Yolov8-Seg Network Model
Before measuring volume data, the sugarcane objects in the image must be identified and segmented. This study selects the instance segmentation algorithm based on YOLOv8 [27], which combines both object detection and instance segmentation. The algorithm is capable of detecting and segmenting individual sugarcanes in the image. YOLOv8 has five main versions: YOLOv8n, YOLOv8s, YOLOv8m, YOLOv8l, and YOLOv8x. In this study, the five versions of YOLOv8 were used to train the dataset, with the training results shown in Table 1. According to the experimental results, YOLOv8x achieved the highest segmentation accuracy but had the largest number of parameters and the lowest segmentation speed. To balance accuracy and speed, YOLOv8n was selected as the base model.

Table 1.
Comparison of the performance of different YOLOv8 models.
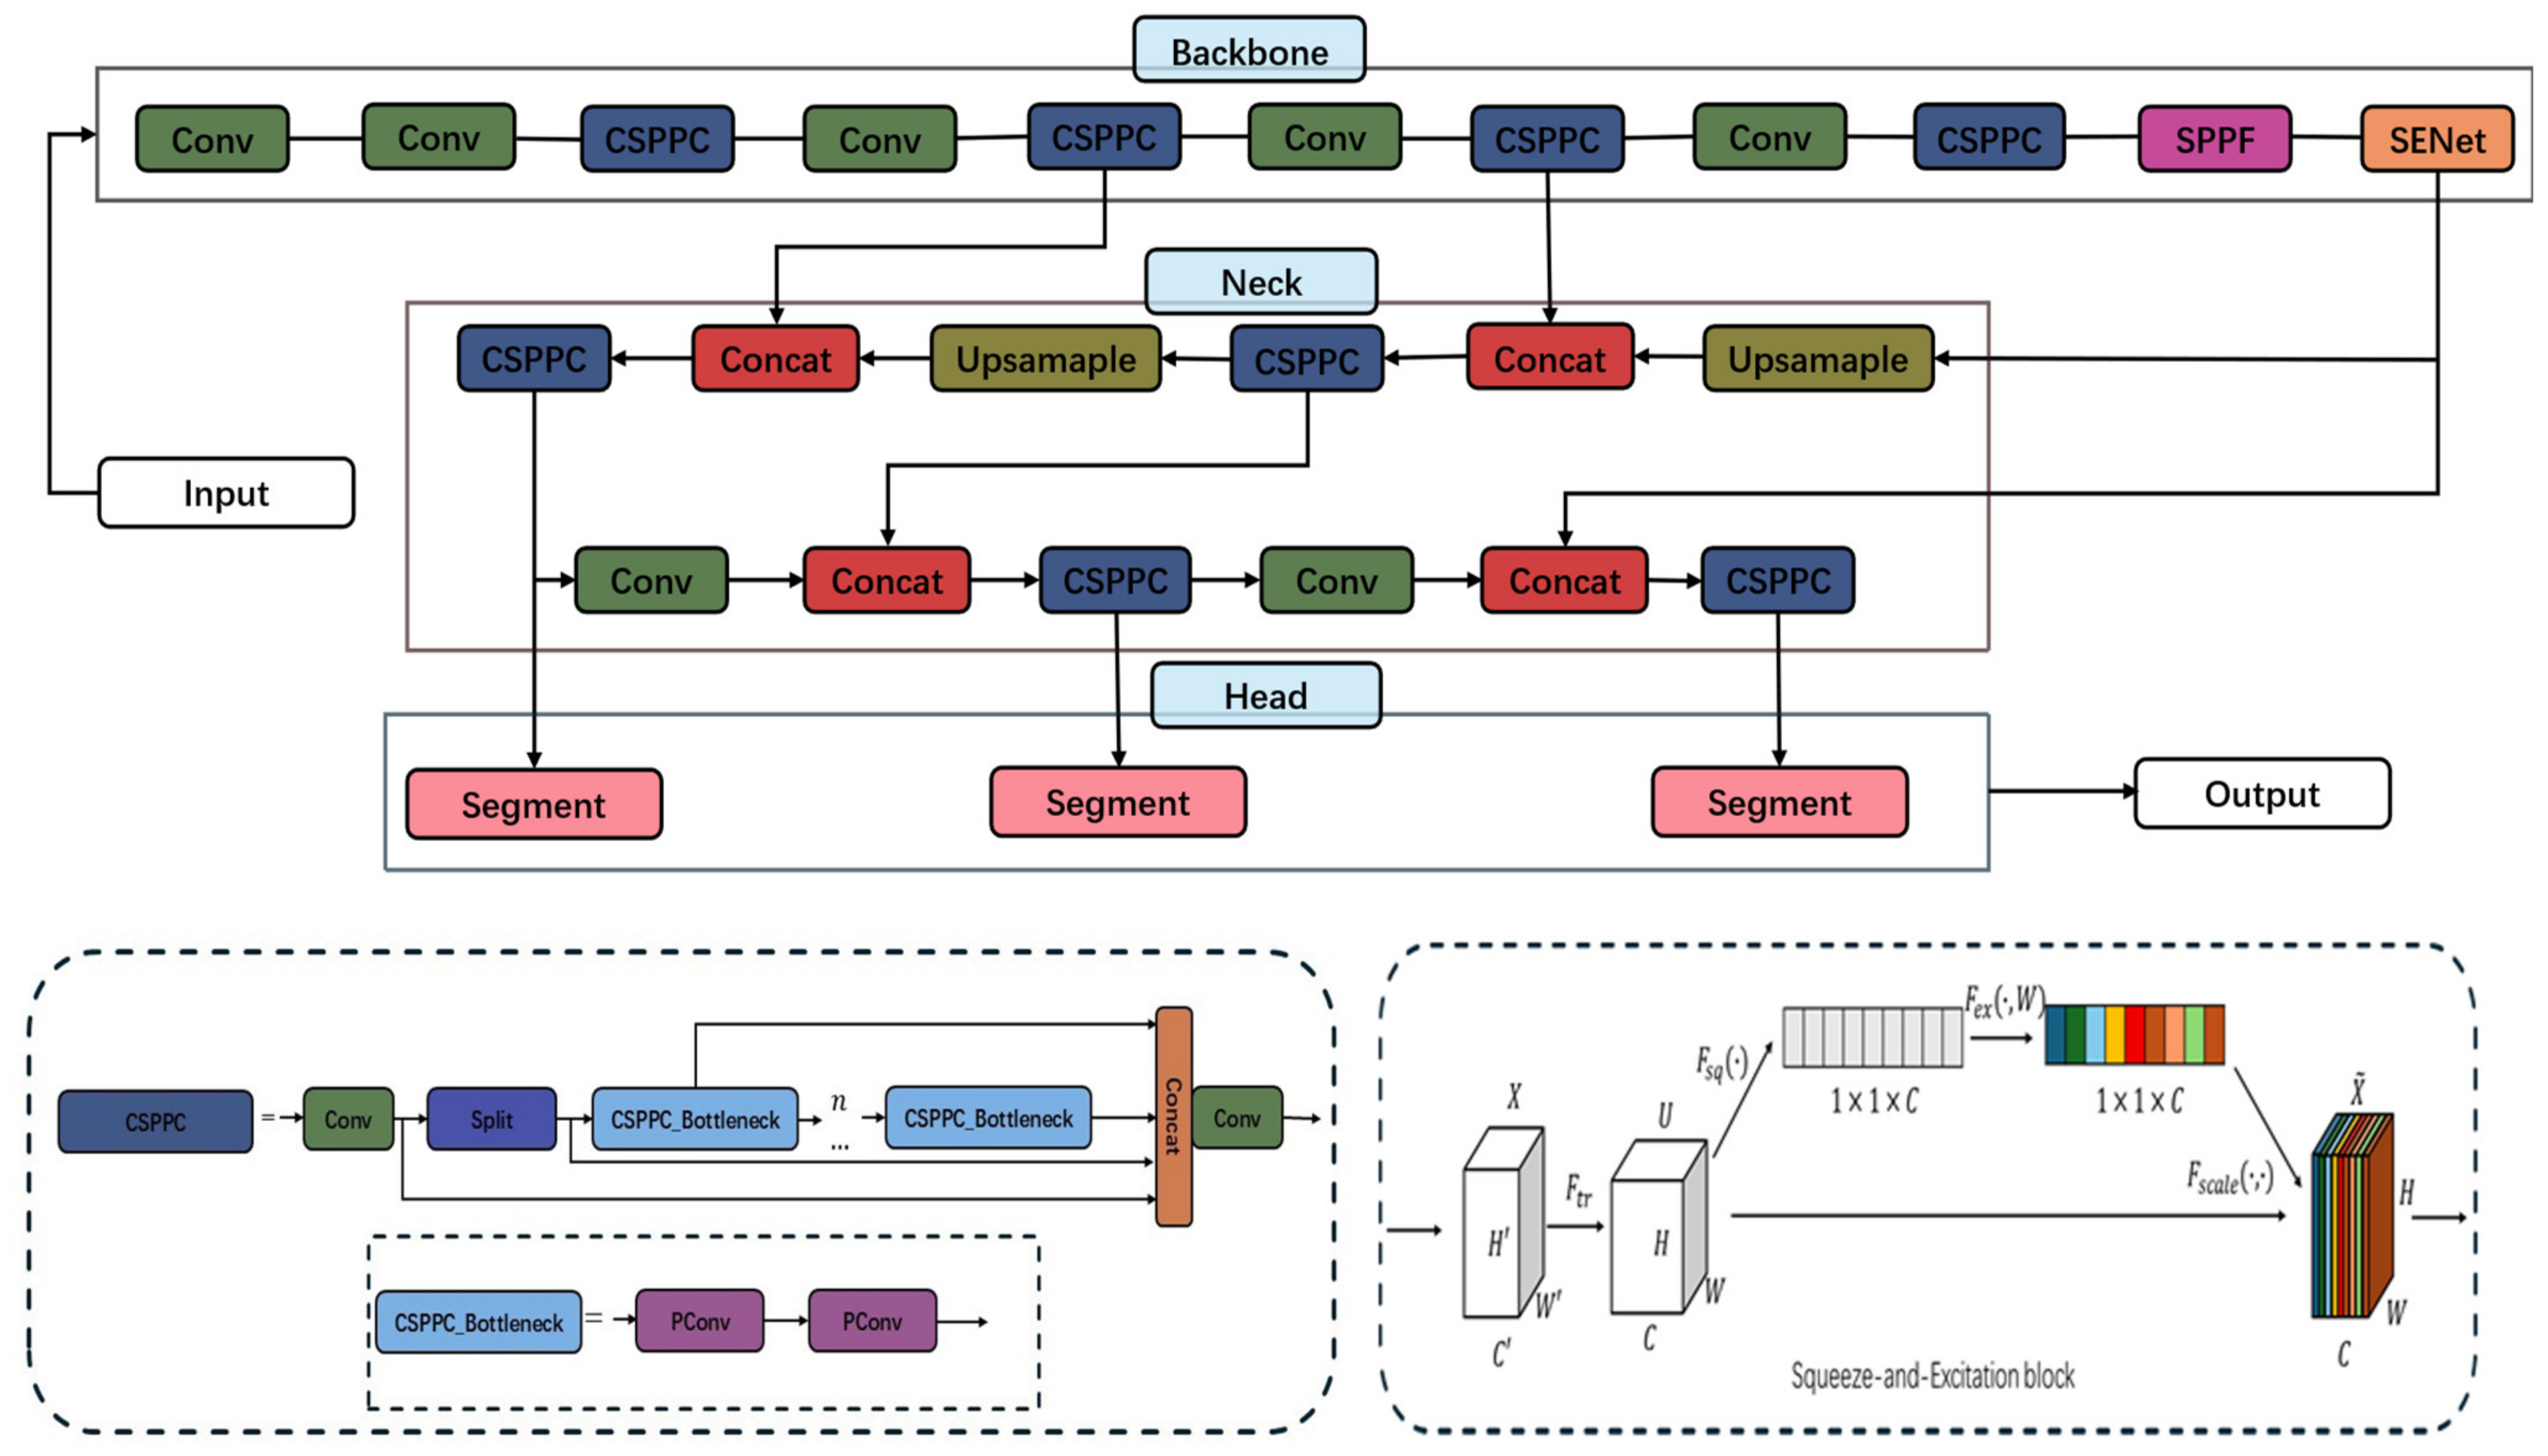
To maintain high accuracy while improving the processing speed of sugarcane segmentation, this study made improvements to the original YOLOv8n-seg model in two key aspects. The network structure of the improved I-YOLOv8n-seg model is shown in Figure 7.
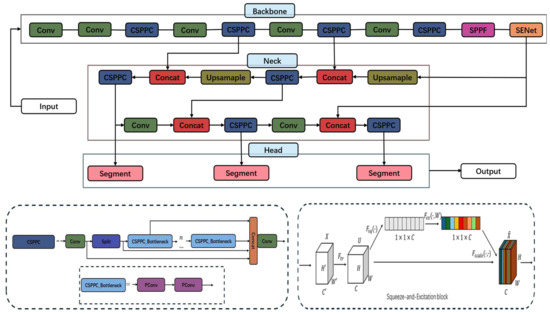
Figure 7.
A diagram of the improved network model structure.
- The C2f module used by YOLOv8n-seg has a large number of parameters and high computational complexity, leading to redundancy in channel information. To address these issues, the CSPPC module replaces the C2f module to reduce redundant channels and extract richer features through multi-scale pooling.
- The Squeeze-and-Excitation (SE) module is employed to model the interdependence between channels in convolutional neural networks, using global average pooling and fully connected layers to improve network expressiveness.
2.3.3. Model Training Environment and Evaluation Indicators
The experimental environment configuration is provided in Table 2, and the basic parameter settings are listed in Table 3.
Table 2.
Environmental configuration.
Table 3.
Basic parameters.
To evaluate model performance, precision (), recall (), mean average precision (), and frams per second () were used as evaluation metrics.
(true positive) refers to the number of correct predictions for positive samples, (false positive) refers to the number of incorrect predictions for positive samples, and (false negative) refers to the number of incorrect predictions for negative samples.
Here, the area is under the curve, and AP50 represents the average precision for each category at an IoU threshold of 50%.
is the time (in ms) taken to detect a single image, including image preprocessing time, inference time, and non-maximum suppression processing time.
2.3.4. Sugarcane Point Cloud Acquisition
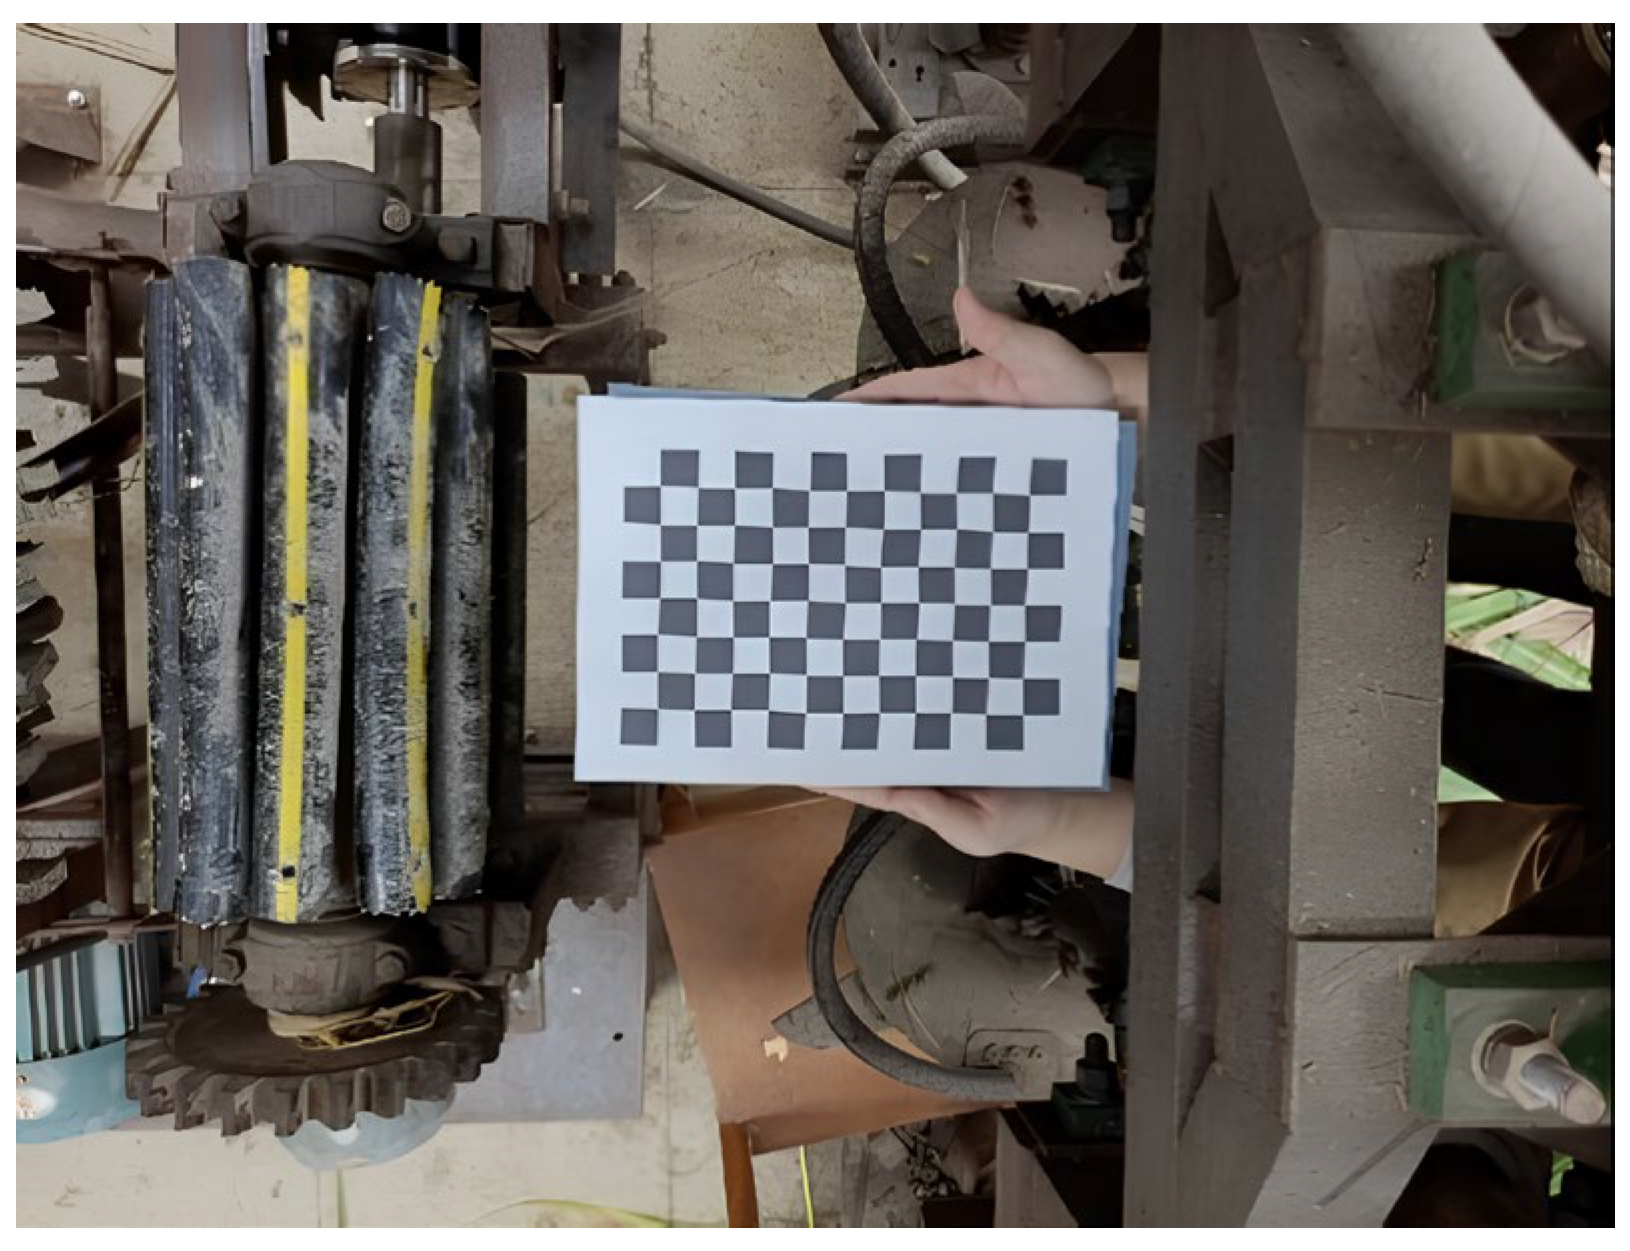
To establish an effective imaging model, camera calibration was performed using Zhang’s calibration method [28]. Calibration and correction were carried out by capturing multiple images of the calibration board from different angles, as shown in Figure 8.
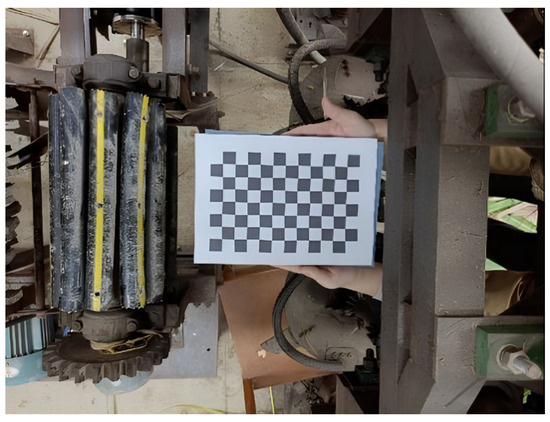
Figure 8.
Calibration image in the sugarcane harvester.
The calibration was performed using the Calibration Toolbox (MathWorks, Natick, MA, USA) in MATLAB R2023a [29], and the results are shown in Table 4. These parameters will be used for stereo rectification and depth calculation of the images.
Table 4.
Binocular camera calibration parameters.
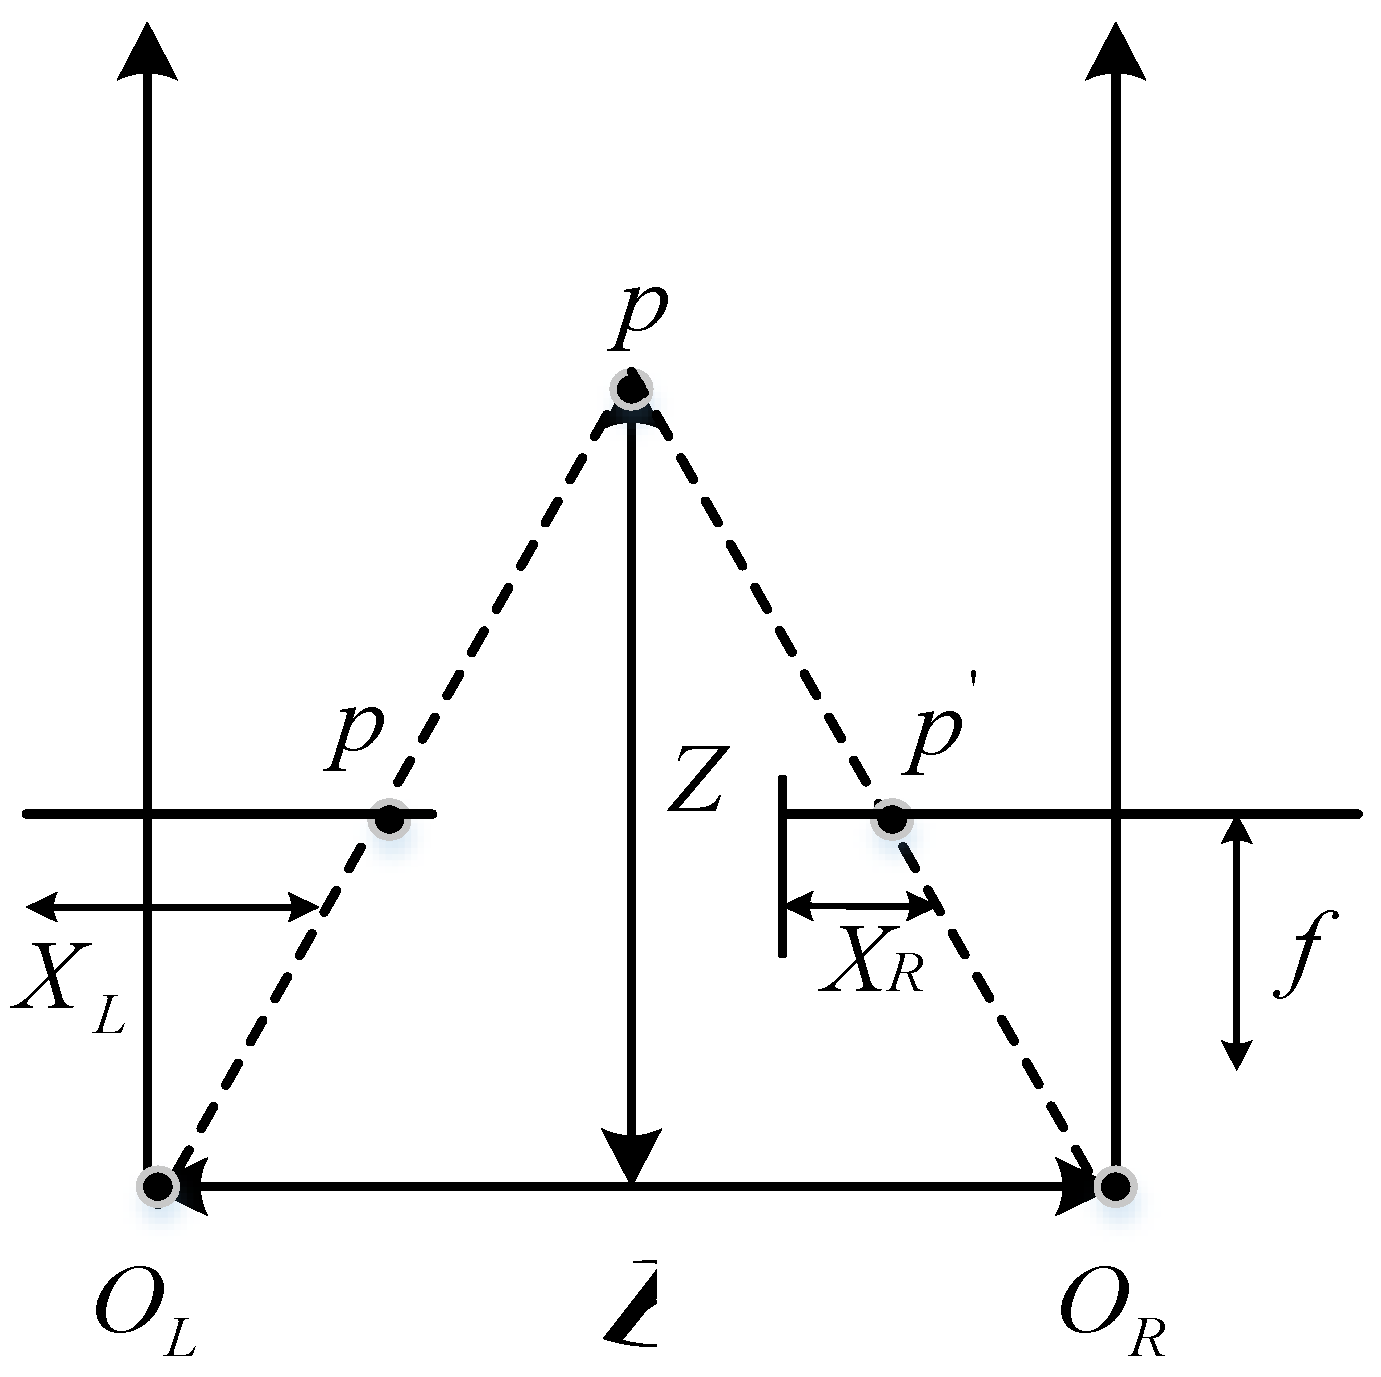
The ideal binocular stereo vision model after stereo rectification using binocular camera calibration parameters is shown in Figure 9. The calibration process uses triangulation to solve the 3D coordinates of spatial points for two cameras in a parallel configuration on the experimental platform. and represent the optical centers of the left and right cameras, respectively, is the image’s physical coordinates, and is the focal length. As shown in Formula (6), the 3D spatial information of the object surface is recovered by combining the spatial coordinate expression of the spatial point with the disparity obtained from the algorithm. In the equation, and are the principal points of the image, and is the focal length, both of which are provided by the camera calibration.
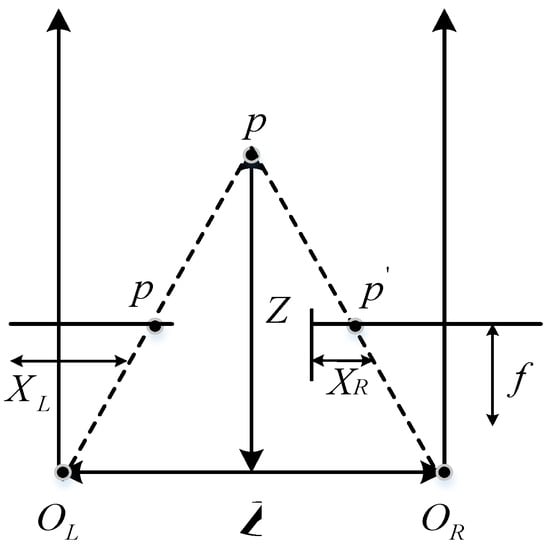
Figure 9.
Ideal binocular stereo vision model.
Using binocular disparity, the 3D coordinates of corresponding points are derived from the 2D image coordinates of the left and right pixel points to generate depth data.
2.3.5. Volume Calculation Method
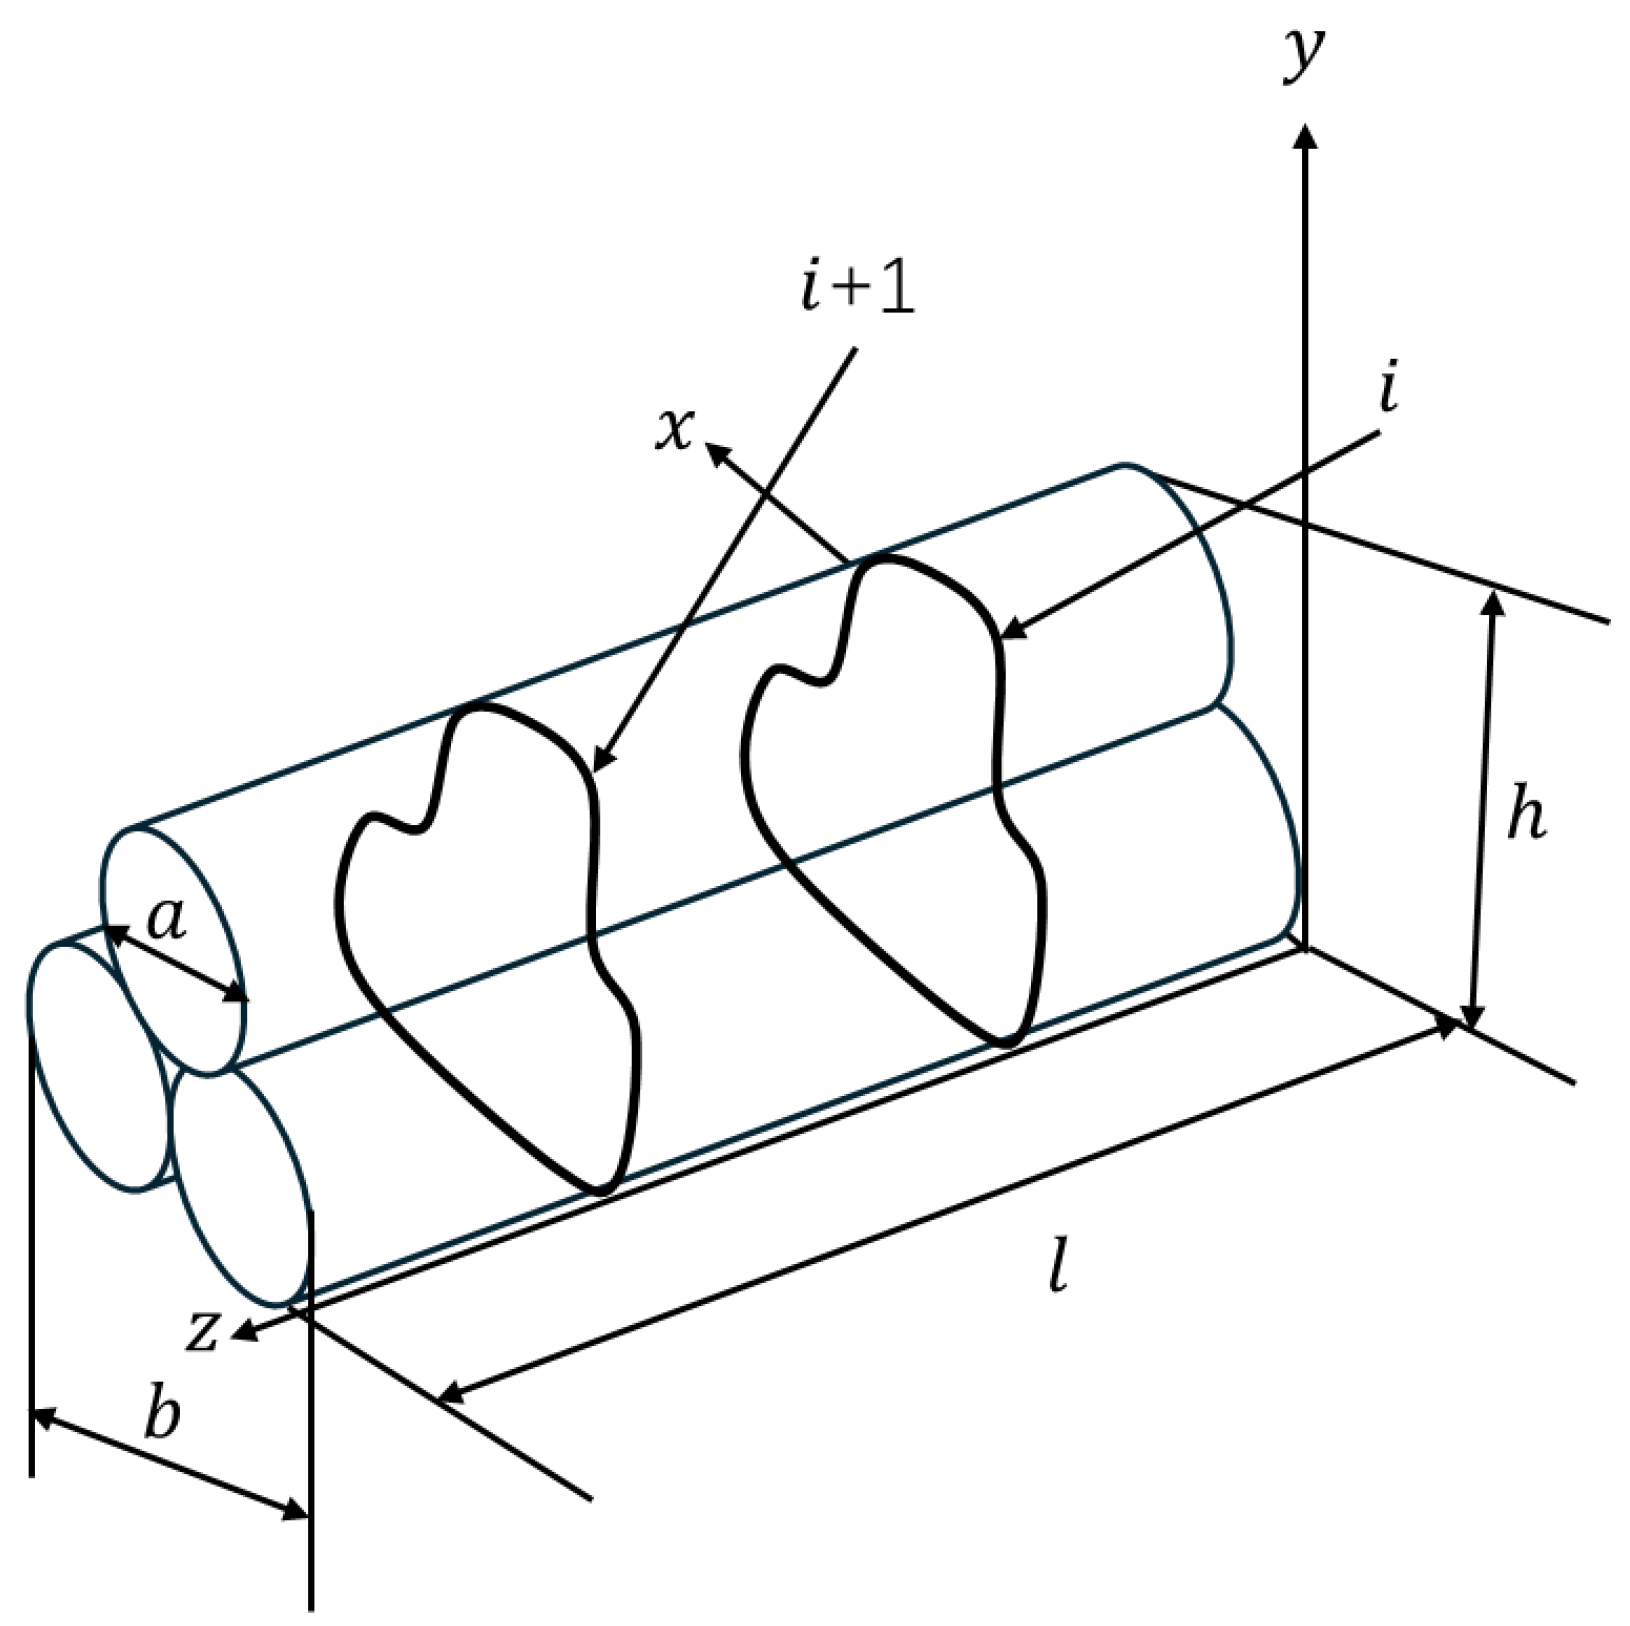
Sugarcane may bend due to gravity and other factors during its growth and planting process. Therefore, the calculation process takes into account the volume of sugarcane piles with different shapes. The sugarcane pile is divided into multiple sections, and the final sum is calculated to determine the feeding volume. As shown in Figure 10, the identified area is divided horizontally, with the cross-sectional area of each horizontal slice calculated, and the volume of each slice further determined. The total volume is obtained by summing the volumes of all slices.
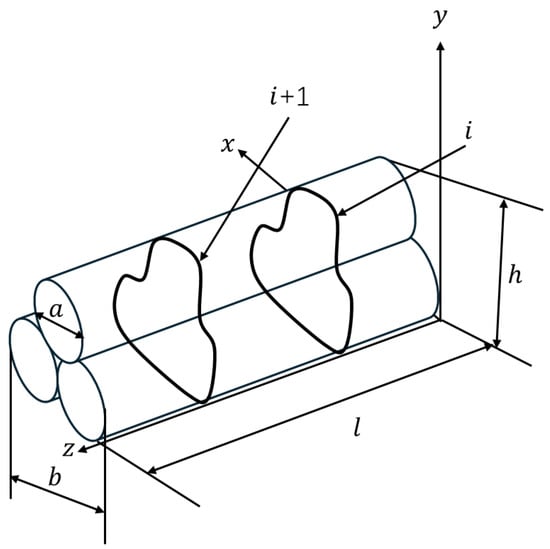
Figure 10.
Principle of volume calculation.
For the -th slice with a height of and a thickness of , the depth information of the slice is extracted, the area is set to , and the average depth value is calculated using Formula (7), which represents the radius of the sugarcane:
where is the depth value of the -th slice, is the area of the -th pixel in this slice, and is the total number of pixels in the area.
When the sugarcanes are stacked, the cross-sectional shape can be decomposed into geometrically recognizable segments to form a curved trapezoid. This may be a combination of a portion of the circular arc in the shape of a single sugarcane and the region where the sugarcanes touch the bottom surface, i.e., the vertices of multiple sugarcanes approximate a flat line segment on the bottom surface. When the edge of the sugarcane forms part of the curved trapezoid, the area of the line segment can be calculated using Formula (8):
Among them, is the radius of the sugarcane to which this line segment belongs, and is the slice height. The cross-sectional area of the remaining incompletely rectangular line segments after segmentation can be obtained by Formula (9):
Among them, is the diameter of a single sugarcane at the top or the sum of the diameters of multiple sugarcanes at the top layer; is the length of the bottom surface; and is the slice height or the stacking height minus the sugarcane radius. In summary, the cross-sectional area at the i-th position can be calculated using Formulas (9) and (10).
will be calculated for different sugarcane radii. By substituting Formula (10) into Formula (11), we can derive Formula (12) for the volume of multiple sugarcanes:
where is the cross-sectional area of the slice at position , is the incremental thickness of each slice, and is the number of slices. is the total volume.
2.3.6. Volume Recognition Evaluation Metrics
In Section 2.2.1, an analysis of the sugarcane distribution in the field was conducted. It was observed that the sugarcane stalk diameter varied significantly, with the diameter typically decreasing from the head to the tail of the cane. Additionally, there were differences in the diameter between internodes. To minimize errors, two points were selected between the internodes as measurement points for the diameter. After taking the measurements, the average of the two diameters was used as the final diameter for that section of the sugarcane. The actual volume was then calculated using a segment-wise summation method, and the volume calculation formula is as follows:
In the sugarcane volume recognition experiment, the error probability is used as the evaluation metric, where is the recognized volume and is the actual volume.
2.4. Conveyance Conveying Module Design
2.4.1. Control Platform Building
As shown in Figure 11, the core of this module consists of four parts: the upper and lower feeding rollers, the leaf-crushing and peeling rollers, the upper and lower output rollers, and the power drive components for each group of rollers. The feeding roller is driven by a hydraulic motor in the hydraulic system, while the leaf-crushing roller, leaf-peeling roller, and output roller are driven by three-phase AC motors, with power transmitted via a belt drive.
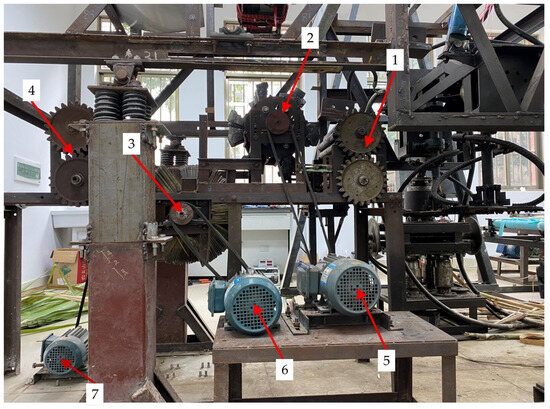
Figure 11.
Conveyor control components: 1. feeding rollers; 2. leaf-crushing roller; 3. leaf-stripping roller; 4. output rollers; 5. leaf-crushing roller motor; 6. leaf-stripping roller motor; 7. output roller motor.
2.4.2. Control System Components and Operating Principle
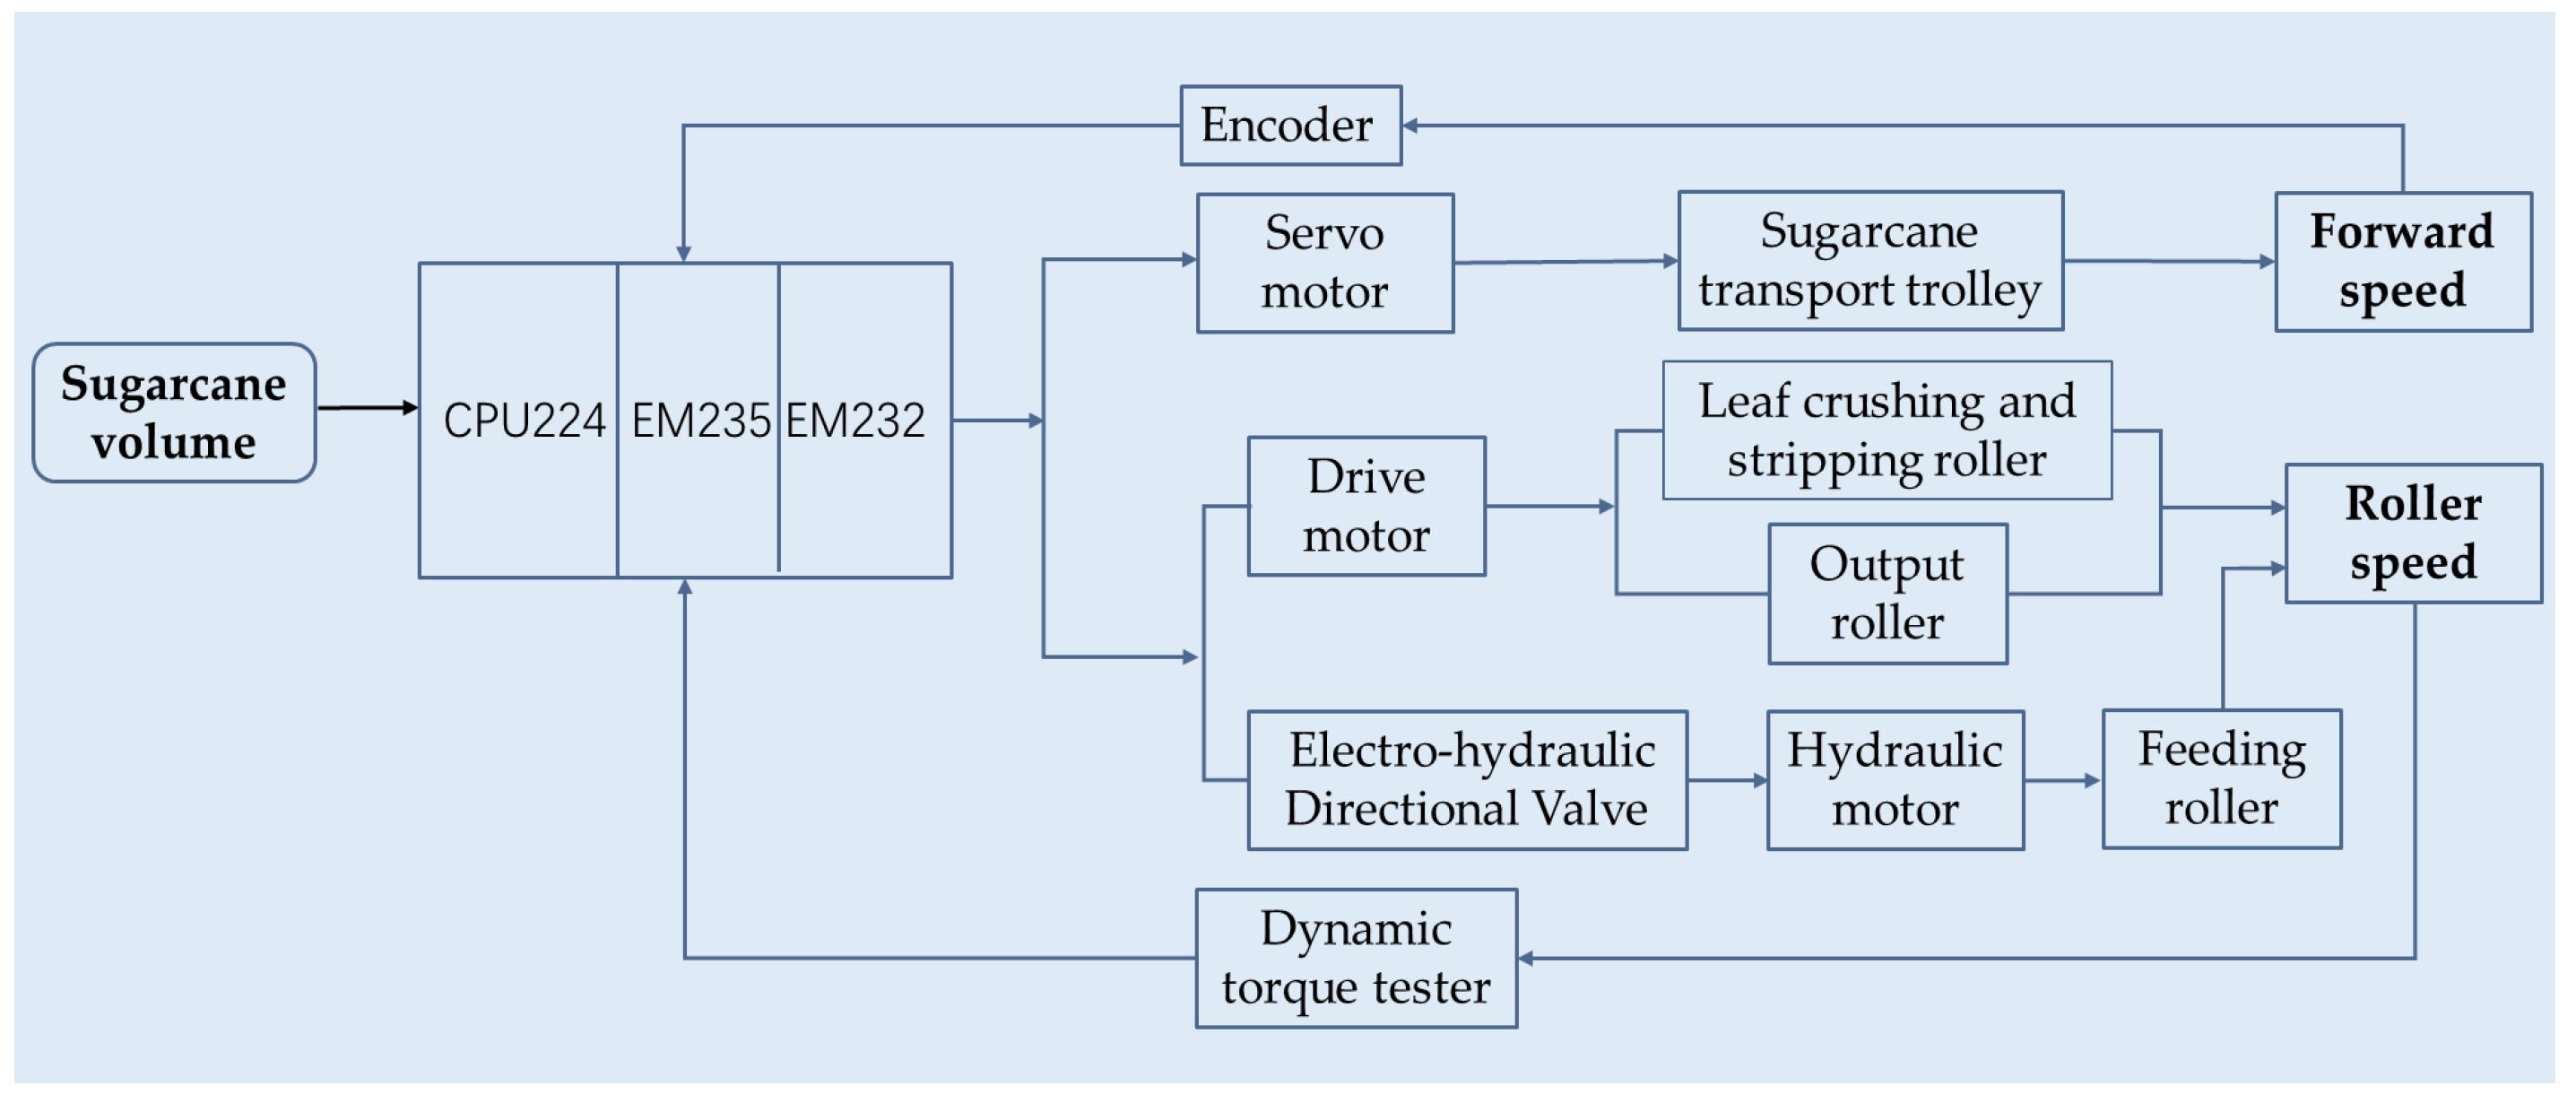
A diagram of the working principle of the conveyor control system is shown in Figure 12. The control system uses a Siemens PLC S7-200 (CPU224, Siemens, Nanjing, China), along with EM325 and EM232 modules as the core processors. It consists of four main components: the hydraulic control system, the actuating mechanism, the detection devices, and the control system itself. The hydraulic system primarily includes an electro-hydraulic proportional valve and a hydraulic motor. By adjusting the valve spool’s opening size in the electro-hydraulic proportional valve, the flow of hydraulic oil to the hydraulic motor is regulated, thereby altering the feeding roller speed. The actuating mechanism includes a servo motor and a drive motor. These motors control the speeds of the leaf-stripping and leaf-crushing rollers, as well as the output roller, by adjusting the motor speeds. The movement speed of the conveyor trolley is also regulated. The detection devices mainly consist of a dynamic torque tester and an encoder. The encoder detects the speed of the servo motor, while the dynamic torque tester measures the roller speed. During system operation, the obtained sugarcane volume information is transmitted to the PLC controller. The controller then determines whether the volume of the fed sugarcane falls within a specific range and generates control signals for the feeding roller speed, leaf-stripping and crushing roller speed, output roller speed, and transport trolley forward speed.
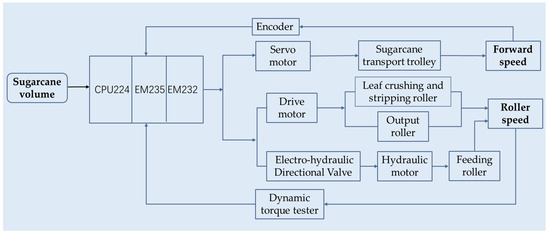
Figure 12.
Working principle of the control system.
2.4.3. Relationship Between Roller Speeds and Feeding Quantity
The core of the control system lies in determining the optimal correspondence between the roller speed and the sugarcane feeding amount. In order to determine the optimal rotation speeds of each roller, three sets of two-factor experiments were conducted. The experimental indicator was the blockage rate. Five different roller speed levels were set, with each level repeated 10 times, and the 10 trials were divided into two groups for repeated testing, with the blockage rate of the conveyor channel calculated separately for each group. The experimental materials were sugarcane of Guitang No. 42 with a diameter of 24–28 mm and a length of 1.2 m. The levels for the two-factor experiment are shown in Table 5, and other non-variable test parameters are shown in Table 6.
Table 5.
Levels of two-factor interaction tests.
Table 6.
Parameter settings of the test of non-variable factors.
The experimental results are shown in Tables S1–S3. As shown in Table 7, the roller speeds for different feeding amounts are statistically analyzed when no blockage occurs.
Table 7.
Reference values of roller speed setting under different sugarcane feeding quantities.
2.4.4. Control Method
To simplify the control principle and improve conveying efficiency, the minimum roller speeds that prevent blockage were selected based on the number of sugarcane roots, the speed of the conveyor system actuator was divided into three levels, and the feeding amount range corresponding to different numbers of roots was calculated. The set values are shown in Table 8.
Table 8.
Optimal control parameters of each actuator.
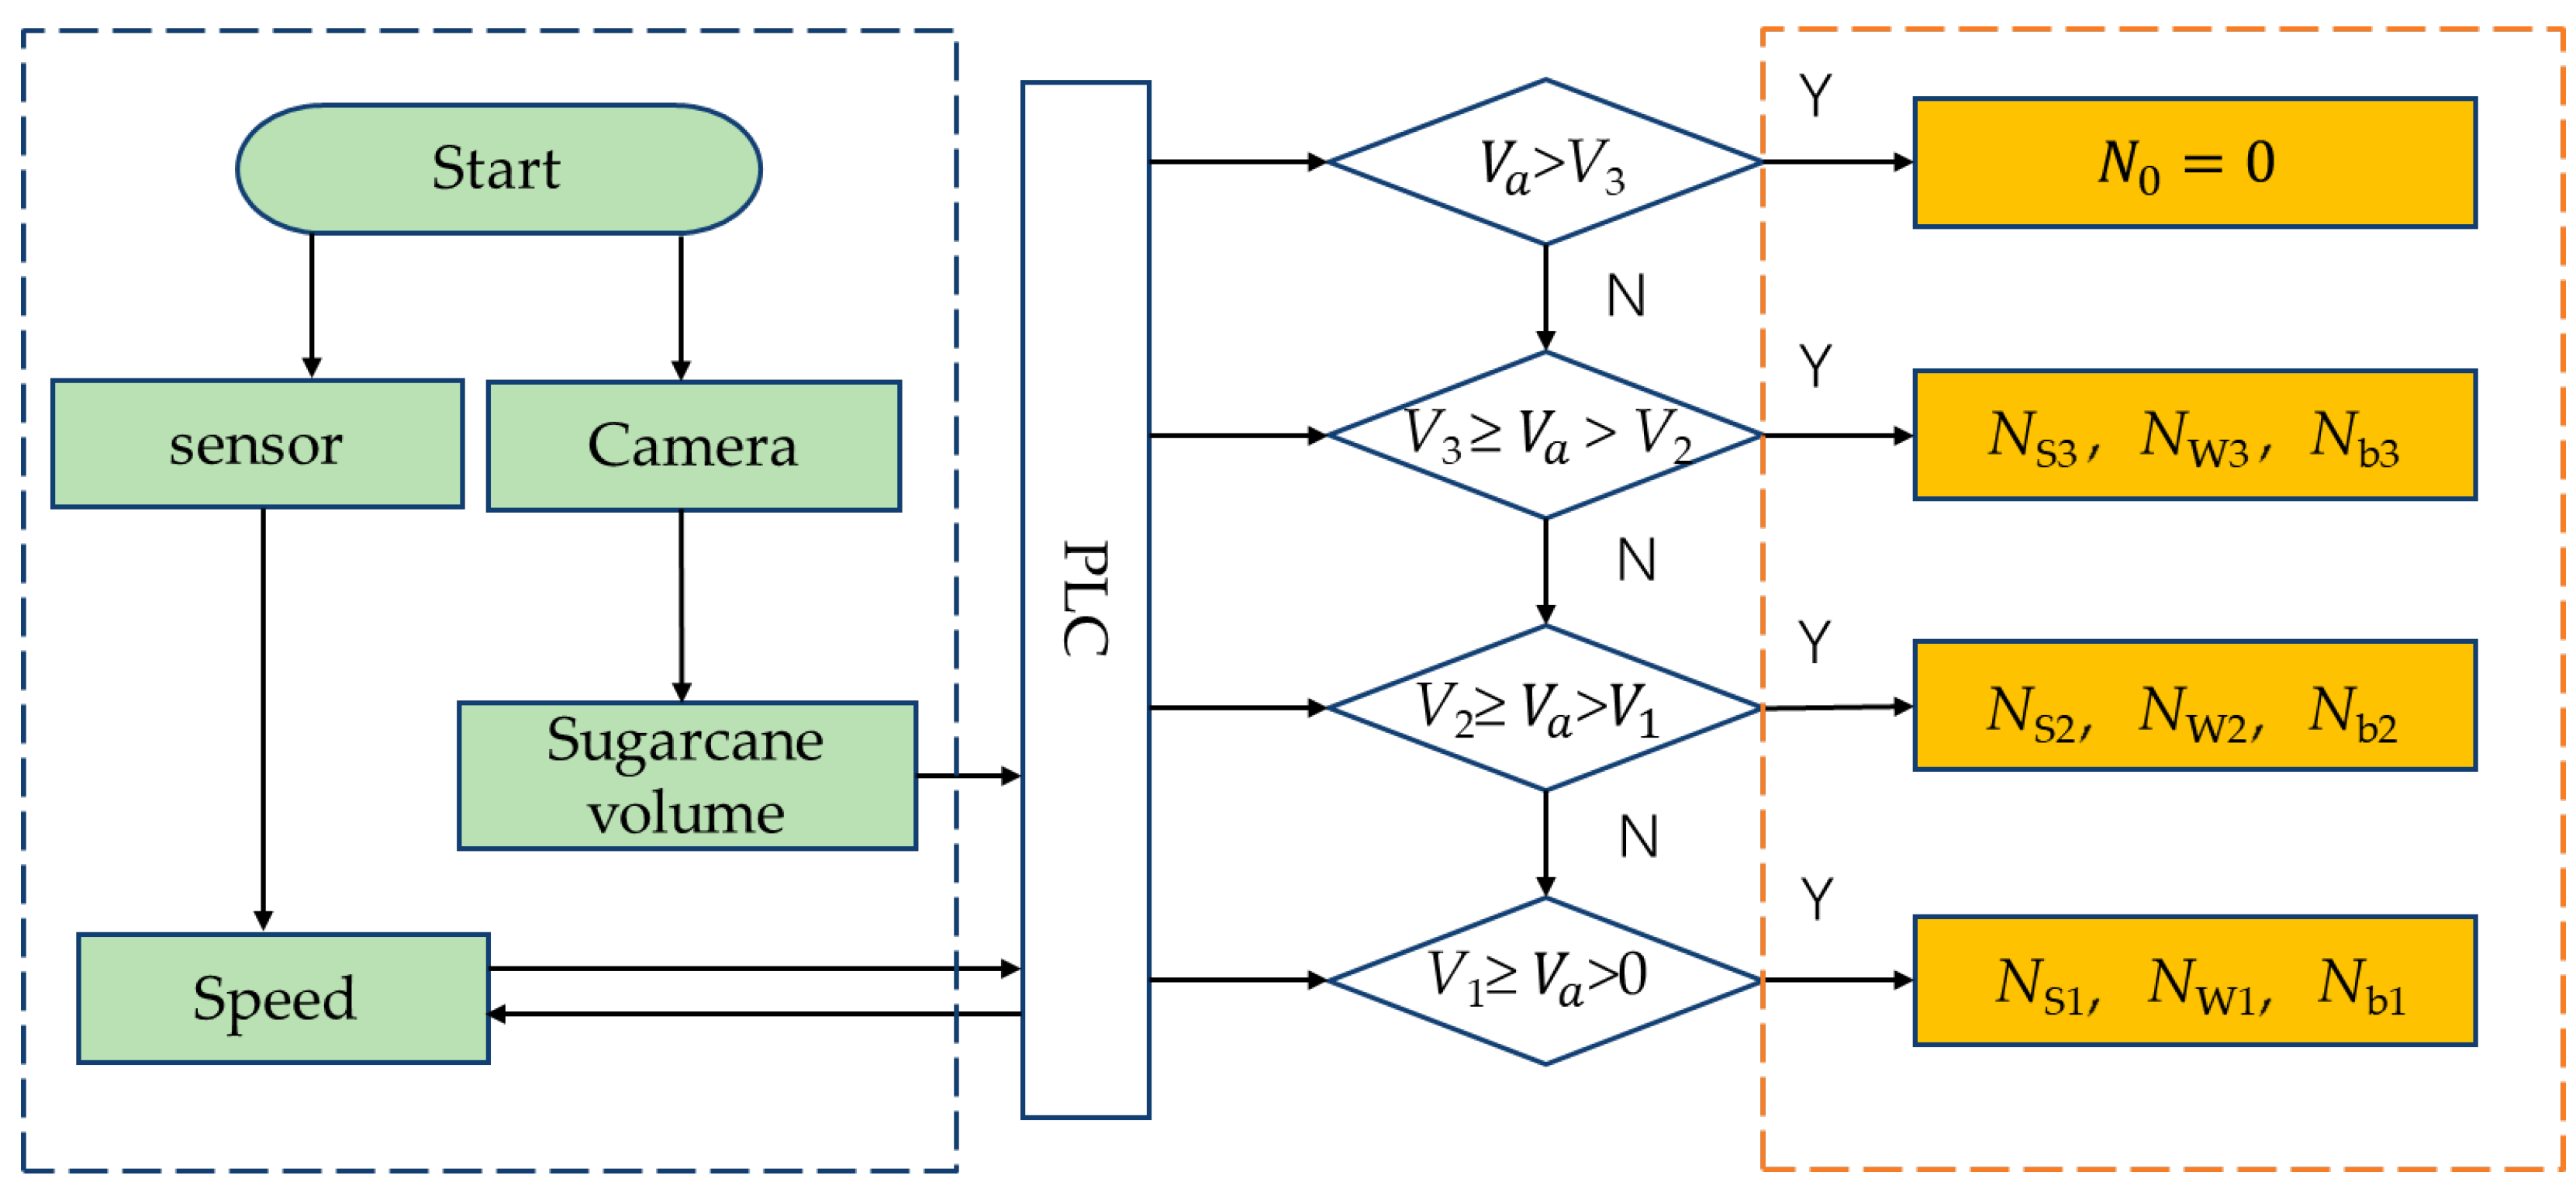
Based on the above functional planning requirements and the reference values for the speed of each roller, the control principle of the conveying control system is shown in Figure 13.
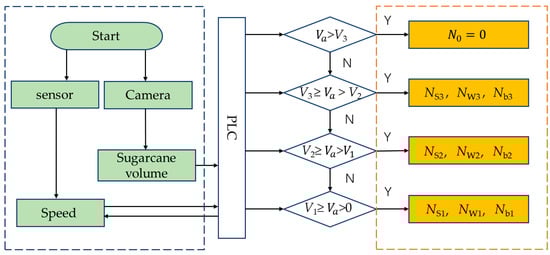
Figure 13.
Control system workflow diagram.
First, set the initial operating state of the control system by setting the feeding roller speed to , the output roller speed to , the leaf-stripping roller speed to .
(1) As shown in the figure, when the volume of fed sugarcane exceeds the threshold value of the sugarcane harvester test bench for feeding sugarcane once, with , there is a high probability that the feeding roller at the front end of the conveying channel will be blocked. In this case, the PLC sends a signal command to force the sugarcane transport trolley to stop transporting sugarcane and outputs the signal command. Otherwise, proceed to the next step to determine which volume range the fed sugarcane falls into and then output the corresponding signal command.
(2) When the volume of fed sugarcane is less than or equal to and greater than , , the PLC outputs , , signal commands.
(3) When the volume of fed sugarcane is less than or equal to and greater than , , the PLC outputs , , signal commands.
(4) When the volume of the fed sugarcane is less than or equal to and greater than 0, , the PLC outputs , , signal commands.
In these, represents the speed of the transport trolley; represents the three speed values of the output roller; represents the three speed values of the feeding roller; and represents the three speed values of the leaf-crushing and peeling roller.
2.5. Experimental Method
The test material used is the sugarcane variety Guitang 42. The sugarcane length is approximately 1.2 m, and its diameter ranges from 24 to 28 mm. The sugarcane is divided into six groups based on the number of roots, with each group repeated for five experiments. The initial parameters for each group were set as follows: the blade disk rotation speed is 650 r/min, the forward speed of the sugarcane transport trolley is 0.6 m/s, the feeding roller speed is 240 r/min, leaf-crushing and stripping roller speed is 870 r/min, and the output roller speed is 780 r/min. In each test, the sugarcane was clamped onto the transport trolley and driven by a motor to the feeding entrance of the test bench’s conveying system.
The blockage rate is calculated according to Formula (15) [4]: represents the blocking rate, %; is the sugarcane feeding amount in a single test; is the number of sugarcanes blocked during the transportation process in one test; and j is the number of repetitions in the experiment.
3. Results
3.1. Sugarcane Feeding Amount Detection
3.1.1. Model Performance Evaluation
The segmentation performance of YOLOv8n and I-YOLOv8n was evaluated using the same dataset. As shown in Table 9, the improved I-YOLOv8n algorithm outperformed YOLOv8n across all metrics. It reduced the number of parameters to 2.83 million and FLOPs to 11.1 G and increased the FPS from 88.3 to 96.2, while maintaining high accuracy (95.6%), recall (90.2%), and (94.8%). This demonstrates the efficacy of our improvements and shows that the enhanced I-YOLOv8n algorithm is suitable for sugarcane feeding amount detection.
Table 9.
A comparison of the performance of segmentation algorithms.
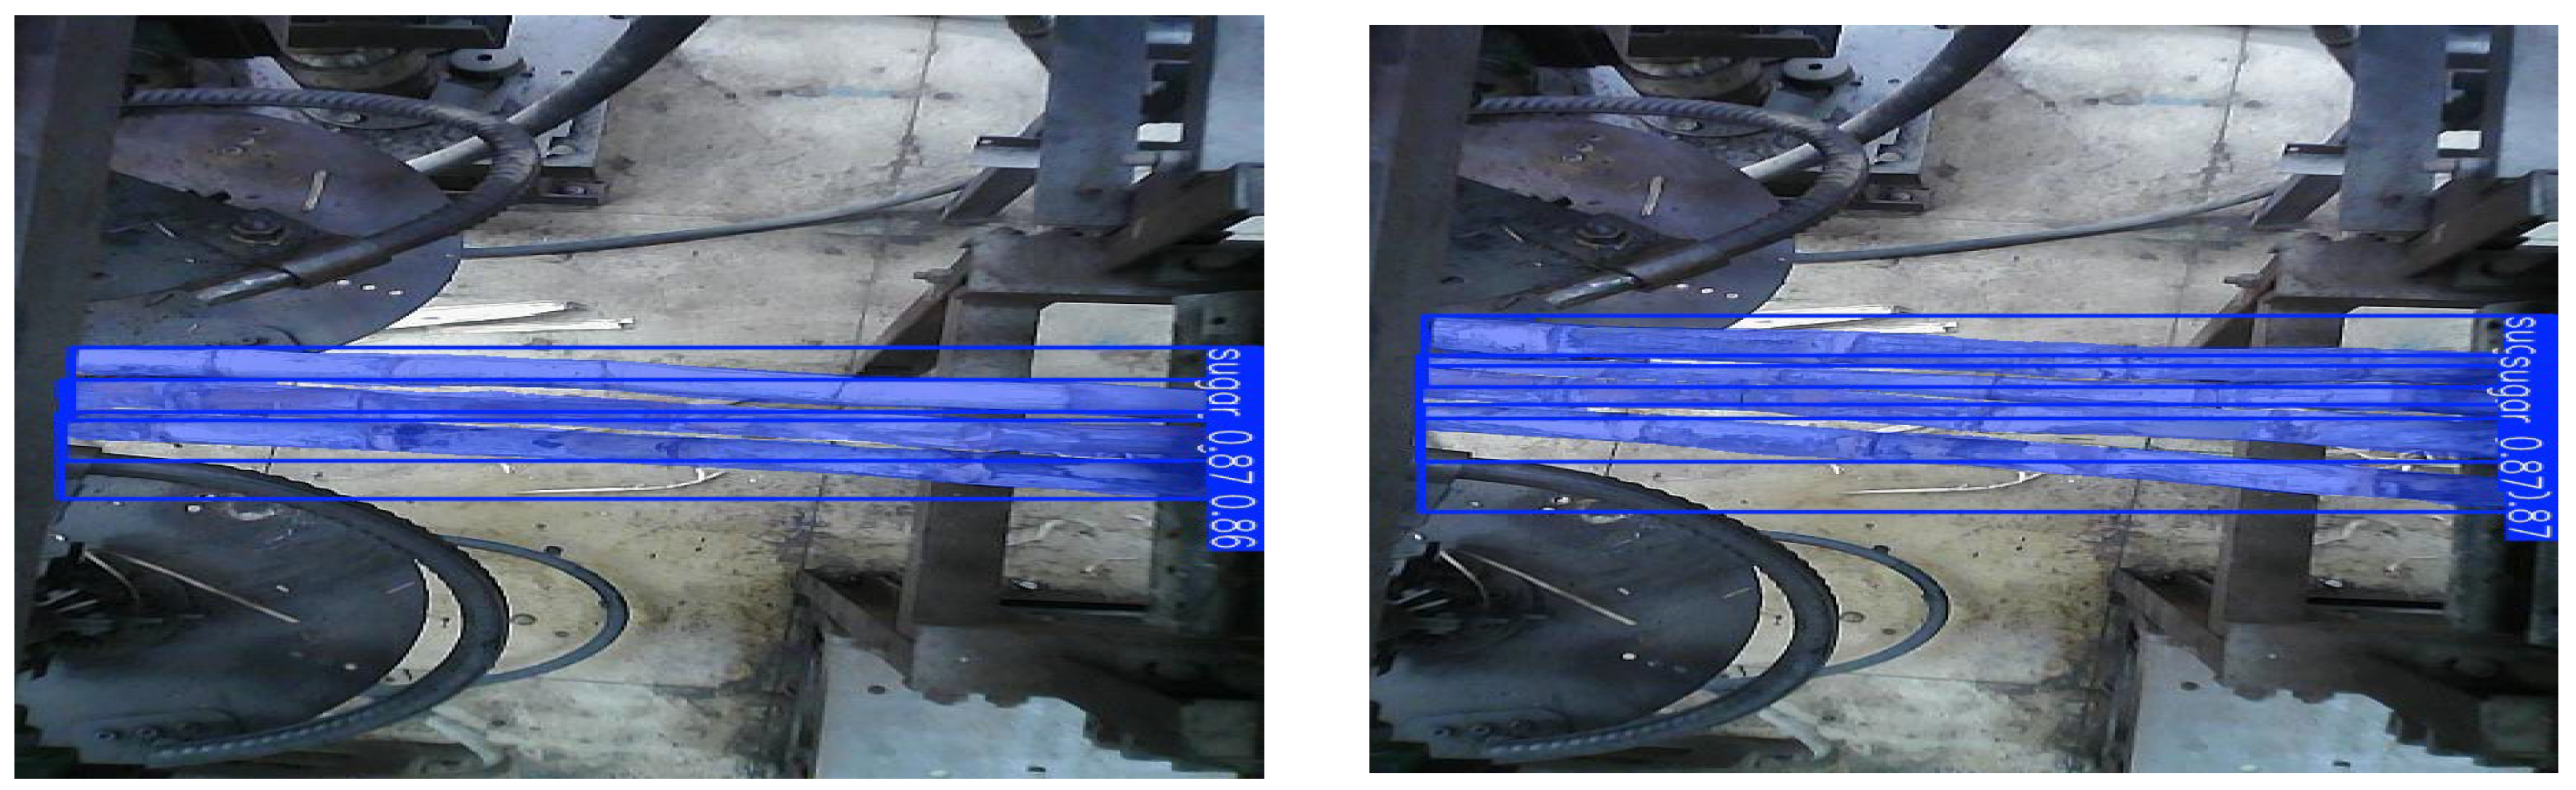
In addition to analyzing the detection indicators, evaluating the detection results is a crucial part of assessing the algorithm’s performance. As shown in Figure 14, a series of sugarcane images in various states was randomly selected for testing. The results show that the improved model can effectively segment the sugarcane contours, even when the sugarcane is stacked.

Figure 14.
Effect of sugarcane segmentation.
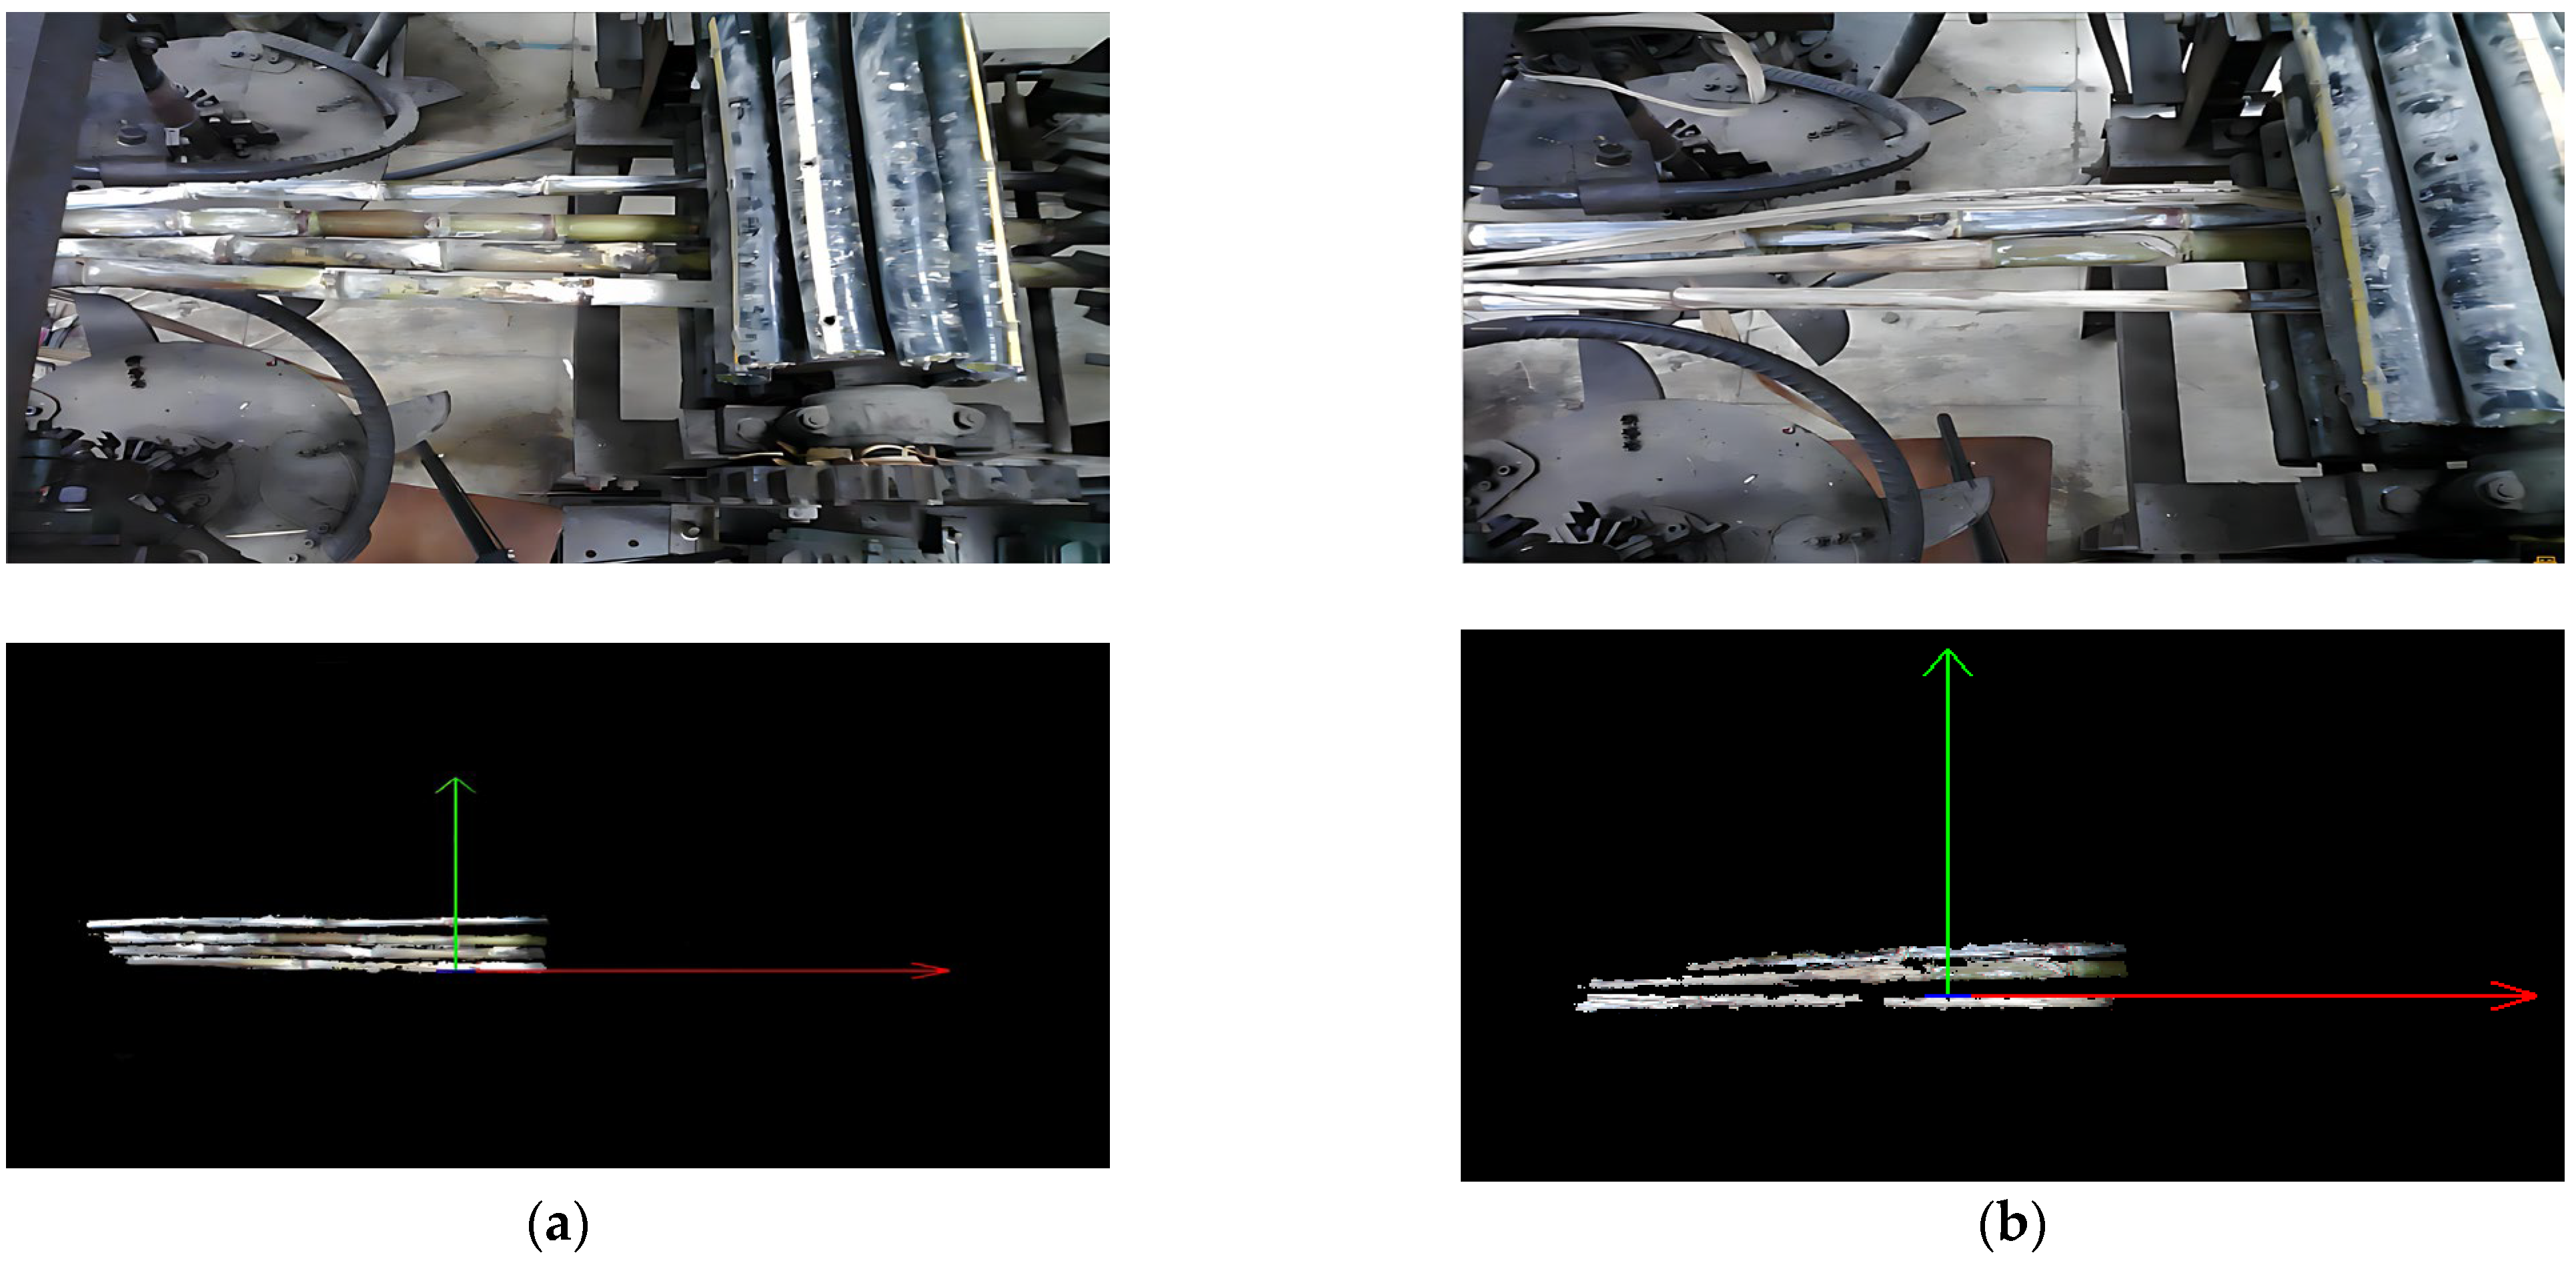
3.1.2. Volume Detection Effect
As shown in Figure 15, when no stacking occurs, complete point cloud information can be obtained. However, when stacking occurs, some point cloud information is lost. As shown in Table 10, with the increase in the amount of sugarcane fed, both the volume detection error and computation time gradually increase. The largest increase occurs when the number of sugarcane canes fed reaches three. This is due to the stacking phenomenon leading to missing point cloud information. When the number of sugarcane stalks fed reaches three or more, stacking may occur. During depth data acquisition using the binocular camera, the inability to correctly match points in the left and right views results in the loss of some depth data, causing discontinuities in the point cloud and ultimately leading to a measured volume smaller than the actual volume. After more than three sugarcanes, the gaps between stacked sugarcane stalks led to computational bias. In the actual operation process, the gaps between stacked sugarcane occupy some space in the feeding roller. As a result, these gaps, which arise from stacking, are accounted for in the volume calculation and are included in the final volume result, causing the measured volume to be greater than the actual volume.
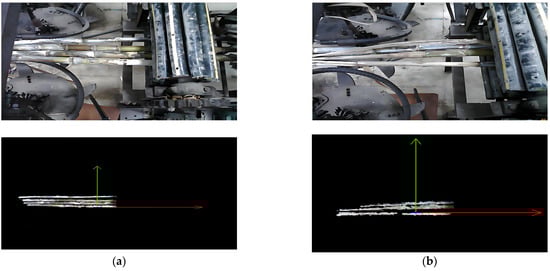
Figure 15.
Sugarcane in different states inside the harvesting prototype: (a) no stacking; (b) stacking.
Table 10.
Volume detection results.
In addition, as shown in Table 8, the roller speeds are divided into three levels based on the sugarcane feeding volume. When the feeding quantity is three or five sugarcanes, the volume is in a critical state. If the detected volume is lower than the actual volume, the roller speed will be reduced. However, the data in Table 7 indicate that, for a feeding quantity of three sugarcanes, even if the speed is reduced, the roller speeds can still ensure that the sugarcane smoothly passes through the conveyor system. When the feeding amount is five sugarcanes, deceleration is likely to cause blockage. At this point, although the output roller speed does not meet the set condition, the feeding roller and the leaf-stripping roller speeds still satisfy the set conditions. Compared to the uncontrolled state, the blockage situation is still alleviated. For other feeding quantities, even if there is some error in volume detection, the volume remains at the set level, and the roller speed will not be reduced. Furthermore, the maximum error of volume detection is less than 10%, which can be considered as meeting the requirements for feeding amount detection in the sugarcane harvester.
3.2. System Control Performance Test
To verify the system’s control performance, the blockage rates with and without the control system are shown in Table 11, and the changes in the roller speeds when the sugarcane feeding quantities are two, four, and six are recorded in Figure 16. The blockage rate without the control system is derived from the results of the two-factor experiment in Section 2.4.3.
Table 11.
Anti-clogging test results.
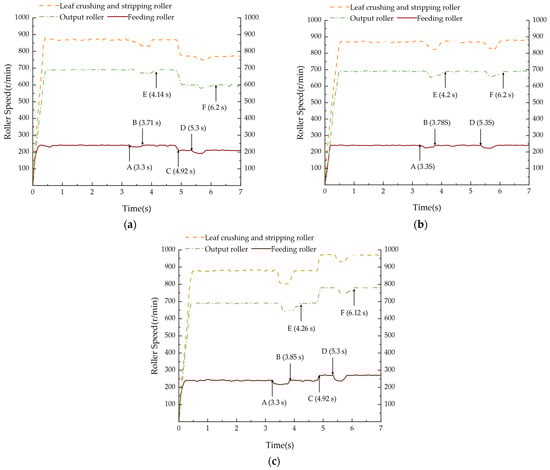
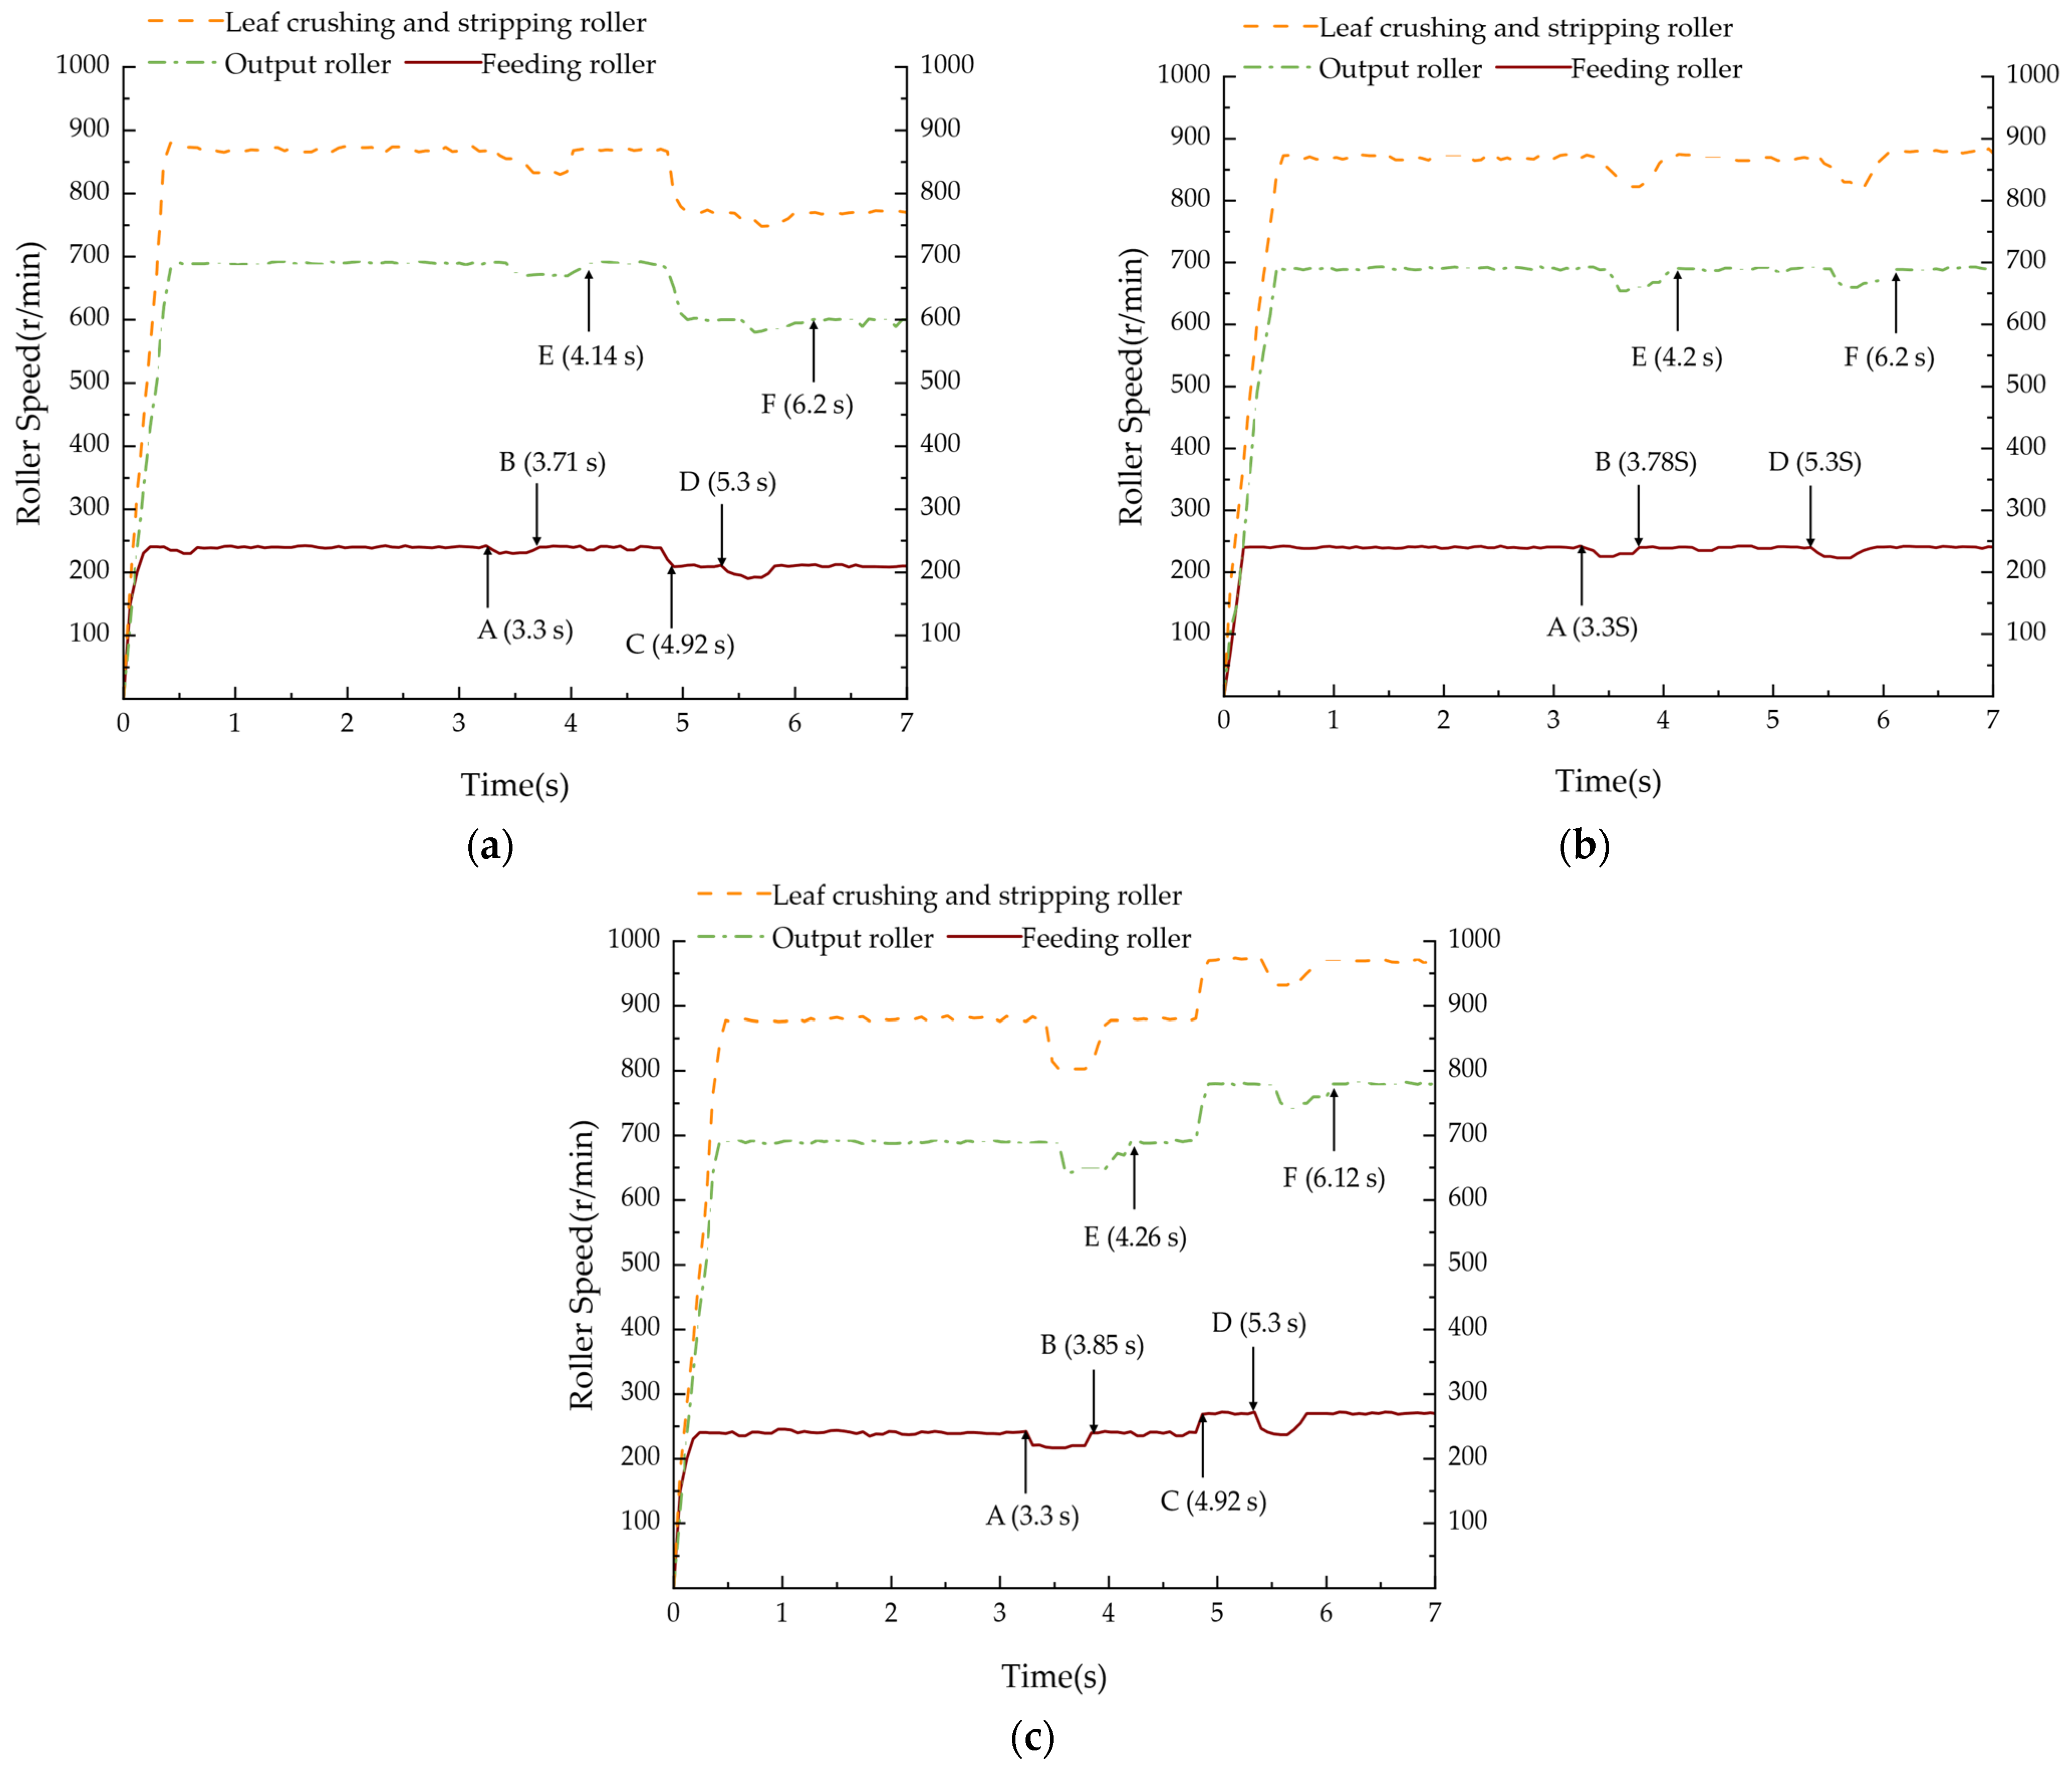
Figure 16.
The speed change curve of each roller at different sugarcane feeding quantities: (a) 2 stalks of sugarcane; (b) 4 stalks of sugarcane; (c) 6 stalks of sugarcane.
Table 11 shows significant differences in the system’s performance with and without the control system. When the control system is enabled, no blockage occurs when the sugarcane feeding quantity is within four stalks. The changes in roller speeds during this process are shown in Figure 16a,b. When the feeding volume is 0~V1, the system reduces the roller speed to ensure smooth passage of the sugarcane through the conveying channel and reduce energy consumption. When the feeding volume is V1~V2, the speed remains unchanged, and the sugarcane passes smoothly. However, when the sugarcane feeding quantity is five or six stalks, blockages are most likely to occur during the first feeding process. The changes in roller speed are shown in Figure 16c. The first batch of sugarcane takes 0.96 s from feeding to output. The second batch of sugarcane takes 0.82 seconds from feeding to output. The blockage rate decreased from 11.47% and 17.76% to 6.54% and 4.32%, respectively.
In Figure 16, point A represents the first feeding of the sugarcane. At this point, the volume information has not yet been fully extracted, as the feeding speed decreases due to the compression of the sugarcane. Point B represents the moment when the sugarcane completely passes through the feeding roller for the first time. At this point, the complete volume data are obtained and transmitted to the PLC controller, and the feeding speed begins to increase as the sugarcane is discharged. Point C represents the moment when the PLC begins to adjust the speed based on the volume data, and point D indicates when the speed adjustment is complete. The average time for speed adjustment is 0.25 s. Point E represents the first batch of sugarcane passing through the output roller. Point F represents the second batch of sugarcane passing through the output roller.
4. Discussion
The research results indicate that the system alleviates the conveyor blockage issue of the sugarcane harvester to some extent but still has potential for further optimization. The core of this system lies in the accurate detection of sugarcane volume. During the experiment, it was found that the stacking degree of the sugarcane and the obstruction caused by cane leaves severely affected the collection of point cloud data, leading to disordered or missing point cloud information in certain areas. To alleviate this situation, Gao et al. [30] used two depth cameras instead of a binocular camera as point cloud acquisition devices to obtain RGB-D data. They performed a rough registration between the measured point cloud and the template point cloud to align the point clouds, which improved some defects in the point cloud data. Alternatively, Sarmad et al. [31] applied reinforcement learning to construct a correspondence between the global feature vector of partial point clouds and the input random noise vector of GAN to complement point clouds. Therefore, multiple sensors can be considered to capture the point cloud information of sugarcane from different angles, or generative adversarial networks (GANs) can be used to supplement the missing point cloud data, thereby improving the loss of point cloud information caused by the occlusion or stacking of sugarcane leaves.
This system’s ability to significantly reduce the probability of blockage lies in the accurate relationship established between volume and speed. However, it also limits the roller speed to three fixed levels, which restricts the flexibility in adjusting the system’s operation. In addition, another key factor contributing to the significant reduction in the blockage rate is the selection of an appropriate initial speed. Since the system cannot be adjusted before the first feeding, it is necessary to collect volume data during the first feeding process. However, when the feeding amount varies significantly, the first feeding process may lead to blockage. The main cause of these issues lies in the discrete threshold-based control strategy designed in this study. The system only responds when the sugarcane feeding amount exceeds a preset threshold, and the response speed of this control strategy is relatively slow. In future research, consideration can be given to combining fuzzy logic control with PID control, dynamically adjusting based on the feeding amount and roller speeds and improving the system’s response speed.
These two aspects severely limit the application of machine vision in sugarcane harvesters and should be given high attention in future research.
5. Conclusions
This study proposes a machine vision-based conveying control approach for sugarcane harvesters to reduce blockage occurrences in the conveying channel. Firstly, an improved I-YOLOv8-Seg instance segmentation model is fused with depth data to rapidly extract 3D sugarcane point clouds from complex backgrounds. Subsequently, the slicing method was established for calculating the volume of sugarcane point clouds. Finally, the optimal roller speeds for different feeding volumes were determined through experiments, leading to the development of a control strategy based on feeding volume detection. Experimental results show a detection accuracy of 91.28% even under maximum feeding rates, and the maximum blockage rate is reduced from 17.76% to 4.32%. This approach ensures continuous harvester operation, improves harvesting efficiency and quality, and results in substantial time and labor cost savings.
Supplementary Materials
The following supporting information can be downloaded at https://www.mdpi.com/article/10.3390/agriengineering7060191/s1; Table S1: Sugarcane clogging rate at different sugarcane feeding amounts and rotating speeds of the feeding roller; Table S2: Sugarcane clogging rate at different feeding amounts and rotation speeds of the crushing and stripping roller; Table S3: Sugarcane clogging rate at different sugarcane feeding amounts and output roller speeds.
Author Contributions
Conceptualization, X.L. (Xiao Lai) and X.L. (Xiao Lang); methodology, X.L. (Xiao Lang); software, X.L. (Xiao Lang); validation, X.L. (Xiao Lai) and X.L. (Xiao Lang); formal analysis, X.L. (Xiao Lai); investigation, X.L. (Xiao Lang); resources, X.L. (Xiao Lai); data curation, X.L. (Xiao Lai); writing—original draft preparation, X.L. (Xiao Lang); writing—review and editing, X.L. (Xiao Lang); visualization, X.L. (Xiao Lai); supervision, X.L. (Xiao Lai); project administration, X.L. (Xiao Lang); funding acquisition, X.L. (Xiao Lai). All authors have read and agreed to the published version of the manuscript.
Funding
This research was funded by the Research Initiation Program for Introduced Talent (Grant No. 2024KJQD12), the Natural Science Foundation of Guangxi (Grant No. 2022GXNSFAA035549) and Guangxi Science and Technology Major Project (Guike AA22117006).
Institutional Review Board Statement
Not applicable.
Informed Consent Statement
Not applicable.
Data Availability Statement
The data presented in this study are available on request from the corresponding author.
Conflicts of Interest
The authors declare no conflicts of interest.
Nomenclature
| Symbol | Meaning |
| The depth value at the -th slice | |
| The total number of pixels within the region | |
| Slice height | |
| Top diameter | |
| Bottom edge distance | |
| Cross-sectional area at the i-th slice | |
| Δ | Slice thickness |
| Recognized volume | |
| Actual volume | |
| Volume detection error | |
| Transport trolley forward speed | |
| Feeding roller speed | |
| Leaf-crushing and stripping roller speed | |
| Output roller speed | |
| Volume range | |
| Blockage quantity in a single test | |
| Feeding quantity in a single test | |
| Number of tests | |
| Blocking rate |
References
- Qian, Y.; Kuang, Z.; Zhao, X.; Zhang, Y.; He, Y.; Li, Y.; Wang, C. Evolution of global sugarcane planting and cane sugar production and circulation. Sugarcane Canesugar 2024, 53, 68–81. [Google Scholar]
- Zhao, Y.; AI, J.; Wang, Y.; Zhang, Z.; Yang, H.; Li, J.; Guo, Z.; Liu, H.; Qin, W.; Deng, J. Research on the Production Potential of Main Sugarcane Varieties Under Different Planting Modes in Hilly and Mountainous Areas. Sci. Agric. Sin. 2024, 57, 3743–3757. [Google Scholar]
- Lai, X.; Chen, P.; Li, S.; Wang, M.; Cheng, J.; Huang, H. Design and Experiment of Conveying Control System for Whole Rod Sugarcane Harvester. Nongye Jixie Xuebao/Trans. Chin. Soc. Agric. Mach. 2023, 54, 121–128+185. [Google Scholar]
- Lai, X.; Chen, S.; Chen, P.; Chen, D. Simulation and Experiment of Blockage of ConveyorSystem of Sugarcane Harvester. J. Agric. Mech. Res. 2025, 47, 162–170. [Google Scholar]
- Wei, X.; Li, Y.; Chen, J.; Song, S.; Gu, J.; Zuo, Z.; Ni, J. System integration of working process intelligent monitoring and controlling devices for combine harvester. TCSAE 2009, 25, 56–60. [Google Scholar]
- Zhang, Y.; Yin, Y.; Meng, Z.; Chen, D.; Qin, W.; Wang, Q.; Dai, D. Development and testing of a grain combine harvester throughput monitoring system. Comput. Electron. Agric. 2022, 200, 107253. [Google Scholar] [CrossRef]
- Špokas, L.; Adamčuk, V.; Bulgakov, V.; Nozdrovický, L. The experimental research of combine harvesters. Res. Agric. Eng. 2016, 62, 106–112. [Google Scholar] [CrossRef]
- Zhang, Z.; Sun, Y.; Liu, R.; Zhang, M.; Li, H.; Li, M. Design and test of feed rate monitoring system for combine harvester. Nongye Jixie Xuebao/Trans. Chin. Soc. Agric. Mach. 2019, 50, 85–92. [Google Scholar] [CrossRef]
- Jiang, T.; Guan, Z.; Li, H.; Mu, S.; Wu, C.; Zhang, M.; Wang, G.; Chen, X. A feeding quantity monitoring system for a combine harvester: Design and experiment. Agriculture 2022, 12, 153. [Google Scholar] [CrossRef]
- Lu, W.; Liu, B.; Zhang, D.; Li, J. Experiment and feed rate modeling for combine harvester. Trans. Chin. Soc. Agric. Mach. 2011, 201, 82–85. [Google Scholar]
- Jie, Z.; Luo, S.; Zhou, X. LabVIEW-based telemetering experiments of rice feed quantity for combined harvester. Trans. Chin. Soc. Agric. Eng. 2009, 25, 87–91. [Google Scholar]
- Sun, Y.; Liu, R.; Ou, H.; Zhang, Z.; Zhang, M.; Li, H. Analysis and comparison of feed rate detection methods of combine harvester based on power detection. Trans. Chin. Soc. Agric. Mach. 2020, 51, 118–123. [Google Scholar]
- Sadeghi-Tehran, P.; Virlet, N.; Ampe, E.M.; Reyns, P.; Hawkesford, M.J. DeepCount: In-field automatic quantification of wheat spikes using simple linear iterative clustering and deep convolutional neural networks. Front. Plant Sci. 2019, 10, 1176. [Google Scholar] [CrossRef]
- Wang, D.; Fu, Y.; Yang, G.; Yang, X.; Liang, D.; Zhou, C.; Zhang, N.; Wu, H.; Zhang, D. Combined use of FCN and Harris corner detection for counting wheat ears in field conditions. IEEE Access 2019, 7, 178930–178941. [Google Scholar] [CrossRef]
- Xiong, X.; Duan, L.; Liu, L.; Tu, H.; Yang, P.; Wu, D.; Chen, G.; Xiong, L.; Yang, W.; Liu, Q. Panicle-SEG: A robust image segmentation method for rice panicles in the field based on deep learning and superpixel optimization. Plant Methods 2017, 13, 104. [Google Scholar] [CrossRef]
- Dandrifosse, S.; Ennadifi, E.; Carlier, A.; Gosselin, B.; Dumont, B.; Mercatoris, B. Deep learning for wheat ear segmentation and ear density measurement: From heading to maturity. Comput. Electron. Agric. 2022, 199, 107161. [Google Scholar] [CrossRef]
- Chen, J.; Fu, S.; Wang, Z.; Zhu, L.; Xia, H. Research on the method of predicting feeding volume of rice combine harvester base on machine vision. In Proceedings of the International Conference on Image Processing and Intelligent Control (IPIC 2021), Lanzhou, China, 30 July–1 August 2021; pp. 28–32. [Google Scholar]
- Subbarayudu, C.; Kubendiran, M. A Comprehensive Survey on Machine Learning and Deep Learning Techniques for Crop Disease Prediction in Smart Agriculture. Nat. Environ. Pollut. Technol. 2024, 23, 619–632. [Google Scholar] [CrossRef]
- Xu, B.; Chai, L.; Zhang, C. Research and application on corn crop identification and positioning method based on Machine vision. Inf. Process. Agric. 2023, 10, 106–113. [Google Scholar] [CrossRef]
- Fan, C.; Wang, W.; Cui, T.; Liu, Y.; Qiao, M. Maize kernel broken rate prediction using machine vision and machine learning algorithms. Foods 2024, 13, 4044. [Google Scholar] [CrossRef]
- Islam, M.M.; Himel, G.M.S.; Moazzam, M.G.; Uddin, M.S. Artificial Intelligence-based Rice Variety Classification: A State-of-the-Art Review and Future Directions. Smart Agric. Technol. 2025, 10, 100788. [Google Scholar] [CrossRef]
- Yan, Z.; Liu, R.; Cheng, L.; Zhou, X.; Ruan, X.; Xiao, Y. A concave hull methodology for calculating the crown volume of individual trees based on vehicle-borne LiDAR data. Remote Sens. 2019, 11, 623. [Google Scholar] [CrossRef]
- Mirbod, O.; Choi, D.; Heinemann, P.H.; Marini, R.P.; He, L. On-tree apple fruit size estimation using stereo vision with deep learning-based occlusion handling. Biosyst. Eng. 2023, 226, 27–42. [Google Scholar] [CrossRef]
- Qi, Z.; Hua, W.; Zhang, Z.; Deng, X.; Yuan, T.; Zhang, W. A novel method for tomato stem diameter measurement based on improved YOLOv8-seg and RGB-D data. Comput. Electron. Agric. 2024, 226, 109387. [Google Scholar] [CrossRef]
- JB/T 6275-2019; Sugarcane combine harvesters. Ministry of Industry and Information Technology of the People’s Republic of China: Beijing, China, 2019.
- LabelMe, version 5.3.1, Software for Image Annotation. MIT Computer Science and Artificial Intelligence Laboratory (CSAIL): Cambridge, MA, USA, 2023.
- YOLOv8, version 8.0, Software for Object Detection. Ultralytics: San Francisco, CA, USA, 2023.
- Zhang, Z. A flexible new technique for camera calibration. IEEE Trans. Pattern Anal. Mach. Intell. 2002, 22, 1330–1334. [Google Scholar] [CrossRef]
- MATLAB R2023a, version 9.14.0, Software for Numerical Computation. MathWorks: Natick, MA, USA, 2023.
- Gao, Z.; Lei, J.; Wu, J.; Zhang, J.; Ruchay, A.; Pezzuolo, A.; Guo, H. Automated method for measuring body size parameters of live pigs based on non-rigid registration of point clouds. In Proceedings of the 2023 IEEE International Workshop on Metrology for Agriculture and Forestry (MetroAgriFor), Pisa, Italy, 6–8 November 2023; pp. 472–477. [Google Scholar]
- Sarmad, M.; Lee, H.J.; Kim, Y.M. Rl-gan-net: A reinforcement learning agent controlled gan network for real-time point cloud shape completion. In Proceedings of the Proceedings of the IEEE/CVF conference on computer vision and pattern recognition, Long Beach, CA, USA, 15–20 June 2019; pp. 5898–5907. [Google Scholar]


Disclaimer/Publisher’s Note: The statements, opinions and data contained in all publications are solely those of the individual author(s) and contributor(s) and not of MDPI and/or the editor(s). MDPI and/or the editor(s) disclaim responsibility for any injury to people or property resulting from any ideas, methods, instructions or products referred to in the content. |
© 2025 by the authors. Licensee MDPI, Basel, Switzerland. This article is an open access article distributed under the terms and conditions of the Creative Commons Attribution (CC BY) license (https://creativecommons.org/licenses/by/4.0/).