Article

Improving Water Use and Sugarcane Yield Using Irrigation Strategies in Nicaragua

by
Rafael Menezes Pereira
1,2,
Felipe Schwerz
3,*,
Adriano Valentim Diotto
2,
Carolina Altamirano Oñate
1,
Marlon Daniel Vargas Sandoval
1,
Braulio Otomar Caron
4 and
Bernardo Cândido
5
1
Compañía Azucarera del Sur—CASUR, Carretera Panamericana, Potosí, Rivas 48300, Nicaragua
2
Department of Water Resources, Federal University of Lavras, Lavras 37200-000, MG, Brazil
3
Department of Agricultural Engineering, Federal University of Lavras, Lavras 37200-000, MG, Brazil
4
Department of Agronomic and Environmental Sciences, Federal University of Santa Maria, Frederico Westphalen 98400-000, RS, Brazil
5
College of Agriculture, Food and Natural Resources, University of Missouri, Columbia, MO 65211, USA
*
Author to whom correspondence should be addressed.
AgriEngineering 2025, 7(5), 162; https://doi.org/10.3390/agriengineering7050162
Submission received: 7 April 2025 / Revised: 5 May 2025 / Accepted: 15 May 2025 / Published: 21 May 2025
(This article belongs to the Section Agricultural Irrigation Systems)

Abstract

:
One of the greatest challenges in crop science worldwide is balancing crop production and water management. In the context of sustainability and vertical production growth, understanding water relations is fundamental for improving crop management in irrigated and rainfed sugarcane fields. Adequate irrigation management can improve water use efficiency and agronomic performance. Nicaragua, due to its limited research and information on irrigation, has significant opportunities to increase crop yields and enhance water efficiency. Therefore, the aim of this study was to evaluate the response of sugarcane growth, yield, and water use efficiency under different irrigation management strategies. The study was performed in a field area from Casur Sugarcane mill in Nicaragua during the crop cycle 2021/2022. The experimental area was cultivated in high clay soil, with the variety CP72-2086 in the second cut with the furrow irrigation method. Two treatments were evaluated, irrigation based on soil moisture (ISw) and irrigation with fixed intervals (IFI), and their effect on growth variables and crop yield. On a temporal analysis, the plants showed compensatory growth in IFI, recovering from water-deficit stress in most measured variables. Sugarcane yield was statistically different between the treatments with 97.87 and 83.84 Mg ha−1 for ISw and IFI, respectively. The water use efficiency was similar for both irrigation strategies. Based on the results found by the authors, it is recommendable to manage irrigation based on soil moisture content because of the best growth response and sugarcane yield.

1. Introduction

Sugarcane is one of the most important crops cultivated in Nicaragua. The sugarcane industry accounts for over 4% of the Gross National Product (GNP), generating approximately USD 210 million. Additionally, it contributes 10% of the total seaport cargo and over 380 million kilowatt-hours of renewable energy from sugarcane biomass to the national grid [1].
Nicaragua has the largest water resources in Central America, and approximately 70% of its sugarcane fields are irrigated [2]. Despite the economic and agricultural importance, there is limited information regarding irrigation management, crop growth analysis, and water use efficiency.
Sugarcane requires between 900 and 2500 mm of water per season [3,4,5,6]. Irrigation management should consider allowable water deficits during specific phenological stages. Using soil water tension as an indicator, maximum stalk yields have been achieved in vertisols [7]. Similarly, variable yields have been reported with center pivot irrigation systems at different ET0 levels [8]. Daily sugarcane water consumption varies from 2 to 6 mm/day depending on the variety, growth stage, and evapotranspiration demand [6,9].
Irrigation in sugarcane is present in many countries. About 60% of the sugar produced from cane in Australia requires some form of irrigation. In South Africa, around 40% of the crop depends on irrigation, and in some countries, sugarcane cannot be grown without irrigation (Swaziland and Sudan, for example) [10,11]. Several irrigation schedule methods have been proposed to optimize irrigation in sugarcane crops. According to [12,13], the authors recommended irrigation at a fixed time interval, while others recommended irrigation at 20% [14], 50% [15], or depletion of available soil moisture from the effective root zone.
Globally, irrigation plays a vital role in food production and contributes significantly to reducing hunger [16]. Although only 17% of the croplands are irrigated, they account for 40% of the global food production [17,18]. Due to its critical role in photosynthesis, nutrient dissolution and uptake, transport, and other physiological processes in crops [18], water is a major determinant of biomass production and yields. Thus, evaluating sugarcane responses to different irrigation strategies is crucial to maximizing yields and growth variables. Previous studies have shown that drought stress reduces leaf area, stalk weight, tillering, and biomass accumulation [19,20,21,22].
Although several authors have evidenced the deleterious effects of water stress, its effect can be more or less pronounced when it occurs at a particular crop growth stage [19]. However, it is necessary to evaluate the most critical phases of the crop and how the water–soil–plant relationship occurs due to the compensatory growth phenomenon. These natural endowments give the sugarcane more resilience over abiotic stresses, which are called compensatory ability [10].
In Nicaragua, most farmers rely on empirical irrigation scheduling, often using fixed intervals due to limited technical knowledge and infrastructure. This approach may lead to inefficient water use and reduced yields. Most sugarcane farmers do not use equipment to measure soil moisture content or ETc throughout the two-step procedure (ET0 × Kc) to guide irrigation. An irrigation schedule based on the calendar (fixed irrigation interval or frequency) is the principal irrigation schedule used locally due to its ease from an operative point of view. This empirical irrigation management may result in an over- or under-depth water application, resulting in the elevation of production cost, and reducing yields, water use efficiency, and availability for other crops.
The utilization of accurate soil moisture information emerges as a fundamental tool to optimize irrigation management. By enabling the precise assessment of the water status of the root zone, soil moisture monitoring facilitates the application of irrigation at the most appropriate times and in adequate amounts, thereby improving water use efficiency. Therefore, adopting soil moisture data as a basis for irrigation scheduling allows for better alignment between crop water demand and supply, promoting plant health and maximizing productivity. Furthermore, when integrated with meteorological data and crop phenological stages, soil moisture information supports the development of advanced irrigation strategies that contribute to the resilience of agricultural systems.
Therefore, this study aimed to evaluate two irrigation management strategies in Nicaragua based on soil moisture and with fixed intervals (local management) to understand their effects on sugarcane growth, yield, and water use efficiency. This knowledge is essential for sugarcane companies, farmers, and technicians in order to promote sustainable irrigation management and irrigated agriculture in Nicaragua.

2. Materials and Methods

2.1. Site Characterization

The field experiment was conducted during the 2021/2022 crop season at the Compañía Azucarera del Sur (Casur) sugarcane mill in Potosí, Rivas Department, Nicaragua. The site is located at latitude 11.597° N, longitude 85.884° W, and an altitude of 39 m. The experiment was carried out in second ratoon sugarcane (2nd cut, crop cycle 2021/2022) planted with the variety CP72-2086, genotype from Canal Point—USA but widely planted in Nicaragua and Central America. The experiment began on 31 January 2021, and ended on 13 January 2022. The distance between sugarcane rows used for the company is 1.65 m, with a density of 15 buds per meter at planting.
Information about climate conditions in the field experiment was obtained using a meteorological station located inside the area of Casur, approximately 3 km from the experimental field. This station belongs to INETER (Instituto Nicaraguense de Estudios Territoriales), the governmental institution responsible for meteorological monitoring in Nicaragua. The climate in the region is classified as tropical savanna (Aw) according to the Koppen classification, with an average annual rainfall of 1130 mm, mainly between May and November. The average maximum temperature is 30.9 °C, and the average minimum is 24.1 °C. The annual mean maximum and minimum relative humidity range from 40% to 100% and 95% to 25%. The annual mean maximum, minimum, and average of pan evaporation range from 18.1, 1.1, and 6.4 mm day−1, respectively, while the mean wind speed ranges from 3.6 to 1.9 m s−1.
A soil analysis was performed in the experimental area at the different soil layers, 0–25 and 25–50 cm depth. Four subsamples were taken per layer, randomized in the mixed area, forming only one sample per layer. Table 1 shows the chemical and physical results. Field capacity, wilting point, and porosity were determined using the apparatus plate. The bulk density of the dry soil was taken using a core sample.
The soil of the experimental field is a vertisol, characterized by soils usually with high plasticity and stickiness when wet and crack formation when dry. Soils in the area generally have high levels of calcium and magnesium, and in some sites, low to high sodium levels. Casur estimates that around 70% of its sugarcane fields are cultivated in this type of soil, which includes salty areas.

2.2. Experimental Design

The experiment used a split-plot design with two treatments and five replications. The treatments were (1) irrigation based on soil moisture content (ISw) and (2) irrigation at fixed intervals (IFI). The experimental units considered were ten furrows 70 m long.
The IFI treatment was defined by local practices, with an average interval of 31 days between irrigation events. In contrast, ISw was managed using soil moisture measurements, ensuring no more than 45% depletion of the available water. Furrow irrigation was used for both treatments.
Since there are no free data from meteorological stations in Nicaragua, nor a good network of them, the estimation of ET0 is challenging. Another difficulty of the ET0 is it uses knowledge, which is not well known locally. In the absence of ET0 and Kc to calculate ETc, ISw was defined as the second treatment, where irrigation is guided by the soil moisture content.

2.3. Soil Moisture Content and Irrigation Management

The gravimetric methodology was used to determine the soil moisture content. The soil moisture content was determined each 7 to 10 days long during the crop cycle. The soil samples were taken at 0–25, 25–50, and 50–75 cm depth. The soil moisture for each plot in each evaluation was the average of three samples taken at the beginning of the furrow, avoiding the first 5 m.
Irrigation management was carried out based on soil moisture monitoring. The irrigation schedule was defined according to the soil moisture content, never allowing more than 45% depletion of the total available water at the root zone. The available water (AW) was determined according to Equation (1) [7].
AW = ( θ fc θ wp )   ×   BD   ×   Z   ×   0.45
where θfc and θwp are the moisture content at the field capacity and wilting point (g g−1). BD is the dry soil bulk density (g cm−3), and Z is the effective root zone. The irrigation system used was furrow irrigation, the most used in this region for sugarcane and other crops.

2.4. Sugarcane Yield and Growth Variables

Growth evaluations were conducted at 60, 90, 150, 210, 270, 300, and 340 days after cutting (DAC), totaling seven evaluations during the crop cycle.
The growth components evaluated were as follows: TI—tillering (stalk m−2) measured in 16.5 m2 by counting the number of stalks in the evaluated area; Di—stalk diameter (mm) measured in the centered internode of the stalk using a digital pachymeter; IN—number of internodes by counting the number of internodes in each stalk; and H—plant height (m) measured from the bottom until the last visible dewlap (+1 leaf) using a measuring tape. The same components were also measured at harvest at 344 DAC on 13 January 2022. On this day, each plot of 1155 m2 was manually harvested and weighted individually, then converted for the estimation of CY—cane yield (Mg ha−1).
Other growth variables related to the plant physiological response measured and calculated were as follows: NGL—number of green leaves per stalk, measured by counting the number of green leaves from the leaf +1 until the last leaf with at least 20% of green area; SLA—stalk leaf area (cm2); LAI—leaf area index (m2 m−2); and LAR—leaf area rate (cm2 g−1), where the LAR is obtained according to Equation (2).
LAR = SLA   ×   SD   ×   DM 1
where SD is the stalk density or number of stalks per lineal meter and DM is the dry matter of all the plants one meter long.
For the growth evaluations, ten stalks were marked and identified in five plots per treatment, totaling 50 evaluation plants per treatment, i.e., the same plants were evaluated during the crop cycle. For the dry matter determination, the destructive method was used, where all the plants that were one meter long in each plot were cut and weighed to obtain the total fresh weight. After that, all the plants per sample were milled, and one sample of 500 g was dried in the oven at 110 °C until constant weight to obtain the moisture content, and hence, the dry matter.

2.5. Irrigation Water Depth and Water Use Efficiency

Irrigation water regime—IWR was measured using a Parshall flume. This equipment measures the water flow—Q (l s−1), and with the area irrigated—S (ha) and the time spent in each irrigation event—t (h) to irrigate the area S, it was possible to obtain the IWR (Equation (3)).
IWR = Q   ×   0.36   ×   t   S
The water use efficiency was calculated considering the sugarcane yield and the total irrigation water applied. Similar studies also calculated the WUE using the same methodology [23,24]. To obtain the WUE, Equations (4) and (5) were used:
IWUE = CY   IW
where IWUE is the irrigation water use efficiency (Mg ha−1 mm−1), CY is the sugarcane yield (Mg ha−1), and IW is the total irrigation water applied (mm).
TWUE = CY   TW  
where TWUE is the total water use efficiency (Mg ha−1 mm−1), which is the division of CY by the total water (TW) used by the crop (mm). TW is the sum of the total irrigation water applied and rainfall.

2.6. Agronomical Practices

The experiment was conducted in a field area in ratoon sugarcane (2nd cut, crop cycle 2021/2022) planted with the variety CP72-2086, a genotype widely planted in Nicaragua and Central America. The past harvest was on 31 January 2021. After 5 days of mechanical harvesting, the mulch (dry leaves) was aligned, leaving four rows free of mulch and one with mulch. Mechanical cultivation was carried out with a disk harrow at 25 days of age to kill any weed and better shape the furrows for irrigation. The sugarcane field was fertilized with 410 kg ha−1 of NPK (25-06-06) at 60 DAC. Weed control was performed mechanically and chemically. No insecticides or fungicides were applied.

2.7. Statistical Analysis

The results obtained in this study were statistically analyzed with the software Infostat version 2. An analysis of variance (ANOVA) was performed to evaluate the effects of the irrigation management strategies on sugarcane yield and yield components. Also, differences were considered significant when p < 0.05 using the Tukey test.

3. Results and Discussion

3.1. Irrigation Water Applied and Soil Moisture Content

Irrigation was essential during the early stages of crop development. Irrigation events occurred between February and June, corresponding to the first 150 DACs. A total of nine irrigations were applied in the ISw treatment and five in the IFI treatment, resulting in total irrigation amounts of 707.1 mm and 556.4 mm, respectively (Table 2).
Despite the higher total water consumption in ISw, the average water application depth per event was 29% lower than in IFI. This is likely due to deeper soil cracks in the IFI plots caused by lower soil moisture prior to irrigation. Cracked vertisols tend to absorb more water initially, leading to higher irrigation depths and deep percolation losses. The volume of this type of soil changes according to soil moisture, expanding or swelling when wet and cracking when dry [25]. As a result of more water depletion in IFI, the soil moisture content reached low values, leading to more cracks than in ISw. Gravity directs water along a furrow irrigation system from its head to its end. During water movement on the surface, infiltration occurs in soil profiles. In cracked soil, water is first absorbed by the cracks, then percolates along the furrow [26], resulting in deeper percolation, and thus, higher water usage.
The soil moisture dynamics indicated that IFI had lower moisture levels at 25–50 cm depth compared to ISw, especially before irrigation events (Figure 1). This confirmed that IFI resulted in more water depletion and deeper percolation, emphasizing the inefficiency of fixed-interval irrigation.
Most significant soil moisture variations occurred at 0–25 cm for both treatments because of irrigation and rain, and the lowest variation occurred at 25–50 cm (Figure 1). Similar results were found by [7] in Mexico, studying the soil moisture tension effect on sugarcane growth and yield. The water depletion was higher in IFI than ISw in both soil profiles.

3.2. Sugarcane Yield Responses According to Irrigation Management Strategies

Throughout the crop cycle, ISw treatment plants generally exhibited superior growth compared to IFI (Figure 2). Plant height was consistently greater in ISw, particularly during the mid-stages of development (Figure 2A). In the early stages, the first 60 days, the difference in stalk elongation was not so much compared to those in the mid stages (60 to 150 DAC). During the first 60 days, the total water applied (TW)—irrigation plus rainfall—was 293 and 248 mm for ISw and IFI, respectively, representing only 45 mm of deficit. But in mid-stage, the difference increased, reaching 159 at 86 DAC, 178 at 115 DAC, and 151 mm at 145 DAC. This difference in the TW applied caused IFI water stress, resulting in less plant elongation.
The stalk diameter and the number of internodes did not differ significantly between the treatments (Figure 2B,C). However, tillering was slightly higher in ISw during the early growth stages, though the final tiller density was similar (Figure 2D).
Sugarcane stalk elongation was sensitive to water stress, and several authors have reported similar findings for this growth variable. In India, sugarcane subjected to drought and waterlogging exhibited an 18.25% and 7.11% reduction in plant height, respectively, compared to well-irrigated conditions [22]. According to [27], in Japan, when studying the response of sugarcane to different nitrogen applications under well-watered and drought-stressed conditions, it was found that plant height significantly decreased under drought stress. At harvest, a significant difference in plant height was observed between the ISw and IFI treatments (Figure 3A).
Plant diameter, however, did not show any differences between the treatments during the temporal evolution (Figure 2B) or at harvest (Figure 3B). Both treatments ended with almost the same diameter: 23.23 mm for IFI and 23.93 mm for ISw. According to [9,28,29], stem diameter is a parameter largely influenced by genetics and is less affected by environmental factors.
Similarly, the number of internodes did not differ significantly either during the temporal evolution (Figure 2C) or at harvest (Figure 3C). Although there was a 2.1% difference between ISw and IFI at harvest, it was not statistically significant. Despite having a similar number of internodes, IFI exhibited jointed internodes due to water stress exposure. This occurred because during stalk development, each internode functions as an independent unit. While it retains an attached green leaf, the internode completes its elongation cycle. Generally, the internode completes this phase by the time the attached leaf senesces [30]. Drought stress accelerates leaf senescence in sugarcane [10,31], as observed in the IFI treatment.
Tillering, the process of underground branching from short stem joints that produces additional shoots and contributes to the number of millable canes [32,33,34], also demonstrated treatment effects. Under normal conditions, shoot emergence increases after planting or cutting until maximum tillering is reached, followed by a decline (tiller mortality) and stabilization. Tiller mortality is influenced by variety, agronomic management, biotic and abiotic stresses, climate, and nutritional status.
At 60 DAC, ISw and IFI started with approximately the same number of tillers per square meter (~12.2). ISw reached maximum tillering at 90 DAC with 12.8 stalks m−2, and then declined to 6.99 stalks m−2 at 340 DAC. IFI, however, peaked earlier at 60 DAC with 12.4 stalks m−2, followed by a decrease to 6.75 stalks m−2 at 340 DAC (Figure 3D). While the final tiller population was similar, ISw maintained significantly higher values than IFI.
Similar results were reported by [35] in Florida, USA, where sugarcane tillering varied between soil types but not between well-watered and water-stressed treatments. In Australia, stalk numbers per square meter were similar and not statistically different between well-watered and early-season drought treatments [19]. Other studies also examined sugarcane tillering responses to water deficit [21,29,36,37].
Although statistically significant, the small variation in the tiller index (TI) likely reflects the timing of water deficit occurrence. The main difference in total water applied (TWA)—irrigation plus rainfall—occurred within the first 150 DAC (Table 3), when IFI received 57% less TWA. This early-season water deficit suppressed tillering in IFI, whereas ISw showed normal development. After this period, rainfall predominated, eliminating irrigation needs and stabilizing tillering. Shoots formed after 60–90 DAC were typically lost due to shading or reduced radiation interception [33,38], leading to a convergence in tiller numbers after 150 DAC. If intermittent drought stress had persisted in IFI, TI could have decreased further.
The rainfall and total water applied throughout the crop cycle were 1211 mm (ISw), 1918 mm (IFI), and 1767 mm, aligning with the crop’s water requirements according to various authors [3,4,5,38]. Despite adequate water supply, irregular rainfall distribution confirmed the need for irrigation, particularly in the early growth stages. After 150 DAC, rainfall alone sufficed.

3.3. Sugarcane Growth Variables During the Crop Cycle

Growth variables relate external or physical plant structures with internal plant functions. Leaves are the principal plant structure because it is the site where photosynthesis and respiration happen, and hence, the carbohydrate production.
The number of green leaves per stalk (NGL) was higher in ISw for most of the crop cycle, indicating delayed leaf senescence (Figure 4A). This suggests that water stress in IFI accelerated leaf aging. Between 210 and 270 DAC, the NGL was similar in both treatments, with 11.6 and 11.4 and 11.3 and 11.5 NGL, respectively. This indicates that IFI had more leaf senescence during the irrigation period. After that, the plants showed some degree of compensation in leaf appearance, recovering from the stress period. Similar results were found by [19]. These data contribute to the affirmation that the short internodes were caused by early leaf senescence in the irrigation with fixed intervals.
Stalk leaf area (SLA) and leaf area index (LAI) exhibited similar trends, peaking at 270 DAC before declining (Figure 4B,C). Reductions in leaf area were attributed to sugarcane flowering and the implementation of a drying-off period prior to harvest. The SLA started with around 1000 cm2 for both treatments with a pick at 270 DAC, with 4543 and 4251 cm2 for ISw and IFI, respectively. It finished at 340 DAC with only a 4.6% difference. LAI, with the same tendency as ISw and IFI, has the lowest values at 60 DAC, 1.16 and 1.18, and the highest at 210 DAC with 4.36 and 4.37, respectively. For those treatments, the most significant differences happened during the 90 and 150 days after planting. The relative variation in IFI over ISw at 90 and 150 DAC was for SLA −37.4 and −14.1%, respectively, and for LAI at the same time interval −56.3 and −20.0%. Since LAI is a relation between NGL and SLA, and NGL presents smaller differences between the treatments, the variation in SLA according to the irrigation schedule was influenced by the increase or decrease in blade leaf area.
Water deficit effects on morphological traits were also reported by [39] in Jamaica, where water deficit was linearly associated with leaf elongation reductions. Drought-induced declines in turgor pressure and water flow from the xylem disrupt elongation processes, which aligns with the reduction in specific leaf area (SLA) observed in IFI [27].
After 210 DAC, SLA and LAI declined sharply in both treatments. This was likely due to sugarcane flowering and drying off. The CP72-2086 variety, widely grown in Nicaragua and Central America, is prone to flowering [40]. The flag leaf emerged around 230–240 DAC, with flowering occurring at approximately 270 DAC. At this stage, vegetative growth ceased [41].
The last rainfall (20 mm) occurred on 20 November 2021, and harvest was on 13 January 2022, 54 days later. No irrigation was applied during this period, contributing to the decline in leaf parameters. Suppressing irrigation before harvest, known as “drying off” [10,42], is a common practice in sugarcane to reduce soil moisture, facilitate machine harvesting, and enhance sucrose content. This aligns with [43], who reported rapid leaf senescence and reductions in SLA and LAI due to drying off.
The leaf area ratio (LAR) initially favored ISw. However, differences narrowed over time as IFI plants recovered through compensatory growth mechanisms, illustrating sugarcane’s ability to adapt and resume growth when conditions improve. This parameter expresses the leaf area useful for photosynthesis. It is a morphophysiological component, as it is the ratio between the leaf area (the area responsible for the absorption of light and CO2) and the total dry mass (the result of net photosynthesis).
All the growth variables showed the recovery of IFI once the soil moisture content increased. The explanation for this recovery leans on the compensatory growth phenomenon. The compensatory ability or “physiologic compensatory continuum” is the plant’s ability to tide over much abiotic stress once this stress ends [34,37,38]. The morphological properties of sugarcane, such as vast tillering potential, innumerable root primordia, and different types of roots and leaves, allow the crop to offset the stress once it finishes [34]. Many authors have studied this mechanism underlying crops during post-drought rewatering in cotton, wheat, maize, grasses, and sugarcane. Various factors, including photosynthetic rate, stomatal conductance, fertilizer use, and anti-aging properties, have played a role [34,44,45].

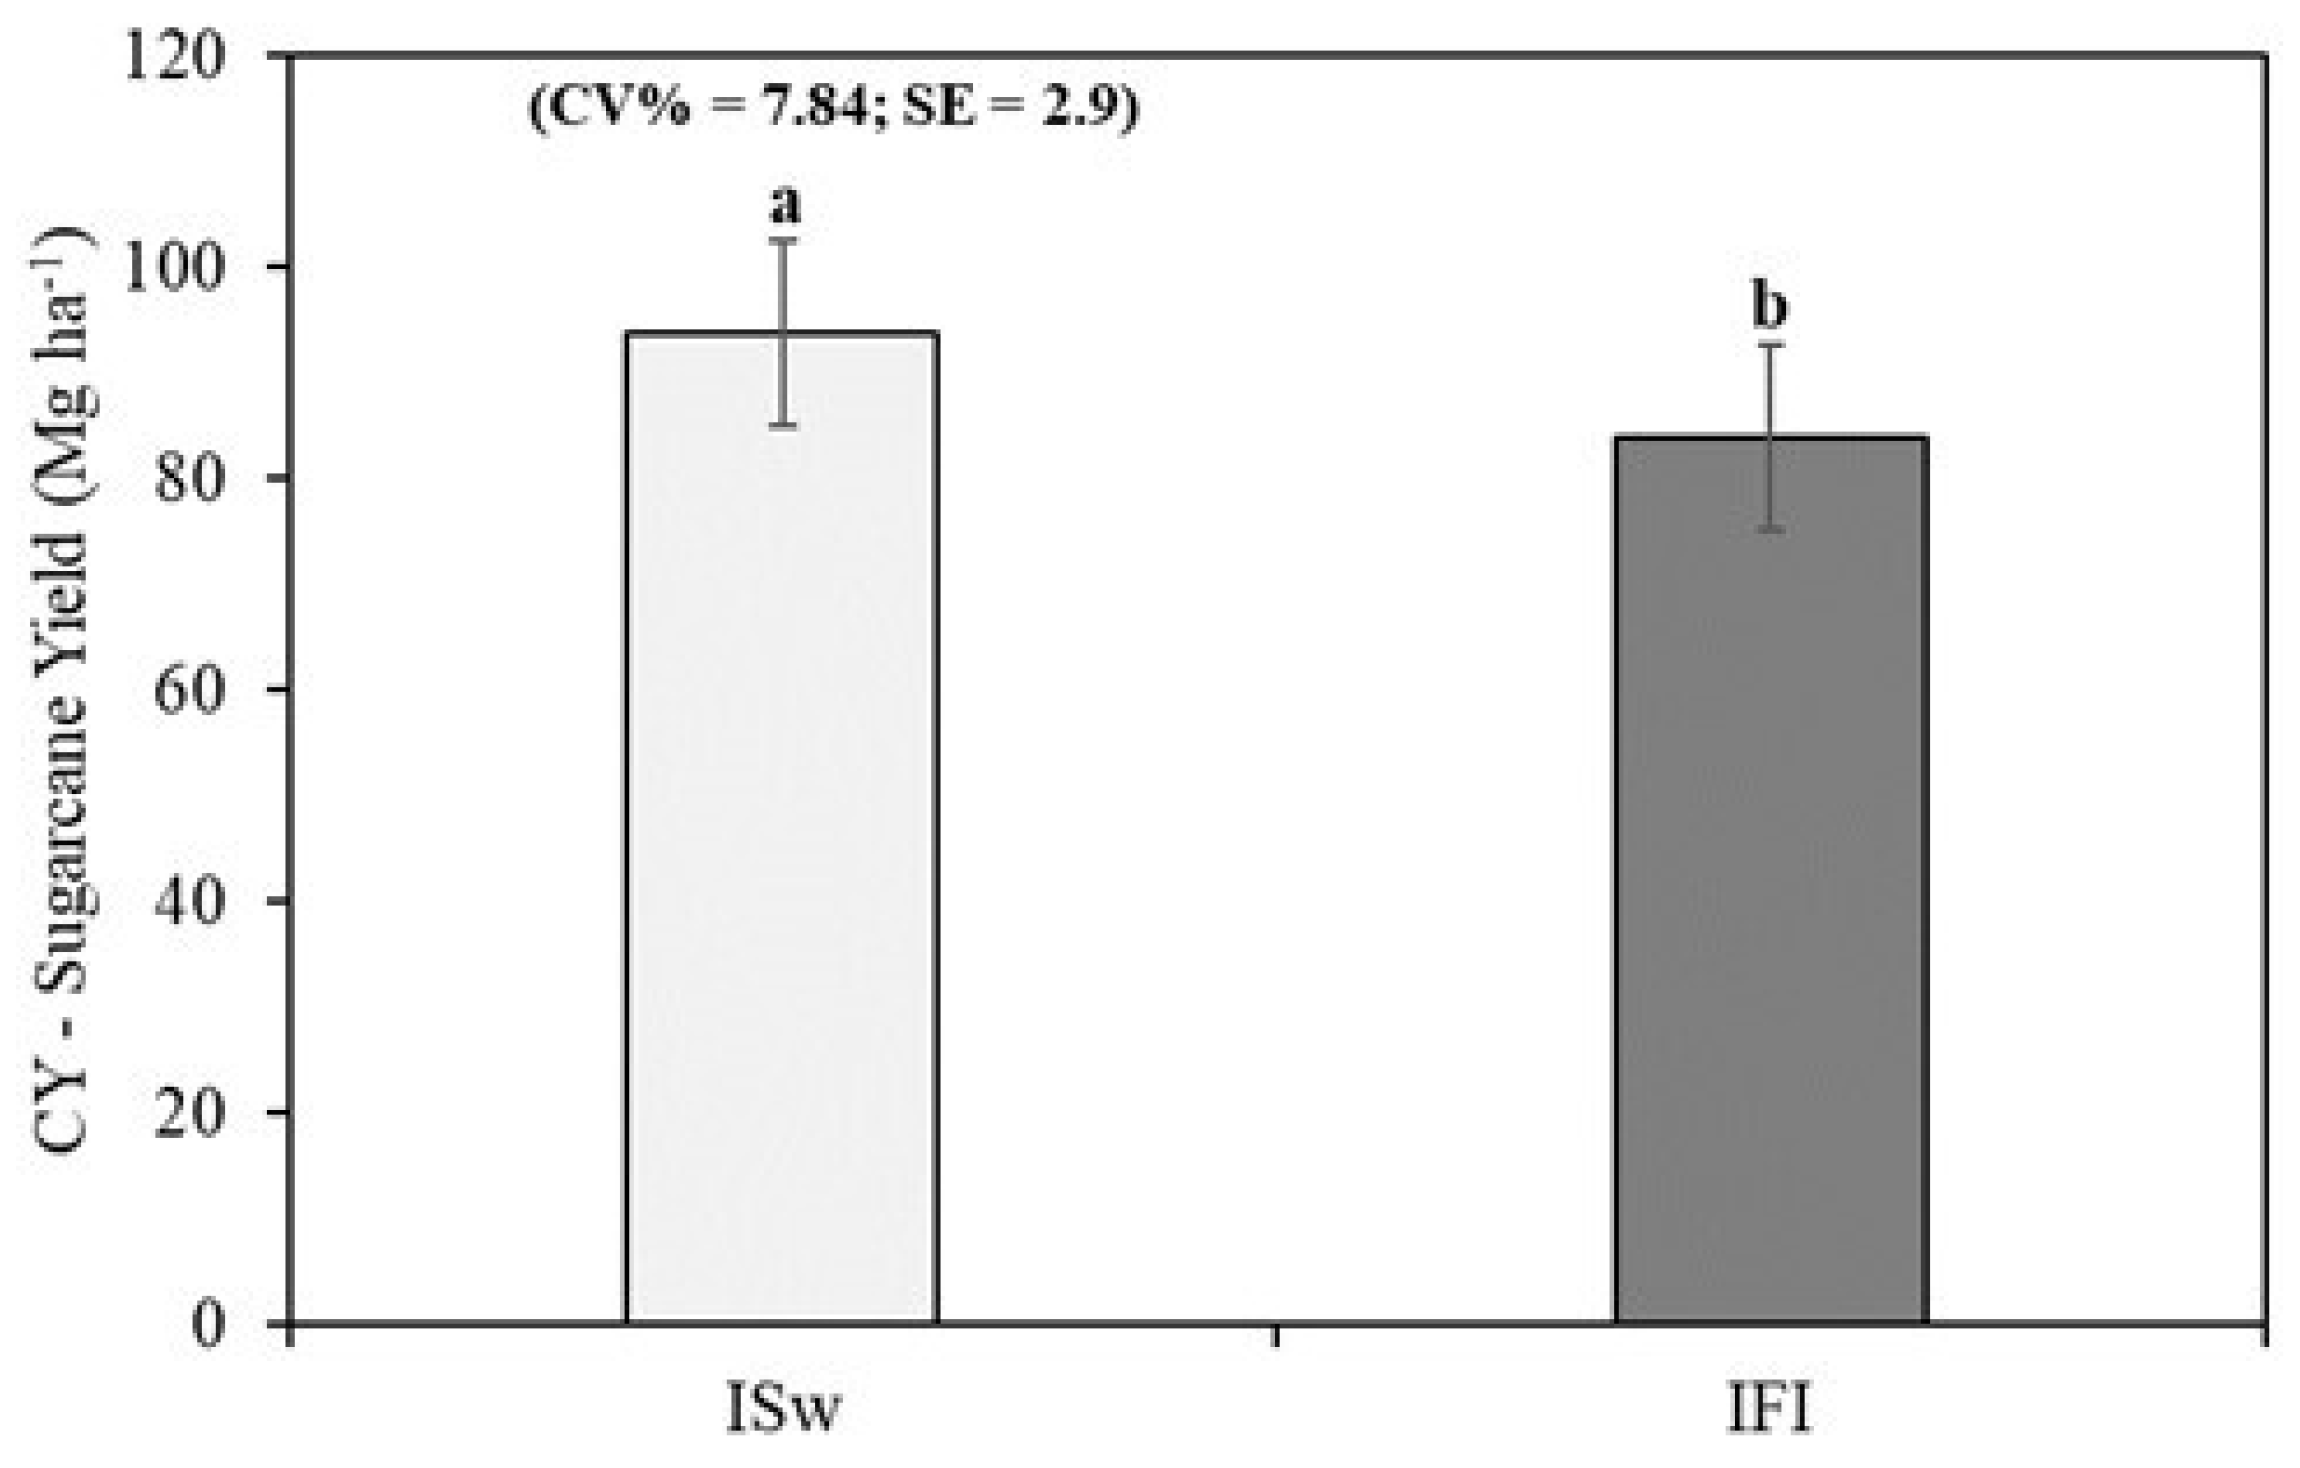
3.4. Sugarcane Yield Under Different Irrigation Management Strategies

At harvest, sugarcane yields were significantly higher in the ISw plots (93.9 Mg ha−1) compared to IFI (83.8 Mg ha−1) (Figure 5). This confirms that irrigation based on soil moisture content enhances productivity. While the IFI plots recovered due to compensatory growth, yields remained lower. In years with reduced rainfall or more severe drought, the performance gap between ISw and IFI would likely increase.
The differences were not more considerable due to the time or the crop stage when the water-deficit stress happened in IFI in this study’s early stage. According to [19], the authors found similar results, where drought stress had a more deleterious effect than well-watered treatments when the deficit happened in the mid-season stages, not in the early stages. The same authors mentioned that the negative impact of water deficit stress is more severe when the leaf area index exceeds two.
The yield reached in ISw is slightly lower (−1.6%) than the national sugarcane yield in Nicaragua in 2020, which was 95.5 Mg ha−1 reached in 71,516 ha harvested. However, it was 8.7, 15.75, and 111.7% superior to the CASUR sugarcane mill, Central America, and Caribbean yields, respectively (Figure 6). This shows the potential of a good irrigation strategy to achieve a high yield and increase sugarcane crop production vertically.
Because the water deficit in IFI mainly occurred before 150 DAC, rainfall later enabled compensatory growth, minimizing differences between irrigation strategies. Compensatory growth in sugarcane following drought stress is well-documented [35,37,47].
Nevertheless, despite compensatory growth, IFI resulted in lower yields than ISw. In seasons with below-average rainfall, growth and yield differences could be even greater. Given the growing challenges of climate change, which may intensify droughts, storms, and heat stress, efficient irrigation strategies are increasingly vital. Managing irrigation based on soil moisture content can improve crop resilience and optimize yields, as demonstrated by ISw.

3.5. Water Use Efficiency for Sugarcane Under Different Irrigation Management Strategies

From the physiological approach, water use efficiency is the ratio of carbon assimilated as biomass or grain produced to water consumed by the crop [11,48]. The present study evaluated two variables of water efficiency. The first is the irrigation water use efficiency, which considers only the water from irrigation, and the second is the total water use efficiency, considering the total water applied to the crop, water from irrigation, and rainfall.
Irrigation water use efficiency (IWUE) was higher in IFI (0.151 Mg ha−1 mm−1) than in ISw (0.133 Mg ha−1 mm−1), likely due to the plant’s compensatory growth after drought periods (Table 4). However, total water use efficiency (TWUE) was similar between the treatments, as rainfall was the dominant water source later in the crop cycle. The highest IWUE on IFI may be explained by the fact that the plants subject to water stress tried to maximize the use of the available water as much as possible by increasing their rate of growth in response to the improvement of the environment after drought stress, which is a result of the compensatory growth.
The values for IWUE and TWUE found in this study for the irrigation treatments were lower than those reported by [7], who reported for IWUE and TUWE at −15 kPa, −45 kPa, and −75 kPa as soil tension (0.393, 0.365, and 0.405 Mg ha−1 mm−1) and (0.0753, 0.0713, and 0.0569 Mg ha−1 mm−1), respectively.
The relatively low IWUE values for both treatments were influenced by the use of furrow irrigation, which is less efficient than drip or sprinkler systems. Improved irrigation technologies could further enhance WUE and crop performance. Therefore, the lowest irrigation efficiency results in more water consumption [49,50]. Several authors have demonstrated the lowest water use efficiency, comparing surface irrigation to drip or sprinkler irrigation in many crops as with sugarcane [51], cotton [23], and maize [52]. Furthermore, in a year with less rainfall, or irregular rainfall, irrigation would become even more important, which could generate different results regarding IWUE.
Future studies may contribute to the sugarcane production chain in Nicaragua. The integration of ISw irrigation strategies with advanced deep learning models can make decision making more assertive regarding irrigation management. The use of models such as Long Short-Term Memory Networks, Transformers, or Convolutional Neural Networks could be employed to predict crop water requirements, evapotranspiration, and optimal irrigation timing by leveraging high-resolution sensor data (e.g., soil moisture, NDVI, and climate parameters). This would enable a transition toward data-driven, intelligent irrigation systems in resource-constrained settings [53,54]. Also, new studies under varying climatic and soil conditions may be important in order to explore optimal irrigation strategies across different environments.

4. Conclusions

Irrigation management based on soil moisture content is a promising alternative for sugarcane producers in Nicaragua, particularly in regions with limited access to evapotranspiration and crop coefficient data. Plants exposed to water deficit stress during early growth stages demonstrated compensatory growth. The growth variables on the temporal analysis confirmed this physiologic behavior. Irrigation management based on soil moisture content was better than the local practice (irrigation with a fixed interval—30 days) in sugarcane yield. The superior performance of the ISw treatments in terms of yield, plant height, and leaf area highlights the benefits of moisture-based irrigation strategies. While water use efficiency was similar between the treatments, adopting more efficient irrigation systems could further improve productivity and sustainability in sugarcane farming.

Author Contributions

Conceptualization, F.S., A.V.D., C.A.O. and M.D.V.S.; data curation, R.M.P. and F.S.; formal analysis, R.M.P. and C.A.O.; funding acquisition, R.M.P. and F.S.; project administration, R.M.P.; writing—original draft, R.M.P.; writing—review and editing, F.S., B.C., B.O.C. and A.V.D. All authors have read and agreed to the published version of the manuscript.

Funding

This research received no external funding.

Data Availability Statement

The data presented in this study are available upon request from the corresponding author.

Conflicts of Interest

The authors declare no conflicts of interest.

References

  1. CNPA. Comité Nacional de Productores de Azúcar—Nicaragua. Importancia Económica la caña Azúcar en Nicaragua. 2022. Available online: https://www.mag.gob.ni/index.php/brochures-tecnicos/brochures-tenicos-agricolas (accessed on 21 January 2024).
  2. Méndez, E.Z.; Zegarra, O.C. Diagnóstico Sobre la Situación y Potencial del Sector Riego en Nicaragua; Nota Técnica del BID (1063); Banco Interamericano de Desarrollo: Washington, DC, USA, 2016. [Google Scholar]
  3. Oliveira, L.A.; Miranda, J.H.; Cooke, R.A.C. Water management for sugarcane and corn under future climate scenarios in Brazil. Agric. Water Manag. 2018, 201, 199–206. [Google Scholar] [CrossRef]
  4. Dingre, S.K.; Gorantiwar, S.D. Determination of the water requirement and crop coefficient values of sugarcane by field water balance method in semiarid region. Agric. Water Manag. 2020, 232, 106042. [Google Scholar] [CrossRef]
  5. Marin, F.R.; Inman-Bamber, G.; Silva, T.G.F.; Vianna, M.S.; Nassif, D.S.P.; Carvalho, K.S. Sugarcane evapotranspiration and irrigation requirements in tropical climates. Theor. Appl. Climatol. 2020, 140, 1349–1357. [Google Scholar] [CrossRef]
  6. Pereira, R.M.; Schwerz, F.; Diotto, A.V.; Sandoval, M.D.V.; Aguirre, M.J.A. Water requirement and crop coefficient of sugarcane cultivated in Nicaragua. J. Crop Sci. Biotechnol. 2024, 27, 79–89. [Google Scholar] [CrossRef]
  7. Alamilla-Magaña, J.C.; Carrillo-Ávila, E.; Obrador-Olán, J.J.; Landeros-Sánchez, C.; Vera-Lopez, J.; Juárez-López, J.F. Soil moisture tension effect on sugar cane growth and yield. Agric. Water Manag. 2016, 177, 264–273. [Google Scholar] [CrossRef]
  8. Silva, V.D.P.; Silva, B.B.; Albuquerque, W.G.; Borges, C.J.; Sousa, I.F.; Neto, J.D. Crop coefficient, water requirements, yield and water use efficiency of sugarcane growth in Brazil. Agric. Water Manag. 2013, 128, 102–109. [Google Scholar] [CrossRef]
  9. Oliveira, F.M.; Aspiazú, I.; Kondo, M.K.; Borges, I.D.; Pegoraro, R.F.; Vianna, E.J. Crescimento e produção de variedades de cana-de-açúcar influenciadas por diferentes adubações e supressões de irrigação. Rev. Trop. Ciênc. Agrár. Biol. 2011, 5, 56. [Google Scholar]
  10. Inman-Bamber, N.G.; Smith, D.M. Water relations in sugarcane and response to water deficits. Field Crops Res. 2005, 92, 185–202. [Google Scholar] [CrossRef]
  11. Singels, A.; Jarmain, C.; Bastidas-Obando, E.; Olivier, F.C.; Paraskevopoulos, A.L. Monitoring water use efficiency of irrigated sugarcane production in Mpumalanga, South Africa, using SEBAL. Water SA 2018, 44, 636–646. [Google Scholar] [CrossRef]
  12. Bhoj, R.L.; Singh, P.K. Agronomical researches on sugarcane in U.P.—A review. Sugar. Res. Dev. 1960, 6, 60–64. [Google Scholar]
  13. Gunasena, H.P.M. Field Crop Production; Lake House Investments: Colombo, Sri Lanka, 1974; 354p. [Google Scholar]
  14. Singh, G.J.D.P.; Sareon, K. Economic use of water with nitrogen fertilization and assessment of suitable indices for scheduling irrigation in sugarcane. Indian Sugar 1976, 25, 417–422. [Google Scholar]
  15. Bose, P.K.; Thakur, K. Critical time and irrigation and nitrogen fertilization under water deficit conditions—Review of work done at Sugarcane. Indian Sugar 1977, 26, 809–812. [Google Scholar]
  16. Chichaibelu, B.B.; Bekchanov, M.; Von Braun, J.; Torero, M. The global cost of reaching a world without hunger: Investment costs and policy action opportunities. Food Policy 2021, 104, 102151. [Google Scholar] [CrossRef]
  17. Dowgert, M.F. The impact of irrigated agriculture on a stable food supply. In Proceedings of the 22nd Annual Central Plains Irrigation Conference, Colby, KS, USA, 21–22 January 2010; pp. 1–11. [Google Scholar]
  18. Adu, M.O.; Yawson, D.O.; Armah, F.A.; Asare, P.A.; Frimpong, K.A. Meta-analysis of crop yields of full, deficit, and partial root-zone drying irrigation. Agric. Water Manag. 2018, 197, 79–90. [Google Scholar] [CrossRef]
  19. Robertson, M.J.; Inman-Bamber, N.G.; Muchow, R.C.; Wood, A.W. Physiology and productivity of sugarcane with early and mid-season water deficit. Field Crops Res. 1999, 64, 211–227. [Google Scholar] [CrossRef]
  20. Silva, T.G.F.; Moura, M.S.B.; Zolnier, S.; Do, J.F.A.; Carmo Souza, L.S.B. Biometria da parte aérea da cana soca irrigada no Submédio do Vale do São Francisco. Rev. Cienc. Agron. 2012, 43, 500–509. [Google Scholar] [CrossRef]
  21. Ecco, M.; Santiago, E.F.; Lima, P.R. Respostas biométricas em plantas jovens de cana-de-açúcar submetidas ao estresse hídrico e ao alumínio. Comun. Sci. 2014, 5, 59–67. [Google Scholar]
  22. Misra, V.; Solomon, S.; Mall, A.K.; Prajapati, C.P.; Hashem, A.; Abd Allah, E.F.; Ansari, M.I. Morphological assessment of water stressed sugarcane: A comparison of waterlogged and drought affected crop. Saudi J. Biol. Sci. 2020, 27, 1228–1236. [Google Scholar] [CrossRef]
  23. Ibragimov, N.; Evett, S.R.; Esanbekov, Y.; Kamilov, B.S.; Mirzaev, L.; Lamers, J.P. Water use efficiency of irrigated cotton in Uzbekistan under drip and furrow irrigation. Agric. Water Manag. 2007, 90, 112–120. [Google Scholar] [CrossRef]
  24. Lu, J.; Ookawa, T.; Hirasawa, T. The effects of irrigation regimes on the water use, dry matter production and physiological responses of paddy rice. Plant Soil 2000, 223, 207–216. [Google Scholar] [CrossRef]
  25. Coulombe, C.E.; Wilding, L.P.; Dixon, J.B. Overview of vertisols: Characteristics and impacts on society. Adv. Agron. 1996, 57, 289–375. [Google Scholar]
  26. Fernandez-Gomez, R.; Mateos, L.; Giráldez, J.V. Furrow irrigation erosion and management. Irrig. Sci. 2004, 23, 123–131. [Google Scholar] [CrossRef]
  27. Dinh, H.T.; Watanable, K.; Takaragawa, H.; Kawamitsu, Y. Effects of Drought Stress at Early Growth Stage on Response of Sugarcane to Different Nitrogen Application. Sugar Tech 2018, 20, 420–430. [Google Scholar] [CrossRef]
  28. Cesnik, R.; Miocque, J. Melhoramento da Cana-de-Açúcar; Embrapa: Brazilia, Brazil, 2014; 25p. [Google Scholar]
  29. Silva, M.D.A.; Alberto, J.; Enciso, J.; Sharma, V.; Jifon, J. Yield components as indicators of drought tolerance of sugarcane. Sci. Agricola 2008, 65, 620–627. [Google Scholar] [CrossRef]
  30. OECD. Safety Assessment of Transgenic Organisms in the Environment: OECD Consensus Documents—Sugarcane; OECD: Paris, France, 2016; 303p. [Google Scholar]
  31. Smit, M.A.; Singels, A. The response of sugarcane canopy development to water stress. Field Crops Res. 2006, 98, 91–97. [Google Scholar] [CrossRef]
  32. Landell, M.G.A.; Silva, M.A. As estratégias de seleção da cana em desenvolvimento no Brasil. Visão Agrícola 2004, 1, 18–23. [Google Scholar]
  33. Vasantha, S.; Shekinah, D.E.; Gupta, C.; Rakkiyappan, P. Tiller Production, Regulation and Senescence in Sugarcane (Saccharum species hybrid) Genotypes. Sugar Tech 2012, 14, 156–160. [Google Scholar] [CrossRef]
  34. Shrivastava, A.K.; Solomon, S.; Rai, R.K.; Singh, P.; Chandra, A.; Jain, R.; Shukla, S.P. Physiological Interventions for Enhancing Sugarcane and Sugar Productivity. Sugar Tech 2014, 17, 215–226. [Google Scholar] [CrossRef]
  35. Zhao, D.; Glaz, B.; Comstock, J.C. Sugarcane response to water-deficit stress during early growth on organic and sand soils. Am. J. Agric. Biol. Sci. 2010, 5, 403–414. [Google Scholar] [CrossRef]
  36. Albuquerque, W.G. Consumo Hídrico e Coeficiente de Cultivo Dual da Cana-de-Açúcar Cultivada sob Diferentes Lâminas de Irrigação. PhD Thesis, Universidade Federal de Campina Grande, Campina Grande, Brazil, 2012; p. 90. [Google Scholar]
  37. Santos, L.C.; Coelho, R.D.; Barbosa, F.S.; Leal, D.P.V.; Fraga, E.F.; Barros, T.H.S.; Lizcano, J.V.; Ribeiro, N.L. Influence of deficit irrigation on accumulation and partitioning of sugarcane biomass under drip irrigation in commercial varieties. Agric. Water Manag. 2019, 221, 322–333. [Google Scholar] [CrossRef]
  38. Carr, B.M.K.V.; Knox, J.W. The water relations and irrigation requirements of sugar cane (Sccharum officinarum): A Review. Exp. Agric. 2011, 47, 1–25. [Google Scholar] [CrossRef]
  39. Cowan, I.R.; Innes, R.F. Meteorology, evaporation and the water requirements of sugar cane. Proc. Int. Soc. Sugarcane Technol. 1956, 9, 215–232. [Google Scholar]
  40. Oñate, C.A.; Pereira, R.M.; Rebolledo, J.P.; Pantoja, J.E. Inhibidor de Floración (Etephon) Aplicado en Diferentes Rango de Edad en la Variedad CP72-2086 en Casur, Nicaragua—America Central; Tecnicaña: Cali, Colombia, 2017; pp. 1–10. [Google Scholar]
  41. Araldi, R.; Silva, F.M.L.; Ono, E.O.; Rodrigues, J.D. Florescimento em cana-de-açúcar. Ciênc. Rural 2010, 40, 694–702. [Google Scholar] [CrossRef]
  42. Araújo, R.; Junior, J.A.; Casaroli, D.; Wagner, A.; Evangelista, P. Variation in the sugar yield in response to drying-off of sugarcane before harvest and the occurrence of low air temperatures. Bragantia 2016, 75, 118–127. [Google Scholar] [CrossRef]
  43. Inman-Bamber, N.G. Sugarcane water stress criteria for irrigation and drying off. Field Crops Res. 2004, 89, 107–122. [Google Scholar] [CrossRef]
  44. Luo, H.H.; Zhang, Y.L.; Zhang, W.F. Effects of water stress and rewatering on photosynthesis, root activity, and yield of cotton with drip irrigation under mulch. Photosynthetica 2016, 54, 65–73. [Google Scholar] [CrossRef]
  45. Wang, X.L.; Qin, R.R.; Sun, R.H.; Wang, J.J.; Hou, X.G.; Qi, L.; Qin, D.H. No post-drought compensatory growth of corns with root cutting based on cytokinin induced by roots. Agric. Water Manag. 2018, 205, 9–20. [Google Scholar] [CrossRef]
  46. FAO. FAO Stat Database. FaoStat. Licens. CC BY-NC-SA 3.0 IGO. 2022. Available online: https://www.fao.org/faostat/en/#data/QCL (accessed on 26 May 2023).
  47. Rossler, R.L.; Singels, A.; Olivier, F.C.; Steyn, J.M. Growth and yield of a sugarcane plant crop under water stress imposed through deficit drip irrigation. Proc. S. Afr. Sugarcane Technol. Assoc. 2013, 86, 170–183. [Google Scholar]
  48. Hatfield, J.L.; Dold, C.; States, U. Water-Use Efficiency: Advances and Challenges in a Changing Climate. Front. Plant Sci. 2019, 10, 103. [Google Scholar] [CrossRef]
  49. Eldeiry, A.A.; Garcia, L.A.; El-Zaher, A.S.A.; Kiwan, M.E. Furrow Irrigation system design for clay soil in arid regions. Appl. Eng. Agric. 2005, 21, 411–420. [Google Scholar] [CrossRef]
  50. Menezes, S.M.; Da Silva, G.F.; Da Silva, M.M.; De Oliveira Filho, R.A.; Jardim, A.M.D.R.F.; Silva, J.R.I.; Dos Santos, M.A.L. Pulse Drip Irrigation Improves Yield, Physiological Responses, and Water-Use Efficiency of Sugarcane. Water Conserv. Sci. Eng. 2024, 9, 25. [Google Scholar] [CrossRef]
  51. Ramesh, P.; Kailasam, C.; Srinivasan, T.R. Performance of Sugarcane (Saccharum officinarum L.) Under Surface Drip, Sub Surface Drip (Biwall) and Furrow Methods of Irrigation. J. Agron. Crop Sci. 1994, 172, 237–241. [Google Scholar] [CrossRef]
  52. El-Halim, A.A. Impact of alternate furrow irrigation with different irrigation intervals on yield, water use efficiency, and economic return of corn. Chil. J. Agric. Res. 2013, 73, 175–180. [Google Scholar] [CrossRef]
  53. Chai, J.; Zeng, H.; Li, A.; Ngai, E.W. Deep learning in computer vision: A critical review of emerging techniques and application scenarios. Mach. Learn. Appl. 2021, 6, 100134. [Google Scholar] [CrossRef]
  54. Wang, R.F.; Su, W.H. The application of deep learning in the whole potato production Chain: A Comprehensive review. Agriculture 2024, 14, 1225. [Google Scholar] [CrossRef]
Figure 1. Soil moisture content for the layer (0–25 and 25–50 cm) for the irrigation management strategies IFI (A) and ISw (B) and rainfall (mm).
Agriengineering 07 00162 g001
Figure 2. Temporal evolution of growth variables for the irrigation with ISw—irrigation based on soil moisture and IFI—irrigation with fixed intervals.
Agriengineering 07 00162 g002
Figure 3. Harvest analysis (344 DAC) for the irrigation with ISw—irrigation based on soil moisture and IFI—irrigation with fixed intervals. Different letters show significance between the treatments at p < 0.05 by the Tukey test. CV%—coefficient of variation; SE—Standard Error.
Agriengineering 07 00162 g003
Figure 4. Temporal analysis of growth variables for the irrigation with ISw—irrigation based on soil moisture and IFI—irrigation with fixed intervals.
Agriengineering 07 00162 g004
Figure 5. Sugarcane yield (Mg ha−1) at 344 DAC for the irrigation management ISw—irrigation based on soil moisture and IFI—irrigation with fixed intervals. Different letters show significance between the treatments at p < 0.05 by the Tukey test. CV%—coefficient of variation; SE—Standard Error.
Agriengineering 07 00162 g005
Figure 6. Average sugarcane yield (Mg ha−1) for both irrigation strategies compared with the Nicaragua national average, CASUR sugarcane mill, Central America and Caribbean for 2020. Source: * CNPA [1]. and ** FAO [46].
Agriengineering 07 00162 g006
Table 1. Experimental field physico-chemical characterization.
VariableUnit00–2525–50Average
Soil Layer Depth (cm)
Chemical Characterization
Organic Matter%1.40.751.08
pH 7.307.407.35
Potassium 0.170.140.16
Calcium 19.315.9317.62
Magnesiumcmol kg−11.620.961.29
Sodium 6.58.647.57
CEC 27.5825.6626.62
Phosphorus 18.5323.5821.06
Sulfur 45.9146.4346.17
Iron 35.0734.0234.55
CupperPpm8.797.688.24
Zinc 0.50.30.40
Manganese 1.620.961.29
Boron 0.650.650.65
Physical Characterization
Clay%47.0053.0050.00
Loam37.1013.1025.10
Sand15.9033.9024.90
Bulk Densityg cm−31.471.441.46
Field Capacityg g−10.4640.4700.467
Wilting Point0.3250.3220.324
Porosity0.5800.6650.623
Table 2. Dates of irrigation events with their respective irrigation water regimes (WRs) and the total water applied from irrigation in each treatment during the crop cycle 2021/2022.
DateDACISwIFI
WR (mm)
12 February 202112117.0119.2
2 February 20212576.10.0
15 March 20214388.1116.7
7 April 20216684.70.0
14 April 20217361.6119.0
27 April 20218686.40.0
12 May 202110179.4117.0
26 May 202111556.70.0
4 June 20211240.084.5
25 June 202114557.20.0
Total Irrigation Water707.1556.4
Average of WR78.6111.3
Table 3. Rainfall, irrigation water applied, and total water (mm) in each crop stage period (DAC) in both treatments and their variation.
DACRainfallIWTWVar. (%)
ISwIFIISwIFI
0–6012.0281.1235.9293.1247.9−15.4
61–9024.0232.7119.0256.7143.0−44.3
91–150158.0193.3201.5351.3359.52.3
151–210331.00.00.0331.0331.00.0
211–270485.00.00.0485.0485.00.0
217–300201.00.00.0201.0201.00.0
301–3400.00.00.00.00.00.0
Total1211.0707.1556.41918.11767.4−7.9
ISw—irrigation based on soil moisture; IFI—irrigation with fixed intervals (30 days); Var. (%)—TW variation in IFI over ISw.
Table 4. Sugarcane yield and water relationship parameters under different irrigation schedule treatments.
TreatmentsCYIWRTWIWUETWUE
(Mg ha−1)(mm)(Mg ha−1 mm−1)
ISw93.87707.1212111918.120.1330.049
IFI83.84556.3712111767.370.1510.047
CY—cane yield; IW—irrigation water; R—rainfall; TW—total water (R + IW); IWUE—irrigation water use efficiency; TWUE—total irrigation water use efficiency. Only 3.2% was the difference between ISw over IFI in the TWUE. This result is directly influenced by the rainfall water, which reduced water consumption (TW—8.53%). The results of IWUE and TWUE showed that even with a rise in irrigation water from 27%, the gain of biomass compensated for this increase in water from irrigation, which led to a light difference between both treatments.
Disclaimer/Publisher’s Note: The statements, opinions and data contained in all publications are solely those of the individual author(s) and contributor(s) and not of MDPI and/or the editor(s). MDPI and/or the editor(s) disclaim responsibility for any injury to people or property resulting from any ideas, methods, instructions or products referred to in the content.

