Technical Note

Design and Initial Testing of Acoustically Stimulated Anaerobic Digestion Coupled with Effluent Aeration for Agricultural Wastewater Remediation

1
USDA-ARS-Food Animal Environmental Systems Research Unit, Bowling Green, KY 42104, USA
2
USDA-ARS-Coastal Plain Soil, Water and Plant Conservation Research, Florence, SC 29501, USA
*
Author to whom correspondence should be addressed.
AgriEngineering 2025, 7(5), 136; https://doi.org/10.3390/agriengineering7050136
Submission received: 18 March 2025 / Revised: 11 April 2025 / Accepted: 22 April 2025 / Published: 5 May 2025

Abstract

:
The construction of an anaerobic digester coupled with post-digestion low-level aeration for agricultural wastewater treatment is described. The digester employs underwater speakers to accelerate the anaerobic digestion process while retaining solids to reduce the strength of the effluent. The effluent is sent to a holding tank and fed at a low flow rate to an aeration tank to effect partial nitrification of the wastewater. The outlet of this tank is sent to a settling tank to retain biomass that developed in the aeration tank, and the effluent is sent to a small constructed wetland to further reduce wastewater nitrogen and phosphorus. The wetland was planted with the broadleaf cattail, Typha latifolia, and hence led to the formation of a retention basin. The system has reduced energy consumption due to the use of underwater sonic treatment and low-level aeration that is not designed to achieve full nitrification/denitrification but rather to achieve a mixture of ammonium, nitrite, and nitrate that might foster the development of a consortium of organisms (i.e., nitrifiers and Anammox bacteria) that can remediate wastewater ammonium at low cost. The system is meant to serve as a complex where various technologies and practices can be evaluated to improve the treatment of agricultural wastewater. Preliminary data from the system are presented.

1. Introduction

Inadequate treatment of animal wastes is a global problem, leading to air pollution, eutrophication of natural water bodies, the spread of antibiotic-resistant bacteria, and significant releases of the greenhouse gases (GHGs) carbon dioxide, methane, and nitrous oxide [1]. Although much large-scale animal production occurs in developed countries, there is little legislation that addresses pollution from animal rearing facilities [2].
In the United States, the most common waste management practice is to store wastewater in facultative aerobic lagoons and then apply the treated wastewater to land during seasons where the nutrients, particularly phosphorus and nitrogen, can be utilized by crops [3]. Lagoons emit considerable amounts of greenhouse gases, ammonia, and malodors. For instance, in simulated animal waste lagoons under summer conditions, Hamilton et al. estimated that CH4 emissions could range from 200 to 300 kg ha−1 d−1 and CO2 emissions could range from 380 to 580 kg ha−1 d−1. This represented approximately 65% of the carbon loading into the simulated lagoons [4].
Sulfur in the form of hydrogen sulfide and organic sulfides contribute to malodor but can also react in the atmosphere to produce sulfate particulate species [5,6]. Other compounds from lagoon emissions that are reactive include nitrogen species such as ammonia, amines [7], and heterocyclic compounds [8]. Furthermore, the effluent usually contains pathogens, excess plant nutrients, and untreated biological waste, which leads to contamination of ground and surface waters. While facultative lagoons have the advantage of being relatively inexpensive, more effective means of treating animal waste are needed.
Of all the technologies available to treat animal wastes, anaerobic digestion has the oldest provenance, with its earliest known use occurring at least 30 centuries ago [9]. Despite this, the use of anaerobic digesters has not achieved widespread adoption. Reasons for this include the relatively low quality of biogas, which contains considerable moisture, carbon dioxide, and hydrogen sulfide. Their removal requires the use of technologies such as sorbents and chemicals such as iron and alkalis [10], which may entail considerable capital and operational costs [11].
In addition to this, anaerobic digesters normally require mixing systems, which can be costly to install and maintain. Although complete mix digesters are more expensive to maintain and operate than non-mixed systems, they achieve greater returns on larger systems [12]. Still, mixing systems are expensive to install and operate, and it has been estimated that 29–54% of the power needs of a biogas plant can be ascribed to mixing equipment [13,14]. Adequate mixing, however, is often hard to achieve, which may lead to the accumulation of solids and/or crusting and potentially lead to digester failure [13,15]. In addition to mixing systems, other means of accelerating the digestion process include heating systems, which can incur considerable capital and operational costs [16], and pretreatment by chemical means such as by using alkalis, acids, or enzymatic treatments to disrupt the sludge [17,18]. Mechanical pretreatment has also been employed to hasten anaerobic digestion by using ultrasonic transducers to disrupt the sludge and facilitate microbial colonization [19,20].
As an alternative to ultrasonic pretreatment of sludge, we have used sound at sonic frequencies (<20 kHz) as a continuous treatment for anaerobic digesters. We have realized increases in biogas production of up to 100% as compared to an untreated digester [21]. Despite treating the digesters with a continuous 2 h-on, 1 hr off cycle of sound as opposed to an ultrasonic pretreatment, energy consumption was considerably lower than that of a typical ultrasonic transducer. In Loughrin et al. [21], we noted that the stereos operated at one-half volume consumed approximately 1150 kcal day−1, much below the energy costs required to perform ultrasonification or heat the digesters to mesophilic temperatures.
Other possible problems associated with anaerobic digesters are plant nutrients in the discharged wastewater [22]. The effluent from anaerobic digesters typically has a nitrogen-to-phosphorus ratio differing from that of crop requirements [23]; the effluent would ideally be chemically supplemented to meet plant nutrient requirements. Research is lacking on the technologies for the removal of ammonia and phosphate from digester effluent, although using algae to accomplish this shows promise [24,25].
Another concern is the emission of greenhouse gases (GHGs) from anaerobic digesters, although it seems intuitive that anaerobic digesters would have less GHG emissions than more conventional means of manure handling. Indeed, Miranda et al., in a meta-analysis of anaerobic digestion, found lower emissions of GHGs in manure storage and field applications as well as GHG reductions due to offsets for fertilizer application and energy production [26].
In addition to utilizing methane for energy production, anaerobic digestion offers the opportunity of capturing carbon dioxide in a concentrated form and at low temperatures. Whereas atmospheric CO2 occurs at about 412 ppm in the present day [27], its concentration in biogas typically ranges from 30 to 60% [28,29].
Hydrogen sulfide in biogas occurs at concentrations normally ranging from 50 to 5000 ppm but has been measured as high as 20,000 ppm [29]. As a corrosive, as well as due to its toxicity, it should be removed from biogas prior to its combustion [30]. Furthermore, if it is not, it is rapidly converted to sulfur dioxide in the atmosphere and hence to sulfate whether or not it is combusted and can participate in the formation of harmful particulate matter and acid rain [31].
Ammonia emissions from animal rearing facilities also contribute to the formation of fine particulates in the atmosphere and the acidification of surface waters [32]. This, coupled with its potential to contaminate ground and surface waters from land application of agricultural wastewater, makes its management critical [33].
This paper describes an anaerobic digestion system coupled with post-digestion wastewater treatment. It employs sound to accelerate the speed of anaerobic digestion and as a substitute for mechanical mixing, reducing the concentration of solids in the digester effluent. The effluent then undergoes low-level aeration to achieve partial nitrification to aid in ammonia removal and is discharged to a small constructed wetland. The discharge from the wetland is to a lagoon, which serves as a reservoir for process water for the digester.
The coupled digester and wastewater treatment system will be used as a means of evaluating practices and technologies that can produce biogas in a cost-effective manner and produce water that is of sufficient quality to recycle back to the anaerobic digesters. This study describes the system and presents preliminary data collection. Data from this system will be used in designing systems to improve nutrient recovery from the effluent, improve biogas quality, and identify points in the system where the escape of GHGs occurs. As a large pilot-scale anaerobic digestion system/wastewater treatment plant, it represents a unique opportunity to develop and test strategies for improving the anaerobic digestion process and agricultural wastewater treatment.

2. Materials and Methods

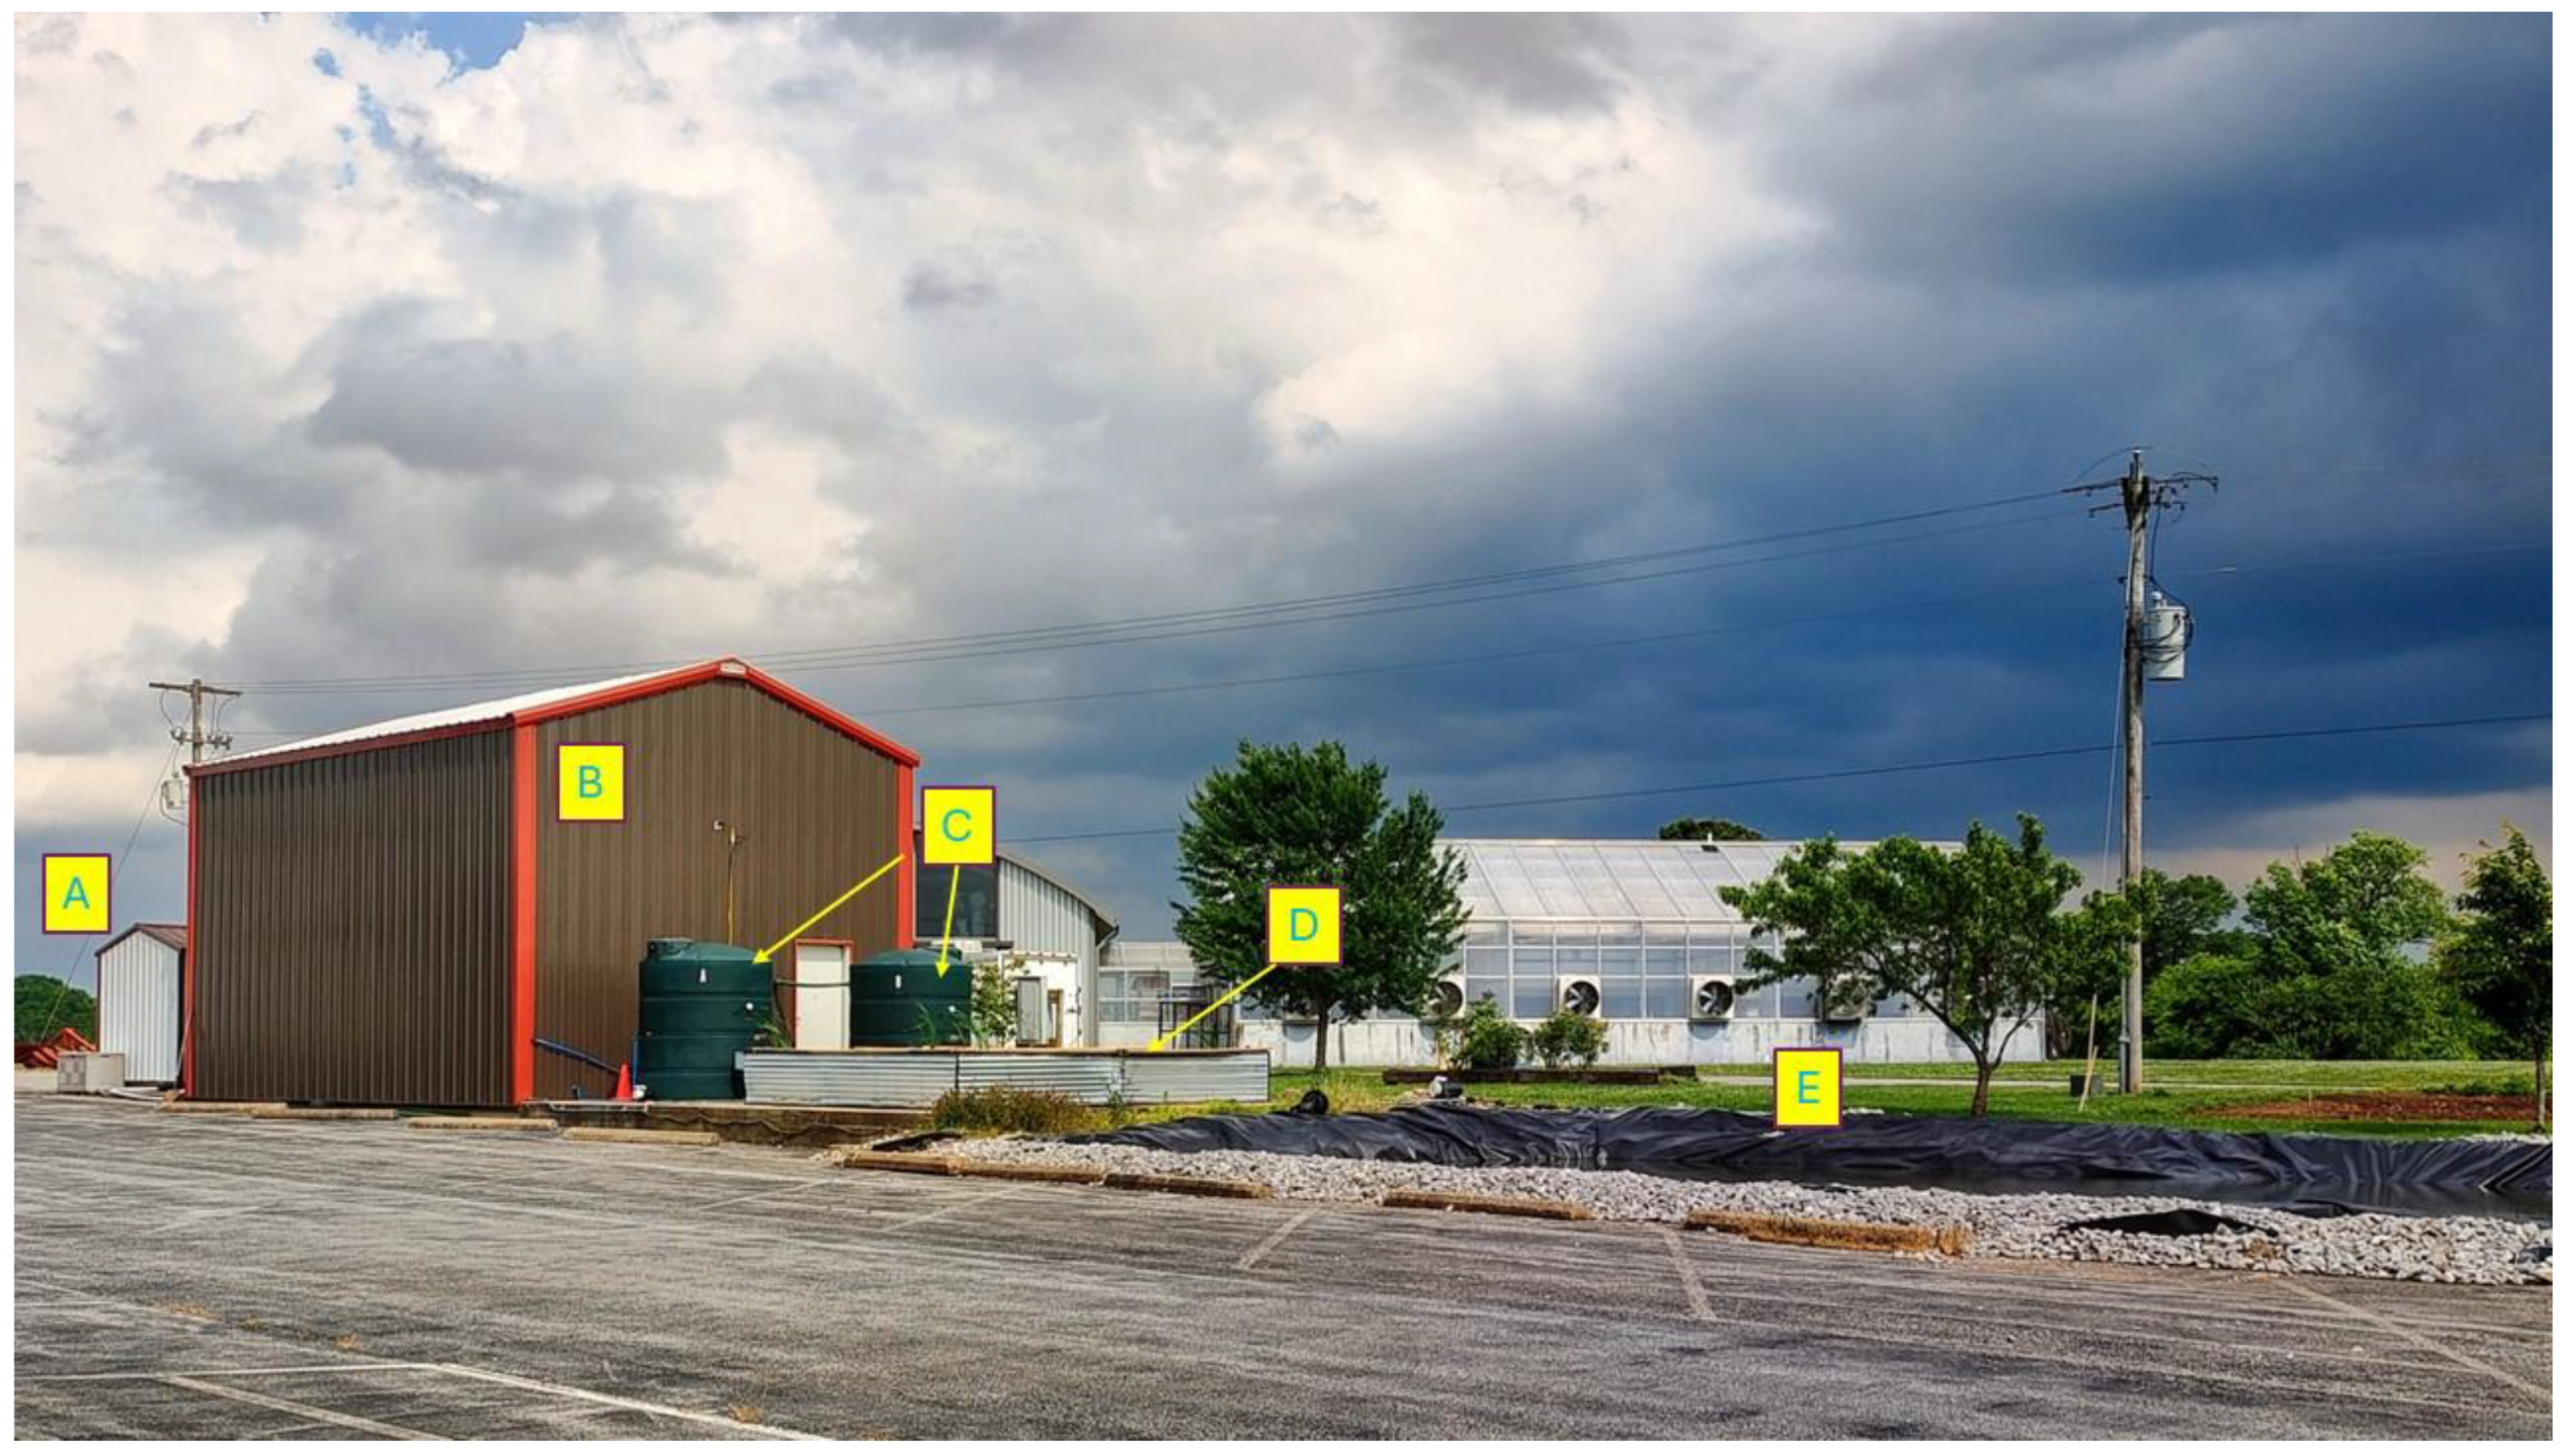
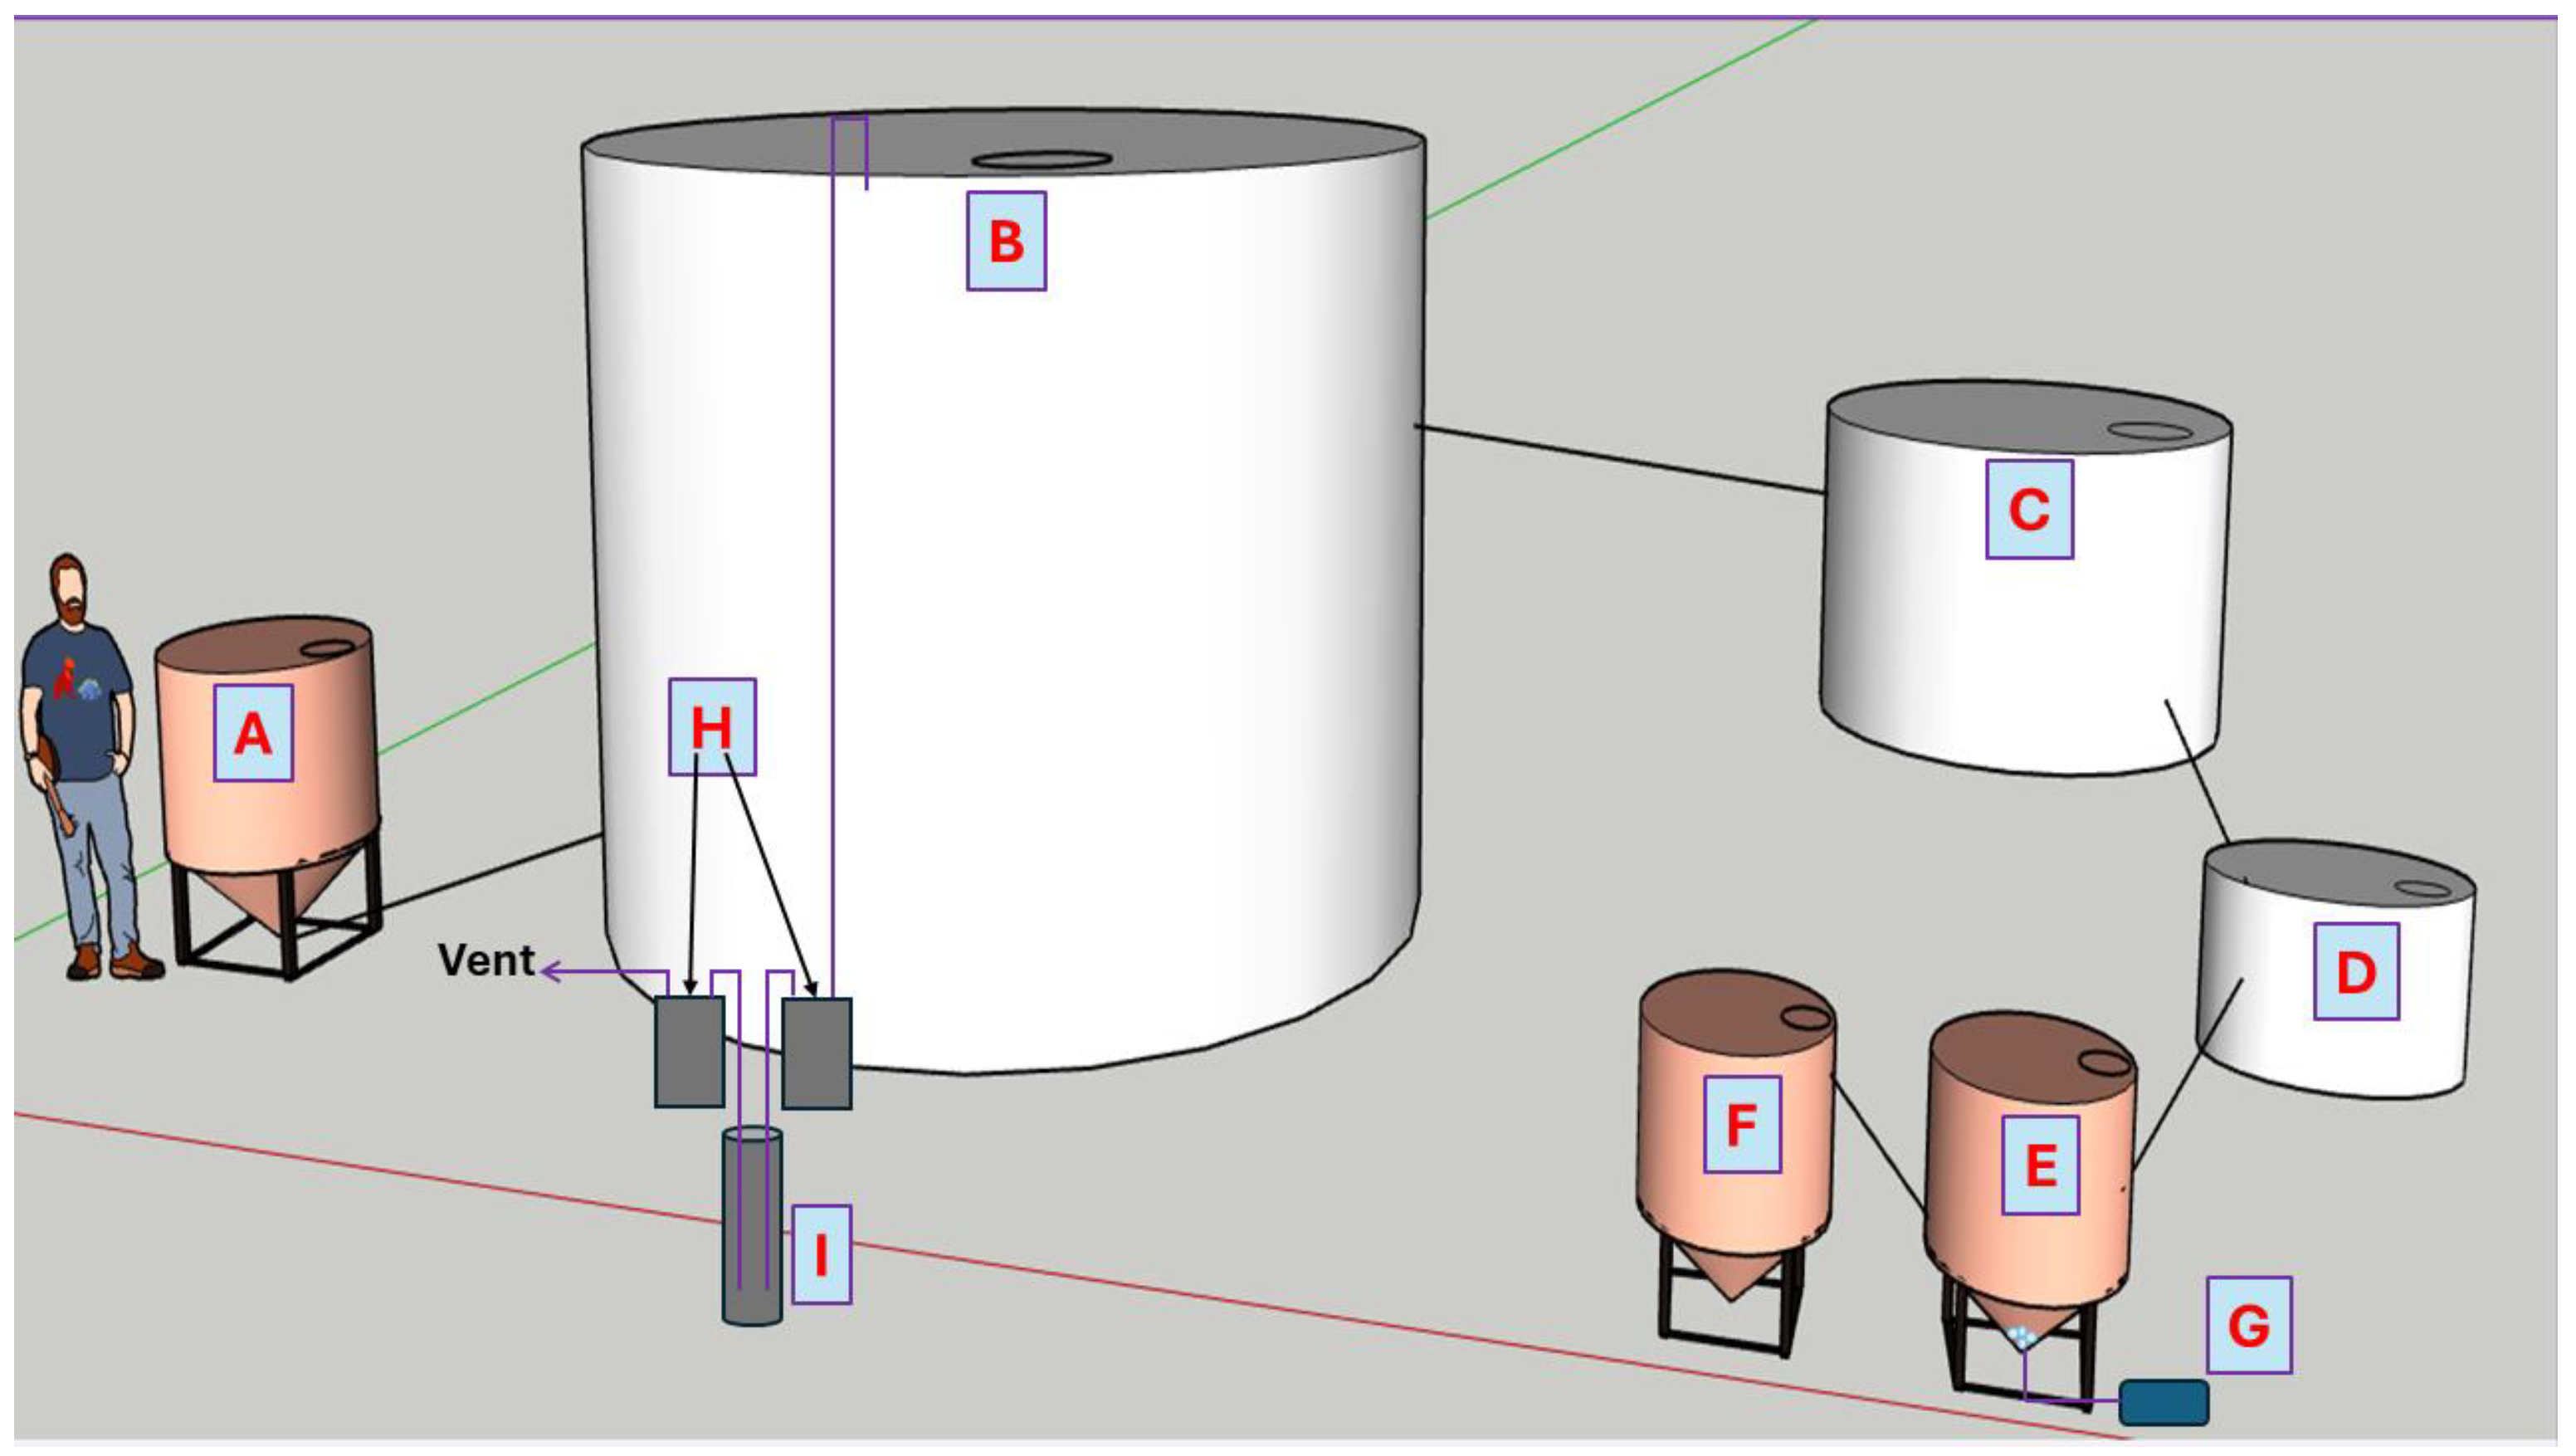
2.1. Waste Treatment System Description

The anaerobic digester and nitrogen removal module were built on a concrete pad measuring 21 by 6 m. A building with a floor measuring 9.1 by 5.2 m with walls 4.9 m tall and a peak building height of 5.9 m was erected on the concrete pad and housed the wastewater feeding tank, anaerobic digester, aeration tank, and settling tank, as described below. The concrete pad also accommodated a constructed wetland measuring 3.6 by 3.6 m and filled with Crider soil, with an average depth of 0.3 m and a water depth of 0.3 m (Figure 1). Bulrushes or broadleaf cattails (Typha latifolia) were planted in the wetland to aid in the remediation of the wastewater. The outlet of the wetland led to a polypropylene-lined lagoon with dimensions of approximately 10 by 5 m and an average depth of 4.75 m with a 30° slope, providing a capacity of approximately 75 m3. A photograph of the wastewater treatment system is presented as Figure 1.
Anaerobic digestion and wastewater holding tanks were purchased from Tank Depot (Edgecliff Village, TX, USA). The digester was constructed from a high-density polyethylene (HDPE) water tank with a diameter of 2.44 m and height of 2.77 m, a volume of 11, 360 L, and a digestate volume of 9085 L. The system was fed by an AMT model 316B-95 self-priming 120 V single-phase centrifugal pump (Gorman-Rupp, Mansfield, OH, USA). Wastewater was fed to the pump from an elevated cone-bottom HDPE feed tank with a capacity of 946 L (National Tank Outlet, Memphis, TN, USA). Feed was routed to the digester by means of a 5.08 cm polyvinyl chloride (PVC) pipe. During a typical feeding, each digester received 22.7 kg of chicken litter suspended in 757 L with a 189 L rinse. Digestate levels were gauged by the means of a clear 5.08 cm diameter PVC pipe with a length of 30 cm (McMaster-Carr, Aurora, OH, USA) connected to the side of the digester near its surface.
The approximate volume to be fed to each tank was drained prior to feeding by opening a ball valve and emptied into a 3028 L HDPE effluent holding tank located outside of the building. The digester had an outlet at the top of the tank, which accommodated a 1.27 cm diameter PVC pipe connected to an EKM model EKM-PGM-075 pulse output diaphragm gas meter, which recorded 1.0-ft3 (28.3 L) per pulse (EKM Metering, Santa Cruz, CA, USA). From the meter, the line led to an in-ground condensate trap constructed from a 10.2 cm diameter pipe with a length of 0.3 m. The top of the condensate trap was fitted with a 1.27 cm diameter pipe and ball valve, from which condensate from the bottom of the condenser could be collected. From the condensate trap, the line then led to another EKM gas meter prior to venting to the atmosphere. Prior to feeding the digester, it was vented to the atmosphere by opening a three-way valve on the gas line to avoid developing excess pressure or vacuum in the system.
From the outdoor holding tank, flowing water was gravity-fed to an indoor effluent holding tank. From this tank, water at a rate of 94 mL−1 min−1 was fed to a 208 L cone-bottom HDPE tank filled with 38 L of polypropylene bioballs (Aquatic Experts, Greensboro, NC, USA). Aeration at a rate of 6 L min−1 was provided by an Aquaneat SCP-107 diaphragm pump (https://www.amazon.com/). The volume of this tank was maintained at 204 L by an outlet leading to another HDPE cone-bottom tank maintained at a volume of 193 L. This tank was intended for use as a settling tank to reduce the loss of ammonia-oxidizing bacteria and or archaea that might develop in the aeration tank. A schematic representation of the waste treatment system is presented as Figure 2.
The design of the system therefore coupled a batch-fed anaerobic digester with a continuously operated post-digestion wastewater treatment system. The anaerobic digester as well as the aeration and biomass retention tanks were kept indoors to maintain an adequate temperature during cool weather, whereas the wetland was outside the building.
The overflow from the settling tank led back outside the building and to a 3.4 m long sand-filled aluminum gutter lined with geotextile fabric and with downspouts at each end. The flow from the sand filter trickled into the constructed wetland.
The overflow of the wetland, consisting of wastewater and rainwater, flowed into a lagoon with a polypropylene liner for further remediation and use as a reservoir for water to feed waste back to the digesters. The lagoon had approximate dimensions of 14 by 7 m and an approximate capacity of 125 m3.

2.2. Sound Systems

All sound systems were housed in a shed measuring 2 by 4 m. Sound was supplied to the digesters by Skar Audio FSX10-4 ten in (25.4 cm), 4 Ω speakers rated at 200 W RMS (root mean square) power and a frequency response of 50–5000 Hz (Skar Audio, Tampa, FL, USA). The speakers were waterproofed by coating them with GE Silicone I caulk (General Electric Co., Boston, MA, USA) diluted with petroleum-based lighter fluid. Two sets of speakers were mounted 0.5 m above and facing the bottom of each digester to have a backup system in case of failure of one of the stereo systems. During operation, the amplifiers were operated at one-quarter volume for 15 min per hour. Sound was played to the digester, consisting of a recording of Neptune, The Mystic from Gustav Holst’s orchestral suite The Planets, and five simultaneous sine waves with frequencies of 1, 2, 3, 4, and 5 kHz played simultaneously as well as an overdubbed recording of two electric guitars undergoing feedback while being played through a Fender® Mustang II amplifier (Fender, Fullerton, CA, USA) recorded with a Yeti USB microphone (Logitech, Newark, CA, USA). The guitars were recorded at a sample rate of 320 kHz with an audio depth of 32 bits.
For audio recordings of the digesters, two Aquarian Model H1A hydrophones (Aquarian Audio & Scientific, Anacortes, WA, USA) were placed in each digester and placed in the center of the tank 1.0 m above the bottom of the tank. For each digester, one hydrophone was equipped with a 1/4“ (6.35 mm) tip-sleeve jack while the other was equipped with an XLR connector. Speaker and hydrophone lines were routed via a 2 in polyvinylchloride (PVC) conduit to a shack (4 m by 3 m) housing the stereo amplifiers (Pyle Audio PTAU 55) rated at 120 W RMS per channel (Pyle Audio, Brooklyn, NY, USA) and the recording equipment.
Recording was performed using a Focusrite Scarlett 18i8 3rd generation USB audio interface (Focusrite Audio Engineering Ltd., High Wycombe, UK) and Ableton Live 11 software (Ableton, Berlin, Germany). Input gain was set to 0 dB. Recordings were performed at a sampling rate of 96 kHz and audio depth of 24 bits, affording a frequency range while recording from 1 Hz to 48 kHz. Live audio monitoring of the digesters was provided by 150 W Behringer Studio50usb-powered studio monitors (Behringer, Willich, Germany).

2.3. Wastewater Treatment System Operation

The digesters were seeded with 13.6 kg dairy manure and 95 L of digestate from a commercial anaerobic digester maintained at approximately 48 °C. The next week, the digesters were fed 13.6 kg of spent top-dressing poultry litter in 750 L of water followed by 190 L of additional water to rinse and flush the feed tank and lines. In subsequent weeks, the digesters were fed 22.7 kg of poultry litter in the same fashion. From week six onwards, 100 g Ca(OH)2 was added to the feed to boost alkalinity in the digester. From week 11 onwards, the digesters were fed 11.3 kg of cracked corn and 13.6 kg of poultry litter.

2.4. Sampling

Samples were collected weekly for analysis prior to feeding the digesters. Water temperature, conductivity, pH, and oxidation–reduction potential (ORP) were measured using a YSI ProDSS water quality meter (YSI Inc., Yellow Springs, OH, USA), and analyses of GHGs in the biogas and water were performed as previously described [21,34]. Soil temperature and moisture were recorded once hourly (Meter Group Inc. Pullman, WA, USA). All other water quality parameters were measured on samples that had been stored at −4 °C prior to analysis using APHA standard methods [35].
Wastewater samples were filtered through nylon syringe filters with a 0.25 um pore size and then analyzed on a SEAL AQ400 discrete spectrophotometric analyzer (SEAL Analytical, Inc., Mequon, MN, USA) using methods AGR-232-C Rev.1 and EPA-153-A Rev. 2 for nitrate/nitrite and ammonia, respectively.
Anions were determined by ion chromatography. Samples of 2 mL were filtered through 0.2 µm pore size filters. An amount of 25 µL was injected via IC via a model AS-AP autosampler. AS22 Eluent Reagent was used as the mobile phase for an isocratic run. The mobile phase was pumped at 1.0 mL min−1 through a 50 mm × 4.00 mm IonPac AG22 Guard and 250 mm by 4.00 mm IonPacAS22 Analytical columns held at 25 °C to a model 061830 conductivity detector and an ADRS 600 Anion Dynamically Regenerating Suppressor. Cations were determined using methanesulfonic acid as the mobile phase at 1.2 mL min−1 through a 50 mm × 4.00 mm IonPac CG12A Guard and 250 mm × 4.00 mm IonPac CS12A Analytical columns held at 25 °C to a model 061830 conductivity detector and a Cation Dynamically Regenerating Suppressor (ICS 6000, Thermo Sci/Dionex Corp., San Francisco, CA, USA). Wastewater and ion data were analyzed in SAS 9.4 (SAS Institute, Cary, NC, USA) using PROC GLM and means were compared using a Duncan multiple range test.
Atmospheric greenhouse gases were determined by a photoacoustic multigas monitor INNOVA 1512-5, LumaSense (California Analytical Instruments Inc., Orange, CA, USA). The photoacoustic gas analyzer had four optical filters: NH3 with a detection limit (DL) of 0.2 ppm (UA0976), N2O with a DL of 0.03 ppm (UA0985), CO2 with a DL of 5.0 ppm (UA0983), and CH4 with a DL of 0.4 ppm (UA0969). Samples were collected every 5 min. via the onboard vacuum system on the system through PTFE tubing with a 4.6 mm diameter and an average length of 18 m. Gas was sampled at the outlet of the anaerobic digester, 3 cm above the surface of the aeration tank, and at a 5.1 cm vent on the effluent holding tank. In the case of the wetland, the air was sampled from a floating chamber with an approximate volume of 28 L. The chamber was made by cutting a 57 L closed-end barrel in half longitudinally.
Biogas and dissolved gas analyses were performed as described previously [21,34,36]. Ammonium and nitrate concentrations were analyzed on a SEAL AQ400 discrete spectrophotometric analyzer (SEAL Analytical, Inc., Mequon, MN) using methods AGR-232-C Rev.1 and EPA-153-A Rev. 2 for nitrate/nitrite and ammonia, respectively.

3. Results and Discussion

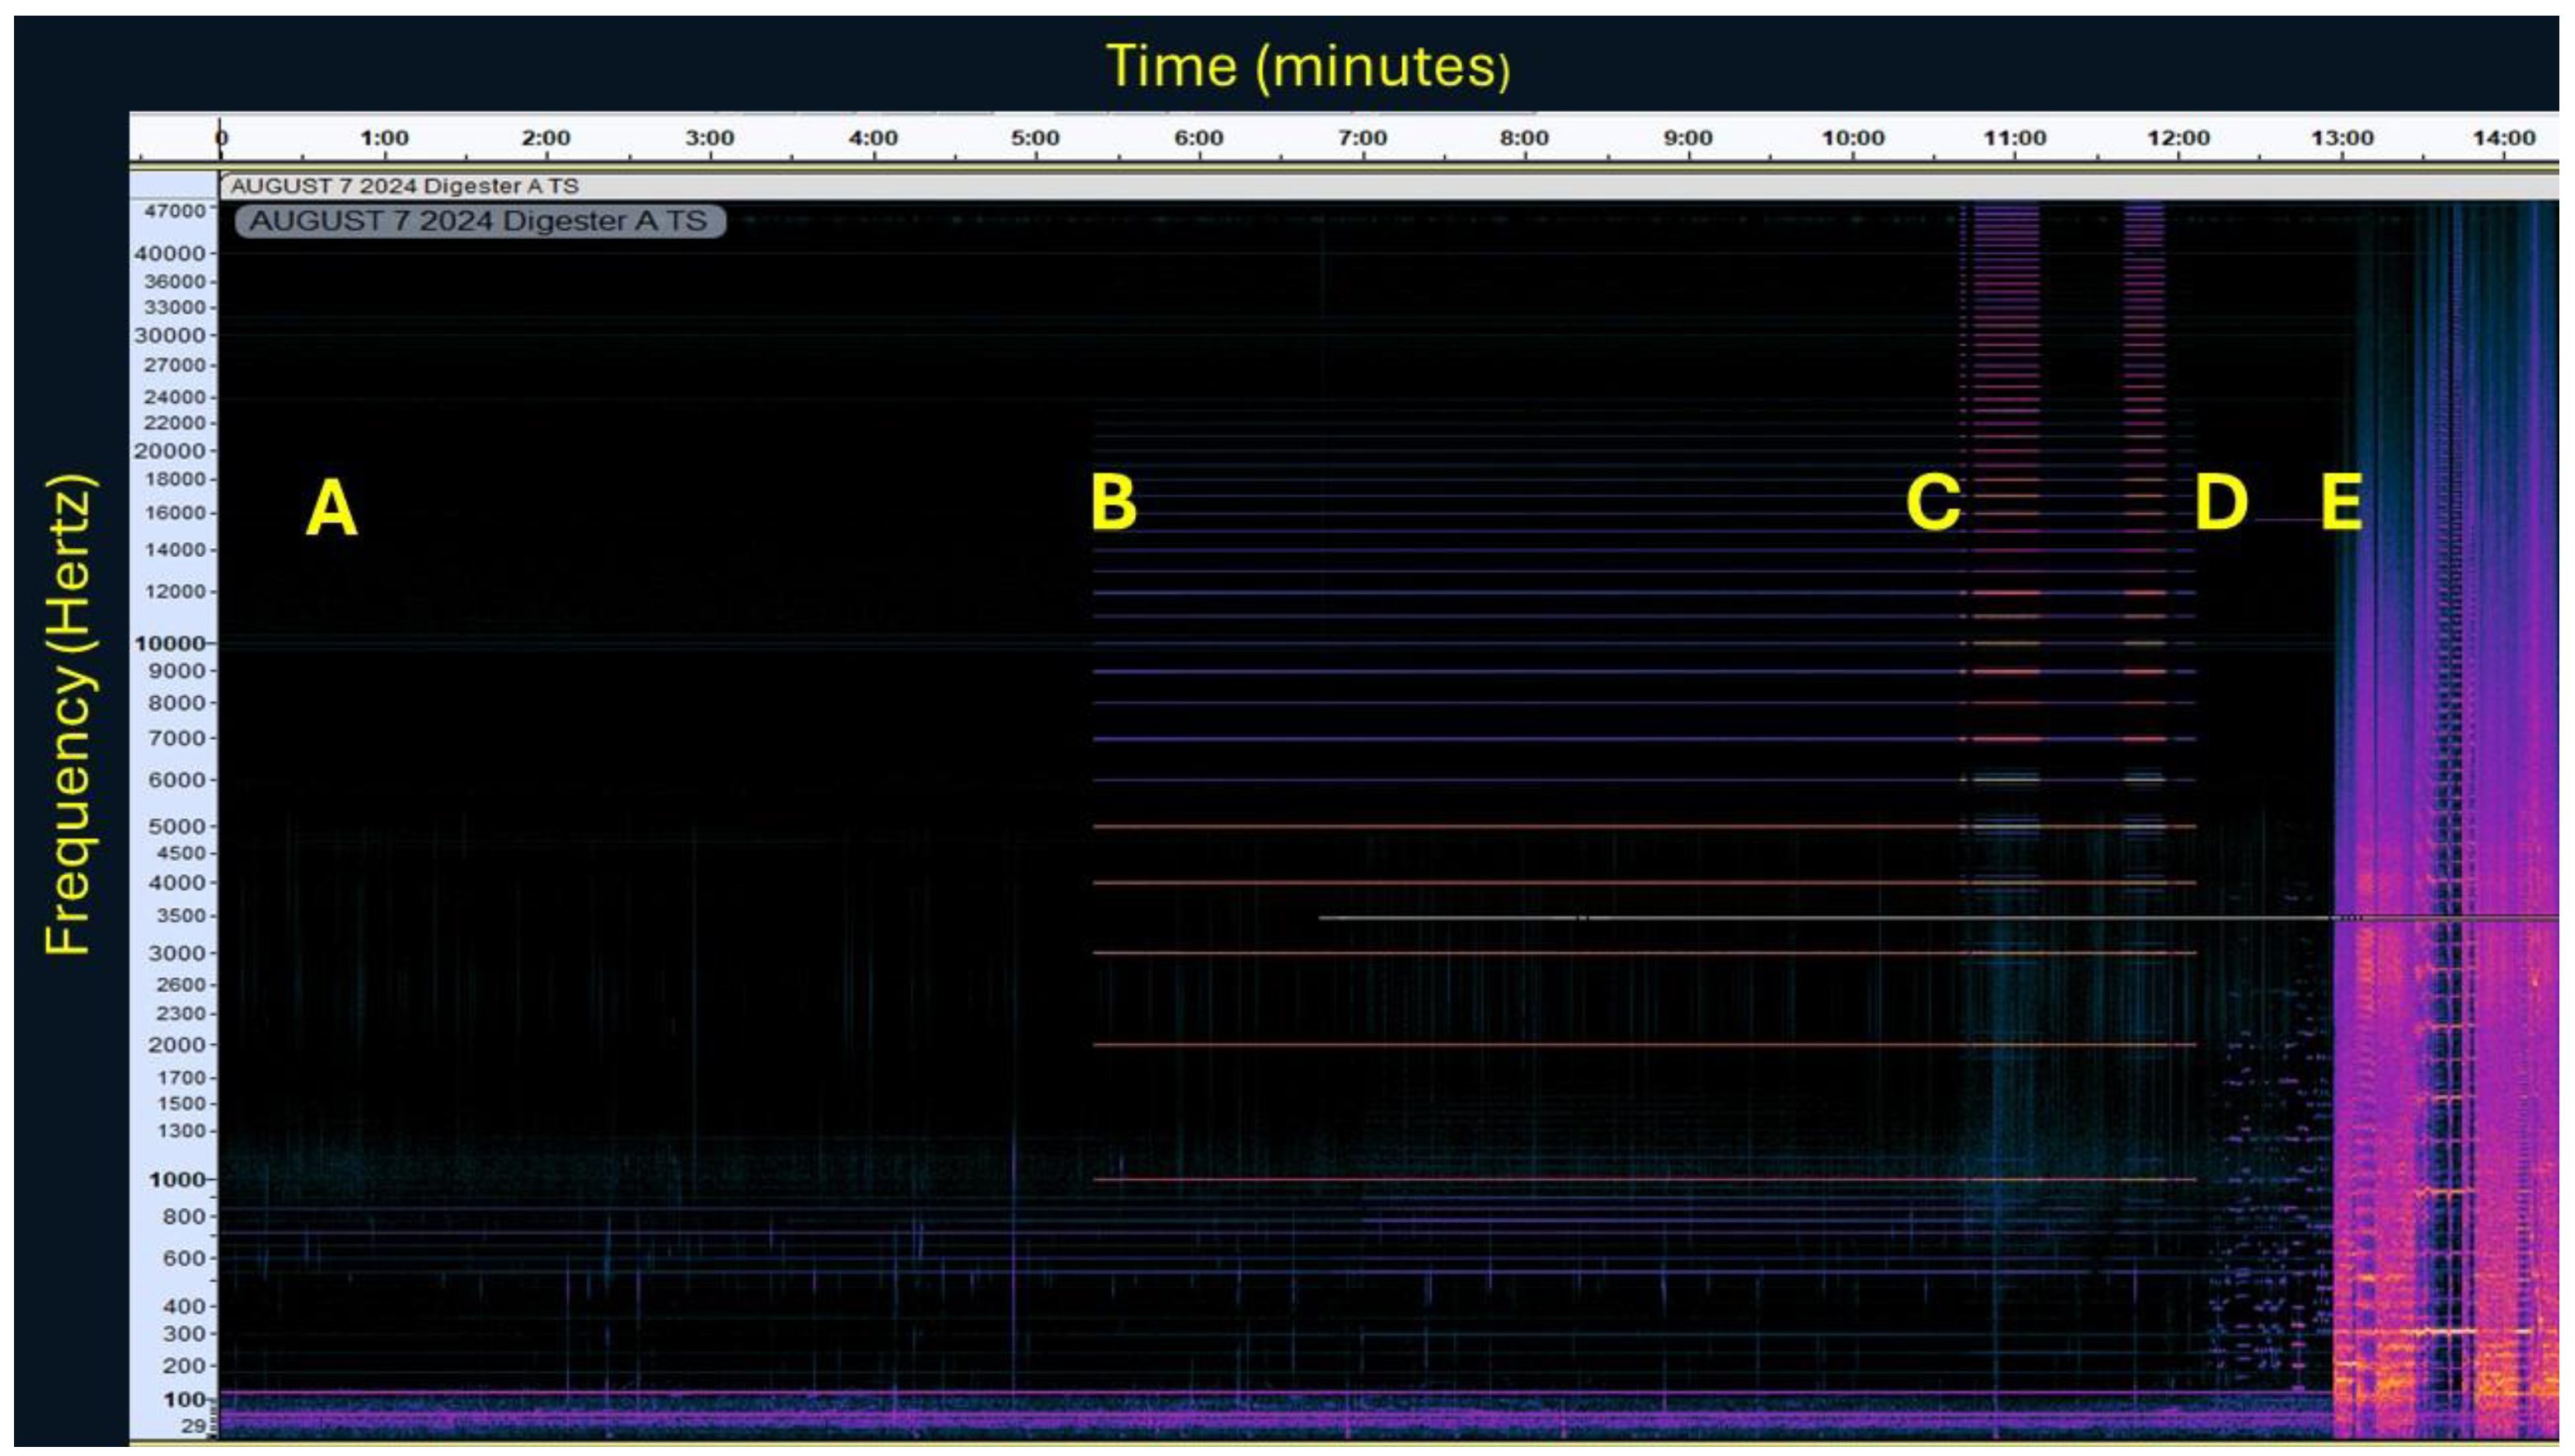
3.1. Sound Treatment of Digesters

Figure 3 shows a spectrogram of digester A recorded during week 11 after digester startup. During this time, the digester had been treated intermittently at one-quarter volume by a recording of Neptune, The Mystic. The background sound amplitude was very low, as we have seen in previous research, and it was only after a long exposure to sound on a 2 h on, 1 h off cycle of sound that the background audio amplitude became much greater than that of an untreated digester [21,36]. During the previous experiment, the amplifiers were set to one-half volume, whereas in the present experiment, the amplifier was set to one-quarter volume. The faint vertical lines extending from about 0 to 5000 Hz that can be best seen during the background recording and while sine waves are being played are due to cavitational events, i.e., bubbles either forming or collapsing.
In the previous experiment, we speculated that bubbles undergoing inertial cavitation in a sound field would emit harmonics of the excitation frequency extending into the ultrasonic range but lacked equipment capable of recording beyond 22 kHz. Part of the mechanism by which acoustic stimulation of anaerobic digestion may enhance biogas production may be due to accelerating the process of inertial cavitation, i.e., the formation, growth, and collapse of bubbles in a fluid. Bubbles resonate at frequencies proportional to their diameter and emit harmonic frequencies of the resonant frequency [37]. With the new recording equipment, faint bubble harmonics were seen extending to near 40 kHz when exposed to a mix of 1, 2, 3, 4, and 5 kHz sine waves. After approximately five minutes of exposure to the sine waves, the volume of the stereo was increased to one-half to accentuate the bubble harmonics and then turned back to one-quarter volume. Intense bubble harmonics extending to at least 48 kHz were noted when comparatively loud guitar feedback was played to the digesters. It should be noted, however, that recording of the guitar feedback samples was performed deliberately with audio clipping, i.e., exceeding the maximum input level of the recording device. The observed ultrasonic harmonics were nevertheless impressive considering the rated frequency of the loudspeakers did not exceed 5 kHz. The rationale for using recordings of guitar feedback was that audio feedback is a classic example of a chaotic system [38], and bubbles exposed to a chaotic sound field might undergo more chaotic oscillations and collapse more frequently and perhaps with even more violence [39]. The sounds used in this paper were used to illustrate how different acoustic excitations affect bubble harmonics in the digesters. It remains to be determined if the spectral quality of audio excitation and its volume and duration affect biogas production to an appreciable degree.
In previous research [21], sine waves and musical compositions were played to the digesters without performing comparisons of different sound types (e.g., music, sine waves, and broadband noise) to determine if the quality of sound affected the efficiency of sound treatment. Nevertheless, in one study these sounds were found to increase weekly biogas production from 18,900 L−1 in a sound-treated digester as compared to 9050 L-1 for a control digester. In the subsequent study [36], sound treatment increased biogas production by 27% during warm weather and 74-fold during the winter.
The mechanism behind how sound treatment enhances biogas production requires elucidation but likely involves mixed mechanisms [21,36]. In addition to inertial cavitation, these include acoustic streaming, where bulk flows are induced in a fluid due to acoustic pressure [40], reducing the depth of cell boundary layers and thereby resistance to molecular exchange [41], and enhancing mixing by inducing bubble formation within the sludge and inducing flows due to “bubble drag and lift” forces [42].

3.2. Wastewater Quality

During the period discussed, limited precipitation coupled with evaporation from the wetland resulted in little flow into the lagoon, so only wastewater quality from the digester through the wetland is discussed. Wastewater quality data presented in Table 1 cover the periods encompassing weeks 6–13 of the wastewater treatment system operation (2 July 2024–20 August 2024). The pH of the digester was low during this period, averaging 6.7, reflecting the faster growth of fermenters as compared to methanogens [43]. Dissolved oxygen was low in all tanks but higher in the aeration tank. All tanks had low ORP values, but the aeration tank had relatively more oxic values.
Except in the aeration tank, NO2 occurred at much higher concentrations than did NO3, likely due to the anoxic conditions. Poultry litter may contain high concentrations of NO3 [44], which could explain the high concentration of NO2 in the digesters due to incomplete denitrification [45]. In the aeration tank, NO2 and NO3 concentrations were more nearly equal. Ammonium levels were lower in the aeration tank, which could be due to nitrification/denitrification processes or loss of ammonia due to aeration. Regardless of which mechanism accounted for the lower concentration of NH4+, the combined NH4+, NO3, and NO2 concentration was low in the wetland compared to that of the aeration tank. The intent for the aeration tank and wetland is to see how NH4+, NO2, and NO3 concentrations vary in the future and whether their microbiome adapts to catabolize these nutrients either through denitrification or anaerobic ammonia oxidation.
The wetland started out relatively oxic prior to feeding the digesters, with dissolved O2 concentrations varying from 10.3 to 7.3 mg per L−1 and ORP ranging from +124 to +90 mV. Two weeks prior to the commencement of system operation, however, ORP declined to −205 mV due to die-off of algae. Despite rapid growth of T. latifolia during this period, the wetland remained anoxic, with ORP averaging −172 mV and dissolved oxygen averaging 1.0 mg L−1. Likely due to hypoxic conditions in the wetland, NO2 concentrations were much higher than NO3 concentrations. Ammonium concentrations remained relatively low in the wetland, likely due to its utilization by micro- and macro-flora.
Although these results are preliminary, relatively lower inorganic phosphate concentrations in the aeration tank and wetland may indicate points where it crystallizes out from the wastewater due to higher pH. Inorganic phosphate is less soluble at higher pH [46]. In the wetland, much lower inorganic phosphate concentrations are likely also due to its take up by algae and cattails and perhaps deposition in the sediment. Without more comprehensive sampling and speciation of phosphate into organic and inorganic forms, this is speculative, however.

3.3. Biogas Production

Table 2 presents the characteristics of the digester biogas from three weeks before sound treatment began and three weeks with sound treatment. These periods span only weeks 8 to 13 of digester operation, and sound treatment was only started on a consistent basis to check operation and gain insight into bubble harmonics, as discussed in Section 3.1. Although gas production and biogas quality were slightly higher before sound treatment as compared to sound treatment, the digesters had not reached a period of stable gas production, so it would be expected that both gas production and gas quality would increase during this time. Since the sound treatment was of low intensity compared to previous experiments [21,36], as well as only used for 15 min per hour, it is unknown whether higher intensity sound treatment and/or treatment for a longer time will yield results comparable to those seen previously, in which biogas production was improved with only slight increases noted in biogas quality.
Carbon dioxide composed approximately 39% of the biogas, which is comparable to other studies [29]. The contaminant of most concern in biogas is usually H2S, which typically ranges from 50 to 10,000 parts per million [31]. We did not measure H2S in this study but plan on investigating whether condensation traps can be used to remove CO2 and H2S in the future.

3.4. Gas Emissions

Greenhouse gas and ammonia/ammonium concentrations were measured in the atmosphere and in the aqueous phase in the digester, effluent holding tank, aeration tank, and wetland (Table 3). Aqueous phase (solvated and in the form of bubbles) CO2 and CH4 occurred in the highest concentration in the digester and effluent holding tank, as expected, and atmospheric CO2 concentrations were much higher from the outlet of the digester, as expected. Atmospheric CH4 concentrations above the surface of the effluent holding tank were not markedly higher than those above the surface of the wetland, however, even though aqueous CH4 was more than 25-fold higher than that in the wetland.
Seeming incongruities in the concentration of gases in the wastewater and headspace at various stages of the treatment process are probably due to the dynamics of ebullition, pH, and configuration of the wastewater holding tanks. For instance, the digester would have high rates of gas evolution due to bubbles collapsing at the surface of the tank, as would the aeration tank. On the other hand, the digester and effluent holding tanks had limited venting compared to the aeration tank and wetland, which might allow for the accumulation of aqueous gases. Ammonia, especially in more alkaline treatment stages after the digester, would mostly be in the form of ammonium, limiting its emission.
In any case, no actual fluxes of gases were calculated from any of the sites within the wastewater treatment system, which would be necessary to determine the magnitude of fugitive emissions. Still, given its relatively large area and the high concentrations of CH4 measured at its surface, the wetland is likely to be an area of concern. This is likely due to eutrophication of the wetland. As measures are taken to reduce nitrogen and phosphorus loading of the wetland, algal growth and subsequent die-off may both be reduced. This would also serve to lessen GHG emissions.
Although combined NH3/NH4+ in the digestate (quantified as NH4+) was quite high, low concentrations of NH3 were detected in the biogas. This may be due to the pH of the digester averaging 6.7 during the sampling period when most of the ammonia would exist as ammonium [33]. In the future, more measurements of GHGs and ammonia in the aqueous and vapor phases will determine points in the system where fugitive emissions are likely to be a concern.

4. Conclusions

This system is intended for use in developing and testing anaerobic digestion and wastewater remediation technologies that are low-cost and efficient. Compared to previous research [22], this system offers moderate heating capabilities, allowing for year-round operation and effluent treatment, allowing for water recycling. Wastewater and biogas characteristics of the system operated without the candidate technologies will serve as useful baselines for comparison later. Initial testing indicates proper operation of the underwater sound system, consistent with previous work. Data on GHGs both in the vapor and aqueous phases show that the system is well suited to account for fugitive emissions from the wastewater treatment system, and preliminary data from the wetland also show modest success in removing nutrients from the wastewater.
The wide variation in pH, dissolved oxygen, and redox potentials within the treatment system can foster the development of microbial processes such as nitrification, denitrification, and aerobic and anaerobic ammonia oxidation to remediate wastewater. Pilot-scale wastewater treatment systems such as those described here can be useful in developing new technologies due to their ability to be readily modified.

Author Contributions

J.H.L., S.W.A. and M.B.V.; methodology, J.H.L., M.B.V., P.J.S. and S.W.A.; validation, S.W.A. and J.H.L.; formal analysis, J.H.L. and S.W.A.; investigation, J.H.L. and N.L. resources, J.H.L., S.W.A., K.R.S., P.J.S. and M.B.V.; data curation, J.H.L.; writing—J.H.L.; review and editing, J.H.L., P.J.S., P.J.S. and M.B.V. visualization, J.H.L. and M.B.V.; supervision, J.H.L.; project administration, J.H.L.; funding acquisition, J.H.L., K.R.S., P.J.S. and M.B.V. All authors have read and agreed to the published version of the manuscript.

Funding

Funding was provided by the Agricultural Research Service (Grant No. 5040-12630-006-00D).

Data Availability Statement

The original contributions presented in this study are included in the article; further inquiries can be directed to the corresponding author.

Acknowledgments

The authors thank Zachary Berry, Jason Simmons, and Michael Bryant (USDAARS) for their technical assistance. The use of trade, firm, or corporation names in this article is for the information and convenience of the reader. Such use does not constitute an official endorsement or approval by the United States Department of Agriculture or the Agricultural Research Service of any product or service to the exclusion of others that may be suitable.

Conflicts of Interest

The authors declare no conflicts of interest. The funders had no role in the design of the study; in the collection, analyses, or interpretation of data; in the writing of the manuscript; or in the decision to publish the results.

References

  1. Gilbert, P.M. From hogs to HABs: Impacts of industrial farming in the US on nitrogen and phosphorus and greenhouse gas pollution. Biogeochemistry 2020, 150, 139–180. [Google Scholar] [CrossRef]
  2. Center, T.J. Governmental oversight of discharges from concentrated animal feeding operations. Environ. Manag. 2006, 37, 745–752. [Google Scholar] [CrossRef] [PubMed]
  3. Burkholder, J.; Libra, B.; Weyer, P.; Heathcote, S.; Kolpin, D.; Thorne, P.S.; Wichman, M. Impacts of waste from concentrated animal feeding operations on water quality. Environ. Health Perspect. 2007, 115, 308–312. [Google Scholar] [CrossRef] [PubMed]
  4. Hamilton, D.W.; Kourtchev, I.N.; Ndegwa, P.W.; Cumba, H.J.; Gioelli, F. Methane and carbon dioxide emissions from simulated anaerobic swine manure treatment lagoons under summer conditions. Trans. ASABE 2006, 49, 157–165. [Google Scholar] [CrossRef]
  5. Van Rooy, P.; Purvis-Roberts, K.L.; Silva, P.J.; Nee, M.J.; Cocker, D. Characterization of secondary products formed through oxidation of reduced sulfur compounds. Atmos. Environ. 2021, 256, 118148. [Google Scholar] [CrossRef]
  6. Van Rooy, P.; Drover, R.; Cress, T.; Michael, C.; Purvis-Roberts, K.L.; Silva, P.J.; Nee, M.J.; Cocker, D. Methanesulfonic acid and sulfuric acid aerosol formed through oxidation of reduced sulfur compounds in a humid environment. Atmos. Environ. 2021, 261, 118504. [Google Scholar] [CrossRef]
  7. Price, D.J.; Kacarab, M.E.; Cocker, D.R.; Purvis-Roberts, K.L.; Silva, P.J. Effects of temperature on the formation of secondary organic aerosol from amine precursors. Atmos. Environ. 2016, 50, 1216–1226. [Google Scholar] [CrossRef]
  8. Baboomian, V.J.; He, Q.; Montoya-Aguilera, J.; Ali, N.; Fleming, L.T.; Lin, P.; Laskin, A.; Laskin, J.; Rudich, Y.; Nizkorodov, S.A. Light absorption and scattering properties of indole secondary organic aerosol prepared under various oxidant and relative humidity conditions. Aerosol. Sci. Technol. 2023, 57, 532–545. [Google Scholar] [CrossRef]
  9. Auer, A.; Vande Burgt, N.H.; Abram, F.; Barry, G.; Fenton, O.; Markey, B.K.; Nolan, S.; Richards, K.; Bolton, D.; De Waal, T.; et al. Agricultural anaerobic digestion power plants in Ireland and Germany: Policy and practice. J. Sci. Food. Agric. 2017, 97, 719–723. [Google Scholar] [CrossRef]
  10. Altege, M.R.; Senol, H.; Djaafri, M.; Hansu, T.A.; Krisa, D.; Atabani, A.; Eskicioglu, C.; Muratçobaboğlu, H.; Unalan, S.; Kalloum, S.; et al. A critical overview of the state-of-the-art methods for biogas purification and utilization processes. Sustainability 2021, 13, 11515. [Google Scholar] [CrossRef]
  11. Bauer, F.; Persson, T.; Hulteberg, C.; Tamm, D. Biogas upgrading—Technology overview, comparison and perspectives for the future. Biofpr 2013, 7, 499–511. [Google Scholar] [CrossRef]
  12. Cowley, C.; Brorsen, B.W. Anaerobic digester production and cost functions. Ecol. Econ. 2018, 152, 347–357. [Google Scholar] [CrossRef]
  13. Singh, B.; Szamosi, Z.; Siménfalvi, Z. State of the art on mixing in an anaerobic digester: A review. Renew. Energy 2019, 141, 922–936. [Google Scholar] [CrossRef]
  14. Nagegele, H.J.; Lemmer, A.; Oechsner, H.; Jungbluth, T. Electric energy consumption of the full scale research biogas plant ‘unterer lindenhof’: Results of longterm and full detail measurements. Energies 2012, 5, 5198–5214. [Google Scholar] [CrossRef]
  15. Kariyama, I.D.; Zhai, X.; Wu, B. Influence of mixing on anaerobic digestion efficiency in stirred tank digesters: A review. Water Res. 2018, 142, 503–517. [Google Scholar] [CrossRef]
  16. Zupančič, G.D.; Roš, M. Heat and energy requirements in thermophilic anaerobic sludge digestion. Renew. Energ. 2003, 28, 2255–2267. [Google Scholar] [CrossRef]
  17. Geng, Y.; Zhang, B.; Du, L.; Tang, Z.; Li, Q.; Zhou, Z.; Yin, X. Improving methane production during the anaerobic digestion of waste activated sludge: CaO-ultrasonic pretreatment and using different seed sludges. Proc. Environ. Sci. 2016, 31, 743–752. [Google Scholar] [CrossRef]
  18. Chen, J.; Liu, S.; Wang, Y.; Huang, W.; Zhou, J. Effect of different hydrolytic enzymes pretreatment for improving the hydrolysis and biodegradability of waste activated sludge. Water Sci. Technol. 2018, 2, 592–602. [Google Scholar] [CrossRef]
  19. Neis, U.; Nickel, K.; Lundén, A. Improving anaerobic and aerobic degradation by ultrasonic disintegration of biomass. J. Environ. Sci. Health A 2008, 43, 1541–1545. [Google Scholar] [CrossRef]
  20. Pilli, S.; Bhunia, P.; Yan, S.; LeBlanc, R.J.; Tyagi, R.D.; Surampalli, R.Y. Ultrasonic pretreatment of sludge: A review. Ultrason. Sonochem. 2011, 18, 1–18. [Google Scholar] [CrossRef]
  21. Loughrin, J.; Antle, S.W.; Sistani, K.; Lovanh, N. In situ acoustic treatment of anaerobic digesters to improve biogas yields. Environments 2020, 7, 11. [Google Scholar] [CrossRef]
  22. Çelen, I.; Türker, M. Recovery of ammonia as struvite from anaerobic digester effluents. Environ. Technol. 2001, 22, 1263–1272. [Google Scholar] [CrossRef]
  23. Möller, K.; Müller, T. Effects of anaerobic digestion on digestate nutrient availability and crop growth: A review. Eng. Life Sci. 2015, 12, 242–257. [Google Scholar] [CrossRef]
  24. Park, J.; Jin, H.-F.; Lim, B.-R.; Park, K.-Y.; Lee, K. Ammonia removal from anaerobic digestion effluent of livestock waste using green alga Scenedesmus sp. Bioresour. Technol. 2010, 101, 8649–8657. [Google Scholar] [CrossRef] [PubMed]
  25. Li, G.; Bai, X.; Li, H.; Lu, Z.; Wang, Y.; Cao, J.; Huang, Z. Nutrients removal and biomass production from anaerobic digested effluent by microalgae: A review. Int. J. Agric. Biol. Eng. 2019, 12, 8–13. [Google Scholar] [CrossRef]
  26. Miranda, N.D.; Tuomisto, H.L.; McCulloch, M.D. Meta-Analysis of greenhouse gas emissions from anaerobic digestion processes in dairy farms. Environ. Sci. Technol. 2015, 39, 5211–5219. [Google Scholar] [CrossRef]
  27. Cui, Y.; Schubert, B.A.; Jahren, A.H. A 23 m.y. record of low atmospheric CO2. Geology 2020, 48, 888–892. [Google Scholar] [CrossRef]
  28. Abdel-Hadi, M.A. A simple apparatus for biogas quality determination. Misr. J. Ag. Eng. 2008, 25, 1055–1066. [Google Scholar]
  29. Dumont, E. H2S removal from biogas using bioreactors: A review. Int. J. Energy Environ. Eng. 2015, 6, 479–498. [Google Scholar]
  30. Little, B.J.; Ray, R.I.; Pope, R.K. Relationship between corrosion and the biological sulfur cycle: A review. Corrosion 2000, 56, 433–443. [Google Scholar] [CrossRef]
  31. Likens, G.E.; Wright, R.F.; Galloway, J.N.; Butler, T.J. Acid Rain. SciAm 1979, 241, 43–51. [Google Scholar] [CrossRef]
  32. Bist, R.B.; Subedi, S.; Chai, L.; Yang, X. Ammonia emissions, impacts, and mitigation strategies for poultry production: A critical review. J. Environ. Manag. 2023, 328, 116919. [Google Scholar] [CrossRef] [PubMed]
  33. Chen, S.-K.; Lee, Y.-Y.; Liao, T.-L. Assessment of ammonium–N and nitrate–N contamination of shallow groundwater in a complex agricultural region, central western Taiwan. Water 2022, 14, 2130. [Google Scholar] [CrossRef]
  34. Loughrin, J.H.; Antle, S.W.; Polk, J. A Gas Chromatographic Method for the Determination of Bicarbonate and Dissolved Gases. Front. Environ. Sci. 2017, 5, 65. [Google Scholar] [CrossRef]
  35. Eaton, A.; Clesceri, L.; Greenberg, A.; Franson, M. Standard Methods for the Examination of Water and Wastewater, 20th ed.; American Public Health Association: Washington, DC, USA, 1998. [Google Scholar]
  36. Loughrin, J.; Antle, S.; Simmons, J.; Sistani, K.; Lovanh, N. In Situ Sonification of Anaerobic Digestion: Extended Evaluation of Performance in a Temperate Climate. Energies 2020, 13, 5349. [Google Scholar] [CrossRef]
  37. Brennen, C.E. Cavitation and Bubble Dynamics, 1st ed.; Cambridge University Press: New York, NY, USA, 2014; p. 268. [Google Scholar]
  38. Slater, D. Chaotic sound synthesis. Comput. Music J. 1998, 22, 12–19. [Google Scholar] [CrossRef]
  39. Zhang, Y.; Zhang, Y. Chaotic oscillations of gas bubbles under dual-frequency acoustic excitation. Ultasonics Sonochem. 2018, 40(B), 151–157. [Google Scholar] [CrossRef]
  40. Wu, J. Acoustic streaming and its applications. Fluids 2018, 3, 108. [Google Scholar] [CrossRef]
  41. Mobaraki, M.; Semken, R.S.; Mikkola, A.; Pyrhonen, J. Enhanced sludge dewatering based on the application of high-power ultrasonic vibration. Ultrasonics 2018, 84, 438–445. [Google Scholar] [CrossRef]
  42. Yuan, T.; Cheng, Y.; Wang, X.; Yu, Y.; Zhang, Z.; Lei, Z.; Shimizu, K.; Utsumi, Y.; Lee, D.-J. A novel anaerobic digestion system coupling biogas recirculation with MgCl2 addition for multipurpose sewage sludge treatment. J. Clean. Prod. 2019, 230, 499–507. [Google Scholar] [CrossRef]
  43. Meegoda, J.N.; Li, B.; Patel, K.; Wang, L.B. A review of the processes, parameters, and optimization of anaerobic digestion. Int. J. Res. Public Health 2018, 15, 2224. [Google Scholar] [CrossRef] [PubMed]
  44. Katuwal, S.; Rafsan, N.A.S.; Ashworth, A.J.; Kolar, P. Poultry litter physiochemical characterization based on production conditions for circular systems. BioResouces 2023, 18, 3961–3977. [Google Scholar] [CrossRef]
  45. Wilderer, P.A.; Jones, W.L.; Dau, U. Competition in denitrification systems affecting reduction rate and accumulation of nitrite. Water Res. 1987, 21, 239–245. [Google Scholar] [CrossRef]
  46. Zheng, Y.; Wan, Y.; Zhang, Y.; Huang, J.; Yang, Y.; Tsang, D.C.W.; Wang, H.; Chen, H.; Gao, B. Recovery of phosphorus from wastewater: A review based on current phosphorous removal technologies. Crit. Rev. Environ. Sci. Technol. 2022, 53, 1148–1172. [Google Scholar] [CrossRef] [PubMed]
Figure 1. Anaerobic digester/wastewater treatment complex. A. Shed containing audio amplifiers and recording equipment. B. Building housing feeding tank, anaerobic digester, and aeration tank. C. Holding tanks for digester effluent. D. Constructed wetland. E. Water retention lagoon for recycling back to the waste digester. Note that building houses two anaerobic digesters but that only one is fully functional at the time of writing.
Agriengineering 07 00136 g001
Figure 2. Schematic representation of the anaerobic digestion system and wastewater treatment system. A. Feed tank; B. anaerobic digester; C. outdoor effluent holding tank; D. indoor effluent holding tank; E. aeration tank; F. biomass retention tank; G. air pump; H. flow meters; and I. in-ground condensate trap.
Agriengineering 07 00136 g002
Figure 3. Spectrogram of anaerobic digester treated with sound. A: Background sound levels; B: digester exposed to a mix of 1 through 5 kHz sine waves at 1 kHz intervals at one-quarter volume; C: volume of sine waves increased to one-half to accentuate harmonics; D: digester exposed to a recording of Neptune, the Mystic from Gustav Holst’s orchestral suite The Planets at one-half volume; and E. digester exposed to a recording of guitar feedback at one-half volume.
Agriengineering 07 00136 g003
Table 1. Water characteristics of the four treatment stages of the waste treatment system a.
Treatment Stage
Parameter DigesterEffluent
Storage Tank
Aeration
Tank
Wetland
Temperature (°C)27.1 ± 1.0 b29.2 ± 1.9 b27.3 ± 1.4 a24.6 ± 1.9 c
pH6.7 ± 0.3 d7.2± 0.2 c7.9 ± 0.4 a7.6 ± 0.2 b
Dissolved oxygen (mg L−1)1.3 ± 0.5 b1.4 ± 0.9 b2.5 ± 1.3 a1.0 ± 0.7 b
Oxidation–Reduction Potential (mV) −271 ± 23.2 b −263 ± 20.8 b −151 ± 83.1 a −158 ± 59.9 a
Conductivity (µS cm−1)3390 ± 1120 a2910 ± 801 ab2520 ± 723 b982 ± 384 c
Concentration (mg L−1)
Ammonium148 ± 93.1 a161 ± 4.5 a103 ± 80.7 b16.7 ± 20.7 c
Nitrite67.8 ± 190 a11.3 ± 27.2 a10.0 ± 14.4 a16.9 ± 19.3 a
Nitrate2.04 ± 3.08 a1.16 ± 1.79 a9.33 ± 12.1 a0.82 ± 0.48 a
Phosphate254 ± 228 a177 ± 134 ab95.7 ± 81.3 bc20.2 ± 24.8 c
Sulfate22.1 ± 23.5 ab16.8 ± 12.9 bc38.1 ± 17.6 a3.60 ± 2.94 c
Sodium99.0 ± 47.3 ab104 ± 39.2 a80.4 ± 41.4 b40.9 ± 25.4 c
Potassium316 ± 168 a301 ± 133 a221 ± 130 b89.0 ± 59.9 c
Calcium106 ± 36.7 a89.0 ± 30.0 a59.1 ± 27.2 b45.8 ± 9.36 b
Magnesium47.3 ± 18.3 a42.9 ± 15.3 ab33.9 ± 5.63 ab27.4 ± 8.20 b
a Data represent the mean of eight determinations ± standard deviation of the mean. Within rows, means followed by the same letter are not significantly different by a Duncan’s multiple range test at p = 0.05 using PROC GLM.
Table 2. Biogas quality produced by anaerobic digester.
Sampling Period a
ParameterBefore Sound TreatmentDuring Sound Treatment
Carbon dioxide, µg L−1326,000 ± 65,200341,000 ± 74,400
Methane, µg L−1508,000 ± 99,300485,000 ± 97,600
Liters of biogas wk−15760 ± 6885580 ± 1580
a Data represent the mean of three determinations ± standard deviation of the mean.
Table 3. Concentration of greenhouse gases and ammonium/ammonia in wastewater and atmosphere of four stages of the wastewater treatment system.
Wastewater Treatment Stage
DigesterEffluent Holding TankAeration TankWetland
Aqueous Phase Concentration
CO2 (mM) a3.16 ± 0.140.74 ± 0.0490.15 ± 0.020.11 ± 0.011
CH4 (mM) a25.0 ± 2.3226.4 ± 3.690.81 ± 0.140.98 ± 0.13
NH4+ (mM) a11.0 ± 10.27.91 ± 2.566.72 ± 4.860.58 ± 1.75
N2O (pM) a225 ± 35.1213 ± 39.7184 ± 39.1188 ± 33.1
Atmospheric Concentration (ppm)
CO264,400 ± 61,5002830 ± 1200911 ± 1562230 ± 3890
CH437,700 ± 34,700716 ± 35045.7 ± 11.0708 ± 3.310
NH312.8 ± 17.96.51 ± 4.229.87 ± 1.337.58 ± 5.41
N2O (ppb)26.9 ± 17.916.6 ± 8.221.26 ± 0.240.96 ± 0.88
a Data represent the mean ± standard deviation of the mean of seven triplicate determinations. Number of atmospheric gas analyses = 285, 323, 285, and 567 for the digester, effluent holding tank, aeration tank, and wetland, respectively.
Disclaimer/Publisher’s Note: The statements, opinions and data contained in all publications are solely those of the individual author(s) and contributor(s) and not of MDPI and/or the editor(s). MDPI and/or the editor(s) disclaim responsibility for any injury to people or property resulting from any ideas, methods, instructions or products referred to in the content.

