Article

Cost-Effective Active Laser Scanning System for Depth-Aware Deep-Learning-Based Instance Segmentation in Poultry Processing

1
Department of Biological and Agricultural Engineering, University of Arkansas, Faytteville, AR 72701, USA
2
Department of Food Science, University of Arkansas, Fayetteville, AR 72701, USA
3
Department of Mechanical Engineering, University of Arkansas, Fayetteville, AR 72701, USA
4
Department of Industrial Engineering, Purdue University, West Lafayette, IN 47907, USA
*
Author to whom correspondence should be addressed.
AgriEngineering 2025, 7(3), 77; https://doi.org/10.3390/agriengineering7030077
Submission received: 23 January 2025 / Revised: 26 February 2025 / Accepted: 5 March 2025 / Published: 12 March 2025

Abstract

:
The poultry industry plays a pivotal role in global agriculture, with poultry serving as a major source of protein and contributing significantly to economic growth. However, the sector faces challenges associated with labor-intensive tasks that are repetitive and physically demanding. Automation has emerged as a critical solution to enhance operational efficiency and improve working conditions. Specifically, robotic manipulation and handling of objects is becoming ubiquitous in factories. However, challenges exist to precisely identify and guide a robot to handle a pile of objects with similar textures and colors. This paper focuses on the development of a vision system for a robotic solution aimed at automating the chicken rehanging process, a fundamental yet physically strenuous activity in poultry processing. To address the limitation of the generic instance segmentation model in identifying overlapped objects, a cost-effective, dual-active laser scanning system was developed to generate precise depth data on objects. The well-registered depth data generated were integrated with the RGB images and sent to the instance segmentation model for individual chicken detection and identification. This enhanced approach significantly improved the model’s performance in handling complex scenarios involving overlapping chickens. Specifically, the integration of RGB-D data increased the model’s mean average precision (mAP) detection accuracy by 4.9% and significantly improved the center offset—a customized metric introduced in this study to quantify the distance between the ground truth mask center and the predicted mask center. Precise center detection is crucial for the development of future robotic control solutions, as it ensures accurate grasping during the chicken rehanging process. The center offset was reduced from 22.09 pixels (7.30 mm) to 8.09 pixels (2.65 mm), demonstrating the approach’s effectiveness in mitigating occlusion challenges and enhancing the reliability of the vision system.

1. Introduction

The poultry industry remains the largest meat sector globally. In 2025, global poultry meat production is forecast to reach approximately 104.93 million tons, continuing its role as the leading sector in global meat production [1]. In 2025, the United States is projected to produce approximately 21.72 billion pounds of broiler meat, maintaining its position as the leading global producer. Compared to other meat products such as beef and pork, chicken is recognized for its superior sustainability and environmentally friendly properties [2]. The demand for chicken products has consistently increased in recent decades, a trend that is expected to continue in the foreseeable future [3].
In recent years, the general meat industry, and more specifically the poultry industry, has employed significant advances in automation and robotics to improve process efficiency, reduce labor costs, and improve product quality. This transition is driven by the need to address labor shortages and global protein production demands. For instance, collaborative robots have been explored for their potential to work alongside human operators, improving safety and productivity in meat processing tasks [4]. Robotic technology has been effectively integrated into various stages of meat processing, including butchery, evisceration, and carcass cutting [5,6]. The development of these specialized robotic systems highlights the potential for tailored automation solutions in response to specific industry needs [7,8]. In addition, technologies such as three-dimensional (3D) vision and advanced vision systems are essential to ensuring precision in cutting and de-boning tasks, allowing real-time adaptability to variations in each individual carcass [9]. AI and image processing technologies have been effectively employed to improve meat quality assessment and inspection processes, ensuring product safety and minimizing reliance on human labor [10,11]. As the meat industry continues to evolve, despite the challenges of high initial investments and the lack of skilled labor to operate sophisticated machinery [12,13], the application of Industry 4.0 technologies, including robotics and the Internet of Things (IoT), is anticipated to revolutionize current labor-intensive operations, leading to more sustainable practices, improving food quality, and reducing food waste [14,15,16,17,18].
More specifically, within the poultry supply chain, the processing industry plays a vital role in preparing value-added products. Many steps in poultry processing have been transitioning from manual to autonomous operations, such as slaughtering, evisceration, and chilling [19]. However, certain processing steps, including the chicken rehanging step, still heavily rely on human labor. This step, which occurs after the chilling operation and USDA inspections, involves hanging chickens from the evisceration line onto an additional line for subsequent deboning, wing cutting, and packaging processes. Currently, the chicken rehanging process is performed manually by workers, who are required to work closely together and carry out repetitive, monotonous tasks on a daily basis. To automate the chicken rehanging process, some early studies have explored the feasibility of utilizing robotic rehanging solutions [20]. However, in real poultry processing plant settings, chickens are not separated as individual carcasses as desired in laboratory settings, and most chicken carcasses are typically piled together [19]. Considering the similar color and texture of chicken skin [21,22], the vision identification of individual carcasses, the initial step of the robotic operation, is extremely challenging. In recent years, advances in deep learning have achieved great success in object segmentation and detection in the agricultural engineering field, particularly in meat processing. For example, studies have demonstrated the efficacy of various deep learning models for tasks such as detecting and segmenting animal carcasses and meat parts, enhancing both efficiency and accuracy [23]. The applications of computer vision systems have been highlighted in research focused on detecting foreign objects in meat products [24,25], assessing meat quality and safety [26,27,28,29,30,31], and even estimating the meat content in products such as meatballs using advanced imaging techniques [32]. Moreover, methods like the Mask R-CNN and SSD have been effectively utilized for beef carcass segmentation [33,34]. The implementation of attention mechanisms in YOLO models has further improved detection capabilities in livestock management [35]. Similarly, in the realm of ocean science, the integration of YOLOv8 can effectively identify and localize objects within underwater scenes; these models can produce more descriptive and contextually appropriate captions, thereby advancing the field of underwater image analysis [36]. Together, these advancements underscore the critical role of effective vision system algorithms in enabling vision-guided agriculture and food automation, which are essential for successful automation in the meat industry, ultimately enhancing operational efficiency and ensuring product quality. However, very few existing studies have considered the instance segmentation of products with similar visual traits and extensive overlapping [37], which is a common scenario in practice. To overcome this challenge, in this study, we aim to integrate the depth information into the deep learning-based instance segmentation model to achieve a more accurate segmentation mask in order to guide robotic operations. However, the commonly used commercialized RGB-D cameras, such as Intel RealSense D435i, can only achieve depth accuracy of 2% at a range of 1 m, and they cannot meet the requirements needed for high-accuracy robotic operations. To fill the gap, an active laser scanning system was developed recently that enables the generation of high-resolution depth maps [38,39]. Different from prior work using a costly hardware configuration, such as a National Instruments Data Acquisition Board 6003) ($900), to control the laser scanning system, this study develops a cost-effective laser scanning hardware system to achieve accurate depth scanning, which is composed of a Raspberry Pi ($35), an Arduino ($25), and a low-cost PWM-to-voltage converter ($10), with a total cost of approximately $70 for the control system. The cost of this setup is relatively low, but it is important to note that, while the NI boards are optimized for parallel data acquisition, the Raspberry Pi may struggle under high data rates, potentially slowing down the system. However, this setup is not intended to be the final solution for poultry industry applications. The depth data acquired from this setup will serve as ground truth for our future online vision system, with this system acting solely as an offline vision setup for initial testing and development.
In summary, this work introduces two key innovations. First, it provides a low-cost, high-accuracy solution for measuring the depth of chickens in poultry using a dual-line laser scanning system, which offers superior accuracy compared to existing systems. Second, it enhances deep learning models by incorporating depth data as an additional channel of information, improving feature extraction and leading to better chicken carcass segmentation performance. These innovations contribute to more efficient and effective solutions for poultry processing automation.
The following sections provide an outline of the methodology and results in detail. Section 2 describes the experimental material and methods, including the development of the cost-effective Dual-Line Laser Active Scanning system, incorporating both hardware and software components, the use of optical triangulation for object height estimation, and depth information-infused chicken instance segmentation. Section 3 provides the experimental results, including a detailed performance evaluation of the Active Laser Scanning System and an analysis of the common segmentation models including Mask-RCNN, Segment Anything [40,41], and YOLOv8 [42] models on RGB data. Following this, Mask-RCNN was trained and tested with various backbones on RGB-D data, where RGB data were concatenated with depth (D) data collected from the customized laser scanning system to assess the impact of depth information on the segmentation performance. Key metrics such as mean average precision (mAP) and the customized metric, Center Offset, were used to evaluate performance across the different models. Section 4 presents the broader implications of these findings, highlighting the benefits of integrating depth sensing, as well as addressing the challenges associated with real-time depth sensing and computational efficiency. The paper concludes by emphasizing the scalability and practical applications of the proposed system, along with directions for future research.

2. Material and Methods

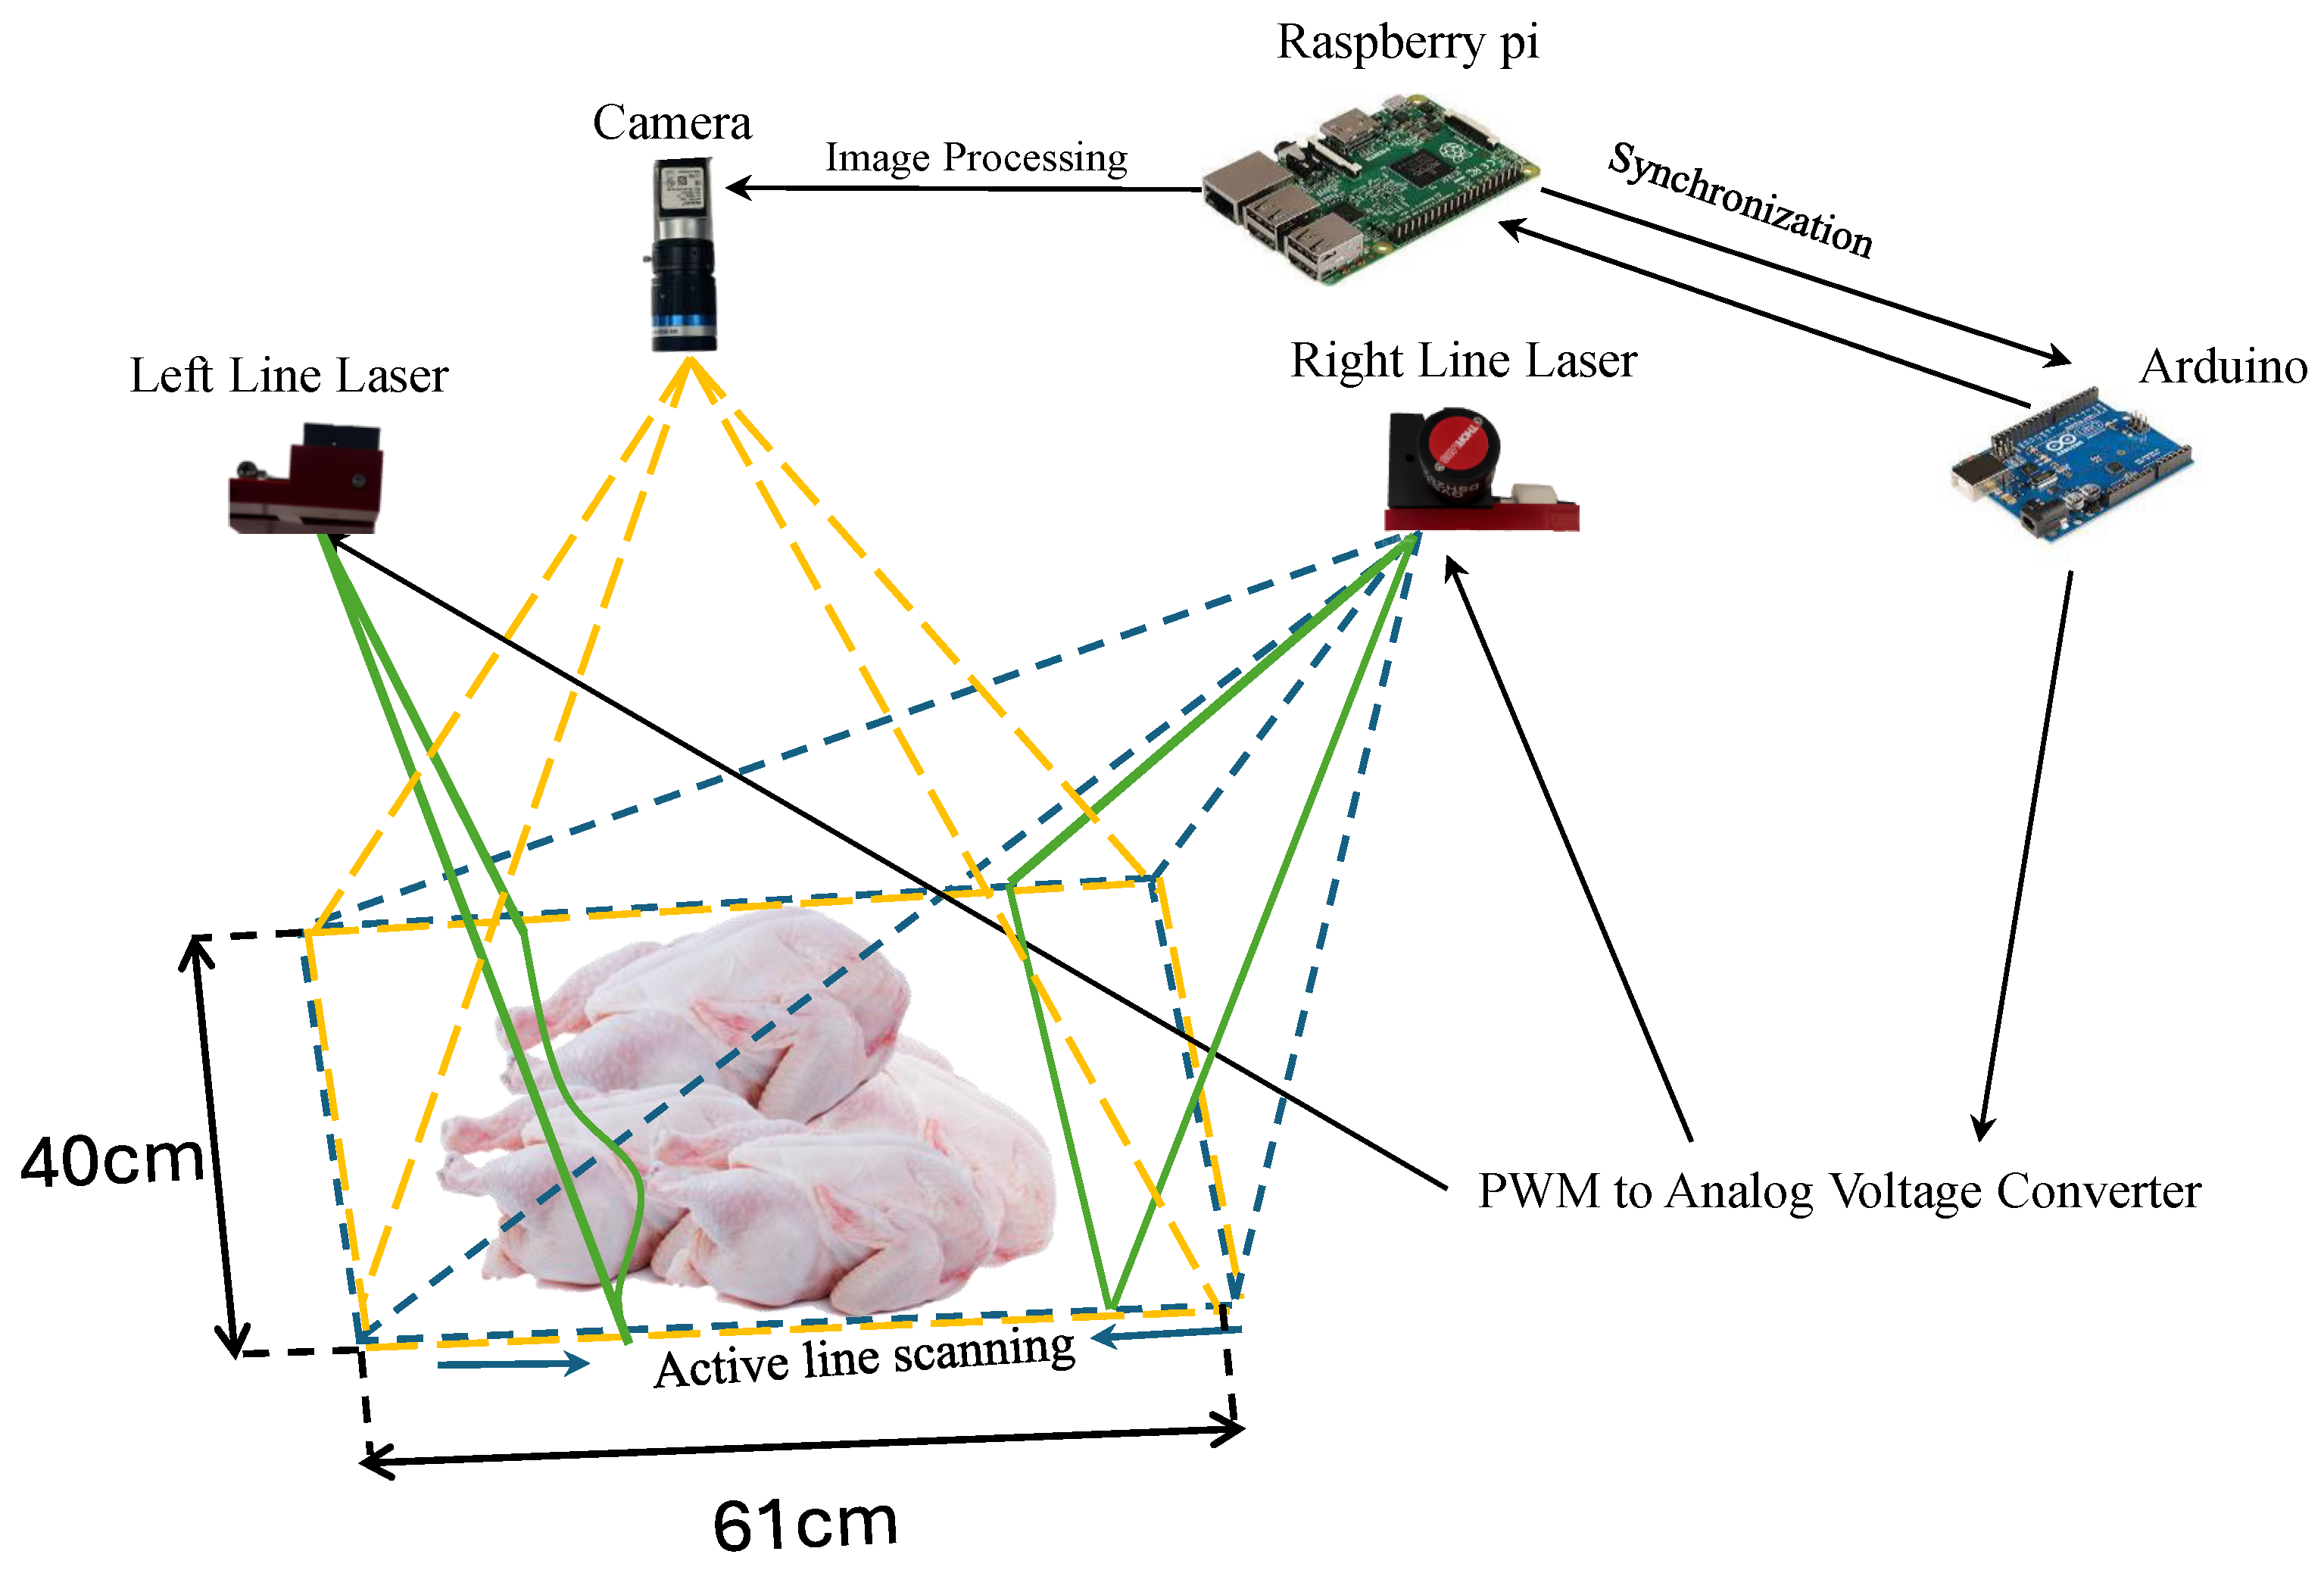
2.1. Dual-Line Laser Active Scanning: A Hardware and Software System for Height Estimation

In recent years, the integration of 3D vision systems has significantly advanced various applications in robotics and automation, particularly in the meat industry [43]. A popular choice for measuring depth perception is the use of stereo cameras, such as Intel’s real-sense series, which employ dual-camera setups to capture stereo images, and to use the stereo matching technique to calculate the depth information, enabling the identification of distances and spatial relationships within a scene [44]. Although these systems are known for their rapid depth acquisition capabilities, they often struggle with depth reconstruction accuracy, especially when depth accuracy is critical. In the context of poultry processing, particularly during the chicken rehanging stage, the accurate acquisition of depth data is critical to guiding the robot performing the rehanging operation [45]. Given that chickens are typically piled together after leaving the chiller, relying solely on color and stereo cameras does not provide the precise depth information needed for effective robotic manipulation. As shown in Figure 1, the depth accuracy with stereo Intel Realsense cameras is low, and the boundary between chickens is not well defined. To overcome this limitation, we implemented a novel active laser scanning-based depth vision reconstruction system. The traditional laser scanning system in the automation industry needs a conveyor belt to carry the target object in order to create the relative movement between the laser scanner and the object. Considering the stationary nature of the chickens in poultry operations and the absence of a conveyor belt during the rehang stage, the active laser scanning system developed aims to effectively capture depth data in this fixed environment. With the setup, we can achieve significantly higher accuracy in depth perception, which is crucial for distinguishing individual chicken carcasses piled together. This enhanced capability supports the automation of the rehanging process, ultimately improving operational efficiency and ensuring better handling of poultry products.
In this experimental setup (as shown in Figure 2), two one-axis controllable galvanometers (GVS011, Thorlabs, Inc, Newton, New Jersey) were utilized alongside a camera (Basler acA1920-40gc, 1920 × 1200 pixels, 40 fps, and GigE interface) for image captures, two green lasers (520 nm ± 10 nm, 50 mW, linewidth <3 mm at 1 m, and divergence angle 88° producing a 2 m line at 1 m distance; NaKu Technology Co., Ltd, Hangzhou, China), a Raspberry Pi3B for image acquisition and 3D reconstruction, and an Arduino Uno REV3 for laser control. The lasers and two galvanometers were affixed to an 80/20 slot structure. Two low-cost enclosures were manufactured using 3D printing techniques to secure the laser and galvanometer, as illustrated in Figure 2. The angle projection positions of two lasers were adjusted through a controllable analog voltage fed to the motors, which could be generated from Arduino via a pulse width modulation (PWM)-to-voltage converter, allowing for programmable laser manipulation with a scale of 0.5 V per degree of movement. The PWM-to-analog voltage converter translates a PWM range of 0% to 100% into an analog voltage range of 0 V to 10 V, which is within the working range of the galvanometer. An increase of 1% in the PWM results in a 0.1 V increment in the output voltage of the module that controls the galvanometer. The laser will scan across the entire field of view, covering approximately 61 cm horizontally and 40 cm vertically at a 1-m distance. Each time the Arduino increases the PWM output duty cycle by 1%, a signal is sent to the Raspberry Pi to activate the camera to capture the image of the green laser and process the resulting image to acquire the depth information at a specific location. The exposure time of the camera has been set to 2 milliseconds to minimize background noise and enhance the visualization of the laser line. Synchronization of the vision and control code was implemented through serial communication between the Arduino and Raspberry Pi via the Universal Asynchronous Receiver Transmitter (UART) ports. The flowchart of this procedure is depicted in Figure 3. The Raspberry Pi is connected to the Basler camera via an Ethernet cable. Upon completion of the image processing required for depth calculation, the Raspberry Pi sends a signal to the Arduino to advance the laser by one step. Compared to the previous study using a National Instrument (NI) data acquisition board for mirror control [38,39], this experimental hardware setup is more cost-effective while still maintaining the necessary functionality for 3D vision reconstruction in poultry processing applications.
As shown in Figure 4, the image processing for depth reconstruction involves multiple steps. One of the key steps is to capture the pixel coordinates, (u,v), of the laser line, where u represents the x-coordinate, and v represents the y-coordinate of a pixel in the image. Specifically, these coordinates are pixel coordinates of both the baseline and object pixels. To obtain the (u,v) of the laser pixels, a binary image is created using manually defined RGB thresholds under the preset exposure time. The morphological closing method is applied to the binary image to fill any gaps present in the laser line. Once the binary line segmentation image is accurately generated, the central pixels of the laser line are captured as the (u,v) coordinates of the laser line.

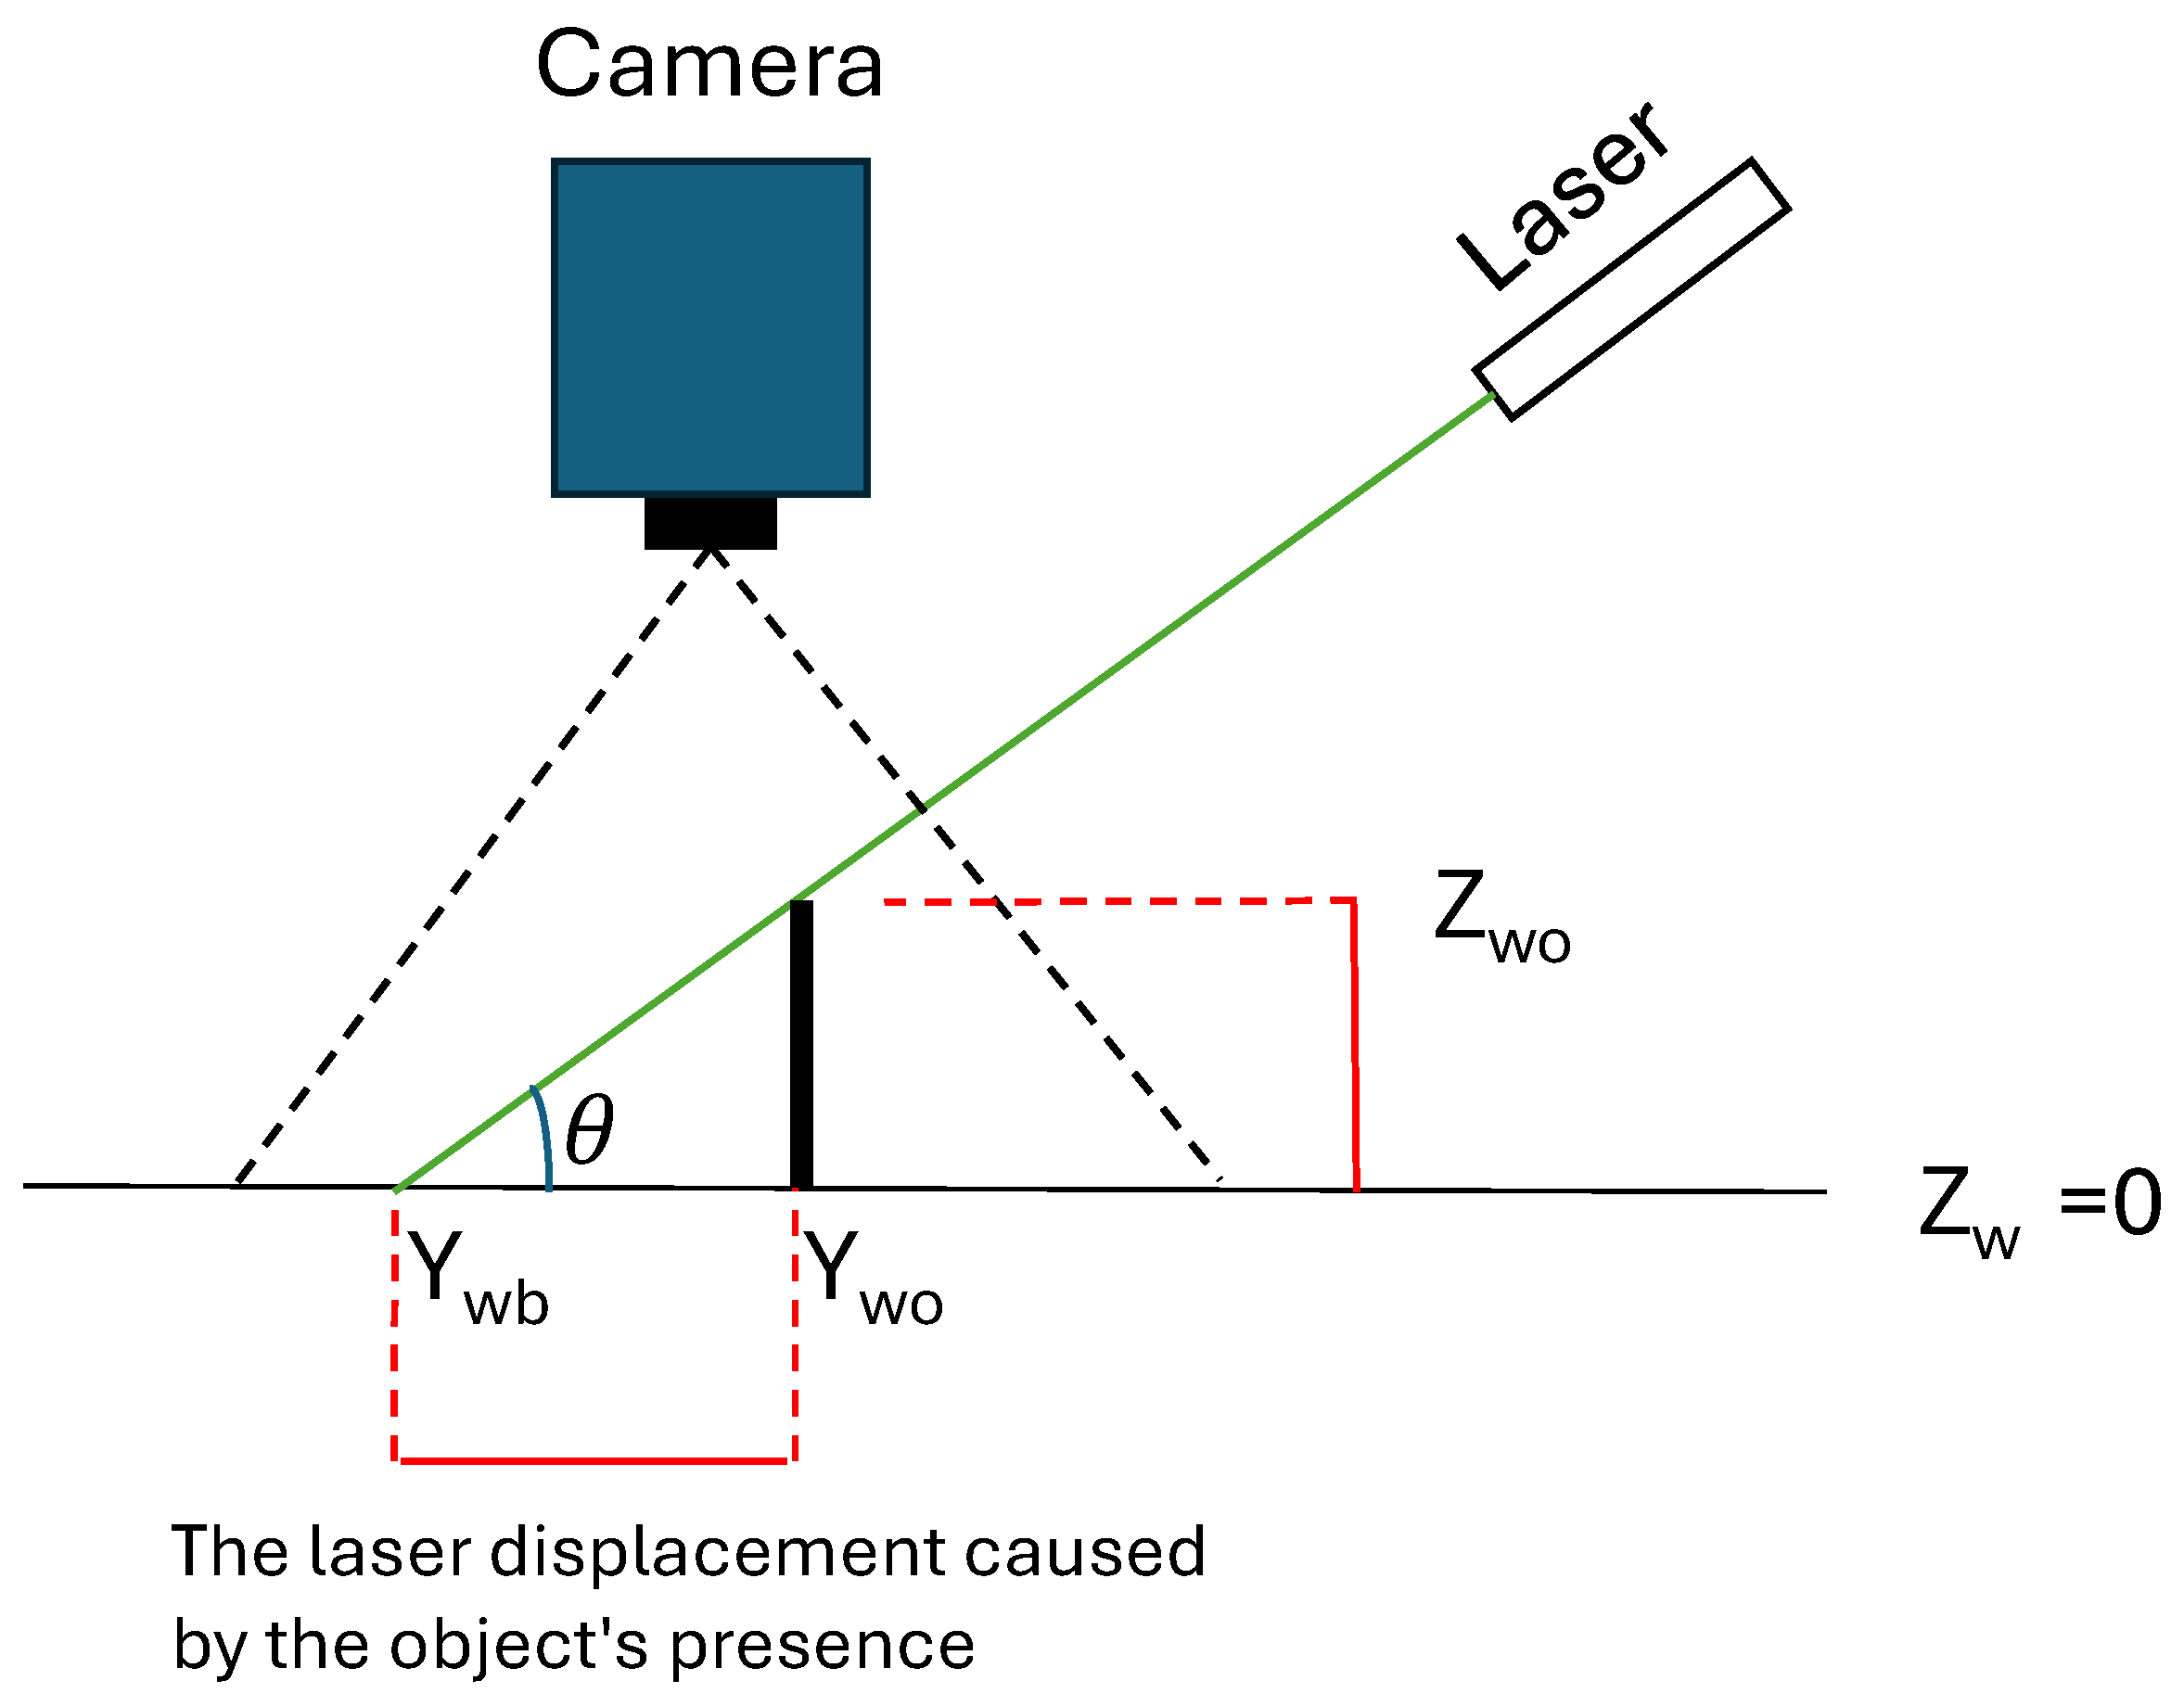
2.2. Optical Triangulation for Object Height Estimation

The developed 3D range scanning imaging system was founded on the principles of optical triangulation. As shown in Figure 5, the height of an object can be calculated via geometry equations, as shown in Equation (1). When an object obstructs the path of the laser line, a displacement occurs in the projected laser line compared to its position in the absence of the object. When no object is present, the position of the laser is referred to as, Y w b , (baseline), while the position when an object is present is designated as, Y w o , (object pixel). By determining the shift between the baseline and object pixels, ( Y w b Y w o ) , and knowing the laser angle, θ , (the angle between the laser line and the ground, where ( 0 θ π ), it is able to calculate the height of the object, Z _ w _ o , using the following equation. In the experiment, θ could be calculated during the calibration stage by scanning objects of known height.
Z _ w _ o = ( Y _ w b Y _ w o ) × tan ( θ )
Y w b and Y w o are world coordinates of the pixels that are found from (u,v) of the laser pixels and from utilizing the camera calibration formulas [38,39]. Details of the camera calibration process are provided in the Supplementary Materials.
After Y w b and Y w o had been calculated using pixel locations, Z w o could be calculated based on Equation (1).
Z w o = 6.16 × 10 1 · ( u b u o ) 1 tan θ 4.46 × 10 1 + 4.7 × 10 3 · u o 1.16 × 10 6 · v o
In which u b represents the x-coordinate of the baseline pixel, and v b represents the y-coordinate of the baseline pixel in the image. Similarly, u o denotes the x-coordinate of the object pixel, while v o represents the y-coordinate of the laser pixel when an object is present under the laser.
The laser depth resolution can be derived by Equation (3).
depth resolution = z w o u b u 0 6.16 × 10 1 1 tan θ 4.46 × 10 1 + 4.7 × 10 3 · u 0 1.16 × 10 6 · v 0

2.2.1. Baseline Position Collection of Laser Line

In this experimental laser scanning system, the PWM duty cycle was utilized to adjust the laser position, allowing precise modifications to the baseline. With every change in the PWM duty cycle, Arduino sends a signal to the Raspberry Pi to capture an image to record the current position of the laser using the aforementioned image processing method. Subsequently, the Raspberry Pi transmits a serial signal back to the Arduino, instructing it to reposition the laser to the next baseline. This cycle is repeated continuously until all designated baselines are established. This approach made our hardware setup significantly more cost-effective than currently available laser active scanning machine vision systems. Figure 4 shows an example of laser projection images of a specific PWM output.

2.2.2. Laser Angle Calibration

In the laser scanning system, each PWM duty cycle corresponds to a specific laser angle θ relative to the ground. To calibrate the angle, a manufactured calibration phantom with a known height ranging from 50 mm to 150 mm with the step of 50 mm was utilized for the calibration process to establish the relationship between θ and PWM. By the known height of the calibration phantom and the baseline coordinates, ( u b , v b ) , associated with the PWM duty cycle, the laser projection angle, θ , for each laser position was estimated using Equation (4). This procedure was conducted for all PWM duty cycles. A linear regression model using the ordinary least squares (OLS) method was applied to remove angle estimation noise.
cot θ 6.16 × 10 1 · ( u b u o ) z w o 4.46 × 10 1 + 4.47 × 10 3 · u o + 1.16 × 10 6 · v o

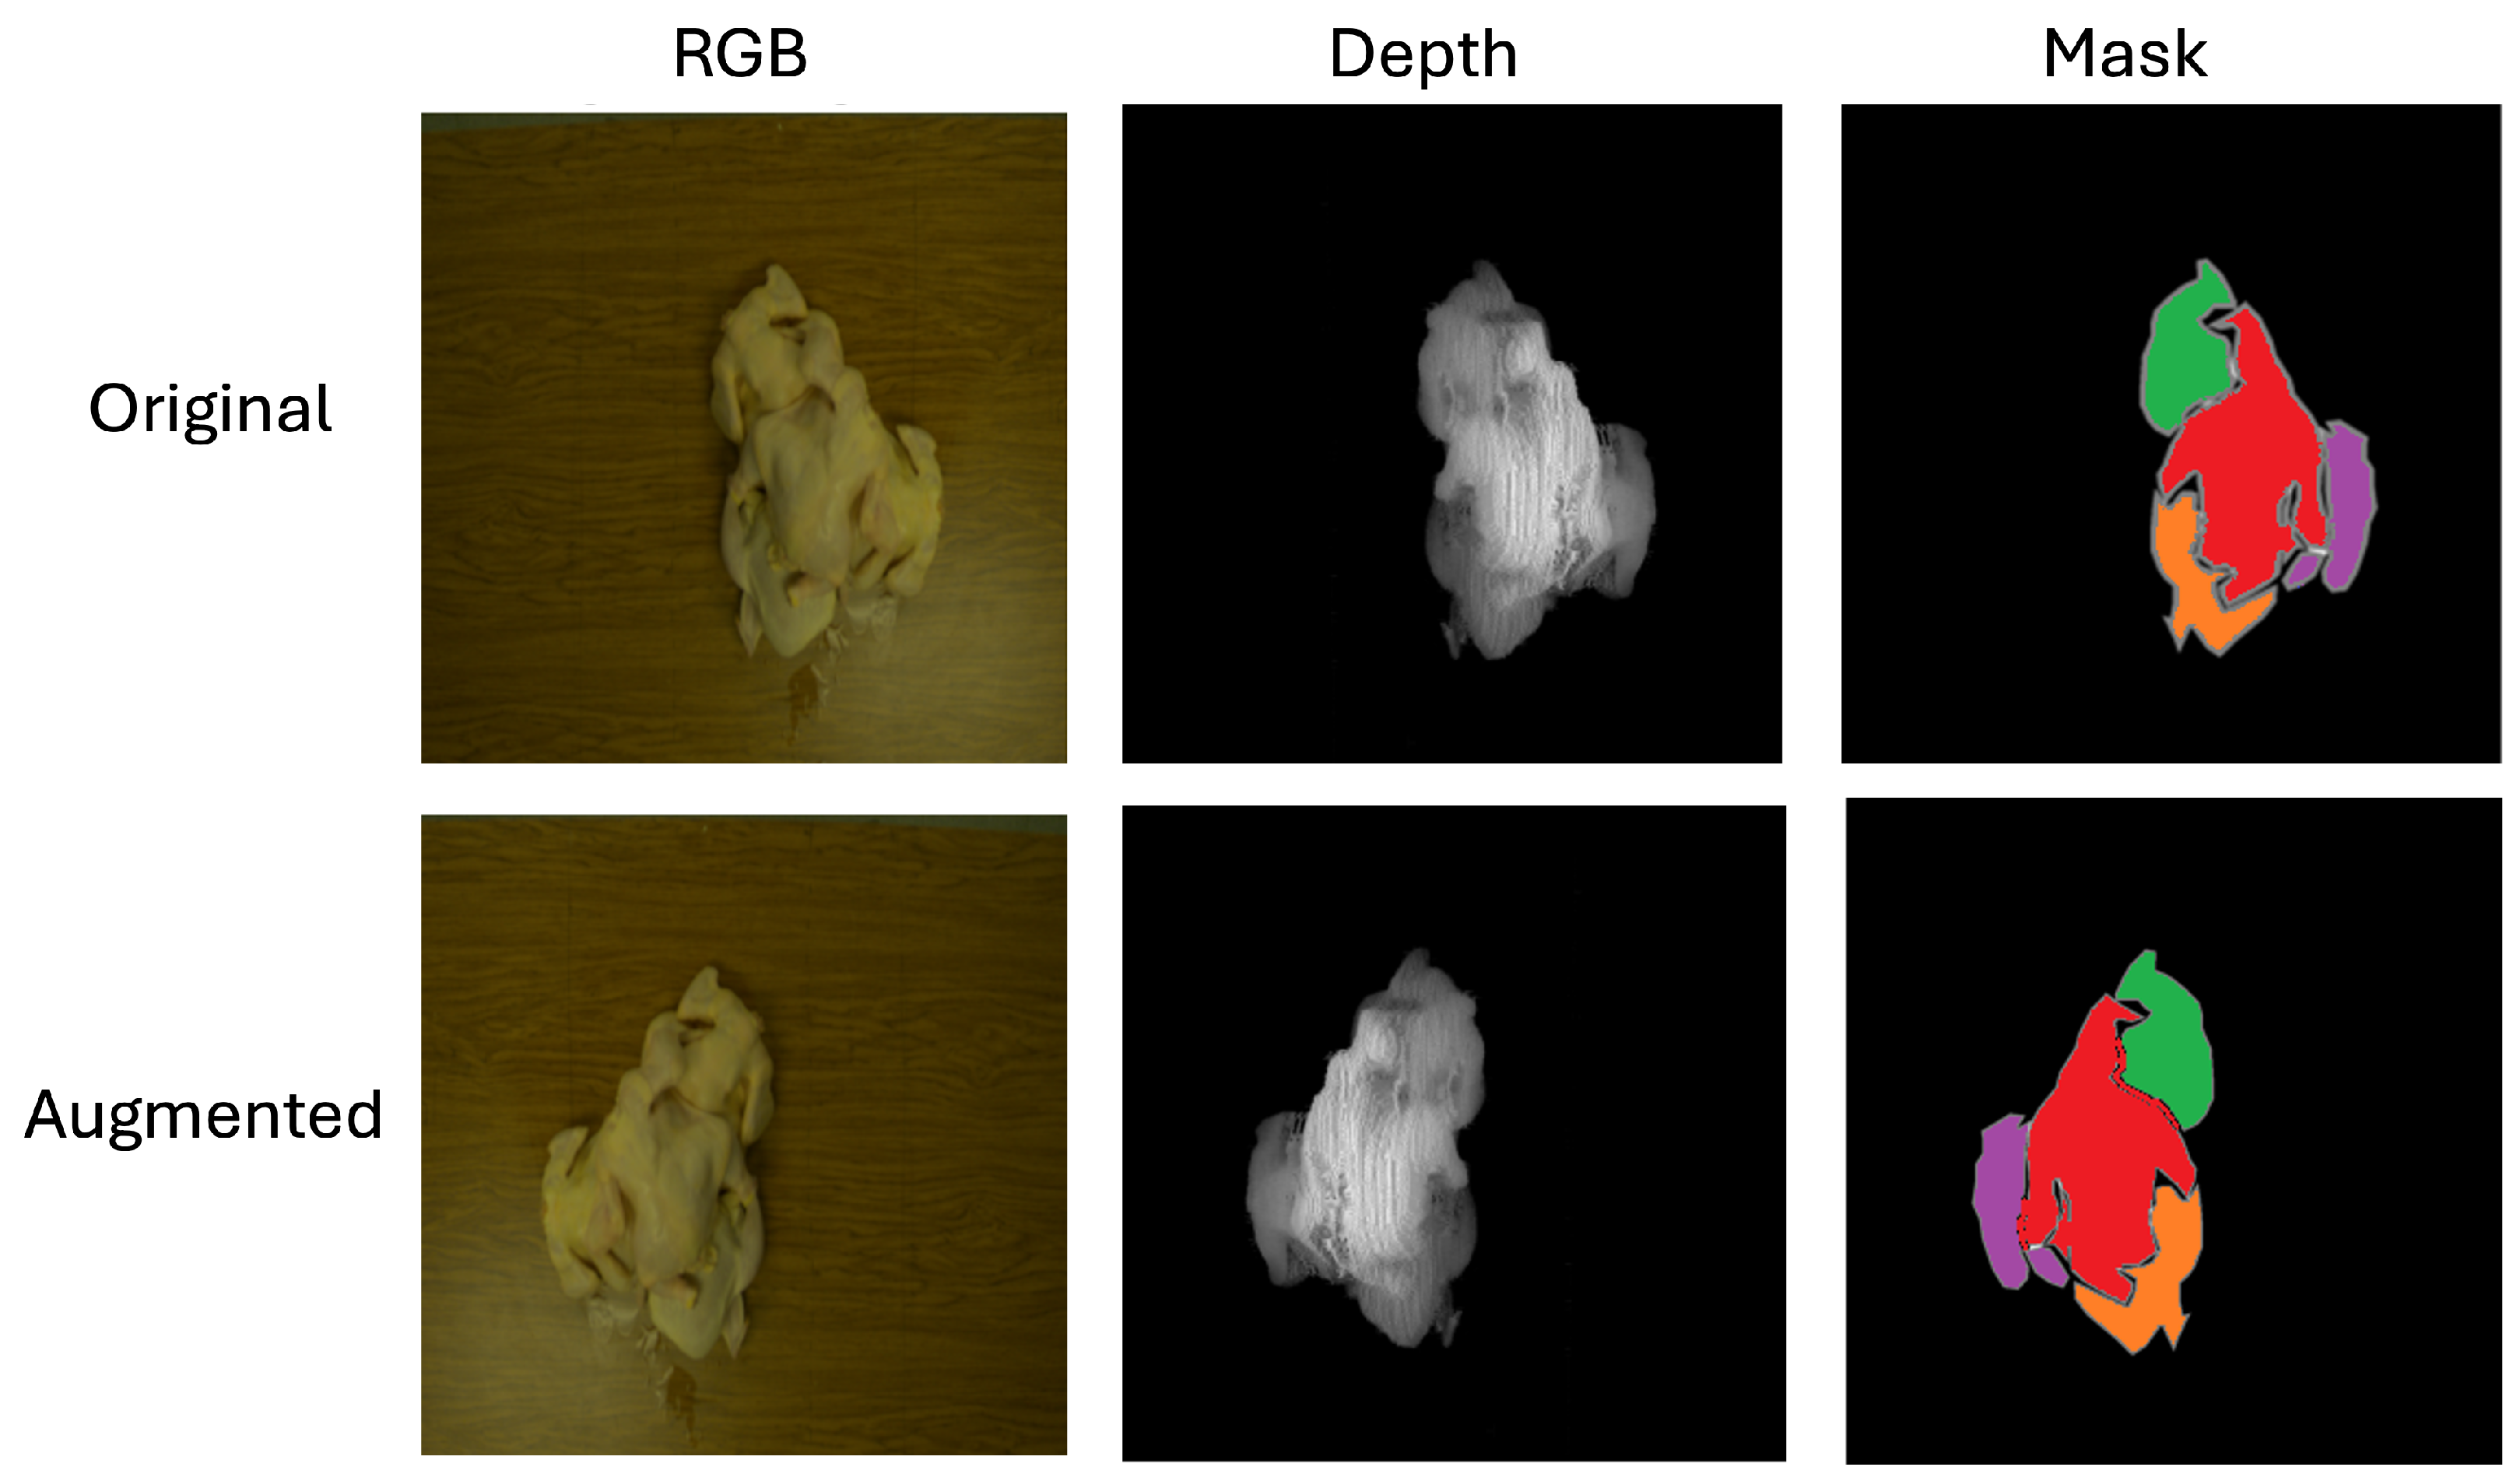
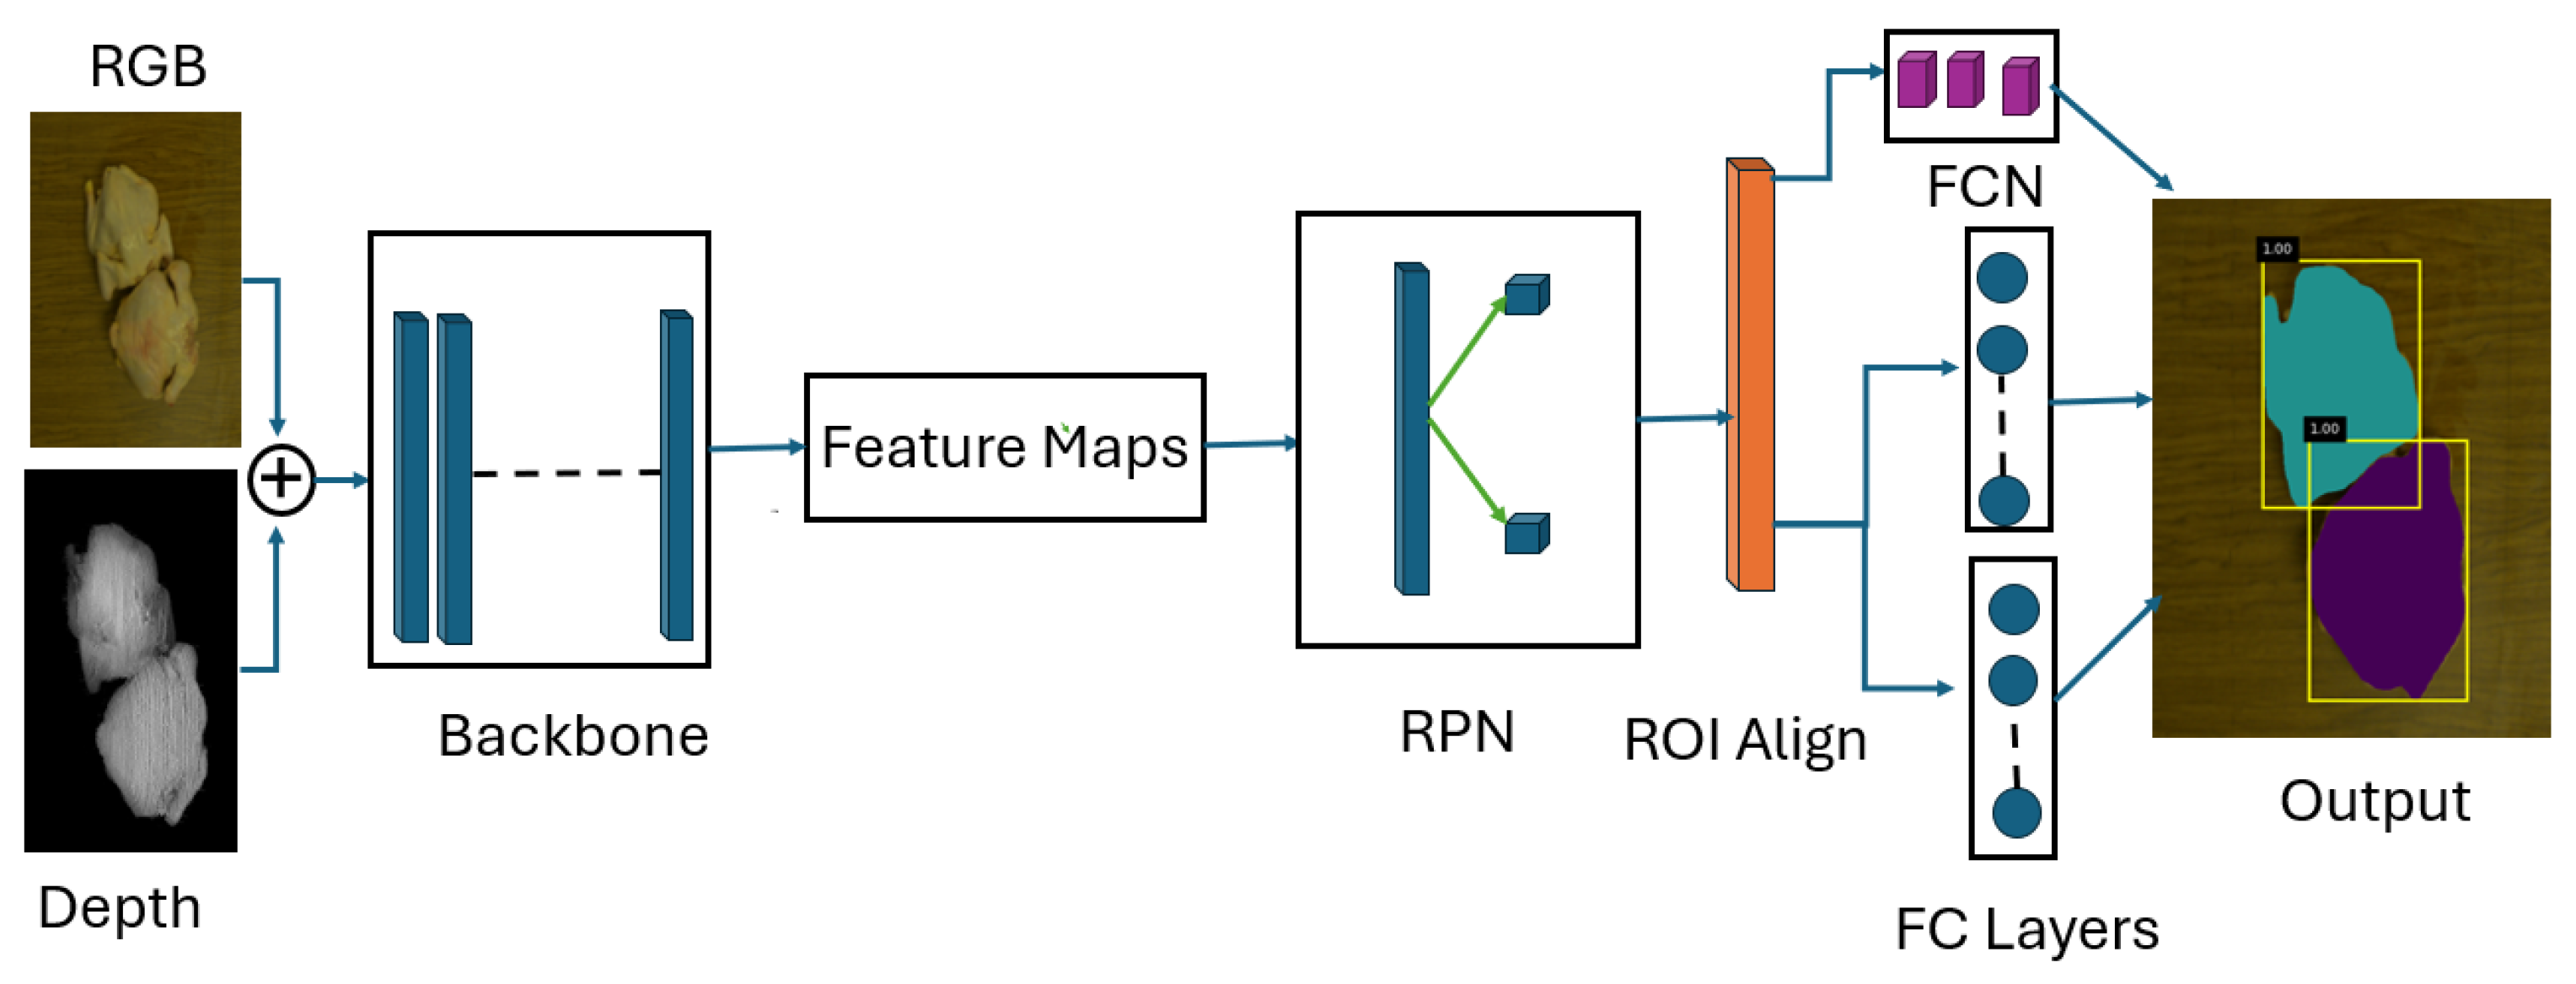
2.3. Instance Segmentation of Chicken Carcass

Instance segmentation is a critical task in computer vision that involves precisely identifying and segmenting individual objects in an image by assigning a unique pixel-level mask to each instance [46]. Instance segmentation focuses on delineating the exact boundaries of each object, making it invaluable for applications requiring detailed spatial understanding. This approach enables models to detect multiple instances of the same category, each with its distinct mask.
The process of instance segmentation typically involves advanced algorithms that leverage deep learning techniques to achieve high levels of accuracy and efficiency. Modern methods are designed to identify and classify objects while simultaneously generating detailed masks that outline their shapes. These masks help extract intricate details about object size, position, and orientation, which will be critical in directing robots in the poultry rehang operation [47].
Recent advancements in instance segmentation have led to the development of several powerful models that offer enhanced segmentation accuracy and efficiency. One such model is Mask R-CNN, a significant breakthrough that generates precise object masks along with bounding boxes, employing feature extraction from convolutional neural network (CNN) backbones [46]. Mask R-CNN’s architecture enables it to capture detailed spatial information, making it particularly effective for applications requiring both detection and segmentation of objects. In contrast, YOLO, initially designed for real-time object detection [42], has evolved in its later versions, such as YOLOv8, to also handle instance segmentation tasks. YOLOv8 incorporates an advanced feature extraction mechanism from its backbone to detect and segment objects with high precision. Similarly, the Segment Anything Model (SAM) has emerged as a cutting-edge large model for segmentation, leveraging transformer-based architectures for feature extraction [40]. SAM’s novel use of transformers enables it to process diverse input data and achieve state-of-the-art performance in segmentation tasks. In this study, first, YOLO, Mask R-CNN, and SAM were employed for the instance segmentation of chickens on RGB data. MaskRCNN achieves the best mAP performance across the models. Subsequently, depth information was incorporated alongside the RGB data, and Mask R-CNN was trained and tested using various backbones to assess the impact of input data and backbone structure on the final detection and segmentation results. For this study, we created a dataset consisting of 160 images of whole chicken carcasses, with the RGB data labeled for segmentation and the depth data collected using our custom dual-line laser scanning system. The data were collected over the span of a month to increase the dataset variety and the model generalization performance, and whole chicken carcasses were purchased from local grocery stores and used for image acquisition. For each image, three to five different chickens were randomly stacked together, arranged by their legs, wings, and chest to mimic the different stacking patterns observed in the real poultry industry. Efforts were made to maximize overlap between carcasses to better represent real-world conditions. To ensure a robust training process, the dataset was split into 70% for training, 20% for validation, and 10% for testing. Data augmentation techniques, including rotation and vertical and horizontal flips, were applied to expand the dataset five times, effectively increasing the variety of training samples. This augmentation ensured that the model could be generalized well to diverse scenarios. While the original dataset is relatively small, we made full use of the laser’s field of view (FOV) to capture a wide variety of stacking patterns and orientations within the constraints of the scanning system. Although data collection was time-consuming and required frequent replacement of chickens due to degradation, the dataset was carefully curated to ensure it accurately represented real-world conditions. As shown in Figure 6, one random sample from the dataset is demonstrated, showcasing the raw RGB image, depth image collected from the customized system, and the corresponding segmentation mask. The top row displays the original RGB image, depth image, and the ground truth mask, while the bottom row illustrates the corresponding images and masks after the random data augmentation, such as rotations and flips. This example highlights the variation introduced by the augmentation process, which helps to create a more diverse dataset for robust model training.
The network architecture consists of a backbone network, such as ResNet [48], which extracts feature maps from the input image. This is followed by a region proposal network (RPN) that generates candidate object proposals. For each proposal, the network predicts a bounding box and a mask for the object class. The mask prediction uses a fully convolutional network (FCN) that outputs a binary mask for each object instance, allowing for pixel-level segmentation.
The training process of mask R-CNN involves multiple loss functions, including the classification loss, which measures the accuracy of object classification, and the bounding box regression loss, which evaluates the accuracy of the predicted bounding box locations. Additionally, a mask loss is computed to assess the quality of the predicted masks against the ground truth, which is manually labeled using the LabelMe application. The combination of these losses enables Mask R-CNN to learn effectively, balancing the need for accurate object detection with precise segmentation capabilities. As shown in Figure 7, depth information was added to the RGB data to create RGB-D inputs. Both RGB and depth data were resized to 1024 × 1024 dimensions prior to the training process, and concatenated to form an input with dimensions 1024 × 1024 × 4. The first layer of the backbone network was modified to accommodate the four-channel input.
In Mask R-CNN, the backbone network is crucial for extracting high-level features from the input images, which are essential for both object detection and instance segmentation tasks. The backbone typically consists of established convolutional neural network (CNN) architectures such as ResNet, VGG [49], or more efficient alternatives such as MobileNet [50] and EfficientNet [51]. Each of these architectures is designed to capture and learn hierarchical patterns in images, providing a robust set of features that can be utilized in downstream tasks. For example, deeper networks such as ResNet-101 can capture complex patterns and finer details due to their increased depth, while lightweight models like MobileNet are optimized for speed and efficiency, making them suitable for deployment in resource-constrained environments [48,49,51].
In our study, data from both the laser scanning system (depth map) and RGB camera (RGB image) were incorporated into the network for feature extraction. Compared to limited information offered via sole RGB images, the additional depth information can offer more comprehensive 3D representations of the objects within the scene and lead to improved accuracy in detection and segmentation tasks.

3. Results

The initial results begin with a calibration and accuracy assessment of the laser system. In the laser calibration process, the relationship between the mirror input voltage and the corresponding angular displacement, θ , (theta) was established. Following the calibration, the accuracy of the depth maps generated via the right and left lasers was evaluated independently, quantifying their precision in capturing depth information. The individual heatmaps were merged from the right and left lasers to create a single combined depth map that accounts for all occlusions. Using a standardized phantom, this final heatmap was compared with the depth map generated using a real-sense camera to validate its accuracy and completeness.
In the second part of this section, the instance segmentation results of the YOLOv8, Mask R-CNN, and SAM models using RGB data as input are presented, highlighting the challenges associated with this task. All models demonstrated limited success in providing accurate segmentation with RGB input only. Moreover, the performance of the Mask R-CNN model with RGB and RGB-D inputs using various backbone architectures was assessed. To evaluate segmentation quality, a new metric called the Center Offset was utilized, which measures the distance between the predicted mask center and the ground truth mask center. This metric is particularly relevant for our application, as precise center alignment ensures that the robot can accurately grasp chicken carcasses from their middle point. The results demonstrated the superior performance of RGB-D data compared to RGB data alone as input to the instance segmentation model, as well as the impact of different backbones on segmentation accuracy and center alignment. The following subsections provide detailed analyses of these findings.

3.1. The Performance Evaluation of Active Laser Scanning System

The performance evaluation of the active laser scanning system is essential to validate its precision and reliability for applications such as object detection using RGB-D data [52]. This evaluation focuses on two critical aspects: laser calibration, which determines the relationship between the input voltage applied to the mirror and the resulting laser angle ( θ ), and system accuracy, which assesses the laser’s capability of measuring predefined physical features accurately. Laser calibration involved analyzing and defining the relationship between the input voltage of the laser-scanning mirror and the laser angle relative to the horizon. This relationship is crucial for ensuring correct laser alignment, enabling consistent and precise scanning results. A series of experiments was conducted to map this relationship and optimize the system’s operational parameters. The accuracy of the system is pivotal in determining how effectively the laser scanning system measures the physical dimensions of target objects. To evaluate the accuracy, a standard height step with dimensions of 50, 100, and 150 mm was used as a reference. The measured heights were compared to the actual dimensions of the step and validated against measurements from a commercial Intel real-sense camera.
The following subsections explore the evaluation of system calibration and accuracy. These analyses provide a detailed understanding of the active laser scanning system’s performance and highlight its capabilities in real-world applications.

3.1.1. Laser Calibration Performance

The laser calibration process aimed to establish a precise relationship between the PWM duty cycle and the laser projection angle ( θ ). The laser angle was initially approximately 90°, decreasing to 58° at the maximum PWM duty cycle and resulting in an angular range of 32°. Figure 8 illustrates this strong linear relationship, characterized by a coefficient of determination ( R 2 ) of 0.9835.
In our setup, the mirrors controlling the laser scanning system are actuated through a PWM-to-voltage converter. The converter outputs a voltage ranging from 0 to 10 V, corresponding to PWM duty cycles from 0% to 100%. The mirrors exhibit a movement response of 0.5 V per degree, translating the voltage to angular displacement.
To determine the laser projection angle ( θ ) in the actual experiment setup for further height estimation, we utilized Equation (4) with an object with known height, which requires the baseline, the object pixel positions, and their differences. This process was repeated systematically for each PWM duty cycle across the range between 0% and 100%. For every PWM value, the converter generated a corresponding voltage, and the laser angle was calculated. The object used for calibration was a 50 mm cube that was 3D-printed to ensure precise and consistent dimensions. After this object was placed within the scanning range, the known height provided a reliable reference for calculating the laser angle during the calibration process.

3.1.2. System Depth Estimation Accuracy

To evaluate the accuracy of the lasers, we fabricated a multi-step object using 3D printing, with heights ranging from 50 mm to 150 mm in increments of 50 mm. The height of each step was measured using our active laser scanning-based depth imaging system. The actual and measured heights of each step in one meter of imaging distance are presented in Table 1. Additionally, the same process was conducted using the Intel Real-sense D435 camera to compare the accuracy of our laser setup with that of the Real-sense camera.
Figure 9 illustrates the color image depth reconstruction for the left laser and the right laser, together with their final integrated depth map. During the preliminary data collection, data losses occurred using a single laser because the laser beam sensed obstructions, which led to the decision to incorporate data from two lasers. Through the combination of the 3D depth maps from both lasers, the impact of obstructions on data loss was minimized.

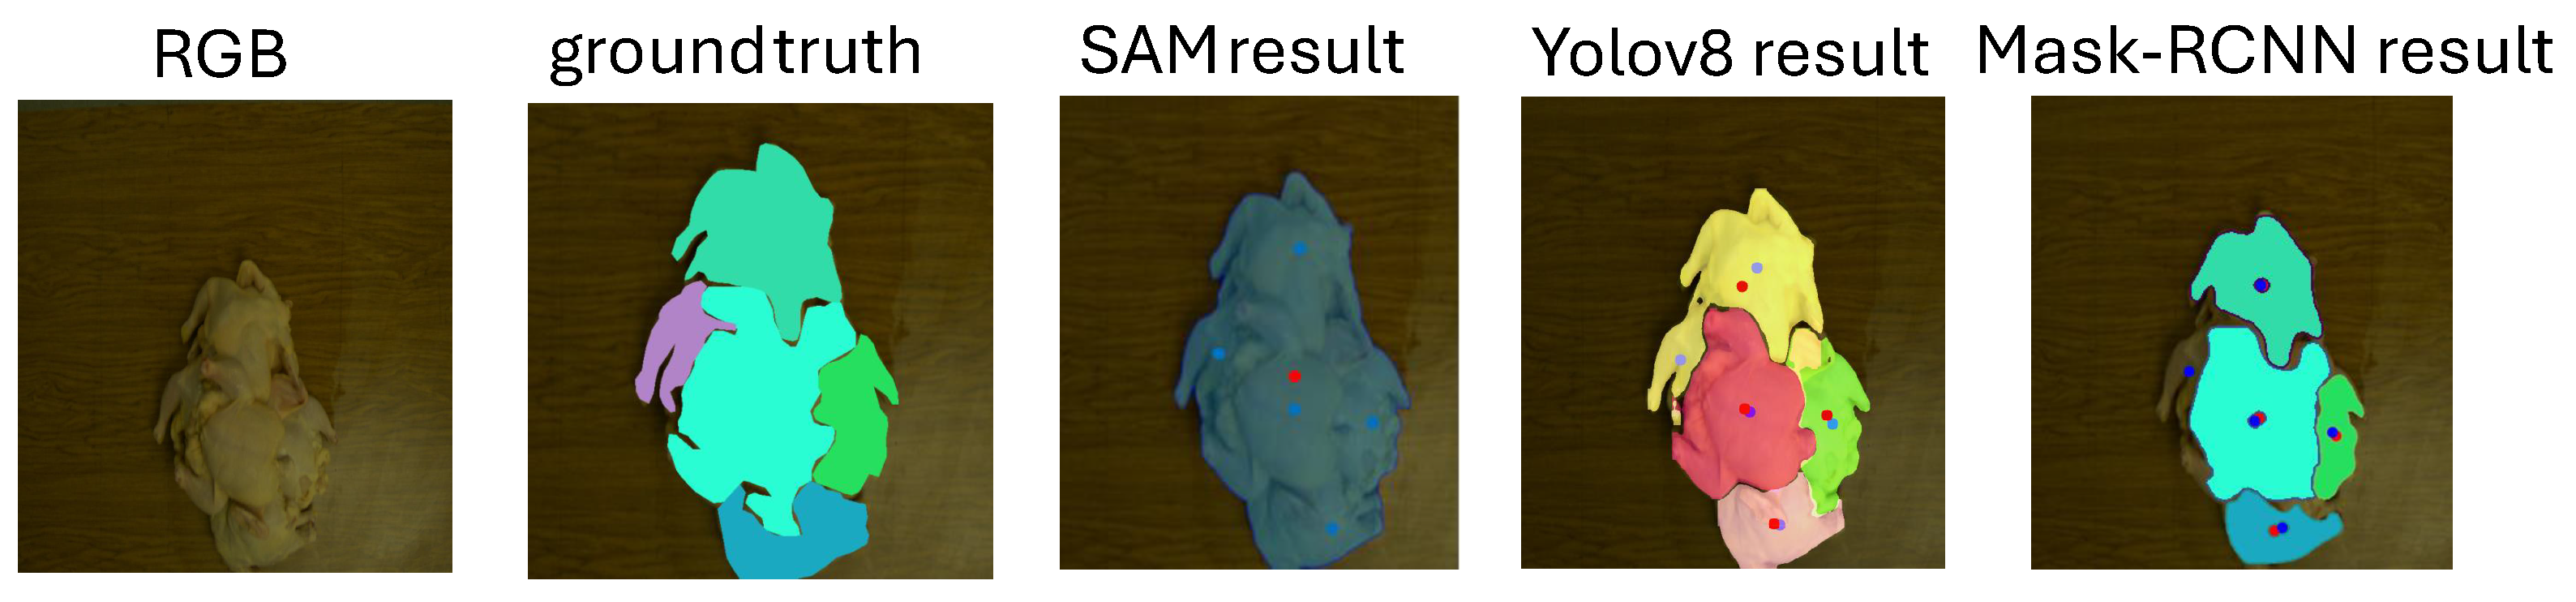
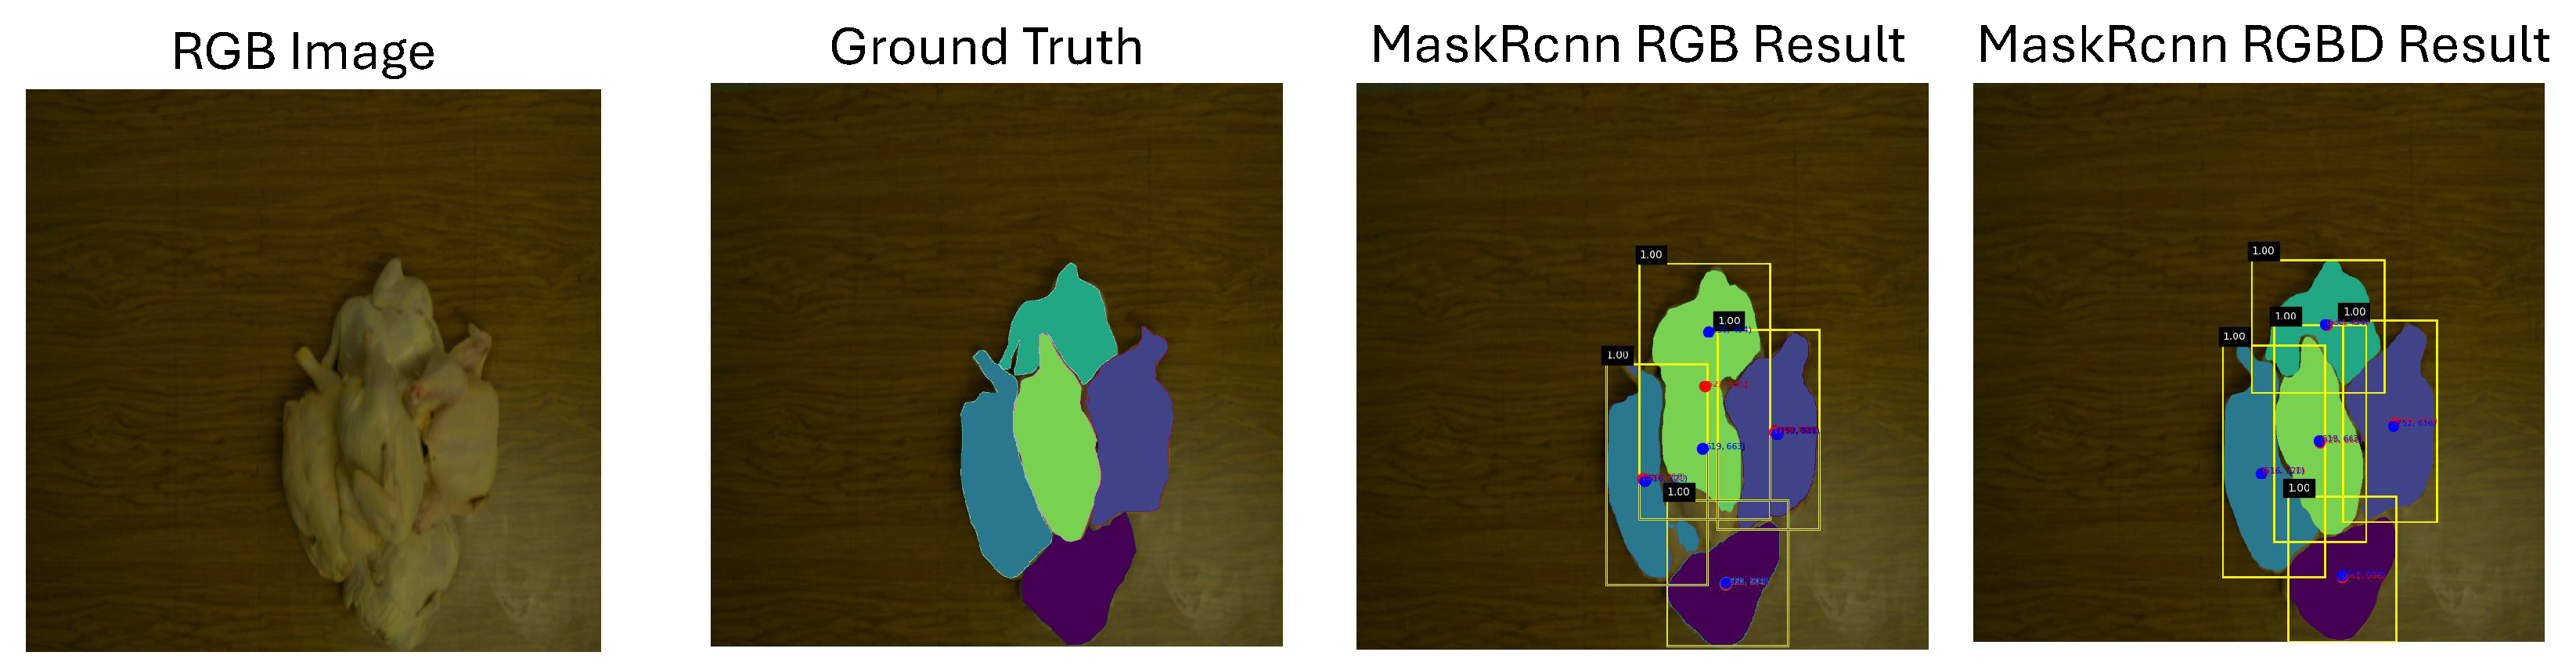
3.2. Performance of Chicken Instance Segmentation

In the experiment, first, the performance of YOLOv8, Mask R-CNN, and SAM was evaluated using RGB data as the training input to highlight the challenges and inaccuracies in segmentation due to the difficulty of segmenting chickens in poultry processing. As shown in Figure 10, all models struggled to provide accurate segmentation of the carcasses, particularly when they were piled together. Then, the RGB and corresponding depth data obtained from the customized active laser scanning system were concatenated and used to train the Mask R-CNN model [46], which achieves the best mAP performance across the three common instance segmentation models. During the Mask-RCNN RGB training, as shown in Figure 7, initially, the model was trained on RGB data alone for 400 epochs, yielding optimal model weights. These weights were then subsequently used to initialize the Mask R-CNN model for RGB-D data training, where various backbones were evaluated.
For the backbone architectures, ResNet-50, ResNet-101, VGG16, and EfficientNet-B0 were selected. ResNet-50 and ResNet-101 were included due to their widespread use in Mask R-CNN and their robust performance on object detection and segmentation tasks. VGG16 was chosen to analyze the performance of an older, simpler architecture and provide a baseline for comparison against more advanced models. EfficientNet-B0 was selected for its promising performance in balancing accuracy and computational efficiency, particularly for RGB-D data.
The implementation was conducted using Python 3.9, with PyTorch Version 2.4.1 as the deep learning framework. CUDA version 11.4 was employed for GPU acceleration, and the experiments were executed on the high-performance computing (HPC) cluster at the University of Arkansas, equipped with NVIDIA A100 GPUs and 64 CPU cores for preprocessing and data augmentation. The results indicate that incorporating depth data improved the mean average precision (mAP) and intersection over union thresholds (IoU). mAP is a commonly used metric in object detection and instance segmentation tasks that calculates the average precision across all classes. IoU thresholds (0.5:0.95) are a measure of the overlap between the predicted mask and the ground truth mask, defined as follows:
IoU = Area of Overlap Area of Union ·
where the area of overlap is the intersection of the predicted and ground truth masks, and the area of union is their combined region. IoU thresholds specify the minimum required overlap for a prediction to be considered correct. The range 0.5:0.95 denotes that mAP is averaged over multiple IoU thresholds from 0.5 to 0.95 in increments of 0.05, providing a comprehensive evaluation of model performance across varying levels of overlap tolerance. In this study, the inclusion of depth data resulted in enhanced segmentation accuracy, with ResNet-50 achieving the highest mAP among the evaluated backbones, highlighting its effectiveness in leveraging RGB-D data for chicken instance segmentation. Additionally, a customized metric was introduced to assess the accuracy of mask center predictions, which is crucial for the downstream robotics-based chicken re-hanging process. This metric calculates the offset distance between the ground truth mask center and the predicted mask center, providing a quantitative measure of alignment accuracy. The offset distance is defined as follows:
D = ( x gt x pred ) 2 + ( y gt y pred ) 2 ·
where ( x gt , y gt ) represents the coordinates of the ground truth mask center and ( x pred , y pred ) represents the coordinates of the predicted mask center. A lower value of D indicates better alignment between the prediction and the ground truth. The mAP and center offset for the YOLOv8 and SAM models were evaluated. SAM achieved a mAP of 0.426 and a center offset of 28.06, while YOLO-v8 obtained a mAP of 0.375 and a center offset of 12.43 pixels. The relatively high center offset indicates that both models struggled with accurate instance segmentation, highlighting the challenges of segmentation performance with RGB data alone. Table 2 presents a comparison of mAP and center offset metrics for Mask R-CNN with RGB and RGB-D inputs across different backbones.
The MaskRCNN model achieves the best mAP compared to YOLOv8 and SAM. The ResNet50 backbone demonstrated superior performance in generating accurate segmentation maps and minimizing the offset in mask centers. This performance highlights its capability of effectively learning and segmenting overlapping chickens within the dataset, especially when augmented with the depth channel data provided via the laser system. As shown in Figure 11, the RGB image, ground truth, Mask R-CNN output with RGB data and Mask R-CNN output with RGB-D data using the ResNet50 backbone are compared. The results indicate that segmentation using RGB data alone is significantly less accurate, whereas the incorporation of RGB-D data achieves notably improved segmentation performance, especially when extensive overlapping happens.

4. Discussion

The automation of the chicken rehanging process offers significant potential to improve efficiency and reduce health risks for laborers exposed to repetitive manual work in poultry processing facilities. This research focused on solving the critical vision problem required for automating this process, demonstrating the value of integrating depth sensing and advanced segmentation techniques to address the inherent challenges. Initial experiments using instance segmentation models on RGB data, YOLOv8, SAM, and Mask-RCNN were trained and tested on our dataset, and they struggled to perform effectively when the chickens were piled together. To address this, we incorporated depth data from a customized, cost-effective, dual-line laser scanning system into the generic instance segmentation Mask R-CNN framework. This modification resulted in a substantial improvement in object detection accuracy. To further evaluate the performance of the segmentation models, we introduced a novel metric, Center Offset, which quantifies the distance between the mask center in the ground truth (GT) and the predicted mask center. This metric is critical for assessing the precision of object localization, especially for reliable and consistent robotic handling of chicken carcasses.
The impact of various backbone architectures on the performance of the Mask R-CNN model was also explored. Among the tested backbones, ResNet50 RGB-D achieved the best results, delivering a 4.9% increase in mAP and reducing the Center Offset from 22.09 pixels to 8.09 pixels compared to a sole RGB input. These results highlight the importance of selecting an appropriate backbone to achieve robust segmentation and precise mask center predictions, which are crucial for guiding future robotic operations. The incorporation of depth data further underscores its value in enhancing both segmentation accuracy and object localization precision, enabling more effective robotic handling in complex scenarios.
Despite these advancements, several challenges still remain. While the RGB-D model significantly outperformed the RGB-only model, its reliance on depth data introduces practical limitations. Collecting depth data using the dual-line laser scanning system is a time-consuming process due to the limited movement speed of the lasers. This limitation arises from the time-consuming communication process between the control system and the vision system, which restricts the overall scanning rate. This limitation affects both dataset creation and real-world applications. The time required to scan and gather depth information could delay mask predictions and reduce the efficiency of the system. Future work could focus on optimizing the laser system to enable faster data acquisition and real-time depth sensing. To address this challenge, the final system in the future study will move away from reliance on lasers. Instead, a stereo matching-based vision system will be implemented to achieve faster and real-time imaging. The current setup, as a low-cost option, will be used to collect the ground truth depth to train the deep learning-based stereo-matching algorithm, enabling the generation of accurate depth maps in real time. The camera of the current setup will also be shared with one camera in the stereo vision system to avoid the registration of RGB and depth images during the dataset collection stage. This shift to stereo-based depth sensing will significantly enhance processing speed and improve the practicality of the system for deployment in poultry processing environments. Additionally, to accelerate dataset collection and improve efficiency, we aim to incorporate semi-supervised learning techniques to expand the dataset for the final vision system. Specifically, we will utilize a subset of available RGBD data to train the model, allowing it to estimate the depth data for other RGB images. This approach will help overcome the challenges posed by the time-consuming process of depth collection using lasers. By leveraging this semi-supervised strategy, we can facilitate scalable dataset growth while reducing the need for extensive manual data collection, ultimately enhancing the robustness of the model. Additionally, while ResNet50 provided excellent segmentation performance, its computational demands may pose challenges for real-time applications on resource-constrained hardware. Future experiments exploring lightweight architectures or applying model compression techniques could further enhance the feasibility of real-time deployment.

5. Conclusions

In conclusion, this study has presented the development procedures of a customized low-cost, dual-line laser scanning system, which can provide accurate and reliable depth data for stacked chicken carcasses. The generated depth data can significantly enhance carcasses segmentation and localization challenges in automating the chicken rehanging process. Despite the recent success of instance segmentation models, including large models, these models struggled to achieve satisfactory segmentation performance when chickens were piled together. The addition of accurate depth information from the customized laser scanning system was essential in enhancing the feature extraction of the Mask R-CNN semantic segmentation model, leading to improved segmentation and detection results in complex scenarios. The outcomes are expected to benefit future robotic arm control. Even though the customized vision system is not designed for online usage, it can offer a cost-effective workflow to collect accurate depth data, which could also be expanded to other meat processing sectors. Further advancements in depth sensing, real-time processing, and adaptive algorithms will be essential to fully achieve the goal of scalable and practical poultry processing automation.

Supplementary Materials

The following supporting information can be downloaded at: https://www.mdpi.com/article/10.3390/agriengineering7030077/s1, Camera Calibration.

Author Contributions

Conceptualization, P.S. and D.W.; methodology, P.S. and D.W.; software, P.S.; validation, P.S., D.W. and S.M.; formal analysis, P.S. and D.W.; investigation, P.S.; resources, P.S. and D.W.; data curation, S.M., C.K.R.P. and A.D.; writing—original draft preparation, P.S. and D.W.; writing—review and editing, W.S. and P.C.; visualization, P.S.; supervision, W.S., Y.S. and D.W.; project administration, W.S., Y.S. and D.W.; funding acquisition, D.W. All authors have read and agreed to the published version of the manuscript.

Funding

This work was supported by awards nos. 2023-67021-39072, 2023-67022-39074, and 2023-67022-39075 from the U.S. Department of Agriculture (USDA)’s National Institute of Food and Agriculture (NIFA) in collaboration with the National Science Foundation (NSF) through the National Robotics Initiative (NRI) 3.0.

Institutional Review Board Statement

Not applicable.

Informed Consent Statement

Not applicable.

Data Availability Statement

The raw data supporting the conclusions of this article will be made available by the authors on request. No public involvement in any aspect of this research.

Conflicts of Interest

The authors declare no conflicts of interest.

References

  1. United States Department of Agriculture (USDA). Livestock and Poultry: World Markets and Trade. 2025. Available online: https://www.fas.usda.gov/sites/default/files/2024-10/Livestock_poultry.pdf (accessed on 16 January 2025).
  2. Kalhor, T.; Rajabipour, A.; Akram, A.; Sharifi, M. Environmental impact assessment of chicken meat production using life cycle assessment. Inf. Process. Agric. 2016, 3, 262–271. [Google Scholar] [CrossRef]
  3. Derya, Y. Global Poultry Industry and Trends. 2021. Available online: https://www.feedandadditive.com/global-poultry-industry-and-trends/ (accessed on 11 March 2021).
  4. Wright, R.; Parekh, S.; White, R.; Losey, D.P. Safely and autonomously cutting meat with a collaborative robot arm. Sci. Rep. 2024, 14, 299. [Google Scholar] [CrossRef] [PubMed]
  5. Templer, R.G.; Nicholls, H.R.; Nicolle, T. Robotics for meat processing—From research to commercialisation. Ind. Robot 1999, 26, 247–252. [Google Scholar] [CrossRef]
  6. Purnell, G. Robots for the meat industry. Ind. Robot 1995, 22, 22–24. [Google Scholar] [CrossRef]
  7. Kim, J.; Kwon, Y.; Kim, H.-W.; Seol, K.-H.; Cho, B.-K. Robot Technology for Pork and Beef Meat Slaughtering Process: A Review. Animals 2023, 13, 651. [Google Scholar] [CrossRef]
  8. Aly, B.A.; Low, T.; Long, D.; Baillie, C.; Brett, P. Robotics and sensing technologies in red meat processing: A review. Trends Food Sci. Technol. 2023, 132, 264–276. [Google Scholar] [CrossRef]
  9. Choi, S.; Zhang, G.; Fuhlbrigge, T.; Watson, T.; Tallian, R. Applications and requirements of industrial robots in meat processing. In Proceedings of the 2013 IEEE International Conference on Automation Science and Engineering (CASE), Madison, WI, USA, 17–20 August 2013; Volume 1, pp. 1167–1172. [Google Scholar] [CrossRef]
  10. Chowdhury, E.U.; Morey, A. Application of optical technologies in the US poultry slaughter facilities for the detection of poultry carcass condemnation. J. Sci. Food Agric. 2020, 100, 3736–3744. [Google Scholar] [CrossRef]
  11. Kang, R.; Yang, K.; Zhang, X.X.; Chen, K. Development of Online Detection and Processing System for Contaminants on Chicken Carcass Surface. Appl. Eng. Agric. 2016, 32, 133–139. [Google Scholar] [CrossRef]
  12. Joshi, K.; Norton, T.; Frías, J.M.; Tiwari, B.K. Robotics in meat processing. In Emerging Technologies in Meat Processing; Cummins, E.J., Lyngeds, J.G., Eds.; Wiley: Hoboken, NJ, USA, 2017. [Google Scholar]
  13. Khodabandehloo, K. Achieving robotic meat cutting. Anim. Front. 2022, 12, 3–4. [Google Scholar] [CrossRef]
  14. Nayik, G.A.; Muzaffar, K.; Gull, A. Robotics and Food Technology: A Mini Review. Food Eng. 2023, 148, 103623. [Google Scholar]
  15. Joutou, T.; Yanai, K. A food image recognition system with Multiple Kernel Learning. In Proceedings of the 16th IEEE International Conference on Image Processing, Cairo, Egypt, 7–10 November 2009; pp. 285–288. [Google Scholar] [CrossRef]
  16. Tanno, R.; Okamoto, K.; Yanai, K. DeepFoodCam: A DCNN-Based Real-Time Mobile Food Recognition System; ACM Digital Library: New York, NY, USA, 2016. [Google Scholar] [CrossRef]
  17. Misimi, E.; Øye, E.R.; Eilertsen, A.; Mathiassen, J.R.B.; Åsebø Berg, O.; Gjerstad, T.B.; Buljo, J.O.; Skotheim, Ø. GRIBBOT—Robotic 3D vision-guided harvesting of chicken fillets. Comput. Electron. Agric. 2016, 121, 84–100. [Google Scholar] [CrossRef]
  18. Echegaray, N.; Hassoun, A.; Jagtap, S.; Tetteh-Caesar, M.; Kumar, M.; Tomasevic, I.; Goksen, G.; Lorenzo, J.M. Meat 4.0: Principles and Applications of Industry 4.0 Technologies in the Meat Industry. Appl. Sci. 2022, 12, 6986. [Google Scholar] [CrossRef]
  19. Barbut, S. Automation and meat quality-global challenges. Meat Sci. 2014, 96, 335–345. [Google Scholar] [CrossRef] [PubMed]
  20. Walker, T.; Ahlin, K.; Joffe, B.P. Robotic Rehang with Machine Vision. In Proceedings of the 2021 ASABE Annual International, Virtual Meeting, 13–15 July 2021; p. 202100519. [Google Scholar] [CrossRef]
  21. Austin, A. How to Get a Processing Line Speed Waiver. WATTPoultry. 2019. Available online: https://www.wattagnet.com/articles/38224-how-to-get-a-processing-line-speed-waiver?v=preview (accessed on 5 August 2019).
  22. Ga, C.Q. Poultry Producers Scratch for Workers Amid rising Demand, Prices. The Atlanta Journal-Constitution. 2021. Available online: https://www.ajc.com/news/ga-poultry-producers-scratch-for-workers-amid-rising-demand-prices/AOBN7F6ZRZC2PPBDWDYUOECSY4/ (accessed on 19 May 2021).
  23. Tran, M.; Truong, S.; Fernandes, A.F.A.; Kidd, M.T.; Le, N. CarcassFormer: An End-to-end Transformer-based Framework for Simultaneous Localization, Segmentation and Classification of Poultry Carcass Defects. arXiv 2024, arXiv:2404.11429. [Google Scholar] [CrossRef]
  24. Xiong, Z.; Sun, D.W.; Pu, H.; Gao, W.; Dai, Q. Applications of emerging imaging techniques for meat quality and safety detection and evaluation: A review. Crit. Rev. Food Sci. Nutr. 2017, 104, 755–768. [Google Scholar] [CrossRef]
  25. Modzelewska-Kapituła, M.; Jun, S. The application of computer vision systems in meat science and industry—A review. Meat Sci. 2022, 182, 108904. [Google Scholar] [CrossRef]
  26. Zhao, S.; Hao, G.; Zhang, Y.; Wang, S. A real-time classification and detection method for mutton parts based on single shot multi-box detector. J. Food Process. Preserv. 2021, 45, e13749. [Google Scholar] [CrossRef]
  27. Sun, X.; Young, J.; Liu, J.H.; Newman, D. Prediction of pork loin quality using online computer vision system and artificial intelligence model. Meat Sci. 2018, 140, 72–77. [Google Scholar] [CrossRef]
  28. Pallerla, C.; Feng, Y.; Owens, C.M.; Bist, R.B.; Mahmoudi, S.; Sohrabipour, P.; Davar, A.; Wang, D. Neural network architecture search enabled wide-deep learning (NAS-WD) for spatially heterogeneous property aware chicken woody breast classification and hardness regression. Artif. Intell. Agric. 2024, 14, 73–85. [Google Scholar] [CrossRef]
  29. Matthews, D.; Pabiou, T.; Evans, R.D.; Beder, C.; Daly, A. Predicting carcass cut yields in cattle from digital images using artificial intelligence. Meat Sci. 2021, 181, 108671. [Google Scholar] [CrossRef]
  30. De La Iglesia, D.H.; Villarrubia González, G.; Vallejo García, M.; López Rivero, A.J.; De Paz, J.F. Non-invasive automatic beef carcass classification based on sensor network and image analysis. Future Gener. Comput. Syst. 2020, 113, 168–176. [Google Scholar] [CrossRef]
  31. Vajdi, M.; Varidi, M.J.; Varidi, M.; Mohebbi, M. Using electronic nose to recognize fish spoilage with an optimum classifier. J. Food Meas. Charact. 2019, 13, 1205–1217. [Google Scholar] [CrossRef]
  32. Ulum, M.F.; Maryani; Rahminiwati, M.; Choridah, L.; Hendra Setyawan, N.; Ain, K.; Mukhaiyar, U.; Pamungkas, F.A.; Jakaria; Garnadi, A.D. Assessment of Meat Content and Foreign Object Detection in Cattle Meatballs Using Ultrasonography, Radiography, and Electrical Impedance Tomography Imaging. Adv. Mech. Eng. 2024, 2024, 9526283. [Google Scholar] [CrossRef]
  33. Xu, B.; Wang, W.; Guo, L.; Chen, G.; Wang, Y.; Zhang, W.; Li, Y. Evaluation of Deep Learning for Automatic Multi-View Face Detection in Cattle. Agriculture 2021, 11, 1062. [Google Scholar] [CrossRef]
  34. Qiao, Y.; Truman, M.; Sukkarieh, S. Cattle segmentation and contour extraction based on Mask R-CNN for precision livestock farming. Comput. Electron. Agric. 2019, 164, 104958. [Google Scholar] [CrossRef]
  35. Jiang, K.; Xie, T.; Yan, R.; Wen, X.; Li, D.; Jiang, H.; Jiang, N.; Feng, L.; Duan, X. An Attention Mechanism-Improved YOLOv7 Object Detection Algorithm for Hemp Duck Count Estimation. Agriculture 2022, 12, 1659. [Google Scholar] [CrossRef]
  36. Li, H.; Wang, H.; Zhang, Y.; Li, L.; Ren, P. Underwater image captioning: Challenges, models, and datasets. arXiv 2022, arXiv:2201.02027. [Google Scholar] [CrossRef]
  37. Walter, F.C.; Damrich, S.; Hamprecht, F.A. MultiStar: Instance Segmentation of Overlapping Objects with Star-Convex Polygons. arXiv 2020, arXiv:2011.13228. [Google Scholar]
  38. Wang, D.; Ali, M.; Cobau, J.; Tao, Y. Designs of a customized active 3D scanning system for food processing applications. In Proceedings of the 2021 ASABE Annual International, Virtual Meeting, 12–16 July 2021; p. 2100388. [Google Scholar] [CrossRef]
  39. Ali, M.A.; Wang, D.; Tao, Y. Active Dual Line-Laser Scanning for Depth Imaging of Piled Agricultural Commodities for Itemized Processing Lines. Sensors 2024, 24, 2385. [Google Scholar] [CrossRef]
  40. Kirillov, A.; Mintun, E.; Ravi, N.; Mao, H.; Roll, C.; Gustafson, L.; Xiao, T.; Whitehead, S.; Berg, A.C.; Lo, W.-Y.; et al. Segment Anything: A Foundation Model for Image Segmentation. arXiv 2023, arXiv:2304.02643. [Google Scholar]
  41. Wang, H.; Köser, K.; Ren, P. Large foundation model empowered discriminative underwater image enhancement. IEEE Trans. Geosci. Remote. Sens. 2025, in press. [Google Scholar] [CrossRef]
  42. Redmon, J.; Farhadi, A. YOLOv3: An Incremental Improvement. arXiv 2018, arXiv:1804.02767. [Google Scholar]
  43. Wang, Z. Challenges and Opportunities in Robotic Food Handling: A Review. Front. Robot. 2022, 8, 789107. [Google Scholar] [CrossRef] [PubMed]
  44. An, G.; Wang, Y.; Zeng, K.; Zhu, Q.; Yuan, X. Deep spatial and discriminative feature enhancement network for stereo matching. Vis. Comput. 2024, 40, 1–16. [Google Scholar] [CrossRef]
  45. Teledyne Vision Solutions. Accuracy of Stereo Vision Camera Disparity Depth Calculations. 2023. Available online: https://www.teledynevisionsolutions.com/support/support-center/technical-guidance/iis/accuracy-of-stereo-vision-camera-disparity-depth-calculations/ (accessed on 16 January 2025).
  46. He, K.; Gkioxari, G.; Dollár, P.; Girshick, R. Mask R-CNN. In Proceedings of the IEEE International Conference on Computer Vision (ICCV), Venice, Italy, 22–29 October 2017; pp. 2961–2969. [Google Scholar] [CrossRef]
  47. Zhao, Z.; Cao, Q.; Zhang, X. Segmentation and Tracking of Vegetable Plants by Exploiting Vegetable Shape Feature for Precision Spray of Agricultural Robots. arXiv 2023, arXiv:2306.13518. [Google Scholar]
  48. He, K.; Zhang, X.; Ren, S.; Sun, J. Deep Residual Learning for Image Recognition. In Proceedings of the IEEE Conference on Computer Vision and Pattern Recognition (CVPR), Las Vegas, NV, USA, 27–30 June 2016; pp. 770–778. [Google Scholar] [CrossRef]
  49. Simonyan, K.; Zisserman, A. Very Deep Convolutional Networks for Large-Scale Image Recognition. arXiv 2014, arXiv:1409.1556. [Google Scholar]
  50. Howard, A.; Zhu, M.; Chen, B.; Kalenichenko, D.; Wang, W.; Weyand, T.; Andreetto, M.; Adam, H. MobileNets: Efficient Convolutional Neural Networks for Mobile Vision Applications. arXiv 2017, arXiv:1704.04861. [Google Scholar] [CrossRef]
  51. Tan, M.; Le, Q. EfficientNet: Rethinking Model Scaling for Convolutional Neural Networks. In Proceedings of the 36th International Conference on Machine Learning (ICML), Long Beach, CA, USA, 10–15 June 2019; Volume 97, pp. 6105–6114. [Google Scholar]
  52. Chen, A.; Li, X.; He, T.; Zhou, J.; Chen, D. Advancing in RGB-D Salient Object Detection: A Survey. Appl. Sci. 2024, 14, 8078. [Google Scholar] [CrossRef]
Figure 1. RGB image (left) of a chicken and the corresponding depth heatmap (right) from an Intel real-sense camera. The depth heatmap generated via the Intel real-sense camera shows a lack of clarity in the boundary between chickens, indicating that the camera lacks sufficient accuracy in distinguishing fine details between objects.
Agriengineering 07 00077 g001
Figure 2. The overall diagram of the low-cost active dual line-laser scanning system.
Agriengineering 07 00077 g002
Figure 3. Flowchart of the cost-effective communication framework implemented between the vision and control systems.
Agriengineering 07 00077 g003
Figure 4. Image processing procedures of depth heatmap generation.
Agriengineering 07 00077 g004
Figure 5. Optical triangulation diagram for object height estimation.
Agriengineering 07 00077 g005
Figure 6. Sample image from the RGB, depth, and mask dataset, showing both before and after the random data augmentation. The top row represents the original RGB image, depth data, and segmentation mask, while the bottom row shows the augmented versions of the same images.
Agriengineering 07 00077 g006
Figure 7. Illustration of the Mask R-CNN architecture, adapted for RGB-D input. The RGB and depth (D) data are concatenated to form a four-channel input, and the first layer of the backbone network is to accommodate the additional depth channel.
Agriengineering 07 00077 g007
Figure 8. Laser calibration analysis: the relationship between the Arduino PWM output and the line-laser projected angle.
Agriengineering 07 00077 g008
Figure 9. Illustration of the RGB image and corresponding depth map generation process using dual lasers. The left image shows the raw RGB input, while the middle images display the heat maps derived from the right and left green lasers, respectively. White pixels in the heat maps indicate occluded areas where the laser could not be detected via the camera.
Agriengineering 07 00077 g009
Figure 10. The leftmost image shows the original RGB image. The following images display the ground truth (GT) mask, and the segmentation results of the SAM, YOLOv8, and Mask-RCNN (ResNet50 Backbone) models, respectively. These results highlight the poor segmentation performance of these models with RGB input only, as evidenced by the inaccurate masks. The red circles represent the predicted mask centers, while the blue circles represent the GT mask centers.
Agriengineering 07 00077 g010
Figure 11. Comparison of Mask R-CNN results on RGB and RGB-D inputs, alongside the corresponding RGB image and ground truth (GT) masks. The RGB image illustrates the input data, while the GT masks serve as the reference for evaluating segmentation accuracy. Moreover, the blue circles represent the centers of the ground truth masks, while the red circles indicate the centers of the predicted masks.
Agriengineering 07 00077 g011
Table 1. Accuracy evaluation of the right laser, the left laser, and their final integration at different step sizes (50 mm, 100 mm, and 150 mm). The table compares the calculated heights for each step using the individual lasers, the integrated depth map, and the real-sense camera.
Step Height (mm)Height Value (mm) from Right LaserHeight Value (mm) from Left LaserFinal Height Value Using Both Lasers (mm)Height Value from Real-Sense (mm)
5043.0946.1545.8927.13
10097.0099.8598.3783.58
150143.91147.92145.85202.00
Table 2. Performance comparison of Mask R-CNN on RGB and RGB-D inputs across various backbone architectures. It reports the mAP (IoU 50:95), Center Offset metrics, and the model training and test time required for different backbones. The table highlights the impact of depth information (D) on segmentation accuracy and center alignment. The bold numbers in each column indicate the superior performance of the respective backbone in comparison to the others.
Mask R-CNN RGB BackbonesmAP IoU = 0.50:0.95Center Offset (Pixels)Training Time (Min)Test Time (s/Image)
RGBRGBDRGBRGBD
ResNet500.6310.68022.098.991970.0392
ResNet1010.5080.63822.1813.343270.0554
VGG160.1320.46619.5721.192600.0383
EfficientNet0.1320.56522.5816.321810.0546
Disclaimer/Publisher’s Note: The statements, opinions and data contained in all publications are solely those of the individual author(s) and contributor(s) and not of MDPI and/or the editor(s). MDPI and/or the editor(s) disclaim responsibility for any injury to people or property resulting from any ideas, methods, instructions or products referred to in the content.

