Article

Biofilter, Ventilation, and Bedding Effects on Air Quality in Swine Confinement Systems

by
Hong-Lim Choi
1,2,*,
Andi Febrisiantosa
1,3,
Anriansyah Renggaman
1,4,
Sartika Indah Amalia Sudiarto
1,4,
Chan Nyeong Yun
5 and
Arumuganainar Suresh
2,6
1
Department of Agricultural Biotechnology, Seoul National University, Seoul 08826, Republic of Korea
2
Rourcification Research Center for Crop-Animal Farming (ReCaf), Seoul 08800, Republic of Korea
3
Research Unit for Natural Product Technology, Indonesian Institute of Sciences, Yogyakarta 55861, Indonesia
4
Ecology Research Group, School of Life Science and Technology, Institut Teknologi Bandung, Bandung 40132, Indonesia
5
TrackFarm Co., Ltd., Anyang Pangyo-ro, Uiwang-si, Gyeonggi-do 82607, Republic of Korea
6
Department of Life Sciences, School of Science, Sri Sathya Sai University for Human Excellence, Kalaburagi 585313, Karnataka, India
*
Author to whom correspondence should be addressed.
AgriEngineering 2025, 7(3), 73; https://doi.org/10.3390/agriengineering7030073
Submission received: 29 December 2024 / Revised: 25 February 2025 / Accepted: 28 February 2025 / Published: 7 March 2025

Abstract

:
This study evaluated housing designs and bedding systems to improve air quality in swine facilities, focusing on odor and particulate matter (PM) reduction. Three experimental animal house designs (M1, M2, M3) were tested: M1 used circulating airflow with negative pressure, M2 featured a plug flow air pattern with a perforated plastic bed, and M3 employed a sawdust bedding system with recirculating ventilation. Nine fattening swine were housed in each 12 m2 house over 110 days (6 May to 26 August 2018). Appropriate air samples were collected, and odorous compounds, volatile organic acids (VOA), PM, and bacterial concentrations measured. Results showed that M3 had the lowest ammonia (NH3) levels (5.9 ± 1.5 ppm) and undetectable hydrogen sulfide (H2S), while M1 recorded the highest NH3 (9.1 ± 2.2 ppm). VOA concentrations were significantly lower in M3 (75 ± 1.3 ppbv) compared to M1 (884 ± 15 ppbv) and M2 (605 ± 10.3 ppbv). PM10 levels were highest in M3 (312 ± 11 μg/m3) and lowest in M1 (115 ± 3 μg/m3), and thus bacterial counts were elevated in M3 (2117 ± 411 cfu/min), whereas M1 showed the lowest bacterial count of 1029 ± 297 cfu/min. The sawdust bedding system effectively reduced odorous compounds, highlighting its potential for odor control. However, higher PM levels in M3 emphasize the need to balance environmental management with animal welfare. These findings suggest that optimizing housing designs and bedding systems can enhance air quality in swine facilities while addressing sustainability and welfare concerns.

1. Introduction

The global meat production industry has shifted dramatically towards intensive confined livestock operations to meet rising consumer demand [1,2]. While this industrial approach has increased efficiency, it has also raised significant environmental and animal welfare concerns. Concentrated Animal Feeding Operations (CAFOs) often prioritize productivity over animal well-being, confining animals to restrictive spaces and employing practices like tail docking and tooth clipping that disregard natural behaviors [3]. Additionally, these operations contribute to air pollution, with confined animal housing emitting odorous gases and particulate matter (PM) with pathogenic bacteria that pose environmental and public health risks [2]. As meat demand grows, there is an urgent need for engineering solutions to manage gaseous pollutants, PM, and microbes while addressing animal welfare and environmental sustainability.
Swine facilities, in particular, emit volatile organic compounds (VOCs), ammonia, and PM, which contribute to respiratory infections and photochemical smog in nearby communities [4,5,6]. Approximately 50% of odor emissions originate from livestock buildings (30%) and manure storage (20%) [7], with key gaseous pollutants including ammonia, H2S, methane, sulfur compounds, and VOCs [8]. To address these challenges, researchers have explored technologies such as activated carbon adsorption, wet scrubbing, and biofiltration [9,10]. Wet biofiltration, in particular, has shown promise by reducing odors by 40–83% in residential areas [11,12,13], though its effectiveness depends on sufficient air contact time [14]. Studies by Zong et al. [15,16] have further optimized ventilation systems to improve air quality in swine housing.
Despite these advancements, there is a lack of research on the combined effects of bedding systems, ventilation strategies, and biofiltration on odor mitigation and environmental impact. This study addresses this gap by integrating bedding types, ventilation systems, and emission control technologies to develop sustainable solutions for swine farming. By balancing environmental management with animal welfare, this approach aims to promote more responsible livestock production practices.

2. Materials and Methods

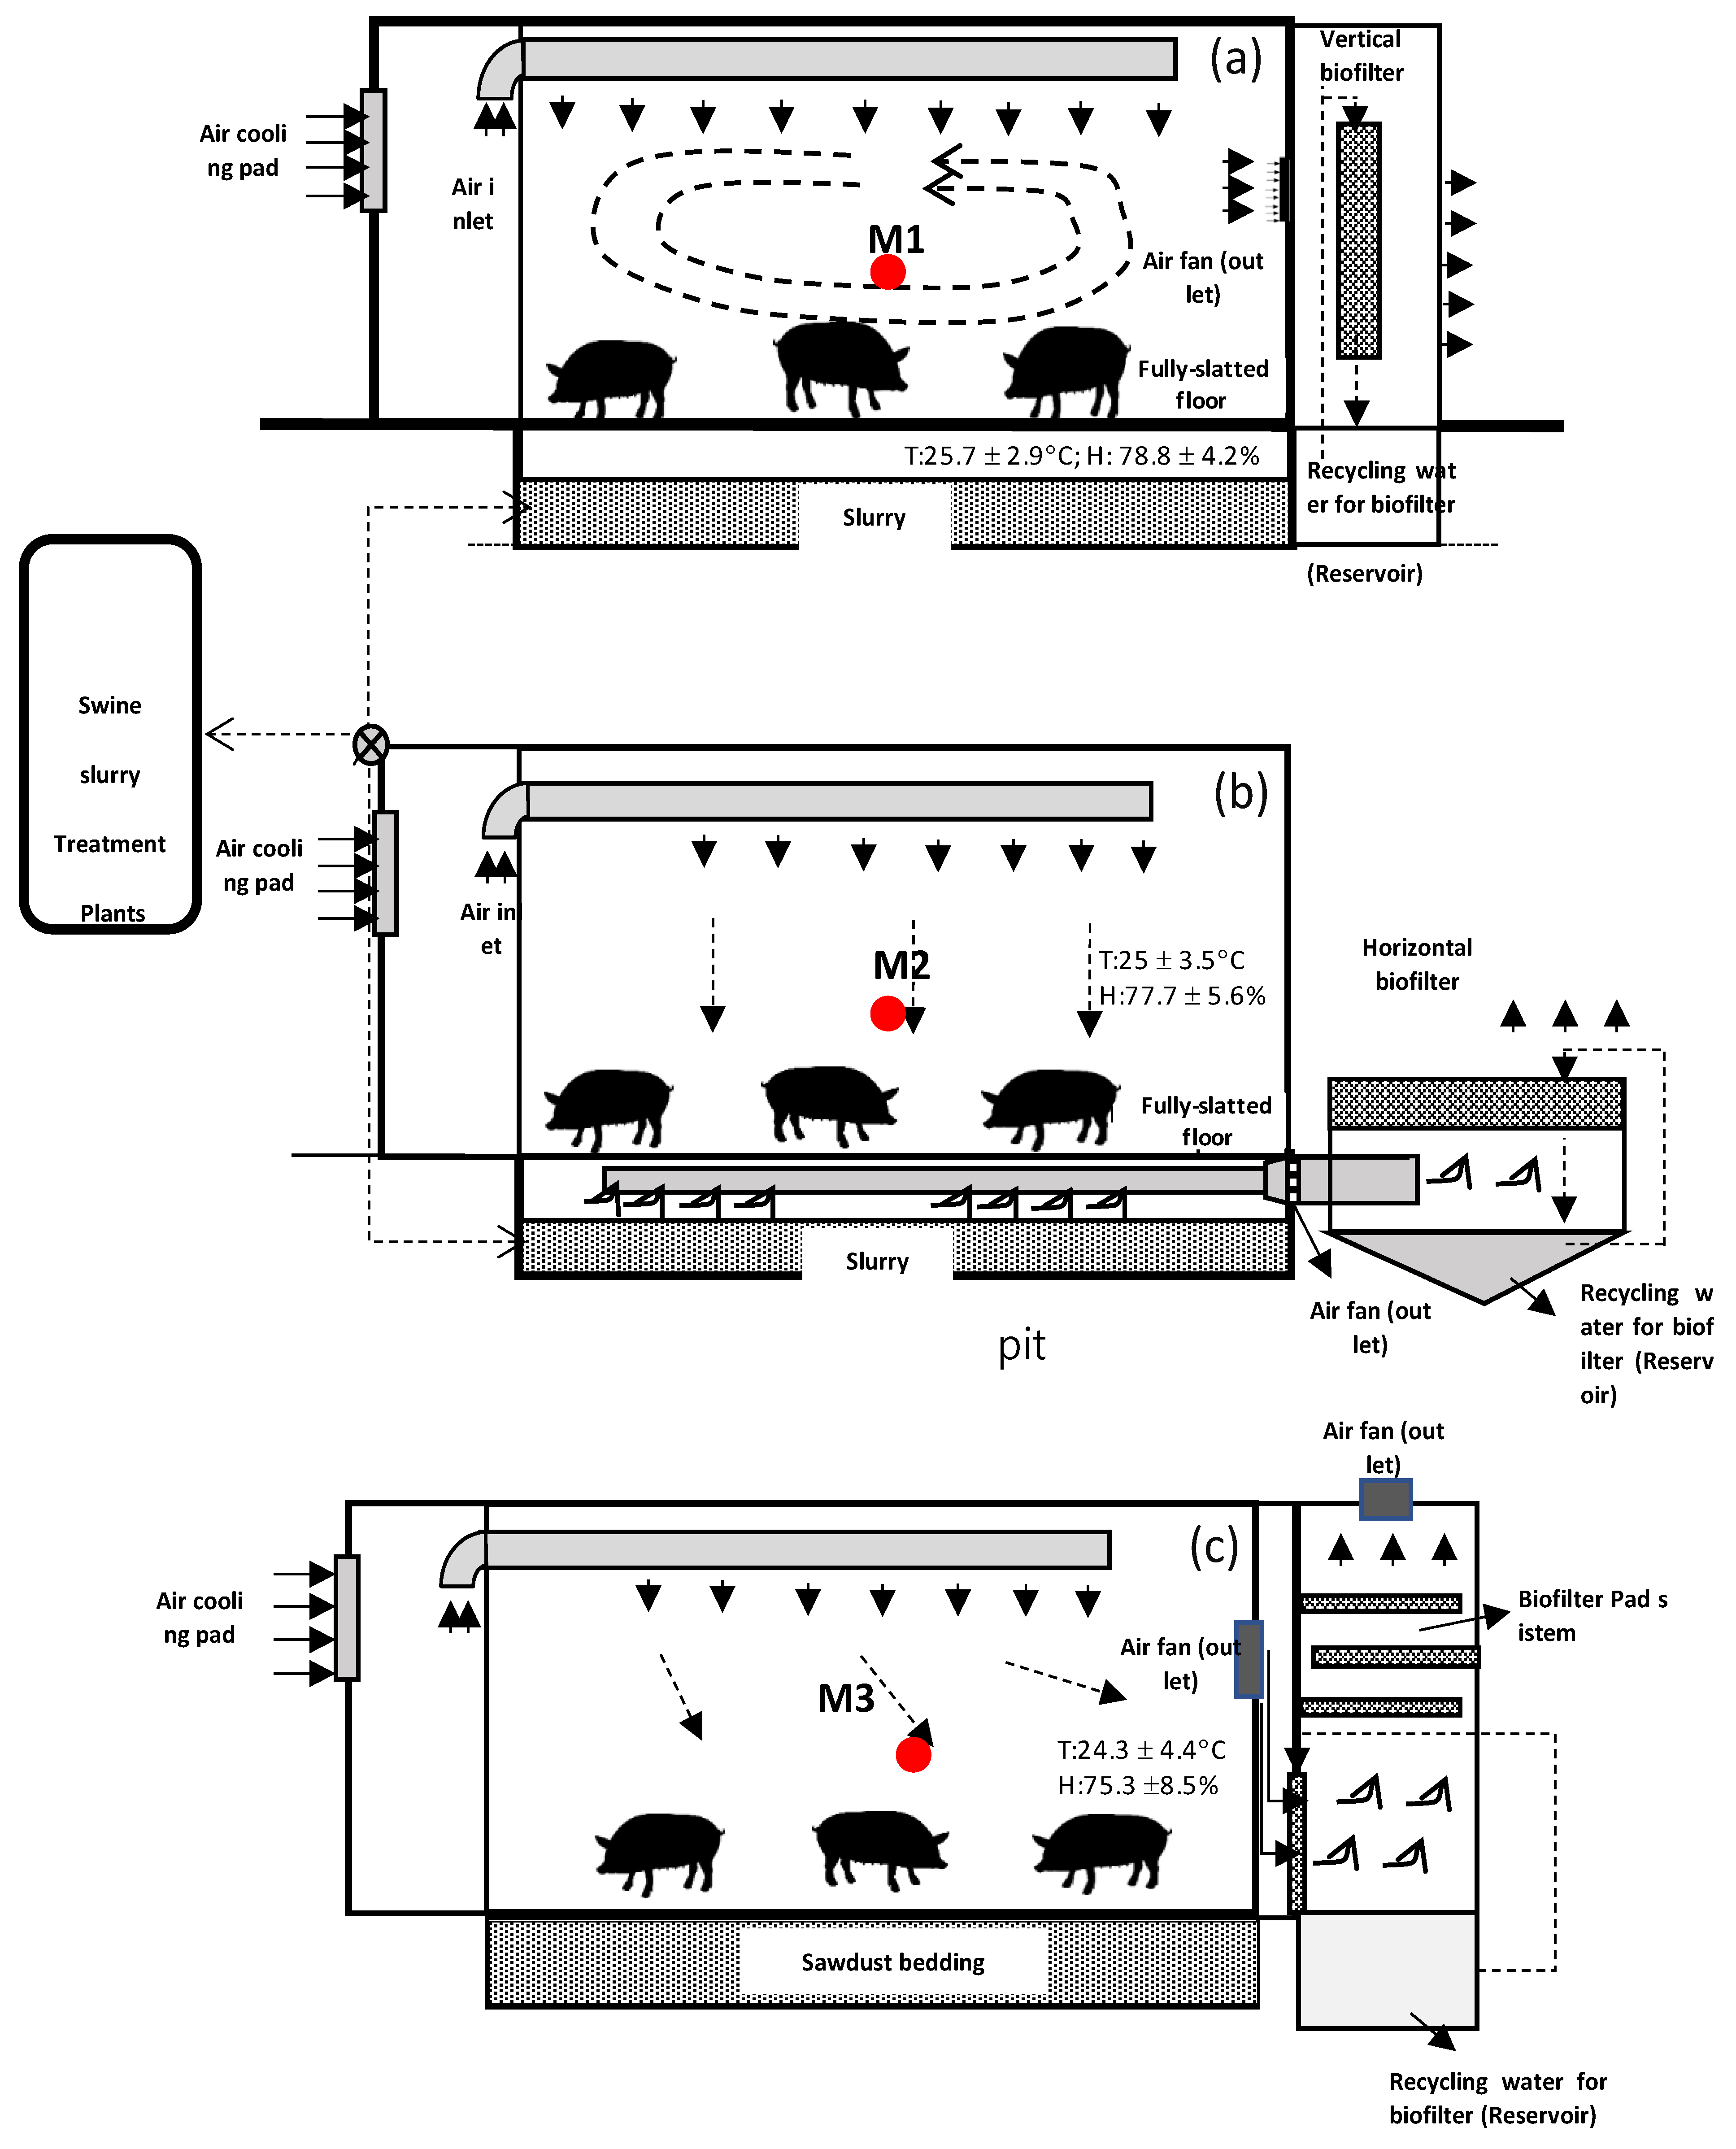
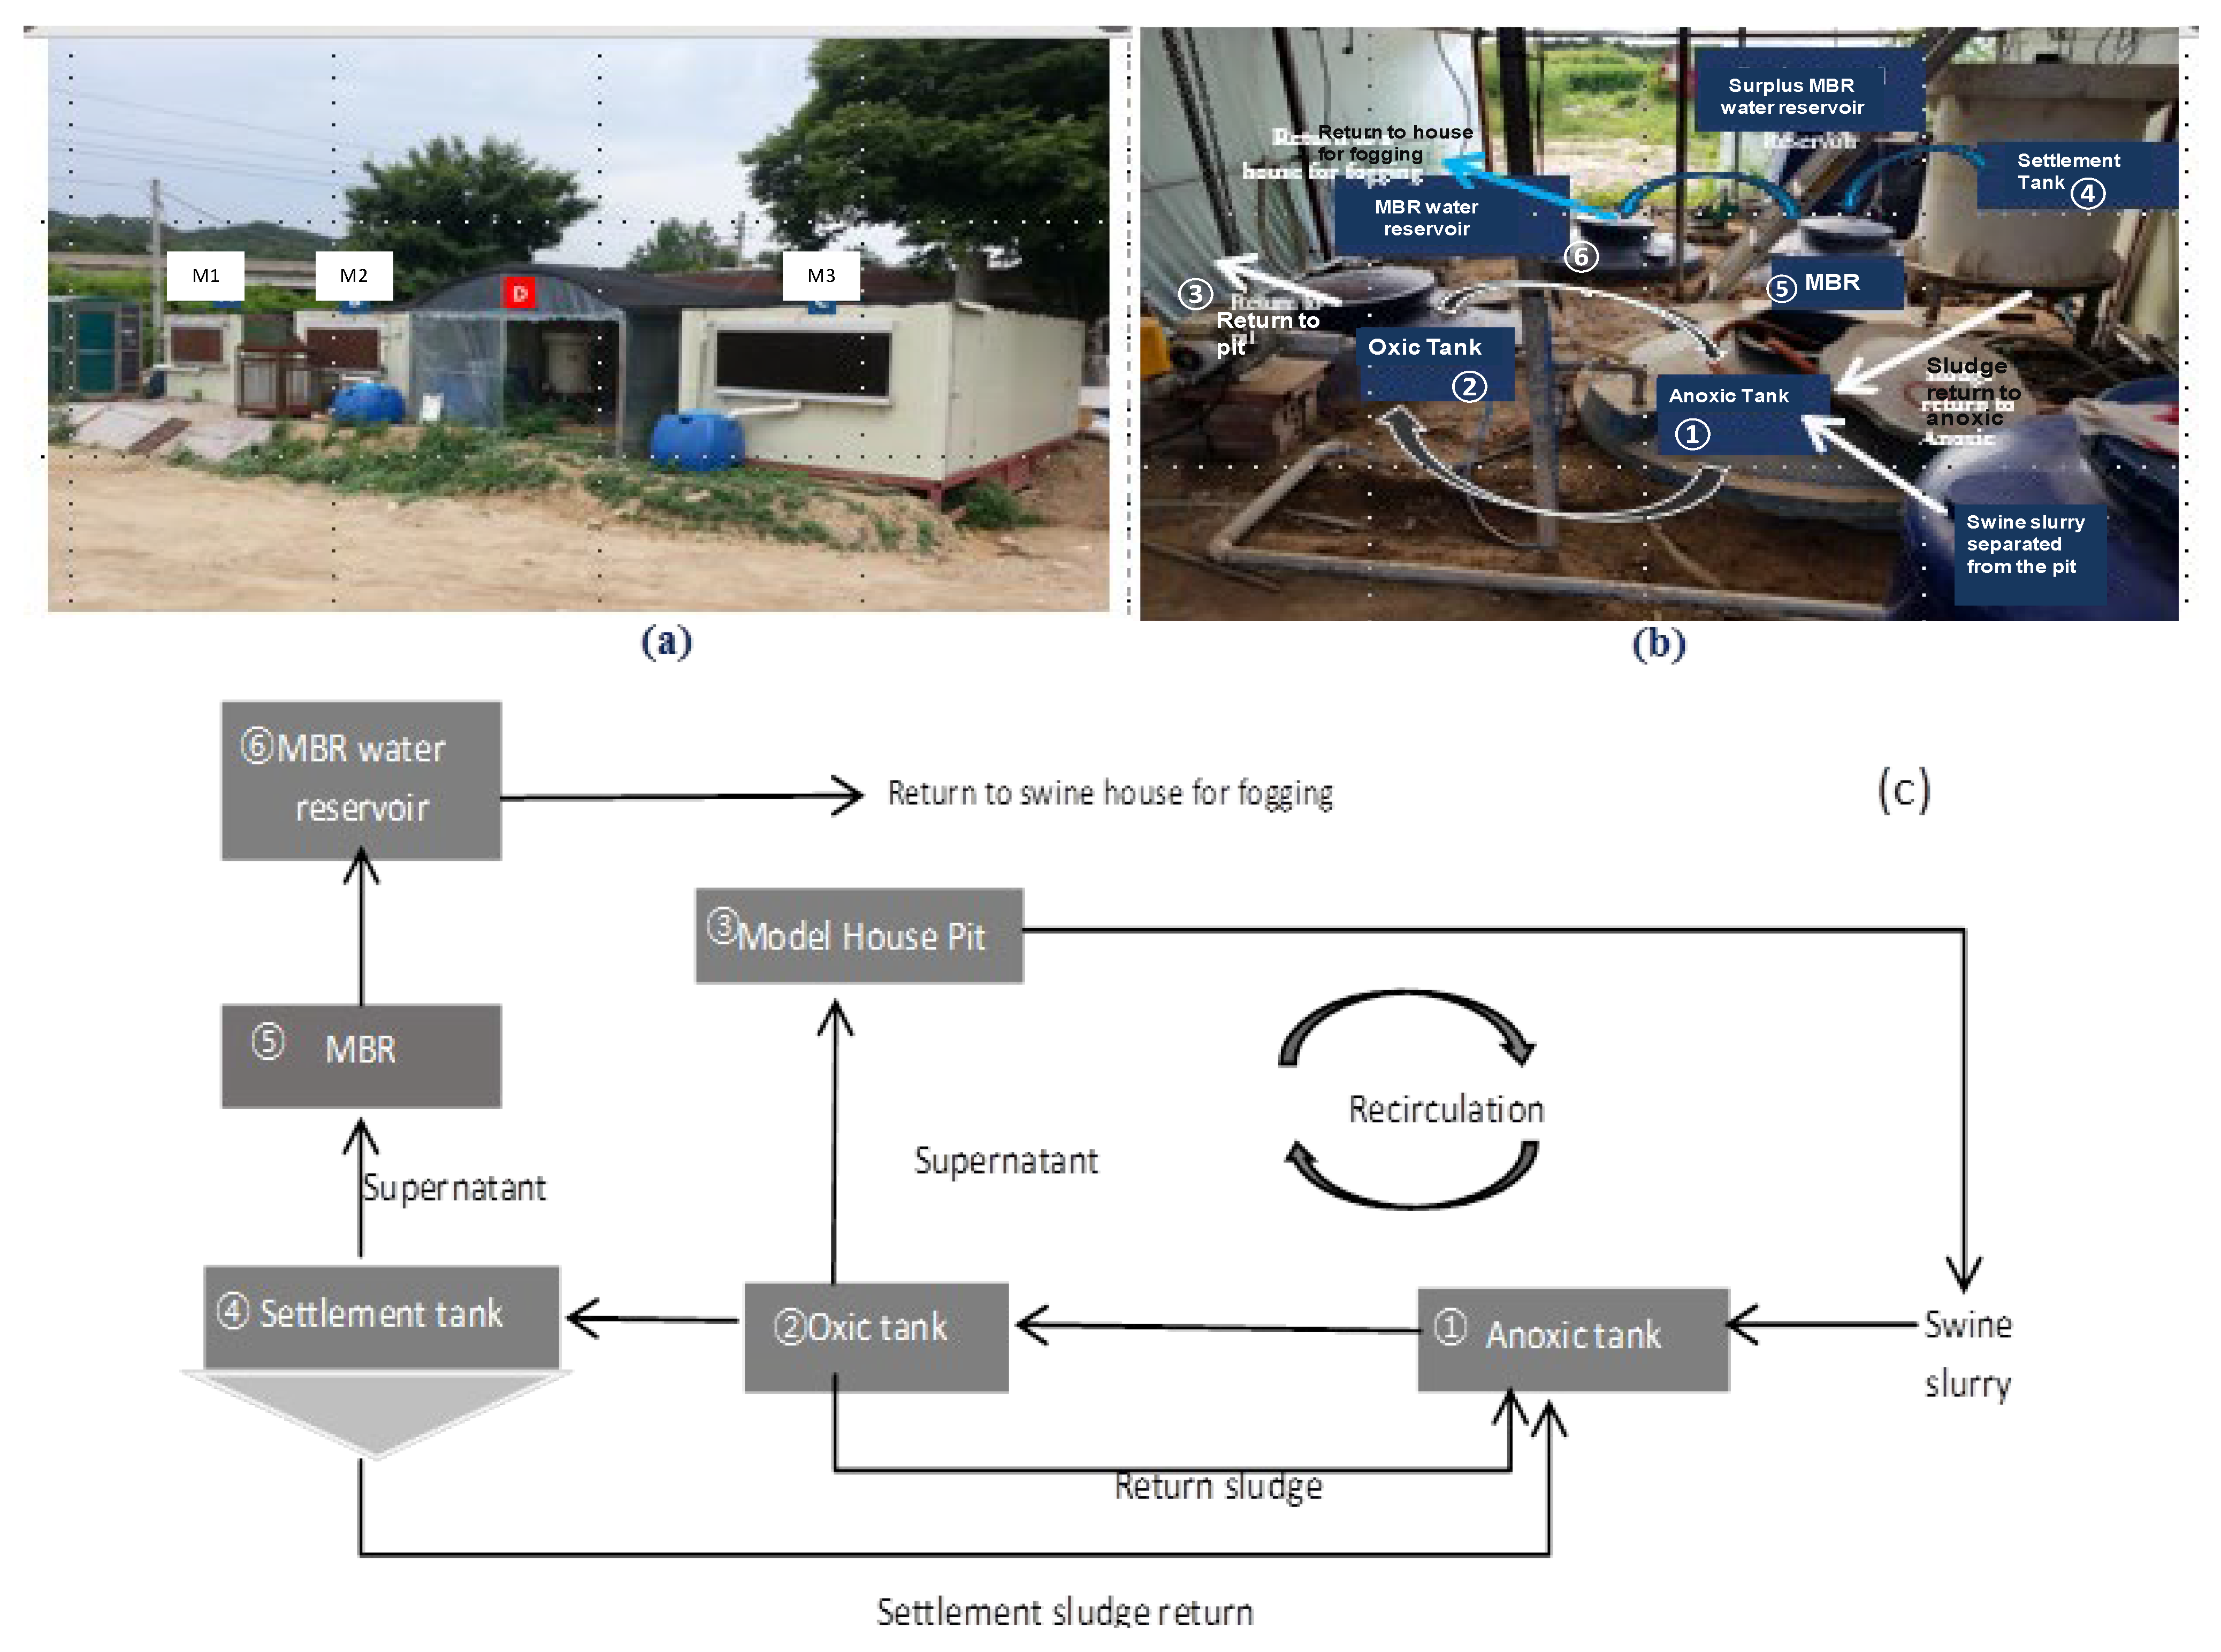
2.1. Experimental Swine Houses Design and Operation

Three experimental swine houses (M1, M2, and M3) were designed to assess the impact of housing configurations on aerial environmental conditions (Table 1). Each house featured distinct biofilter systems and flooring designs (Figure 1a–c and Figure 2). M1 and M2 used fully slatted floors with slurry storage pits, while M3 incorporated a sawdust bedding system. The biofilters varied: M1 utilized vertically arranged cellulose, M2 employed horizontally arranged cellulose, and M3 combined biochar and flue gas desulfurization (FGD) gypsum filters. Treated swine wastewater was recycled at 3.75 L/h to maintain biofilter moisture, with excess collected in a 2.8 m × 1.5 m × 1.0 m reservoir for reuse. Each house accommodated nine fattening swine in a 12 m2 area (3 m × 4 m), providing 1.3 m2 per head—exceeding the standard 0.8–1.0 m2. The study was conducted for 16 weeks (8 May–26 August 2018), with swine having unrestricted access to food and water. Feed contained 16% crude protein during the growing phase and 14.5% during the finisher phase. Ventilation systems (Vent System A/S, Roslev, Denmark) maintained a constant temperature of 23 °C, with a maximum flow rate of 60 m3/head/h (2160 m3/h or 0.67 m3/s). Airflow patterns differed: M1 recirculated air above the slatted floor through a vertical biofilter, M2 directed air into the slurry pit and through a horizontal biofilter, and M3 used a sawdust bed to prevent infiltration. Treated slurry was recirculated to enhance microbial density and reduce micro-dust and odors. Temperature and humidity were also measured throughout the study. However, due to the controlled environment, there was minimal variation in these parameters. The average temperature and humidity in the animal houses were 25 °C ± 3.6 and 77% ± 6, respectively. Solar radiation was not measured, and it was assumed that environmental conditions were identical across the houses unless otherwise measured.

2.2. Analysis of PM and Odorous Compounds

Particulate matter of 10 µm and 2.5 µm (PM10, PM2.5, and total suspended particles) were measured using an aerosol mass monitor (GT-331, SIBATA, Soca-city, Japan) at 2.83 L/min. Samples were collected at a height of 1.5 m in the center of the house at 1:00 pm–2:00 pm each day. For VOC analysis, the air samples were taken in a 1 L Tedlar bag (No.22053, Restek, Bellefonte, PA, USA), and the collected air samples were analyzed using gas chromatography/mass spectrometry (GC/MS) (Agilent GC6890N/5975C MS, Youngin, Korea) in the laboratory. All samples were analyzed within 4 h of sample collection. Solid phase microextraction (SPME) fibers (Solid Phase Microextraction Fiber, Supelco, Bellefonte, PA, USA) consisting of 75 mm carboxen-polydimethylsiloxane were used for the analysis and compared with standards according to Kumari et al.’s protocol [17]. For quantification of volatile compounds, DMS and DMDS were quantified using a certified mixed standard gas obtained from the Research Institute of Gas Analytical Science, South Korea. The following analytical grade standards were purchased from Sigma-Aldrich (St. Louis, MO, USA): Volatile organic acids/acetic acid (99.7%), propanoic acid (99.5%), butyric acid (99%), isobutyric acid (99%), valeric acid (99%), and isovaleric acid (99%), and other compounds: indole (99%), skatole (98%), and p-cresol (99%). Stock solutions were prepared differently depending on compound type. Volatile organic acids were diluted with triple-distilled water, while indolic compounds and p-cresol were diluted with methanol (99.9%, Sigma-Aldrich, USA). These stock solutions were then progressively diluted with triple-distilled water, and a standard graph was prepared and calibrated using a headspace method. Ammonia (NH3) and hydrogen sulfide (H2S) were measured using a Gastec probe (Gastec Co., Ltd., Kanagawa, Japan). The removal efficiency (RE) of the biofilters was calculated using a standard equation.
RE = ((C1 − C2)/C1) × 100
where C1 represents inlet NH3 concentrations and C2 represents exhaust NH3 concentrations.

2.3. Airborne Bacteria Analysis

Airborne bacteria were monitored by frequently measuring the total bacterial count (TBC), total Escherichia coli (TE), and total fecal coliform (TC) using the plate settling methods (sampling was conducted each week for 12 of the 16 weeks of the study). Standard Petri dishes (90 mm × 15 mm, SPL Life Sciences, Pochun-si, Korea) were employed for this purpose. Each bacterial group was cultured on selective media: Tryptic soy agar for TBC, Chromocult Coliform agar for TE, and m-FC agar for TC, and kept open in the house for a minute. Then, the plates were covered with parafilm and transported to the lab and incubated under controlled conditions at 35 °C for 24 h to facilitate the growth of TBC, while TE and TC plates were incubated for 48 h to allow for adequate bacterial growth. The control plates, which were not opened in the animal house, were used to assess media contamination and storage conditions. These plates were handled following the same procedures as the experimental plates. After the incubation period, bacterial colonies were counted and the results were expressed as colony-forming units per minute (cfu/min).

2.4. Statistical Analysis

Statistical analysis employed ANOVA at a 5% significance level, with Tukey’s test for comparing quantitative factor averages using SPSS software 19.0 (SPSS Inc., Chicago, IL, USA).

3. Results and Discussion

3.1. NH3 and H2S Reduction

Gaseous compounds in the swine houses are primarily ammonia and hydrogen sulfide, which are generated by the pigs themselves or by decomposing manure and are easily adsorbed onto airborne dust particles derived from feedstuffs or bedding materials [18]. If ammonia and hydrogen sulfide are adsorbed onto fine dust particles, they pose serious adverse health effects on both pigs and workers because they penetrate the respiratory system [19]. Also, these gases promote the deterioration of equipment in the pig buildings, elicit serious complaints from neighbors if the odors are emitted outdoors, and can potentially damage ecosystems by causing soil acidification, water eutrophication, and global warming [20]. The management of these gaseous emissions remains a critical challenge in swine production facilities. These emissions not only compromise animal health and productivity but also pose significant environmental and public health risks due to their contribution to air pollution and odor nuisances [21,22]. In this study, three pilot swine housing systems (M1, M2, and M3) were evaluated for their effectiveness in controlling NH3 and H2S emissions.

3.1.1. Ammonia (NH3) Emissions

NH3 concentrations varied significantly across the three housing systems (Figure 3). M1, representing a conventional slatted floor system, exhibited the highest NH3 levels at 9.1 ± 2.2 ppm (p < 0.05), significantly exceeding those in M2 (6.1 ± 1.5 ppm) and M3 (5.9 ± 1.5 ppm). These findings are consistent with a previous study by Kim et al. [20], who reported an average of 7.5 ppm (range 0.8 to 21.4 ppm) NH3 concentrations, and suggested that gaseous concentrations were heavily influenced by housing design, manure management practices, and storage systems [22]. Specifically, slatted floor systems like M1 tend to promote higher NH3 emissions due to the direct exposure of manure to air, facilitating the volatilization of NH3 from urea hydrolysis [22]. Also, unexpected NH3 peaks were observed in M1 during the initial stages, likely due to biofilter orientation in which horizontal filter positioning is more effective than vertical positioning for removing gaseous compounds. Also, the peak may be related to transient operational factors, such as changes in the animal activity or feed consumption (data not measured). The sawdust bedding system (M3) initially demonstrated superior NH3 control, with concentrations remaining below 6 ppm for the first 14 days. This finding was supported by Huang et al. [23], who attributed this to the effectiveness of the high carbon (C:N ratio of 500:1) sawdust bedding, which enhances the binding of NH3 molecules and reduces volatilization. However, after day 14, NH3 levels in M3 increased significantly, likely due to the saturation of the bedding material and its reduced absorption capacity over time. This temporal pattern is consistent with observations by Gallmann et al. [24], who noted that bedding-based systems often experience a decline in NH3 control efficiency as the bedding degrades and its ability to retain moisture and NH3 diminishes. The increase in NH3 emissions post-day 14 can also be linked to the accumulation of urine and feces, which accelerates the breakdown of organic matter and releases more NH3 into the air. This phenomenon has been well documented by Cao et al. [25], who highlighted the role of microbial activity in bedding degradation and its impact on NH3 volatilization. Additionally, Arogo et al. [22] emphasized that NH3 emissions tend to increase with the age of pigs, as older animals consume more feed and water, leading to greater nitrogen excretion in urine. This nitrogen is subsequently converted to NH3 through microbial processes, further exacerbating emissions in later stages of the production cycle. Prior to modifying the housing system to prevent NH3 emissions from the pig house, it is essential to accurately determine their concentrations. Most field research to quantify the concentrations and emissions of ammonia in pig houses has been performed in other developed countries, and reports note that the mean concentration of ammonia is approximately 15 ppm [20]. In our study, the maximum of 9 ppm NH3 was noted in the M1 house due to the modifications to the house, such as biofilter exhaust and ventilation systems.

3.1.2. Hydrogen Sulfide (H2S) Emissions

H2S, another critical gaseous emission in swine production, was also evaluated across the three houses. H2S concentrations varied significantly, with M1 (conventional slatted floor system) averaging 0.6 ± 0.2 ppm and M2 (alternative housing system) at 0.5 ± 0.1 ppm (p < 0.05). Notably, M3 (sawdust bedding system) showed undetectable levels of H2S throughout the study period (Figure 4). These results are 500 times higher than those reported by Kim et al. [20], who reported an average of 286 ppb (range 45.8 to 1235 ppb) of H2S and stated that most field research to quantify the concentrations and emissions of hydrogen sulfide in pig houses has been performed in other developed countries, with mean concentrations of hydrogen sulfide being approximately 0.2 ppm, which is 300 times more than in the present study. This study’s housing design effectively reduced H2S emissions in all three houses. In support of the present study, Ni et al. [26] demonstrated that alternative housing systems, particularly those incorporating dry organic bedding, are more effective at reducing H2S emissions compared to conventional systems. The peak H2S concentration in M1 (3.2 ± 0.8 ppm) exceeded the recommended maximum threshold of 3.0 ppm [27], posing potential risks to both animal and human health. This observation aligns with the work of Grant and Boehm [28], who attributed elevated H2S levels in conventional systems to the anaerobic conditions prevalent in deep-pit manure storage systems. Under such conditions, sulfate-reducing bacteria thrive, converting sulfur-containing organic compounds into H2S. In contrast, the sawdust bedding system (M3) effectively mitigated H2S emissions by absorbing moisture and creating an environment less conducive to the activity of sulfate-reducing bacteria. This mechanism has previously been described by researchers who noted that dry bedding materials limit the availability of free water, a critical factor for microbial sulfate reduction [26,28].
The findings of this study underscore the importance of housing design and manure management practices in controlling gaseous emissions. While sawdust bedding systems (M3) demonstrated superior performance in mitigating both NH3 and H2S emissions, their effectiveness diminished over time due to material saturation and degradation. This suggests that regular maintenance and replacement of bedding materials are essential to sustain emission control over the long term. Integrating sawdust bedding into conventional pit slurry systems could offer a promising solution for reducing H2S emissions, as the bedding material absorbs moisture and limits the activity of sulfate-reducing bacteria. However, further research is needed to optimize the design and management of such hybrid systems to ensure consistent performance throughout the production cycle.

3.2. Volatile Organic Compounds (VOCs) and Particulate Matter (PM)

Like other gaseous pollutants, VOCs and PM can also affect health and cause adverse effects in humans and animals, including conjunctival irritation, nose and throat discomfort, headache, allergic skin reactions, nausea, vomiting, nosebleeds (epistaxis), fatigue, dizziness, and an increased risk of cancer [29]. However, the health risks associated with specific volatile compounds detected in indoor and outdoor samples from animal farms have not been well studied [30,31]. These emissions not only pose risks to both animal and human health but also make their mitigation a priority in sustainable swine production [32]. This study evaluated three different swine housing systems—M1 (conventional slatted floor system), M2 (pit system with recirculated treated wastewater), and M3 (sawdust bedding system)—to assess their impact on VOC and PM emissions. The results revealed significant differences in emission profiles across the systems, highlighting the trade-offs and challenges associated with each approach.

3.2.1. Volatile Organic Compounds (VOCs)

VOC concentrations varied significantly among the three housing systems (Table 2). M1, the conventional slatted floor system, exhibited the highest VOC concentration at 884 ± 15 ppbv, followed by M2 (605 ± 10 ppbv) and M3 (75 ± 1.3 ppbv) (p < 0.05). Hutchings et al. [33] suggested that slurry pit systems, such as M1, typically produce higher VOC emissions due to the anaerobic decomposition of organic matter in manure, which releases a variety of volatile compounds. These emissions are higher than those from other systems, such as bedding and flooring. Chmielowiec-Korzeniowska [31] explains that in fresh droppings, there is little bacterial decomposition activity, but bacterial numbers increase as the droppings age. Consequently, the amount of volatile substances released from droppings also increases during storage in a pit system, which explains the high emissions observed in the M1 housing system in this study. In contrast, the sawdust bedding system (M3) demonstrated approximately 85% reduction in VOC emissions compared to M1. This reduction might be attributed to the aerobic conditions maintained by the sawdust bedding, which limits the anaerobic processes responsible for VOC generation [34]. Moreover, the recirculation of treated wastewater in M2 led to a 31% reduction in VOC emissions compared to M1. This improvement is likely due to the dilution and treatment of organic matter in the wastewater, which reduces the substrate available for VOC-producing microbial activity. However, phenolic compound concentrations, which are often associated with odor and health concerns, were similar between M1 (0.8 ppbv) and M2 (0.9 ppbv), while M3 showed significantly lower levels (0.5 ppbv, p < 0.05). Sulfuric compounds, including dimethyl sulfide (DMS) and dimethyl disulfide (DMDS), followed a similar pattern to total VOCs. M3 exhibited significantly lower concentrations (2.4 ppbv) compared to M1 (14.4 ppbv) and M2 (5.1 ppbv). The sawdust bedding system demonstrated a reduction efficiency of 51.8–83.1% for sulfurous emissions, likely due to the absorption of moisture and sulfur-containing compounds by the bedding material, which limits the availability of substrates for sulfate-reducing bacteria. These findings underscore the potential of sawdust bedding systems to mitigate both VOC and sulfuric compound emissions, contributing to improved air quality and reduced odor nuisances [34].

3.2.2. Particulate Matter (PM) Emissions

In contrast to the VOC results, the sawdust bedding system (M3) generated significantly higher PM levels compared to the other systems (Figure 5). Specifically, PM10 concentrations in M3 were 312 ± 11 μg/m3 and PM2.5 concentrations were 164 ± 9 μg/m3, exceeding those in M1 and M2 (p < 0.05). De Rooij et al. [35] and Bottcher [18] reported elevated PM levels in bedding-based systems due to animal activity, such as rooting and movement, which disturb the bedding and feeding material, releasing fine particles into the air. Additionally, the physical properties of sawdust, including its low density and high surface area, make it more prone to becoming airborne compared to liquid slurry systems. The pit systems (M1 and M2) exhibited lower PM concentrations, with PM2.5 levels reaching only 48–72% of M3’s levels and PM10 levels reaching 37–79% of M3’s levels. This difference can be attributed to the reduced physical disturbance of manure in pit systems, as well as the binding of particulate matter in the liquid slurry, which prevents it from becoming airborne. These findings highlight a critical trade-off between VOC and PM emissions when selecting housing systems: while sawdust bedding systems are highly effective in reducing VOC emissions, they may contribute to higher PM concentrations, which can have adverse effects on air quality and respiratory health [30]. The results of this study demonstrate that no single housing system is optimal for controlling all types of emissions. Sawdust bedding systems (M3) excel in reducing VOC and sulfuric compound emissions but may exacerbate PM emissions, while conventional pit systems (M1) and those with recirculated treated wastewater (M2) offer better PM control but higher VOC emissions. This trade-off underscores the need for integrated emission control strategies that combine the strengths of different systems. For instance, the use of recirculated treated wastewater in M2 shows promise in reducing VOC emissions compared to conventional pit systems, suggesting that this approach could be further optimized to achieve greater emission reductions. Additionally, modifications to sawdust bedding systems, such as improved ventilation or the use of dust-suppressing additives, could help mitigate PM emissions without compromising their VOC control efficiency.

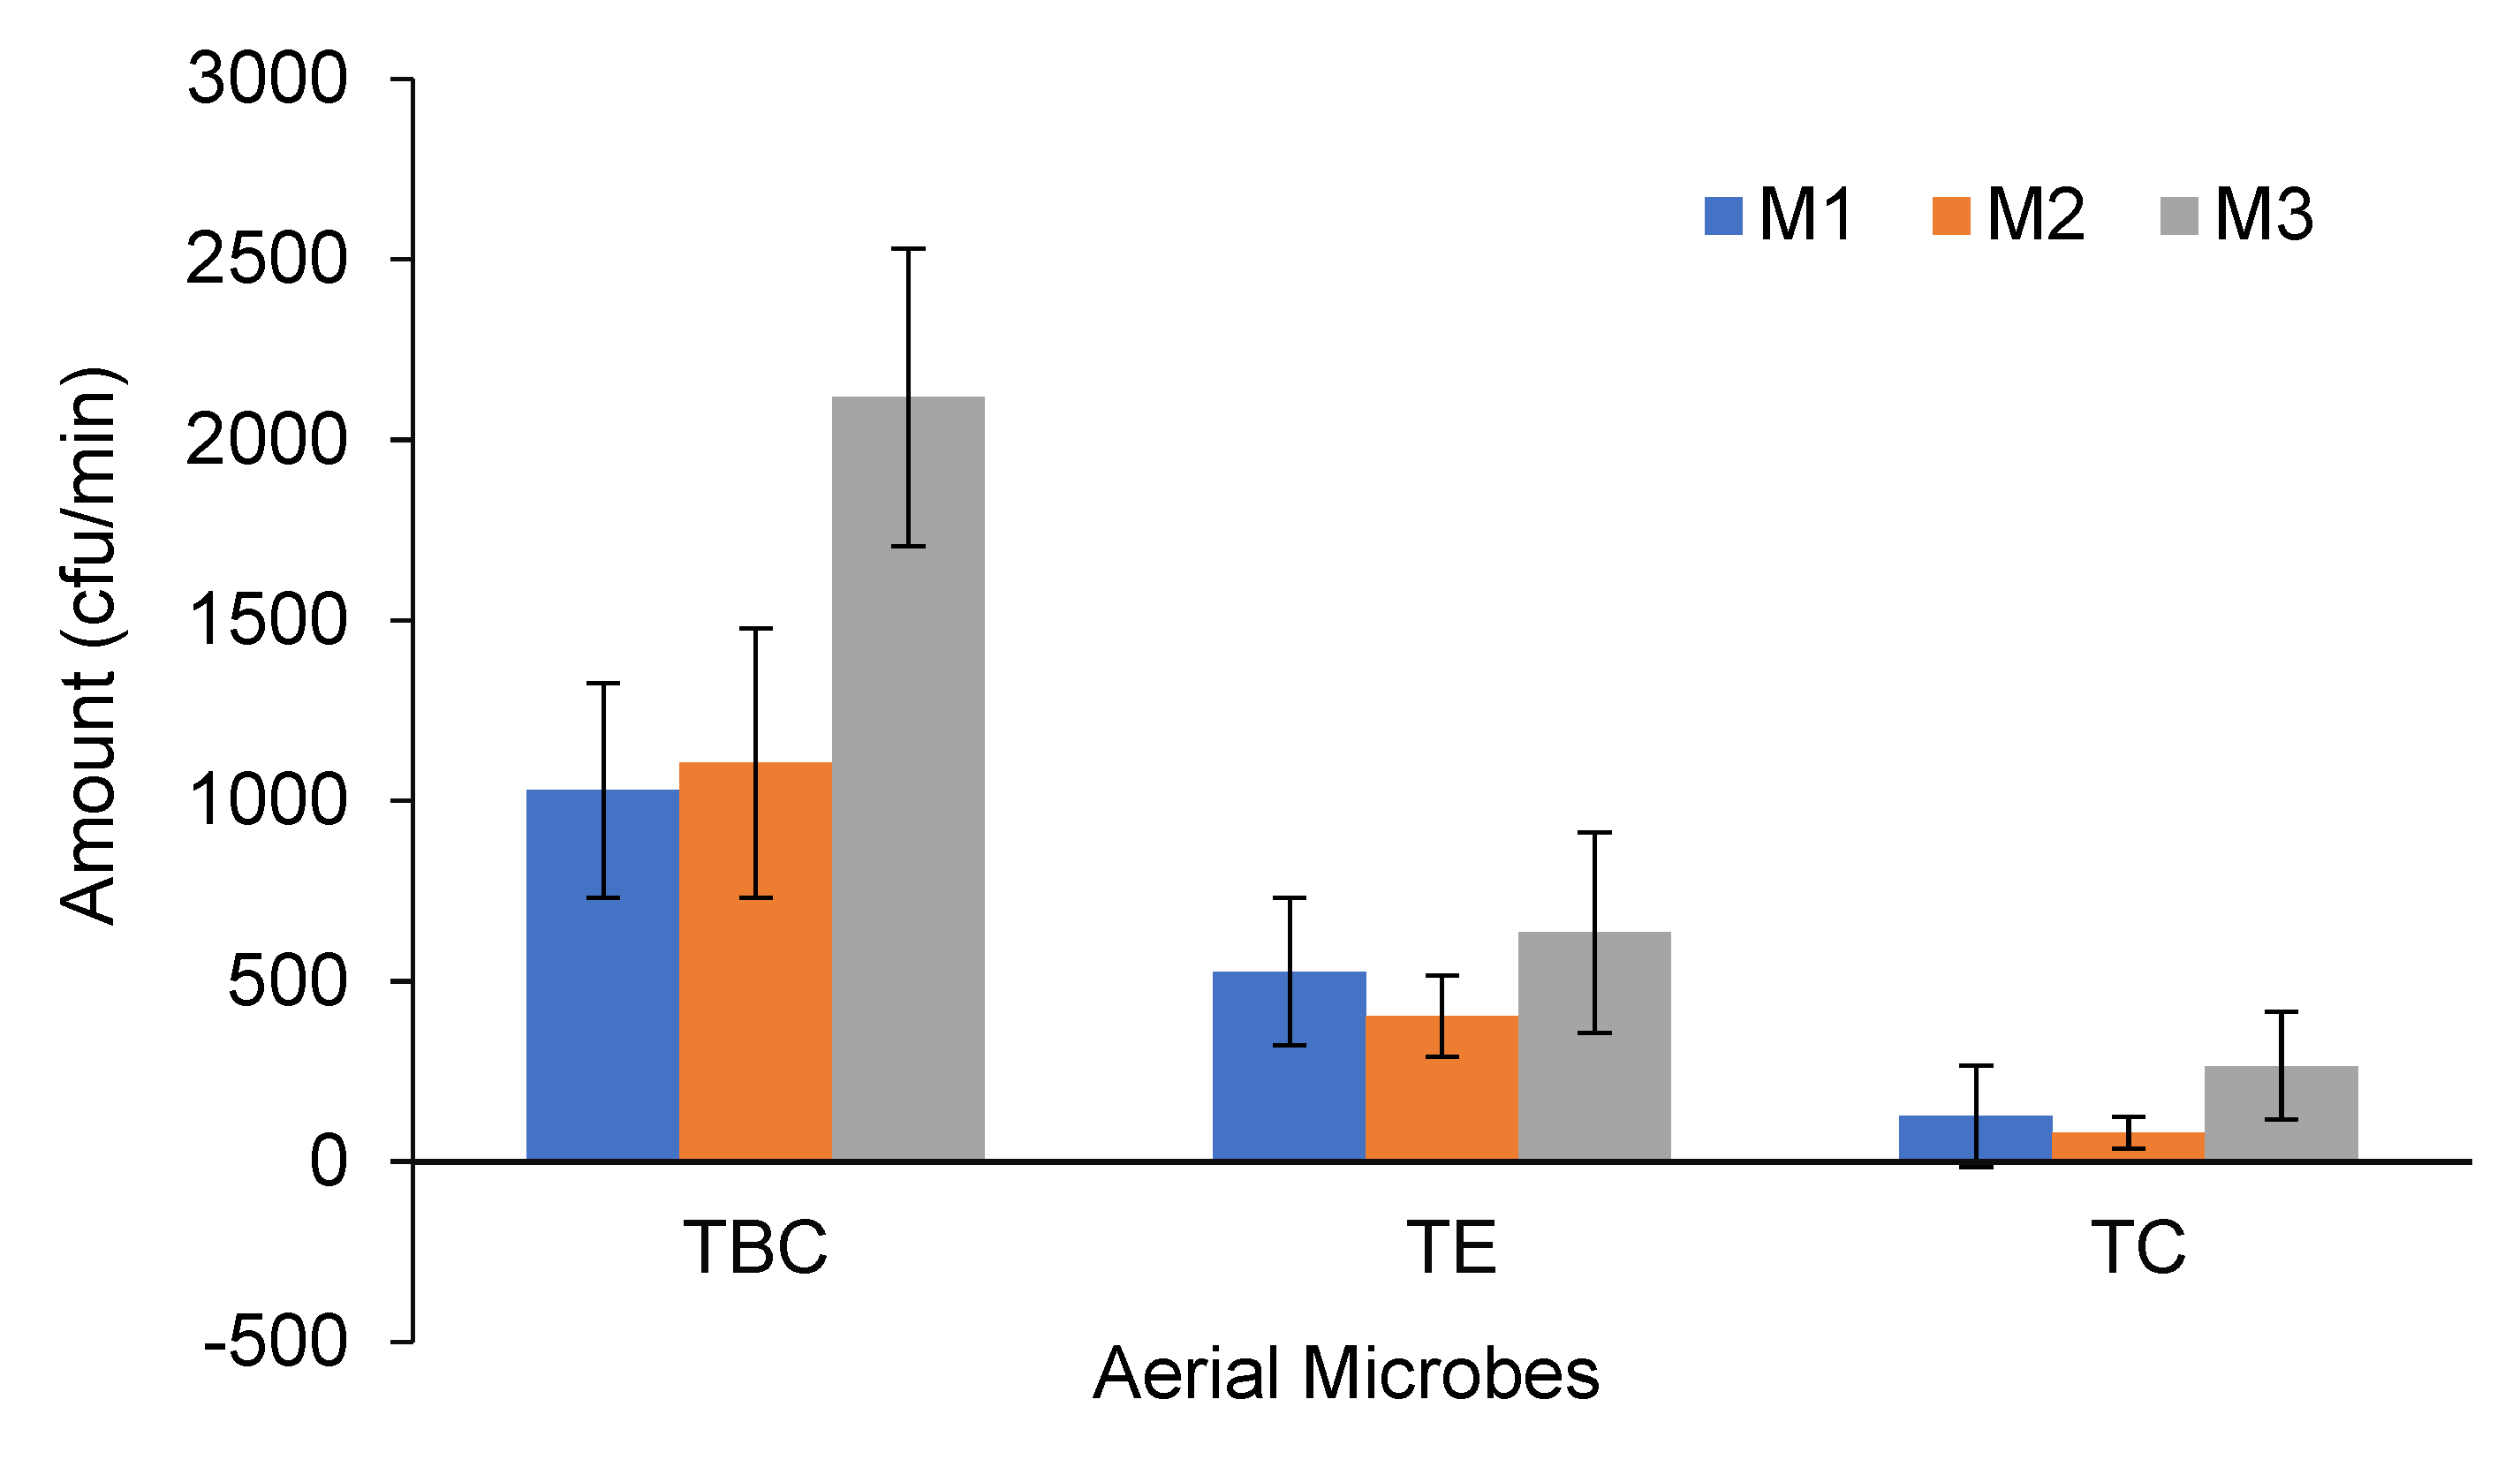
3.3. Aerial Bacterial Concentrations

Aerial bacterial concentrations in the three swine house designs (M1, M2, and M3) reveal significant differences in the concentrations of total bacterial count (TBC), total E. coli (TE), and total coliforms (TCs) (Figure 6). These differences can be attributed to variations in housing design, manure management practices, and the use of biofiltration systems. M3 (sawdust bedding system) exhibited the highest TBC at 2117 ± 411 cfu/min, significantly exceeding M1 (1028 ± 297 cfu/min) and M2 (1105 ± 373 cfu/min). This elevated TBC in M3 is likely due to the sawdust bedding, which provides fine particulate matter along with feed dust that carries microbes into the air [18]. M3 also had the highest TE count at 635 ± 278 cfu/min, compared to M1 (527 ± 204 cfu/min) and M2 (402 ± 112 cfu/min). The higher E. coli levels in M3 can be attributed to the presence of fecal matter and decomposing manure in the dust from sawdust bedding and feedstuff, which serve as reservoirs for enteric bacteria, potentially increasing their negative impact on human health [28]. Similar to TBC and TE, M3 had the highest TC count at 265 ± 149 cfu/min, while M1 and M2 showed lower levels at 126 ± 140 cfu/min and 80 ± 43 cfu/min, respectively. The elevated TC levels in M3 are consistent with the higher microbial activity observed in bedding-based systems, as coliforms are commonly associated with fecal contamination and organic matter decomposition. The aerobic conditions in the bedding material further promote bacterial proliferation, as noted by Lühken et al. [36], who found that organic bedding materials enhance microbial activity due to their moisture retention capacity. In contrast, M1 and M2, which utilize slotted pit systems with biofilters, exhibited lower TBC levels. These findings are supported by Lühken et al. [36], who reported that elevated airborne microbial loads are commonly observed in bedding-based systems. The slurry pit systems (M1 and M2), which feature slotted plastic porous floors that separate the airspace from the pit space, demonstrated lower airborne microbial concentrations. This effect is explained by Bilić et al. [37], who documented the effectiveness of spatial separation in reducing microbial contamination in the air. In contrast, the sawdust bedding system (M3), which lacks spatial separation, resulted in higher microbial dispersion, particularly when the bedding material dried. These results align with the study by Zhao et al. [38], which noted a relationship between bedding moisture content and microbial aerosolization. The increased microbial concentrations in M3 were also linked to enhanced pig activity in the bedded house. Kim et al. [39] also noted that enriched environments that promote natural behaviors lead to greater microbial dispersion. The sawdust bedding, while beneficial for animal welfare, encouraged natural behaviors such as rooting, digging, and increased movement patterns, which in turn led to greater microbial dispersal [40].
The findings of this study have important implications for the design and management of swine housing systems. While sawdust bedding systems offer benefits such as improved animal welfare and reduced ammonia emissions, their higher microbial loads necessitate careful management to minimize the risk of disease transmission and environmental contamination. Regular replacement of bedding material and proper ventilation could help mitigate microbial emissions in these systems. On the other hand, slotted pit systems with biofilters provide a more effective solution for controlling microbial emissions, particularly for E. coli and coliforms. However, these systems may require additional measures to address gaseous emissions, such as VOCs and ammonia. Future research should explore hybrid systems that combine the advantages of bedding-based and biofilter-equipped systems to achieve comprehensive emission control in swine production.

4. Conclusions

The findings of this study suggest that the sawdust bedding system (M3) may contribute to reducing volatile fatty acids and odorous compounds compared to pit-based systems, potentially offering a more favorable environment for odor control. The ventilation systems in the experimental models appeared to influence odor mitigation, though further research is needed to confirm these observations. While M3 showed higher levels of particulate matter (PM), it also demonstrated lower concentrations of ammonia and volatile organic acids, which could indicate a trade-off between different environmental factors. Bacterial concentrations were notably higher in M3, raising questions about the balance between air quality and microbial load. These results highlight the complexity of managing aerial environmental conditions in swine facilities and suggest that no single solution may fully address all challenges. Future studies could explore additional variables and longer-term impacts to better understand the interactions between bedding systems, ventilation, and overall environmental sustainability.

Author Contributions

Conceptualization, H.-L.C., A.F. and S.I.A.S.; methodology, A.F., A.R., S.I.A.S. and H.-L.C.; software, A.F., A.R. and A.S.; validation, A.F., S.I.A.S. and H.-L.C.; formal analysis, A.F., S.I.A.S. and A.S.; investigation, A.F., A.R. and H.-L.C.; resources, A.F.; data curation, A.F.; H.-L.C. and A.S.; writing—original draft preparation, A.F., H.-L.C. and A.S.; writing—review and editing, A.F., S.I.A.S., H.-L.C. and A.S.; visualization, A.F. and A.S.; supervision, H.-L.C. and C.N.Y.; project administration, A.F., H.-L.C. and C.N.Y.; funding acquisition, H.-L.C. and C.N.Y. All authors have read and agreed to the published version of the manuscript.

Funding

This research was funded by the Korea Institute of Planning and Evaluation for Technology in Food, Agriculture, and Forestry (iPET), project number 116049-3 of the Ministry of Agriculture, Food, and Rural Affairs. The authors also thank the Indonesia Endowment Fund for Education (LPDP) for financial support during this study.

Data Availability Statement

Data are available on request to the authors.

Acknowledgments

The authors want to express their gratitude to Seoul National University (SNU) Global Scholarship, SNU Lecture & Research Scholarship, SNU Merit-based Scholarship, and TrackFarm Co., Ltd. for the financial support the author received during his doctoral program. The authors would also like to thank Kim Myoung Dong for technical assistance during the experiment and Priyanka Kumari and Balasubramani Ravindran for their scientific suggestions during the study.

Conflicts of Interest

Author Chan Nyeong Yun was employed by the company TrackFarm Co., Ltd. The remaining authors declare that the research was conducted in the absence of any commercial or financial relationships that could be construed as a potential conflict of interest.

Abbreviations

The following abbreviations are used in this manuscript:
CAFOsConcentrated Animal Feed Operations
CFUColony Forming unit
FGDFlue Gas Desulfurization
M1Model house 1
M2Model house 2
M3Model house 3
MBRMembrane Bioreactor
NDNot Detected
PMParticulate Matter
ppbvParts per billion by volume
ppmParts per million
TBCTotal bacterial Count
TCsTotal Coliforms
TETotal Escherichia coli
TSPsTotal Suspended Particles
VOAVolatile Organic Acid
VOCsVolatile Organic Compounds
VFAsVolatile Fatty Acids

References

  1. Hoff, S.J.; Harmon, J.D. Biofiltration of the Critical Minimum Ventilation Exhaust Air. In Proceedings of the Workshop on Agricultural Air Quality, Washington, DC, USA, 5 June 2006; pp. 760–764. [Google Scholar]
  2. Nimmermark, S. Influence of odour concentration and individual odour thresholds on the hedonic tone of odour from animal production. Biosyst. Eng. 2011, 108, 211–219. [Google Scholar] [CrossRef]
  3. ASPCA. A Closer Look at Animals on Factory Farms. Available online: https://www.aspca.org/fight-cruelty/farm-animal-cruelty/pigs-factory-farms (accessed on 7 March 2019).
  4. Yang, C.; Chen, H.; Zeng, G.; Yu, G.; Luo, S. Biomass accumulation and control strategies in gas biofiltration. Biotechnol. Adv. 2010, 28, 531–540. [Google Scholar] [CrossRef] [PubMed]
  5. Le Leuch, L.M.; Subrenat, A.; Le Cloirec, P. Hydrogen sulfide adsorption and oxidation onto activated carbon cloths: Applications to odorous gaseous emission treatments. Langmuir 2003, 19, 10869–10877. [Google Scholar] [CrossRef]
  6. Cai, L.; Koziel, J.A.; Lo, Y.C.; Hoff, S.J. Characterization of volatile organic compounds and odorants associated with swine barn particulate matter using solid-phase microextraction and gas chromatography-mass spectrometry-olfactometry. J. Chromatogr. A 2006, 1102, 60–72. [Google Scholar] [CrossRef]
  7. Mielcarek, P.; Rzeźnik, W. Odor emission factors from livestock production. Pol. J. Environ. Stud. 2015, 24, 27–35. [Google Scholar] [CrossRef]
  8. Dumont, E.; Hamon, L.; Lagadec, S.; Landrain, P.; Landrain, B.; Andres, Y. NH3 biofiltration of piggery air. J. Environ. Manag. 2014, 140, 26–32. [Google Scholar] [CrossRef]
  9. Chung, Y.C.; Ho, K.L.; Tseng, C.P. Two-stage biofilter for effective NH3 removal from waste gases containing high concentrations of H2S. J. Air Waste Manag. Assoc. 2007, 57, 337–347. [Google Scholar] [CrossRef]
  10. Liu, Z.; Powers, W.; Mukhtar, S. A review of practices and technologies for odor control in swine production facilities. Appl. Eng. Agric. 2014, 30, 477–492. [Google Scholar]
  11. Ryu, H.W.; Cho, K.S.; Lee, T.H. Reduction of ammonia and volatile organic compounds from food waste-composting facilities using a novel anti-clogging biofilter system. Bioresour. Technol. 2011, 102, 4654–4660. [Google Scholar] [CrossRef]
  12. Estrada, J.M.; Kraakman, N.B.; Lebrero, R.; Muñoz, R. A sensitivity analysis of process design parameters, commodity prices and robustness on the economics of odour abatement technologies. Biotechnol. Adv. 2012, 30, 1354–1363. [Google Scholar] [CrossRef]
  13. Martens, W.; Martinec, M.; Zapirain, R.; Stark, M.; Hartung, E.; Palmgren, U. Reduction potential of microbial, odour and ammonia emissions from a pig facility by biofilters. Int. J. Hyg. Environ. Health 2001, 203, 335–345. [Google Scholar] [CrossRef] [PubMed]
  14. Sheridan, B.; Curran, T.; Dodd, V.; Colligan, J. Biofiltration of odour and ammonia from a pig unit-a pilot-scale study. Biosyst. Eng. 2002, 82, 441–453. [Google Scholar] [CrossRef]
  15. Zong, C.; Li, H.; Zhang, G. Ammonia and greenhouse gas emissions from fattening pig house with two types of partial pit ventilation systems. Agric. Ecosyst. Environ. 2015, 208, 94–105. [Google Scholar] [CrossRef]
  16. Zong, C.; Li, H.; Zhang, G. Airflow characteristics in a pig house with partial pit ventilation system: An experimental chamber study. In Proceedings of the ASABE Annual International Meeting, New Orleans, LA, USA, 26–29 July 2015; p. 152172138. [Google Scholar]
  17. Kumari, P.; Lee, J.; Choi, H.L. Characterization of odorant compounds from mechanical aerated pile composting and static aerated pile composting. Asian-Australas. J. Anim. Sci. 2016, 29, 594–598. [Google Scholar] [CrossRef]
  18. Bottcher, R.W. An environmental nuisance: Odor concentrated and transported by dust. Chem. Senses 2001, 26, 327–331. [Google Scholar] [CrossRef]
  19. Erisman, J.W.; Schaap, M. The need for ammonia abatement with respect to secondary PM reductions in Europe. Environ. Pollut. 2004, 129, 159–163. [Google Scholar] [CrossRef]
  20. Kim, K.Y.; Ko, H.J.; Kim, H.T.; Kim, Y.S.; Roh, Y.M.; Lee, C.M.; Kim, C.N. Quantification of ammonia and hydrogen sulfide emitted from pig buildings in Korea. J. Environ. Manag. 2008, 88, 195–202. [Google Scholar] [CrossRef]
  21. Sigsgaard, T.; Balmes, J. Environmental effects of intensive livestock farming. Am. J. Respir. Crit. Care Med. 2017, 196, 1092–1093. [Google Scholar] [CrossRef]
  22. Arogo, J.; Westerman, P.W.; Heber, A.J. A review of ammonia emissions from confined swine feeding operations. Trans. ASAE 2003, 46, 805. [Google Scholar] [CrossRef]
  23. Huang, G.F.; Wong, J.W.; Wu, Q.T.; Nagar, B.B. Effect of C/N on composting of pig manure with sawdust. Waste Manag. 2004, 24, 805–813. [Google Scholar] [CrossRef]
  24. Gallmann, E.; Hartung, E.; Jungbluth, T. Long-term study regarding the emission rates of ammonia and greenhouse gases from different housing systems for fattening pigs–final results. In Proceedings of the International Symposium on Gaseous and Odour Emissions from Animal Production Facilities, Horsens, Denmark, 1–4 June 2003; Volume 122. [Google Scholar]
  25. Cao, Y.; Bai, Z.; Misselbrook, T.; Wang, X.; Ma, L. Ammonia emissions from different pig production scales and their temporal variations in the North China Plain. J. Air Waste Manag. Assoc. 2021, 71, 23–33. [Google Scholar] [CrossRef] [PubMed]
  26. Ni, J.Q.; Heber, A.J.; Lim, T.T. Ammonia and hydrogen sulfide in swine production. In Air Quality and Livestock Farming; CRC Press: Boca Raton, FL, USA, 2018; pp. 29–47. [Google Scholar]
  27. World Health Organization. Guidelines for Air Quality in Livestock Facilities, 4th ed.; WHO Press: Geneva, Switzerland, 2022; Volume 3, pp. 154–196. [Google Scholar]
  28. Grant, R.H.; Boehm, M.T. Emissions of H2S from hog finisher farm anaerobic manure treatment lagoons: Physical, chemical and biological influence. Atmosphere 2022, 13, 153. [Google Scholar] [CrossRef]
  29. Hobbs, P.J.; Webb, J.; Mottram, T.T.; Grant, B.; Misselbrook, T.M. Emissions of volatile organic compounds originating from UK livestock agriculture. J. Sci. Food Agric. 2004, 84, 1414–1420. [Google Scholar] [CrossRef]
  30. Ni, J.Q.; Robarge, W.P.; Xiao, C.; Heber, A.J. Volatile organic compounds at swine facilities: A critical review. Chemosphere 2012, 89, 769–788. [Google Scholar] [CrossRef]
  31. Chmielowiec-Korzeniowska, A. The concentration of volatile organic compounds [VOCs] in pig farm air. Ann. Agric. Environ. Med. 2009, 16, 249–256. [Google Scholar]
  32. Bist, R.B.; Chai, L. Advanced Strategies for Mitigating Particulate Matter Generations in Poultry Houses. Appl. Sci. 2022, 12, 11323. [Google Scholar] [CrossRef]
  33. Hutchings, N.J.; ten Hoeve, M.; Jensen, R.; Bruun, S.; Søtoft, L.F. Modelling the potential of slurry management technologies to reduce the constraints of environmental legislation on pig production. J. Environ. Manag. 2013, 130, 447–456. [Google Scholar] [CrossRef]
  34. Spiehs, M.J.; Brown-Brandl, T.M.; Parker, D.B.; Miller, D.N. Effect of Bedding Material on Air Quality of Bedded Manure Packs in Livestock Facilities; ASABE Paper No. 12-1337890; American Society of Agricultural and Biological Engineers: St. Joseph, MI, USA, 2012. [Google Scholar]
  35. De Rooij, M.M.; Hoek, G.; Schmitt, H.; Janse, I.; Swart, A.; Maassen, C.B.; Schalk, M.; Heederik, D.J.; Wouters, I.M. Insights into livestock-related microbial concentrations in air at residential level in a livestock dense area. Environ. Sci. Technol. 2019, 53, 7746–7758. [Google Scholar] [CrossRef]
  36. Lühken, E.; Nicolaisen, T.; Stracke, J.; Schulz, J.; Kemper, N. Microbiological air quality in free-farrowing housing systems for sows. Vet. Anim. Sci. 2019, 8, 100065. [Google Scholar] [CrossRef]
  37. Bilić, V.; Habrun, B.; Barač, I.; Humski, A. Distribution of airborne bacteria in swine housing facilities and their immediate environment. Arh. Hig. Rada Toksikol. 2000, 51, 199–205. [Google Scholar]
  38. Zhao, Y.; Aarnink, A.J.; De Jong, M.C.; Groot Koerkamp, P.W. Airborne microorganisms from livestock production systems and their relation to dust. Crit. Rev. Environ. Sci. Technol. 2014, 44, 1071–1128. [Google Scholar] [CrossRef] [PubMed]
  39. Kim, K.Y.; Ko, H.J.; Kim, H.T.; Kim, C.N.; Byeon, S.H. Association between pig activity and environmental factors in pig confinement buildings. Aust. J. Exp. Agric. 2008, 48, 680–686. [Google Scholar] [CrossRef]
  40. Luiken, R.E.; Van Gompel, L.; Bossers, A.; Munk, P.; Joosten, P.; Hansen, R.B.; Knudsen, B.E.; García-Cobos, S.; Dewulf, J.; Aarestrup, F.M.; et al. Farm dust resistomes and bacterial microbiomes in European poultry and pig farms. Environ. Int. 2020, 143, 105971. [Google Scholar] [CrossRef] [PubMed]
Figure 1. Swine house types: (a) M1, with recirculation flow–vertical biofilter, slotted pit system; (b) M2, with plug flow–horizontal biofilter, slotted pit system, and (c) M3, with hybrid biochar/FGD layer biofilter and sawdust bedding. Red dot; sample collection, temperature and humidity checking point inside the house. The average temperature (T) and humidity (H) in the animal houses were 25 °C ± 3.6 and 77% ± 6 at the sampling point.
Agriengineering 07 00073 g001
Figure 2. Pilot swine houses (a), pig slurry treatment plant (b), and slurry treatment flow diagram (c).
Agriengineering 07 00073 g002
Figure 3. Average daily ammonia (NH3) concentrations in interior aerial environments of M1 (with recirculation flow–vertical biofilter and slotted pit system), M2 (with plug flow–horizontal biofilter and slotted pit system), and M3 (with hybrid biochar/FGD layer biofilter and sawdust bedding) pilot swine houses. Error bars represent the standard deviations of replicate analysis.
Agriengineering 07 00073 g003
Figure 4. Average daily hydrogen sulfide (H2S) concentrations in interior aerial environments of M1 (with recirculation flow–vertical biofilter and slotted pit system), M2 (with plug flow–horizontal biofilter and slotted pit system), and M3 (with hybrid biochar/FGD layer biofilter and sawdust bedding) pilot swine houses. Error bars represent the standard deviation of replicate analysis.
Agriengineering 07 00073 g004
Figure 5. Particulate matter concentrations inside the M1 (with recirculation flow–vertical biofilter and slotted pit system), M2 (with plug flow–horizontal biofilter and slotted pit system), and M3 (with hybrid biochar/FGD layer biofilter and sawdust bedding) pilot swine houses.
Agriengineering 07 00073 g005
Figure 6. Aerial microbial concentrations inside M1 (with recirculation flow–vertical biofilter and slotted pit system), M2 (with plug flow–horizontal biofilter and slotted pit system), and M3 (with hybrid biochar/FGD layer biofilter and sawdust bedding) pilot swine houses.
Agriengineering 07 00073 g006
Table 1. Characteristics of M1, M2, and M3 model swine houses used in the study.
Characteristics of the Model HouseModel M1Model M2Model M3Specification
Construction material (roof walls)100 mm polyurethane panel 0.8 mm compressed with 0.8 mm metal sheet on both sidesSame as M1Same as M1Resistance (R) 3.85–4.33 K/W@0.1 m panel
Pit Rectangular Same as M1No pit3 m (W) × 4 m (L) × 0.4 m (D)
Floor (bedding system)Fully slatted plastic bedThe same as M1Sawdust bed to a depth of 0.4 m
Ventilation modeRecirculation flow by exhaust fan on the end wall in the middlePlug flow by exhaust fan on the outlet of a pipe in the pitRecirculation flow by exhaust fan on the end wall in the middle, connected to biofilter towerExhaust fan capacity of 400 m3/h
InletCircular inlet duct with perforated holes The same as M1The same as M1D 200 mm with perforated holes of Φ10 mm
Biofilter compositionCorrugated thin plastic sheet pack Two cellular pad sheetsHybrid with Biochar/FGD gypsum layerM1: 1.000 mm thickness, M2: 400 mm cellulose pad, M3: alternately biochar layer and FGD layer with depth of 100 mm
Biofilter orientation HorizontalVerticalHorizontal
Table 2. Volatile organic acids and odorous compounds in the interiors of M1 (with recirculation flow–vertical biofilter and slotted pit system), M2 (with plug flow–horizontal biofilter and slotted pit system), and M3 (with hybrid biochar/FGD layer biofilter and sawdust bedding) pilot swine houses.
VOC (ppbv)Swine House Types
Inside M1Inside M2Inside M3
Acetic acid87.3 ± 2.173.2 ± 1.823 ± 0.6
Propionic acid29.1 ± 0.720 ± 0.5ND
Isobutyric acid2.1 ± 0.11.9 ± 0.117.4 ± 0.4
Butyric acid15.4 ± 0.410.2 ± 0.2ND
Isovaleric acid5.7 ± 0.14.2 ± 0.10.2
Valeric acid729.4 ± 17.5489.8 ± 11.831.6 ± 0.8
P-cresolND0.5ND
Indole0.90.40.6
SkatoleNDNDND
Dimethyl sulfide13.3 ± 0.33.2 ± 0.12.4 ± 0.1
Dimethyl disulfide1.11.9 ± 0.1ND
Total VFA869 ± 20.9599.3 ± 14.472.3 ± 1.7
Total Phenol0.90.90.6
Total Sulfuric14.4 ± 0.35.1 ± 0.12.4 ± 0.1
Total VOA884.3 ± 15605.3 ± 10.375.3 ± 1.3
Values are expressed as mean ± standard deviation of replicate analysis. ND; not detected.
Disclaimer/Publisher’s Note: The statements, opinions and data contained in all publications are solely those of the individual author(s) and contributor(s) and not of MDPI and/or the editor(s). MDPI and/or the editor(s) disclaim responsibility for any injury to people or property resulting from any ideas, methods, instructions or products referred to in the content.

