Article

Detecting Changes in Soil Fertility Properties Using Multispectral UAV Images and Machine Learning in Central Peru

1
Estación Experimental Agraria Santa Ana, Dirección de Desarrollo Tecnológico Agrario, Instituto Nacional de Innovación Agraria (INIA), Carretera Saños Grande-Hualahoyo Km 8 Santa Ana, Huancayo 12000, Junin, Peru
2
Research Group on Nature Conservation and Climate Change, Facultad de Ciencias Forestales y del Ambiente, Universidad Nacional del Centro del Perú, Av. Mariscal Castilla 3909, Huancayo 12006, Junin, Peru
3
Estación Experimental Agraria Santa Ana, Dirección de Recursos Genéticos y Biotecnología, Instituto Nacional de Innovación Agraria (INIA), Carretera Saños Grande-Hualahoyo Km 8 Santa Ana, Huancayo 12000, Junin, Peru
4
Estación Experimental Agraria Santa Ana, Dirección de Servicios Estratégicos Agrarios, Instituto Nacional de Innovación Agraria (INIA), Carretera Saños Grande-Hualahoyo Km 8 Santa Ana, Huancayo 12000, Junin, Peru
5
Instituto de Investigación para el Desarrollo Sustentable de Ceja de Selva (INDES-CES), Universidad Nacional Toribio Rodríguez de Mendoza de Amazonas, Chachapoyas 01001, Amazonas, Peru
*
Authors to whom correspondence should be addressed.
AgriEngineering 2025, 7(3), 70; https://doi.org/10.3390/agriengineering7030070
Submission received: 19 December 2024 / Revised: 27 February 2025 / Accepted: 28 February 2025 / Published: 6 March 2025

Abstract

:
Remote sensing is essential in precision agriculture as this approach provides high-resolution information on the soil’s physical and chemical parameters for detailed decision making. Globally, technologies such as remote sensing and machine learning are increasingly being used to infer these parameters. This study evaluates soil fertility changes and compares them with previous fertilization inputs using high-resolution multispectral imagery and in situ measurements. A UAV-captured image was used to predict the spatial distribution of soil parameters, generating fourteen spectral indices and a digital surface model (DSM) from 103 soil plots across 49.83 hectares. Machine learning algorithms, including classification and regression trees (CART) and random forest (RF), modeled the soil parameters (N-ppm, P-ppm, K-ppm, OM%, and EC-mS/m). The RF model outperformed others, with R2 values of 72% for N, 83% for P, 87% for K, 85% for OM, and 70% for EC in 2023. Significant spatiotemporal variations were observed between 2022 and 2023, including an increase in P (14.87 ppm) and a reduction in EC (−0.954 mS/m). High-resolution UAV imagery combined with machine learning proved highly effective for monitoring soil fertility. This approach, tailored to the Peruvian Andes, integrates spectral indices and field-collected data, offering innovative tools to optimize fertilization practices, address soil management challenges, and merge modern technology with traditional methods for sustainable agricultural practices.

1. Introduction

Human activity is a significant factor in soil formation, influencing the composition and properties of topsoil and ultimately shaping the process of soil formation [1,2]. Humans significantly accelerate processes such as deterioration, nutrient depletion, and erosion of soil structure, compaction, acidification, alkalization, and salinization [3,4]. Assessing soil fertility encompasses a multifaceted process reliant upon various indicators, typically categorized into physical, chemical, and biological parameters [5]. Monitoring changes in these indicators over time facilitates the evaluation of a soil’s fertility status and the identification of potential limitations or imbalances, so that informed decisions can be made regarding factors such as deterioration, nutrient depletion, and soil erosion [6].
In general, the Andean Valley highlands have been utilized for agricultural purposes for centuries, leading to a decline in soil fertility and associated ecosystem services despite being managed with minimal inputs that limit productivity [7,8]. Consequently, there is a continuous demand for mineral and organic fertilizers, the application of which depends on factors such as demand, implementation efficiency, and logistical distribution [9]. It is necessary to adjust management practices to improve soil fertility and increase productivity. This involves evaluating the current state and analyzing quantitative changes in the physical and chemical components from a spatiotemporal perspective [10]; therefore, recognizing the effects of management techniques in agriculture is crucial for making informed decisions and ultimately striving for sustainable utilization of soil resources [11]. Given the intricate circumstances confronting agriculture, there is an urgent need to monitor the growth and health of crops across diverse environments and conditions [12]. Additionally, there is an immediate requirement to produce comprehensive maps detailing the spatial arrangement of soil attributes and their temporal fluctuations across different crop cycles within the framework of precision agriculture.
With the rapid development of spatial techniques in smart agriculture and cloud-based remote sensing [13], implementing a dynamic workflow to produce maps of topsoil fertility changes has become feasible; these maps are now indispensable for farmers and operators, allowing precise optimization of fertilization practices [14]. This optimization not only maximizes crop yields but also significantly improves profitability in agricultural operations by reducing resource waste and increasing efficiency in the use of inputs such as fertilizers and water [15]. This combination of precision and efficiency translates into smarter and more profitable agricultural resource management, providing economic and environmental benefits to beneficiaries.
In the field of precision agriculture, numerous studies have been conducted to investigate the spatial variability in various soil parameters using unmanned aerial vehicles (UAVs) [16,17,18]. These UAVs are frequently employed to obtain spectral data to estimate a wide range of parameters in different crops, such as biomass [19,20,21] and organic matter [22], predict crop yields [23,24], and assess water stress [25] and soil fertility [26]. Additionally, the generation of digital surface models (DSM) from UAV-collected data enables the creation of detailed representations of terrain and vegetation surfaces [18].
UAVs have emerged as key tools in agricultural monitoring and management, primarily due to their capability to calculate spectral indices such as the normalized difference vegetation index (NDVI), the soil-adjusted vegetation index (SAVI), and the enhanced vegetation index (EVI), among others [27]. These indices, essential for assessing soil and plant health and vigor, are based on the reflectance of vegetation in various electromagnetic spectrum regions, including the near-infrared and red wavelengths [28]. This enables the identification of stress patterns, nutrient deficiencies, and photosynthetic variability in crops [29]. Notably, SAVI adjusts for soil influence in areas with low vegetation cover, providing more accurate estimations in high-biomass terrains and supporting informed agricultural decision-making [30].
Additionally, multispectral imagery captured by UAVs delivers high-resolution and precise data while optimizing time and costs compared to conventional methods [31]. These features establish UAVs as essential tools in implementing sustainable agricultural practices and improving the management of agricultural resources [32].
Although UAVs have proven to be flexible and efficient tools in agricultural studies, they still face significant challenges in integrating spatial and temporal data for longitudinal investigations of soil fertility. Recent studies have highlighted the use of multispectral images obtained via UAVs to accurately map soil organic matter, a key indicator of fertility, using advanced machine learning (ML = algorithms [33,34,35].
Moreover, both multispectral and hyperspectral images have demonstrated their effectiveness in mapping macronutrients such as nitrogen [36], offering practical, reliable, and accessible alternatives. Furthermore, the incorporation of ML algorithms has proven valuable for predicting and analyzing the spatial and temporal variability in soil fertility [37,38,39]. However, methodological limitations persist, along with the need to standardize approaches for a comprehensive evaluation of spatial and temporal effects on soil fertility parameters.
In Peru, traditional agriculture in the valleys do not have adequate fertilization management; in order to improve yields, it is usual to use a constant formula, resulting in over or under fertilization [40].
The use of topographic data and spectral indices, in combination with soil property data across different seasons, allows a better understanding of nutrient extraction and soil vegetation turnover to optimize management practices according to the specific spatial variation [41]. By using UAV technology, it is possible to build soil properties maps at high spatial resolution [42], to detect changes in soil fertility in consecutive crop seasons and guide fertilization inputs.
In this context, the goal of the study is to detect changes in fertility-related soil properties in order to compare these variations with the fertilizer inputs for electrical conductivity (EC) (mS/m), nitrogen (N) (%), phosphorus (P) (ppm), potassium (K) (ppm), and organic matter (OM) (%). It is expected that these results will enable the appropriate decisions to be made regarding the management of soil fertility.

2. Materials and Methods

2.1. Study Area

Soil data collection was carried out at the Santa Ana Agrarian Experimental Center (hereafter Santa Ana) of the National Institute of Agrarian Innovation (INIA) (75°13′17.60″ W, 12°0′42.36″ S) (Figure 1), located within agricultural lands in the Mantaro Valley of the central highlands of Peru. Santa Ana has an altitudinal gradient range from 3303 to 3325 m.a.s.l. The plain landscape of the mountain valley dominates the physiography. With 477 mm of precipitation annually, the climate is defined by dry spells from May to August, transitional seasons from April to October, and rainy spells from November to March. With the lowest temperatures occurring between May and August and frost episodes occurring between July and August, the average temperature ranges from 3.90 to 20.2 °C [43,44]. With flood irrigation canals, the agricultural fields span 49.83 of the 67.08 ha that are divided among 30 parcels. October through May is when the seeding season takes place.

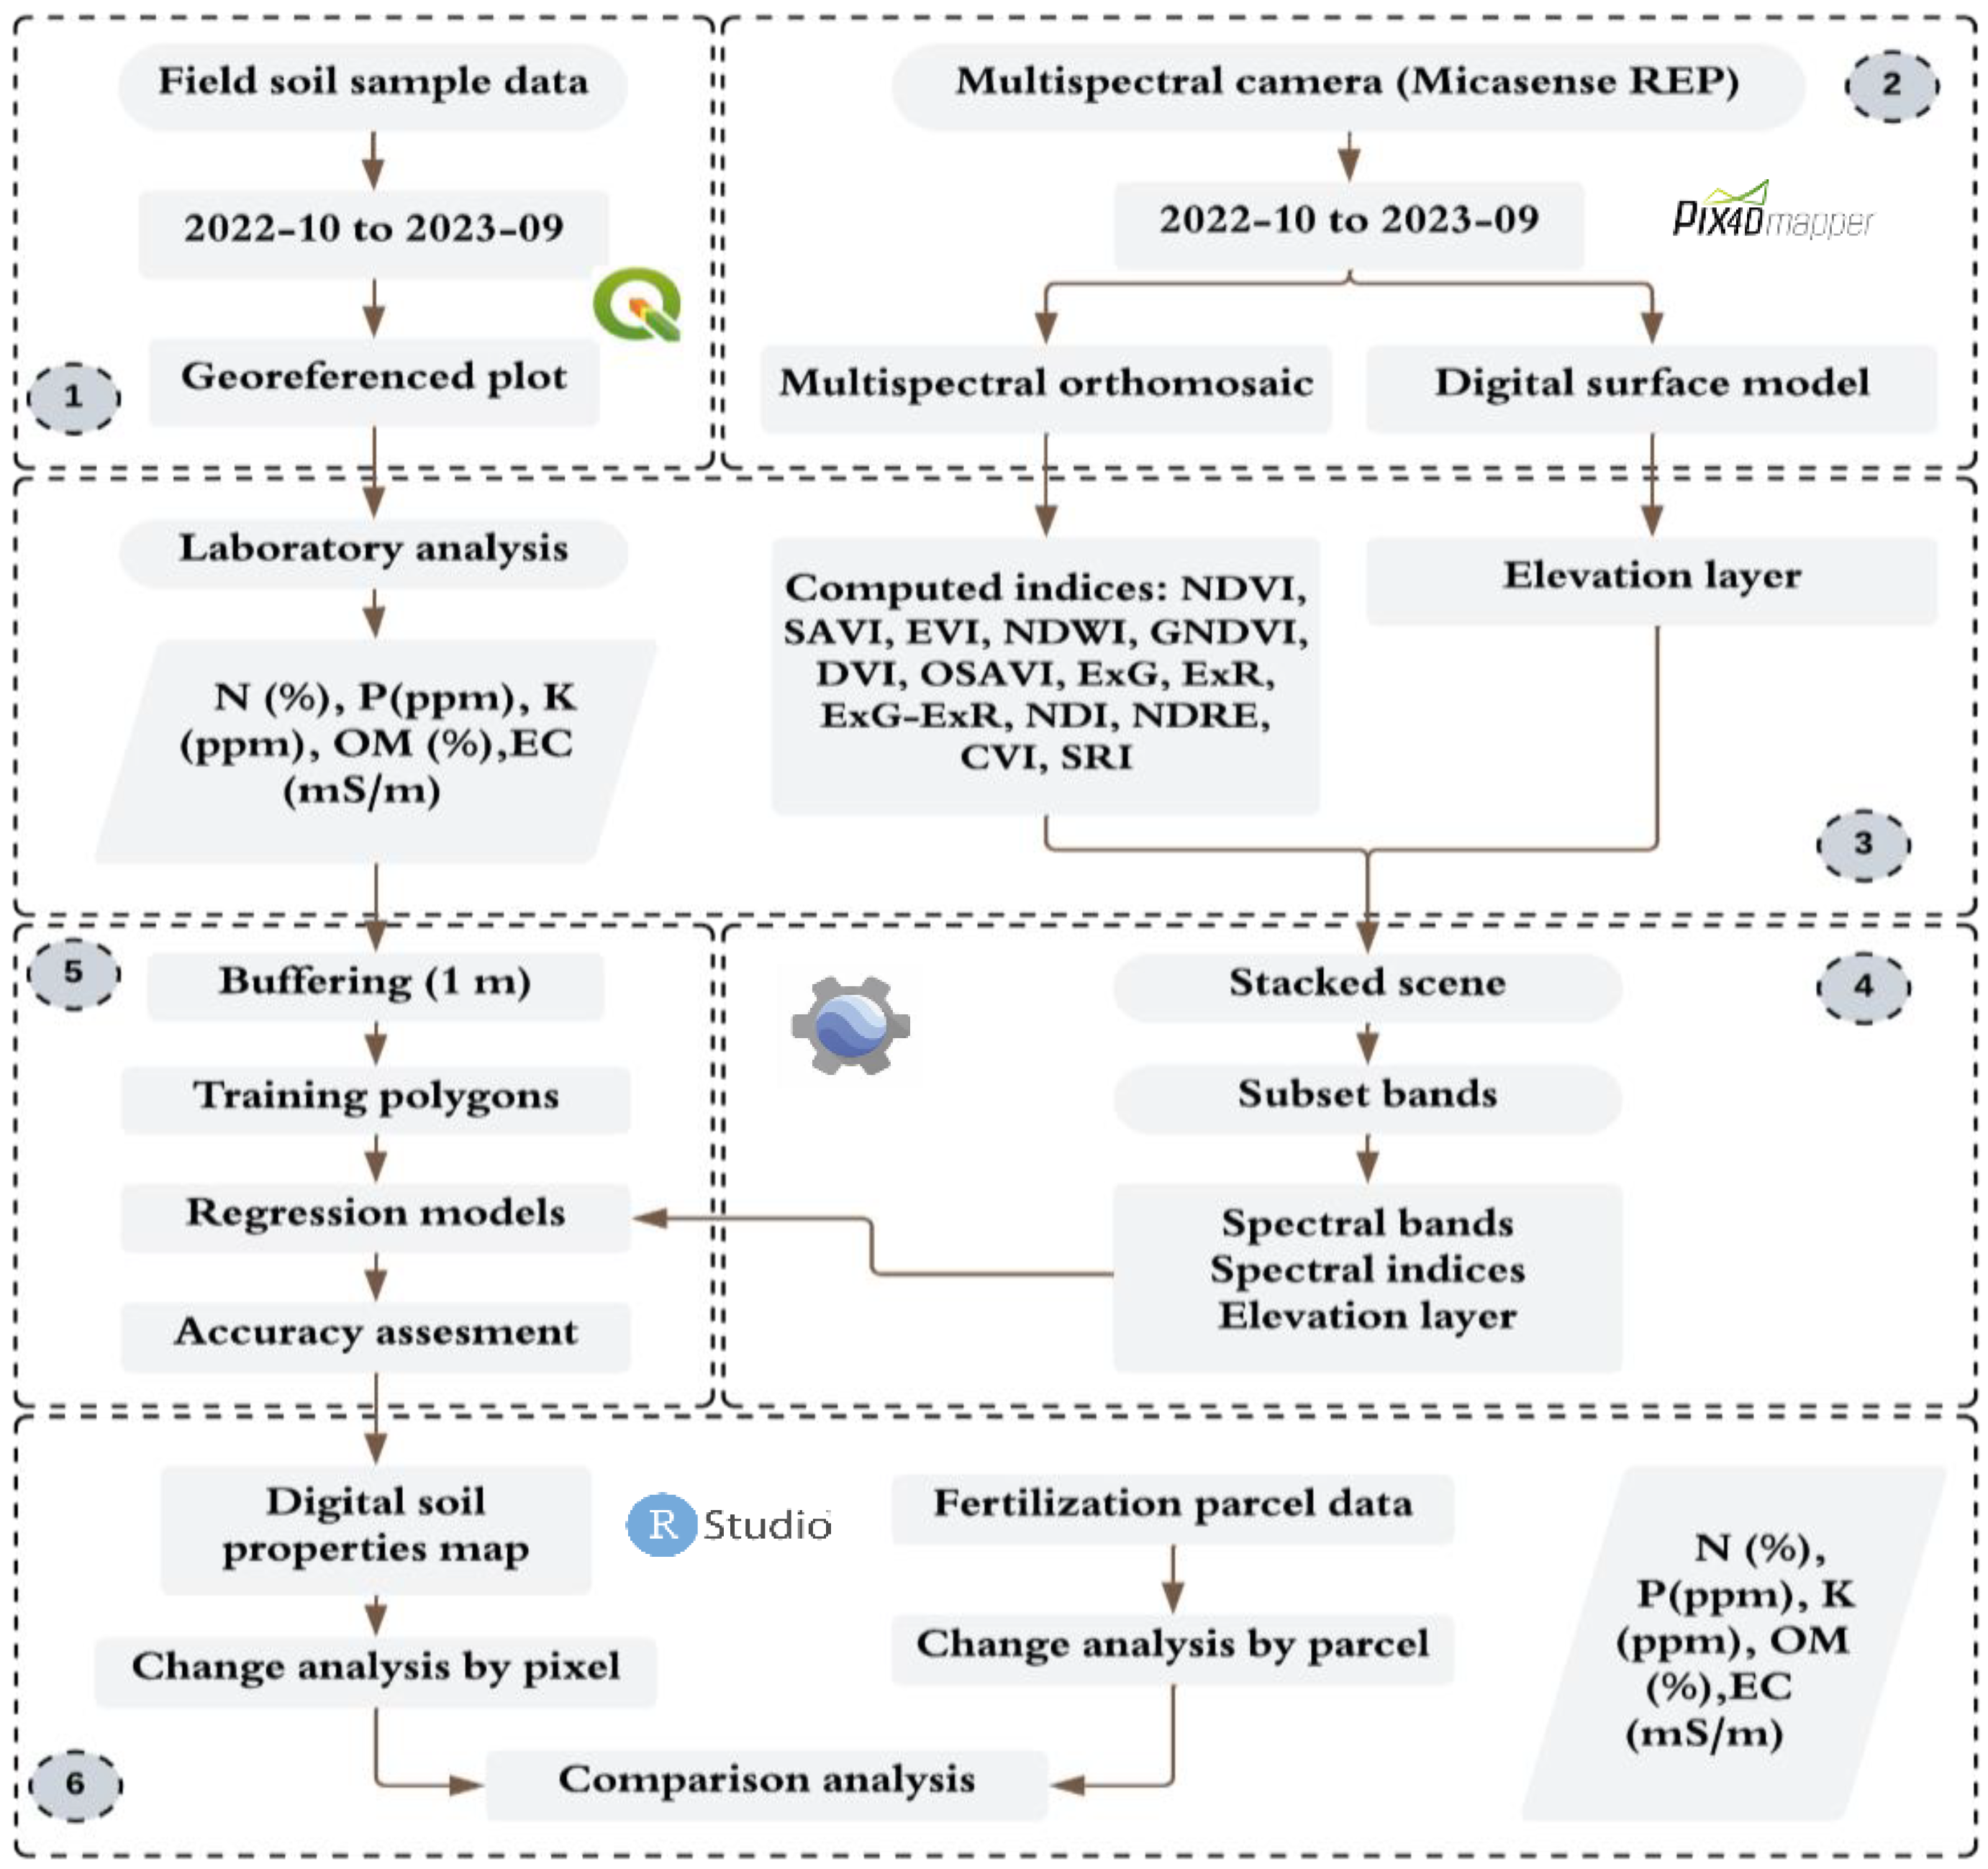
2.2. Methodological Framework

The whole methodological framework used in this investigation is depicted in Figure 2, which also offers a summary of the integrative and sequential procedures that were applied. The framework is elaborated upon in the following six methodological subsections.

2.3. Field Sampling of Chemical and Physical Soil Parameters

Composite samples were collected using five subsamples around a central point of each parcel, at a depth of 30 cm, and were georeferenced using a D-RTK 2-DJI GNSS GPS (DJI, Shenzhen, China). In October 2022, 46 samples were obtained as part of the investigation by Pizarro et al. [13] and 103 in September 2023 (Figure 2).
The increase in samples was due to a refinement of the sampling strategy to improve the spatial representativeness and statistical robustness of our results.
Because the calculation of the quality measures and their precision is basic and provides estimates that are somewhat accurate, this approach is easy to execute. The standard error of the projected quality measurements can be quantified without making any assumptions [45]. The Santa Ana “Laboratorio de Suelos, Aguas y Foliares” (LABSAF) conducted the physicochemical investigations to ascertain the soil’s EC, N, P, K, and OM. The materials underwent disaggregation, homogenization, and sieving (2 mm) after being dried at room temperature (15–30 °C). EC was calculated using the ISO 11265:1994/Cor 1 method [46], while the Mexican Official Standard [47] was used to measure OM, total nitrogen, and K.

2.4. Flight Planning and Image Acquisition Data

Table 1 presents the time and amount of aerial imagery acquired during the period of analysis. A total of 06 flights were planned to build soil maps for each year. The flights were executed at noon to minimize shadows and ensure high radiometric quality of the images captured by the multispectral sensor. To ensure data accuracy, a sensor calibration was performed before and after each flight.

2.5. Soil Fertility Parameters Classification

To carry out the classification and interpretation of soil parameters, we used (Table 2) the thresholds provided according to the Mexican Official Standard [47] and the guide for the interpretation of soil and water analysis [48]. These data encompassed various key parameters, such as OM, EC, total nitrogen content, available phosphorus, and potassium. A detailed classification has been established for these parameters using a standardized scale, which allows for precise interpretation of the results and facilitates meaningful comparisons across different geographical areas, time series, and agricultural contexts. Therefore, adopting it ensures that interpretations and comparisons adhere to the study area’s specific conditions.

2.6. Fertility Input Addition Information Survey

The inputs added to the study area (Figure 2) during the 2022–2023 agricultural cycle were fundamental to understanding the percentage variations observed through multispectral image analysis. Based on the results obtained from a survey conducted among the representatives and decision-makers of the 30 agricultural plots that make up Santa Ana, these variations were compared, validated, and discussed.
The survey was conducted in January and February 2024. It included questions about the use and application of organic and inorganic fertilizers such as nitrogen, phosphorus, potassium, and organic matter to the soils of the plots, the prioritized crop, and the quantities (bags or kilograms) of these inputs used. In total, 30 surveys were completed, which allowed for the collection of detailed information about the inputs used to prepare the crop fields. Notably, some inputs are chemical compounds, so a separation of the components was performed using the molar mass of the compound and calculating the mass fraction of each element. This procedure was applied to diammonium phosphate and potassium chloride (the most used and representative compounds) to record the quantities of kilograms applied and standardize the units in the elements.

2.7. Gathering and Analyzing Multispectral Images

A DJI Matrice 300 RTK UAV (DJI, Shenzhen, China) equipped with a multispectral camera (MicaSense, Inc., Seattle, WA, USA) has 3.2 megapixels of resolution (2064 × 1544 pixels) and five spectral bands (blue (475 ± 20 nm), green (560 ± 20 nm), red (668 ± 10 nm), NIR (840 ± 40 nm), and RE (717 ± 10 nm). The specifics of the UAV, camera, and flight plan are displayed in Figure 3.
The flight plan was executed roughly at noon local time, at a height above the ground of 150 m. The photos were taken every 2.0 s with 75% front and side overlap. Finally, these photos were stored in 16-bit.tiff format and calibrated using sun irradiance data and calibration reflectance panel to obtain reflectance values.
Pix4D Pro Mapper (Prilly, Switzerland) was used for the photogrammetric processing. The starting parameters are dependable for building the ortho-mosaic, as seen by the small (0.42%) relative variations between the original and optimized internal values. To increase the topographic accuracy of the point cloud and reflectance bands, we gathered 34 ground control points using a D-RTK 2-DJI GNSS GPS (horizontal: 1 cm + 1 ppm (RMS); vertical: 2 cm + 1 ppm (RMS). We then incorporated these points into the processing flow, resulting in a final ground surface distance (GSD) of 15.00 cm. Using triangulation, a digital surface model (DSM) was created from the point cloud at the same resolution as the reflectance map. It was then converted into a raster and exported in.tiff format.

2.8. Model Development and Statistical Analysis for Variable Extraction

Based on earlier research, we created a collection of 14 spectral indices that are frequently utilized in vegetation and soil studies in order to create the spatial soil parameters distribution models [13]. These indices consist of soil, water, and vegetation indexes. The reflectance values of each pixel were transformed into an observation replica that contrasted with the concentration value of the soil parameter of interest at each sampled site, which was a circular buffer with a diameter of 0.5 m. In order to forecast the soil’s fertility qualities, spectral indices that were chosen based on earlier research [13,49,50] were computed using various reflectance combinations and assembled as predictors alongside the pure spectral bands.

2.9. Spatial Analysis

The entire set of soil sample data was randomly split into training data (70%) and validation data (30%), and it was connected by coordinates with the predictor dataset (spectral bands, spectral indices, and DSM). In order to forecast fertility soil attributes, a number of models were created utilizing logic-based algorithms that are accessible on the GEE platform [50] and applied selectively to four dataset stacks: spectral bands, spectral bands + DSM, spectral indices, and spectral indices + DSM. Random forest (RF) and classification and regression trees (CART) were the ML regression techniques used. The versatile CART algorithm is effective for classification or regression analysis [51]. It organizes data into binary partitions via decision trees, mitigating data noise and handling missing or abnormal data. However, its stability is limited, making it a foundational model for more complex models like RF, which improves classification accuracy by aggregating predictions from independently built decision trees, making no assumptions about data distribution, handles discrete and continuous variables simultaneously and has robust nonlinear data extraction and generalization capabilities [52].
For random forest, we defined the number of decision trees generated as 100, leaving the other parameters default as in the other classifiers. Furthermore, a total of 120 models were built using a combination of predictors and input data. The models developed in GEE were assessed using accuracy metrics like R2, root mean square error (RMSE), and mean absolute error (MAE). These metrics helped us identify the combination of predictors that most effectively predicted soil fertility properties. For N, OM, and EC, we used CART, and spectral indices as predictors. The stack of spectral indices and DSM were optimal for predicting K and P through the RF model. These predictive models were used to create maps of soil properties in the study area.
Finally, to evaluate the evolution of agricultural soil properties, a percentage variation analysis was conducted. The annual percentage variation was calculated by determining the difference between the values of both periods and dividing this result by the value of the first year. These results, at the raster level, were represented on a final variation map. This analysis made it possible to identify the soil parameters that showed the greatest changes over time and to understand trends in soil quality.

3. Results

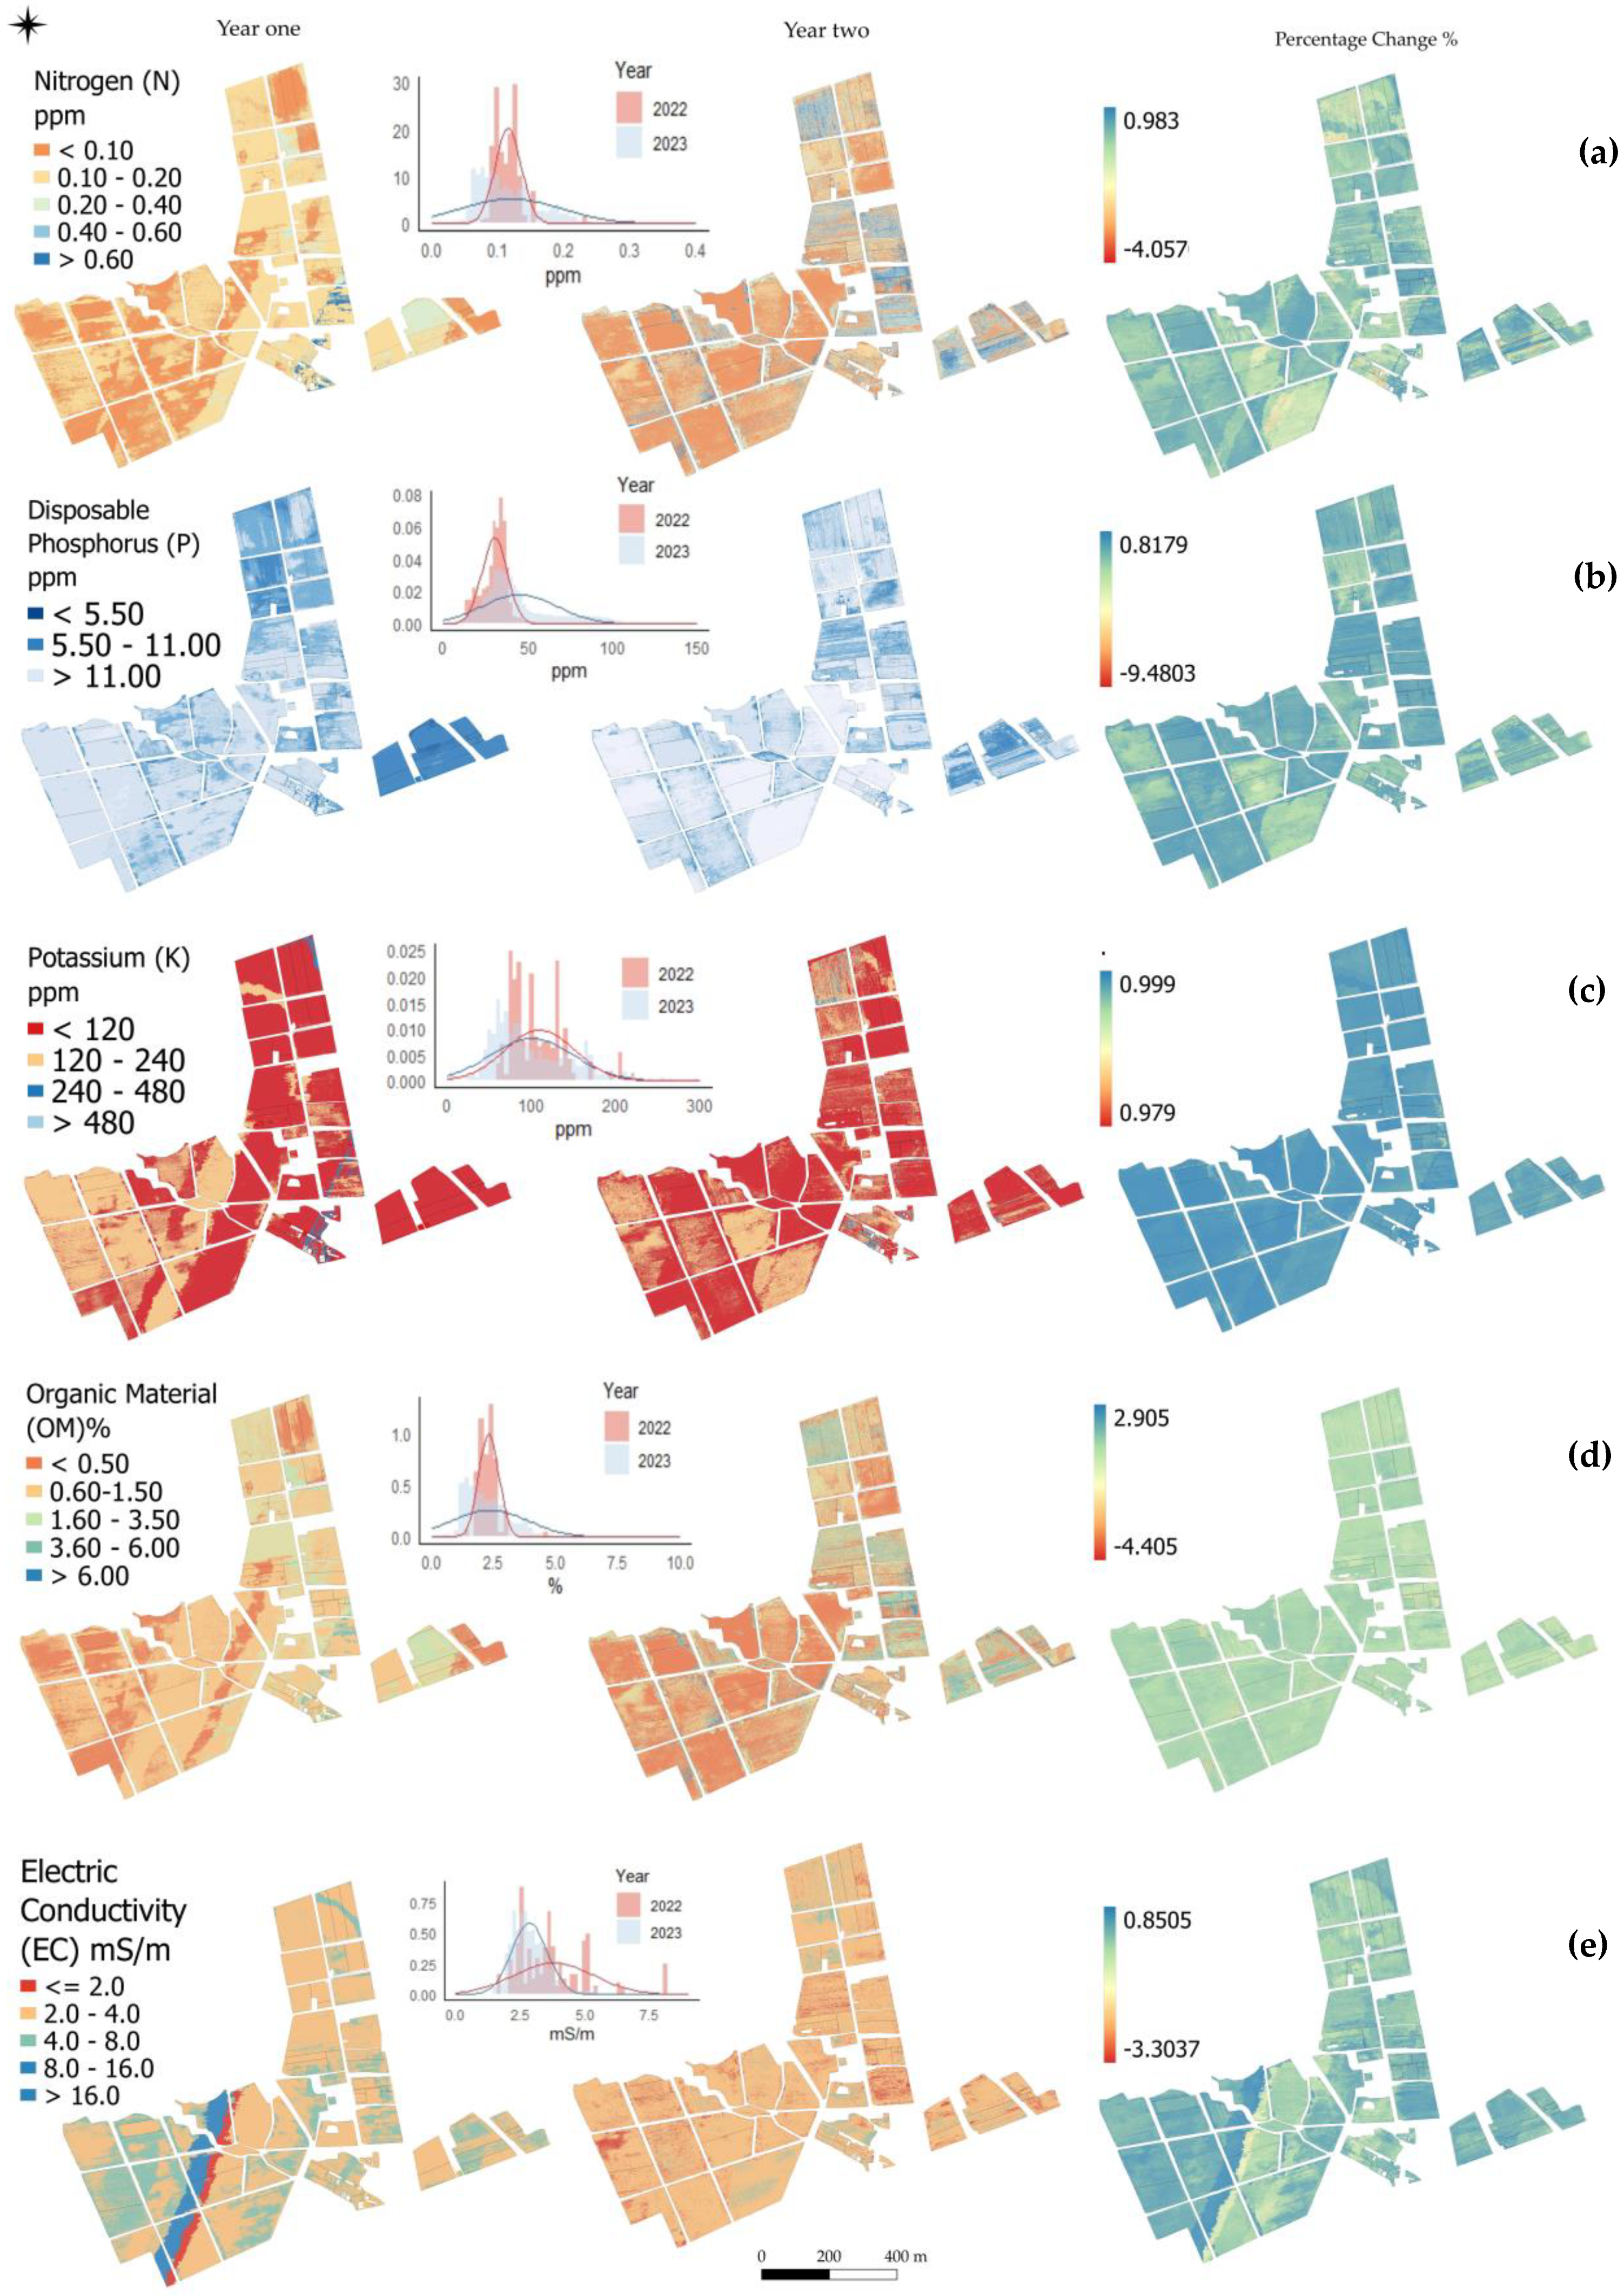
3.1. Descriptive Statistics and Change Detection of Soil Parameters

The descriptive statistics of the soil parameters for 2022 [13], and 2023, based on 46 and 103 samples respectively, are presented in Table 3. In 2023, the average concentration of all parameters, except EC (electrical conductivity), increased, as did their range of variation. The range of OM (organic matter) concentration in 2022 (2.295%) was somewhat narrower, with lower average values compared to 2023 (2.349%). Additionally, the mini-mum value of all parameters increased in 2023, while the maximum value decreased for OM and EC.
A particular case is potassium (K), which presents a high standard deviation, indicating a great heterogeneity in the sampled values. This high variability is probably attributable to irregular fertilization, resulting in marked differences in potassium concentrations between samples. Similarly, phosphorus (P) exhibits wide dispersion in the data. This variability is associated with differences in the retention capacities and availability of phosphorus between the different areas, which are influenced by the textural and compositional heterogeneity of the soil.
The data presented in Table 3 show the quantification of the N content in the soil, an essential nutrient for plant development, measured in ppm. During 2022, the average concentrations recorded were 0.115 ppm. However, in 2023 a higher concentration range was observed, with an average of 0.120 ppm. It should be noted that the average level of N increased considerably compared to the previous year, reflecting an average increase of 0.002%. On the other hand, total P concentrations in the soil experienced a considerable increase between the two years by an average of −0.538%. Regarding K, a key macronutrient in plant metabolism, a downward trend was observed in the maximum and minimum values between both years.
Unlike the previous parameters, there was a reduction in both the maximum and minimum values of potassium in the year 2023, with a decrease of 0.146 times for the maximum values and 0.906 times for the minimum values compared to 2022, noting a percentage variation of 0.998. For the OM parameter, measured as a percentage, which influences the physical, chemical, and biological parameters of the soil, the minimum values were 1.480% in 2022 and 0.700% in 2023, while the maximum values were 4.570% in 2022 and 7.999% in 2023, presenting reduced variations and an average variation of 0.992% between both years.
Finally, the EC measured in dS/m showed a minimum value of 1580 dS/m, a maximum of 9370 dS/m, and an average of 3786 dS/m in 2022, while in 2023, the values were 1400 dS/m for the minimum, 6800 dS/m for the maximum. This parameter presented a slight reduction in its maximum value, with a decrease of at least 0.377 times, varying by 0.140 percent. The analyzed parameters are key indicators of soil fertility and quality, whose spatiotemporal variability can influence crop yields and require specific management practices.
Table 4 shows the metrics that were used to evaluate the accuracy of the prediction models. It was observed that, for 2023, the values of R-squared N, P, K, OM and CE are explained by 71%, 81%, 65%, 70% and 73% for the CART model and 72%, 83%, 87%, 85% and 70% for the RF model, respectively, of data variability, indicating a good fit of the model. Likewise, for 2022 the values explain a good fit of the model, with ranges between 82%, 83%, 55%, 81% and 89% for the CART model and 82%, 89%, 71%, 82% and 87% for RF, respectively. On the other hand, the square root of the mean RMSE errors in 2023 explains a low error magnitude for nitrogen (N) (0.20), OM (0.56), EC (0.48), and considerably larger for P (3.25) and K (2.91).
Therefore, the model would be quite accurate for N, OM and EC. While for 2022, the RMSE shows a low squared error in N (0.01) and OM (0.20) and considerably higher in K (27.70). Additionally, regarding the MAE values, they indicate that the errors in N, P, K, OM and EC are 4.28, 0.25, 0.03, 0.01 and 0.08 for 2023, and for 2022, they are 5.36, 0.40, 0.001, 0.05 and 0.03, respectively. This indicates that, on average, the model predictions in N, OM and EC are very close to the observed values. Finally, the combination of the two datasets resulted in the lowest accuracy metrics for both the training and test partitions. For this reason, we decided to use the individual datasets for 2022 and 2023 separately, as they demonstrated better performance metrics.

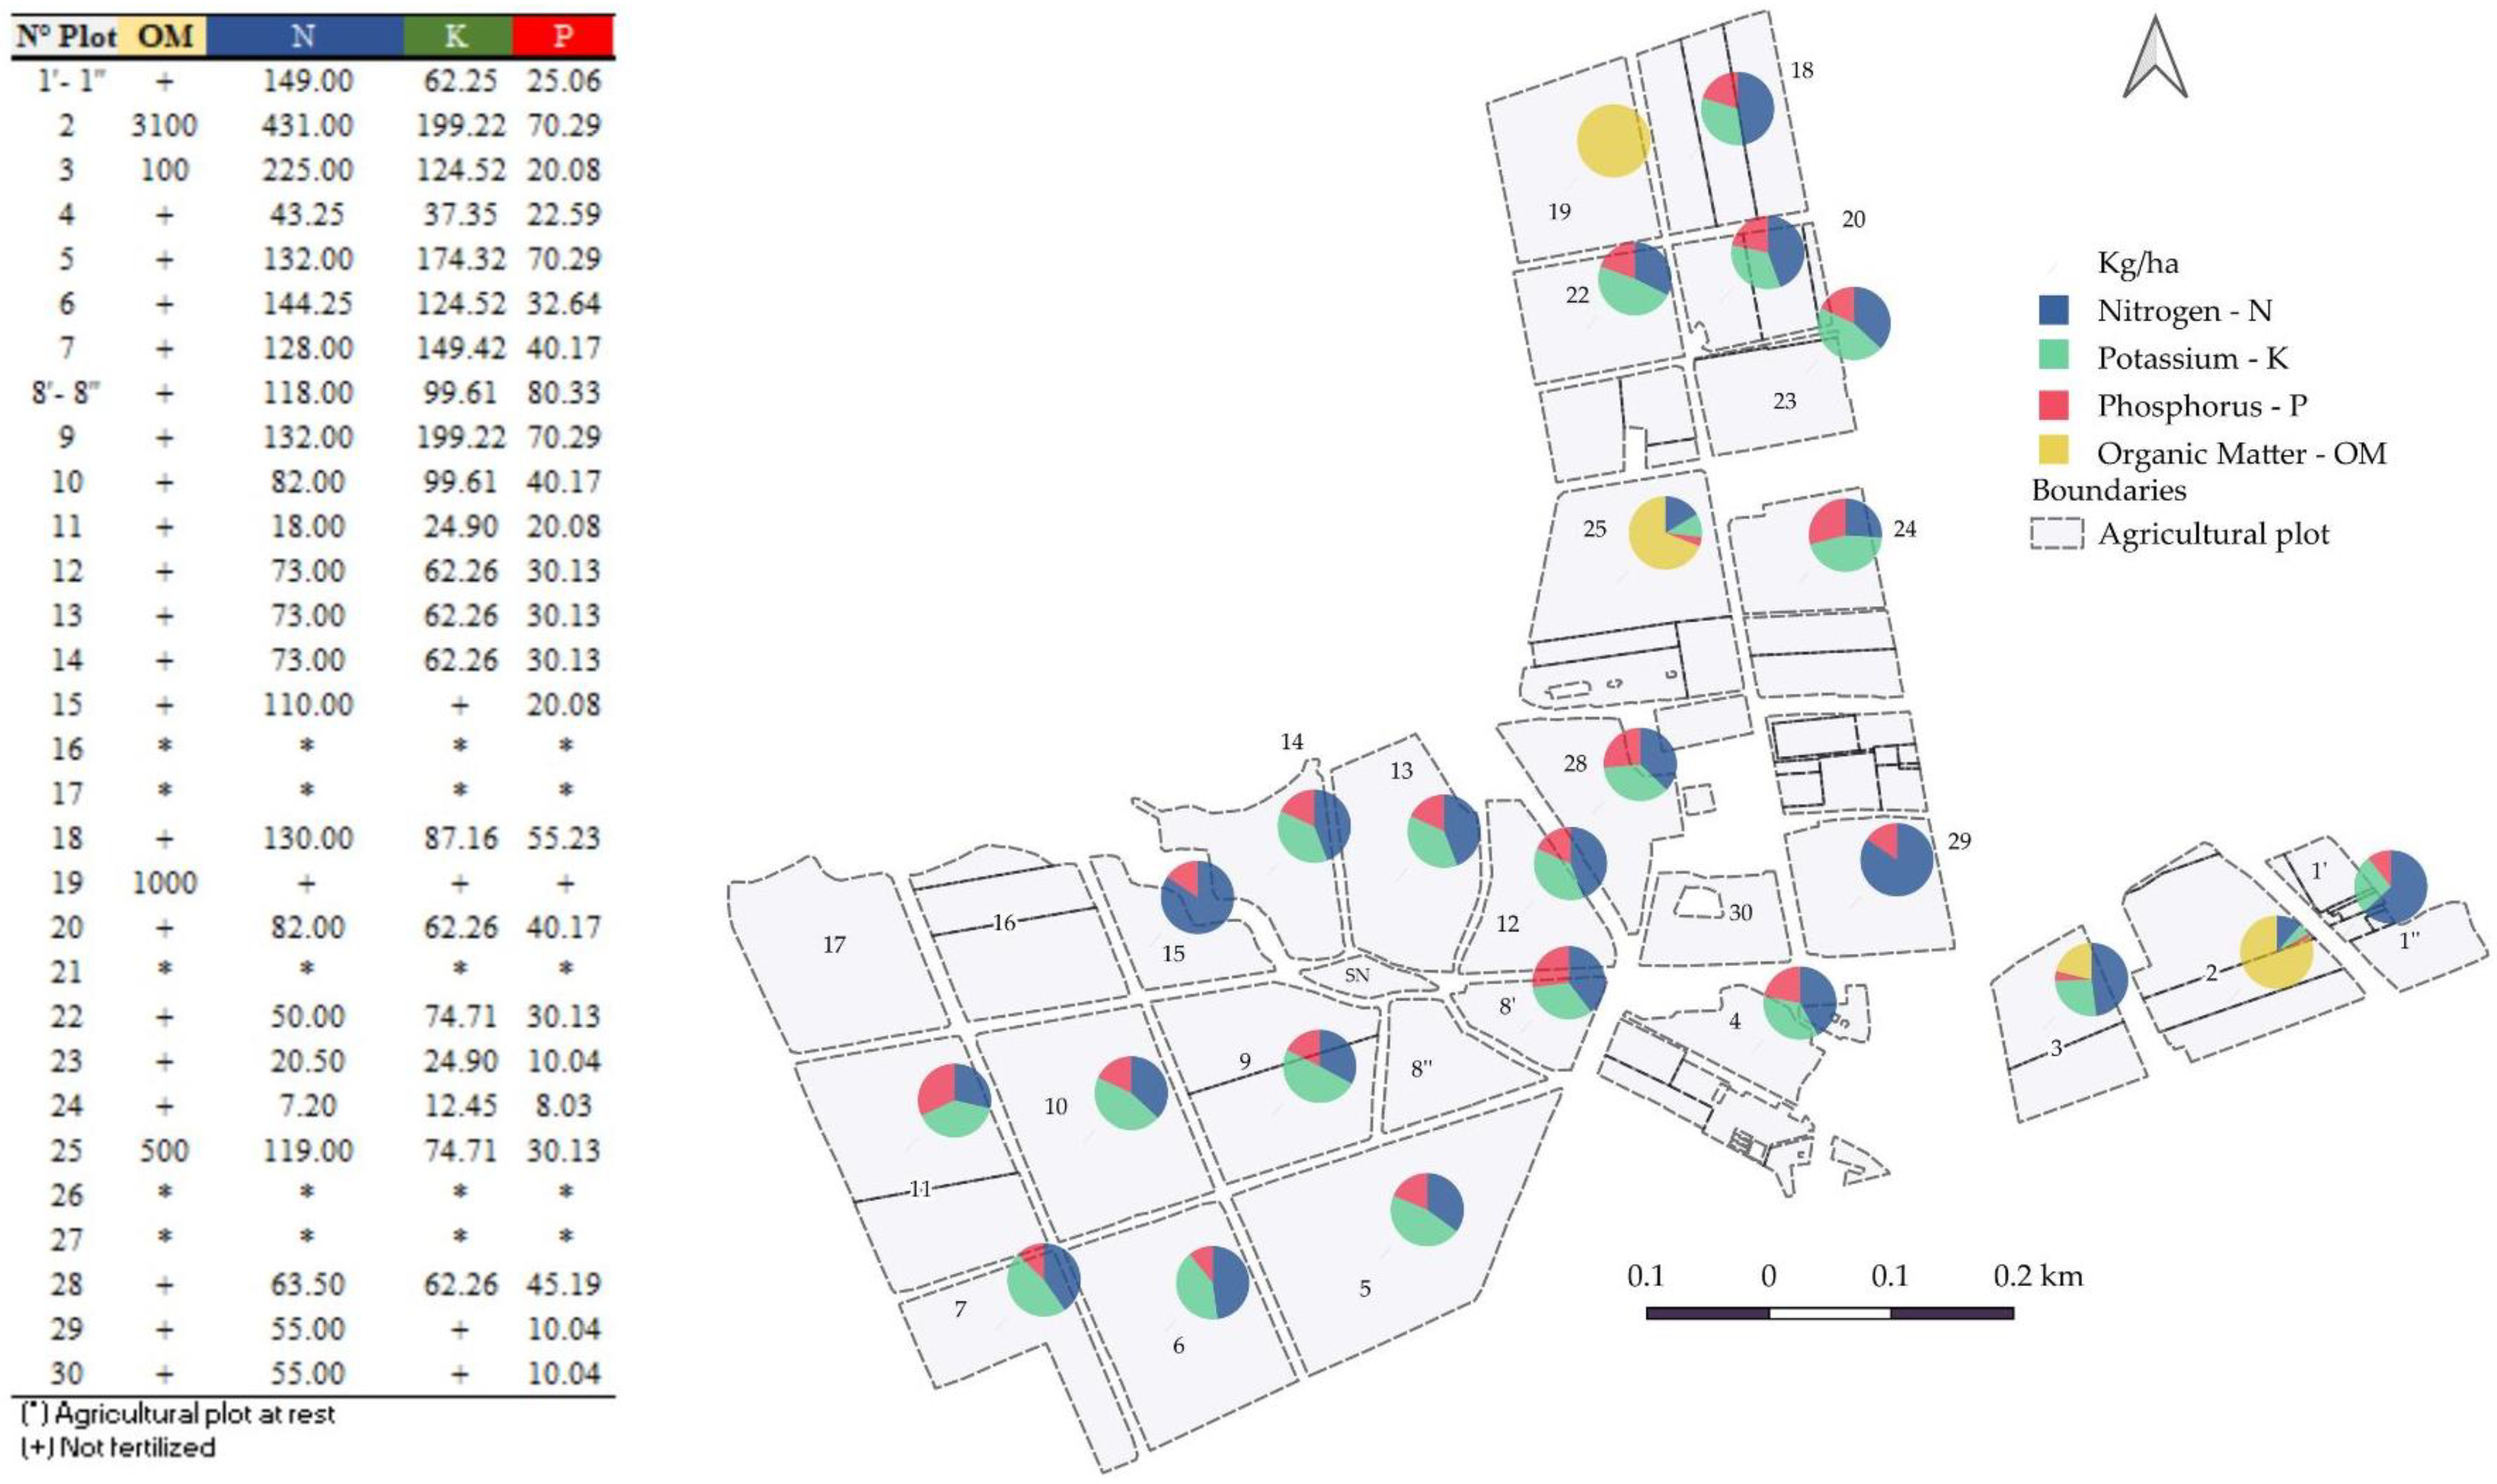
3.2. Information on Fertility Inputs

Figure 4 presents a detailed pie chart illustrating the specific input of fertilizers applied on each parcel at the Santa Ana Center during 2023. This information provides a comprehensive overview of the fertilization strategy implemented, including the nutrients supplied, the applied doses, the types of fertilizers used, and the timing of application. It also shows the doses of N, P, K, and OM applied to each plot.
It is worth noting that fertilizer doses vary according to the crop and its developmental stage. For example, plots with corn, potatoes, pastures, and forages received higher doses of nitrogen in the form of urea during fruit or tuber development, a critical period for nutrient absorption and biomass generation.
Carefully selected fertilizers were used based on the specific requirements of each crop and soil characteristics. Among the most used compounds are diammonium phosphate (source of N and P), potassium chloride (source of K), and urea (source of N). The application was carried out in kg/ha, following recommendations from specialists with extensive experience in fertilization management.
Recognizing the critical role of organic matter in soil fertility and health, this study incorporated organic material from various sources, including composted waste from camelids, sheep, cows, and guinea pigs. The selection of these materials was based on their local availability and their potential to improve the physical, chemical and biological parameters of the soil. It is important to note that plots 16, 17, 21, 26 and 27 did not receive any fertilization during the year 2023 because they were in a resting phase as part of a crop rotation system. This practice allows for the restoration of soil fertility, reduction in pest and disease incidence, and diversification of agricultural production.
Figure 4 offers a valuable graphical representation of the fertilization strategy implemented at the Santa Ana Station during the year 2023, showing in the summary table the total quantities of compounds and elements supplied specifically, reaching 144.25 kg/ha of nitrogen on the 06 plot and as low as 7.20 kg/ha on the 24 plot. The detailed information of the nutrients supplied, applied doses, types of fertilizers used, and timing of application provides fundamental insights for evaluating the efficiency of fertilization and its impact on crop yield. Furthermore, the incorporation of organic matter and the implementation of crop rotation demonstrate a comprehensive and sustainable agronomic approach to soil management.

3.3. Spatial Model of Nutrient Addition to Agricultural Soils

A comprehensive analysis of the soil fertility over two years is presented in Figure 5 through the creation and comparison of five thematic maps of fertility parameters. The first five maps in the first column correspond to the year 2022, which can also be found in the study by Pizarro et al. [13]. These maps show the spatial distribution of essential nutrients such as N, K, P, and OM, as well as EC, which are related to necessary parameters. These maps provide a detailed view of the heterogeneity of soil fertility in the study area, highlighting the concentrations of each analyzed element. Additionally, these data can be examined in greater detail in Table 1, facilitating a deeper understanding of the distribution and variability of these parameters.
In 2023, five additional maps were submitted, revealing temporal changes in the concentrations of nutrients and key soil parameters in the Santa Ana plots. These maps were generated by extracting a larger number of soil samples from diverse areas, creating more robust and complex models. The temporal comparison between the 2022 and 2023 maps allows a detailed assessment of soil nutrient dynamics and the identification of notable patterns of change. Variations in concentrations are observed to be mainly influenced by anthropogenic activities, such as the use of fertilizers, which is corroborated by surveys on the addition of different types to each plot (Figure 4). The percentage change refers to the difference between the pixels generated for each year, divided by the value of the first year.
For P, a reduction is noted in 2023, with most pixels concentrated between 5.50 and 11 ppm. Organic matter shows little notable variation, decreasing on average from a range of 2.5% in 2022, to more spaced values of 0.50 to 6% in 2023, due to the addition of compost in some lots (Figure 4). Regarding N, changes are also observed in plots 03, 04, 24, 29 with variations from 0.10 ppm in 2022 to 0.20–0.40 ppm in 2023, but with greater dispersion. This was anticipated due to low seasonal fertilization with urea to promote growth in pastures and forage crops. The variation in K is almost uniform in 2023, with all plots approaching their average of 120–240 ppm, compared to peaks higher than 480 ppm in 2022.
Finally, five percentage variation maps comparing 2022 and 2023 are included, along with histograms that visualize the distribution of values and trends in soil fertility variability. The latter shows a negative variation in 2023 for most of the studied plots. This integrated approach provides a comprehensive understanding of the dynamics of soil fertility, serving as a basis for decision-making in agricultural resource management.

4. Discussion

UAV-based fertility monitoring in areas where agriculture needs sustainable intensification to meet global food demands will assist in efficient water and soil management, integrated with crop practices for enhanced productivity to reduce environmental impacts [53]. This study illustrates that it is feasible to monitor soil fertility-related properties through UAV multispectral imagery, alongside platforms like GEE and machine learning models such as RF and CART.
The values estimated for the soil properties show noticeable changes in the soil fertility for the period from 2022 to 2023, for N, K, and P, while variations in soil EC and OM were less pronounced. These changes can be attributed to a variety of factors affecting the chemical properties of the soil and their spatial distribution, including soil management practices such as crop type, fertilization, and irrigation [54,55].
The range of N concentrations varied between years, reflecting the typical variability in agricultural environments and highlighting the complexity of the biogeochemical nitrogen cycle in these ecosystems [56]. This variability is influenced by various factors, such as agricultural practices and soil biological activity [57]. The decrease in N concentration suggests the loss of soil nutrients that should be replaced to avoid negatively impacting crop health and soil quality [58] In the case of K, most plots showed a reduction in concentration, attributed to its extraction during harvesting [59,60], which could affect soil productivity if not properly compensated [61]. On the other hand, P concentrations showed no significant changes between the two years, remaining within the range of 120–240 ppm, which is considered optimal or high for agricultural soils [62]. OM content showed minor fluctuations, with a notable increase in some plots. This increase is due to the incorporation of large amounts of manure from alpacas, sheep, and guinea pigs managed in Santa Ana as part of strategies to improve soil health and agricultural productivity [61], within a circular economy approach [63]. Regarding EC, a slight decrease was observed, indicating a reduction in soil salinity. This could benefit agricultural production by improving water and nutrient absorption, as well as helping to maintain a balanced pH, which is essential for efficient nutrient translocation in the soil [64].
The interannual variability in soil fertility properties and their spatial distribution represent a significant challenge for the accuracy of the developed predictive models. While machine learning models can be adjusted to specific datasets and generate precise predictions, combining data from different sources and periods increases the dispersion of predictor variables and the range of responses. This introduces greater variability into the modeling process, which may compromise model accuracy [65,66].
This phenomenon is related to transfer learning, which seeks to improve a model’s predictive capability in a target domain by utilizing information from a source domain, but its effectiveness depends on the similarity between both domains [67], including considerable variations in the accuracy [68].
Our results showed that, for 2022, in most parameters (N, P, OM, and EC), the CART and random forest models performed slightly better compared to 2023, with R-squared values ranging from 55% to 89% for CART and from 70% to 89% for RF. For N, P, OM, EC, the obtained metric values for both RF and CART demonstrated good fit, considering that models with the highest R-squared values, and RMSE and MAE values closest to zero, are deemed the best for predicting soil properties [69]. These findings align with previous studies reporting similar values when using RF for soil property prediction [70], outperforming other models such as XGBoost, PLSR, and SVRM, whose results showed lower predictive performance [37,71], suggesting that these models exhibit greater variability in prediction errors.
Various studies have focused on identifying the most efficient models for estimating soil fertility. For example, RF combines multiple decision trees to predict soil nutrients [72], while XGBoost, an optimized decision tree algorithm, has proven efficient in evaluating total nitrogen content [73]. In the case of K, the CART model showed a lower explanatory capacity for variability compared to RF, similar to another report [74]. Regarding soil spectroscopy, studies indicate that partial least squares regression (PLSR) [71] and support vector regression machine (SVRM) [74] are the most intuitive models. In this study, RF and CART efficiently managed the complexity of multispectral data based on fertility parameters, making these results robust and accurate.
Additionally, in proximal spectrometry like multispectral microsensors mounted on UAVs, reflectance measurements are highly sensitive to factors such as illumination and observation geometry, which can cause variations in the captured radiance [75], including soil roughness variability and crop residues. Even with the use of calibration panels used commonly to correct these effects, their adjustments are approximate and do not ensure complete reflectance correction [76], making the integration of multiple multispectral photo sources complicated, given the variations in reflectance corrections.
Therefore, it is necessary to develop more robust methods to reduce the influence of these variations in spectral measurements [77], and use harmonization techniques in the same way that they are used to merge multisource satellite imagery, knowing that systematic sampling for small-scale variability is time-consuming and costly, and that field evaluations are necessary for reducing uncertainty and enhancing predictive model accuracy.
The findings underscore the importance of continuously monitoring the concentrations of nitrogen, potassium, phosphorus, and other key parameters in agricultural systems. Various factors, such as crop absorption, human activities, and agricultural management practices, including the use of agrochemicals and fertilizers, influence variations in these nutrients. These results highlight the need to implement sustainable agricultural practices that reduce nutrient loss and promote a healthy balance in soil biogeochemical cycles, a concept supported in the work of [78].
The incorporation of new technologies in agriculture is emerging as a solution to challenges in agricultural production. One of the remote sensing tools increasingly used in various studies for soil fertility prediction is satellite imagery from platforms such as ZH-1 or Sentinel-2 [73], which enables the monitoring of large areas. Additionally, other techniques, such as Vis–NIR reflectance spectroscopy, facilitate rapid soil parameter evaluation [74]; however, they require specialized and costly equipment. In this study, unmanned aerial vehicles (UAVs) were used to predict soil nutrient variability during the period 2022–2023. These UAVs are characterized by providing high-quality, high-resolution images of small agricultural areas [79,80], such as Santa Ana, which consists of small plots. Furthermore, integration was performed with platforms such as Google Earth Engine (GEE) and machine learning models, including random forest (RF) and classification and regression trees (CART), to predict soil properties. The predictive model performance was similar to that reported in similar studies [81,82,83].
This study validates a workflow that integrates machine learning and field data within a cloud computing environment to map soil properties across multiple seasons, based on the reflectance of bare soil composites of agricultural plots. A key finding is that models developed in different years, despite showing high accuracy when trained and validated independently, are not interchangeable due to interannual variations in soil conditions [84]. This highlights the importance of year-specific modeling for achieving accurate predictions. Nevertheless, this approach enables effective interannual monitoring of soil fertility.
Additionally, before conducting field data collection via photogrammetry, it is crucial to establish control points in the study area to ensure data accuracy. It is recommended to conduct UAV flights between 10:00 a.m. and 3:00 p.m. to minimize the impact of shadows in images, which could distort reflectance values and affect analysis quality.
Finally, traditional soil analysis methods remain fundamental, as they provide essential reference data for validating and calibrating ML-based models. In particular, studies have demonstrated that visible and near-infrared (Vis–NIR) spectroscopy combined with machine learning techniques can improve the prediction of soil properties such as cation exchange capacity. However, it is still necessary to validate these models with conventional analyses to ensure their reliability [84].

5. Conclusions

The present study demonstrates that monitoring soil fertility parameters using multispectral imagery obtained with UAVs, in combination with machine learning algorithms such as CART and random forest, constitute a robust and efficient methodology for evaluating soil fertility properties. The results highlight the ability of this approach to identify significant changes in fertility parameters, including concentrations of phosphorus (−0.538 ppm), nitrogen (0.002 ppm), potassium (0.998 ppm), electrical conductivity (0.992 mS/m), and organic matter (0.140%) during the 2022–2023 period.
UAVs equipped with multispectral sensors have become essential tools in precision agriculture due to their ability to generate high-resolution spectral indices, enabling real-time monitoring of soil properties. This technology facilitates the early detection of deficiencies of nutrients in soil and the implementation of adaptive management plans aimed at optimizing productivity. However, the study also highlights certain limitations, such as the need to standardize analytical methods and reflectance correction improvement to model the spatial distribution of soil properties. The integration of additional data sources, such as satellite imagery and ground-based sensors, along with the extension of the monitoring period and the inclusion of a greater diversity of soil parameters, could deepen the understanding of soil dynamics and significantly enhance the accuracy of predictive models.
The integration of UAVs and machine learning represents a significant advancement in soil fertility monitoring, contributing to the development of more efficient, sustainable, and resilient agriculture. Future research should focus on reflectance harmonization techniques, optimizing the models used and incorporating emerging technologies for continuous monitoring of changes in soil properties, to expand the scope and applicability of these systems in diverse agricultural contexts.

Author Contributions

L.E., K.O., J.U. and S.P. (Samuel Pizarro): conceptualization; D.C. and S.P. (Samuel Pizarro): methodology; L.E., D.C., C.R. and S.P. (Samuel Pizarro): software; J.U. and K.O.: validation; S.P. (Solanch Patricio) and L.E.: formal analysis; L.E., M.O.-C., E.B. and S.P. (Samuel Pizarro): investigation; J.U. and L.A.: resources; L.E., D.C., K.O. and C.R.: data curation; K.O. and S.P. (Samuel Pizarro): writing—original draft preparation; K.O. and S.P. (Solanch Patricio): writing—review and editing, D.C., J.U., L.A., M.O.-C., E.B. and S.P. (Solanch Patricio): visualization; M.O.-C., E.B. and S.P. (Samuel Pizarro): supervision; M.O.-C., S.P. (Samuel Pizarro) and L.A.: funding acquisition. All authors have read and agreed to the published version of the manuscript.

Funding

The Ministry of Agrarian Development and Irrigation (MIDAGRI) of the Peruvian Government provided funding for this study through the project “Creación del servicio de agricultura de precisión en los Departamentos de Lambayeque, Huancavelica, Ucayali y San Martín 4 Departamentos” (grant number CUI 2449640). It also received support from the Vice-Rectorate for Research of the Universidad Nacional del Amazonas Toribio Rodríguez de Mendoza—UNTRM.

Data Availability Statement

Data available on request.

Acknowledgments

Special thanks are extended to the collaborators involved in field data collection and assistants of the Precision Agriculture Project (CUI 2449640) as well as other research programs of the “Estación Experimental Agraria Santa Ana”, INIA.

Conflicts of Interest

The authors declare no conflicts of interest.

References

  1. Taghizadeh-Mehrjardi, R. Agropedogenesis: Humankind as the 6th soil-forming factor and attractors of agrogenic soil degradation. Geophys. Res. Abstr. 2019, 49, 1–42. [Google Scholar] [CrossRef]
  2. Kuzyakov, Y.; Zamanian, K. Reviews and syntheses: Agropedogenesis-Humankind as the sixth soil-forming factor and attractors of agricultural soil degradation. Biogeosciences 2019, 16, 4783–4803. [Google Scholar] [CrossRef]
  3. Homburg, J.A.; Sandor, J.A.; Norton, J.B. Anthropogenic influences on Zuni agricultural soils. Geoarchaeology 2005, 20, 661–693. [Google Scholar] [CrossRef]
  4. Alori, E.T.; Adekiya, A.O.; Adegbite, K.A. Impact of Agricultural Practices on Soil Health; Springer: Berlin/Heidelberg, Germany, 2020; pp. 89–98. [Google Scholar] [CrossRef]
  5. Moran, E.F.; Brondizio, E.S.; Tucker, J.M.; da Silva-Forsberg, M.C.; McCracken, S.; Falesi, I. Effects of soil fertility and land-use on forest succession in Amazônia. For. Ecol. Manag. 2000, 139, 93–108. [Google Scholar] [CrossRef]
  6. Ghimire, R.; Thapa, V.R.; Acharya, P.; Wang, J.; Sainju, U.M. Soil Indicators and Management Strategies for Environmental Sustainability. In Soil Science: Fundamentals to Recent Advances; Springer: Berlin/Heidelberg, Germany, 2021; pp. 127–140. [Google Scholar] [CrossRef]
  7. Fonte, S.J.; Vanek, S.J.; Oyarzun, P.; Parsa, S.; Quintero, D.C.; Rao, I.M.; Lavelle, P. Pathways to Agroecological Intensification of Soil Fertility Management by Smallholder Farmers in the Andean Highlands. Adv. Agron. 2012, 116, 125–184. [Google Scholar] [CrossRef]
  8. Visscher, A.M.; Vanek, S.; Huaraca, J.; Mendoza, J.; Ccanto, R.; Meza, K.; Olivera, E.; Scurrah, M.; Wellstein, C.; Bonari, G.; et al. Traditional soil fertility management ameliorates climate change impacts on traditional Andean crops within smallholder farming systems. Sci. Total Environ. 2024, 912, 168725. [Google Scholar] [CrossRef]
  9. Rao, D.L.N.; Dey, P.; Reddy, K.S. Plant demand adapted fertilization in organic and precision farming. In Environmental Science and Engineering; Springer: Berlin/Heidelberg, Germany, 2021; pp. 137–166. [Google Scholar] [CrossRef]
  10. Chen, S.; Lin, B.; Li, Y.; Zhou, S. Spatial and temporal changes of soil properties and soil fertility evaluation in a large grain-production area of subtropical plain, China. Geoderma 2020, 357, 113937. [Google Scholar] [CrossRef]
  11. McBratney, A.; Field, D.J.; Koch, A. The dimensions of soil security. Geoderma 2014, 213, 203–213. [Google Scholar] [CrossRef]
  12. Hatfield, P.L.; Pinter, P.J. Remote sensing for crop protection. Crop Prot. 1993, 12, 403–413. [Google Scholar] [CrossRef]
  13. Pizarro, S.; Pricope, N.G.; Figueroa, D.; Carbajal, C.; Quispe, M.; Vera, J.; Alejandro, L.; Achallma, L.; Gonzalez, I.; Salazar, W.; et al. Implementing Cloud Computing for the Digital Mapping of Agricultural Soil Properties from High Resolution UAV Multispectral Imagery. Remote Sens. 2023, 15, 3203. [Google Scholar] [CrossRef]
  14. Sharma, R.P.; Chattaraj, S.; Jangir, A.; Tiwari, G.; Dash, B.; Daripa, A.; Naitam, R.K. Geospatial variability mapping of soil nutrients for site specific input optimization in a part of central India. Agron. J. 2022, 114, 1489–1499. [Google Scholar] [CrossRef]
  15. Weiss, M.; Jacob, F.; Duveiller, G. Remote sensing for agricultural applications: A meta-review. Remote Sens. Environ. 2020, 236, 111402. [Google Scholar] [CrossRef]
  16. Näsi, R.; Mikkola, H.; Honkavaara, E.; Koivumäki, N.; Oliveira, R.A.; Peltonen-Sainio, P.; Keijälä, N.-S.; Änäkkälä, M.; Arkkola, L.; Alakukku, L. Can Basic Soil Quality Indicators and Topography Explain the Spatial Variability in Agricultural Fields Observed from Drone Orthomosaics? Agronomy 2023, 13, 669. [Google Scholar] [CrossRef]
  17. Ragazzo, A.V.; Mei, A.; Fontinovo, G. Unmanned aircraft systems and satellite technologies for topsoil mapping in precision agriculture. Int. Arch. Photogramm. Remote Sens. Spat. Inf. Sci. 2023, XLVIII-1-W1-2023, 417–422. [Google Scholar] [CrossRef]
  18. Khalesi, F.; Daponte, P.; De Vito, L.; Picariello, F.; Tudosa, I. UAV in Precision Agriculture: A Preliminary Assessment of Uncertainty for Vegetation Health Index. In Proceedings of the 2022 IEEE Workshop on Metrology for Agriculture and Forestry, MetroAgriFor 2022—Proceedings 2022, Perugia, Italy, 3–5 November 2022; pp. 94–99. [Google Scholar] [CrossRef]
  19. Wang, T.; Liu, Y.; Wang, M.; Fan, Q.; Tian, H.; Qiao, X.; Li, Y. Applications of UAS in Crop Biomass Monitoring: A Review. Front. Plant Sci. 2021, 12, 616689. [Google Scholar] [CrossRef]
  20. Villoslada Peciña, M.; Bergamo, T.F.; Ward, R.D.; Joyce, C.B.; Sepp, K. A novel UAV-based approach for biomass prediction and grassland structure assessment in coastal meadows. Ecol. Indic. 2021, 122, 107227. [Google Scholar] [CrossRef]
  21. Martinez, A.; Mosquera, L.; Jatsun, S.; Emelyanova, O. UAV Soil Sampling in Andean Highlands for Precision Agriculture. Smart Innov. Syst. Technol. 2023, 331, 375–387. [Google Scholar] [CrossRef]
  22. Yan, Y.; Yang, J.; Li, B.; Qin, C.; Ji, W.; Xu, Y.; Huang, Y. High-Resolution Mapping of Soil Organic Matter at the Field Scale Using UAV Hyperspectral Images with a Small Calibration Dataset. Remote Sens. 2023, 15, 1433. [Google Scholar] [CrossRef]
  23. Nevavuori, P.; Narra, N.; Lipping, T. Crop yield prediction with deep convolutional neural networks. Comput. Electron. Agric. 2019, 163, 104859. [Google Scholar] [CrossRef]
  24. van Klompenburg, T.; Kassahun, A.; Catal, C. Crop yield prediction using machine learning: A systematic literature review. Comput. Electron. Agric. 2020, 177, 105709. [Google Scholar] [CrossRef]
  25. Zarco-Tejada, P.J.; González-Dugo, V.; Berni, J.A.J. Fluorescence, temperature and narrow-band indices acquired from a UAV platform for water stress detection using a micro-hyperspectral imager and a thermal camera. Remote Sens. Environ. 2012, 117, 322–337. [Google Scholar] [CrossRef]
  26. Gelaw, A.; Singh, B.R.; Lal, R. Soil organic carbon and total nitrogen stocks under different land uses in a semi-arid watershed in Tigray, Northern Ethiopia. Agric. Ecosyst. Environ. 2014, 188, 256–263. [Google Scholar] [CrossRef]
  27. Mahasneh, H. Drones in Agriculture: Real-World Applications and Impactful Case Studies. J. Nat. Sci. Rev. 2024, 2, 643–656. [Google Scholar] [CrossRef]
  28. Parida, P.K.; Somasundaram, E.; Krishnan, R.; Radhamani, S.; Sivakumar, U.; Parameswari, E.; Raja, R.; Rangasami, S.R.S.; Sangeetha, S.P.; Selvi, R.G. Unmanned Aerial Vehicle-Measured Multispectral Vegetation Indices for Predicting LAI, SPAD Chlorophyll, and Yield of Maize. Agriculture 2024, 14, 1110. [Google Scholar] [CrossRef]
  29. Pamuji, R.; Mahardika, A.I.; Wiranda, N.; Alkaf, N.; Saputra, B.; Adini, M.H.; Pramatasari, D. Utilizing Electromagnetic Radiation in Remote Sensing for Vegetation Health Analysis Using NDVI Approach with Sentinel-2 Imagery. Kasuari Phys. Educ. J. (KPEJ) 2023, 6, 127–135. [Google Scholar] [CrossRef]
  30. Sashikkumar, M.C.; Selvam, S.; Karthikeyan, N.; Ramanamurthy, J.; Venkatramanan, S.; Singaraja, C. Remote Sensing for Recognition and Monitoring of Vegetation Affected by Soil Properties. J. Geol. Soc. India 2017, 90, 609–615. [Google Scholar] [CrossRef]
  31. Wang, Y.; Ma, Y.; Zhou, F.; Huang, Z.; Yao, Y. More Precise Monitoring of Soil Moisture Content in Agricultural Fields by Upscaling Conversion of Multispectral Image Data From Unmanned Aerial Vehicles. IEEE Access 2024, 12, 79892–79904. [Google Scholar] [CrossRef]
  32. Urquizo, J.; Ccopi, D.; Ortega, K.; Castañeda, I.; Patricio, S.; Passuni, J.; Figueroa, D.; Enriquez, L.; Ore, Z.; Pizarro, S. Estimation of Forage Biomass in Oat (Avena sativa) Using Agronomic Variables through UAV Multispectral Imaging. Remote Sens. 2024, 16, 3720. [Google Scholar] [CrossRef]
  33. Biney, J.K.M.; Houška, J.; Volánek, J.; Abebrese, D.K.; Cervenka, J. Examining the influence of bare soil UAV imagery combined with auxiliary datasets to estimate and map soil organic carbon distribution in an erosion-prone agricultural field. Sci. Total Environ. 2023, 870, 161973. [Google Scholar] [CrossRef]
  34. Srivastava, P.K.; Srivastava, S.; Singh, P.; Gupta, A.; Dugesar, V. Chapter 2—Soil Chemical Properties Estimation Using Hyperspectral Remote Sensing: A Review; Earth Observation for Monitoring and Modeling Land Use; Elsevier: Amsterdam, The Netherlands, 2025; pp. 25–43. [Google Scholar] [CrossRef]
  35. Yuan, J.; Gao, J.; Yu, B.; Yan, C.; Ma, C.; Xu, J.; Liu, Y. Estimation of soil organic matter content based on spectral indices constructed by improved Hapke model. Geoderma 2024, 443, 116823. [Google Scholar] [CrossRef]
  36. Ravikumar, S.; Vellingiri, G.; Sellaperumal, P.; Pandian, K.; Sivasankar, A.; Sangchul, H. Real-time nitrogen monitoring and management to augment N use efficiency and ecosystem sustainability–A review. J. Hazard. Mater. Adv. 2024, 16, 100466. [Google Scholar] [CrossRef]
  37. Heil, J.; Jörges, C.; Stumpe, B. Fine-Scale Mapping of Soil Organic Matter in Agricultural Soils Using UAVs and Machine Learning. Remote Sens. 2022, 14, 3349. [Google Scholar] [CrossRef]
  38. Tsouros, D.C.; Bibi, S.; Sarigiannidis, P.G. A Review on UAV-Based Applications for Precision Agriculture. Information 2019, 10, 349. [Google Scholar] [CrossRef]
  39. Zhao, J.; Wan, S. Artificial Intelligence and Hyperspectral Modeling for Soil Management; Springer: Berlin/Heidelberg, Germany, 2023; pp. 67–91. [Google Scholar] [CrossRef]
  40. Rolando, J.; Dubeux, J.C., Jr.; Perez, W.; Ramirez, D.; Turin, C.; Ruiz-Moreno, M.; Comeford, N.; Mares, V.; Garcia, S.; Quiroz, R. Soil organic carbon stocks and fractionation under different land uses in the Peruvian high-Andean Puna. Geoderma 2017, 307, 65–72. [Google Scholar] [CrossRef]
  41. Zhang, W.; Cheng, L.; Xu, R.; He, X.; Mo, W.; Xu, J. Assessing Spatial Variation and Driving Factors of Available Phosphorus in a Hilly Area (Gaozhou, South China) Using Modeling Approaches and Digital Soil Mapping. Agriculture 2023, 13, 1–18. [Google Scholar] [CrossRef]
  42. Guerrero, A.; De Neve, S.; Mouazen, A.M. Data fusion approach for map-based variable-rate nitrogen fertilization in barley and wheat. Soil Tillage Res. 2021, 205, 104789. [Google Scholar] [CrossRef]
  43. Cáceres, Y.Z.; Torres, B.C.; Archi, G.C.; Mallqui, R.Z.; Pinedo, L.E.; Trucios, D.C.; Ortega Quispe, K.A. Analysis of Soil Quality through Aerial Biomass Contribution of Three Forest Species in Relict High Andean Forests of Peru. Malays. J. Soil Sci. 2024, 28, 38–52. [Google Scholar]
  44. Instituto Geofísico del Perú. Atlas Climático de Precipitación y Temperatura del aire en la Cuenca del Río Mantaro; Instituto Geofísico del Perú: Junín, Perú, 2005. [Google Scholar]
  45. Brus, D.J.; Kempen, B.; Heuvelink, G.B.M. Sampling for validation of digital soil maps. Eur. J. Soil Sci. 2011, 62, 394–407. [Google Scholar] [CrossRef]
  46. ISO 11265:1994; Soil Quality—Determination of the Specific Electrical Conductivity. ISO: Geneva, Switzerland, 1994. Available online: https://www.iso.org/es/contents/data/standard/01/92/19243.html (accessed on 17 October 2024).
  47. NOM-021-RECNAT-2000; Especificaciones de Fertilidad, Salinidad y Clasificación de Suelos. FAOLEX: Rome, Italy, 2000. Available online: https://www.fao.org/faolex/results/details/es/c/LEX-FAOC050674/ (accessed on 17 October 2024).
  48. Castellanos, J. Manual de Interpretación de Analisis de Suelos y Aguas. 2024. Available online: https://www.intagri.com/public_files/Interpretacion-de-Analisis-de-Suelos-y-Aguas.pdf (accessed on 13 October 2024).
  49. Demir, S.; Başyiğit, L. Evaluating Bare Soil Properties and Vegetation Indices for Digital Farming Applications from UAV-based Multispectral Images. Data Sci. Appl. 2023, 6, 5–10. [Google Scholar]
  50. Dindaroğlu, T.; Kılıç, M.; Günal, E.; Gündoğan, R.; Akay, A.E.; Seleiman, M. Multispectral UAV and satellite images for digital soil modeling with gradient descent boosting and artificial neural network. Earth Sci. Inform. 2022, 15, 2239–2263. [Google Scholar] [CrossRef]
  51. Fávero, L.P.; Belfiore, P.; de Freitas Souza, R. Classification and regression trees. In Data Science, Analytics and Machine Learning with R; Academic Press: Cambridge, MA, USA, 2023; pp. 371–401. [Google Scholar] [CrossRef]
  52. Kumar, A.; Sinha, S.; Saurav, S. Random forest, CART, and MLR-based predictive model for unconfined compressive strength of cement reinforced clayey soil: A comparative analysis. Asian J. Civ. Eng. 2024, 25, 2307–2323. [Google Scholar] [CrossRef]
  53. Akshay, R.; Reddy, N.; Nidhi, S.S.; Rajasekaran, V.A. Applications of UAV in the agriculture field. Appl. Comput. Eng. 2023, 6, 441–446. [Google Scholar] [CrossRef]
  54. Montezano, Z.F.; Corazza, E.J.; Muraoka, T. Variabilidade espacial da fertilidade do solo em área cultivada e manejada homogeneamente. Rev. Bras. Cienc. Solo 2006, 30, 839–847. [Google Scholar] [CrossRef]
  55. Rathore, T.S. Factors Responsible for Spatial Distribution of Enzyme Activity in Soil. In Climate Change and Microbial Diversity: Advances and Challenges; Routledge: London, UK, 2022; pp. 143–161. [Google Scholar] [CrossRef]
  56. Raimi, H.S.M.; Shahrul, N.N.A.; Ismail, T.N.H.T.; Ali, R.; Shaheed, R.; Yusop, F.M. The Influence of Compost Bin Volume and Effective Microorganisms (EM) Quantity for Efficient Food Waste Composting. J. Adv. Res. Micro Nano Eng. 2024, 16, 70–84. [Google Scholar] [CrossRef]
  57. Li, Z.-C.; Song, Z.-L.; Yang, X.-M.; Song, A.-L.; Yu, C.-X.; Wang, T.; Xia, S.; Liang, Y.-C. Impacts of silicon on biogeochemical cycles of carbon and nutrients in croplands. J. Integr. Agric. 2018, 17, 2182–2195. [Google Scholar] [CrossRef]
  58. Wang, Y.; Yu, Q.; Zheng, C.; Wang, Y.; Chen, H.; Dong, S.; Hu, X. The impact of microbial inoculants on large-scale composting of straw and manure under natural low-temperature conditions. Bioresour. Technol. 2024, 400, 130696. [Google Scholar] [CrossRef]
  59. Zhang, F.; Niu, J.; Zhang, W.; Chen, X.; Li, C.; Yuan, L.; Xie, J. Potassium nutrition of crops under varied regimes of nitrogen supply. Plant Soil 2010, 335, 21–34. [Google Scholar] [CrossRef]
  60. Gade, A.; Ingle, P.; Nimbalkar, U.; Rai, M.; Raut, R.; Vedpathak, M.; Jagtap, P.; Abd-Elsalam, K.A. Nanofertilizers: The Next Generation of Agrochemicals for Long-Term Impact on Sustainability in Farming Systems. Agrochemicals 2023, 2, 257–278. [Google Scholar] [CrossRef]
  61. Roba, T.B.; Roba, T.B. Review on: The Effect of Mixing Organic and Inorganic Fertilizer on Productivity and Soil Fertility. Open Access Libr. J. 2018, 5, 1–11. [Google Scholar] [CrossRef]
  62. da Silva, L.I.; Pereira, M.C.; de Carvalho, A.M.X.; Buttrós, V.H.; Pasqual, M.; Dória, J. Phosphorus-Solubilizing Microorganisms: A Key to Sustainable Agriculture. Agriculture 2023, 13, 462. [Google Scholar] [CrossRef]
  63. Brevik, E.C.; Sauer, T.J. The past, present, and future of soils and human health studies. SOIL 2015, 1, 35–46. [Google Scholar] [CrossRef]
  64. Liu, J.; Xie, W.; Yang, J.; Yao, R.; Wang, X.; Li, W. Effect of Different Fertilization Measures on Soil Salinity and Nutrients in Salt-Affected Soils. Water 2023, 15, 3274. [Google Scholar] [CrossRef]
  65. Martín-Merino, M. Fusing Heterogeneous Data Sources Considering a Set of Equivalence Constraints; Springer: Berlin/Heidelberg, Germany, 2011. [Google Scholar]
  66. Fu, Z.; Qin, Q.; Luo, B.; Sun, H.; Wu, C. HOMPC: A Local Feature Descriptor Based on the Combination of Magnitude and Phase Congruency Information for Multi-Sensor Remote Sensing Images. Remote Sens. 2018, 10, 1234. [Google Scholar] [CrossRef]
  67. Weiss, K.; Khoshgoftaar, T.M.; Wang, D.D. A survey of transfer learning. J Big Data 2016, 3, 1345–1459. [Google Scholar] [CrossRef]
  68. Nguyen, T.; Khadka, R.; Phan, N.; Yazidi, A.; Halvorsen, P.; Riegler, M.A. Combining datasets to increase the number of samples and improve model fitting. arXiv 2022. [Google Scholar] [CrossRef]
  69. Abdi, D.; Tremblay, G.F.; Ziadi, N.; Bélanger, G.; Parent, L.-É. Predicting Soil Phosphorus-Related Properties Using Near-Infrared Reflectance Spectroscopy. Soil Sci. Soc. Am. J. 2012, 76, 2318–2326. [Google Scholar] [CrossRef]
  70. Folorunso, O.; Ojo, O.; Busari, M.; Adebayo, M.; Joshua, A.; Folorunso, D.; Ugwunna, C.O.; Olabanjo, O.; Olabanjo, O. Exploring Machine Learning Models for Soil Nutrient Properties Prediction: A Systematic Review. Big Data Cogn. Comput. 2023, 7, 113. [Google Scholar] [CrossRef]
  71. Karray, E.; Elmannai, H.; Toumi, E.; Gharbia, M.H.; Meshoul, S.; Aichi, H.; Ben Rabah, Z. Evaluating the Potentials of PLSR and SVR Models for Soil Properties Prediction Using Field Imaging, Laboratory VNIR Spectroscopy and Their Combination. Comput. Model. Eng. Sci. 2023, 136, 1399–1425. [Google Scholar] [CrossRef]
  72. Kouadio, L.; Deo, R.C.; Byrareddy, V.; Adamowski, J.F.; Mushtaq, S.; Phuong Nguyen, V. Artificial intelligence approach for the prediction of Robusta coffee yield using soil fertility properties. Comput. Electron. Agric. 2018, 155, 324–338. [Google Scholar] [CrossRef]
  73. Zhang, W.; Zhu, L.; Zhuang, Q.; Chen, D.; Sun, T. Mapping Cropland Soil Nutrients Contents Based on Multi-Spectral Remote Sensing and Machine Learning. Agriculture 2023, 13, 1592. [Google Scholar] [CrossRef]
  74. Singha, C.; Swain, K.C.; Sahoo, S.; Govind, A. Prediction of soil nutrients through PLSR and SVMR models by VIs-NIR reflectance spectroscopy. Egypt. J. Remote Sens. Space Sci. 2023, 26, 901–918. [Google Scholar] [CrossRef]
  75. Zhao, H.; Wang, Z.; Jia, G.; Tian, J.; Jin, S.; Liang, S.; Liu, Y. The Impact and Correction of Sensitive Environmental Factors on Spectral Reflectance Measured In Situ. Remote Sens. 2023, 15, 5332. [Google Scholar] [CrossRef]
  76. Milton, E.J. Review article: Principles of field spectroscopy. Int J Remote Sens 1987, 8, 1807–1827. [Google Scholar] [CrossRef]
  77. Rossini, M.; Meroni, M.; Celesti, M.; Cogliati, S.; Julitta, T.; Panigada, C.; Rascher, U.; Van der Tol, C.; Colombo, R. Analysis of red and far-red sun-induced chlorophyll fluorescence and their ratio in different canopies based on observed and modeled data. Remote Sens. 2016, 8, 412. [Google Scholar] [CrossRef]
  78. Drinkwater, L.E.; Snapp, S.S. Advancing the science and practice of ecological nutrient management for smallholder farmers. Front. Sustain. Food Syst. 2022, 6, 921216. [Google Scholar] [CrossRef]
  79. Jiachen, H.; Jing, H.; Gang, L.; Weile, L.; Zhe, L.; Zhi, L. Inversion analysis of soil nitrogen content using hyperspectral images with different preprocessing methods. Ecol. Inform. 2023, 78, 102381. [Google Scholar] [CrossRef]
  80. Rejeb, A.; Abdollahi, A.; Rejeb, K.; Treiblmaier, H. Drones in agriculture: A review and bibliometric analysis. Comput. Electron. Agric. 2022, 198, 107017. [Google Scholar] [CrossRef]
  81. Song, Q.; Gao, X.; Song, Y.; Li, Q.; Chen, Z.; Li, R.; Zhang, H.; Cai, S. Estimation and mapping of soil texture content based on unmanned aerial vehicle hyperspectral imaging. Sci. Rep. 2023, 13, 14097. [Google Scholar] [CrossRef]
  82. Zhou, J.; Xu, Y.; Gu, X.; Chen, T.; Sun, Q.; Zhang, S.; Pan, Y. High-Precision Mapping of Soil Organic Matter Based on UAV Imagery Using Machine Learning Algorithms. Drones 2023, 7, 290. [Google Scholar] [CrossRef]
  83. Yang, X.; Bao, N.; Li, W.; Liu, S.; Fu, Y.; Mao, Y. Soil Nutrient Estimation and Mapping in Farmland Based on UAV Imaging Spectrometry. Sensors 2021, 21, 3919. [Google Scholar] [CrossRef]
  84. Rehman, H.U.; Knadel, M.; de Jonge, L.W.; Moldrup, P.; Greve, M.H.; Arthur, E. Comparison of Cation Exchange Capacity Estimated from Vis–NIR Spectral Reflectance Data and a Pedotransfer Function. Vadose Zone J. 2019, 18, 1–8. [Google Scholar] [CrossRef]
Figure 1. Location of the study area, Santa Ana (Peru).
Agriengineering 07 00070 g001
Figure 2. Representation of the methodology employed in this investigation.
Agriengineering 07 00070 g002
Figure 3. (a) Micasense Red Edge P camera, (b) CRP Panel, (c) Matrice 300 UAV integrated with multispectral sensor serving as the imaging platform used in this study, (d) flight plan for the study image, (e) DJI RTK V2 GNSS for marking soil plots, and (f) GCP.
Agriengineering 07 00070 g003
Figure 4. Survey regarding the addition of fertilizers (kg/ha) for the period 2023.
Agriengineering 07 00070 g004
Figure 5. Variability (2022–2023) in soil parameters across different evaluation parameters: (a) nitrogen (N), (b) available phosphorus (P), (c) potassium (K), (d) organic matter (MO), (e) electrical conductivity (EC).
Agriengineering 07 00070 g005
Table 1. Flight plan and acquisition of photogrammetric images.
IDFlight DateFlight Extension (ha)Flight Height (m)Images Acquired
0112 August 2022137.34301508355
0228 August 2022123.97331505365
0314 September 2022126.66301504972
0415 August 2023161.91831501715
0527 August 2023165.96761501845
068 September 2023166.88231501840
Table 2. Soil parameter interpretation scale.
ParameterRange
Very LowLowMediumHighVery High
Total nitrogen (N) (ppm)<0.100.10–0.200.20–0.400.40–0.60>0.60
Phosphorus (P) (ppm)<5.55.5–11>11
Potassium (K) (ppm)<120120–240240–480>480
Electrical conductivity (EC) (mSm−1)<2.02.0–4.04.0–8.08.0–16.0>0.16
Organic matter (OM) (%)<0.50.6–1.51.6–3.53.6–6.0>6.0
Note: adapted classification [47,48] regarding soil parameter evaluation ranges.
Table 3. Descriptive statistics and variation in soil parameter values between 2022 and 2023.
ParameterMeanMaximumMinimumStandard DeviationChange (%)
20222023202220232022202320222023Mean
N (ppm)0.1150.120.2291.190.0740.040.020.0760.002
P (ppm)30.12144.98757.881192.617.7616.6197.47322.091−0.538
K (ppm)109.342100.409335.42292.757.885.441.17148.9740.998
OM (%)2.2952.3494.577.991.480.70.4031.540.992
EC (mS/m)3.7862.8329.376.81.581.41.5530.6930.14
Note: min = the minimum values of the pixels assigned by the best modeling with respect to the soil parameters evaluated for each year; max = the maximum values of the pixels assigned by the best modeling with respect to the soil parameters evaluated for each year. The variation refers to the percentage difference, obtained by dividing the difference between the values of both years by the value of the first year.
Table 4. Performance of the predicted physical-chemical parameter models.
Soil PropertyNPKOMEC
ModelCARTRFCARTCARTCART
Training2022R-squared0.820.890.550.810.89
RMSE0.013.6827.700.200.51
MAE5.361.200.000.050.03
2023R-squared0.710.830.650.700.73
RMSE0.205.6515.410.560.48
MAE4.280.970.030.010.08
2022–2023R-squared0.630.640.580.680.64
RMSE0.0217.4729.740.430.64
MAE0.0110.6918.620.290.42
Testing2022R-squared0.840.890.720.840.86
RMSE0.013.7128.490.220.53
MAE6.181.170.000.040.03
2023R-squared0.770.880.650.790.74
RMSE0.072.2123.170.120.44
MAE4.200.970.130.080.07
2022–2023R-squared0.530.580.590.560.54
RMSE0.0318.8633.300.570.80
MAE0.0211.8421.160.370.55
Note: N = total nitrogen; P = phosphorus; K =potassium; OM = organic matter; EC = electrical conductivity; RF = random forest; CART = classification and regression trees; RMSE = root mean square Error; and MAE = mean absolute error.
Disclaimer/Publisher’s Note: The statements, opinions and data contained in all publications are solely those of the individual author(s) and contributor(s) and not of MDPI and/or the editor(s). MDPI and/or the editor(s) disclaim responsibility for any injury to people or property resulting from any ideas, methods, instructions or products referred to in the content.

