Abstract
The study analyzed energy, environmental impact, and costs in intensive broiler production systems in the southeast of the state of Minas Gerais, Brazil, comparing scenarios with and without photovoltaic systems. Four configurations were evaluated, considering different ventilation types (positive and negative pressure) and photovoltaic generation. The Life Cycle Assessment (LCA), with a functional unit of 1 kg of live weight of chicken and a cradle-to-gate approach, indicated that photovoltaic systems reduce between 2.58 t and 4.96 t of CO2-eq annually, in addition to offering better energy efficiency. Economically, sheds with positive pressure ventilation have the lowest cost–benefit ratios, while the feeding subsystem was the one that contributed the most to global warming, among the environmental impact categories evaluated in the LCA. Photovoltaic systems demonstrated the potential to reduce electricity costs between 19.4% and 26.5% per year. However, coffee husks used as chicken litter accounted for 36.5% of production costs, highlighting the need for more economical alternatives. It was concluded that photovoltaic systems are a viable solution to reduce environmental impacts and increase profitability, reinforcing the importance of resource-use optimization strategies in poultry farming.
1. Introduction
Among the paths necessary for sustainable development in agriculture is the quantification and comparison of the energy, economic, and environmental aspects of products and processes in the agricultural sector. In Brazil, broiler chicken production is a prominent activity in national agribusiness, and studies in this area contribute significantly to the sector’s development [1]. Consolidated data from 2022 show that poultry farming produced around 14.5 million metric tons of chicken meat, positioning Brazil as the second-largest producer and the largest exporter in the world. Most of the national production is concentrated in the southern region (64.4%), while Minas Gerais ranks sixth nationally (7.2%), with the Zona da Mata mesoregion accounting for approximately 8% of the state’s production [1,2].
Intensive broiler production systems, compared to other similar production systems, are generally identified as more environmentally efficient [3]. However, given the sector’s continuous growth, there is increasing concern about its environmental and human health impacts [4,5]. Life Cycle Assessment (LCA) has become one of the most robust methodologies for evaluating the environmental impacts of products and services, allowing the identification of critical points along production chains and supporting strategies to improve efficiency and reduce emissions [6,7].
Over recent decades, several studies have applied LCA and energy analysis to poultry production systems worldwide [8,9,10,11]. Pishgar-Komleh et al. [12] evaluated greenhouse gas emissions and energy use efficiency in different housing systems in Iran, while Lima et al. [13] analyzed the environmental performance of conventional broiler systems in Mato Grosso do Sul, Brazil. In turn, Martinelli et al. [14] assessed the eco-efficiency of conventional, Dark House, and organic systems in southern Brazil, and Rocchi et al. [15] compared alternative systems in Italy. Such research has been fundamental to mapping the environmental profile of broiler production and identifying potential mitigation strategies.
Energy is one of the most important inputs for agricultural production and sustainability [11,14,16]. Energy analysis provides valuable insights into resource use efficiency and potential areas for cost reduction, contributing to more sustainable and competitive farming practices [10]. Li et al. [16] reported that non-renewable energy sources in poultry production can account for up to 50% of total energy use and contribute 20–35% of life cycle impacts. The authors proposed integrating photovoltaic systems into intensive poultry houses as a sustainable alternative to grid electricity, reducing dependence on non-renewable sources and improving system efficiency.
Despite the growing number of studies addressing the environmental and energy performance of poultry production, few have examined the integration of photovoltaic energy systems within broiler production under tropical conditions, particularly in the Southeast region of Brazil [12,13,14]. Most existing works focus exclusively on either environmental impacts or energy consumption, without considering the combined environmental, energy, and economic dimensions. Therefore, this study fills an important gap in the literature by performing an integrated assessment of broiler production systems with and without photovoltaic systems, providing a broader understanding of sustainability and the potential benefits of renewable energy adoption in the poultry sector.
The objective of this study was to evaluate the energy consumption, main environmental impacts, and economic costs of intensive broiler production systems with and without photovoltaic systems in the Zona da Mata region of Minas Gerais, using the LCA approach. The study aimed to identify which production system scenarios are the most sustainable from an environmental perspective and the most economically viable for rural producers. To achieve this, an integrated methodological approach combining LCA, analysis of energy use, and economic analysis was applied.
2. Materials and Methods
2.1. Characterization of the Object of Study
Intensive broiler production systems present in municipalities in the Zona da Mata mesoregion, located in the southeast of the state of Minas Gerais, Brazil, were analyzed (Figure 1). Data were collected from broiler production systems located in 12 of the 23 municipalities where the slaughterhouse operated.
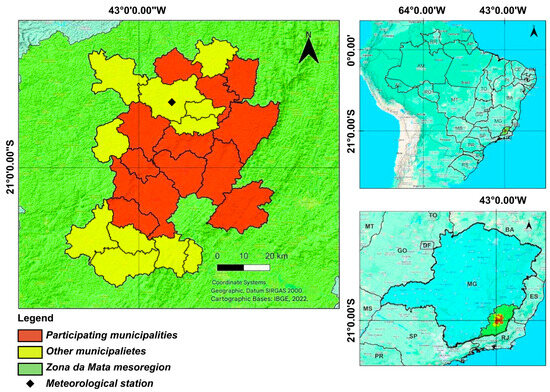
Figure 1.
Geographic location of the municipalities where the poultry processing company operates. Source: Brazilian Institute of Geography and Statistics (IBGE), own elaboration in QGIS.
The Conventional system uses positive-pressure ventilation, where air is drawn into the house by fans, creating a higher pressure than that of the external environment. The Blue House and Dark House systems, on the other hand, feature negative-pressure ventilation, in which air is drawn out of the house through exhaust fans, promoting more uniform air circulation and internal environmental control. The Blue House system has side walls that can be covered with blue curtains and uses a moderate number of fans. In contrast, the Dark House has walls covered with black curtains, more fans, and higher airflow, which favor maintaining controlled environmental conditions, especially in regions with sharp climate variations. These characteristics directly impact production performance, bird thermal comfort, and ecological ventilation and humidity management.
In addition to the two production systems, the way the chicken farms used electrical energy in the captive energy market under the Regulated Contracting Environment was considered. It was found that there were broiler chicken sheds without photovoltaic systems (SFV) or with photovoltaic systems (CFV), that is, with or without consumer units that had distributed generation, in accordance with Brazilian Federal Law 14300/2022 [17].
Initially, it was necessary to prepare an inventory of data on water, energy, raw materials, and associated economic costs to understand the inputs and outputs of broiler production systems. Data for preparing the farm inventory were obtained from poultry farmers through questionnaires, field interviews, and technical production reports. The information was obtained from July 2022 to June 2023 (12 months), covering six production cycles. Data were obtained from technical production reports, encompassing production indicators from 150 broiler breeder batches.
Thus, four possible scenarios were defined for broiler production systems in the mesoregion, based on the type of production system and the unit’s electricity consumption profile. These scenarios were classified as PP-SFV (Positive Pressure without photovoltaic systems), PP-CFV (Positive Pressure with photovoltaic systems), PN-SFV (Negative Pressure without photovoltaic systems), and PN-CFV (Negative Pressure with photovoltaic systems). Positive-pressure systems include conventional sheds that use fans to introduce air. In contrast, negative-pressure systems include sheds such as Blue House and Dark House, which use exhaust fans for air extraction, generally associated with more efficient control of the internal environment.
2.2. Assessment of Environmental Impacts Using the LCA Approach
The first approach of this study is the assessment of the environmental impacts of broiler chicken production using the LCA methodology, carried out in accordance with ISO standards 14040 and 14044 [18,19]. The life cycle inventory (LCI) data, and life cycle impact assessment (LCIA) results were reported according to the functional unit of “1 kg of live weight of chicken”.
The poultry farming process encompasses several subsystems, including hatchery (day-old chick production), feed production, broiler production, and broiler processing (slaughterhouse). In this work, only the feed and broiler production subsystems were discussed (Figure 2). The hatchery phase was excluded due to limited data availability and its minor contribution to the overall environmental impact, as reported in previous studies [12,13,19]. The study focuses specifically on the production process.
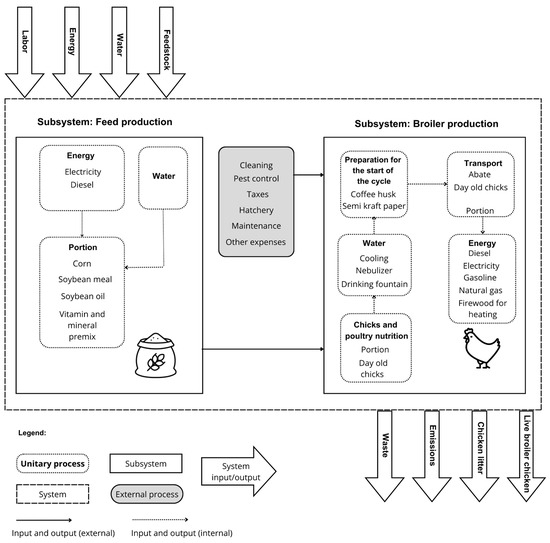
Figure 2.
Limits and flow diagram of the study system. Source: Own elaboration.
2.2.1. Defining Goal and Scope
The goal of this LCA is to evaluate the environmental impacts of broiler chicken production, identify the most significant contributing stages, and provide data to support improvements in production efficiency and sustainability. The purpose of defining the LCA’s scope is to identify the elements of the poultry supply chain. The LCA in this work is considered attributional, as it is characterized by the allocation of co-products and the use of average LCI data in view of a system considered static. Figure 2 shows the system boundary diagram.
The temporal boundaries included the broiler chicken rearing period, characterized by a production cycle that spans from housing the animals in the shed at one day old to pre-slaughter, with an average life of 46 days (from cradle-to-gate). During this period, production resources were evaluated until the final product was obtained—the chicken was ready for slaughter—within a cradle-to-gate system boundary. The functional unit was “1 kg of live weight of chicken” [12,13,19]. Due to the impossibility of fully citing all the inputs involved in the process based on the information gathered from broiler chicken producers, and considering the objective of the research, there were limitations in some variables and other systems along with the definition of all inventory reviews, such as medications, breeders, incubation of chicks from one day old and construction of production infrastructure on farms. Overall, these data would make only a small contribution to the results and are external to the two subsystems evaluated (feed production and broiler production).
2.2.2. Life Cycle Inventory Analysis (LCI)
Life cycle inventory data were calculated relative to the functional unit established for the system. Initially, primary data were collected in the field from broiler producers, within the previously defined boundaries of the system under evaluation. The data obtained were organized, validated, and used to prepare the LCI in accordance with the procedures described in ISO 14040 [18].
Life cycle inventory data were calculated relative to the functional unit established for the system. Initially, primary data were collected in the field from broiler producers, within the previously defined boundaries of the system under evaluation. The data obtained were organized, validated, and used to prepare the LCI in accordance with the procedures described in ISO 14040 [18].
For each scenario evaluated, the input and output values per functional unit were normalized relative to the average annual broiler production observed on a representative farm, ensuring comparability between the different contexts analyzed. Table 1 presents the unitary data for each entry in the ICV for each study scenario to evaluate the environmental impact of 1 kg of live weight of chicken produced.

Table 1.
Life Cycle Inventory data per kg live weight of chicken for each study scenario. Source: Own elaboration.
The main characteristics and their respective technical coefficients for the production systems under study are described in Table 2. It was verified that the Cobb® and Ross® strains, of both sexes, are primarily used in the broiler breeding process. The nutritional diets adopted as reference in the study were defined according to the birds’ breeding phases (Pre-initial: 1 to 8 days; Initial: 9 to 16 days; Growth: 17 to 24 days; Fattening: 25 to 33 days; Slaughter: from 34 days) and the feed composition ingredients, following the recommendations of Rostagno et al. [4]. These data were used to estimate the elemental composition of the feed production system, which was subsequently incorporated into the LCI of the broiler production systems. This linkage ensured consistency between the nutritional profiles, feed inputs, and the corresponding environmental flows modeled in the study.
Table 2.
Technical coefficients of the evaluated production systems. Source: Own elaboration.
The financial costs incurred during data collection were quantified in Brazilian currency and converted to US dollars for all analyses. A conversion factor of 1.00 Brazilian real (BRL) was used, approximately equivalent to 0.21 US dollars (USD). This conversion rate was used consistently throughout the study to express the economic assessment of the broiler production systems in a standardized international currency, allowing for comparison of production costs and economic indicators with those reported in other studies and global benchmarks. Table 3 presents the average daily weight gain by sex in broiler production systems, calculated from the average values obtained from technical production reports.
Table 3.
Average daily weight gain by sex in broiler production systems. Source: Own elaboration.
The unit value for electricity consumption in the PP-SFV and PN-SFV scenarios along with the LCI, both characterized by broiler production systems without photovoltaic systems, was determined based on the average annual total consumption recorded on a reference farm. In these scenarios, it was assumed that all energy demand is met exclusively by electricity supplied by the local electricity distributor’s network, indicating the system’s complete dependence on an external electricity source.
In the PP-CFV and PN-CFV scenarios, which represent production systems equipped with grid-connected photovoltaic installations, the data collected from farms indicated that the consumer units maintain an active connection to the local electricity distribution grid to meet the minimum contracted demand, corresponding to the availability cost for a two-phase, low-voltage supply. Each photovoltaic system operated under the Brazilian net-metering regulation [17] and consisted of crystalline silicon modules with total installed capacities ranging from 10 to 30 kWp, depending on farm size and electricity demand. The systems were connected to high-efficiency string inverters (≥97%) and supplied the electricity required for poultry production, with any surplus generation injected into the local distribution grid [20]. To model the solar energy inputs within the life cycle inventory, the photovoltaic electricity generation process is available in the Ecoinvent database (version 3.8).
The origin of the materials and inputs used within the system boundaries was also considered, as required for a cradle-to-gate approach. Key materials—such as feed ingredients, electricity, and water—were sourced from regional suppliers located in Minas Gerais, Brazil. For feed production, the origin of raw materials (corn, soybean meal, and other additives) followed supply chains commonly used by local poultry producers, as described in national agricultural statistics and previous LCA studies on broiler production systems in Brazil. Data on electricity, water consumption, and other inputs were obtained directly from producers.
2.2.3. Life Cycle Impact Assessment (LCIA)
The LCIA consisted of calculating environmental impact using the ICV unitary processes. Using the SimaPro® program version PhD 9.2.0.2, the available Ecoinvent® database version 3.8, and the CML-IA method Version 3.02/World 2000 (global scope of application), impact categories were quantified, and an analysis of data uncertainty was performed [21].
In this analysis, the midpoint impact assessment level was considered, which refers to the impact categories across the chemical, physical, and biological process systems (environmental mechanisms) before the final point of each category. The midpoint characterization does not refer to the damage that can be caused to the environment and human health.
Based on the work of Pelletier [11], Leinonen et al. [22], Martinelli et al. [14] and Beal et al. [23] and in the CML-IA methodology described by Sleeswijk et al. [24] and Guinee et al. [25], the environmental impact categories of acidification (kg SO2-eq), eutrophication (kg PO4-eq) and global warming potential (kg CO2-eq) were chosen, which represent the pollutant emissions most analyzed in the studies found in literature on the application of LCA in broiler production systems.
Mostert et al. [26] highlight the initial relevance of focusing on reducing greenhouse gas (GHG) emissions in broiler production, recognizing that, although other environmental impact categories are also important, establishing simultaneous targets for multiple indicators can pose a significant challenge. Thus, prioritizing GHG emissions emerges as a fundamental step to guide mitigation efforts and policies in this production chain. At the same time, the integrated approach to other impact categories is a subject for future investigation.
The works published by Usva et al. [27], Alves et al. [6], Cheng et al. [28], Lima et al. [13], and Martinelli et al. [14] present relevant results and discussions on the impact categories analyzed in this work. These studies address impacts such as global warming potential, acidification, eutrophication, which are critical for evaluating broiler production systems. In particular, these authors highlighted the importance of feed management and waste management as key factors that significantly influence the environmental footprint of these systems. Integrating these impact categories into the life-cycle inventory contributes to a comprehensive analysis of environmental effects. It enables the development of more effective strategies to mitigate impacts along the broiler production chain.
2.2.4. Life Cycle Interpretation
The interpretation of the life cycle was based on the LCA results, with the calculated potential environmental impacts translated into recommendations and conclusions on the performance of the evaluated scenarios, in line with the scope and objective of the LCA study [29,30].
2.2.5. Uncertainty Analysis
Variations in data can be described by probability distributions that express their uncertainty, which may originate from primary and secondary sources. Statistical methods, such as Monte Carlo techniques, can assist in quantifying the uncertainty of data in LCA results [29,30]. The various input data may contain some degree of uncertainty and, when aggregated, may affect the evaluation results. Therefore, when comparing the impacts of different processes or products, it is crucial to determine whether the observed differences are statistically significant [29,30].
In this study, a Monte Carlo analysis was performed using the CML-IA version 3.02/World 2000 method, assuming a 95% confidence interval and evaluating the parameters through 5000 independent simulations. Since detailed statistical ranges (minimum, maximum, or standard deviation) were not available for the primary inventory data, the analysis was based on the pedigree matrix and uncertainty factors incorporated in the ecoinvent database, in accordance with ISO 14044 [19] recommendations. In addition to the uncertainties inherent in the tertiary data from the ecoinvent database, the quality and variability of the primary data obtained directly from interviews with rural producers were also considered in the modeling process. This approach ensured a probabilistic interpretation of environmental performance in broiler production, reflecting the combined uncertainty of primary and secondary sources [31].
2.3. Assessment of Economic Costs and Energy Use
Based on the work of Pishgar-Komleh et al. [12], detailed analyses were conducted regarding energy and economic flows throughout the supply chain of broiler production. This study evaluated direct and indirect energy inputs—such as fuel, electricity, and feed—and associated economic costs across different production systems. Furthermore, energy efficiency indices and economic indicators were calculated to better understand the relationship between energy consumption and the financial viability of production. The results and methodologies presented by Pishgar-Komleh et al. [12] served as a basis for guiding the energy and economic assessment in this study, helping to identify opportunities for reduction in environmental impacts.
2.3.1. Energy Usage Analysis
The energy values for each of the inputs were quantified by the respective energy coefficient (MJ/unit) multiplied by the quantity used in the production of broiler chickens for the period of one year in each of the study scenarios. The sum of the calculations of the energy values of the inputs resulted in the total input energy. Similarly, the output energy value was obtained by multiplying the number of kilograms of live chicken produced over one year by the respective energy coefficient.
It is important to note that the functional unit defined for the LCA (“1 kg of live weight of chicken”) was applied exclusively to the environmental assessment. In contrast, the energy and economic analyses were based on the average annual production values of each system, considering total input and output flows. This approach was adopted to represent the actual operational performance and efficiency of the broiler production systems, while the LCA results remained standardized by the functional unit to ensure comparability with previous studies.
The energy indices used to analyze energy use were energy efficiency (EE), energy productivity (PE), and net energy (EL), as defined by Equations (1)–(3).
The Energy Efficiency Index (Equation (1)) can be interpreted as follows: if the value is 1, the output energy equals the input energy. Likewise, if greater than one, more energy was obtained at the output due to the inputs that were needed at the input of the system [12,32,33].
Energy Productivity (Equation (2)) measures the amount of a given product produced per unit of total input energy required in the process. In this work, the total available input energy represents the energy needed to support broiler production [12,32,33].
As for Net Energy (Equation (3)), if EL > 0, it indicates that energy was gained; that is, the production system produced more energy than was spent on production. Otherwise, if EL < 0, it indicates that the output energy was lower than the necessary demand from the production system [12,32,33].
2.3.2. Economic Assessment
The studies by Andrade et al. [34] were adopted as a reference for the economic analysis carried out in this work, complemented by the contributions of Ibrahim et al. [35], Qaid et al. [36], and by the methodologies proposed by the National Rural Learning Service (SENAR) [37] for cost management in agriculture. In this analysis, the economic viability of the production systems was assessed considering the financial resources needed to cover all stages of the poultry activity throughout an annual production cycle. The economic analysis consists of identifying and quantifying costs—such as inputs, labor, and operating expenses—and assessing possible financial returns, thereby allowing an assessment of whether the production is financially sustainable for the producer.
Initially, we sought to understand the associated variable costs, also known as the effective operating cost (COE), which is the sum of all direct production process expenses. The COE includes maintenance expenses, energy, labor, improvements, and taxes, for example.
Next, we have the total operating cost (COT), which consists of the sum of the COE, family labor costs, and depreciation of agricultural equipment (Equation (4)) such as silos, electric generator, chainsaw, microtractor, photovoltaic plant, chimney, ovens, etc., depending on their useful lifespan.
Thus, the total cost (CT) was calculated as the sum of the COT and the opportunity cost (Equation (5)), which consists of the interest on the capital tied up in the broiler farm if one had chosen to invest this money in another financial application or investment. This is important to include in the cost composition, as it helps the producer’s financial decision-making by enabling them to verify whether the investments made on the farm are more profitable than a financial investment of the same amount. In this analysis, for comparison purposes, the profitability of investment in savings was considered at an interest rate of 6.0% per year [37].
Profit (Equation (7)) is the difference between gross income (RB) and CT, and positive values are expected to maintain the enterprise, in the same way as in the gross margin (MB) and net margin (ML) indices. The MB is an indicator that shows the difference between the RB and the COE (Equation (8)), which, if positive, indicates that the production system is financially viable.
ML (Equation (9)) is another indicator calculated based on the difference between gross income and COT. If ML > 0, the system is considered economically viable in the medium term; however, profit must be observed for long-term analyses [34].
The last index is the cost–benefit ratio (RCB), calculated as the ratio of RB to CT (Equation (10)). The higher the RCB value, the greater the profitability of the production system [35,36,37].
3. Results and Discussion
3.1. Assessment of Environmental Impacts
The results for the environmental impact categories are shown in Table 4 and Figure 3 for each evaluated scenario. The production system with positive pressure and without photovoltaic systems had the highest impacts for all impact categories. However, within each production system, with or without photovoltaic systems, differences in results were observed across the evaluated impact categories.
Table 4.
Results of environmental impact categories based on Life Cycle Assessment. Source: Own elaboration.
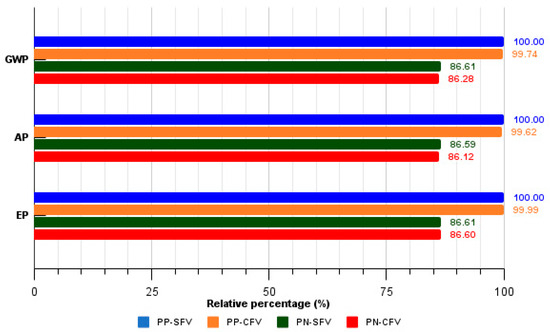
Figure 3.
Relative percentage values of environmental impacts were calculated based on the Life Cycle Assessment. Legend: PP-SFV: Positive pressure without photovoltaic systems; PP-CFV: Positive pressure with photovoltaic systems; PN-SFV: Negative pressure without photovoltaic systems; PN-CFV: Negative pressure with photovoltaic systems. Source: Own elaboration.
The GWP results obtained in this study ranged from 2.52 to 2.92 kg CO2-eq/kg live weight, which are consistent with those reported in the literature for intensive broiler production systems. Similar values were found by Cheng et al. [28] (2.98 kg CO2-eq, China), Lima et al. [13] (2.70 kg CO2-eq, Midwest Brazil), and Usva et al. [27] (2.40 kg CO2-eq, Finland). Slightly higher results were reported by Martinelli et al. [14] (3.37 kg CO2-eq, southern Brazil) and Alves et al. [6] (northern Brazil), mainly due to regional differences in energy matrices, feed composition, and inclusion of the slaughter phase in the system boundaries. These comparisons indicate that the results obtained in this study are within the expected range for broiler production systems and reflect the influence of regional production characteristics.
It is essential to highlight that these authors considered, in addition to the feeding and chicken-rearing subsystems, the poultry slaughter process. This implies the use of a different functional unit than those adopted in this study. While this work presents the results in terms of kg CO2-eq per kilogram of live chicken produced, the referenced authors adopted a functional unit that encompasses all stages up to slaughter, which should be considered when comparing quantitative values across studies. In the present work, the feed production subsystem was the most significant contributor to GHG emissions, accounting for around 91.0%, a finding also reported in the previously mentioned works.
Within this subsystem, soybean meal and corn cultivation were identified as the main sources of emissions due to fertilizer use, agricultural fuel consumption, and land use change associated with soybean production. Other relevant factors included electricity consumption in feed manufacturing and fuel use in broiler production systems and transport to the slaughterhouse, although their influence was comparatively smaller. These results are consistent with previous LCAs on broiler production systems, confirming that feed-related processes dominate the environmental impacts of poultry production.
Lima et al. [13] identified in their literature review that the global warming potential varies significantly, ranging from 1.39 to 6.83 kg CO2-eq/per functional unit. This variation can be attributed to several factors, including fossil fuel consumption, chicken feed production, age at slaughter, feed conversion, and the technological level of the poultry sheds. Thus, although specific factors can lead to significant variations, they follow a consistent logic that reflects the technical and operational conditions of the production systems analyzed. Regarding the GWP values obtained in this study, Figure 3 shows that the highest values are recorded in the PP-SFV and PN-SFV scenarios. In photovoltaic systems for raising broiler chickens, an approximate reduction of 8 g in GHG emissions was observed with the positive pressure (PP) system and 10 g with the negative pressure (PN) system, compared to SFV systems.
An average-sized PP system produces an average of 340,067 kg of live chicken per year, while an average PN system produces a value of around 516,458 kg. In the evaluation of each scenario, the PP-SFV emits approximately 993.23 t CO2-eq annually, and the PP-CFV emits 990.65 t CO2-eq, thus the average broiler house with a photovoltaic plant emits 2.58 t CO2-eq less per year than one without. During the study period, the integrating company operated 239 active sheds for raising PP broiler chickens, representing approximately 63.0% of the production systems in the study region. If photovoltaic systems were adopted in all of these warehouses together with the Electric Energy Compensation System, an approximate reduction of 616.6 t CO2-eq per year in GHG emissions could be achieved.
In the PN system, the PN-SFV scenario presented annual emissions of approximately 1306.4 tons of CO2-eq, while the PN-CFV scenario recorded 1301.4 tons of CO2-eq. The difference between these two scenarios is the use of photovoltaic systems in the PN-SFV, which reduces electricity consumption from the conventional grid. This reduction resulted in an estimated average reduction of 4.96 tons of CO2-eq per farm equipped with photovoltaic systems. Considering that, during the same period, the integrated company had 138 active PN-type breeding sheds, the widespread adoption of these systems could lead to a total reduction of approximately 684.5 tons of CO2-eq per year. Thus, the first scenario refers to the average decrease per production unit, while the second projects the aggregate impact if the entire operation were converted to the photovoltaic system. This provides a strong justification, on the basis of GHG emissions reduction, for new poultry farmers to use photovoltaic systems on their farms.
Although the adoption of photovoltaic systems resulted in measurable reductions in GHG emissions, the relative difference between the scenarios with and without solar energy remains relatively small, especially for GWP. This is mainly due to the characteristics of the Brazilian electricity matrix, which is predominantly renewable and is primarily supplied by hydropower. Consequently, even in systems that rely entirely on grid electricity, the carbon intensity of energy consumption is already low. In this context, substituting hydropower-based electricity with photovoltaic generation leads to only a modest reduction in emissions, since both energy sources are renewable and have low GHG emissions.
The broiler chicken production system with a higher level of technology (PN-CFV) has approximately 0.40 kg lower annual CO2-eq emissions per kg live weight of chicken compared to the system with a lower level of technology (PP-SFV) (Table 4). The lower greenhouse gas (GHG) emissions observed in intensive broiler production systems with higher technological levels, especially those incorporating photovoltaic systems, can significantly contribute to the formulation of public policies aimed at decarbonizing and decentralizing the electricity sector [17]. In the context of the energy transition, the current study examines how electricity is generated and consumed in these production systems, as local generation from renewable sources such as solar energy reduces dependence on the conventional grid and reduces the carbon footprint of broiler production. Thus, adopting clean technologies in poultry houses not only lowers operating costs but also aligns production with energy and climate sustainability goals.
Another point to be mentioned is that the reduction in GWP is associated with the targets defined in Sustainable Development Goals 7 and 13, which can be assessed as the inclusion of more sustainable practices in the broiler chicken production chain, being essential for facing contemporary environmental challenges and promoting effective integration with the UN Sustainable Development Goals [38].
The Eutrophication Potential (EP) ranged from 1.98 × 10⁻² to 2.29 × 10⁻² kg PO4-eq and the Acidification Potential (AP) from 1.53 × 10⁻² to 1.78 × 10⁻² kg SO2-eq in the four scenarios (Table 4). It was observed that PN systems had the lowest EP and AP impacts, while PP systems had the highest. Within production systems, differences between systems with and without photovoltaic installations were not significantly different.
For AP impacts of broiler production, the results found in the literature were: Cheng et al. [28] of 0.53 × 10⁻² kg SO2-eq, Lima et al. [13] of 4.00 × 10⁻² kg SO2-eq, Martinelli et al. [14] of 1.80 × 10⁻² kg SO2-eq (Southern Brazil), and Alves et al. [6] of 31.00 × 10⁻² kg SO2-eq. Only the result of Martinelli et al. [14] was close to that obtained in this work, as shown in Table 4. One reason for the differences in the values reported in the literature for the AP is the way the impact was allocated among the evaluated subsystems in the LCA. Acidification occurs mainly due to human actions that negatively impact the environment, such as the combustion of fossil fuels. In the case of Alves et al. [6], the AP value (31.00 × 10⁻² kg SO2-eq) was much higher, as the poultry slaughter subsystem was considered, which featured extensive use of natural gas and the production of biological waste.
In the literature, the following EP impacts of broiler production were reported: Cheng et al. [28] recorded 0.091 × 10⁻² kg PO4-eq, Lima et al. [13], 2.60 × 10⁻² kg PO4-eq, Martinelli et al. [14], 3.50 × 10⁻² kg PO4-eq, and Alves et al. [6] reported 0.10 × 10⁻² kg PO4-eq. Only the results of Lima et al. [13] and Martinelli et al. [14] are closer to those obtained in this work. One justification for this difference in results is that Cheng et al. [28] and Alves et al. [6] analyzed systems with lower broiler production. Non-intensive chicken production systems tend to contribute less to the eutrophication of water resources than intensive systems. This is because typical intensive production processes, such as managing large volumes of waste and intensive use of fertilizers and water, release greater quantities of nutrients, such as nitrogen and phosphorus, the main agents of eutrophication. Per kg live chicken, despite lower yields, the smaller scale and lower intensity of non-intensive production is reflected in a proportional reduction in eutrophication potential.
In relation to all impact categories evaluated, the results achieved in this work are compatible with the values obtained by other studies available in the literature. Although a range of estimated GWP values is reported in the literature, these values vary depending on the production system’s technology model, climatic conditions, the use of non-renewable energy sources, and the ingredients in the feed formulation.
The importance of sustainability in poultry production was highlighted in the environmental impact assessment. The inclusion of photovoltaic systems in agriculture through distributed generation not only reduces environmental impacts but also strengthens the energy transition. This is because these systems promote the decarbonization and decentralization of the electricity sector, ensuring greater independence in electricity generation and consumption compared to traditional production methods.
Based on the results of this LCA, several recommendations can be proposed to reduce the environmental impacts associated with broiler chicken production. First, the adoption of photovoltaic systems and other renewable energy sources should be encouraged to further decrease GHG emissions and energy dependence on the grid. Second, improvements in feed formulation, including the use of locally sourced ingredients and alternative protein sources, can significantly reduce the impacts related to feed production, which represents the main contributor to the total environmental burden.
Additionally, optimizing energy efficiency in poultry houses, promoting sustainable agricultural practices in soybean and corn cultivation, and implementing carbon mitigation measures throughout the supply chain are essential strategies to enhance environmental performance. These recommendations can guide producers, integrators, and policymakers toward a more sustainable and climate-resilient poultry production sector. These comparisons confirm that feed production remains the dominant environmental hotspot and validate the consistency of the present findings with literature results. A broader benchmarking interpretation is provided in the conclusions Section 4 to contextualize these outcomes within the sustainability perspective.
3.2. Energy Usage Assessment
Table 5 presents the average energy values calculated for each input and output of each chicken production system in the study region. The average input energy for a production system over one year in the PP-SFV, PP-CFV, PN-SFV, and PN-CFV scenarios was 7.03 GJ, 6.82 GJ, 10.34 GJ, and 9.91 GJ, respectively. The average output energy (live chicken and chicken litter) was 6.65 GJ for the PP system and 9.67 GJ for the PN system.
Table 5.
Energy inputs and outputs for the scenarios studied—source: Own elaboration.
Figure 4 shows the average values of the energy input components for the four evaluated scenarios. Feed was the highest contributor to total input energy consumption, corresponding to 82.3%, followed by coffee husks (11.7%), electricity (4.5%), day-old chicks (0.7%), and others (fuel inputs, firewood for heating, semi-kraft paper, and human labor, with 0.8%).
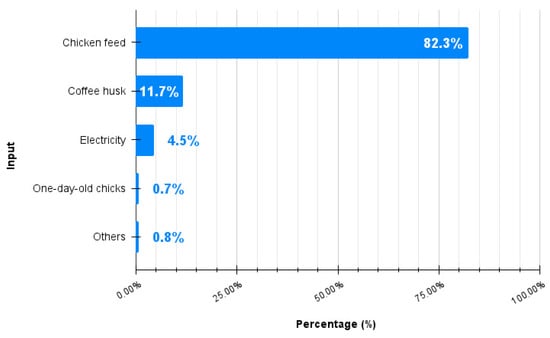
Figure 4.
Participation of the average input energy of inputs in the production of broilers. Source: Own elaboration.
The graph illustrates the average energy inputs for the main components of the production system. The energy attributed to “feed” represents the embodied energy required for the production, processing, and transportation of feed ingredients (mainly corn and soybean meal). “Coffee husks” refers to the energy content of this agricultural co-product used as poultry litter. “Electricity” refers to the direct energy consumed during production, including lighting, ventilation, and heating of the poultry houses. “Day-old chicks” include the energy used in hatchery operations and transportation to the farms, while “others” encompass minor contributions from fuels, firewood, semi-kraft paper, and human labor. This breakdown highlights the predominance of feed-related energy inputs in the total energy demand of broiler chicken production systems.
It is important to clarify that the energy attributed to feed ingredients refers to the indirect energy embodied in their production, processing, and transportation. This includes the energy used in agricultural operations (fertilizer application, machinery, and fuel use), feed milling, and logistics up to the poultry farm. Therefore, the feed represents the cumulative energy demand required to sustain animal growth and is the dominant component of the total energy input in broiler chicken production.
The results for the contribution of electricity to total energy use from Heidari et al. [32] (8.6%) and Pishgar-Komleh et al. [12] (3.0%) were similar to those obtained here (4.5%). However, fuel inputs (59.2% to 71.0%) and feed (25.0% to 31.8%) accounted for the highest proportions in the previous studies, whereas they accounted for the lowest proportions here (Figure 4). The consumption of the set of fuels (diesel oil, gasoline, and natural gas) was included in the item “others”, as it represented only 0.52% of energy inputs. The feed in this study accounts for around 82.0% of the total energy demand in the production of broiler chickens. Just as in the assessment of environmental impacts, the feed was also the component with the highest energy use.
The energy indices Energy Efficiency (EE), Energy Productivity (PE), and Net Energy (EL) for the production of broiler chickens in the Zona da Mata of Minas Gerais are presented in Table 6. The energy efficiency index showed that PP systems have lower energy use efficiency when compared to PN systems, and that if the production system is a generator-consumer along with the Electric Energy Compensation System, that is, production systems that adopt photovoltaic systems [16], there is up to a 4.5% increase in energy efficiency.
Table 6.
Energy indices of evaluated broiler production systems. Source: Own elaboration.
The energy productivity index reflects the efficiency with which energy is used to generate production. The results presented in Table 6 indicate that the system with more advanced technology, represented by the PN-CFV scenario, has an energy productivity 7.2% higher than the system with less technology, the PP-SFV. This difference is driven by better energy consumption management practices, mainly through the use of photovoltaic systems in conjunction with electricity consumption, which together result in lower energy consumption per unit of product.
Regarding the net energy index, Table 6 shows that, across all scenarios, the output energy was lower than the input energy. The PN-SFV scenario had the highest energy losses among the production systems. In contrast, the PN-CFV scenario showed lower losses, although it still recorded energy outputs lower than the input energy required. The differences in net energy values across the four evaluated scenarios were mainly due to electricity consumption from photovoltaic systems installed in poultry sheds. The adoption of these systems significantly reduced dependence on conventional grid energy, reduced the use of non-renewable sources, and consequently reduced total electricity consumption. This reduction is possible because the energy generated locally from solar radiation is used directly to power essential production equipment, such as ventilation, heating, lighting, and automated systems, thereby improving their energy efficiency. Thus, integrating photovoltaic energy into production systems effectively reduces energy consumption and promotes environmental sustainability in poultry production.
Among the photovoltaic systems, Table 5 shows that PP-CFV has an energy loss 13.0% greater than PN-CFV. For systems without photovoltaic integration, the PN-SFV system has an energy loss that is 26.5% higher than the PP-SFV system.
Since the highest energy consumption is associated with feed production and the use of coffee husks, it is necessary to evaluate alternatives for feed ingredients and poultry litter with lower energy coefficients. This is because, even with the adoption of photovoltaic systems, the scenarios assessed were unable to deliver output energy exceeding input energy. Therefore, to further increase system energy efficiency, it is essential to seek alternative, more sustainable sources for feed formulation and poultry waste management.
It is considered necessary to source feed formulated with more sustainably produced agricultural ingredients, such as organic crops, to reduce carbon emissions and reliance on fossil fuels. Furthermore, it is suggested to seek alternative raw materials for poultry litter, such as agricultural byproducts or recycled organic waste, to reduce energy demand from production and management processes. These measures aim to reduce total input energy consumption and, consequently, increase the energy efficiency (EE) and energy productivity (EP) of poultry production systems [2,10].
3.3. Economic Assessment
Table 7 presents the full breakdown of production costs for each scenario evaluated. From this cost breakdown, it was possible to evaluate which inputs have the highest expenses in broiler production systems.
Table 7.
Composition of the annual costs of the evaluated systems. Source: Own elaboration.
After obtaining the initial results of the economic analysis, labor costs were excluded from the cost calculation, as the vast majority of poultry farmers in the study region use family labor. However, it is essential to clarify that, if these payments were included, labor costs would range from 31.5% to 45.6% of annual production costs in the plans evaluated. This decision was made to reflect the local reality, where family labor, although not formally paid, represents an essential productive and economic resource. However, this exclusion significantly underestimates total costs, which should be taken into account when interpreting the financial results presented.
The study found that adopting family labor in poultry farming reduces total production costs, a finding also reported by Beal et al. [23], who identified paid labor as one of the most significant costs in conventional broiler production systems. This reduction occurs because family labor, often unpaid formally, reduces direct expenses such as wages and labor charges, thereby increasing the economic viability of rural properties [45]. Furthermore, the use of family labor plays an important social role, enabling families to remain in rural areas and promoting local development and the preservation of farming communities.
This dynamic relates to the sustainability of the broiler production chain not only from an economic perspective but also from a social and environmental perspective, and aligns with the Sustainable Development Goals (SDGs), especially SDG 2, which aims to eliminate hunger, promote food security, and advance sustainable agriculture. Research shows that production systems that encourage family labor tend to be more resilient and have lower socio-environmental impacts, reinforcing the role of this model in sustainable rural development [38].
The results in the PP-SFV scenario indicated that 32.9% of the costs are related to the acquisition of coffee husks, followed by the maintenance of equipment, machines and facilities (24.1%), electricity (20.2%), firewood for heating (10.6%), food in collection services (2.4%), diesel oil (2.2%), semi-kraft paper (2.0%) and others (5.5%) which included taxes, gasoline, natural gas, pest control and cleaning products, and telephone services.
In the positive pressure broiler production scenario with photovoltaic systems, PP-CFV, the costs of purchasing coffee husks were 41% of total costs, followed by maintenance of equipment, machines and facilities (30.0%), firewood for heating (13.2%), food in collection services (3.0%), diesel oil (2.8%), semi-kraft paper (2.4%), electricity (0.8%) and others (6.9%). The results showed a significant 19.4% reduction in electricity consumption by the electricity distributor per year with the inclusion of a photovoltaic system.
For negative pressure production systems, the PN-SFV scenario showed that 30.5% of the costs are related to the purchase of coffee husks, electricity (20.2%), maintenance of equipment, machines and facilities (16.2%), firewood for heating (10.8%), diesel (4.3%), food in collection service (3.3%), telephone and internet (2.4%), semi-kraft paper (1.3%) and others (4.0%) including taxes, gasoline, natural gas, pest control and cleaning products.
For the last scenario evaluated, PN-CFV, expenditure on purchasing coffee husks represented 41.6% of production costs, followed by maintenance of equipment, machines and facilities (22.1%), firewood for heating (14.8%), diesel oil (5.9%), food collection service (4.4%), telephone and internet (3.3%), semi-kraft paper (1.8%), electricity (0.6%) and others (5.4%). The results also point to a significant difference in electricity consumption with the electricity distributor, with a 26.5% annual reduction. Table 8 presents a summary of production costs and the economic indices evaluated in the study.
Table 8.
Annual indices and costs of evaluated broiler production systems. Source: Own elaboration.
Across all evaluated scenarios (Table 8), the production systems demonstrated cost-effective strategies, yielding positive profits. However, the system with the most advanced technology, the PN-CFV scenario, showed a profit 88.8% higher than the PP-SFV system. This difference is primarily due to the greater operational efficiency enabled by automation and the use of photovoltaic energy, which significantly reduces electricity costs—one of the most significant expenses in poultry production. Furthermore, photovoltaic systems enable greater energy independence and lower variable costs, thereby increasing producers’ profit margins. Meanwhile, the total cost profiles of the PP-CFV and PN-CFV systems are similar, but systems incorporating photovoltaic technology achieve an 81.2% higher profit than those without, highlighting the positive impact of these renewable resources on production economics.
Regarding the MB and ML indices, it was confirmed that the values shown in Table 8 are positive. Thus, it can be concluded that the broiler production systems are economically stable and remunerative [34]. It is noteworthy that profits increase when broiler production systems include photovoltaic systems that inject electrical energy credits into the production system’s consumer unit, while RCB decreases as technology levels decline. Furthermore, PP production systems have the lowest RCB values. According to SENAR [37], it is crucial to evaluate the relationship between gross income and total costs, as production systems with values of 1 or less can result in losses for rural producers and render the production process unfeasible.
3.4. Uncertainty Analysis
The results of the Uncertainty Analysis obtained from the simulation with the Monte Carlo tool, together with SimaPro®, are presented in Table 9. The work of Pereira et al. [30] was used as a reference for the uncertainty analysis of the production systems studied. The results for the GWP impact category showed less variation and fewer associated uncertainties.
Table 9.
Average and coefficients of variation for the impact categories assessed in the uncertainty analysis. Source: Own elaboration.
Regarding the acidification (AP) and eutrophication (EP) categories, the values presented in Table 9 indicate moderate to high coefficients of variation (CV). This variability can be explained by the nature of the primary data for feed production subsystem inputs, primarily corn and soybeans. These differences are reflected in the inventory through the uncertainty factors embedded in the ecoinvent database and, consequently, propagated in the Monte Carlo simulation. Studies such as Leinonen et al. [22] have also observed this high uncertainty in similar analyses, highlighting that variability in basic raw material data directly impacts the coefficients of variation in the related environmental categories.
4. Conclusions
This study evaluated broiler production systems using Life Cycle Assessment to analyze environmental impacts, energy use, and economic costs for rural producers. Based on the results obtained, it was concluded that:
- Production systems with photovoltaic systems have the potential to reduce CO2-eq emissions by 2.58 t (positive pressure systems) to 4.96 t (negative pressure systems) annually, while also achieving better energy efficiency indices.
- No significant differences were observed between positive and negative pressure systems, with or without photovoltaic systems, across the environmental impact categories assessed, given the Brazilian electricity grid’s high share of renewable sources.
- All scenarios analyzed demonstrated economic viability, with negative-pressure systems standing out for their best cost–benefit ratio.
- Feed production represented a significant portion of global warming potential (approximately 82%) and total energy demand, indicating the need for specific strategies for this phase.
- The highest costs were for coffee husks for chicken bedding (36.5%), facility maintenance (23.1%), and firewood for heating chicks (12.4%).
- The incorporation of photovoltaic systems reduces electricity costs by 19.4% to 26.5% per year, promoting not only savings but also greater energy sustainability.
- The most sustainable system, both environmentally and economically, was the negative-pressure system with photovoltaic generation, while the least sustainable was the positive-pressure system without photovoltaic generation.
Given the significant reductions in emissions and costs enabled by photovoltaic systems, it is recommended that public policies encourage their adoption in poultry production through subsidies, flexible credit lines, and technical training programs. Furthermore, special attention to feed production—the primary driver of environmental impact and energy consumption—justifies investments in research on more sustainable and efficient feed formulations [45,46,47].
Rural producers can benefit from adopting photovoltaic systems and technologies that improve energy and operational efficiency, promoting environmental and economic improvements. Integrating companies and government agencies should support processes that facilitate technological modernization.
This study was based on data from a specific region of Brazil and may not fully capture the country’s climatic, agricultural, and economic variations. Furthermore, the financial analysis did not account for formal remuneration for family labor, which may affect cost assessments.
Future research should optimize feed formulation to reduce environmental impact, conduct a detailed analysis of the adoption of various renewable sources, and assess the long-term economic effects of technological modernization. Studies involving other regions and complementary production systems are also essential to broaden the applicability of the results [48,49].
Author Contributions
Conceptualization, L.R.B., N.d.S.R. and N.D.d.S.L.; methodology, L.R.B., N.d.S.R. and N.D.d.S.L.; software, L.R.B., N.D.d.S.L. and C.F.R.; validation, L.R.B., N.d.S.R. and N.D.d.S.L.; writing—original draft preparation, L.R.B.; writing—review and editing, L.R.B., N.d.S.R., N.D.d.S.L. and N.B.; supervision, L.R.B., N.d.S.R. and N.D.d.S.L.; project administration, L.R.B., N.d.S.R. and N.D.d.S.L. All authors have read and agreed to the published version of the manuscript.
Funding
This research was partially funded by the Coordination for the Improvement of Higher Education Personnel—Brazil (CAPES)—Financial Code 001 and by the Federal Institute of Southeast Minas Gerais.
Institutional Review Board Statement
Not applicable.
Informed Consent Statement
Not applicable.
Data Availability Statement
The original contributions presented in this study are included in the article. Further inquiries can be directed to the corresponding author.
Conflicts of Interest
The authors declare no conflicts of interest.
References
- ABPA (Associação Brasileira de Proteína Animal). Relatório Anual. 2023. Available online: https://abpa-br.org/abpa-relatorio-anual/ (accessed on 8 September 2025).
- Painel Agropecuário. Painel de Dados da Produção Agropecuária; Secretaria de Estado de Agricultura, Pecuária e Abastecimento de Minas Gerais: Belo Horizonte, Brazil, 2023. Available online: https://www.mg.gov.br/agricultura (accessed on 11 September 2025).
- Nacimento, R.A.; Rojas Moreno, D.A.; Luiz, V.T.; Avelar de Almeida, T.F.; Rezende, V.T.; Bazerla Andreta, J.M.; Ifuki Mendes, C.M.; Giannetti, B.F.; Gameiro, A.H. Sustainability assessment of commercial Brazilian organic and conventional broiler production systems under an Emergy analysis perspective. J. Clean. Prod. 2022, 359, 132050. [Google Scholar] [CrossRef]
- Rostagno, H.S.; Albino, L.; Donzele, J.L.; Gomes, P.C.; De Oliveira, R.F.; Lopes, D.C.; Ferreira, A.S.; de Toledo Barreto, S.L.; Euclides, R. Tabelas Brasileiras para Suínos e Aves: Composição de Alimentos e Exigências Nutricionais (HS Rostagno), 3rd ed.; UFV: Viçosa, Brazil, 2011. [Google Scholar]
- Mottet, A.; Tempio, G. Global poultry production: Current state and future outlook and challenges. World’s Poult. Sci. J. 2017, 73, 245–256. [Google Scholar] [CrossRef]
- Alves, E.C.; dos Santos Alves, I.H.; Soares, B.B.; Borges, A.F.; Jalal, A.; Jani, A.D.; Abreu-Junior, C.H.; Capra, G.F.; Rodrigues Nogueira, T.A. Resource recovery of biological residues from the Brazilian poultry industry in mitigating environmental impacts: A life cycle assessment (LCA) approach. J. Clean. Prod. 2023, 416, 137895. [Google Scholar] [CrossRef]
- Costantini, M.; Ferrante, V.; Guarino, M.; Bacenetti, J. Environmental sustainability assessment of poultry productions through life cycle approaches: A critical review. Trends Food Sci. Technol. 2021, 110, 201–212. [Google Scholar] [CrossRef]
- Skunca, D.; Tomasevic, I.; Nastasijevic, I.; Tomovic, V.; Djekic, I. Life cycle assessment of the chicken meat chain. J. Clean. Prod. 2018, 184, 440–450. [Google Scholar] [CrossRef]
- Bamber, N.; Jones, M.; Nelson, L.; Hannam, K.; Nichol, C.; Pelletier, N. Life cycle assessment of mulch use on Okanagan apple orchards: Part 1—Attributional. J. Clean. Prod. 2020, 267, 121960. [Google Scholar] [CrossRef]
- Khanali, M.; Kokei, D.; Aghbashlo, M.; Nasab, F.K.; Hosseinzadeh-Bandbafha, H.; Tabatabaei, M. Energy flow modeling and life cycle assessment of apple juice production: Recommendations for renewable energies implementation and climate change mitigation. J. Clean. Prod. 2020, 246, 118997. [Google Scholar] [CrossRef]
- Pelletier, N. Environmental performance in the US broiler poultry sector: Life cycle energy use and greenhouse gas, ozone depleting, acidifying and eutrophying emissions. Agric. Syst. 2008, 98, 67–73. [Google Scholar] [CrossRef]
- Pishgar-Komleh, S.H.; Akram, A.; Keyhani, A.; van Zelm, R. Life cycle energy use, costs, and greenhouse gas emission of broiler farms in different production systems in Iran—A case study of Alborz province. Environ. Sci. Pollut. Res. 2017, 24, 16041–16049. [Google Scholar] [CrossRef] [PubMed]
- da Silva Lima, D.; de Alencar Nääs, I.; Garcia, R.G.; Jorge de Moura, D. Environmental impact of Brazilian broiler production process: Evaluation using life cycle assessment. J. Clean. Prod. 2019, 237, 117752. [Google Scholar] [CrossRef]
- Martinelli, G.; Vogel, E.; Decian, M.; Farinha, M.J.U.S.; Bernardo, L.V.M.; Borges, J.A.R.; Gimenes, R.M.T.; Garcia, R.G.; Ruviaro, C.F. Assessing the eco-efficiency of different poultry production systems: An approach using life cycle assessment and economic value added. Sustain. Prod. Consum. 2020, 24, 181–193. [Google Scholar] [CrossRef]
- Rocchi, L.; Paolotti, L.; Rosati, A.; Boggia, A.; Castellini, C. Assessing the sustainability of different poultry production systems: A multicriteria approach. J. Clean. Prod. 2019, 211, 103–114. [Google Scholar] [CrossRef]
- Li, Y.; Arulnathan, V.; Heidari, M.D.; Pelletier, N. Design considerations for net zero energy buildings for intensive, confined poultry production: A review of current insights, knowledge gaps, and future directions. In Renewable and Sustainable Energy Reviews; Elsevier Ltd.: Amsterdam, The Netherlands, 2022; Volume 154. [Google Scholar] [CrossRef]
- Presidência da República. Lei nº 14.300, de 06 de Janeiro de 2022. In Institui o Marco Legal da Microgeração e Minigeração Distribuída, o Sistema de Compensação de Energia Elétrica (SCEE) e o Programa de Energia Renovável Social (PERS); Presidência da República: Brasília, Brazil, 2022. Available online: http://www.planalto.gov.br/ccivil_03/_ato2019-2022/2022/lei/L14300.htm (accessed on 11 September 2025).
- ISO 14040; Environmental Management e Life Cycle Assessment e Principles and Framework. ISO (International Standards Organization): Geneva, Switzerland, 2009.
- ISO 14044; Environmental Management e Life Cycle Assessment e Requirements and Guidelines. ISO (International Standards Organization): Geneva, Switzerland, 2009.
- Abranches Felix Cardoso Junior, R.; Schwertner Hoffmann, A.; de Barbosa, L.O.; de Azevedo Pires Soares Coutinho, R. A Geração Distribuída E A Redução De Carbono Na Matriz Elétrica Brasileira. Rev. Int. Ciências 2021, 11, 42–60. [Google Scholar] [CrossRef]
- Mendes, N.C. Métodos e Modelos de Caracterização para Avaliação de Impacto do Ciclo de vida: Análise e Subsídios para a Aplicação no Brasil. Master’s Thesis, Universidade de São Paulo, São Carlos, Brazil, 2013. [Google Scholar] [CrossRef]
- Leinonen, I.; Williams, A.G.; Wiseman, J.; Guy, J.; Kyriazakis, I. Predicting the environmental impacts of chicken systems in the United Kingdom through a life cycle assessment: Broiler production systems. Poult. Sci. 2012, 91, 8–25. [Google Scholar] [CrossRef]
- Beal, C.M.; Robinson, D.M.; Smith, J.; Gerber Van Doren, L.; Tabler, G.T.; Rochell, S.J.; Kidd, M.T.; Bottje, W.G.; Lei, X. Economic and environmental assessment of U.S. broiler production: Opportunities to improve sustainability. Poult. Sci. 2023, 102, 102887. [Google Scholar] [CrossRef]
- Sleeswijk, A.W.; van Oers, L.F.; Guinée, J.B.; Struijs, J.; Huijbregts, M.A. Normalisation in product life cycle assessment: An LCA of the global and European economic systems in the year 2000. Sci. Total Environ. 2008, 390, 227–240. [Google Scholar] [CrossRef]
- Guinée, J.B.; Gorrée, M.; Heijungs, R.; Huppes, G.; Kleijn, R.; de Koning, A.; van Oers, L.; Wegener Sleeswijk, A.; Suh, S.; Udo de Haes, H.A.; et al. Handbook on life Cycle Assessment. Operational Guide to the ISO Standards; I: LCA in perspective. IIa: Guide. IIb: Operational annex. III: Scientific background; Kluwer Academic Publishers: Dordrecht, The Netherlands, 2002; p. 692. ISBN 1-4020-0228-9. [Google Scholar]
- Mostert, P.F.; Bos, A.P.; van Harn, J.; de Jong, I.C. The impact of changing towards higher welfare broiler production systems on greenhouse gas emissions: A Dutch case study using life cycle assessment. Poult. Sci. 2022, 101, 102151. [Google Scholar] [CrossRef]
- Usva, K.; Hietala, S.; Nousiainen, J.; Vorne, V.; Vieraankivi, M.L.; Jallinoja, M.; Leinonen, I. Environmental life cycle assessment of Finnish broiler chicken production—Focus on climate change and water scarcity impacts. J. Clean. Prod. 2023, 410, 137097. [Google Scholar] [CrossRef]
- Cheng, Z.; Jia, Y.; Bai, Y.; Zhang, T.; Ren, K.; Zhou, X.; Zhai, Y.; Shen, X.; Hong, J. Intensifying the environmental performance of chicken meat production in China: From perspective of life cycle assessment. J. Clean. Prod. 2023, 384, 35603. [Google Scholar] [CrossRef]
- PRé. Introduction to LCA with SimaPro. 2016. Available online: https://pre-sustainability.com/files/2014/05/SimaPro8IntroductionToLCA.pdf (accessed on 11 September 2025).
- PRé. SimaPro Database Manual. 2023. Available online: https://simapro.com/wp-content/uploads/2023/04/DatabaseManualMethods.pdf (accessed on 11 September 2025).
- Baiochi, A.G.; da Silva, V.G. Análise de incerteza de parâmetros com base em processos críticos em avaliação do ciclo de vida de edificações. PARC Pesqui. Arquitetura Construção 2021, 12, e021027. [Google Scholar] [CrossRef]
- Heidari, M.D.; Omid, M.; Akram, A. Energy efficiency and econometric analysis of broiler production farms. Energy 2011, 36, 6536–6541. [Google Scholar] [CrossRef]
- Elahi, E.; Zhang, Z.; Khalid, Z.; Xu, H. Application of an artificial neural network to optimise energy inputs: An energy- and cost-saving strategy for commercial poultry farms. Energy 2022, 244, 123169. [Google Scholar] [CrossRef]
- Andrade, I.R.A.; Nogueira Furtado, R.; da Silva, R.G.; Fernandes Franco Pompeu, R.C.; Duarte Cândido, M.J. Metodologias para avaliação econômica de sistemas de produção agropecuários. Arch. Zootec. 2018, 67, 610–620. Available online: https://ainfo.cnptia.embrapa.br/digital/bitstream/item/185636/1/CNPC-2018-Metodologias.pdf (accessed on 11 September 2025). [CrossRef][Green Version]
- Ibrahim, D.; Moustafa, A.; Shahin, S.E.; Sherief, W.R.I.A.; Abdallah, K.; Farag, M.F.M.; Nassan, M.A.; Ibrahim, S.M. Impact of Fermented or Enzymatically Fermented Dried Olive Pomace on Growth, Expression of Digestive Enzyme and Glucose Transporter Genes, Oxidative Stability of Frozen Meat, and Economic Efficiency of Broiler Chickens. Front. Vet. Sci. 2021, 8, 644325. [Google Scholar] [CrossRef]
- Qaid, M.M.; Al-Mufarrej, S.I.; Al-Garadi, M.A.; Al-Haidary, A.A. Effects of Rumex nervosus leaf powder supplementation on carcasses compositions, small intestine dimensions, breasts color quality, economic feasibility in broiler chickens. Poult. Sci. 2023, 102, 102943. [Google Scholar] [CrossRef]
- SENAR. Gestão da Atividade Agropecuária: Custos de Produção. 2024. Available online: https://ead.senar.org.br/curso-whatsapp/gestao-da-atividade-agropecuaria-custos-de-producao (accessed on 11 September 2025).
- ONU. Sobre o Nosso Trabalho para Alcançar os Objetivos de Desenvolvimento Sustentável no Brasil; Organização das Nações Unidas: Brasília, Brazil, 2024; Available online: https://brasil.un.org/pt-br/sdgs (accessed on 11 September 2025).
- Zheng, Z.; Lei, T.; Wang, J.; Wei, Y.; Liu, X.; Yu, F.; Ji, J. Catalytic Cracking of Soybean Oil for Biofuel over γ-Al2O3/CaO Composite Catalyst. J. Braz. Chem. Soc. 2019, 30, 359–370. [Google Scholar] [CrossRef]
- Silva, F.T.M. Valorização da Madeira Eucalyptus sp. via Pirólise: Caracterização e Rendimentos dos Produtos. Ph.D. Thesis, Universidade Federal de Uberlândia, Uberlândia, Brazil, 2019; 152p. [Google Scholar] [CrossRef]
- de Freitas, C.P.M. O Potencial do Resíduo do Café Como Fonte de Geração de Energia. Master’s Thesis, Universidade Federal de Viçosa, Viçosa, Brazil, 2022; 97p. [Google Scholar]
- Teodoro, M.I.T.M. Energia Embutida na Construção de Edificações no Brasil: Contribuições para o Desenvolvimento de Políticas Públicas a Partir de um Estudo de Caso em Mato Grosso do Sul. Ph.D. Thesis, Universidade de São Paulo, São Paulo, Brazil, 2017. [Google Scholar] [CrossRef]
- Pasolini, V.H.; Costa, A.B.S.; Perazzini, M.T.B.; Cipriano, D.F.; Freitas, J.C.C.; Perazzini, H.; Sousa, R.C. Valorization of pure poultry manure for biomass applications: Drying and energy potential characteristics. Renew. Energy 2024, 220, 119609. [Google Scholar] [CrossRef]
- Sordi, C.; De Tavernari, F.C.; Surek, D.; Ribeiro Júnior, V. Características Físicas de Rações Para Frangos de Corte Contendo Glicerina Bruta. In Jornada de Iniciação Científica (Jinc) 10, Concórdia; Anais; Embrapa: Brasília, Brazil, 2016; pp. 127–128. [Google Scholar]
- EPE. Plano Nacional de Energia 2050; Ministério de Minas e Energia: Brasília, Brazil, 2020. Available online: https://www.epe.gov.br/pt/publicacoes-dados-abertos/publicacoes/Plano-Nacional-de-Energia-2050 (accessed on 11 September 2025).
- Presidência da República. Lei nº 11.326, de 24 de Julho de 2006. Estabelece as Diretrizes para a Formulação da Política Nacional da Agricultura Familiar e Empreendimentos Familiares Rurais; Presidência da República: Brasília, Brazil, 2006. Available online: https://www.planalto.gov.br/ccivil_03/_ato2004-2006/2006/lei/l11326.htm (accessed on 11 September 2025).
- Karlsson, L.; Röös, L.; Röös, E. What is a better chicken? Exploring trade-offs between animal welfare and greenhouse gas emissions in higher-welfare broiler systems. Sustain. Prod. Consum. 2025, 55, 203–216. [Google Scholar] [CrossRef]
- Bigiotti, S.; Costantino, C.; Patriarca, A.; Mancini, G.; Provolo, G.; Recanatesi, F.; Ripa, M.N.; Marucci, A. Energy Efficiency and Environmental Sustainability in Rural Buildings: A Life Cycle Assessment of Photovoltaic Integration in Poultry Tunnels—A Case Study in Central Italy. Appl. Sci. 2025, 15, 5094. [Google Scholar] [CrossRef]
- Kang, H.Y.; Hwang, Y.W.; Lee, J.H.; Cho, S.J.; Jeon, Y.S.; Kim, N.S.; Kim, J. Evaluating the greenhouse gas emissions footprint of chicken meat production in South Korea: A life cycle perspective. Food Bioprod. Process. 2025, 150, 230–239. [Google Scholar] [CrossRef]
Disclaimer/Publisher’s Note: The statements, opinions and data contained in all publications are solely those of the individual author(s) and contributor(s) and not of MDPI and/or the editor(s). MDPI and/or the editor(s) disclaim responsibility for any injury to people or property resulting from any ideas, methods, instructions or products referred to in the content. |
© 2025 by the authors. Licensee MDPI, Basel, Switzerland. This article is an open access article distributed under the terms and conditions of the Creative Commons Attribution (CC BY) license (https://creativecommons.org/licenses/by/4.0/).