Article

SVMobileNetV2: A Hybrid and Hierarchical CNN-SVM Network Architecture Utilising UAV-Based Multispectral Images and IoT Nodes for the Precise Classification of Crop Diseases

by
Rafael Linero-Ramos
1,2,
Carlos Parra-Rodríguez
2 and
Mario Gongora
3,*
1
Faculty of Engineering, Universidad del Magdalena, Street 29H3 No 22-01, Santa Marta 470004, Colombia
2
Faculty of Engineering, Pontificia Universidad Javeriana, 7th No. 40-62, Building. N° 11. José Gabriel Maldonado. Floor 2, Bogotá 110231, Colombia
3
Faculty of Computing, Engineering and Media, De Montfort University, The Gateway, Leicester LE1 9BH, UK
*
Author to whom correspondence should be addressed.
AgriEngineering 2025, 7(10), 341; https://doi.org/10.3390/agriengineering7100341
Submission received: 2 September 2025 / Revised: 4 October 2025 / Accepted: 9 October 2025 / Published: 10 October 2025

Abstract

This paper presents a novel hybrid and hierarchical architecture of a Convolutional Neural Network (CNN), based on MobileNetV2 and Support Vector Machines (SVM) for the classification of crop diseases (SVMobileNetV2). The system feeds from multispectral images captured by Unmanned Aerial Vehicles (UAVs) alongside data from IoT nodes. The primary objective is to improve classification performance in terms of both accuracy and precision. This is achieved by integrating contemporary Deep Learning techniques, specifically different CNN models, a prevalent type of artificial neural network composed of multiple interconnected layers, tailored for the analysis of agricultural imagery. The initial layers are responsible for identifying basic visual features such as edges and contours, while deeper layers progressively extract more abstract and complex patterns, enabling the recognition of intricate shapes. In this study, different datasets of tropical crop images, in this case banana crops, were constructed to evaluate the performance and accuracy of CNNs in detecting diseases in the crops, supported by transfer learning. For this, multispectral images are used to create false-color images to discriminate disease through spectra related to the blue, green and red colors in addition to red edge and near-infrared. Moreover, we used IoT nodes to include environmental data related to the temperature and humidity of the environment and the soil. Machine Learning models were evaluated and fine-tuned using standard evaluation metrics. For classification, we used fundamental metrics such as accuracy, precision, and the confusion matrix; in this study was obtained a performance of up to 86.5% using current deep learning models and up to 98.5% accuracy using the proposed hybrid and hierarchical architecture (SVMobileNetV2). This represents a new paradigm to significantly improve classification using the proposed hybrid CNN-SVM architecture and UAV-based multispectral images.

1. Introduction

Agriculture is an important activity for humans due to the cultivation and production of food. For these environmentally related activities to be sustainable, crops worldwide must consider a balance between economic viability, environmental impact, and providing food security [1].
Advancing towards sustainability in agriculture requires adherence to globally endorsed practices, especially those outlined by institutions like the Food and Agriculture Organization. Central to this is the alignment with Sustainable Development Goal 2, which emphasises the eradication of hunger, the assurance of food availability, the promotion of balanced nutrition, and the encouragement of farming methods that respect and protect the environment [2].
Banana cultivation plays a crucial role in addressing global food challenges, particularly in the context of food security and nutritional improvement. As one of the most widely cultivated and consumed fruits worldwide, bananas serve as a key source of essential nutrients in both exporting and importing regions [3]. In many low-income and food-insecure countries, bananas are not only a fundamental component of local diets but also represent a significant source of income, thereby supporting both subsistence farming and commercial agriculture [4].
However, the path toward sustainable agriculture is increasingly obstructed by climatic fluctuations, pest infestations, and the spread of destructive diseases such as Fusarium wilt tropical race 4 (TR4) and Black Sigatoka [5]. These conditions have exposed a concerning genetic fragility in banana varieties, particularly under stress from fungal pathogens that degrade foliar structures, inhibit chlorophyll development, and undermine the plant’s capacity for efficient photosynthesis [6].
Over recent decades, these fungal infections have posed a persistent challenge to global commercial banana production, leading to substantial reductions in yield [7]. Among them, Black Sigatoka has emerged as the most critical threat, with reported losses reaching up to 50% in affected plantations [8]. Disease management has traditionally relied on intensive preventive applications of fungicides, either protective, systemic, or a combination of both, with some farms implementing up to 52 aerial spraying cycles per year. This approach is not only economically burdensome but also places considerable pressure on operational costs, thereby narrowing profit margins for producers [9].
One of the prevailing challenges in modern agriculture is the implementation of accurate and efficient techniques for the early identification of plant diseases. Traditionally, disease diagnosis has relied heavily on manual inspection and visual evaluation of symptomatic signs on plant foliage [10]. However, recent advancements in unmanned aerial vehicle (UAV) platforms, alongside the evolution of multispectral and hyperspectral imaging technologies, have opened up new avenues for precision agriculture. These remote sensing tools, when mounted on UAVs equipped with high spatial, spectral, and temporal resolution sensors, offer a robust alternative to conventional inspection methods, enabling more detailed, scalable, and cost-effective monitoring of crop health and physiological traits [11].
The integration of cutting-edge sensors, sophisticated software, and improved UAV platforms has significantly increased the adoption of drone technology in the field of precision agriculture. These aerial systems are now widely utilised by researchers and practitioners to monitor various agronomic parameters, including crop health and disease incidence [12]. The timely identification of plant diseases is essential to mitigate yield reduction and enhance overall farm profitability [13]. Nevertheless, to obtain reliable and precise estimations of disease presence, the application of advanced data-driven methodologies, such as machine learning and deep learning, is indispensable.
Current advances in deep learning, particularly through the application of Convolutional Neural Networks (CNNs), have facilitated the development of diverse algorithms for identifying foliar diseases in banana crops, achieving accuracy rates ranging from 85% to 99% [14]. In efforts to further enhance classification accuracy and model robustness, researchers have begun exploring hybrid approaches, which integrate CNNs with complementary machine learning techniques such as Long Short-Term Memory (LSTM) networks and Support Vector Machines (SVM) [15].
In these explorations of hybrid approaches, several recent studies have further improved the classification accuracy and robustness of disease detection and classification models across different crops [16,17], and specifically in banana cultivation, such as in the detection of Moko and Black Sigatoka diseases using UAV imagery [18].
Similarly, the use of UAVs in combination with spectrophotometric and multispectral imagery data has enabled researchers to achieve accurate, real-time identification of diseased and healthy leaf regions [19]. In Banana applications, work supporting informed decision-making in precision agriculture and providing precise instance-level localisation of disease symptoms, achieved a mean precision of 79.6%, recall of 80.3%, mAP@0.5 of 84.9%, and mAP@0.5:0.95 of 62.9% [20].
This research contributes to the role of UAV-based monitoring for the precise classification of diseases affecting banana crops. UAVs equipped with multispectral sensors enable near-canopy remote sensing, offering both spatial and spectral data that can support the early identification of infected plants [21]. By leveraging this rich multidimensional input, a combination of deep learning techniques, such as CNNs, Support Vector Machines (SVMs), Recurrent Neural Networks (RNNs), and regression models, can be employed to improve classification outcomes in the context of disease detection [22,23].
In this combination of techniques, the Convolutional Neural Networks (CNNs) represent a category of artificial neural networks extensively employed in machine learning, designed to emulate the capabilities of neurons in the human visual system. CNNs comprise multiple specialised, interconnected layers; initial layers focus on detecting basic features like lines and curves, while subsequent, deeper layers are progressively refined to identify more complex shapes [24]. The Long Short-Term Memory (LSTM) network, a specialised form of Recurrent Neural Network (RNN), incorporates memory gates designed to preserve both short-term and long-term dependencies within sequential data. This architecture enables the effective extraction of temporal features and facilitates accurate classification tasks [25]. In contrast, the Support Vector Machine (SVM) is a supervised learning algorithm that operates by determining the optimal decision boundary, either a line or a hyperplane, in an N-dimensional feature space, with the aim of maximising the margin between data classes [26].
Various algorithms have demonstrated effectiveness in identifying Black Sigatoka at multiple spatial resolutions using data from the visible spectrum [27]. Moreover, the integration of machine learning models with heterogeneous sensor data, particularly from multispectral imaging systems, has significantly improved the reliability of disease detection in agricultural contexts [28]. The use of multispectral sensors has proved especially valuable for characterising disease presence through spectral analysis, where wavelengths ranging from the red band (approximately 650–673 nm) to the near-infrared region (800–880 nm) serve as clear indicators of changes in foliar chlorophyll concentration [29].
This study aims to assess multiple hybrid Convolutional Neural Network (CNN) architectures grounded in contemporary deep learning methodologies, utilising false-color images derived from multispectral imagery captured by UAVs. The evaluation is conducted through classification algorithms aimed at detecting Black Sigatoka in commercial banana plantations, employing various combinations of CNN architectures alongside other machine learning models, including SVM.
In a previous independent study, we evaluated a range of CNN models for the classification of Black Sigatoka in banana crops, examining dataset scalability using UAV-based multispectral imagery supported by transfer learning [30], achieving a performance accuracy of 86.5%. Building on this work, the present study seeks to broaden the contribution in two key directions. First, beyond the application of conventional CNN architectures to UAV-captured multispectral images, this research develops a hybrid and hierarchical architecture that substantially enhances both accuracy and precision in disease classification. Second, in contrast to the earlier study, the proposed methodology integrates multispectral imagery with environmental variables (air and soil temperature and humidity measured by IoT nodes), enabling a multimodal approach to disease detection. Furthermore, we acquired a new multispectral images dataset using a new, more advanced drone (Figure 1) and created an alternative false-color dataset (Section 2.2).
The structure of this paper is organised into five sections: Section 1 introduces the research context and reviews the current advancements in crop disease classification using multispectral imagery acquired by UAVs and hybridised machine learning models. It also sets forth the research objectives and the underlying rationale of the study. Section 2 details the methodological framework, including UAV-based image acquisition, the integration of environmental data via IoT sensor nodes, dataset construction, and the training and validation procedures for the proposed classification models. Section 3 outlines the core findings derived from the experimental analysis. In Section 4, a critical discussion is undertaken, juxtaposing the empirical outcomes with existing literature. Finally, Section 5 provides the main conclusions, highlighting the study’s scientific contributions and potential directions for future research.

2. Materials and Methods

2.1. Image Acquisition

For this research, multispectral images captured by a DJI Mavic 3M drone were used. This drone is equipped with an RGB imaging system and four dedicated multispectral sensors. Its RGB camera, featuring a 4/3 CMOS sensor with 20 megapixels and a mechanical shutter, minimises motion blur and allows for rapid image capture at 0.7 s intervals when operating independently. The multispectral module includes four 5-megapixel cameras that cover key spectral bands: green (560 nm ± 16 nm), red (650 nm ± 16 nm), red edge (730 nm ± 16 nm), and near-infrared (860 nm ± 26 nm), as illustrated in Figure 1; these are located in the underside of the drone and controlled through a gimbal to point either front or down. Combined with a spectral sunlight sensor, this configuration supports advanced applications such as high-accuracy aerial mapping, assessment of crop development, and environmental resource monitoring [31].
The methodology employed for image acquisition was the one implemented in our previous study [30]. The images were captured between 9:00 and 11:00 a.m. at two sampling altitudes—15 and 25 m above ground level—across five banana-producing farms located in the department of Magdalena, Colombia. This approach aimed to increase the number of both healthy leaves and diseased leaves samples for the construction of a new dataset (see Figure 2).
The plantations consist of the ‘Williams’ cultivar, Cavendish subgroup, Musa acuminata variety, with an age between 4 and 9 months, and in both productive and reproductive stages. Given that Black Sigatoka is endemic in the Magdalena department, infections were present in all six stages during data collection, reflecting the foliar impact and symptom progression of the disease on banana leaves. These stages were identified following the Gauhl and Fouré classification [32], as corroborated by phytopathology experts supporting this research.
It is worth emphasising that this study does not assess the severity levels of the disease but rather concentrates exclusively on its binary classification (presence or absence) based on expert labelling of 2706 diseased leaf images and 3102 healthy leaf images.

2.2. Dataset Construction

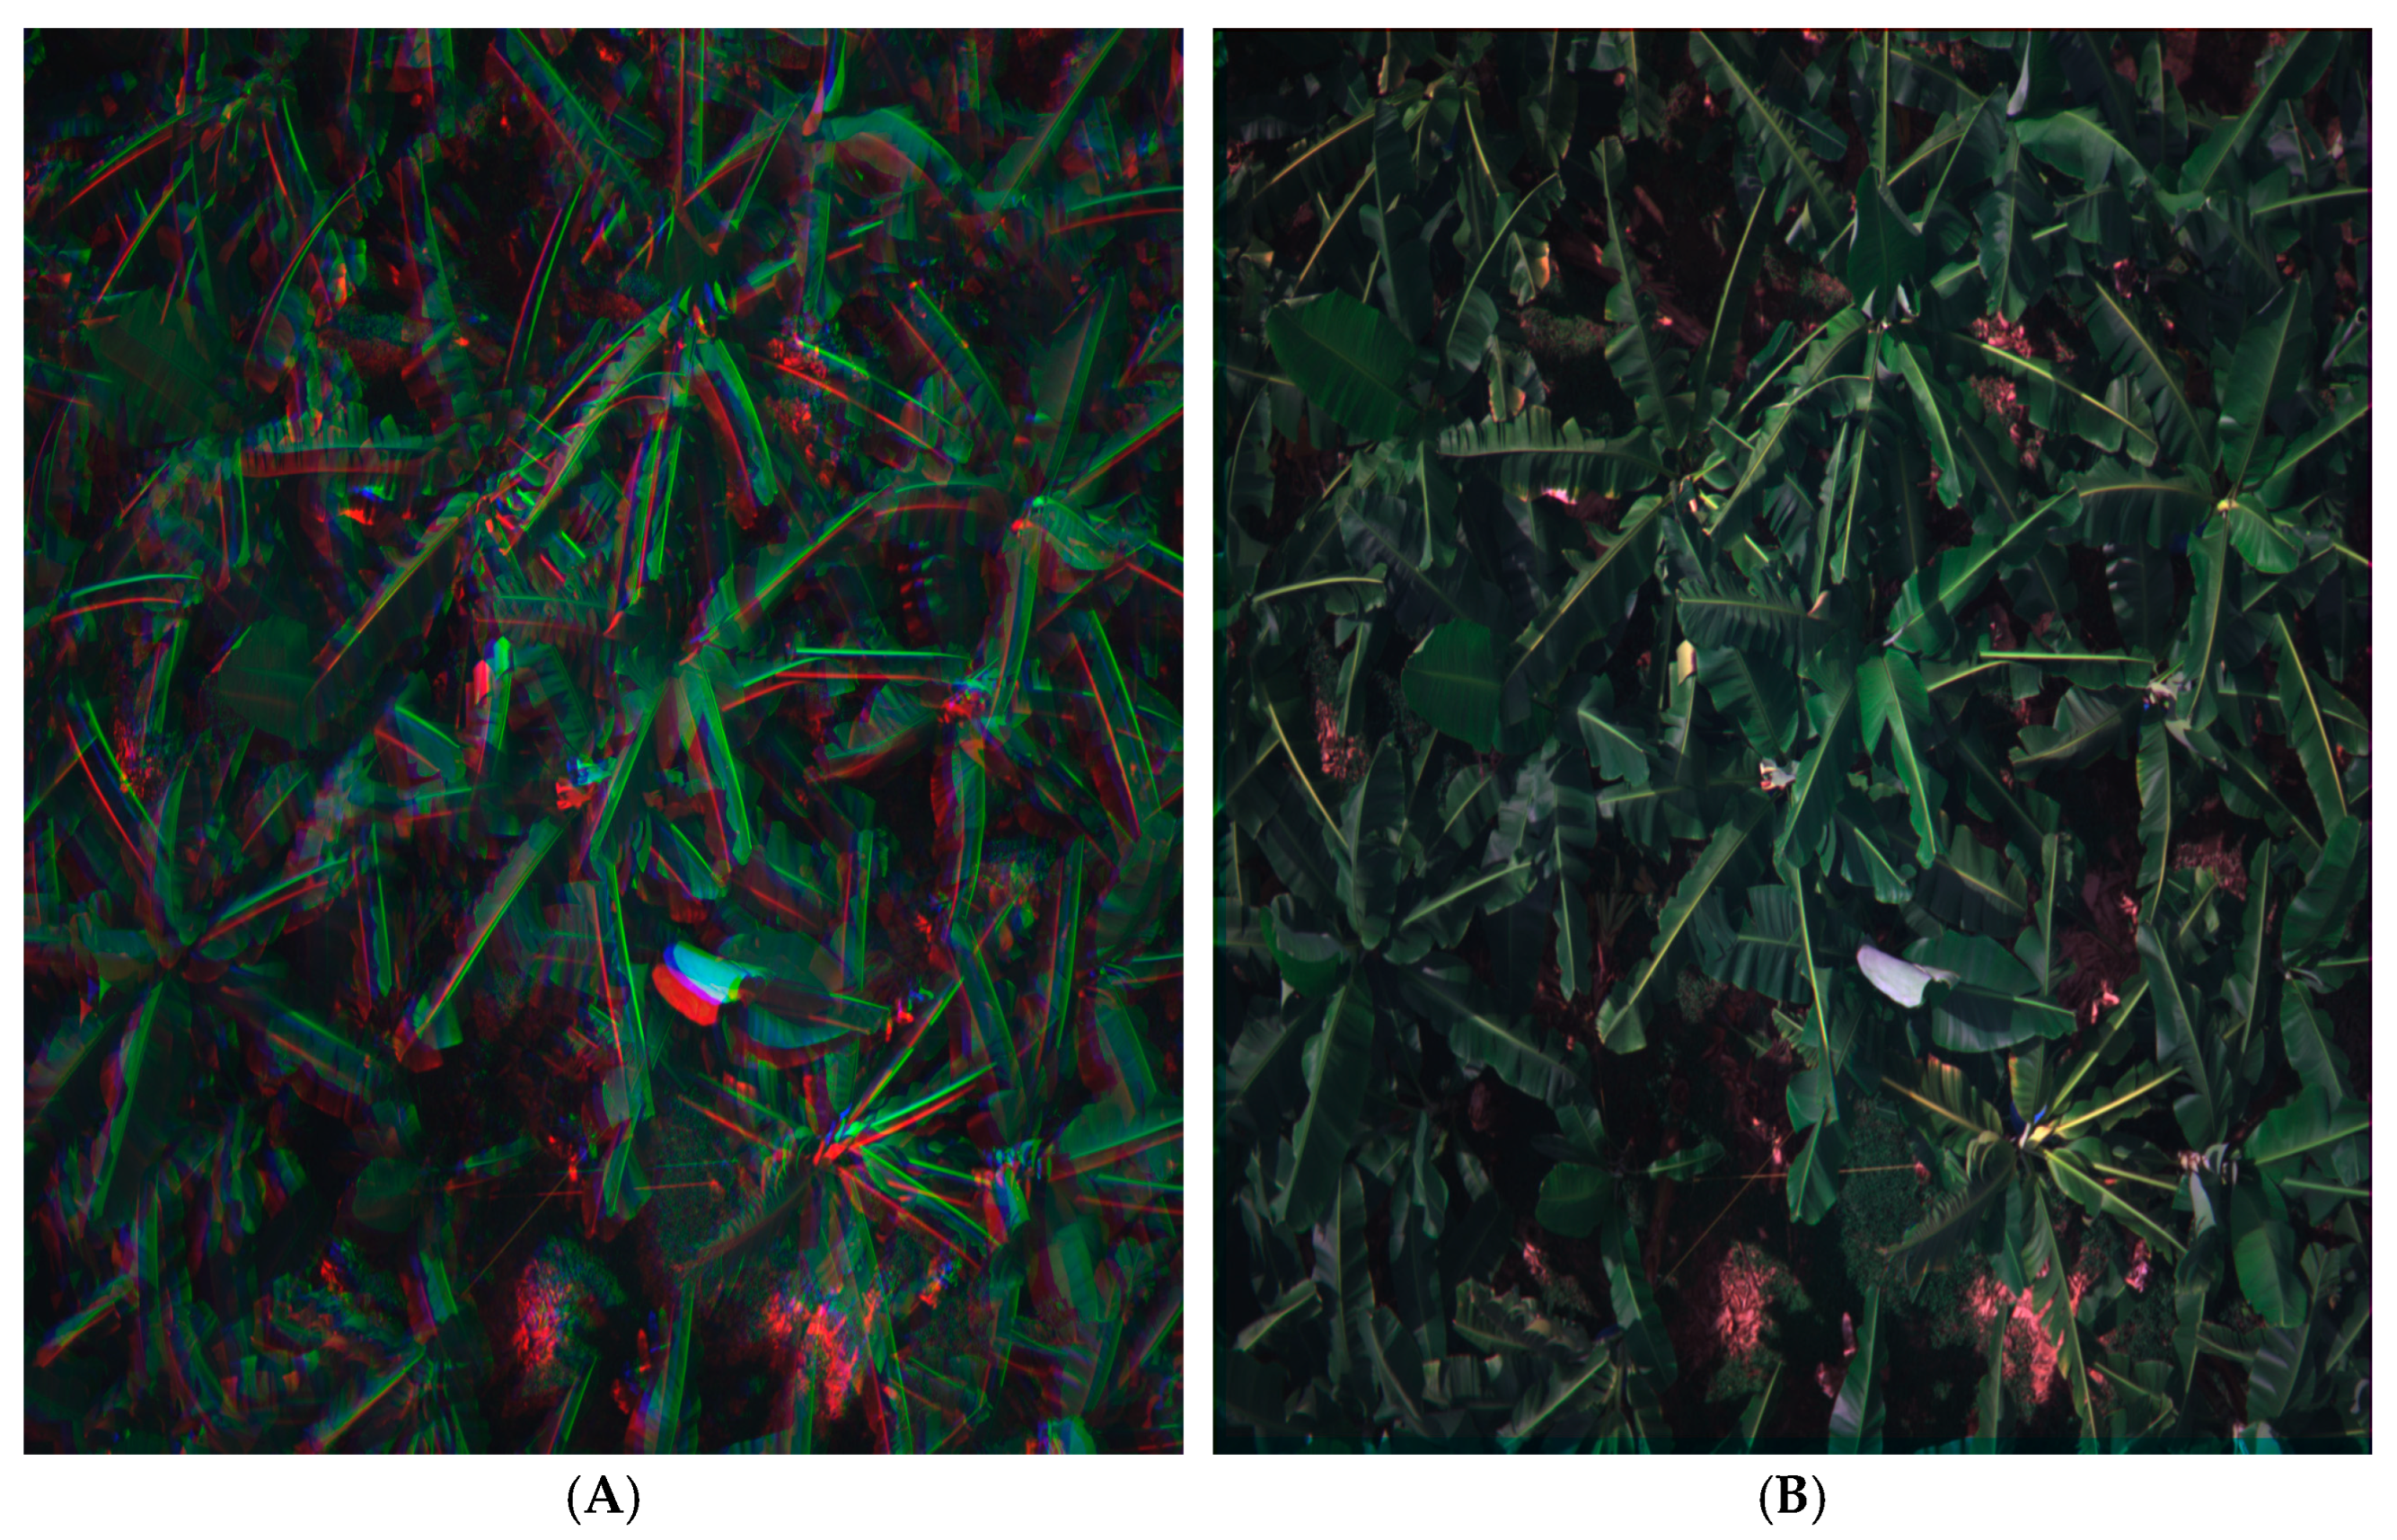
To construct false-color imagery, it is essential to account for the optical disparity arising from the physical separation of the lenses associated with each spectral band on the multispectral DJI Mavic 3M drone. This disparity introduces spatial misalignments, denoted by shifts in the (x, y) axes, between the individual spectral images, as illustrated in Figure 1. To address this issue and enable accurate spectral comparisons within the leaf area, a computer vision-based alignment technique was applied. Specifically, the Scale-Invariant Feature Transform (SIFT) algorithm was utilised [33], facilitating the precise registration of the five spectral bands in each of the 505 effective images captured, all with a unified resolution of 1600 × 1300 pixels. This alignment process ensures temporal invariance of the key features used, thus providing reliable pixel-level spectral information. The corrected results are shown in Figure 3.
By utilising the GPS coordinates of 282 recorded points, in conjunction with the georeferenced imagery captured by the UAV, multiple infection hotspots were identified. From these zones, a total of 505 effective images were extracted, each containing at least one banana leaf affected by Black Sigatoka, captured at varying spatial scales.
In contrast to detection, classification tasks necessitate only an object-based dataset [34]. Therefore, the 505 selected images were segmented into smaller patches measuring 160 × 130 pixels, which allows for to extraction of representative samples of distinct objects-namely diseased leaves, healthy leaves, and others containing non-leaf elements. This procedure enabled the construction of a dataset comprising three distinct categories: 2706 samples of diseased leaves, 3102 samples of healthy leaves, and 1192 samples representing non-leaf objects, as illustrated in Figure 4.
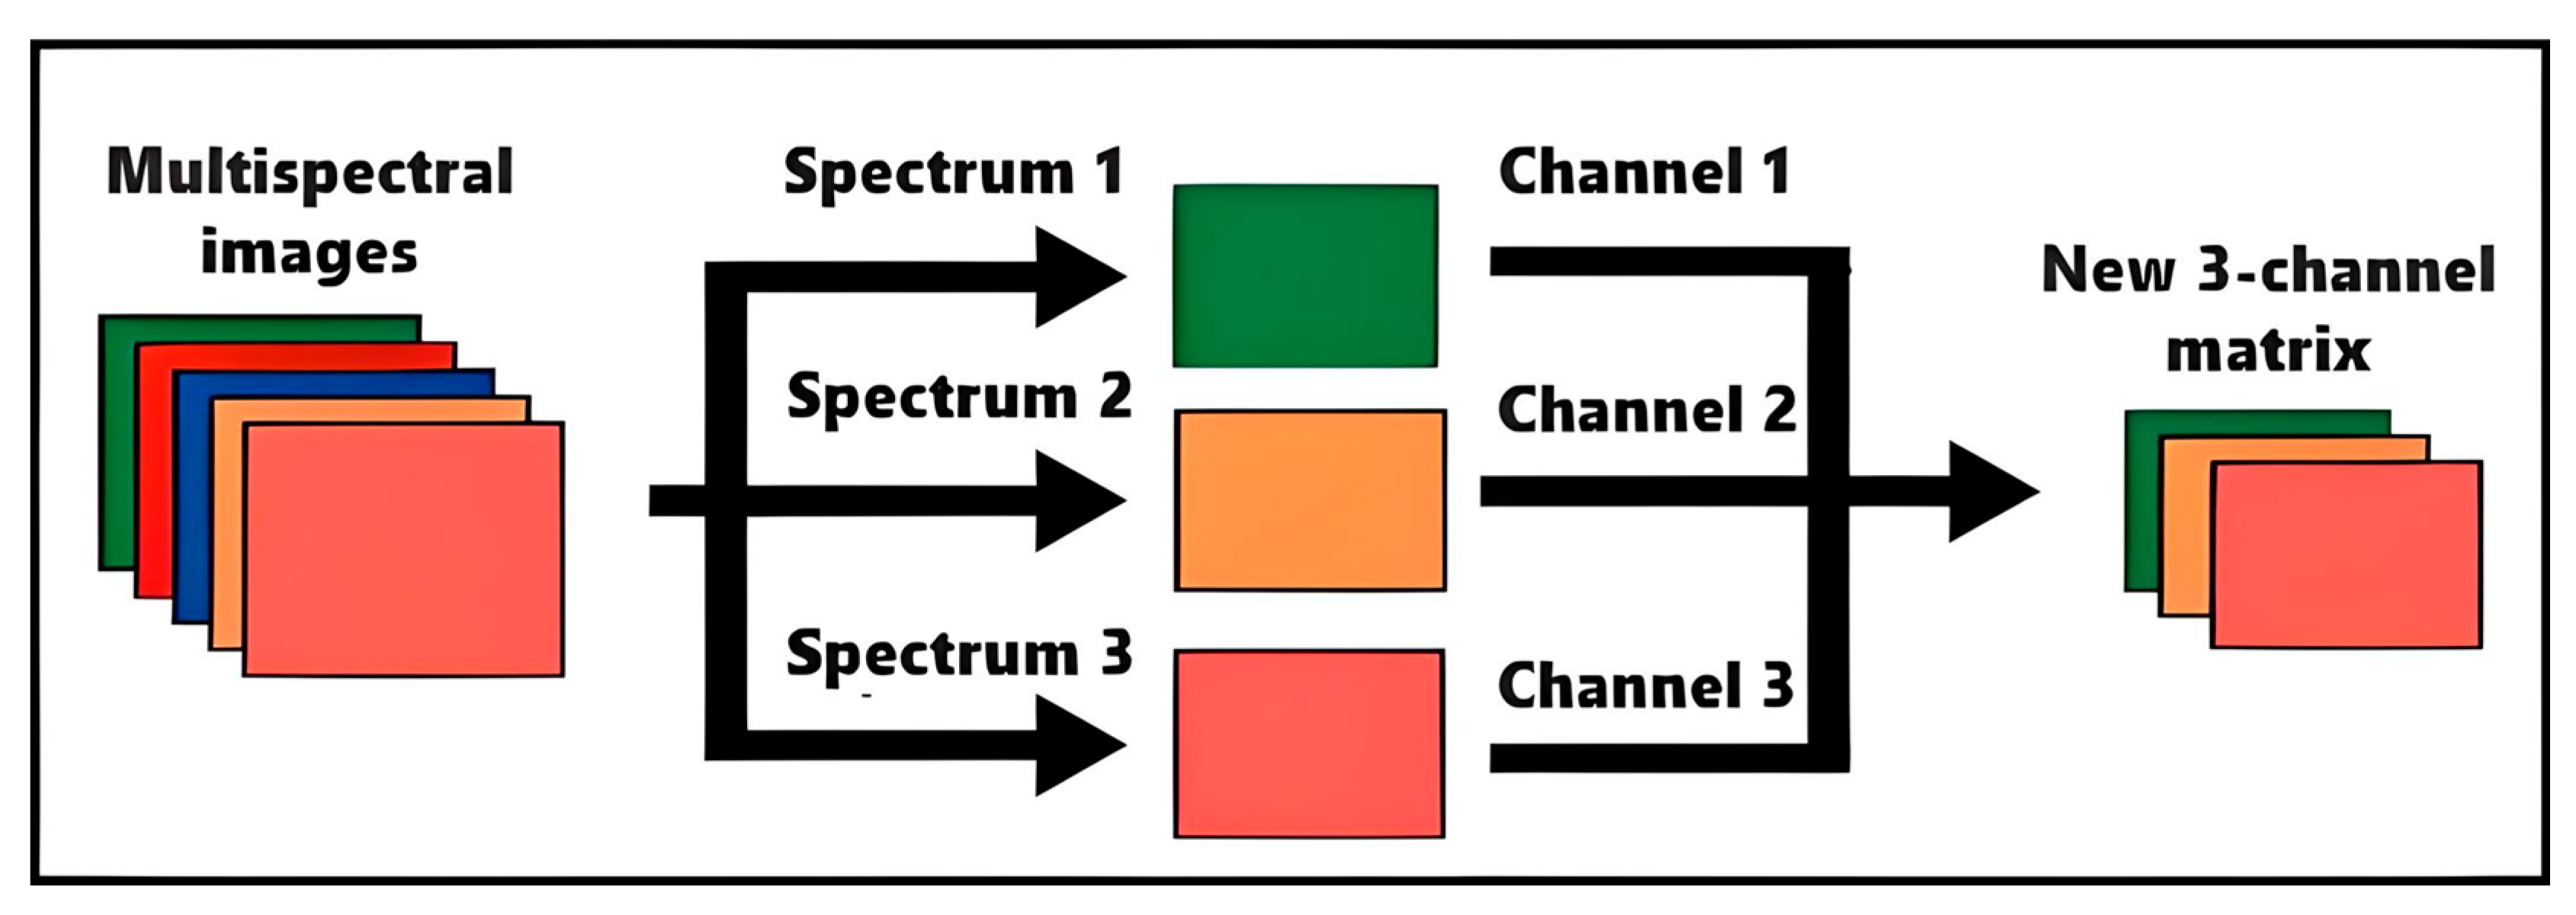
This approach introduces alternative criteria for visual photointerpretation by substituting one or more image channels with threshold values derived from the multispectral sensor [35], thereby enhancing the volume of training data. Moreover, it allows for the generation of images within an enriched colour space, surpassing the quality of those limited to the visible spectrum, without necessitating substantial computational power [36]. The process is schematically represented in Figure 5.
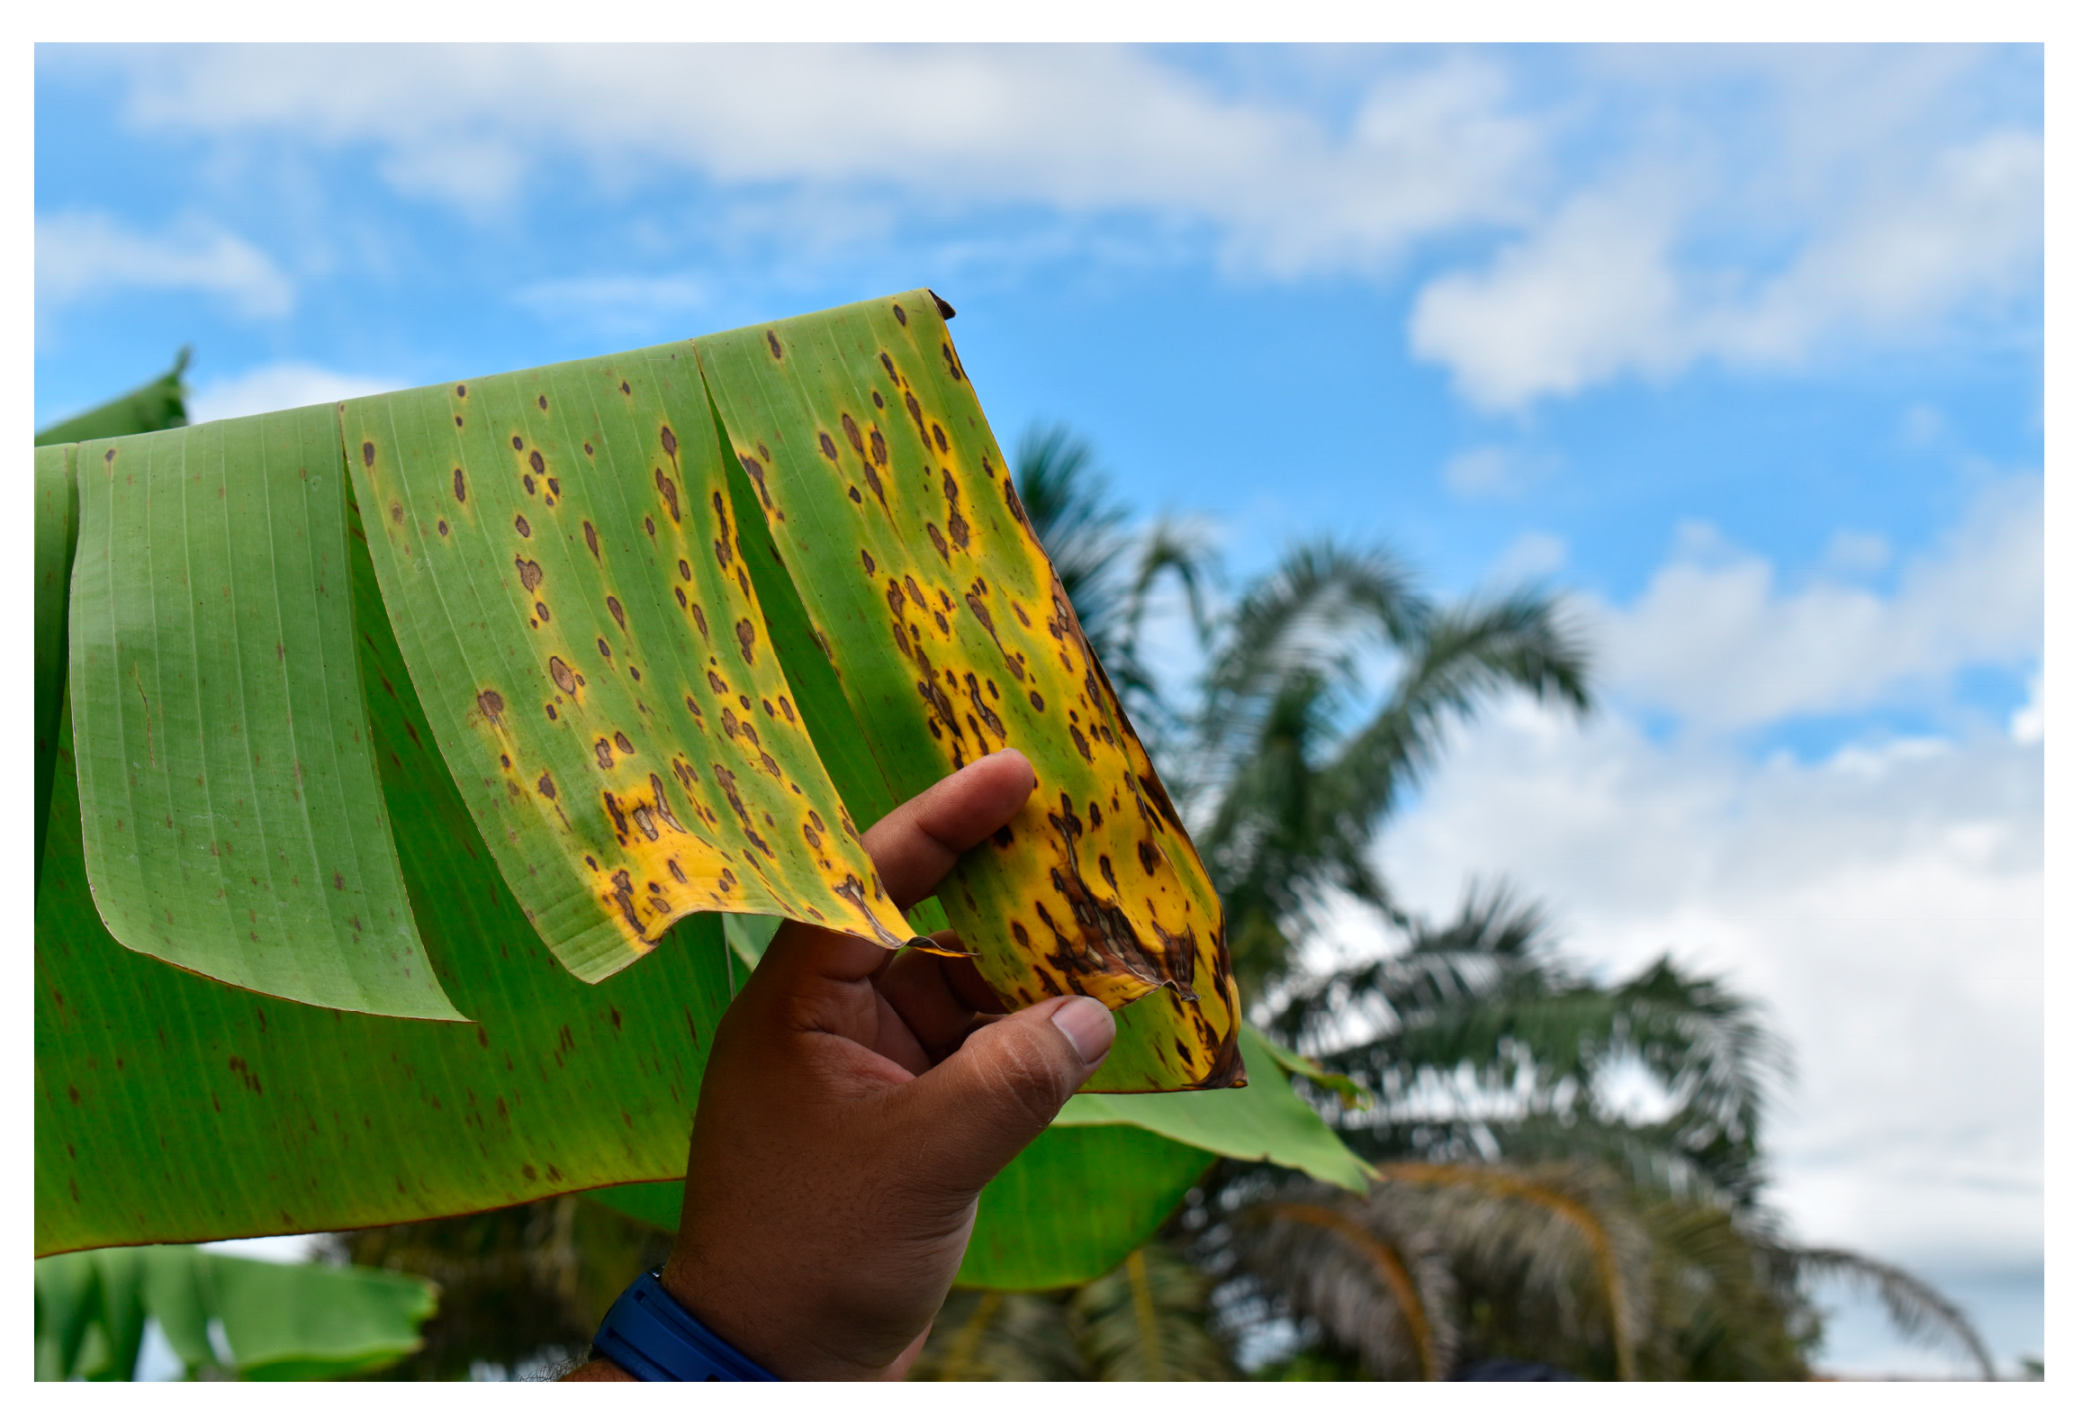
Since the generation of these enhanced images does not affect the spatial positioning of the objects within each scene, a single set of annotations suffices across all methodological variations. This approach enables the use of labels established in the visible spectrum as a foundation. In an individual image, it is possible to see the physical changes caused by Black Sigatoka on banana leaves, as shown in Figure 6.

2.3. Environmental Data Acquisition

In addition to the physical changes caused by Black Sigatoka on banana leaves, there are predisposing conditions that allow the fungus causing the disease (Mycosphaerella fijiensis) to spread rapidly throughout the crop. These conditions are directly related to the temperature and humidity of both ambient air and soil. Therefore, for the acquisition of environmental data that allows improving the precision and accuracy of the models currently detecting Black Sigatoka in banana crops, an IoT node was designed in this study to sense different soil and environmental parameters within a crop.
To collect spatial data, a circuit integrating an ESP32 microcontroller with a NEO-6 GPS module was employed to map the banana crops, accompanied by an experienced grower. The primary aim was to record the geographical coordinates of infection hotspots and to assess the disease severity at each site. This georeferenced information will subsequently be used as a reference during the annotation process to improve labelling precision.
Methodologically, the designed IoT nodes were implemented to sense the temperature and humidity of the environment and the soil using the following sensors: BME280, HD-38, and ST-SS-GEN-052. The multiple sensors are connected to the microcontroller, ESP32, through various communication protocols. These protocols are synchronized with specific logic in this development to ensure their correct operation and to avoid interference between them, both in data collection by the sensors and in the transmission of data to a parent node and from this latter node to a server.
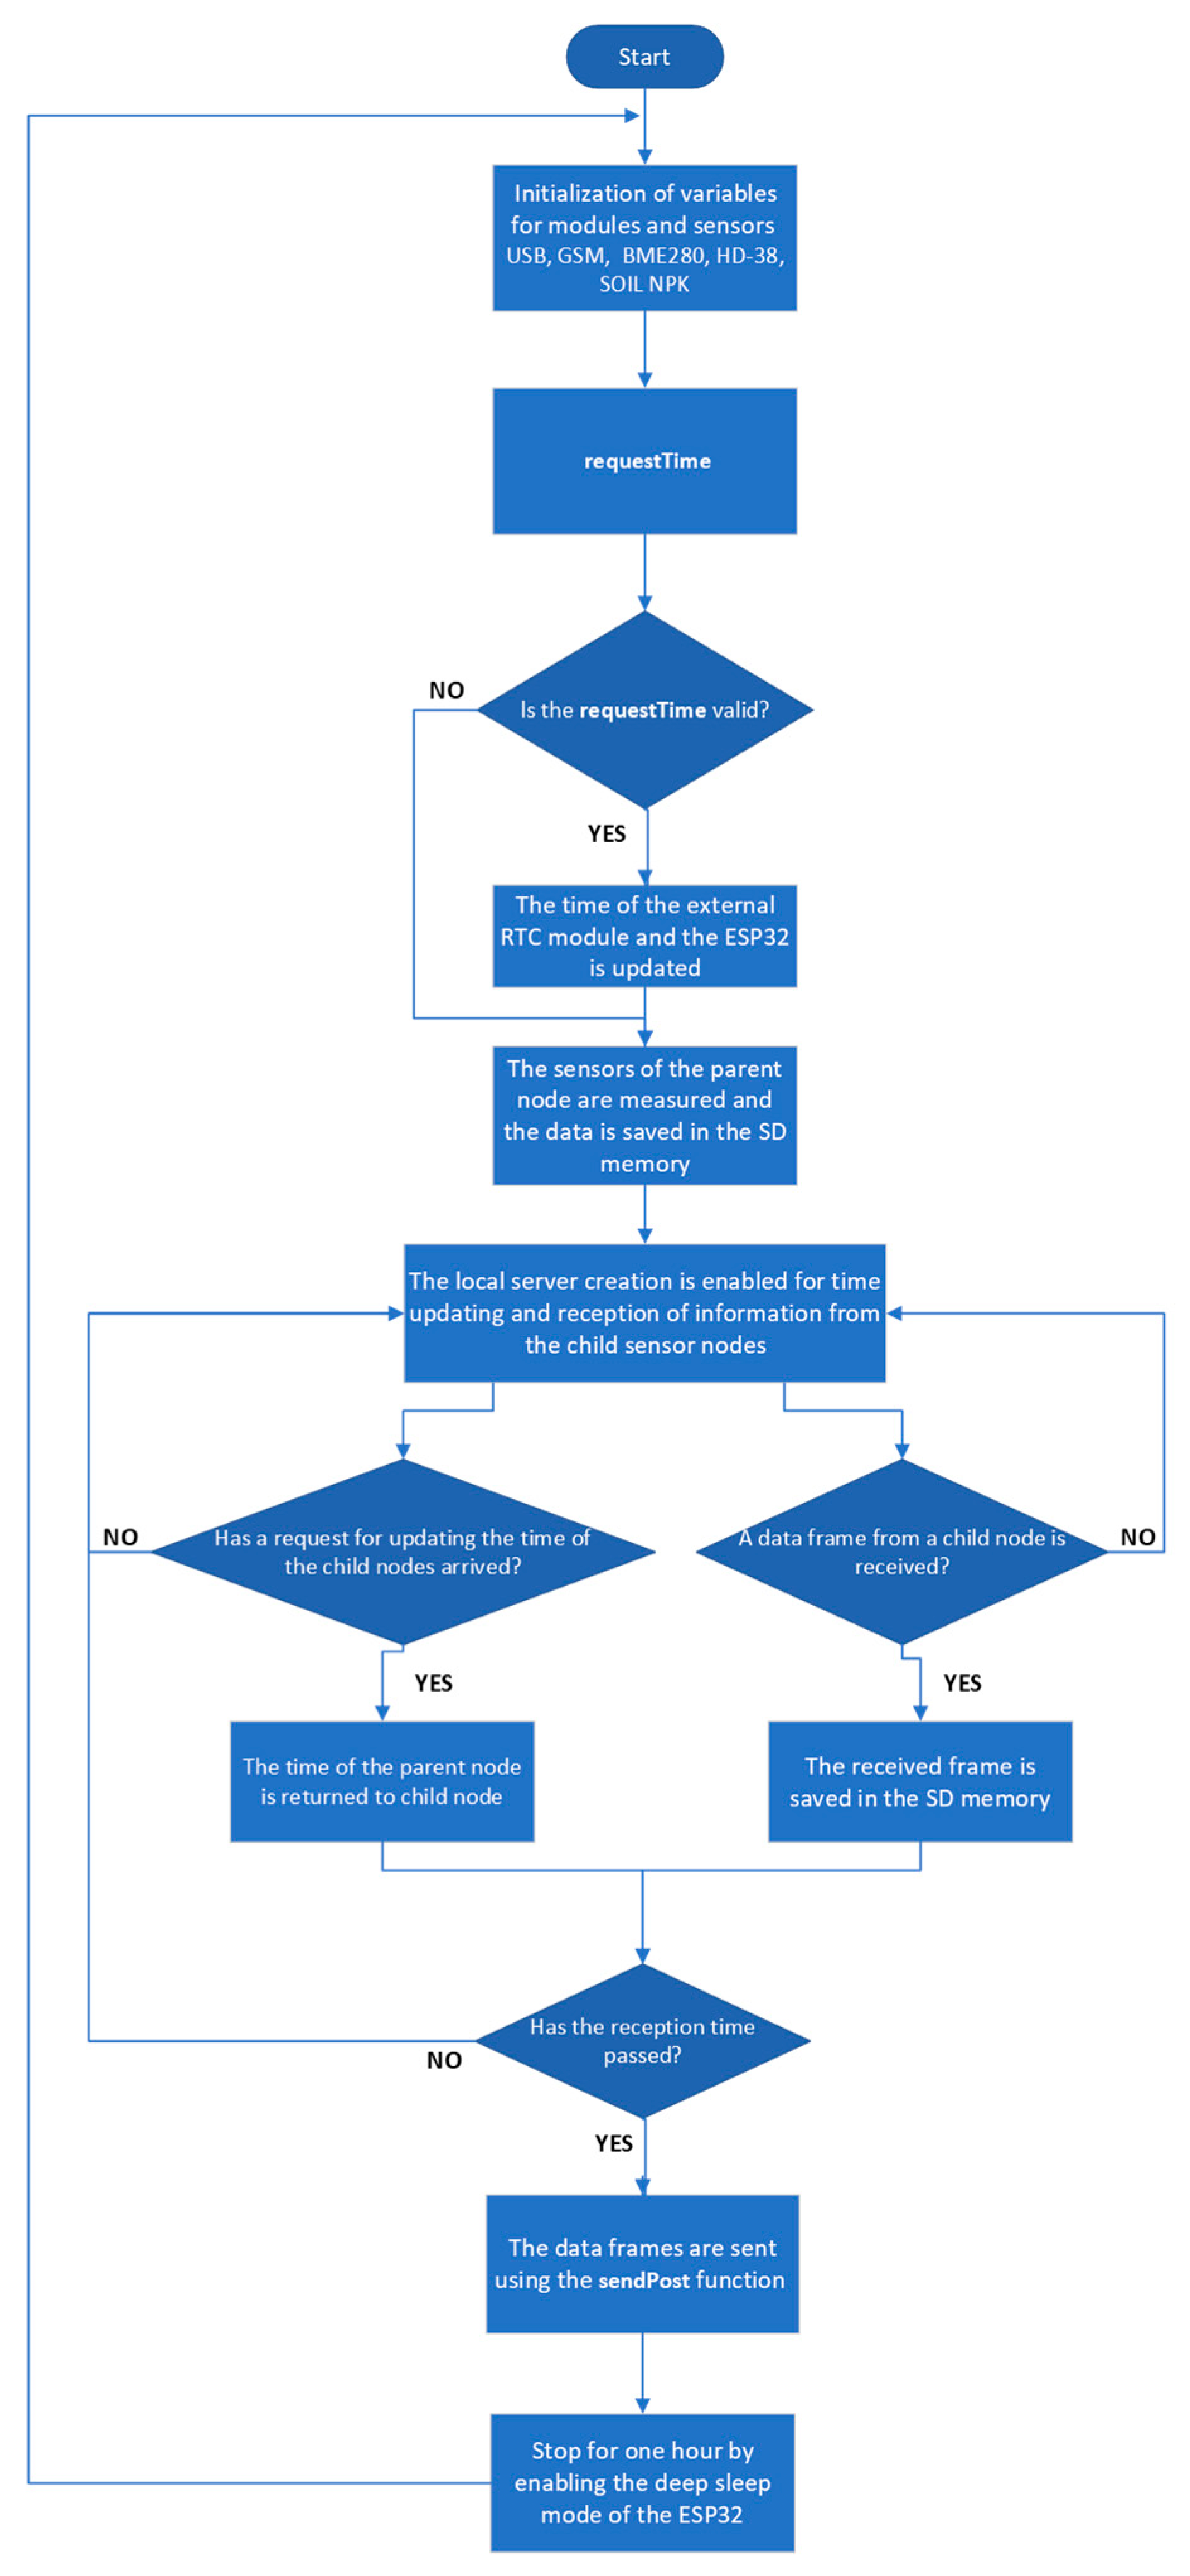
The operation of the IoT parent node can be observed in the process flowchart of Figure 7. The parent node serves as the intermediary between the child nodes and the cloud. It collects, stores, and retransmits the information, and is equipped with a real-time clock (RTC DS1307), a Wi-Fi module to receive data from the child nodes through the local network, an SD card for storing the incoming data, and an LTE/GSM module (SIM800L) to transmit the collected information to a cloud server via the cellular network.
The operation of the IoT child sensor nodes can be observed in the process flowcharting of Figure 8. The child nodes are responsible for acquiring both environmental and soil data. They are designed to operate autonomously with low power consumption. In addition to their main components for environmental variable acquisition, namely the BME280 sensor (measuring temperature, relative humidity, and atmospheric pressure) and the HD-38 sensor (measuring soil moisture), these nodes are equipped with a real-time clock (RTC DS1307) and a Wi-Fi module integrated into the ESP32 microcontroller. This configuration enables an HTTP POST (client-server) communication protocol, establishing a channel to the parent node via data transmission in JSON format.
Since environmental parameters do not frequently vary within short time intervals, the sampling frequency for environmental parameters (temperature and humidity of both ambient air and soil) was set to once every 60 min over a six-month research period, yielding a total of 4320 effective samples per parameter.
In the hybrid and hierarchical models proposed in this study, false-color images constructed from the dataset served as inputs to the evaluated CNNs, while environmental data vectors (air and soil temperature and humidity) were integrated into complementary ML models, including SVM, RNN, and Regression. To ensure spatial and temporal consistency, the environmental measurements were synchronised with UAV imagery using GPS timestamps. These parameters were subsequently concatenated as auxiliary input channels in the hybrid CNN-SVM architecture, enriching the feature space and enhancing the model’s capacity to capture disease-related patterns.
Each image acquisition and sensor measurement was automatically annotated with a precise timestamp, thereby ensuring the accurate alignment of environmental variables (air and soil temperature and humidity) with their corresponding spectral data.
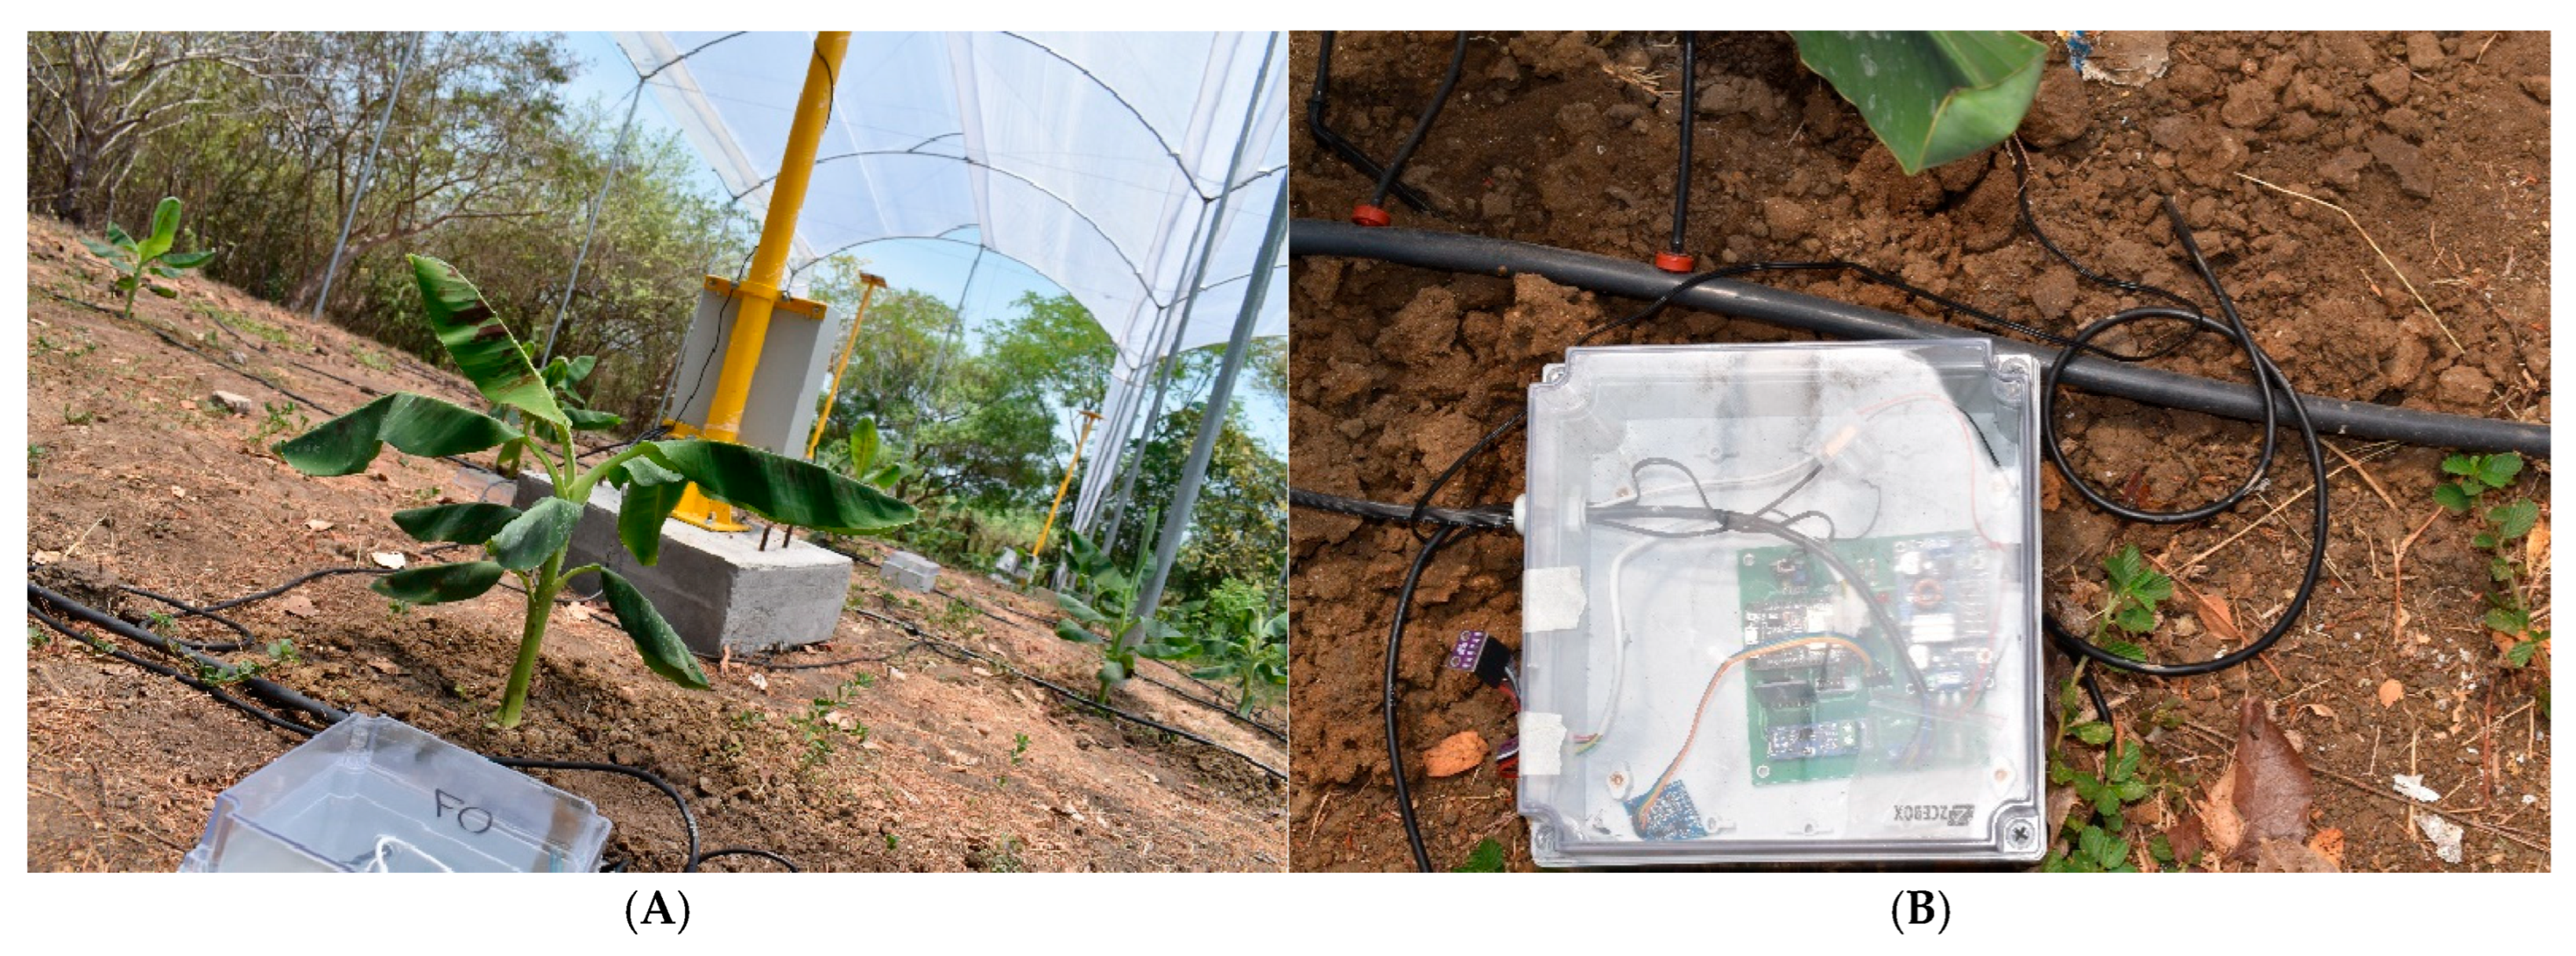
The sensing nodes in operation within an experimental plantation are depicted in Figure 9.

2.4. Building Multiple Models

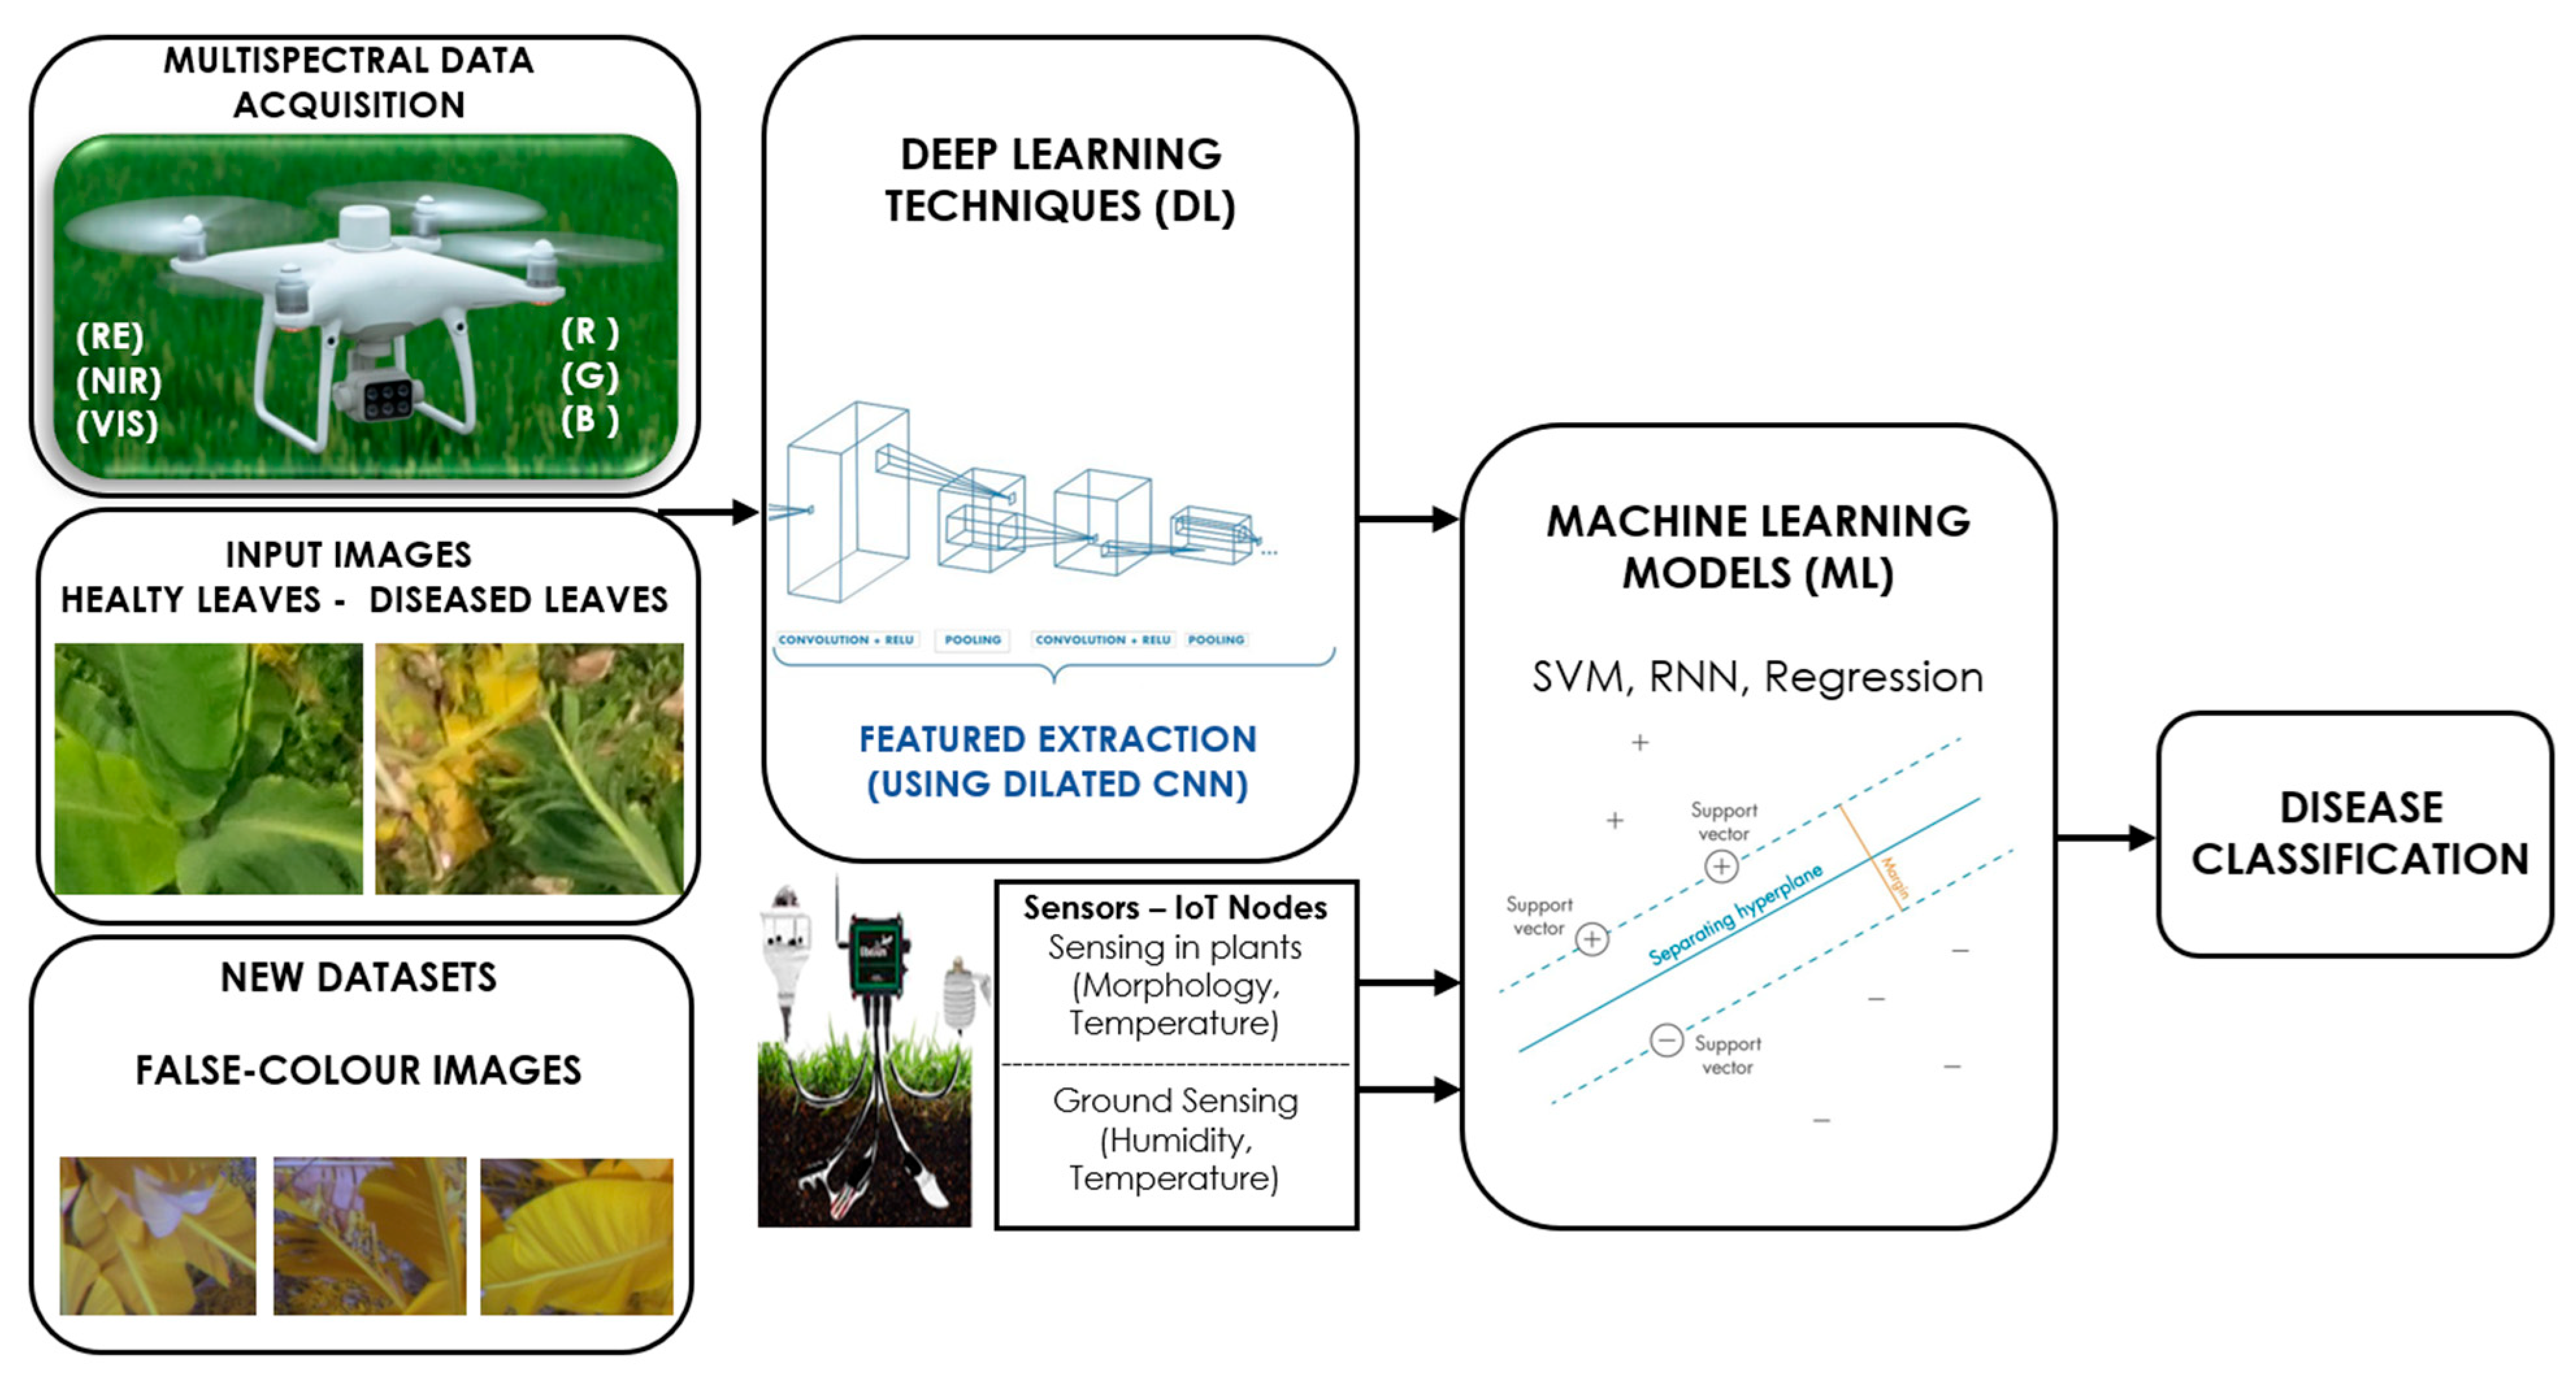
To assess the classification of leaf images with diseases using UAV-based multispectral images, we initially used current Deep Learning models such as CNNs, as many current works have. Then we proposed our novel models, built using different hierarchical combinations like CNN-SVM, CNN-RNN, and CNN-Regression, as shown in Figure 10.
For this, the input to the CNNs consists of the images from the constructed datasets. Before the model performs the classification task, the features of the images are extracted from the last convolutional layer, as the deeper layers contain higher-level features.
In the last global pooling layer, it is possible to obtain a significant amount of feature vectors. These feature vectors are then combined with the vectors obtained from the acquisition of environmental data (temperature and humidity of both ambient air and soil).
This new set of feature vectors is used as input for a new ML model, in this case, SVM, RNN, and Regression.

2.5. Evaluation of the Models

Machine learning algorithms are commonly validated through performance metrics tailored to their respective tasks. In the context of classification, one of the most informative tools is the confusion matrix, which delineates the correspondence between true class labels (typically organised by rows) and the model’s predicted outputs (typically organised by columns). This tabular structure, as illustrated in Table 1, provides critical insights into the classification accuracy and the distribution of correct and incorrect predictions across all classes.
Based on the confusion matrix displayed in Table 1, a range of performance metrics was calculated to evaluate the classification model in greater depth. Metrics such as precision, recall, and F1-score were determined for each class individually, enabling a more detailed understanding of how well the model distinguishes between the target categories. These quantitative results are compiled in Table 2, providing a broader and more nuanced perspective on the model’s classification capability.
Indicates the proportion of positive identifications that were actually correct.
To establish a robust comparative framework for the classification of foliar pathologies within the domain of precision agriculture, three deep convolutional neural network (CNN) architectures (EfficientNet, VGG, and MobileNetV2) were selected based on their proven suitability in similar tasks. Each model was subjected to a transfer learning approach; whereby pre-trained weights were adapted to the specific classification context. A systematic tuning of hyperparameters was conducted iteratively, aiming to optimise training performance metrics and enhance the generalisability of the models across diverse input conditions.
Subsequently, these architectures served as foundational backbones for constructing our hybrid classification models. These included hierarchical combinations such as CNN-SVM, CNN-RNN, and CNN integrated with regression layers. Each variant was designed to explore diverse learning dynamics and enhance classification performance. This methodological extension aimed to refine predictive accuracy and precision when analysing multispectral imagery of crop leaves exhibiting pathological symptoms.

3. Results

3.1. Dataset Creation

Considering that the red spectral band is sensitive to chlorophyll levels in vegetation [29], a novel strategy was adopted involving the use of near-infrared and red-edge bands to construct enhanced image representations, as described in Section 2.2. This technique yielded three distinct configurations, wherein the first spectral channel alternates among the red, green, and blue bands, while the remaining two channels are consistently set to the red-edge bands. The specific channel allocations for each configuration are detailed in Table 3 [30].
This approach enables the construction of synthetic false-color images structured as three-band matrices, simulating the additive RGB colour composition traditionally used in digital imaging. In contrast to standard RGB configurations, the selected bands are based on their proven spectral sensitivity to physiological changes in foliage. Specifically, the Near-Infrared (NIR), Red-Edge (RE), and Red wavelengths were incorporated, given their demonstrated capacity to detect chlorophyll fluctuations associated with foliar pathologies [29]. Additional spectral combinations are created to facilitate data augmentation.
To maintain uniformity across the training datasets of different model architectures, the false-color images generated through this technique were configured to preserve the spatial and structural characteristics inherent to images captured in the visible spectrum. This alignment facilitates comparative analysis during the detection phase. Figure 11 illustrates this in the boxed labels that keep their position in the false color images from the RGB original image.
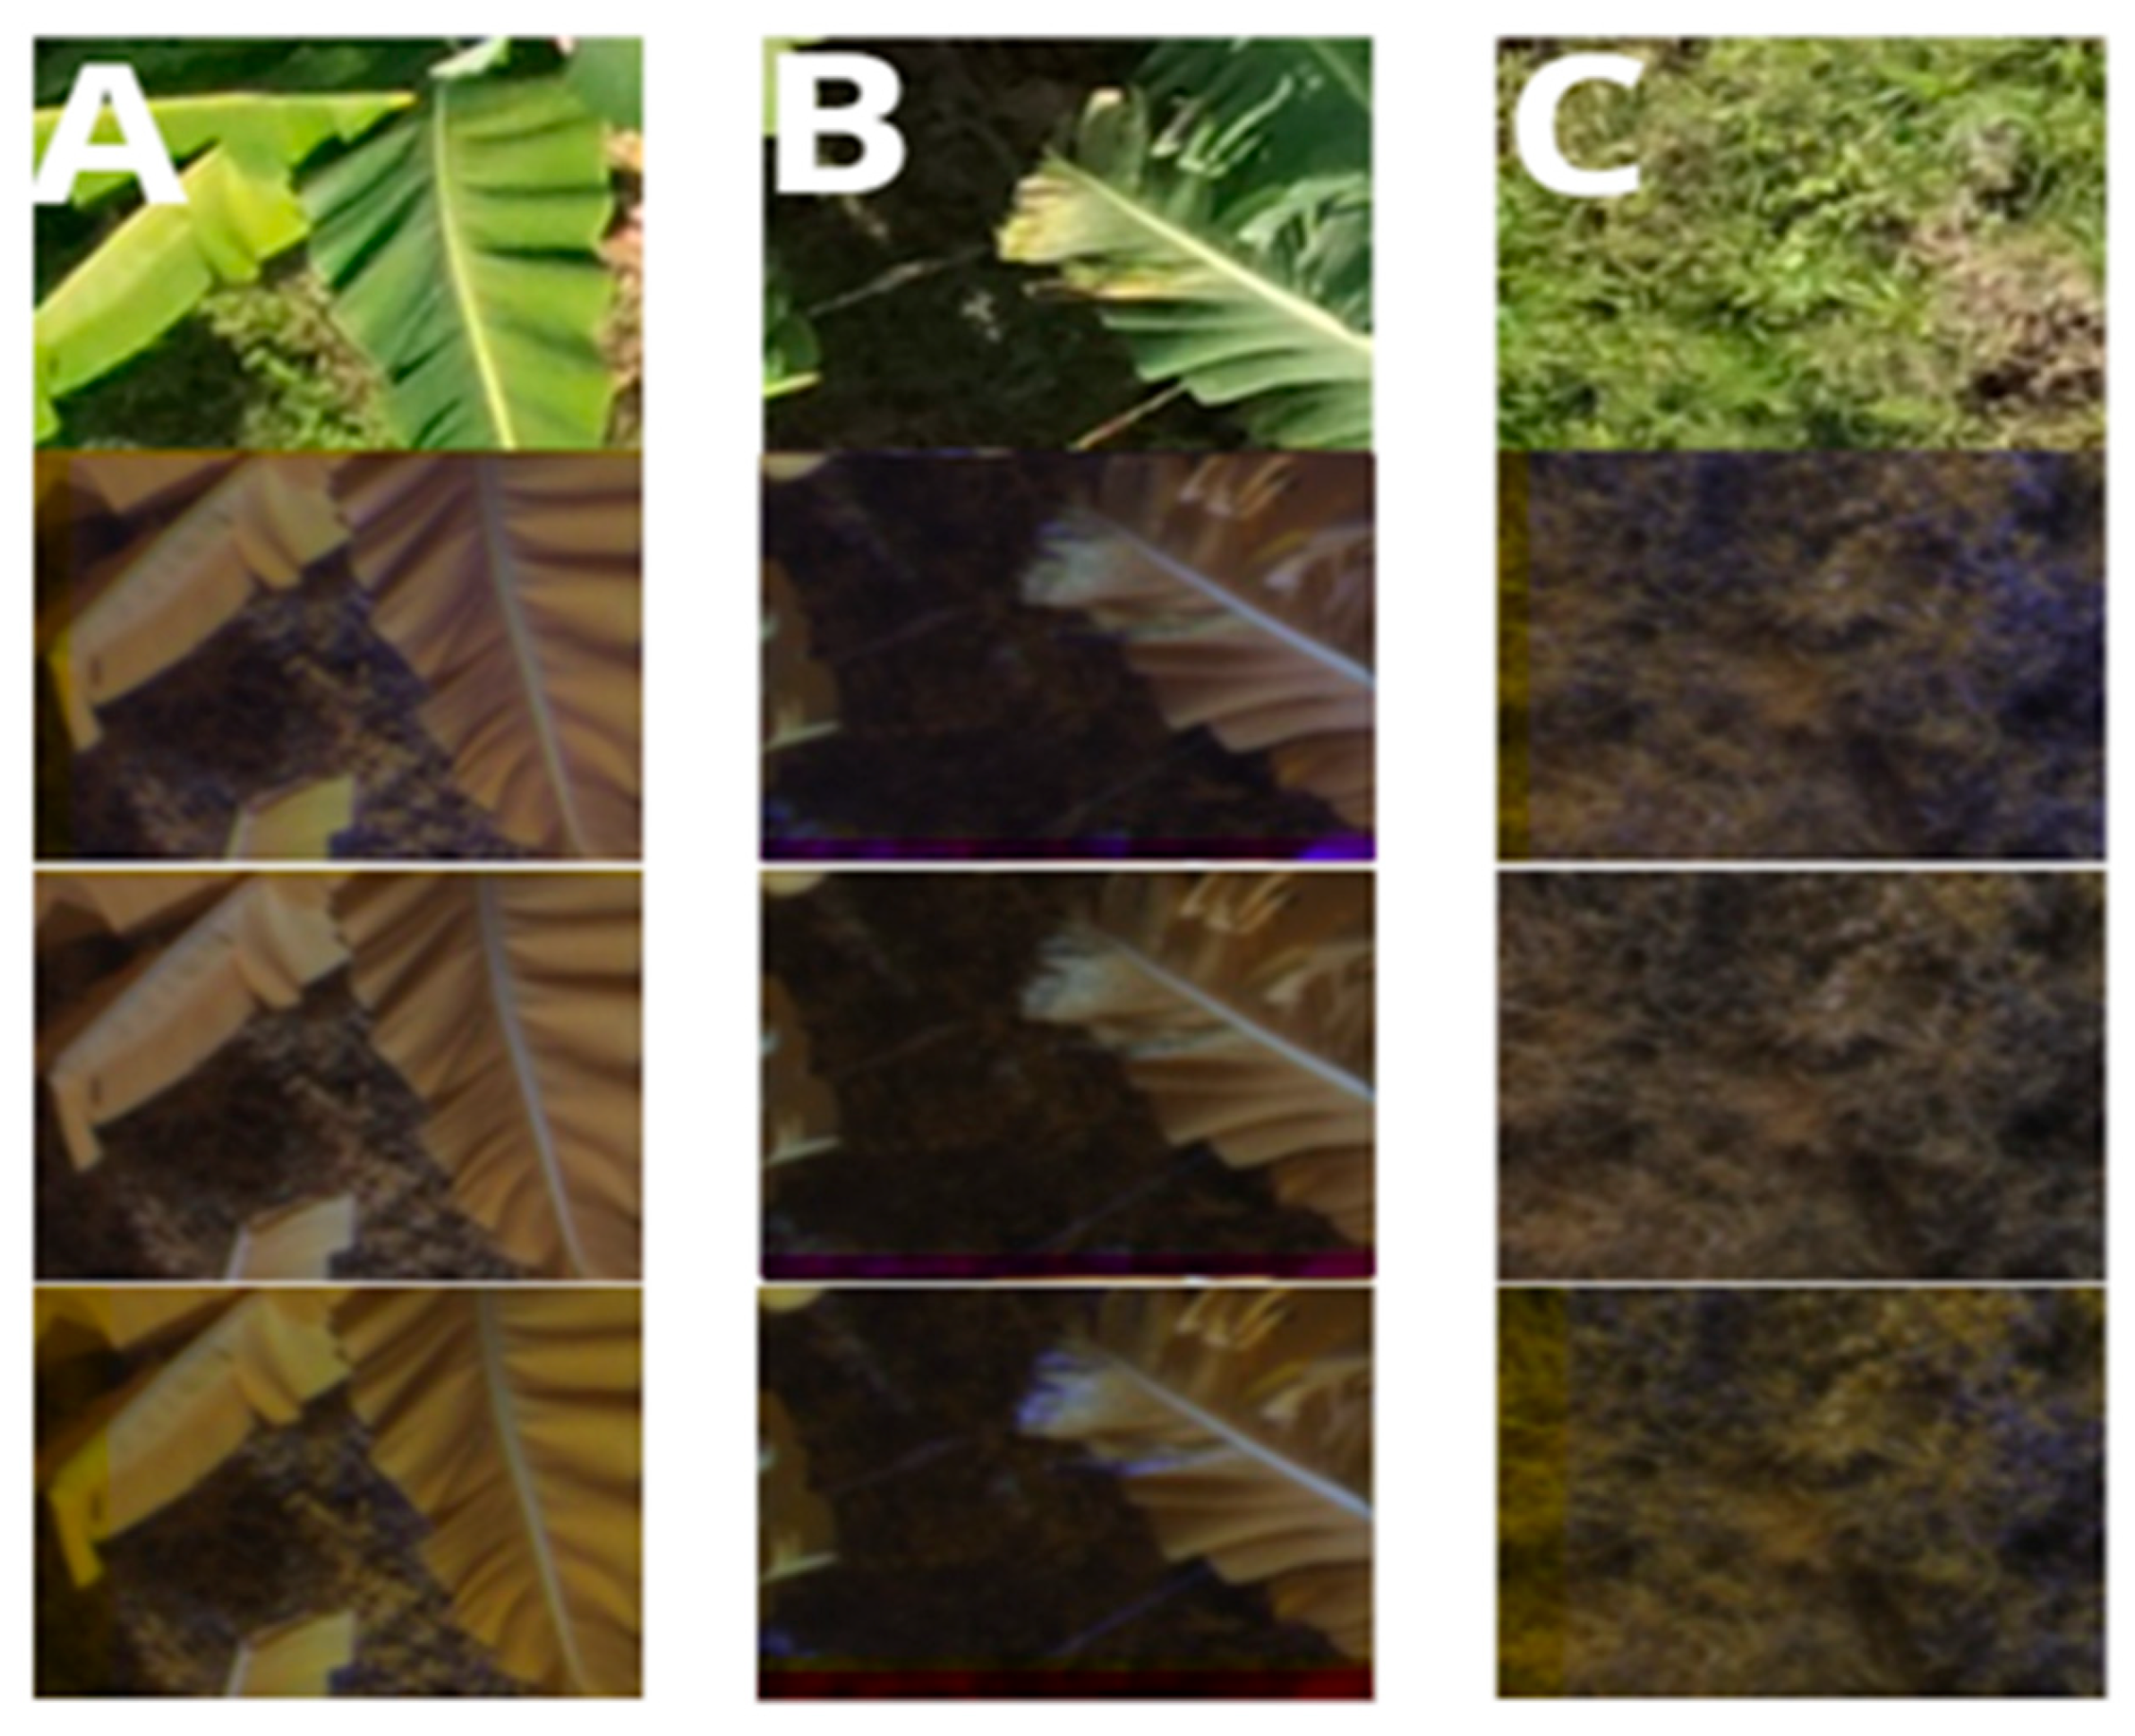
In this case, the false-color image dataset was annotated using a tripartite classification scheme comprising three discrete categories: healthy leaves, diseased leaves, and non-leaf. The non-leaf extras category serves to differentiate banana leaves from other environmental components (extraneous elements unrelated to plant tissue), as illustrated in Figure 12.

3.2. Training CNN Architectures

In the classification phase, advanced deep learning architectures such as EfficientNetV2B3, VGG19, and MobileNetV2 were selected. These models were chosen due to their proven effectiveness in prior agricultural studies, offering a strong balance between classification accuracy, computational efficiency, and adaptability to diverse operational conditions typically encountered in agricultural scenarios [37,38,39].
To improve model accuracy during the training process, data augmentation strategies were implemented without resorting to dataset rebalancing. This enhancement was accomplished by applying controlled transformations, including random zoom operations, either magnifying or shrinking the image, within a 20% threshold, and random rotations in both clockwise and counterclockwise directions, also constrained to a maximum of 20%.
Each dataset comprised a total of 2120 augmented images, which included 1890 instances of healthy foliage and 1290 depicting symptoms of Sigatoka disease. These were evenly distributed across 10 batches for training, with a 70/30 split applied for training and validation. The training process spanned 35 epochs, employing a learning rate of 0.001. The resulting performance metrics for the evaluated models are summarised in Table 4.
The results presented in Table 4 show that among the conventional CNN architectures evaluated, MobileNetV2 achieved the highest accuracy (86.5%) and precision (76%) when using false-color images composed of the Red, Red Edge, and Near-Infrared bands. In contrast, VGG19 and EfficientNetV2B3 exhibited comparable but slightly lower performances. These findings indicate that lightweight architectures such as MobileNetV2 can provide a balance between computational efficiency and classification accuracy in disease detection tasks.
The evaluation indicates that the performance levels on the validation dataset remain relatively consistent across the various models. Nevertheless, MobileNetV2 stands out in the specific task of classifying Sigatoka-affected foliage, particularly when employing imagery composed from the Red, Red Edge, and Near-Infrared spectral bands. Under these conditions and the 10-fold cross-validation strategy, it achieved the highest accuracy, reaching 86.5%.
It is particularly noteworthy that, when focusing on precision, understood as the proportion of true positives within the predictions for the Black Sigatoka class, the findings underscore a higher degree of reliability in disease identification when using false-color images constructed from spectral bands in the red region, specifically Red, Red Edge, and Near-Infrared. Furthermore, recall, representing the rate of correctly identified disease cases, reaches 73% with these spectra, significantly outperforming the 40% recall achieved with the visible spectrum.

3.3. Training Hybrid Architectures

Using the new combinations of architectures proposed for this study, it was possible to achieve better performance than with conventional CNN architectures. This can be observed in a comparison between Table 4 and Table 5, where accuracies increased from 70.5% to 98.5%, with the best result obtained using the hybrid and hierarchical architecture composed of MobileNetV2-SVM (SVMobileNetV2). This used as inputs false-color images with the combination of spectra (Near-Infrared, Red Edge and Red) from the datasets constructed for this research, as well as data from the acquisition of environmental conditions (temperature and humidity of both ambient air and soil).
As observed in Table 5, the hybrid MobileNetV2-SVM model (SVMobileNetV2) significantly outperformed all baseline CNNs, reaching 98.5% accuracy and 87% precision in detecting Black Sigatoka. This improvement demonstrates the added value of combining convolutional feature extraction with machine learning classifiers, enhancing robustness and reducing misclassifications. The results support the feasibility of hybrid hierarchical designs for scalable and reliable crop disease detection.
Metrics such as precision and recall for classifying images with leaves infected by Black Sigatoka (diseased leaves class) achieved high values, reaching up to 87% and 90%, respectively, indicating good precision in identifying the disease.
The use of regressions to replace the final classification layers of the CNNs also yielded noteworthy results. For example, using the hybrid and hierarchical architecture composed of Xception—REGRESSION and VGG19—REGRESSION, achieved precision and accuracy values in the ranges of 85% and 95.9%.
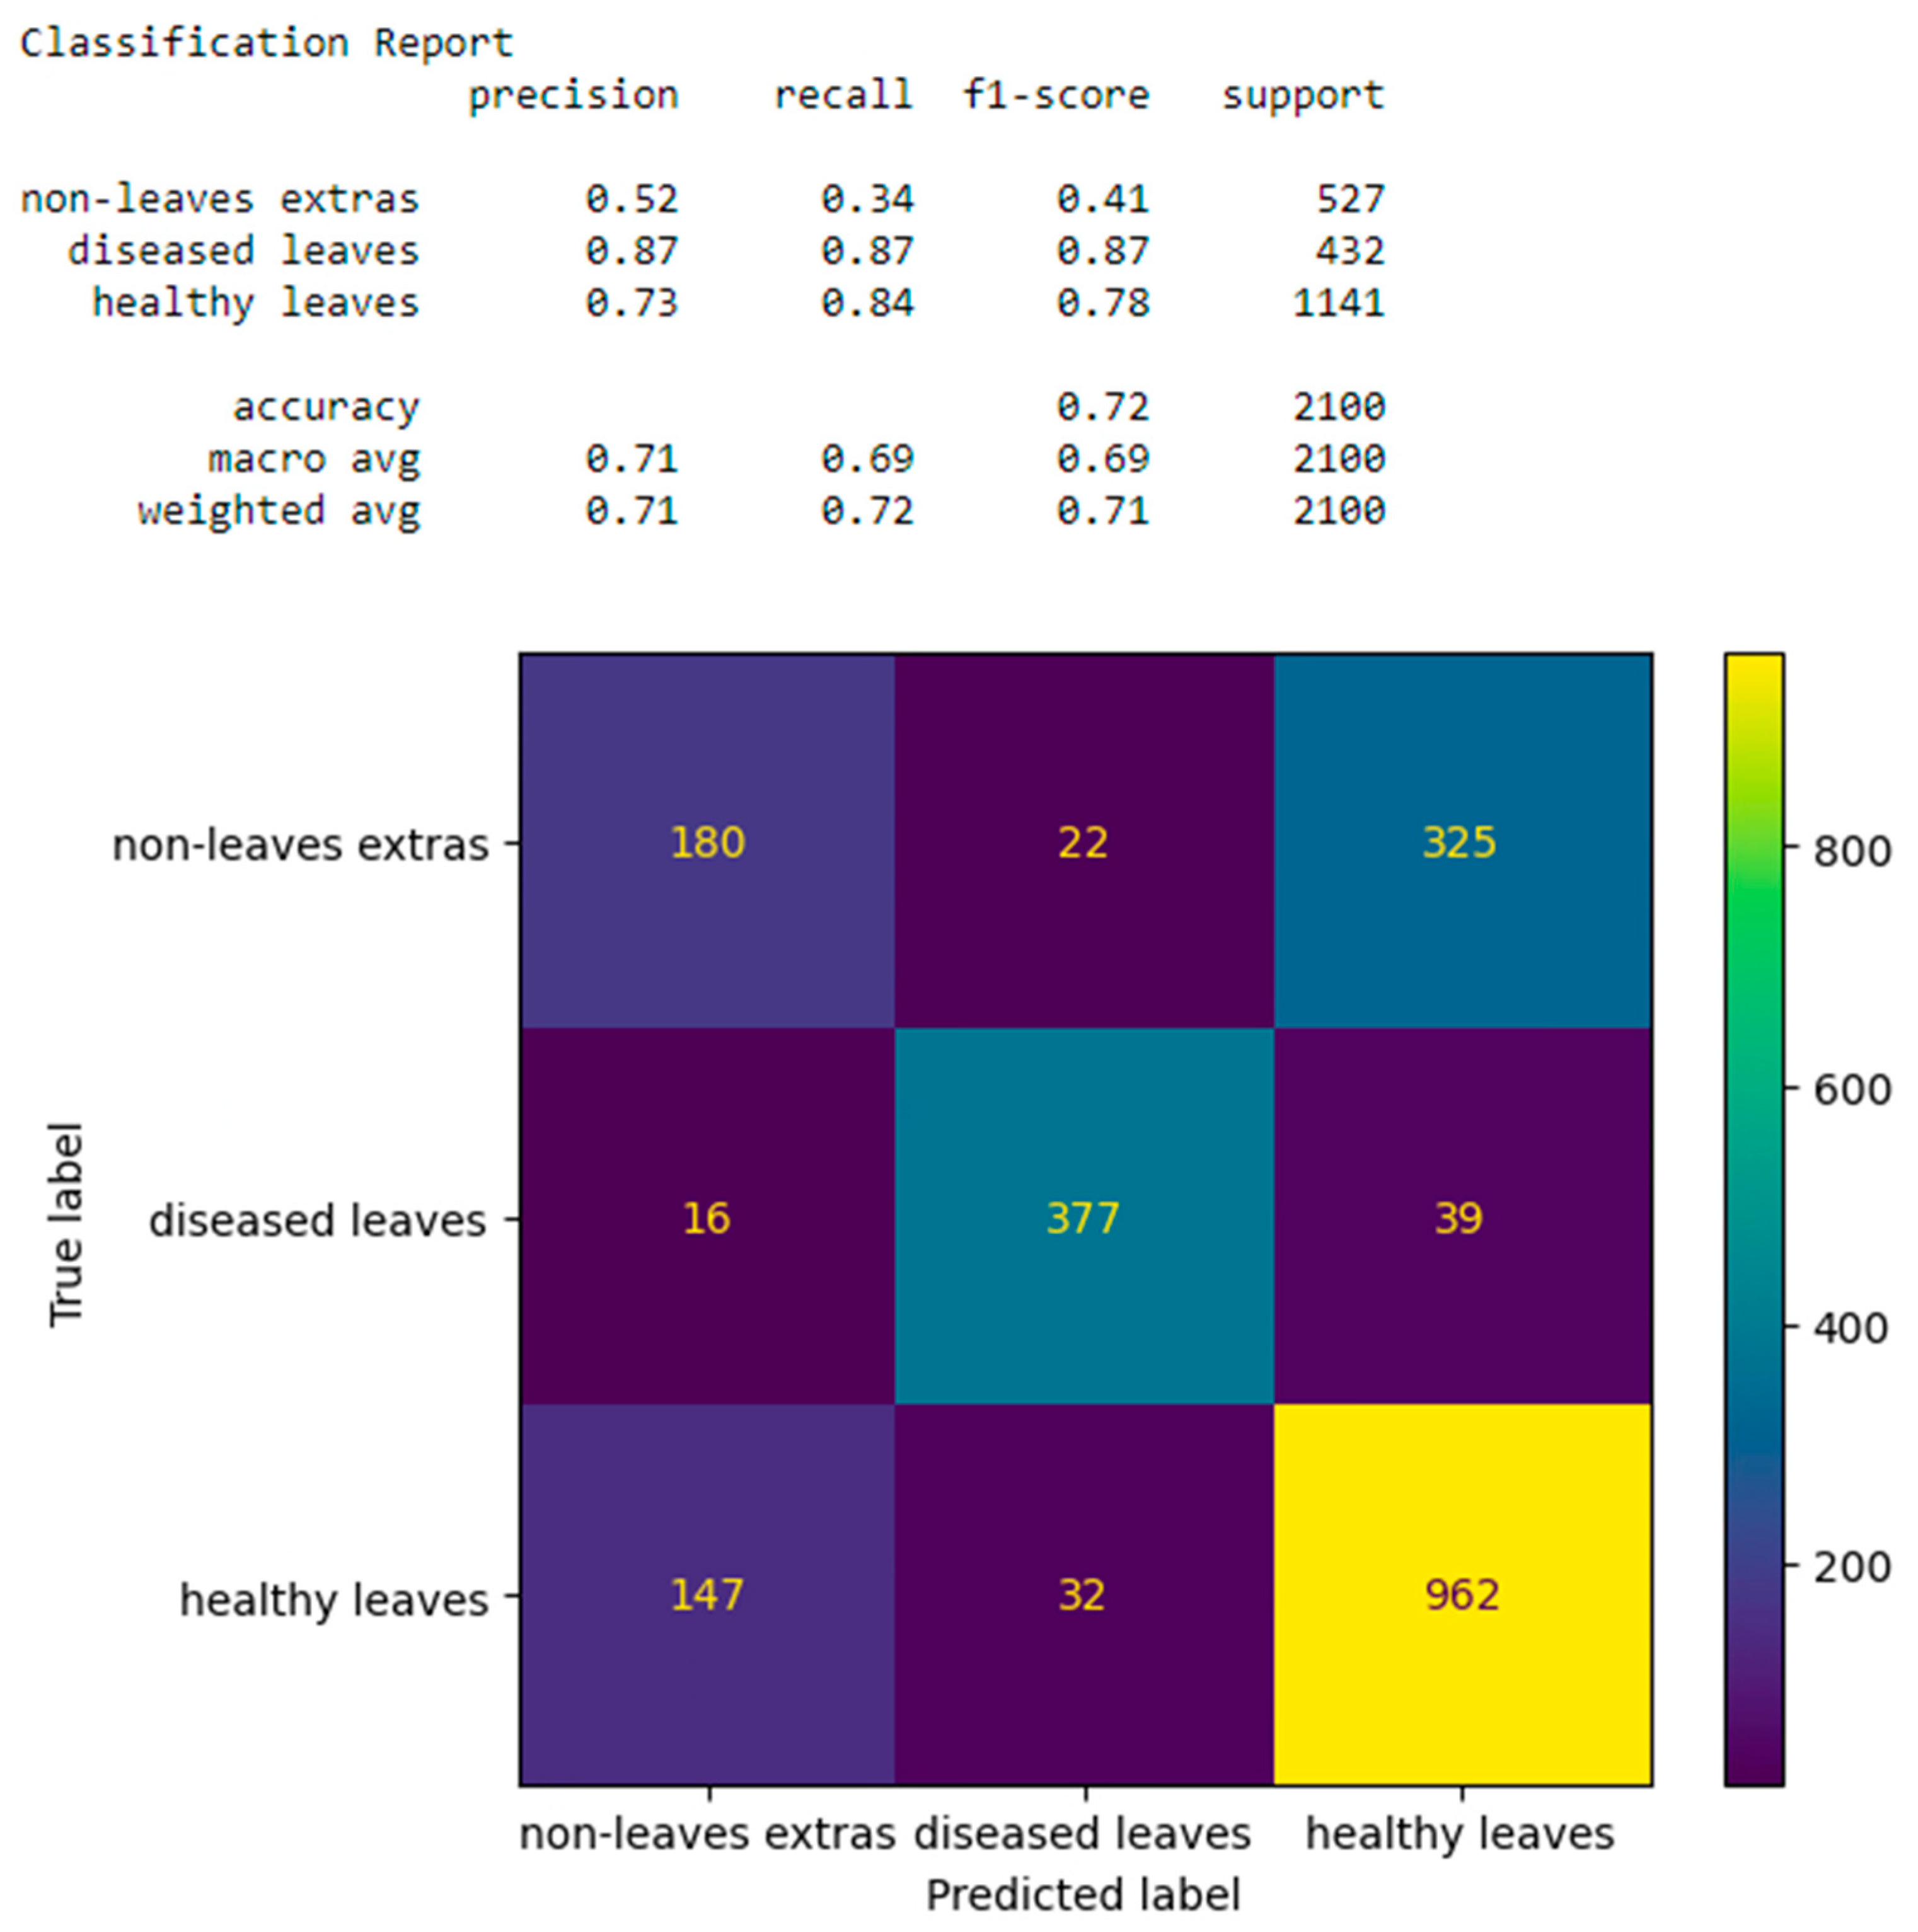
Figure 13 presents a representative example of the confusion matrix derived from the training and validation phases employing the MobileNetV2 architecture. The evaluation metrics associated with the classification models indicate a strong performance in terms of precision, particularly within hybrid CNN frameworks, when predicting labels corresponding to diseased foliage. Notably, precision values reached up to 87%, underscoring the model’s robustness in identifying infected leaf samples.
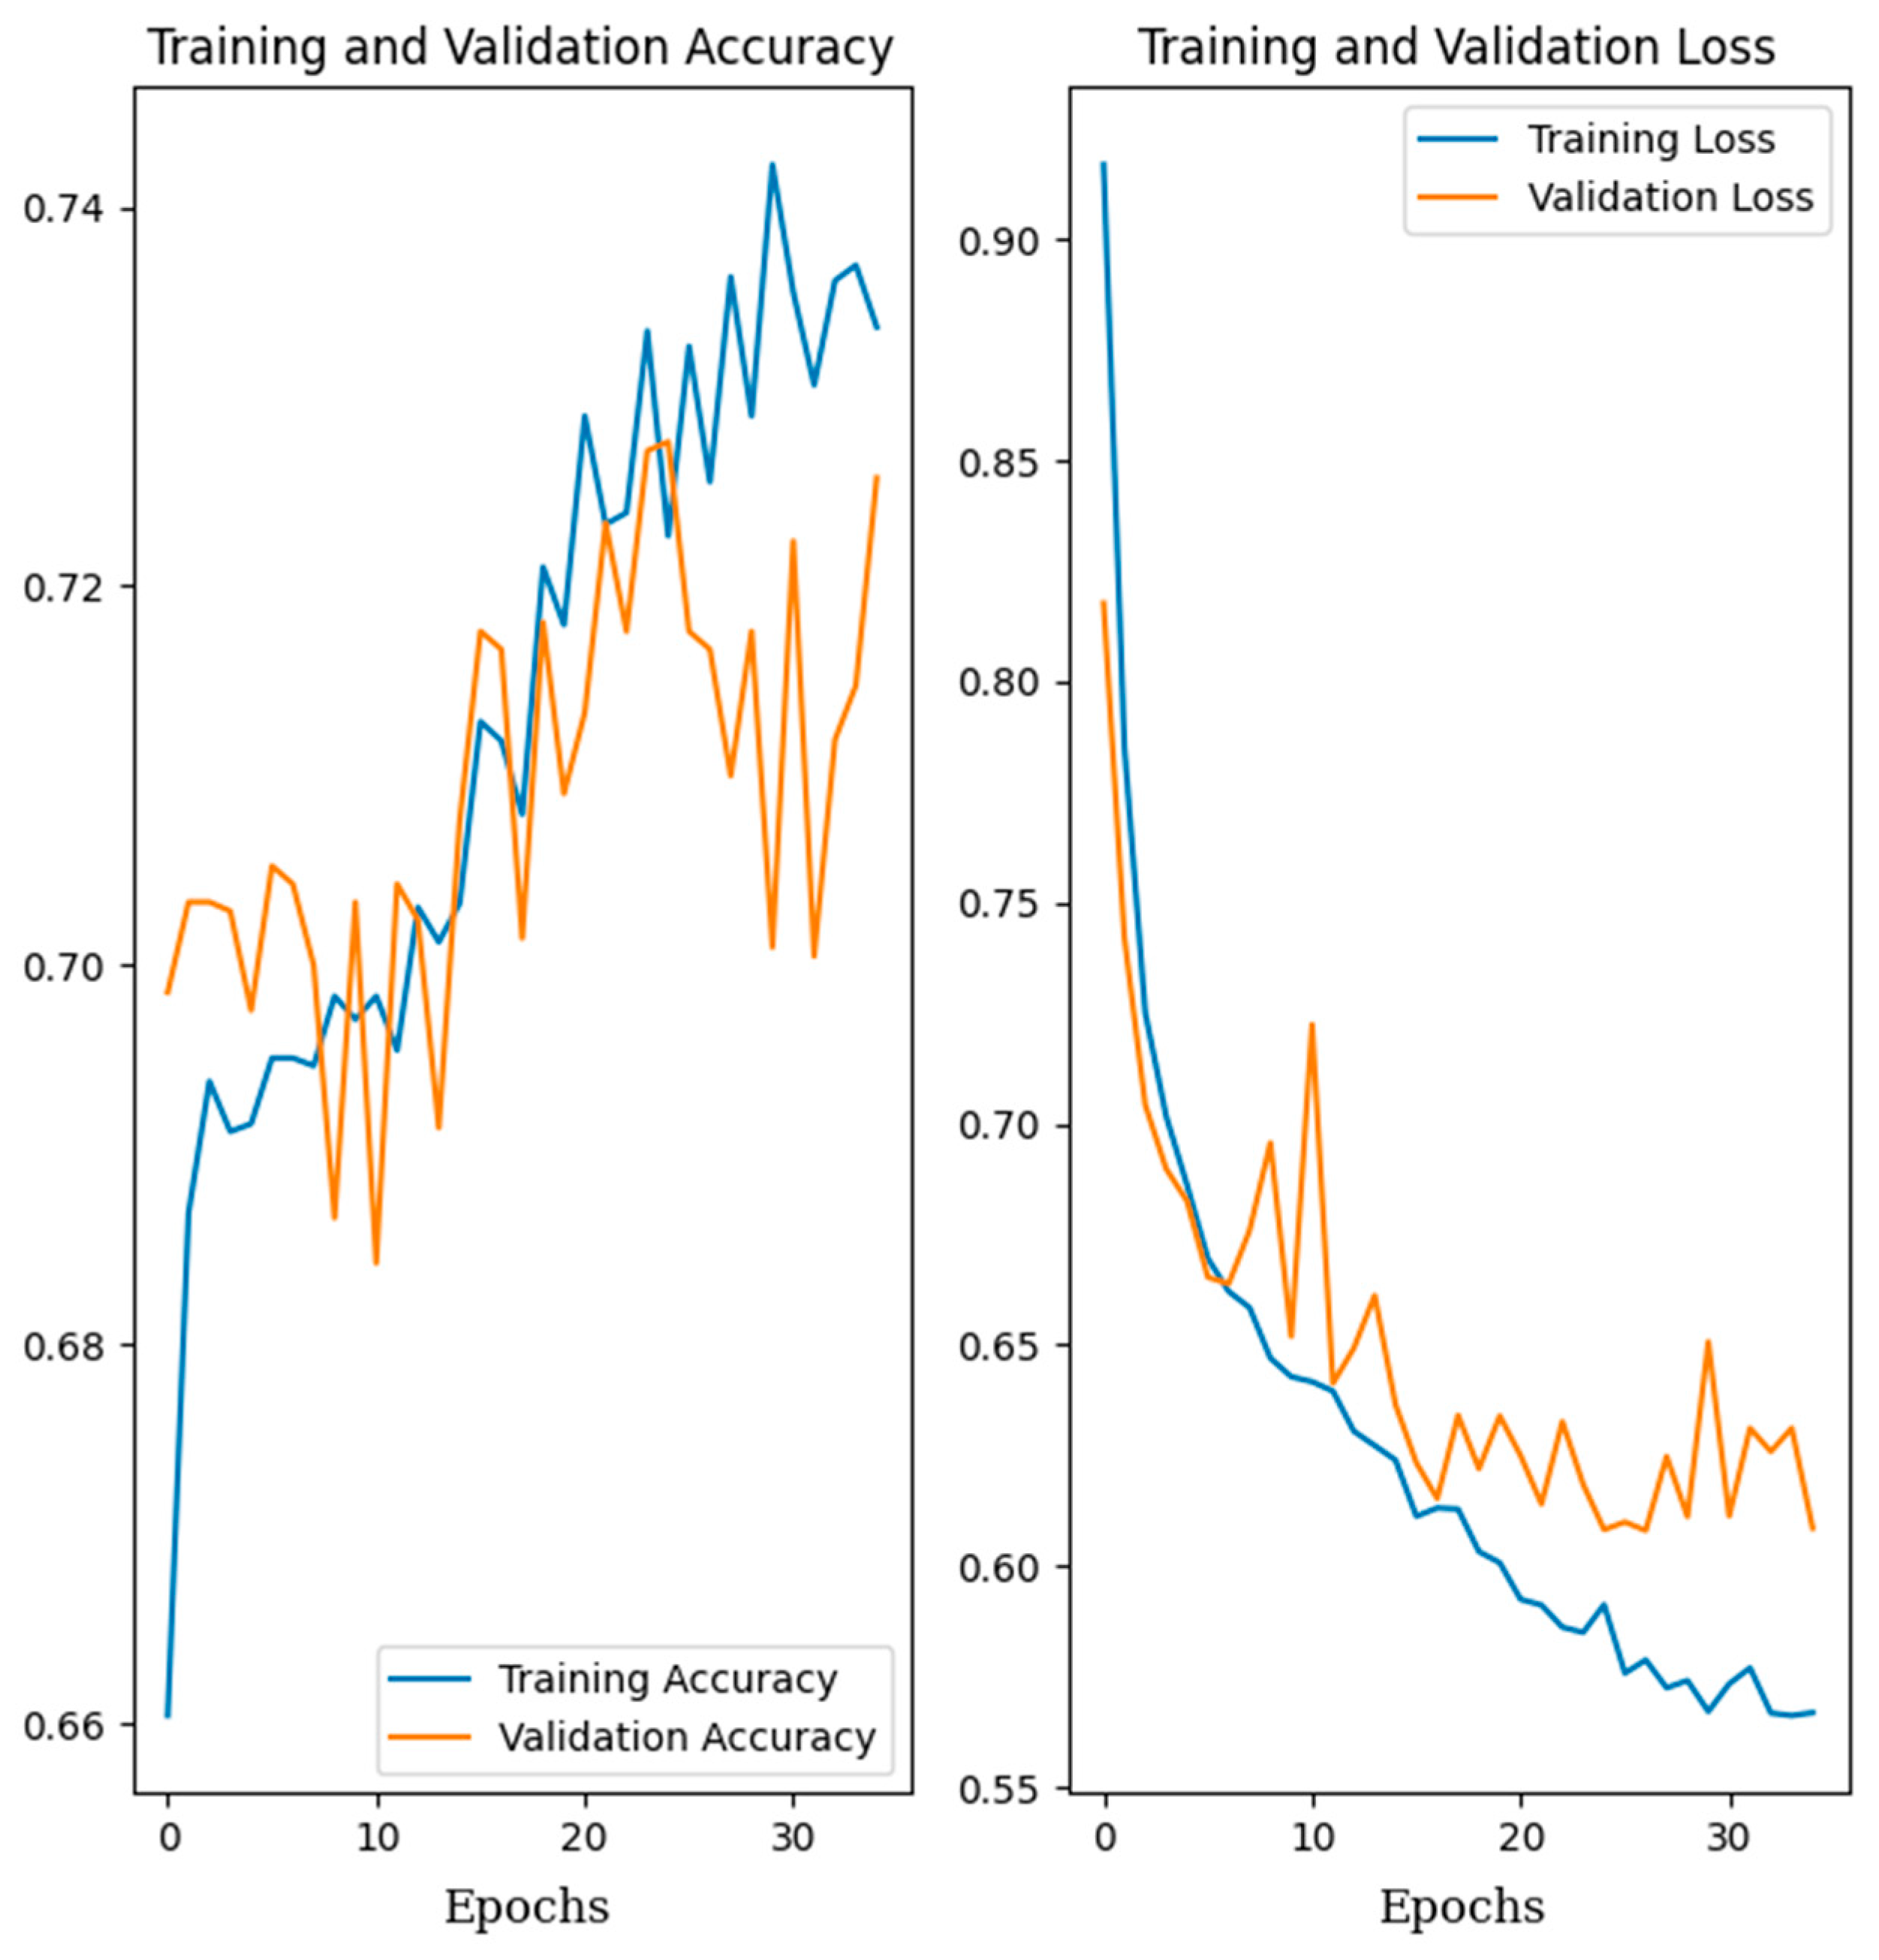
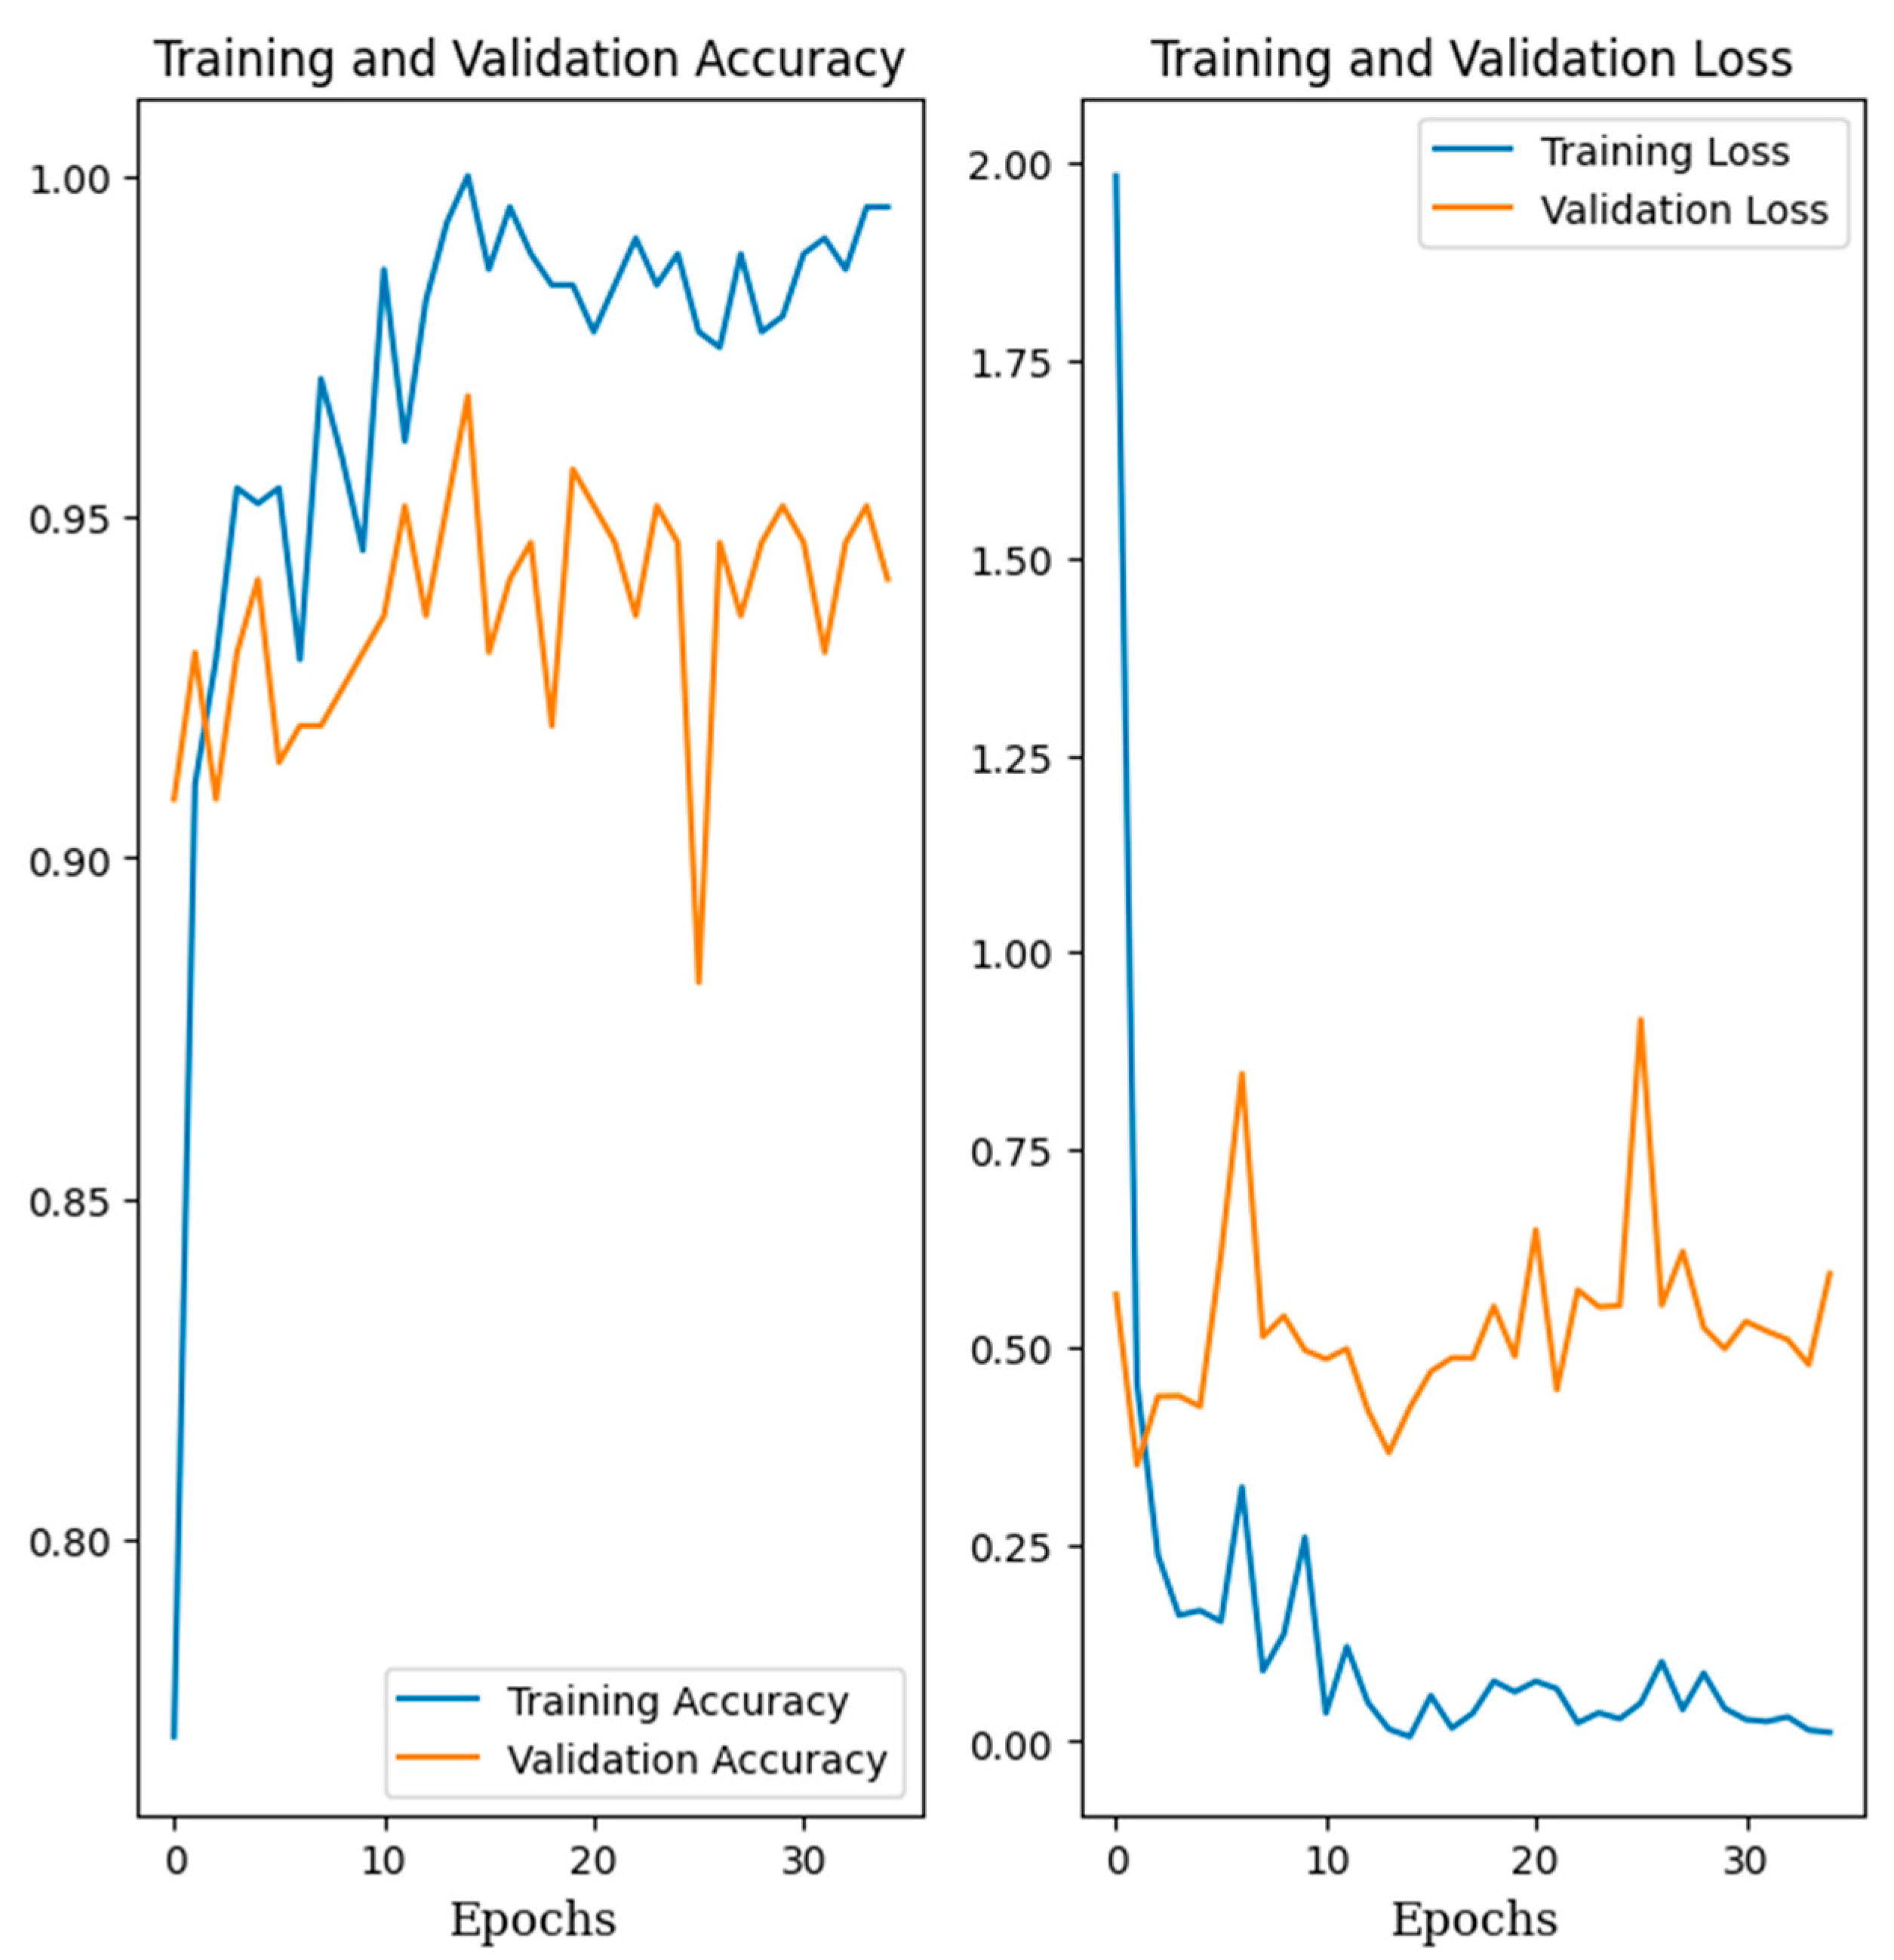
Figure 14 and Figure 15 illustrate a favourable progression of the learning curves, demonstrating a consistent and coherent relationship between the training and validation phases. This behaviour reflects an effective generalisation capability of the models, indicating minimal overfitting and reliable learning performance throughout the training process.

4. Discussion

The integration of artificial intelligence methodologies, including machine learning, deep learning, and transfer learning, has significantly advanced the field of precision agriculture. These approaches have increasingly relied on multispectral imaging as input data for assessing plant health conditions, traditionally through the derivation of vegetation indices [40,41]. However, an alternative strategy involves manipulating spectral information through various channel combinations and transformations within alternative colour models. This facilitates the generation of false-color imagery that accentuates spectral anomalies, such as disease-induced foliar changes, without necessitating explicit vegetation index calculations, but rather by leveraging the distinct spectral reflectance characteristics of the observed surface [42]. For this reason, it is relevant to continue the construction of original datasets in different colour spaces to enable the training of machines, models, and algorithms, as performed in this study.
Alterations in chlorophyll content due to biotic stress factors, such as pathogenic infections, result in measurable changes in the spectral reflectance properties of plant foliage. Under normal physiological conditions, chlorophyll efficiently absorbs light within the visible range, especially in the red bands, while reflecting green wavelengths, which accounts for the typical appearance of healthy leaves [43]. However, when disease impairs chlorophyll synthesis or integrity, this balance is disrupted. A decline in chlorophyll levels often leads to reduced absorption in the red spectrum and, consequently, a noticeable increase in reflectance within that region [44].
Monitoring reflectance responses at targeted wavelengths, particularly those strongly influenced by chlorophyll absorption, enables the detection of physiological changes associated with plant health status. The results presented in this work align with previous investigations [29,42], confirming that spectral regions in the Near-Infrared (840 nm), Red Edge (730 nm) and Red (650 nm) ranges offer robust indicators for identifying disease-induced alterations in chlorophyll levels. These specific bands demonstrated a high level of diagnostic accuracy, reaching up to 98.5% in distinguishing instances of Black Sigatoka infection in banana crops.
The generation of the image data utilised in this research necessitates the deployment of advanced technological tools, particularly the integration of unmanned aerial vehicles (UAVs) equipped with multispectral imaging systems. Such innovations are increasingly becoming indispensable in modern agricultural practices, enabling the acquisition of high-resolution, multi-band imagery that enhances the early detection of plant stress indicators [12]. This technological approach supports near real-time surveillance of crop health, thereby equipping farmers with the ability to implement timely, data-driven interventions. Consequently, it contributes not only to mitigating the severity of disease outbreaks but also to safeguarding crop productivity and ensuring the economic viability of farming operations [45].
The integration of advanced technologies, as previously discussed, plays a pivotal role in promoting sustainable agricultural practices. In the context of sustainable crop management, the early and accurate detection of diseases is essential, as it enables the adoption of precision agriculture techniques, such as targeted spraying in affected zones, which in turn minimises the excessive use of agrochemicals and reduces overall production costs. Achieving this, however, not only depends on the use of UAVs and multispectral sensors but also on the robustness of machine learning algorithms.
Continuous research into the application of deep learning and transfer learning is critical to optimising these methods. However, as highlighted by various authors [18], it is equally important to monitor key environmental variables, such as temperature and humidity, which significantly influence the development and spread of crop diseases. Integrating these parameters into predictive models can enhance the accuracy of disease outbreak forecasting by correlating real-time environmental conditions with the emergence of phytopathological symptoms. This multidisciplinary approach not only strengthens diagnostic reliability but also supports the timely implementation of preventive measures within precision agriculture frameworks.
In response to this challenge, the present study advocates the development of innovative hybrid and hierarchical architectures grounded in state-of-the-art convolutional neural networks (CNNs). Our novel architecture is also tailored specifically for the classification of multispectral imagery acquired via unmanned aerial vehicles (UAVs). This methodological advancement seeks to improve both the accuracy and robustness of disease detection systems within the context of precision agriculture. Nevertheless, a persistent area requiring enhancement remains: the improvement of precision in crop disease early detection.
It is important to emphasise that, although this study is conceptually related to previous research [30], its methodological scope is extended significantly. The introduction of hybrid and hierarchical architectures, particularly the MobileNetV2-SVM configuration, demonstrates notable improvements in accuracy (98.5%) and precision (87%) compared with conventional CNN models. Moreover, the inclusion of environmental data, collected through IoT sensing nodes and spatially aligned with UAV imagery, provides an additional layer of robustness, supporting a multimodal perspective on crop health monitoring. These distinctions highlight the originality of the present contribution and its added value for advancing precision agriculture systems.
An analysis of the results revealed that, although both accuracy and precision were high, most misclassifications occurred in leaves at early stages of Black Sigatoka infection, where symptoms are not yet clearly distinguishable either visually or spectrally. In addition, variations in illumination and the occasional presence of non-leaf elements within the dataset also contributed to erroneous classifications.
These findings suggest that, while the proposed hybrid architecture achieves high overall precision, its performance may be compromised in borderline cases where spectral and morphological indicators are subtle or ambiguous. Future work should address these limitations by expanding the dataset with more representative samples of early-stage infections, applying preprocessing methods such as leaf segmentation to minimise background noise, and integrating additional spectral bands to enhance the discrimination of disease-related features.
After discussing the specific performance and limitations observed in the case of Black Sigatoka, it is also important to consider the broader applicability of the proposed approach. Beyond these specific findings, the proposed hybrid CNN-SVM architecture demonstrates potential for wider deployment. Given that its design relies on spectral and structural patterns rather than crop-specific features, the approach could be adapted to detect diseases in other tropical and subtropical crops such as maize, rice, or tomato, provided that representative multispectral datasets are available.
Previous studies have shown that deep learning architectures trained with transfer learning achieve robust results across different pathologies in diverse crops, suggesting that the proposed model could be generalised to similar agricultural contexts with minimal adjustments [16,17,18]. This generalisation capability is critical for advancing precision agriculture solutions that can be applied at scale.
Building upon these results, future research will focus on further enhancing the diagnostic capacity of these systems by integrating more sophisticated combinations of spectral bands captured by the acquisition sensors. Planned developments include the modification of input layers in established CNN architectures to support five-channel inputs, allowing for the simultaneous analysis of multiple spectral bands and vegetation indices. This methodological advancement is expected to refine the models’ ability to detect nuanced spectral changes associated with early disease progression, thus supporting more robust, accurate, and timely decision-making in sustainable agricultural practices.

5. Conclusions

In this study, we created a novel dataset as a case study, starting with newly collected multispectral images, and creating an alternative false color dataset from these images. This was specifically designed to facilitate the identification of Black Sigatoka in productive banana plantations located in the department of Magdalena, Colombia. The initial phase of the research evaluated the efficacy of traditional convolutional neural network (CNN) architectures, where MobileNetV2 achieved the highest performance, with an accuracy of 86.5% and a precision of 75% in the classification of diseased leaves, in comparison with the results obtained using Xception, EfficientNetV2B3, and VGG19. These results were derived from false-color images generated using red, red-edge, and near-infrared spectral bands captured via UAV-based multispectral imaging.
To further enhance classification performance, this research explored the integration of multispectral imagery and critical environmental variables (temperature and humidity of both ambient air and soil) into hybrid and hierarchical models. These models combined CNN-based architectures with complementary machine learning techniques, including support vector machines (SVM), recurrent neural networks (RNN), and regression models. These configurations were specifically designed to capture both spatial and sequential patterns, thereby substantially improving the robustness and precision of disease classification in banana crops.
Among the configurations assessed, the hybrid MobileNetV2-SVM architecture, hereafter referred to as SVMobileNetV2, exhibited markedly superior performance, attaining both higher accuracy and precision than all other architectures evaluated, in the context of diseased leaf detection. The performance difference between SVMobileNetV2 and the baseline model is statistically significant (p < 0.01, paired t-test). These findings reinforce the relevance of integrating multimodal data and advanced modelling approaches to support early, accurate, and scalable disease diagnosis in precision agriculture.
Finally, when compared with recent studies reported in the literature, the proposed hybrid architecture demonstrated superior performance in detecting Black Sigatoka in banana crops. For instance, while prior studies have reported precision values ranging from 79.6% to 95% when employing UAV-based multispectral imagery with conventional CNNs, our hybrid MobileNetV2–SVM model achieved superior performance, attaining an accuracy of 98.5% and a precision of 87%. This improvement is attributable to the fact that, although CNNs are highly proficient in extracting spatial features from multispectral images, their classification performance can be constrained when relying exclusively on convolutional layers.
These findings indicate that the integration of multispectral imagery with environmental variables provides a more robust and comprehensive framework for disease classification. Nevertheless, certain limitations remain, particularly regarding the scalability of the approach to other crops and disease types, which are often restricted by the availability of representative multispectral datasets. Consequently, future research should explore the adaptability of hybrid CNN architectures across diverse agricultural contexts, the incorporation of additional environmental parameters, and the potential application of transfer learning strategies to enhance generalisation capabilities.

Author Contributions

Conceptualization, investigation, formal analysis, writing—review and editing: R.L.-R., C.P.-R. and M.G.; writing—original draft preparation, methodology, software, validation, resources and data curation: R.L.-R. All authors have read and agreed to the published version of the manuscript.

Funding

This research was funded by the Pontificia Universidad Javeriana, the Universidad del Magdalena, and MINCIENCIAS Through Colombia’s General Royalties System (SGR) with project number BPIN 2020000100417.

Data Availability Statement

The original contributions presented in the study are included in the article/Materials and Methods, and further inquiries can be directed to linero-rafael@javeriana.edu.co author.

Acknowledgments

We extend our sincere gratitude to phytopathologist Andrés Quintero Mercado for his invaluable contribution to this research, particularly in the expert labelling of datasets used to differentiate between healthy leaves and those affected by Black Sigatoka.

Conflicts of Interest

The authors declare no conflict of interest.

References

  1. Velten, S.; Leventon, J.; Jager, N.; Newig, J. What Is Sustainable Agriculture? A Systematic Review. Sustainability 2015, 7, 7833–7865. [Google Scholar] [CrossRef]
  2. FAO. Banana Market Review—Preliminary Results 2023. Rome. Available online: https://www.fao.org/markets-and-trade/commodities/bananas/en (accessed on 30 November 2024).
  3. OECD; FAO. Environmental Sustainability in Agriculture 2023; OECD: Rome, Italy; FAO: Rome, Italy, 2023. [Google Scholar] [CrossRef]
  4. Soares, V.B.; Parreiras, T.C.; Furuya, D.E.G.; Bolfe, É.L.; Nechet, K.d.L. Mapping Banana and Peach Palm in Diversified Landscapes in the Brazilian Atlantic Forest with Sentinel-2. Agriculture 2025, 15, 2052. [Google Scholar] [CrossRef]
  5. Datta, S.; Jankowicz-Cieslak, J.; Nielen, S.; Ingelbrecht, I.; Till, B.J. Induction and recovery of copy number variation in banana through gamma irradiation and low-coverage whole-genome sequencing. Plant Biotechnol. J. 2018, 16, 1644–1653. [Google Scholar] [CrossRef]
  6. Fajardo, J.U.; Andrade, O.B.; Bonilla, R.C.; Cevallos-Cevallos, J.; Mariduena-Zavala, M.; Donoso, D.O.; Villardón, J.L.V. Early detection of black Sigatoka in banana leaves using hyperspectral images. Appl. Plant Sci. 2020, 8, e11383. [Google Scholar] [CrossRef]
  7. Friesen, T.L. Combating the Sigatoka Disease Complex on Banana. PLoS Genet. 2016, 12, e1006234. [Google Scholar] [CrossRef]
  8. Brito, F.S.D.; Fraaije, B.; Miller, R.N. Sigatoka disease complex of banana in Brazil: Management practices and future directions. Outlooks Pest Manag. 2015, 26, 78–81. [Google Scholar] [CrossRef]
  9. Liu, B.-L.; Tzeng, Y.-M. Characterization study of the sporulation kinetics of Bacillus thuringiensis. Biotechnol. Bioeng. 2000, 68, 11–17. [Google Scholar] [CrossRef]
  10. Kuswidiyanto, L.W.; Noh, H.H.; Han, X. Plant Disease Diagnosis Using Deep Learning Based on Aerial Hyperspectral Images: A Review. Remote Sens. 2022, 14, 6031. [Google Scholar] [CrossRef]
  11. Shahi, T.B.; Xu, C.-Y.; Neupane, A.; Guo, W. Recent Advances in Crop Disease Detection Using UAV and Deep Learning Techniques. Remote Sens. 2023, 15, 2450. [Google Scholar] [CrossRef]
  12. Maes, W.H.; Steppe, K. Perspectives for Remote Sensing with Unmanned Aerial Vehicles in Precision Agriculture. Trends Plant Sci. 2019, 24, 152–164. [Google Scholar] [CrossRef]
  13. Silva, T.C.; Moreira, S.I.; de Souza, D.M.; Christiano, F.S., Jr.; Gasparoto, M.C.G.; Fraaije, B.A.; Goldman, G.H.; Ceresini, P.C. Resistance to Site-Specific Succinate Dehydrogenase Inhibitor Fungicides Is Pervasive in Populations of Black and Yellow Sigatoka Pathogens in Banana Plantations from Southeastern Brazil. Agronomy 2024, 14, 666. [Google Scholar] [CrossRef]
  14. Raja, N.B.; Selvi Rajendran, P. Comparative Analysis of Banana Leaf Disease Detection and Classification Methods. In Proceedings of the 6th International Conference on Computing Methodologies and Communication (ICCMC), Erode, India, 29–31 March 2022; IEEE: New York, NY, USA, 2022; pp. 1215–1222. [Google Scholar] [CrossRef]
  15. Selvaraj, M.G.; Vergara, A.; Montenegro, F.; Ruiz, H.A.; Safari, N.; Raymaekers, D.; Ocimati, W.; Ntamwira, J.; Tits, L.; Omondi, A.B.; et al. Detection of banana plants and their major diseases through aerial images and machine learning methods: A case study in DR Congo and Republic of Benin. ISPRS J. Photogramm. Remote Sens. 2020, 169, 110–124. [Google Scholar] [CrossRef]
  16. Shareena, E.M.; Chandy, D.A.; Shemi, P.M.; Poulose, A. A Hybrid Deep Learning Model for Aromatic and Medicinal Plant Species Classification Using a Curated Leaf Image Dataset. AgriEngineering 2025, 7, 243. [Google Scholar] [CrossRef]
  17. Li, B.; Yu, L.; Zhu, H.; Tan, Z. YOLO-FDLU: A Lightweight Improved YOLO11s-Based Algorithm for Accurate Maize Pest and Disease Detection. AgriEngineering 2025, 7, 323. [Google Scholar] [CrossRef]
  18. Jiménez, N.; Orellana, S.; Mazon-Olivo, B.; Rivas-Asanza, W.; Ramírez-Morales, I. Detection of Leaf Diseases in Banana Crops Using Deep Learning Techniques. AI 2025, 6, 61. [Google Scholar] [CrossRef]
  19. Pino, A.F.S.; Moreno, J.D.S.; Valencia, C.I.V.; Narváez, J.A.G. A Leaf Chlorophyll Content Dataset for Crops: A Comparative Study Using Spectrophotometric and Multispectral Imagery Data. Data 2025, 10, 142. [Google Scholar] [CrossRef]
  20. Oviedo, B.; Zambrano-Vega, C.; Villamar-Torres, R.O.; Yánez-Cajo, D.; Campoverde, K.C. Improved YOLOv8 Segmentation Model for the Detection of Moko and Black Sigatoka Diseases in Banana Crops with UAV Imagery. Technologies 2025, 13, 382. [Google Scholar] [CrossRef]
  21. Li, H.; Chen, L.; Yao, Z.; Li, N.; Long, L.; Zhang, X. Intelligent Identification of Pine Wilt Disease Infected Individual Trees Using UAV-Based Hyperspectral Imagery. Remote Sens. 2023, 15, 3295. [Google Scholar] [CrossRef]
  22. Bonet, I.; Caraffini, F.; Peña, A.; Puerta, A.; Gongora, M. Oil Palm Detection via Deep Transfer Learning. In Proceedings of the 2020 IEEE Congress on Evolutionary Computation (CEC), Glasgow, UK, 19–24 July 2020; pp. 1–8. [Google Scholar] [CrossRef]
  23. Zhang, Z.; Jiang, D.; Chang, Q.; Zheng, Z.; Fu, X.; Li, K.; Mo, H. Estimation of Anthocyanins in Leaves of Trees with Apple Mosaic Disease Based on Hyperspectral Data. Remote Sens. 2023, 15, 1732. [Google Scholar] [CrossRef]
  24. Alzubaidi, L.; Zhang, J.; Humaidi, A.J.; Al-Dujaili, A.; Duan, Y.; Al-Shamma, O.; Santamaría, J.; Fadhel, M.A.; Al-Amidie, M.; Farhan, L. Review of deep learning: Concepts, CNN architectures, challenges, applications, future directions. J. Big Data 2021, 8, 53. [Google Scholar] [CrossRef]
  25. Wang, H.; Xu, Y.; Yu, Y.; Lin, Y.; Ran, J. An Efficient Model for a Vast Number of Bird Species Identification Based on Acoustic Features. Animals 2022, 12, 2434. [Google Scholar] [CrossRef] [PubMed]
  26. Luis, C.; Maira, G.; Rafa, L. Traditional and modern processing of digital signals and images for the classification of birds from singing. Int. J. Appl. Sci. Eng. 2024, 21, 2023222. [Google Scholar] [CrossRef]
  27. Jha, K.; Doshi, A.; Patel, P.; Shah, M. A comprehensive review on automation in agriculture using artificial intelligence. Artif. Intell. Agric. 2019, 2, 1–12. [Google Scholar] [CrossRef]
  28. Deng, L.; Mao, Z.; Li, X.; Hu, Z.; Duan, F.; Yan, Y. UAV-based multispectral remote sensing for precision agriculture: A comparison between different cameras. ISPRS J. Photogramm. Remote Sens. 2018, 146, 124–136. [Google Scholar] [CrossRef]
  29. Bendini, H.D.N.; Jacon, A.; Pessoa, A.C.M.; Pavanelli, J.A.P. Caracterização Espectral de Folhas de Bananeira (Musa spp.) para detecção e diferenciação da Sigatoka Negra e Sigatoka Amarela. In Anais XVII Simpósio Brasileiro de Sensoriamento Remoto; Instituto Nacional de Pesquisas Espaciais (INPE): São José dos Campos, Brazil, 2015. [Google Scholar]
  30. Linero-Ramos, R.; Parra-Rodríguez, C.; Espinosa-Valdez, A.; Gómez-Rojas, J.; Gongora, M. Assessment of Dataset Scalability for Classification of Black Sigatoka in Banana Crops Using UAV-Based Multispectral Images and Deep Learning Techniques. Drones 2024, 8, 503. [Google Scholar] [CrossRef]
  31. DJI. DJI MAVIC 3M User Manual. 6 July 2020. Available online: https://ag.dji.com/mavic-3-m/downloads (accessed on 6 December 2024).
  32. Gauhl, F. Epidemiology and Ecology of Black Sigatoka (Mycosphaerella fijiensis Morelet) on Plantain and Banana (Musa spp.) in Costa Rica, Central America; INIBAP: Montpellier, France, 1994. [Google Scholar]
  33. Li, Q.; Qi, S.; Shen, Y.; Ni, D.; Zhang, H.; Wang, T. Multispectral Image Alignment With Nonlinear Scale-Invariant Keypoint and Enhanced Local Feature Matrix. IEEE Geosci. Remote Sens. Lett. 2015, 12, 1551–1555. [Google Scholar] [CrossRef]
  34. Valdez, A.E.; Castañeda, M.A.P.; Gomez-Rojas, J.; Ramos, R.L. Canopy Extraction in a Banana Crop From UAV Captured Multispectral Images. In Proceedings of the 2022 IEEE 40th Central America and Panama Convention (CONCAPAN), Panama, Panama, 9–12 November 2022; IEEE: New York, NY, USA, 2022; pp. 1–6. [Google Scholar] [CrossRef]
  35. Universidad Nacional de Quilmes. Introducción a la Teledetección: La Herramienta de la Teledetección, El análisis Visual Y El Procesamiento de Imágenes. Available online: https://static.uvq.edu.ar/mdm/teledeteccion/unidad-3.html (accessed on 26 June 2024).
  36. Padilla, R.; Netto, S.L.; da Silva, E.A.B. A Survey on Performance Metrics for Object-Detection Algorithms. In Proceedings of the 2020 International Conference on Systems, Signals and Image Processing (IWSSIP), Niteroi, Brazil, 1–3 July 2020; IEEE: New York, NY, USA, 2020; pp. 237–242. [Google Scholar] [CrossRef]
  37. Giakoumoglou, N.; Pechlivani, E.-M.; Frangakis, N.; Tzovaras, D. Enhancing Tuta absoluta Detection on Tomato Plants: Ensemble Techniques and Deep Learning. AI 2023, 4, 996–1009. [Google Scholar] [CrossRef]
  38. Nirmal, M.D.; Jadhav, P.P.; Pawar, S. Pomegranate Leaf Disease Detection Using Supervised and Unsupervised Algorithm Techniques. Cybern. Syst. 2023, 54, 1–12. [Google Scholar] [CrossRef]
  39. Bhuiyan, M.A.B.; Abdullah, H.M.; Arman, S.E.; Rahman, S.S.; Mahmud, K.A. BananaSqueezeNet: A very fast, lightweight convolutional neural network for the diagnosis of three prominent banana leaf diseases banana leaf diseases. Smart Agric. Technol. 2023, 4, 100214. [Google Scholar] [CrossRef]
  40. Li, L.; Zhang, S.; Wang, B. Plant Disease Detection and Classification by Deep Learning—A Review. IEEE Access 2021, 9, 56683–56698. [Google Scholar] [CrossRef]
  41. Radócz, L.; Szabó, A.; Tamás, A.; Illés, Á.; Bojtor, C.; Ragán, P.; Vad, A.; Széles, A.; Harsányi, E.; Radócz, L. Investigation of the Detectability of Corn Smut Fungus (Ustilago maydis DC. Corda) Infection Based on UAV Multispectral Technology. Agronomy 2023, 13, 1499. [Google Scholar] [CrossRef]
  42. Choosumrong, S.; Hataitara, R.; Sujipuli, K.; Weerawatanakorn, M.; Preechaharn, A.; Premjet, D.; Laywisadkul, S.; Raghavan, V.; Panumonwatee, G. Bananas diseases and insect infestations monitoring using multi-spectral camera RTK UAV images. Spat. Inf. Res. 2023, 31, 371–380. [Google Scholar] [CrossRef]
  43. Yeom, J.; Jung, J.; Chang, A.; Ashapure, A.; Maeda, M.; Maeda, A.; Landivar, J. Comparison of Vegetation Indices Derived from UAV Data for Differentiation of Tillage Effects in Agriculture. Remote Sens. 2019, 11, 1548. [Google Scholar] [CrossRef]
  44. Carter, G.A.; Knapp, A.K. Leaf optical properties in higher plants: Linking spectral characteristics to stress and chlorophyll concentration. Am. J. Bot. 2001, 88, 677–684. [Google Scholar] [CrossRef] [PubMed]
  45. Shah, S.A.; Lakho, G.M.; Keerio, H.A.; Sattar, M.N.; Hussain, G.; Mehdi, M.; Vistro, R.B.; Mahmoud, E.A.; Elansary, H.O. Application of Drone Surveillance for Advance Agriculture Monitoring by Android Application Using Convolution Neural Network. Agronomy 2023, 13, 1764. [Google Scholar] [CrossRef]
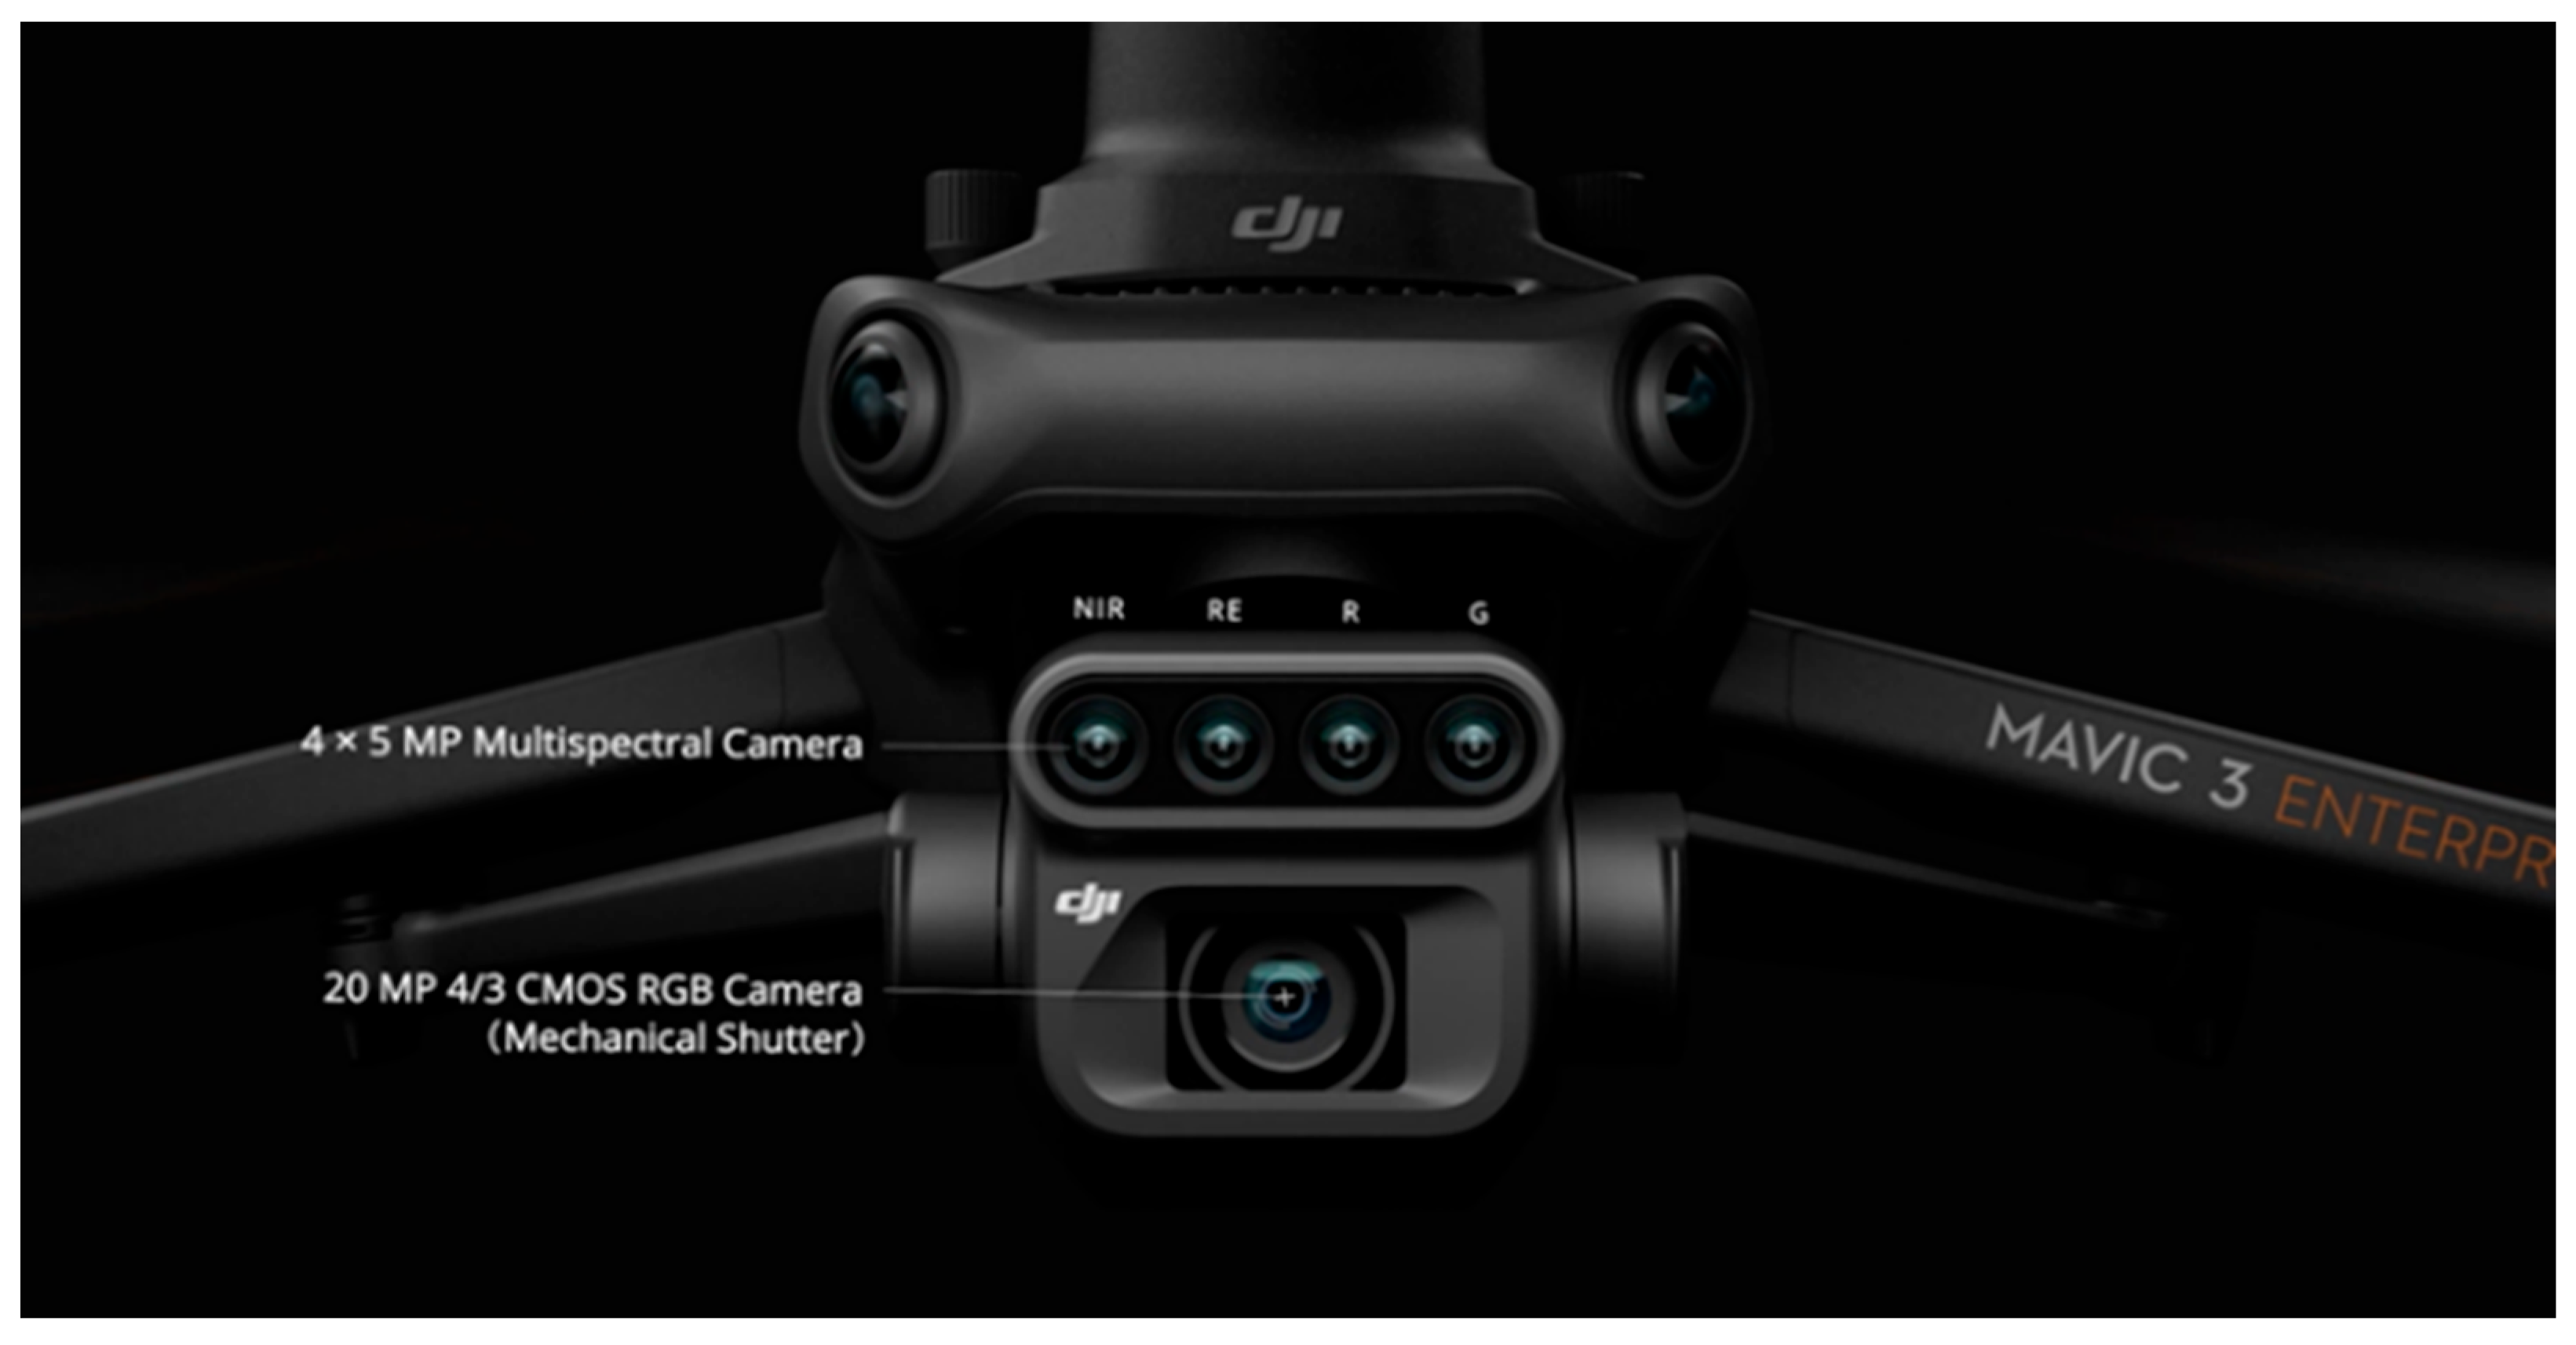
Figure 1. DJI Mavic 3M drone is equipped with an RGB imaging system (20 MP and 4/3 CMOS 20MP camera) and four dedicated multispectral sensors (5 MP: NIR-RE-R-G), manufactured by DJI, in Shenzhen, China [31].
Agriengineering 07 00341 g001
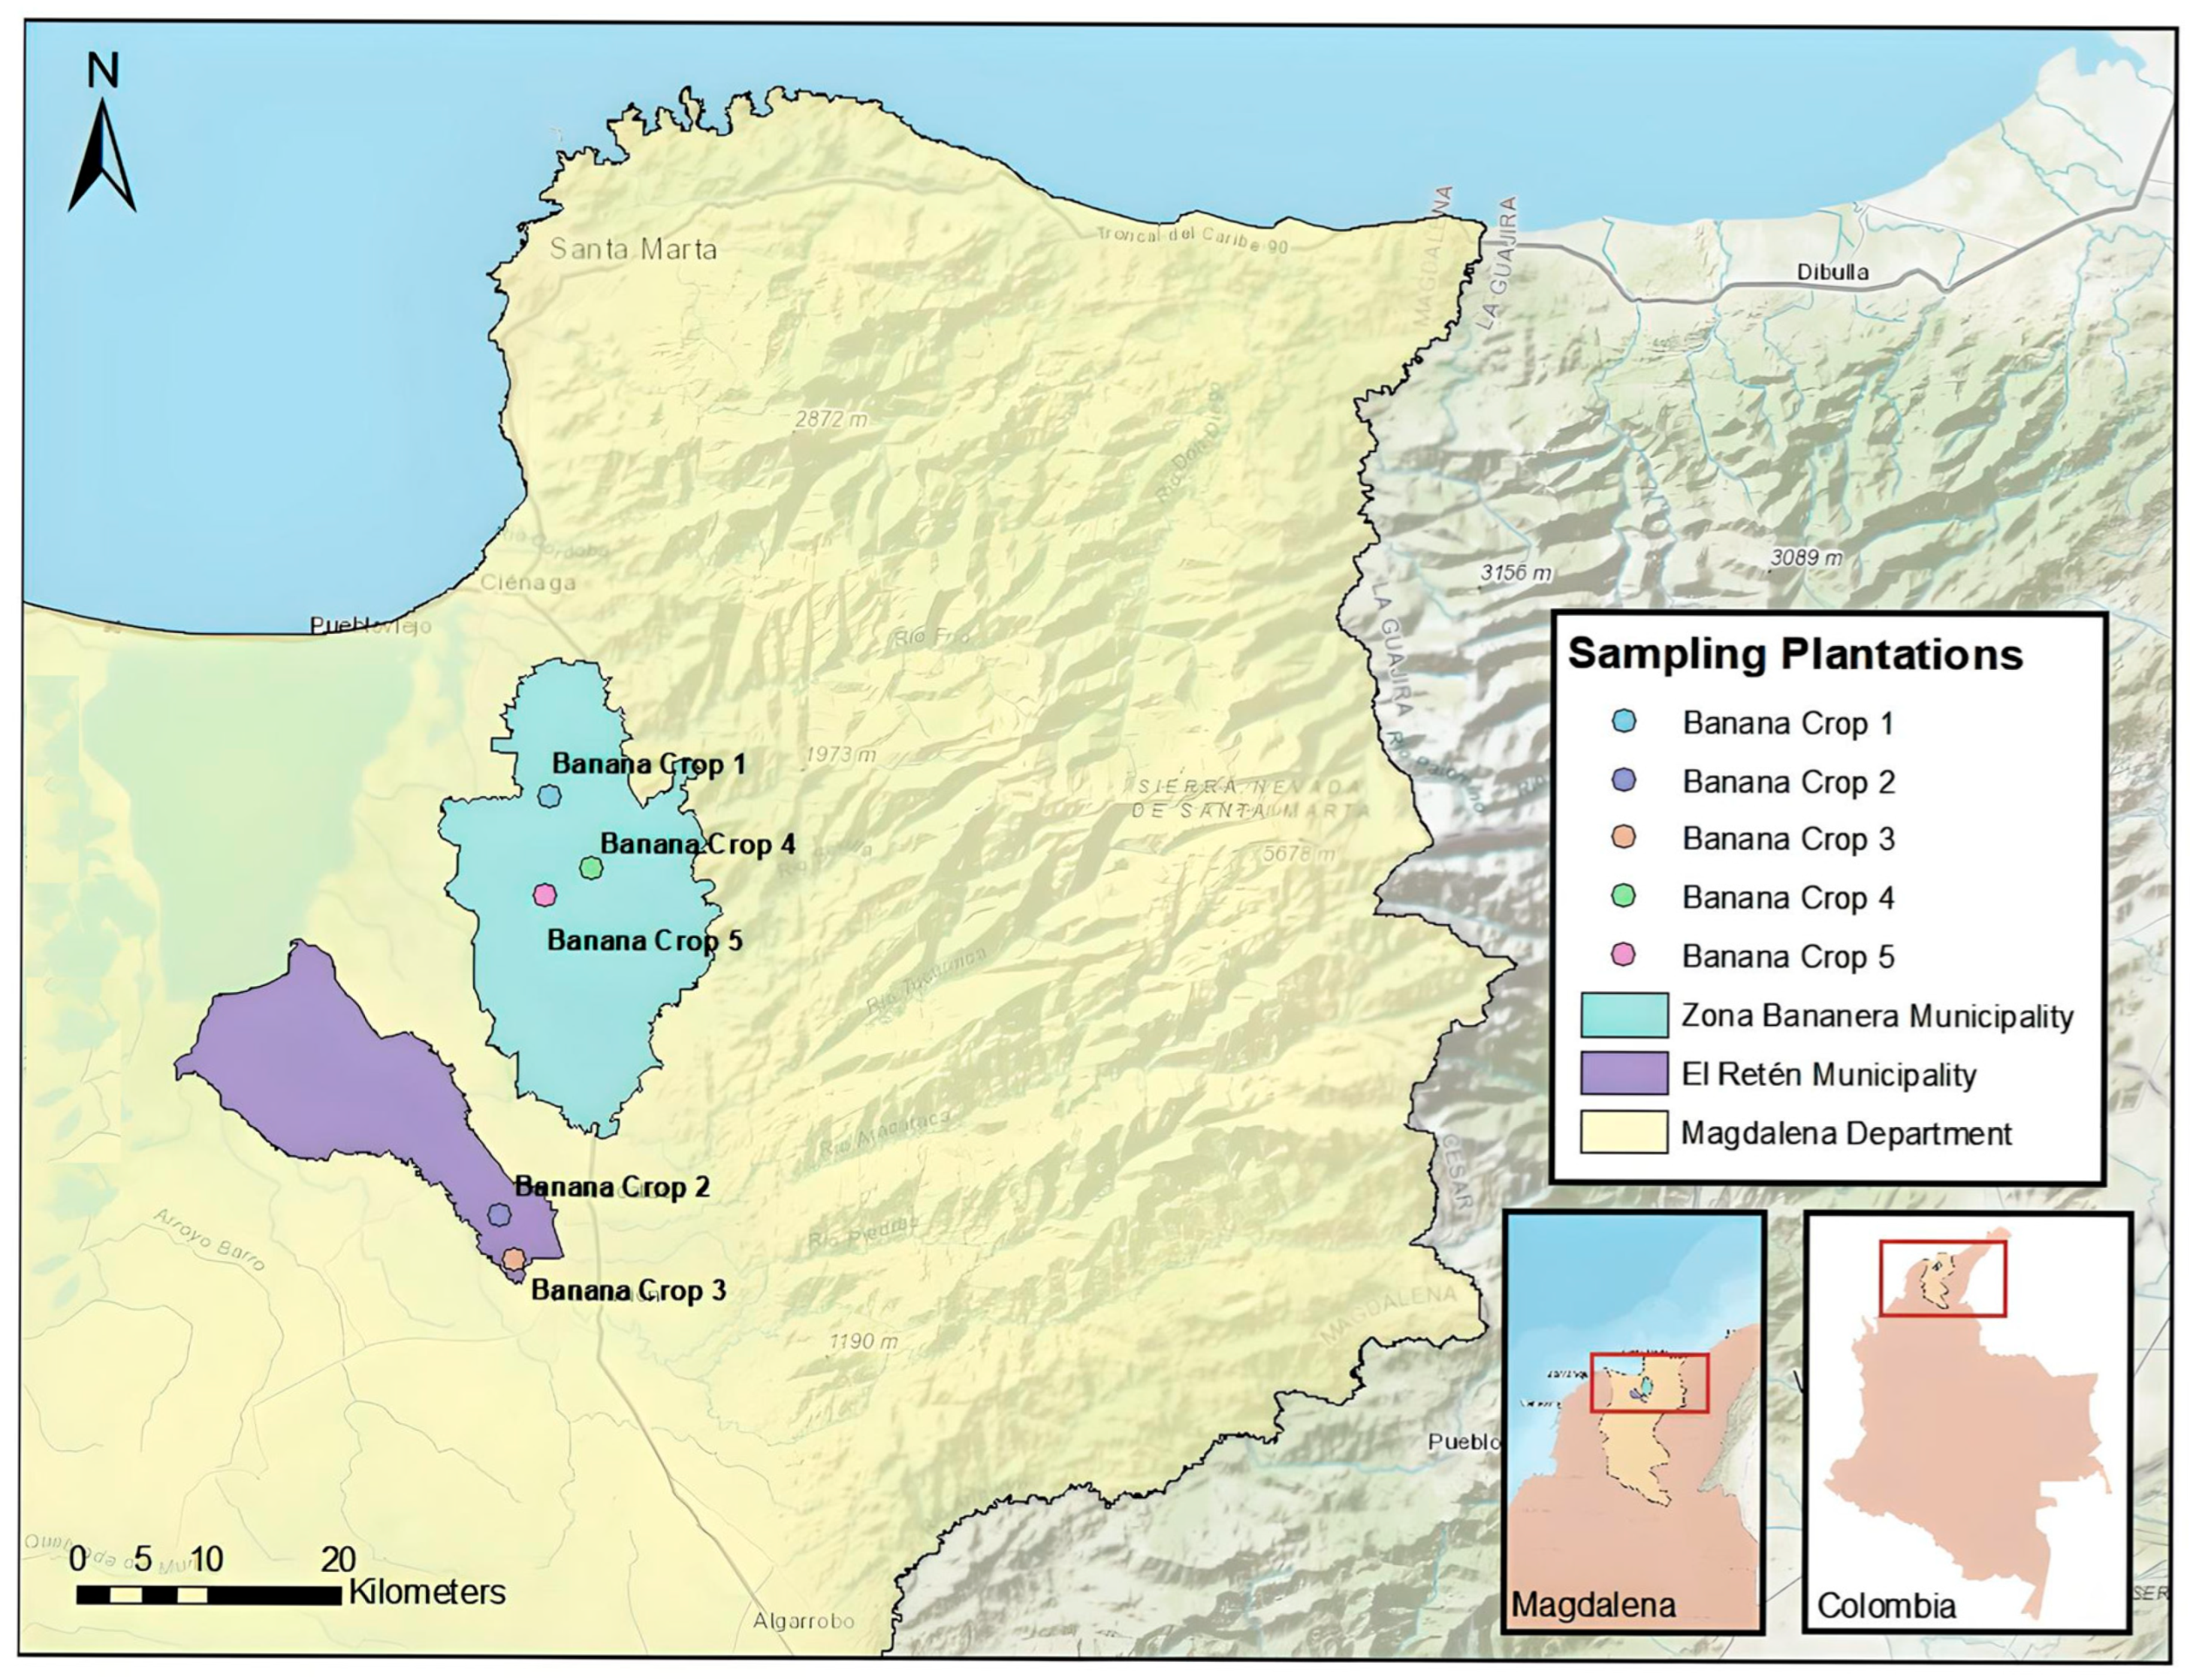
Figure 2. Study area map, showing the location of the banana crops in the municipalities of Retén and Zona Bananera, Colombia [30]. The right sub panel shows in the red box the location of the region in relation to Colombia, the panel to its left shows in the red box the location of the farm in a zoomed section showing the region.
Agriengineering 07 00341 g002
Figure 3. (A) Spectral images prior to alignment, displaying noticeable disparity and blur resulting from lens displacement. (B) Spectral images following correction and alignment using the SIFT algorithm, showing improved clarity and spatial consistency across bands [33].
Agriengineering 07 00341 g003
Figure 4. Dataset construction for evaluation of the classification models: 505 images were divided into sections of 160 × 130 pixels to obtain samples of objects.
Agriengineering 07 00341 g004
Figure 5. Spectral fusion process for the creation of false-color images from multispectral data [30].
Agriengineering 07 00341 g005
Figure 6. Morphological and physical alterations in banana leaves induced by Black Sigatoka.
Agriengineering 07 00341 g006
Figure 7. Operation of the IoT parent node.
Agriengineering 07 00341 g007
Figure 8. Operation of the IoT child sensor nodes.
Agriengineering 07 00341 g008
Figure 9. (A) Sensing of environmental and soil variables in banana. (B) IoT node in sensing operation. These nodes are based on the sensors BME280, HD-38, and ST-SS-GEN-052, integrated with the microcontroller ESP32, manufactured by Espressif Systems, Shanghái, China.
Agriengineering 07 00341 g009
Figure 10. Hybrid and hierarchical network architecture based on Deep Learning and Machine Learning models for disease classification [30].
Agriengineering 07 00341 g010
Figure 11. Construction of the dataset used to evaluate classification models, featuring the generation of false-color images based on varying spectral band combinations for enhanced detection performance [30].
Agriengineering 07 00341 g011
Figure 12. Overview of dataset preparation for evaluating classification models, involving the segmentation of UAV-captured multispectral imagery and its transformation into false-color compositions. The dataset includes: (A) healthy leaves; (B) diseased leaves; (C) non-leaves extras [30].
Agriengineering 07 00341 g012
Figure 13. Confusion matrix obtained during training and validation using the MobileNetV2 architecture.
Agriengineering 07 00341 g013
Figure 14. Performance curves (Accuracy and Loss) of the MobileNetV2 CNN model during training and validation.
Agriengineering 07 00341 g014
Figure 15. Performance curves (Accuracy and Loss) of the hybrid MobileNetV2-SVM model during training and validation.
Agriengineering 07 00341 g015
Table 1. Confusion matrix for the Three-Class classification model with indicators: TP (True Positives), FP (False Positives) and FN (False Negatives) [35].
Confusion MatrixPredicted Labels
Actual labelsTPFPFP
FNTPFP
FNFNTP
Table 2. Summary of evaluation metrics used for classification tasks.
MetricEquationDescription
Accuracy (acc) T P + T N T P + F P + T N + F N Measures the overall proportion of correct predictions among all predictions.
Precision (P) T P T P + F P Indicates the proportion of positive identifications that were actually correct.
Recall (R) T P T P + F N Represents the proportion of actual positives that were correctly identified.
F1Score (F1) 2 × P r e c i s i o n × R e c a l l P r e c i s i o n + R e c a l l Harmonic mean of precision and recall. Particularly useful in scenarios with imbalanced classes. The score ranges between 0 (worst) and 1 (best).
Table 3. Description of false-color images composed of 3-channel matrices [30].
Image
Combination
Channel 1
Wavelengths
Channel 2
Wavelengths
Channel 2
Wavelengths
Description
Colour Space
Combination 1Red
650 ± 16 nm
Red Edge
730 ± 16 nm
Near-Infrared
840 ± 26 nm
Traditional RGB with near-infrared enhancement using red-edge bands.
Combination 2Green
560 ± 16 nm
Red Edge
730 ± 16 nm
Near-Infrared
840 ± 26 nm
Emphasises vegetation health by combining green spectrum with red-edge data.
Combination 3Blue
450 ± 16 nm
Red Edge
730 ± 16 nm
Near-Infrared
840 ± 26 nm
Highlights disease patterns by integrating blue spectrum with red-edge bands.
Table 4. Results of training and validation using conventional CNN architectures.
Architecture
CNN
Image
Combination
Training
Accuracy
Validation
Accuracy
Precision of SigatokaRecall of
Sigatoka
Xception
Xception
Xception
Xception
EfficientNetV2B3
RGB
R–RE–NIR
G–RE–NIR
B–RE–NIR
RGB
0.7052
0.7249
0.7148
0.7167
0.8091
0.7027
0.7145
0.7029
0.7043
0.7834
0.83
0.86
0.80
0.81
0.76
0.87
0.90
0.88
0.83
0.65
EfficientNetV2B3R–RE–NIR0.83070.76490.720.68
EfficientNetV2B3G–RE–NIR0.83050.75630.690.59
EfficientNetV2B3B–RE–NIR0.83380.76340.710.62
VGG19RGB0.80190.77150.690.78
VGG19R–RE–NIR0.80440.75820.680.71
VGG19G–RE–NIR0.80210.74960.750.60
VGG19B–RE–NIR0.82770.74770.680.71
MobileNetV2RGB0.82480.78530.640.40
MobileNetV2R–RE–NIR0.86540.78910.760.73
MobileNetV2G–RE–NIR0.82580.76390.690.73
MobileNetV2B–RE–NIR0.82660.76110.710.66
Table 5. Results of training and validation for hybrid classification architectures.
Hybrid
Architecture
Image
Combination
Training
Accuracy
Validation
Accuracy
Precision of SigatokaRecall of
Sigatoka
Xception—SVMRGB0.76520.74990.750.41
Xception—SVMR–RE–NIR0.85740.71870.730.72
Xception—SVMG–RE–NIR0.82240.78640.640.54
Xception—SVMB–RE–NIR0.80130.76960.650.66
Xception—RNNRGB0.73020.78380.630.41
Xception—RNNR–RE–NIR0.84390.78230.750.78
Xception—RNNG–RE–NIR0.73450.77430.700.88
Xception—RNNB–RE–NIR0.73020.77990.770.78
Xception—REGRESSRGB0.80140.71030.800.46
Xception—REGRESSR–RE–NIR0.86050.78680.850.90
Xception—REGRESSG–RE–NIR0.70550.70660.780.90
Xception—REGRESSB–RE–NIR0.81860.71960.700.65
EfficientNetV2B3—SVMRGB0.83850.80620.780.75
EfficientNetV2B3—SVMR–RE–NIR0.96920.92610.840.80
EfficientNetV2B3—SVMG–RE–NIR0.93430.91420.790.80
EfficientNetV2B3—SVMB–RE–NIR0.93460.92350.760.68
EfficientNetV2B3—RNNRGB0.85390.82690.840.58
EfficientNetV2B3—RNNR–RE–NIR0.88920.84950.820.73
EfficientNetV2B3—RNNG–RE–NIR0.87440.81490.780.73
EfficientNetV2B3—RNNB–RE–NIR0.85180.87190.830.67
EfficientNetV2B3—REGRESRGB0.80320.78910.810.44
EfficientNetV2B3—REGRESR–RE–NIR0.92750.88790.770.84
EfficientNetV2B3—REGRESG–RE–NIR0.95210.86930.830.86
EfficientNetV2B3—REGRESB–RE–NIR0.93390.81980.750.65
VGG19—SVMRGB0.87820.87320.810.51
VGG19—SVMR–RE–NIR0.93090.87310.830.70
VGG19—SVMG–RE–NIR0.93720.86370.700.75
VGG19—SVMB–RE–NIR0.88750.86560.650.59
VGG19—RNNRGB0.80230.76930.780.66
VGG19—RNNR–RE–NIR0.93260.90910.820.72
VGG19—RNNG–RE–NIR0.90250.83360.810.74
VGG19—RNNB–RE–NIR0.91250.83270.820.58
VGG19—REGRESSRGB0.91560.87720.730.86
VGG19—REGRESSR–RE–NIR0.95980.85650.850.89
VGG19—REGRESSG–RE–NIR0.95710.83130.820.89
VGG19—REGRESSB–RE–NIR0.93460.80820.780.66
MobileNetV2—SVMRGB0.84660.76840.850.67
MobileNetV2—SVMR–RE–NIR0.98510.86110.870.85
MobileNetV2—SVMG–RE–NIR0.95410.85920.750.74
MobileNetV2—SVMB–RE–NIR0.94850.84530.800.77
MobileNetV2—RNNRGB0.82470.77930.750.52
MobileNetV2—RNNR–RE–NIR0.78450.74350.790.74
MobileNetV2—RNNG–RE–NIR0.81070.71340.710.83
MobileNetV2—RNNB–RE–NIR0.85080.76430.850.68
MobileNetV2—REGRESSRGB0.82080.78080.660.57
MobileNetV2—REGRESSR–RE–NIR0.85440.82950.850.84
MobileNetV2—REGRESSG–RE–NIR0.81470.76570.840.82
MobileNetV2—REGRESSB–RE–NIR0.81570.75770.770.76
Disclaimer/Publisher’s Note: The statements, opinions and data contained in all publications are solely those of the individual author(s) and contributor(s) and not of MDPI and/or the editor(s). MDPI and/or the editor(s) disclaim responsibility for any injury to people or property resulting from any ideas, methods, instructions or products referred to in the content.