Article

From Waste to Resource: Phosphorus Adsorption on Posidonia oceanica Ash and Its Application as a Soil Fertilizer

by
Juan A. González
1,
Jesús Mengual
2,* and
Antonio Eduardo Palomares
2
1
Institut Universitari d’Investigaciò d’Enginyeria de l’Aigua i Medi Ambient, Universitat Politècnica de València, Camí de Vera s/n, 46022 València, Spain
2
Instituto de Tecnología Química, Universitat Politècnica de València—Consejo Superior de Investigaciones Científicas, Avenida de los Naranjos s/n, 46022 València, Spain
*
Author to whom correspondence should be addressed.
AgriEngineering 2025, 7(10), 333; https://doi.org/10.3390/agriengineering7100333
Submission received: 7 August 2025 / Revised: 11 September 2025 / Accepted: 23 September 2025 / Published: 3 October 2025
(This article belongs to the Section Sustainable Bioresource and Bioprocess Engineering)

Abstract

Phosphorus-based compounds play a crucial role in agricultural productivity. However, excessive phosphorus discharge into water bodies contributes to eutrophication. This study proposes a circular approach for phosphorus recovery and reuse through the thermal valorization of Posidonia oceanica residues, an abundant marine biomass along Mediterranean coasts. After energy recovery from this waste (12.3 MJ kg−1), the resulting ash was assessed as an effective adsorbent for aqueous phosphorus removal. Batch experiments were conducted to evaluate adsorption kinetics and equilibrium, considering the influence of key operational variables, such as temperature, pH, and adsorbent dosage. Under optimal conditions, the material achieved a maximum retention of approximately 55–60 mgP g−1. The Freundlich model successfully describes the equilibrium isotherm data, indicating a heterogeneous adsorbent and an overall endothermic process. Phosphorus removal was favored at basic pH values (9.5–10.5), where the monohydrogen phosphate predominates. Leaching tests further revealed that saturated material releases phosphorus and other minerals in a manner clearly dependent on the final pH, with higher phosphorus release under more acidic conditions. These results suggest that Posidonia ash could serve as a low-cost adsorbent while also acting as a potential phosphorus source in soils.

1. Introduction

Continuous phosphorus inputs into aquatic systems, primarily originating from anthropogenic sources such as agricultural runoff, domestic wastewater, and industrial effluents, contribute to the degradation of water quality [1]. If not properly regulated, these discharges can lead to eutrophication, thereby altering the ecological balance and functioning of aquatic ecosystems. Eutrophication in aquatic systems is typically initiated when phosphorus concentrations surpass 0.1 mgP·L−1 [2]. Eutrophication induces an overgrowth of phytoplankton, deteriorates water quality, reduces aquatic biodiversity, and accelerates water scarcity [3,4]. Esfandi et al. [5] report that, under the Organization for Economic Cooperation and Development (OECD) classification criteria, a substantial proportion of lakes are considered eutrophic: 54% in Asia, 53% in Europe, 48% in North America, 28% in Africa, and 41% in South America. The problem is especially severe in semi-enclosed marine basins like the Mediterranean Sea, where limited hydrodynamic exchange and elevated nutrient loading from agriculture and urban runoff significantly enhance the risk and extent of eutrophication [6]. To mitigate eutrophication, it is essential to reduce, remove, and, where feasible, recover phosphorus from wastewater. As a key component in fertilizer production, phosphorus has been classified as a Critical Raw Material by the European Union in its 2023 list, due to concerns over supply security and its significant economic role. Consequently, the development of processes, technologies, and materials that enable the safe recycling and reuse of dissipated phosphorus is of great interest, as it promotes the sustainable recovery of critical resources from waste streams and aligns with the principles of a circular economy [7,8,9].
At the same time, Mediterranean coastal areas are experiencing an increasing accumulation of Posidonia oceanica residues. While this endemic seagrass plays a crucial ecological role in stabilizing sediments and supporting marine biodiversity [10], climate change-related stressors, such as rising sea temperatures and shifts in hydrodynamic regimes, have led to a greater deposition of Posidonia biomass along shorelines [11]. Despite their high organic and mineral content, these residues are often managed as waste, overlooking their potential for valorization in various biotechnological and environmental applications [12].
Recent studies have explored the treatment of Posidonia oceanica biomass to develop materials with potential adsorptive properties [13]. Furthermore, ashes derived from biomass, rich in mineral phases, have demonstrated promising capabilities for phosphate retention from aqueous solutions [14,15,16,17,18]. Their application as sustainable adsorbents are consistent with circular economy principles. Therefore, the utilization of Posidonia oceanica litter as an organic biomaterial for thermal valorization, and subsequently its ashes as precursors for adsorbents, offers dual environmental benefits by both valorizing coastal biomass and mitigating phosphorus pollution in aquatic environments.
In the event that these ashes demonstrate the capacity to adsorb phosphorus, the material generated following adsorption treatment would be enriched in this essential macronutrient, which is non-renewable and critical for plant growth due to its vital role in various physiological processes [19,20,21]. Consequently, this phosphorus-rich product possesses significant potential as a sustainable fertilizer alternative. By recovering phosphorus from aqueous systems, this approach not only reduces the depletion of natural phosphorus reserves but also diminishes the reliance on synthetic phosphorus fertilizers in adjacent agricultural lands. This dual benefit promotes more sustainable nutrient management and enhances the economic viability of the treatment strategy [22,23]. Recent studies have demonstrated that phosphorus recovery from waste-derived adsorbents aligns well with circular economy principles, simultaneously addressing environmental pollution and resource scarcity [7]. Thus, valorizing phosphorus-laden adsorbents as fertilizers represents a promising pathway towards sustainable agriculture and nutrient recycling.
Building on these considerations, the present work aims to conduct an in-depth study of phosphorus removal from aqueous media via adsorption using a material derived from green biowaste produced along the Mediterranean coasts—specifically, ashes obtained after the thermal treatment of Posidonia oceanica. The ash will be produced, processed, and subsequently tested for its phosphorus removal capacity. The kinetics of the removal process and adsorption equilibrium will be analyzed and modeled. Particular attention will be given to the effects of contact time, temperature, adsorbent dosage, and initial pH. Finally, to evaluate its potential use as a phosphorus-rich fertilizer material, the phosphorus-saturated ashes will undergo leaching-desorption experiments under controlled conditions to determine the amount of phosphorus and other relevant cations that can be released depending on the proton dosage and contact time during the leaching process.

2. Materials and Methods

2.1. Preparation and Characterization of Adsorbent

The raw material, Posidonia oceanica balls, was collected from a beach on the Mediterranean Sea in the Gulf of Valencia region, Denia, Spain. This material was shredded, washed with water, filtered, and dried in an oven at 353 K. This sample is hereafter referred to as PO.
The adsorbent, the Posidonia oceanica ash, was prepared by combustion of the raw material in a muffle furnace at 823 K for 2 h, followed by cooling, according to the Solid biofuels—Determination of ash content (ISO 18122:2022) standard [24]. The resulting ash was washed with deionized water until the conductivity of the suspension reached approximately 1000 μS cm−1. Finally, the sample was dried at 353 K overnight in an oven, sieved through a 0.5 mm mesh, and stored in a sealed container until use. This material is hereafter referred to as POA.
Characterization of both the raw material and the adsorbent was performed through a set of complementary analytical techniques. Specifically, an initial qualitative analysis of the ash composition was carried out by X-ray fluorescence spectrometer Zetium 4 kV (Malvern-Panalytical, Almelo, The Netherlands), which allowed the identification of the predominant elements and guided the subsequent selection of the cations quantified by inductively coupled plasma–optical emission spectrometry ICP–OES (Varian Inc., Palo alto, CA, USA). Elemental analysis (C, H, N, S) was performed using an elemental analyzer 1106 (Carlo Erba, Milan, Italy). Powder X-ray diffraction (PXRD) was used to assess the crystalline nature of the adsorbent, employing a multi-sample Philips X’Pert diffractometer equipped with a graphite monochromator (Philips, Amsterdam, The Netherlands). Data were collected over a 2θ range of 2° to 80°, with a step size of 0.02° and an accumulation time of 20 s per step, using Cu-Kα radiation (λ = 0.1542 nm). Thermogravimetric and differential thermal analyses (TGA–DTA) of the raw material were conducted under an air atmosphere using a Mettler Toledo TGA/SDTA 851E analyzer (Mettler Toledo, Greifensee, Switzerland). The particle morphology of the sample was examined by scanning electron microscopy (SEM) with a GeminiSEM 500 (Carl Zeiss, Jena, Germany). Additionally, textural properties were determined from N2 adsorption–desorption isotherms measured at 77 K on a Micromeritics TriStar 3000 (Micromeritics, Norcross, GA, USA).
The point of zero charge (pHPZC) was determined using the equilibrium method. The pH of a series of aqueous solutions was adjusted to the desired initial value (pHinitial) using 0.1 M HCl or 0.1 M NaOH. Adsorbent samples were mixed with 50 mL of each solution in 100 mL stoppered conical flasks and stirred until equilibrium was reached at 293 K. The final pH (pHfinal) was then measured, and the pHPZC was determined by plotting pHinitial versus pHfinal.

2.2. Batch and Semi-Batch Adsorption Experiments

Adsorption experiments were performed in batch mode, adapting the methodology commonly used in similar studies [25]. Equilibrium tests were conducted with different initial phosphate concentrations, C0 (5–150 mgP L−1), using sodium phosphate dibasic (NaH2PO4) solutions in 100 mL stoppered conical flask containing 50 mL of synthetic water and varying amounts of adsorbent. The mixtures were stirred in a temperature-controlled chamber for the selected time. The chosen temperatures ranged from 283 K to 303 K, which are typical values found in most natural water bodies.
Adsorption studies were conducted with solid-to-liquid doses (D) varying from 0.5 g L−1 to 2.0 g L−1, depending on the type of experiment. Blank experiments, performed in the absence of phosphorus, were also conducted to validate the experimental methodology. Upon completion of the adsorption experiment, at time t, the solution was filtered through a glass microfiber filter (1.2 µm), and the phosphate concentration, Ct (mgP L−1), was determined using the vanadomolydophosphoric acid colorimetric method as described in the Standard Methods for the Examination of Water and Wastewater [26]. The filtrate was also used to measure pH and electrical conductivity.
Multiple experiments were conducted for each series, and most of them were duplicates to verify reproducibility.
Semi-batch experiments were used for kinetic studies. The protocol was similar to that described above, but a larger amount of synthetic water (220 mL) was used, and the samples were collected at predetermined intervals for subsequent analysis.
The amount of phosphorus adsorbed onto the adsorbent, qt (mgP g−1), was calculated by the mass balance equation, as represented by Equation (1):
q t = C 0 C t W V = C 0 C t D
where V (L) is the volume of the solution; W (g) is the weight of the adsorbent used; and D (g L−1) is the adsorbent dose.
In addition, the percentage of phosphorus removal, or removal efficiency, Premoval (%), was calculated according to the following equation:
P r e m o v a l % = C 0 C t C 0 × 100

2.3. Leaching-Desorption Studies

The solid used for the leaching-desorption experiments was a sample of phosphorus-saturated adsorbent, obtained from an equilibrium experiment with an initial phosphorus concentration of 200 mgP L−1 and a dose of 2.0 g L−1. After reaching equilibrium, the solid was filtered, thoroughly washed with deionized water, and dried at 353 K. This sample is hereafter referred to as POA-P.
Leaching-desorption experiments were carried out in accordance with the procedure described in the UNE-EN 15958:2012 standard [27], for the extraction of water-soluble phosphorus in fertilizers. The experiments were performed in batch mode with a solid-to-liquid ratio (D) of 10 g L−1. Samples were placed in a 50 mL stoppered conical flask containing 20 mL of aqueous solutions at different pH values (adjusted using 1 M HCl) and the corresponding amount of phosphorus-saturated adsorbent, under continuous stirring at room temperature (293–298 K) for the selected contact time.
Blank experiments using the original ash material (PO) were also performed. Upon completion of the desorption experiment, at time tdes, the solution was filtered through a glass microfiber filter (1.2 µm), and pH and electrical conductivity were measured. The concentration of the extracted ions, corresponding to those identified in the ash composition, was determined by inductively coupled plasma–optical emission spectrometry ICP-OES.

2.4. Adsorption Kinetics

Different kinetic models have been tested. In this regard, three commonly used kinetic models reported in the literature were applied: the pseudo-first-order model, the pseudo-second-order model, and the Elovich model.
The pseudo-first-order rate expression proposed by Lagergren, applied to a batch adsorption system, is shown in Equation (3) [28]. Integrating this equation and applying the boundary conditions t = 0 qt = 0 and at t = t qt = qt, Equation (4) is obtained.
d q t d t = k 1 q e q t
q t = q e 1 e k 1 · t
where k1 (h−1) is the rate constant of pseudo-first order adsorption and qe (mg g−1) is the amount of solute adsorbed at equilibrium.
The pseudo-second order rate expression, developed by Ho and co-workers [29] and applied to batch adsorption experiments, is presented in Equation (5).
d q t d t = k 2 q e q t 2
where k2 (g mg−1 h−1) is the rate constant of pseudo-second order adsorption. Integrating the above equation yields
q t = t 1 k 2 q e 2 + t q e = t 1 h + t q e
where h (mg g−1 h−1) is the initial adsorption rate.
Finally, the Elovich model is suitable for chemical adsorption processes and systems with heterogeneous adsorbing surfaces. Equation (7) represents the mass balance applied to a batch adsorption experiment, considering the Elovich model as a kinetic expression [30], and Equation (8) shows its integrated form, using the same boundary conditions as in the previous models:
d q t d t = α e β q t
q t = 1 β ln 1 + α β t
where α (mg g−1 h−1) is the initial adsorption rate, and β (g mg−1) is the Elovich constant.
All these models have been fitted directly, without any linear transformation, to avoid violating the assumptions of linear regression [31,32]. Model fitting was performed using the least squares method.

2.5. Adsorption Isotherms

Different isotherm models have been used to determine the adsorption capacity of the adsorbent under various conditions. In this work, three of the most commonly applied models for this type of process were considered: the Langmuir model, the Freundlich model, and the Temkin model.
The Langmuir model assumes, among other things, that adsorption occurs on a solid surface with equivalent sites, without interactions between adsorbate molecules, and that the adsorption is limited to monolayer coverage. The Langmuir isotherm model is represented by the following equation [33]:
q e = q m a x K L C e 1 + K L C e
where qmax (mg g−1) is the maximum adsorption capacity, and KL (L mg−1) is the Langmuir constant, which reflects the affinity of the adsorbate for the adsorbent.
The Freundlich isotherm model is an empirical equation, and its expression can be written as [34]
q e = K F C e 1 n
where KF (mg1−(1/n) L1/n g−1) is a constant indicative of the relative adsorption capacity of the adsorbent, and n is a constant that reflects the intensity of the adsorption.
The Temkin isotherm model assumes that the heat of adsorption of all molecules in the layer decreases linearly with surface coverage due to adsorbent-adsorbate interactions. The Temkin model is expressed as follows [35]:
q e = B ln K T C e
where KT (L mg−1) is the Temkin equilibrium constant, and B (mg g−1) is a constant related to the variation in adsorption energy.
Similarly to the previous point, all these models have also been fitted directly, without any linear transformation, in accordance with the recommendations of other authors [32,36]. The models were fitted using the least squares method, following the recommendations of Tran and co-workers [37,38].

3. Results and Discussion

3.1. Characterization of Adsorbent

Figure 1A shows the thermogravimetric analysis of the thermo-oxidative degradation process of PO (raw material), presenting mass loss (TG) and the rate of mass loss (DTG). This process can be divided into four stages. The first stage, from 302 K to 458 K, with a maximum DTG at 333 K, is characterized by moisture evolution, resulting in a mass loss of 9.5%. The second stage, from 458 K to 664 K, with a maximum DTG at 597 K, involves a mass loss of 50.7%, attributed to the decomposition of hemicellulose, cellulose, and lignin. The third stage, from 664 K to 850 K, with a maximum DTG at 741 K, accounts for a 29.4% mass loss. Finally, the fourth stage, from 850 K to 1173 K, presents a broad maximum at 894 K with a mass loss of 1.7%. According to the literature, this stage corresponds to char combustion and lignin decomposition [39]. The residual mass after the oxidative process, corresponding to ash yield (wet basis), was 8.7%. Both the ash yield and the mass loss in the fourth stage are low compared to other studies [38,39,40,41]. However, this may be due to the washing of the original sample prior to characterization, as effective removal of salt and sand is achieved by properly washing and sieving of the raw material [42].
Table 1 shows the elemental analysis of PO. This sample exhibits a slightly higher carbon content than that reported in other studies. This is attributed to the low ash content discussed above, which results in a higher relative proportion of carbon in the sample. Using the Dulong formula [43], the higher heating value (HHV) was estimated to be 12.32 MJ kg−1. This value is consistent with those reported in the literature for similar material [40,44], and has already been recognized as a valuable feedstock for thermo-chemical processes, including combustion, gasification, and pyrolysis [39]. Although the HHV of Posidonia oceanica biomass lies in the lower range of typical biomasses used for energy purposes (11–21 MJ kg−1), it remains comparable to several agricultural residues commonly valorized for energy purposes, such as vine prunings, sorghum, or paddy straw (≈11–14 MJ kg−1) [45]. This suggests that Posidonia biomass could be effectively incorporated into biomass blends for thermo-chemical processes, thereby enabling the subsequent reuse of its ash as a phosphorus recovery material.
In the case of Posidonia ash, POA, Table 1 shows its physicochemical properties. The relatively small surface area and the high percentage of external surface area indicate that the adsorbent does not exhibit significant microporosity. In this regard, the scanning electron micrographs (Figure 2) reveal a non-crystalline, heterogeneous distribution of particles with varying sizes and shapes, ranging from a few to several tens of micrometers. Reinforcing or vascular fibers can also be observed among the fragments. Similar morphologies have been reported for ashes derived from other plant-based wastes [25,46].
The ashes are essentially inorganic, as evidenced by their low carbon content, which indicates a proper combustion process. Moreover, the measured carbon content in the ash may be overestimated due to the possible decomposition of calcite during combustion. A moderate sulfur content is also present. Silicon and calcium are the main components, followed by magnesium, reflecting a high content of alkaline earth metals. The material also contains a relatively high iron content, greater than that of aluminum. Finally, the content of alkali metals and phosphorus is low. This composition is consistent with data reported in specialized literature [40,41].
The diffraction pattern of the POA (Figure 1B) confirms its low crystallinity. The material appears to be a heterogeneous mixture, mostly amorphous, composed of metal oxides. Using X’Pert Highscore Plus software (v. 2.2b), two crystalline phases—silica (SiO2) and calcite (CaCO3)—were clearly identified. Other phases, such as anhydrite (CaSO4) and periclase (MgO), were also suggested, though with less certainty due to the number of overlapping peaks.
The basicity of the adsorbent was determined based on the point of zero charge (pHPZC), shown in Figure 1C, for a dose of 2.0 g L−1. The extrapolated value was approximately 10.7, which lies at the upper end of the typical range reported for metal oxides [47]. The buffering capacity of the material is clearly illustrated in Figure 1C: over a wide range of initial pH values, the final pH remained nearly constant, stabilizing around the pHPZC, even when the initial pH started as low as 3. The high buffering capacity of POA is mainly attributed to the presence of alkaline earth metals such as calcium and magnesium, which provide alkalinity and contribute to pH stabilization. In addition, aluminosilicate structures and iron oxides containing surface hydroxyl groups with amphoteric behavior also play a role by enabling protonation and deprotonation reactions depending on the pH. However, the overall buffering effect will depend on factors such as POA dosage and soil characteristics.

3.2. Adsorption Kinetic Studies

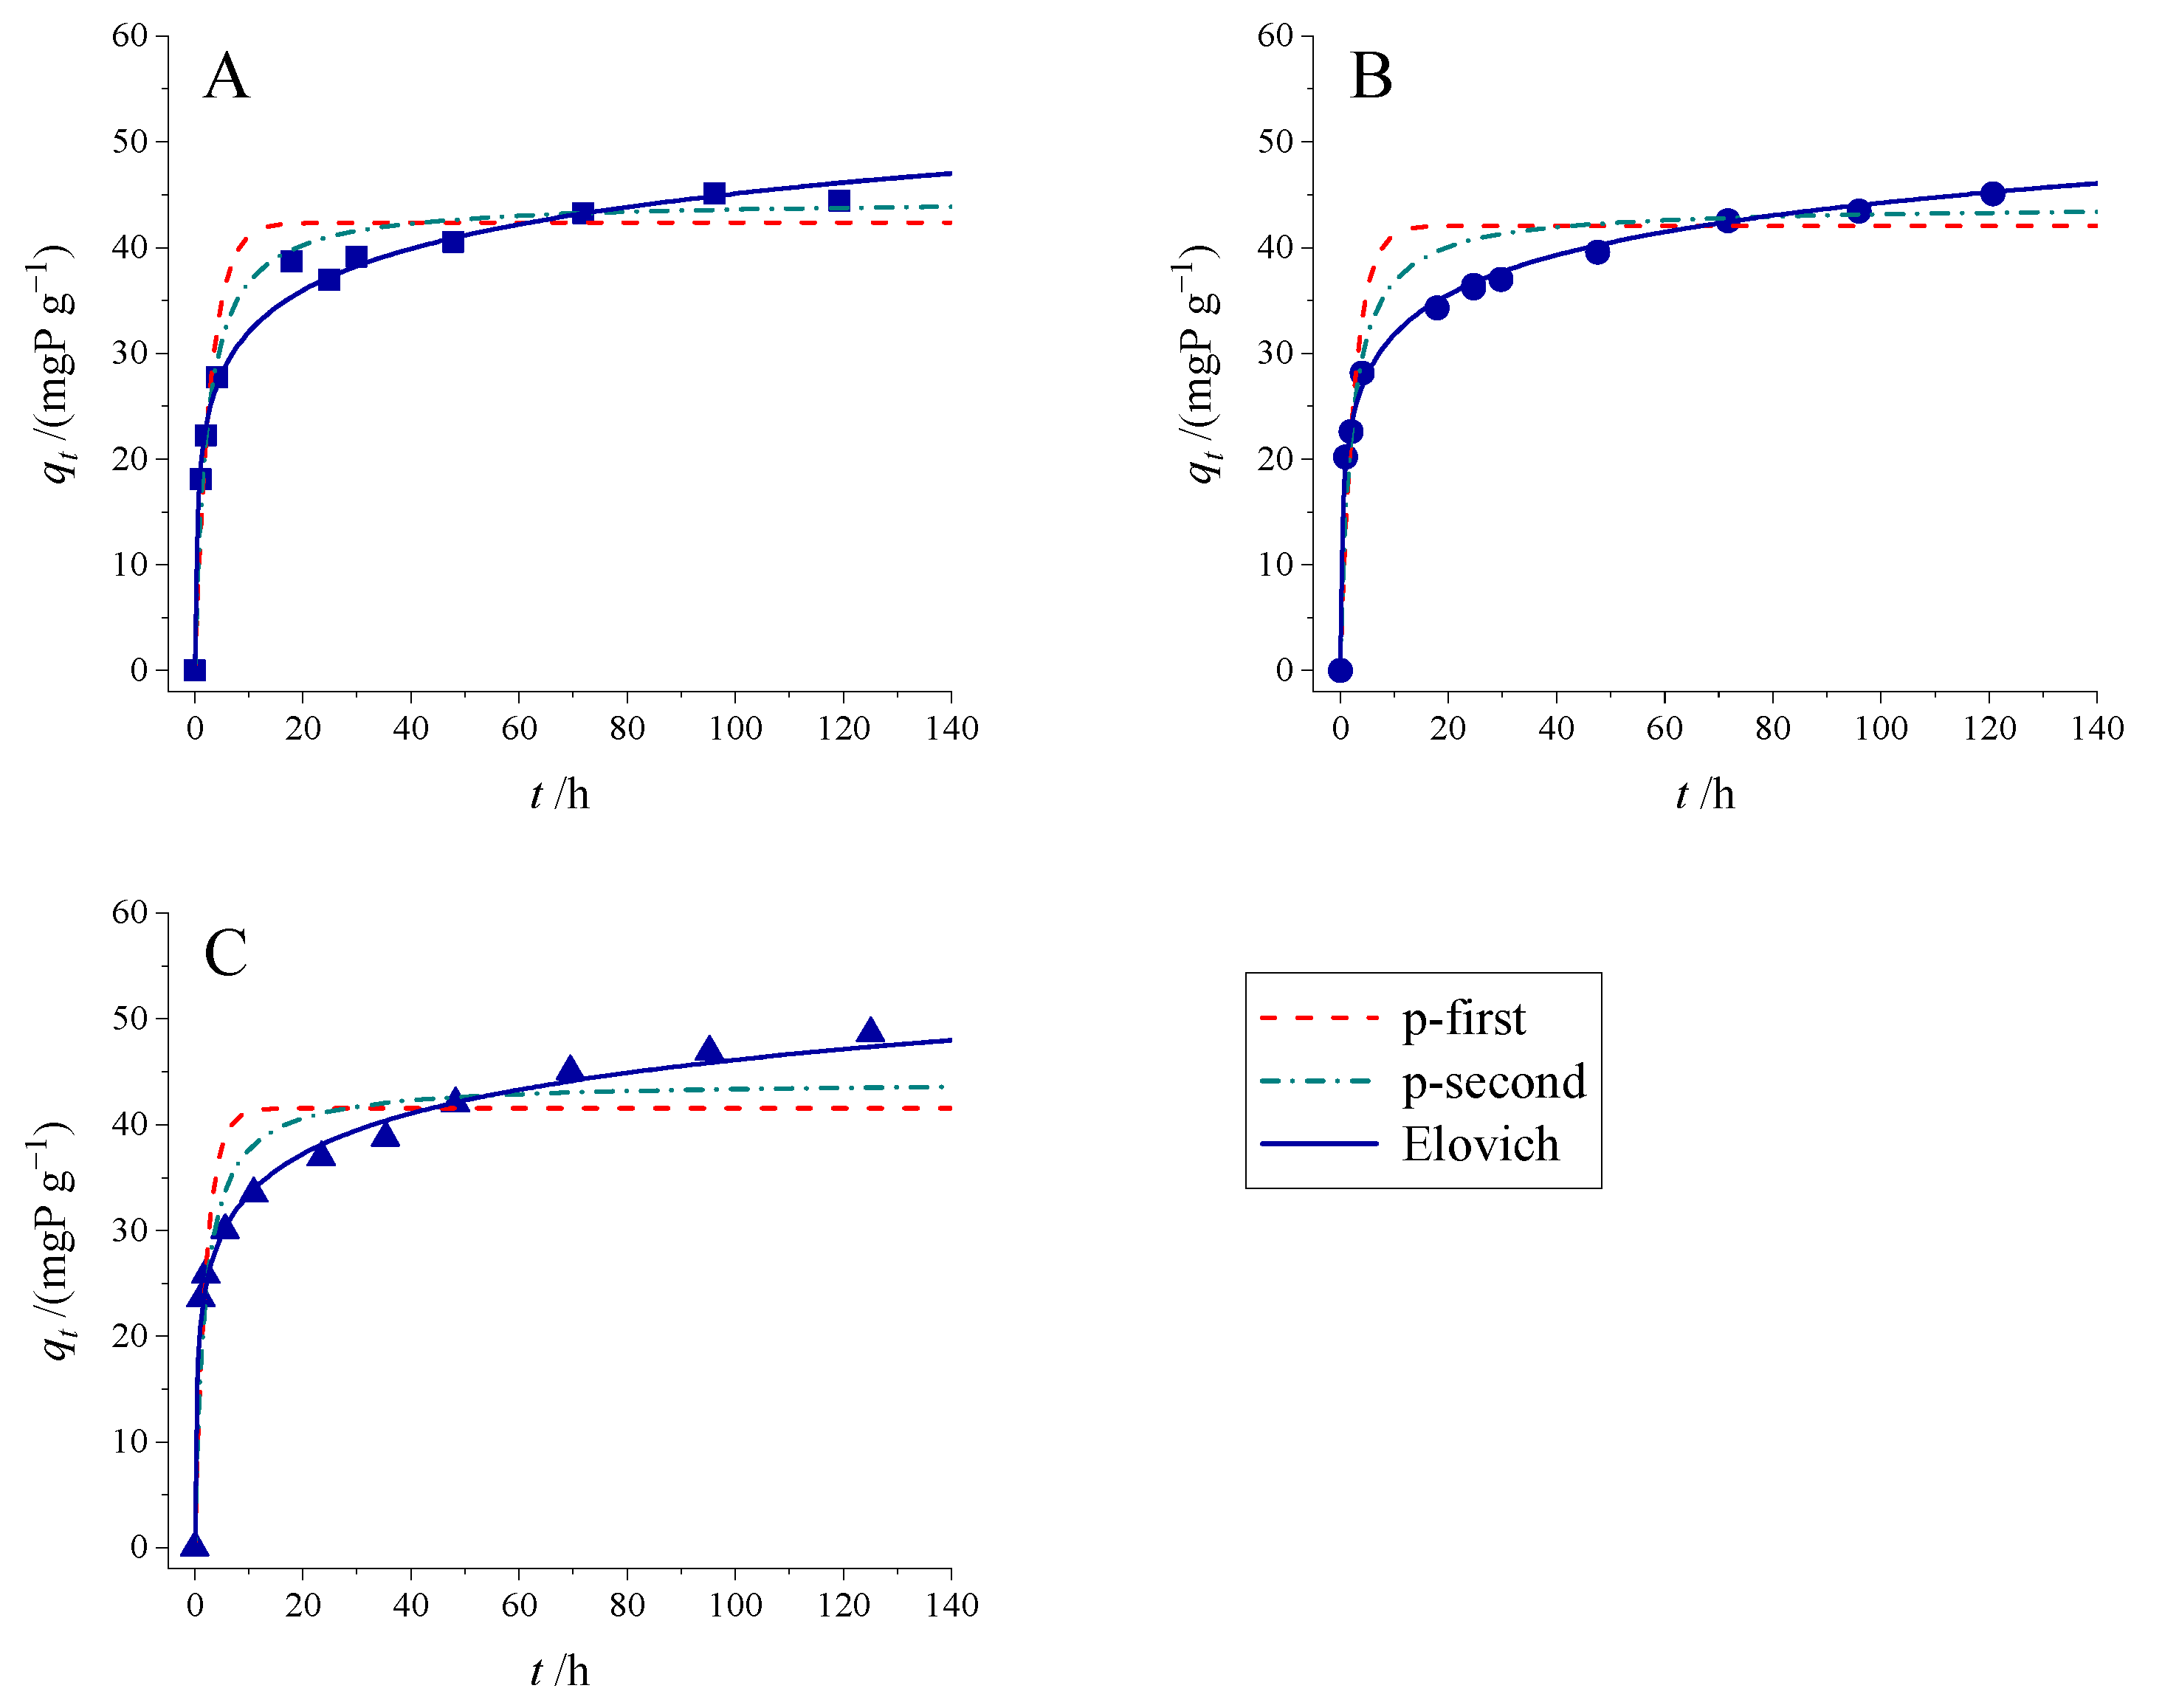
Adsorption kinetic studies are essential for determining the required equilibration time and the optimal contact time for isotherm adsorption experiments [38]. Kinetic phosphate adsorption experiments were conducted at different temperatures: 283 K, 293 K, and 303 K. The relative error across different data points ranged from a minimum of 2.0% to a maximum of 12.1%, observed only on rare occasions. The average error obtained for the different series of the POA adsorbent was 5.9%. Figure 3 presents the kinetic results at these three temperatures.
As shown in Figure 3, phosphorus removal increased rapidly during the first day, after which the system evolved at a very slow rate, gradually approaching a pseudo-steady state. A marked initial step can be observed, with approximately 73% removal achieved within the first 12 h and 81% after 24 h, compared to that achieved after 96 h. This behavior indicates a relatively fast initial removal of phosphorus, followed by a very slow process that persists over long periods, allowing an increase in the final retention yield. Based on these initial kinetic data, it is evident that this material is capable of effectively removing phosphorus, demonstrating a high retention capacity.
Several kinetic models were used to analyze the experimental data and to distinguish possible kinetic differences. Table 2 shows the fitted parameters of the three kinetic models studied for this adsorbent at all temperatures, including the coefficients of determination (R2), calculated from the theoretical values predicted by the model relative to the true values obtained, ytheor = f(yexp), and the root mean squared error (RMSE) according to Equation (12) [32]. Figure 3 also shows the fitted curves for the three models at each temperature. The continuous lines represent the different models.
R M S E = 1 N 2 i q exp i q t h e o r i 2
where N is the sample size, qiexp is the experimental value of qt of the sample i and qitheor is the value of qt obtained using the model in the same condition as qiexp.
According to the observed evolution, the pseudo-first-order and pseudo-second-order models can be excluded for this material, as they show the greatest deviations from the experimental data. Both models converge toward a final equilibrium value, which, as mentioned above, does not occur with this material. Moreover, their R2 values for both models are the lowest and their RMSE values the highest when compared to the Elovich model. These models overestimated values during the initial stage and then underestimated the final constant equilibrium values. The Elovich model provides the best representation of the adsorption evolution, showing both the rapid initial uptake a final trend that continues to increase. Consequently, this model yields the highest R2 values and the lowest RMSE values. The fit to this model is indicative of chemical adsorption on a heterogeneous surface, where the adsorption rate decreases as the amount adsorbed increases. In this context, as described during the characterization of the material, POA is a partially crystallized heterogeneous mixture of oxides, in which interactions between these oxides and phosphate can occur through chemical reactions.
Since the Elovich model does not provide a defined equilibrium time, a pseudo-equilibrium of 96 h was selected, consistent with previous studies on similar materials [16,17,25,48]. At this time, the adsorption rate was already very low (≈0.05 mgP g−1 h−1), and the ratio between the chosen pseudo-equilibrium time and the parameter t0 (the characteristic Elovich time, defined as the inverse of α·β), which indicates the number of “characteristic times” elapsed until reaching pseudo-equilibrium, ranged between 2600 and 3400, both values being considerably more conservative than those typically reported in the literature [49,50,51,52,53].

Activation Energy—Arrhenius Plot

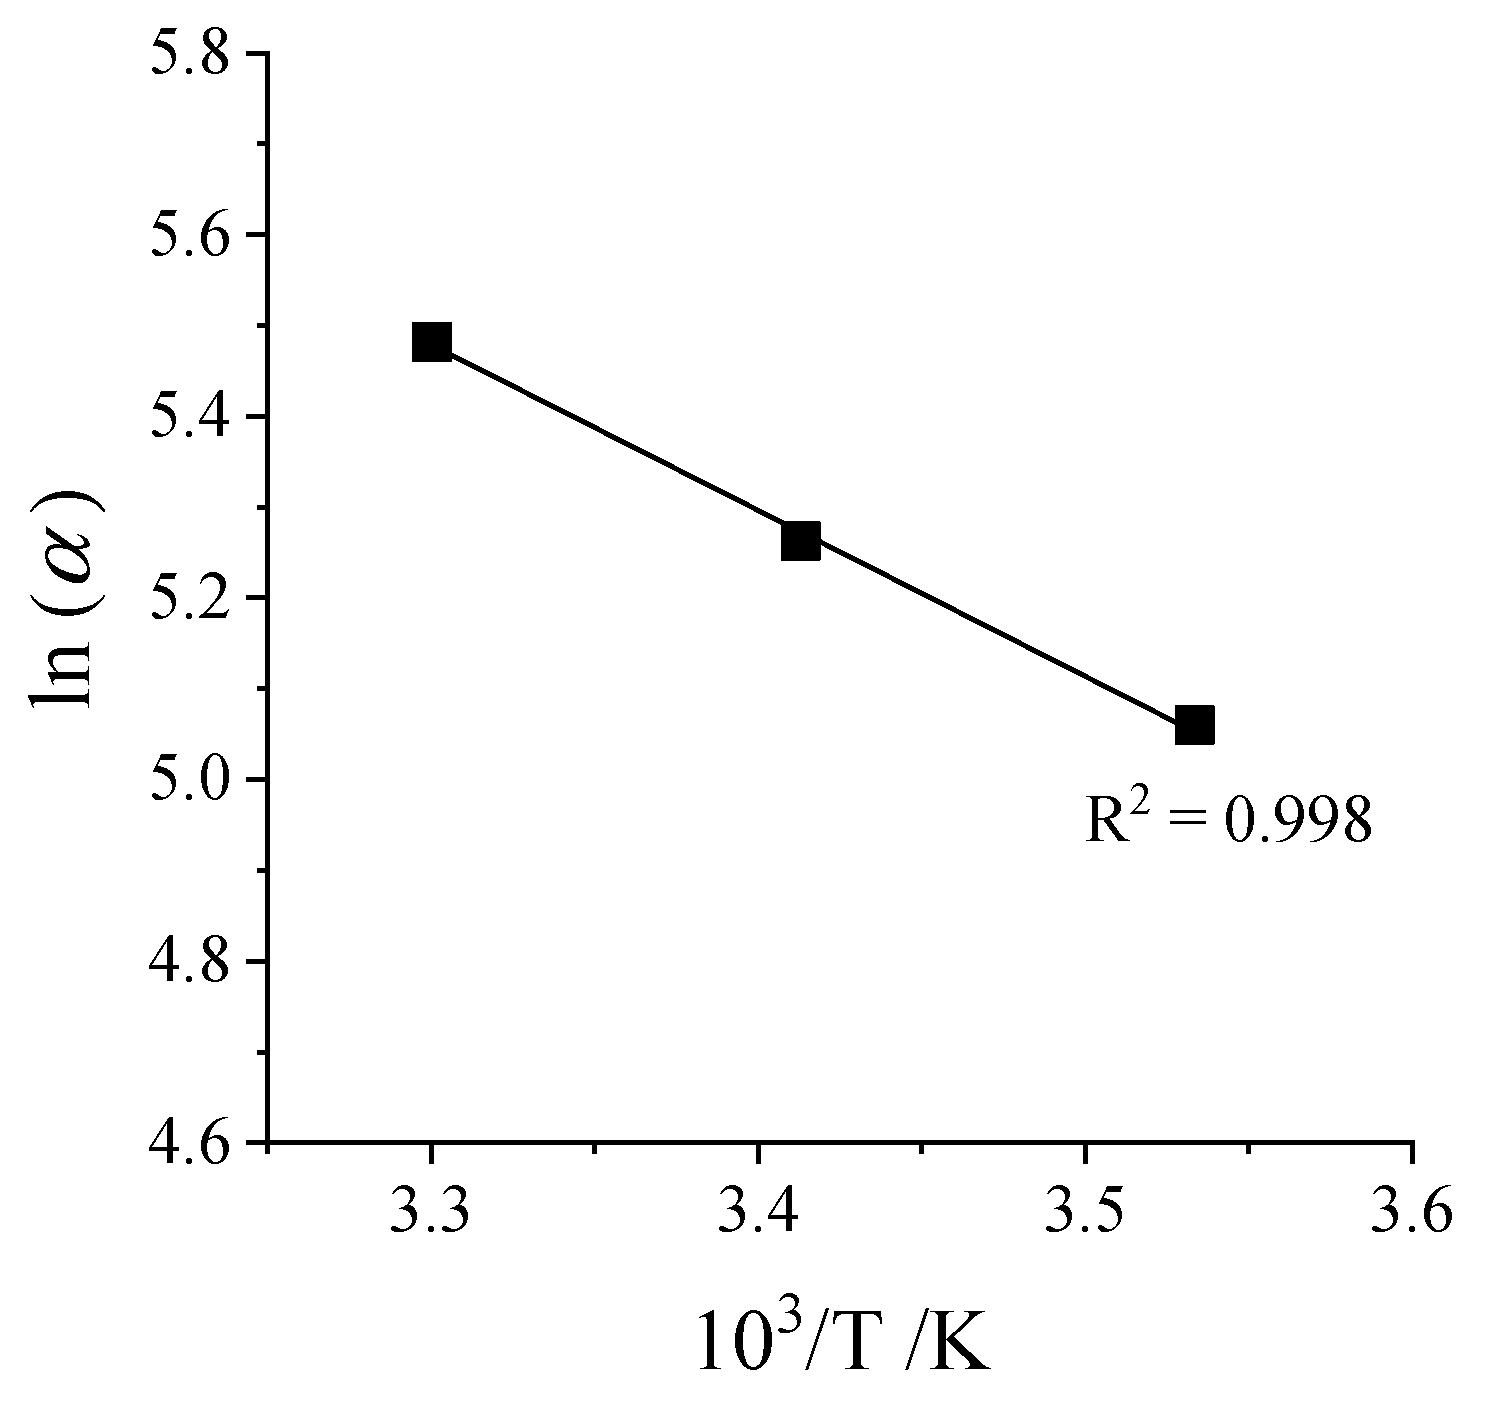
Once the model describing the kinetic behavior of the sample has been selected and the rate constants at different temperatures have been determined, the activation energy (Ea) of the kinetic process can be calculated using the Arrhenius equation, as shown below.
α = α 0 exp E a R T
This equation was fitted directly without any linear transformation of the graph. The fitting was performed using the least squares method. Figure 4 shows the Arrhenius plot for the kinetic constant and the accuracy of the fit obtained. The activation energy for the POA sample was 15.2 kJ mol−1. This value is consistent with those reported for the same adsorption process on ashes from other biomaterials (15.6–24.7 kJ mol−1) [25]. The variation in β with temperature does not show a clear trend, fluctuating around an average value of 0.181 g mgP−1, indicating moderate heterogeneity that is not significantly affected by temperature within the studied range.

3.3. Adsorption Isotherm Studies

3.3.1. Effect of Temperature

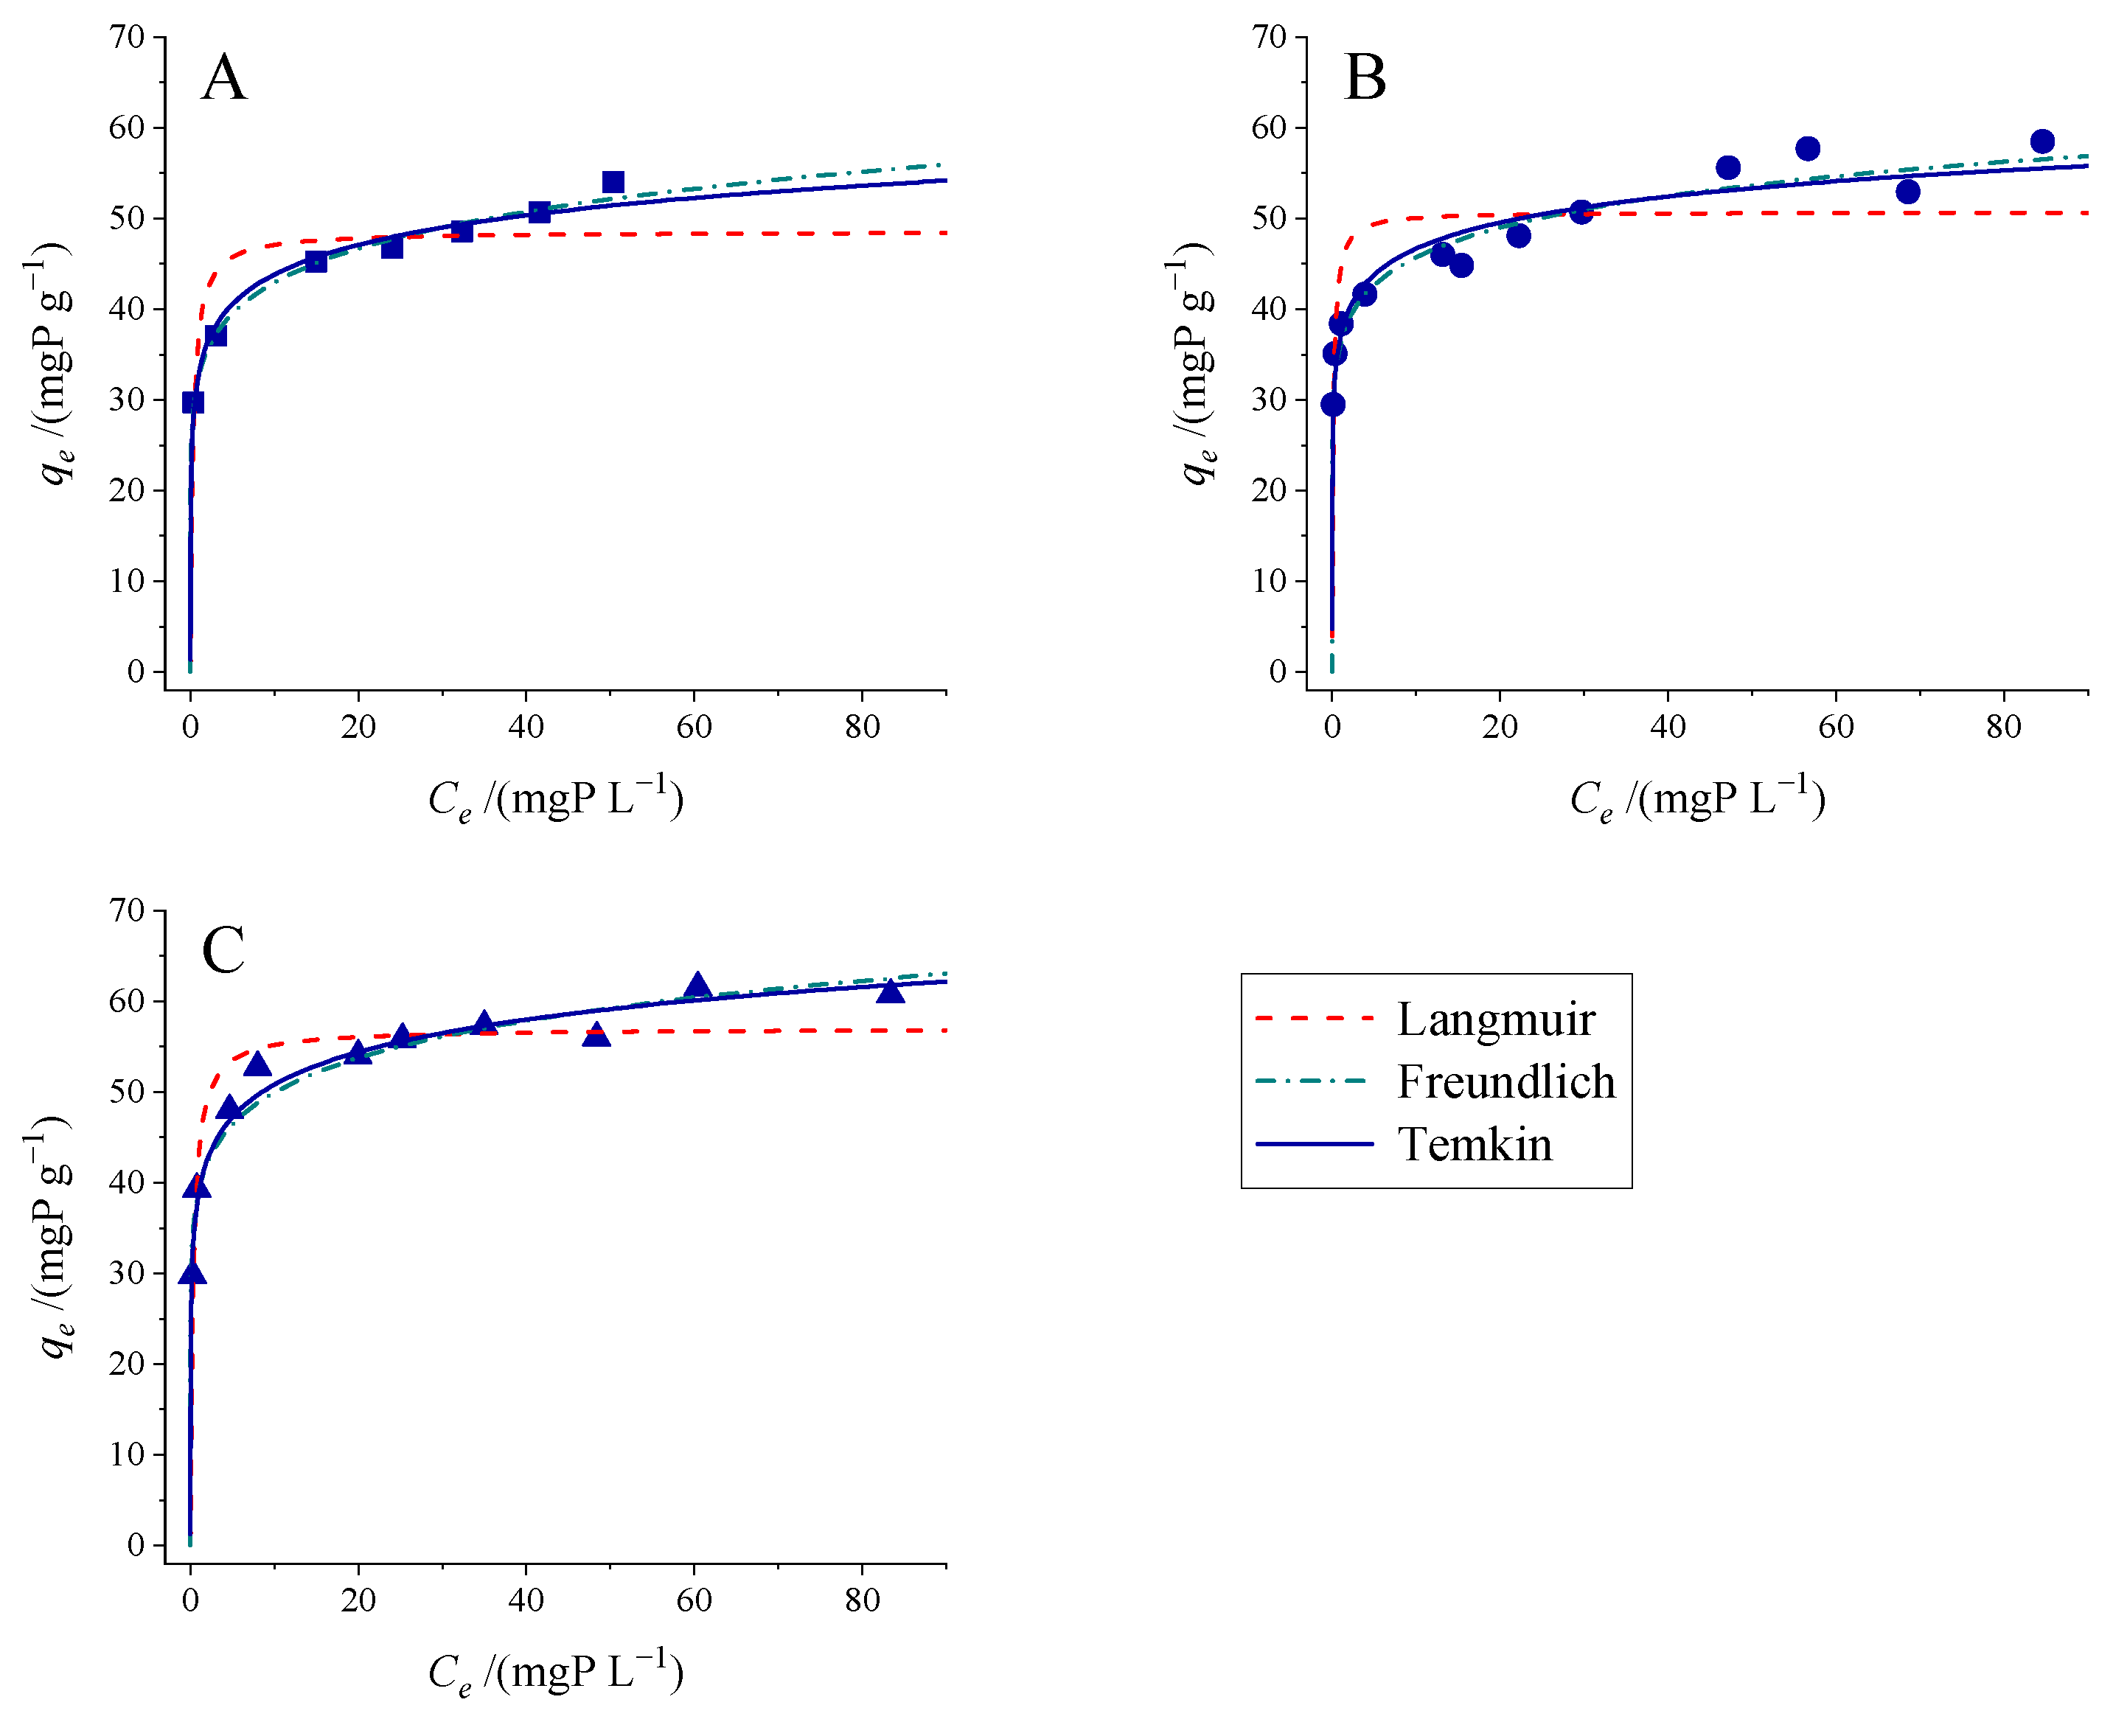
Phosphate adsorption isotherms for the POA adsorbent were determined at three different temperatures, maintaining a constant adsorbent dose of 1.0 g L−1 and an equilibrium time of 96 h, based on the preliminary kinetic study. The temperatures studied (283–303 K) reflect the typical range found in natural water bodies. Figure 5 presents the results obtained at these temperatures. It can be observed that the adsorption capacity increases with equilibrium concentration, reaching high retention values on the order of 45–55 mgP g−1. Notably, a high retention capacity is observed even at low equilibrium concentrations, which suggests the material’s potential for effective phosphorus removal from natural waters where phosphate concentrations are typically low while maintaining high adsorbent efficiency.
The isotherms were analyzed using the three previously described models: Langmuir, Freundlich, and Temkin. All experimental data were fitted directly to these models without any linearization. Model selection was based on the coefficient of determination (R2) and the root mean squared error (RMSE), following the procedure described earlier. Table 3 presents the fitted parameters for each model at different temperatures, together with their respective R2 and the RMSE values.
According to the data obtained and the experimental trends shown in Figure 5, the Langmuir isotherm model can initially be discarded, as it presents the lowest R2 values and the highest RMSE values. Moreover, the Langmuir model assumes an asymptotic approach to a maximum adsorption capacity (qmax), a behavior that is not observed in the experimental data under the present operating conditions.
In contrast, both the Freundlich and Temkin models provide a good fit to the experimental data, with comparable performance in terms of R2 and RMSE values and curve evolution. Unlike the Langmuir model, both the Freundlich and Temkin models assume a heterogeneous adsorption system and a decrease in interaction strength as surface coverage increases. These assumptions are consistent with the findings from the kinetic study, supporting the applicability of both models to describe the adsorption behavior of the material. Figure 5 also includes the model fits as continuous lines.
To distinguish between these two models, and considering that they are not nested, the corrected Akaike Information Criterion (AICc) was applied, following an approach similar to that adopted in previous work [25]. The value was determined using Equation (14) [54].
A I C c = N ln S S E N + 2 K + 2 K K + 1 N K 1
where N is the number of data points, SSE is the sum of squares residuals of the regression, and K is the number of fitting parameters in the regression plus one.
The model with the lowest AICc value is considered the most likely to be correct. Since the AICc is expressed on a relative scale, it is common practice to calculate the AICc differences (ΔAICc), taking the model with the lowest value as the reference. The larger the ΔAICc, the less plausible the fitted model becomes [55].
Δ A I C c i = A I C c i A I C c min
Table 3 shows the ΔAICc values for each model, considering all the data obtained at the three temperatures together. As can be seen, this difference is very high for the Langmuir model, which allows us to rule it out in agreement with the other statistical parameters analyzed. In contrast, the difference between the Freundlich and Temkin models is much smaller, close to 2.0, indicating that both models have substantial support [55]. The model probabilities, as a measure of strength of evidence [56], are 76.5% for Freundlich and 23.5% for Temkin, while it is negligible for Langmuir. Therefore, from a statistical perspective, although the Freundlich model appears the most likely, the Temkin model cannot be completely ruled out.
Regarding the effect of temperature, the results show a slight increase in phosphorus removal capacity with increasing temperature. Although the Langmuir model was rejected for its poor fit, it is noteworthy that the estimated qmax values increase with temperature, suggesting improved adsorption capacity at higher temperatures.
The variation in the isotherm constants with temperature is particularly relevant, as it relates to the isosteric enthalpy of adsorption (ΔHad), which can be evaluated using the van’t Hoff equation.
ln K i 1 / T θ = Δ H a d R
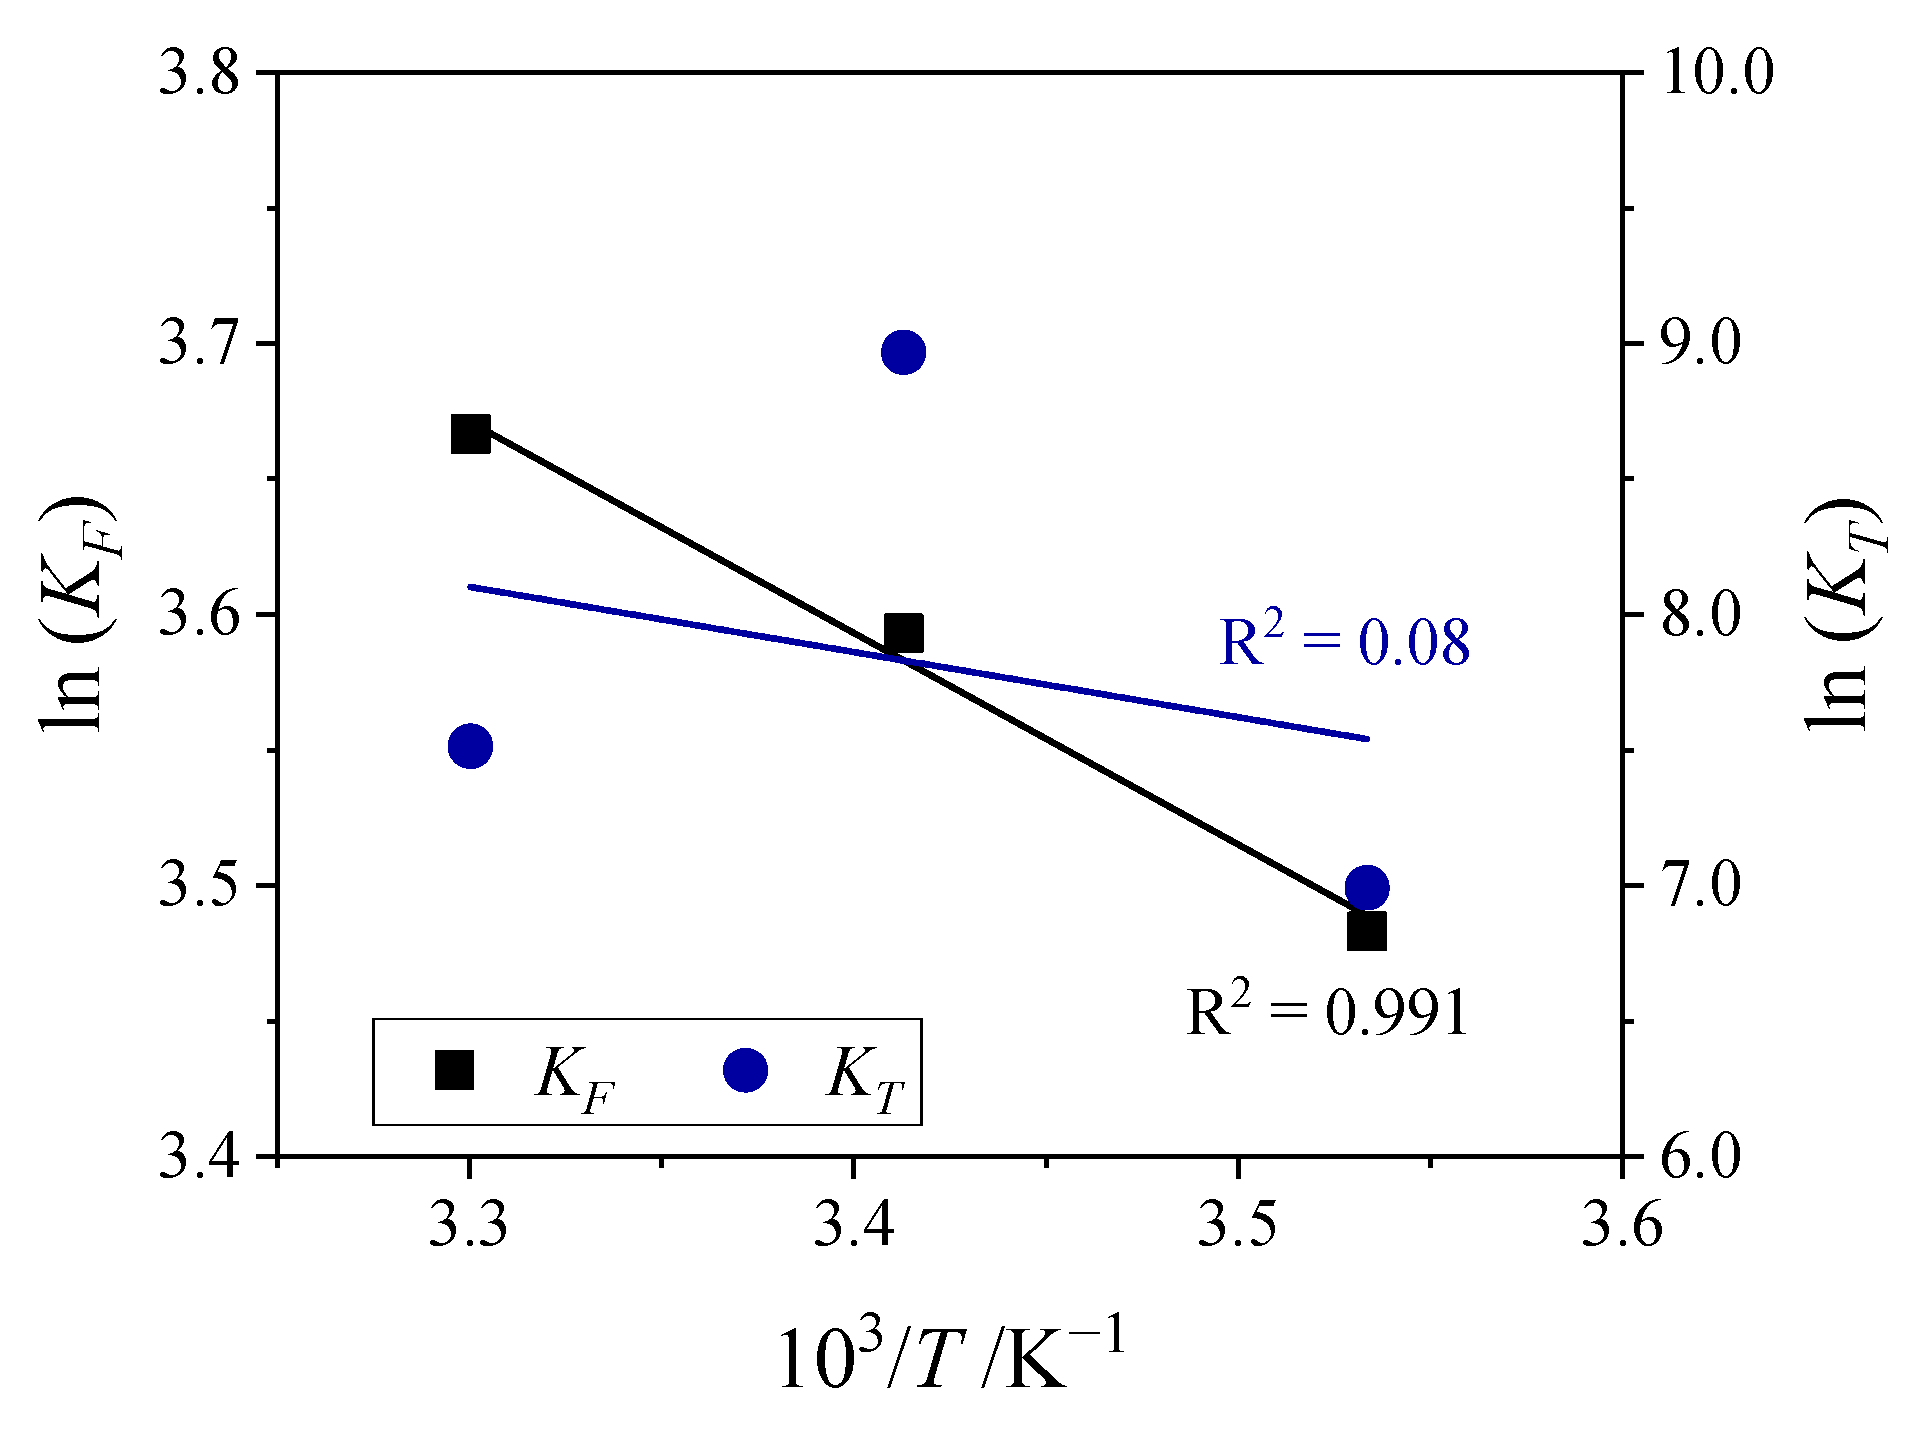
According to Equation (16), the slope of the linear plot of ln Ki versus 1/T corresponds to the isosteric enthalpy of adsorption. The linearity of this type of plot also suggests that the model possesses not only mathematical adequacy but also physical-chemical significance.
Figure 6 presents the van’t Hoff plot for the selected isotherm constants, KF (Freundlich) and KT (Temkin). As shown, the evolution of the Freundlich constant, KF, follows the expected linear trend described by Equation (16), yielding a high coefficient of determination (R2 of 0.991), which supports its validity as a descriptor of the thermodynamic behavior of the adsorption process. In contrast, although the Temkin constant, KT, can mathematically reproduce the experimental variation, the resulting parameters lack physical significance, as reflected in the poor fit (R2 of 0.08). Therefore, based on these findings, the Freundlich isotherm model is selected as the most appropriate for describing the physicochemical adsorption process in this system.
From Figure 6, the adsorption enthalpy can be determined from the slope of the Freundlich van’t Hoff plot using Equation (16). The calculated enthalpy of adsorption is 6.5 kJ mol−1, which falls within the typical range reported for similar materials (5.6–11.7 kJ mol−1) [25]. This positive value confirms the endothermic nature of the global process, implying that phosphorus removal is favored at higher temperatures, consistent with the observed increase in retention capacity.
Regarding the temperature dependence of the Freundlich exponent (1/n), which reflects adsorption intensity, no clear trend is observed. The parameter fluctuates around an average value of 0.109. This low value of 1/n is indicative of a strong affinity between the adsorbent and the adsorbate, supporting efficient adsorption even at low equilibrium concentrations, as previously discussed.

3.3.2. Effect of Adsorbent Dose

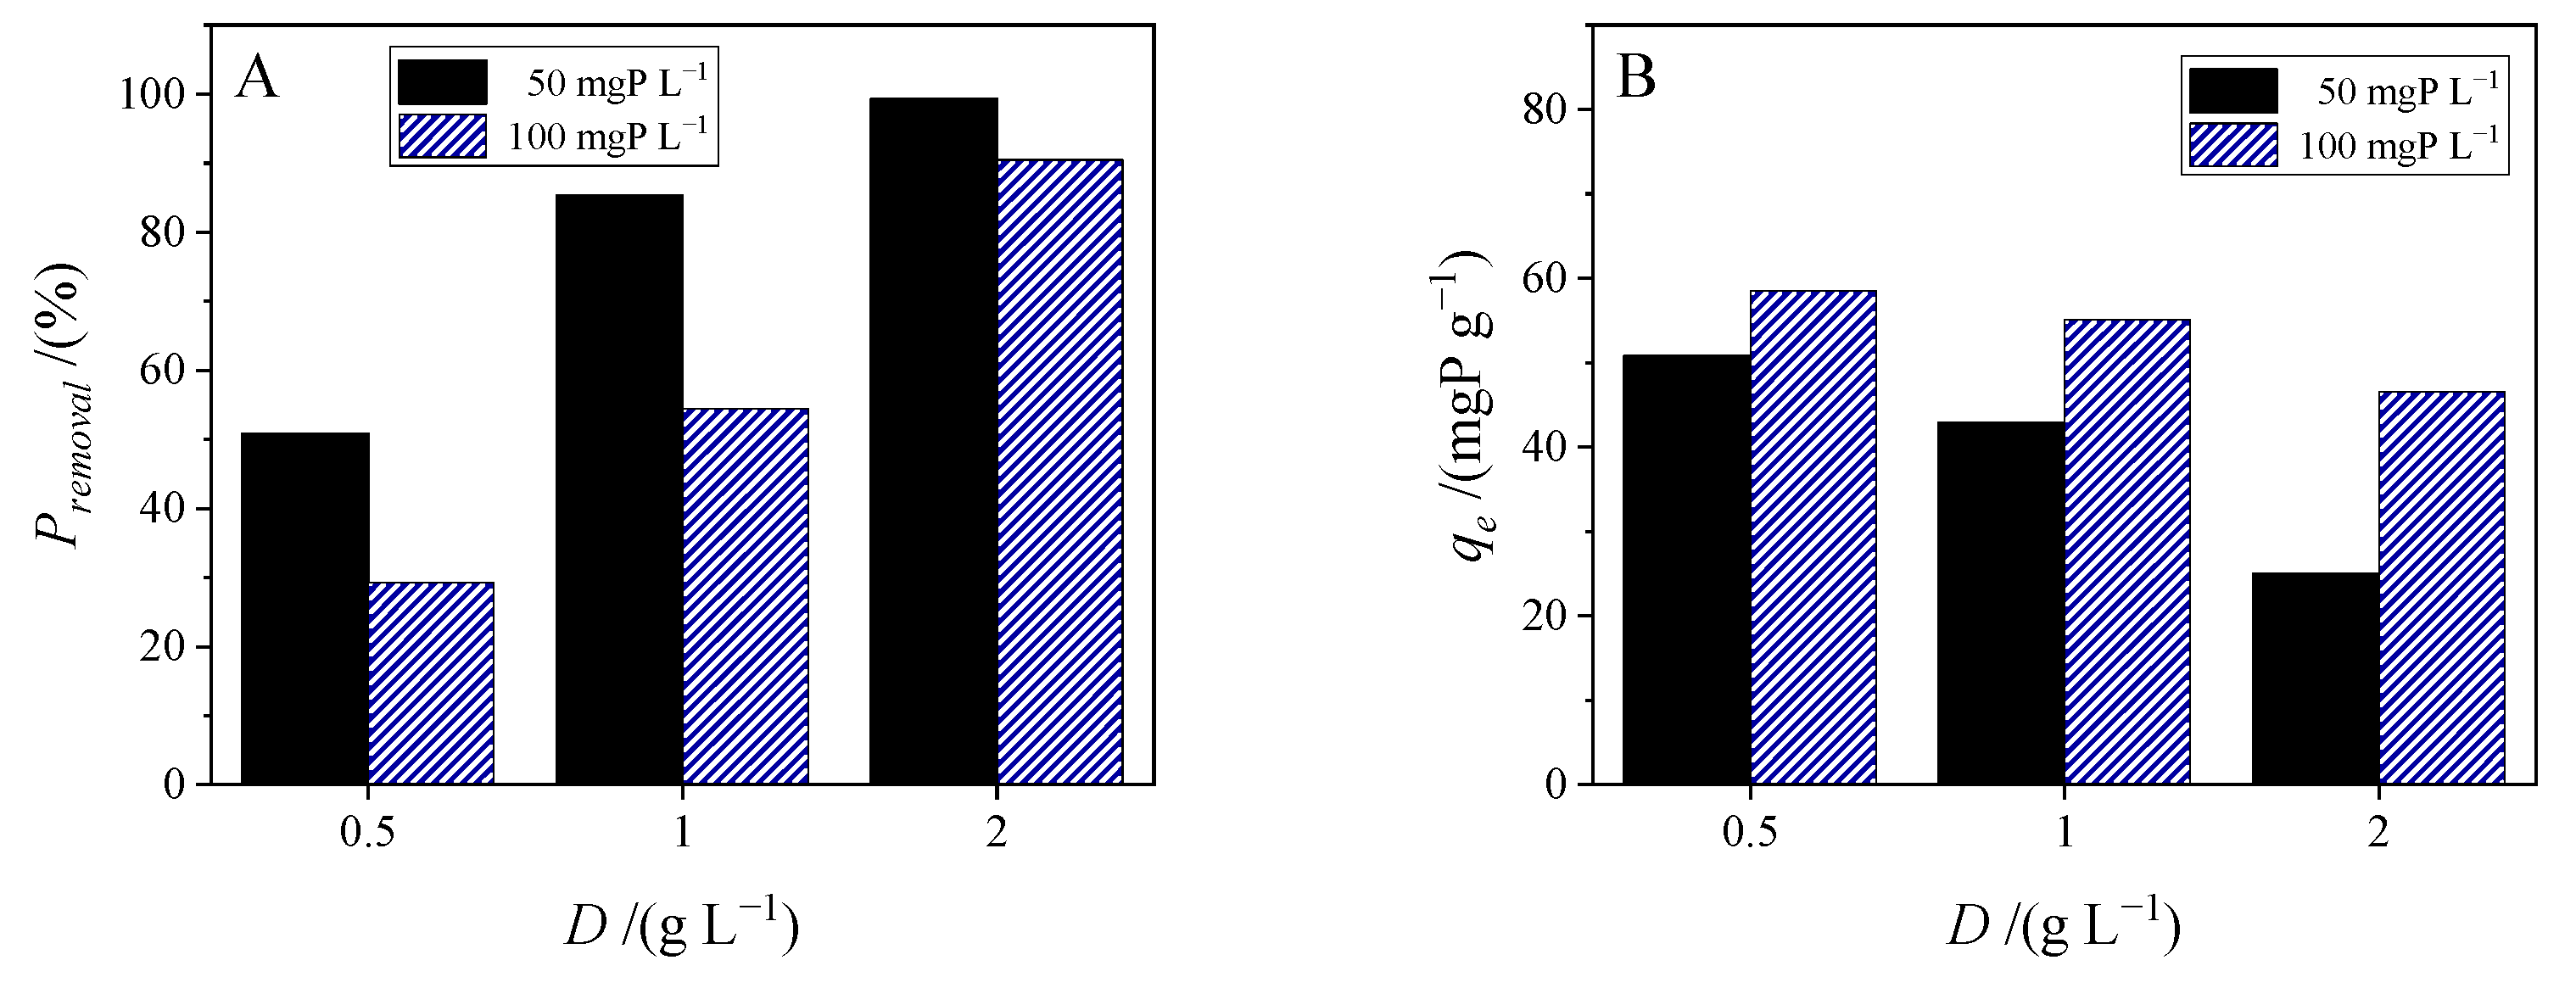
The effect of adsorbent dose on phosphorus removal is shown in Figure 7, where three doses (0.5 g L−1, 1.0 g L−1, and 2.0 g L−1) were evaluated. For each dose, two initial phosphorus concentrations (50 mgP L−1 and 100 mgP L−1) were used to enable a comparative study of the adsorption performance. For both initial phosphorus concentrations an increase in adsorbent dose leads to a corresponding increase in phosphorus removal (Figure 7A), approaching 100% at higher doses. This behavior is expected, as a greater amount of adsorbent provides more active sites for adsorption, resulting in a lower equilibrium concentration and, consequently, higher removal efficiency.
These types of representations are commonly found in the literature for evaluating the effect of adsorbent dose; however, they should be interpreted with caution, as they can be misleading. One of the appropriate approaches to assess this effect is to determine the maximum adsorption capacity at different doses [25]. Nevertheless, when the adsorption isotherm does not exhibit a clear plateau, as observed in this study, analyzing the dose effect becomes more complex.
Figure 7B shows the adsorption capacity of POA for the two initial concentrations of phosphorus, 50 mg L−1 and 100 mg L−1, respectively. It is evident that adsorption capacity decreases with increasing dose, particularly at the lower initial concentration (solid black bars). This is because the equilibrium concentrations fall within the high-affinity region of the isotherm, where variations in adsorption capacity (qe) are more sensitive to dose changes. Therefore, comparisons should be made preferably under conditions where the equilibrium concentrations lie in the mid-to-high range of the isotherm (hatched blue bar), where the true effect of dose can be observed without being masked by the high initial affinity of the adsorbent.

3.3.3. Effect of pH on the Removal Process

The pH of the aqueous solution is a crucial parameter influencing adsorption processes, as it directly affects the ionization state and speciation of the adsorbate. To evaluate this effect, phosphate removal experiments were conducted using synthetic water containing 100 mgP L−1. The initial pH was adjusted as required using HCl or NaOH solutions, covering a range from approximately pH 2 to pH 10.
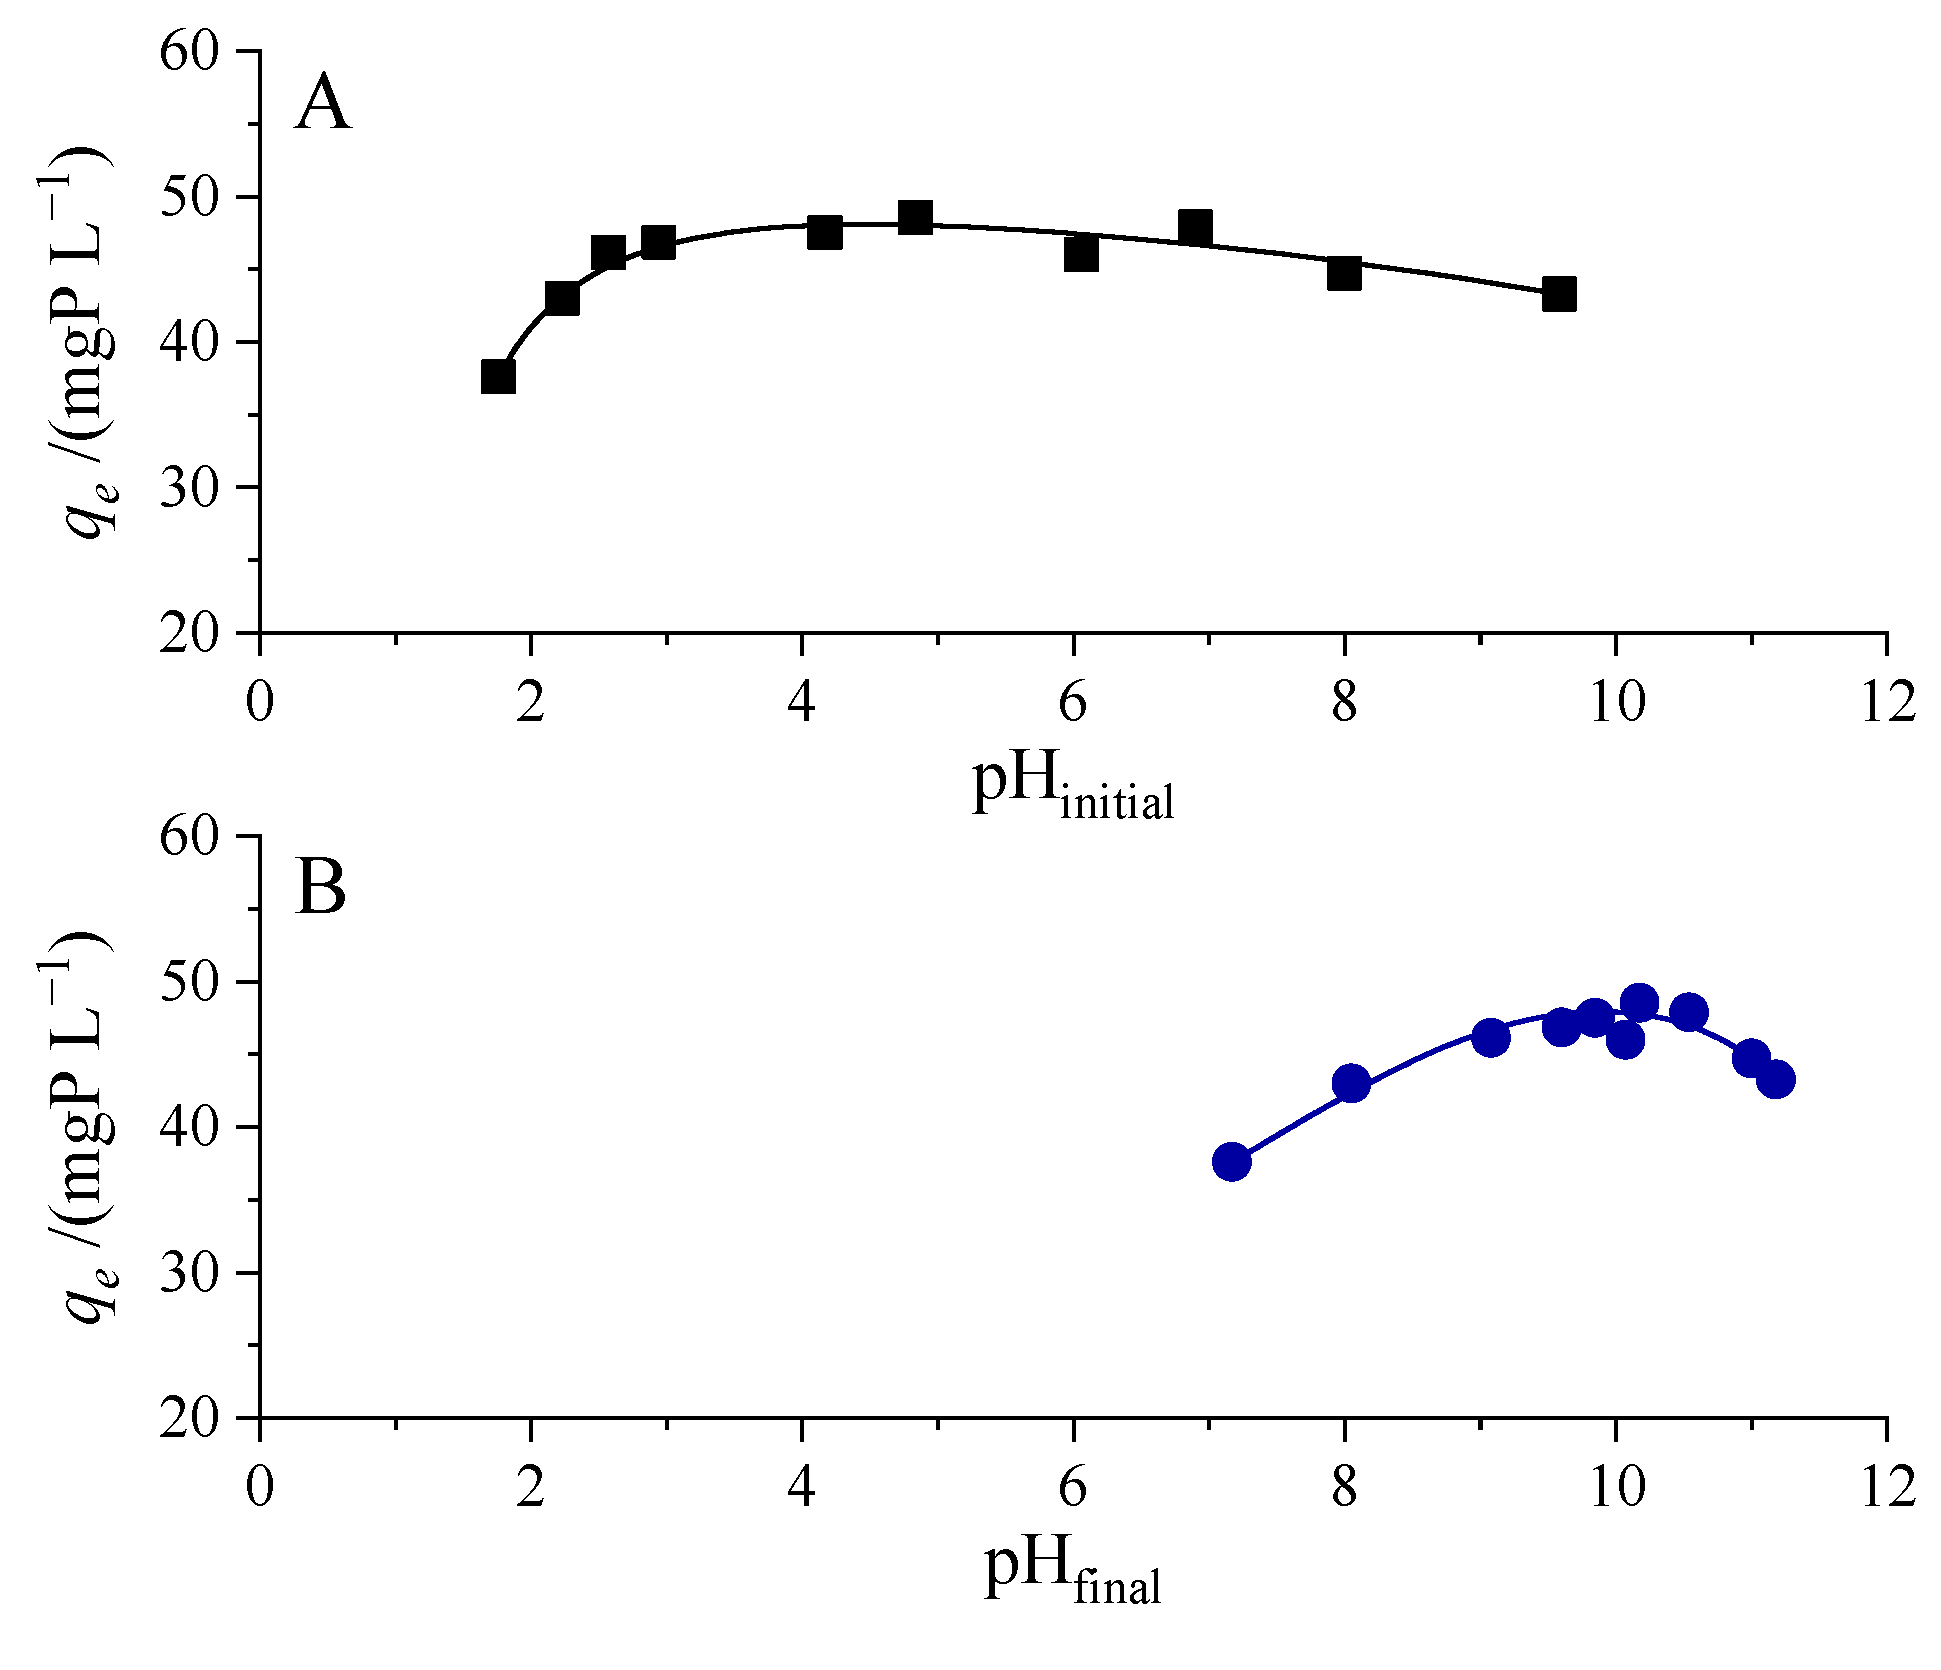
Figure 8A illustrates the effect of initial pH on the adsorption capacity of POA, while Figure 8B presents the corresponding final pH values reached after equilibrium for each initial pH tested, that is, for the same adsorption capacity values.
Due to the basic character of the material, an increase in pH is observed during the adsorption process, even in the presence of phosphorus. The final pH values mostly reached are typically within the range of 9.5 to 10.5, as shown in Figure 8B. Notably, this pH range corresponds to the highest phosphate removal capacities achieved. Outside this interval, the adsorption capacity decreases significantly.
As reported by various authors, adsorption is strongly influenced by both the ionic state and type of functional groups present on the adsorbent surface, as well as the speciation of the adsorbate in solution [57,58,59]. In this context, considering that phosphate exists in aqueous media in multiple ionic forms depending on pH, it is reasonable to hypothesize that POA exhibits a preferential interaction with a specific phosphate species.
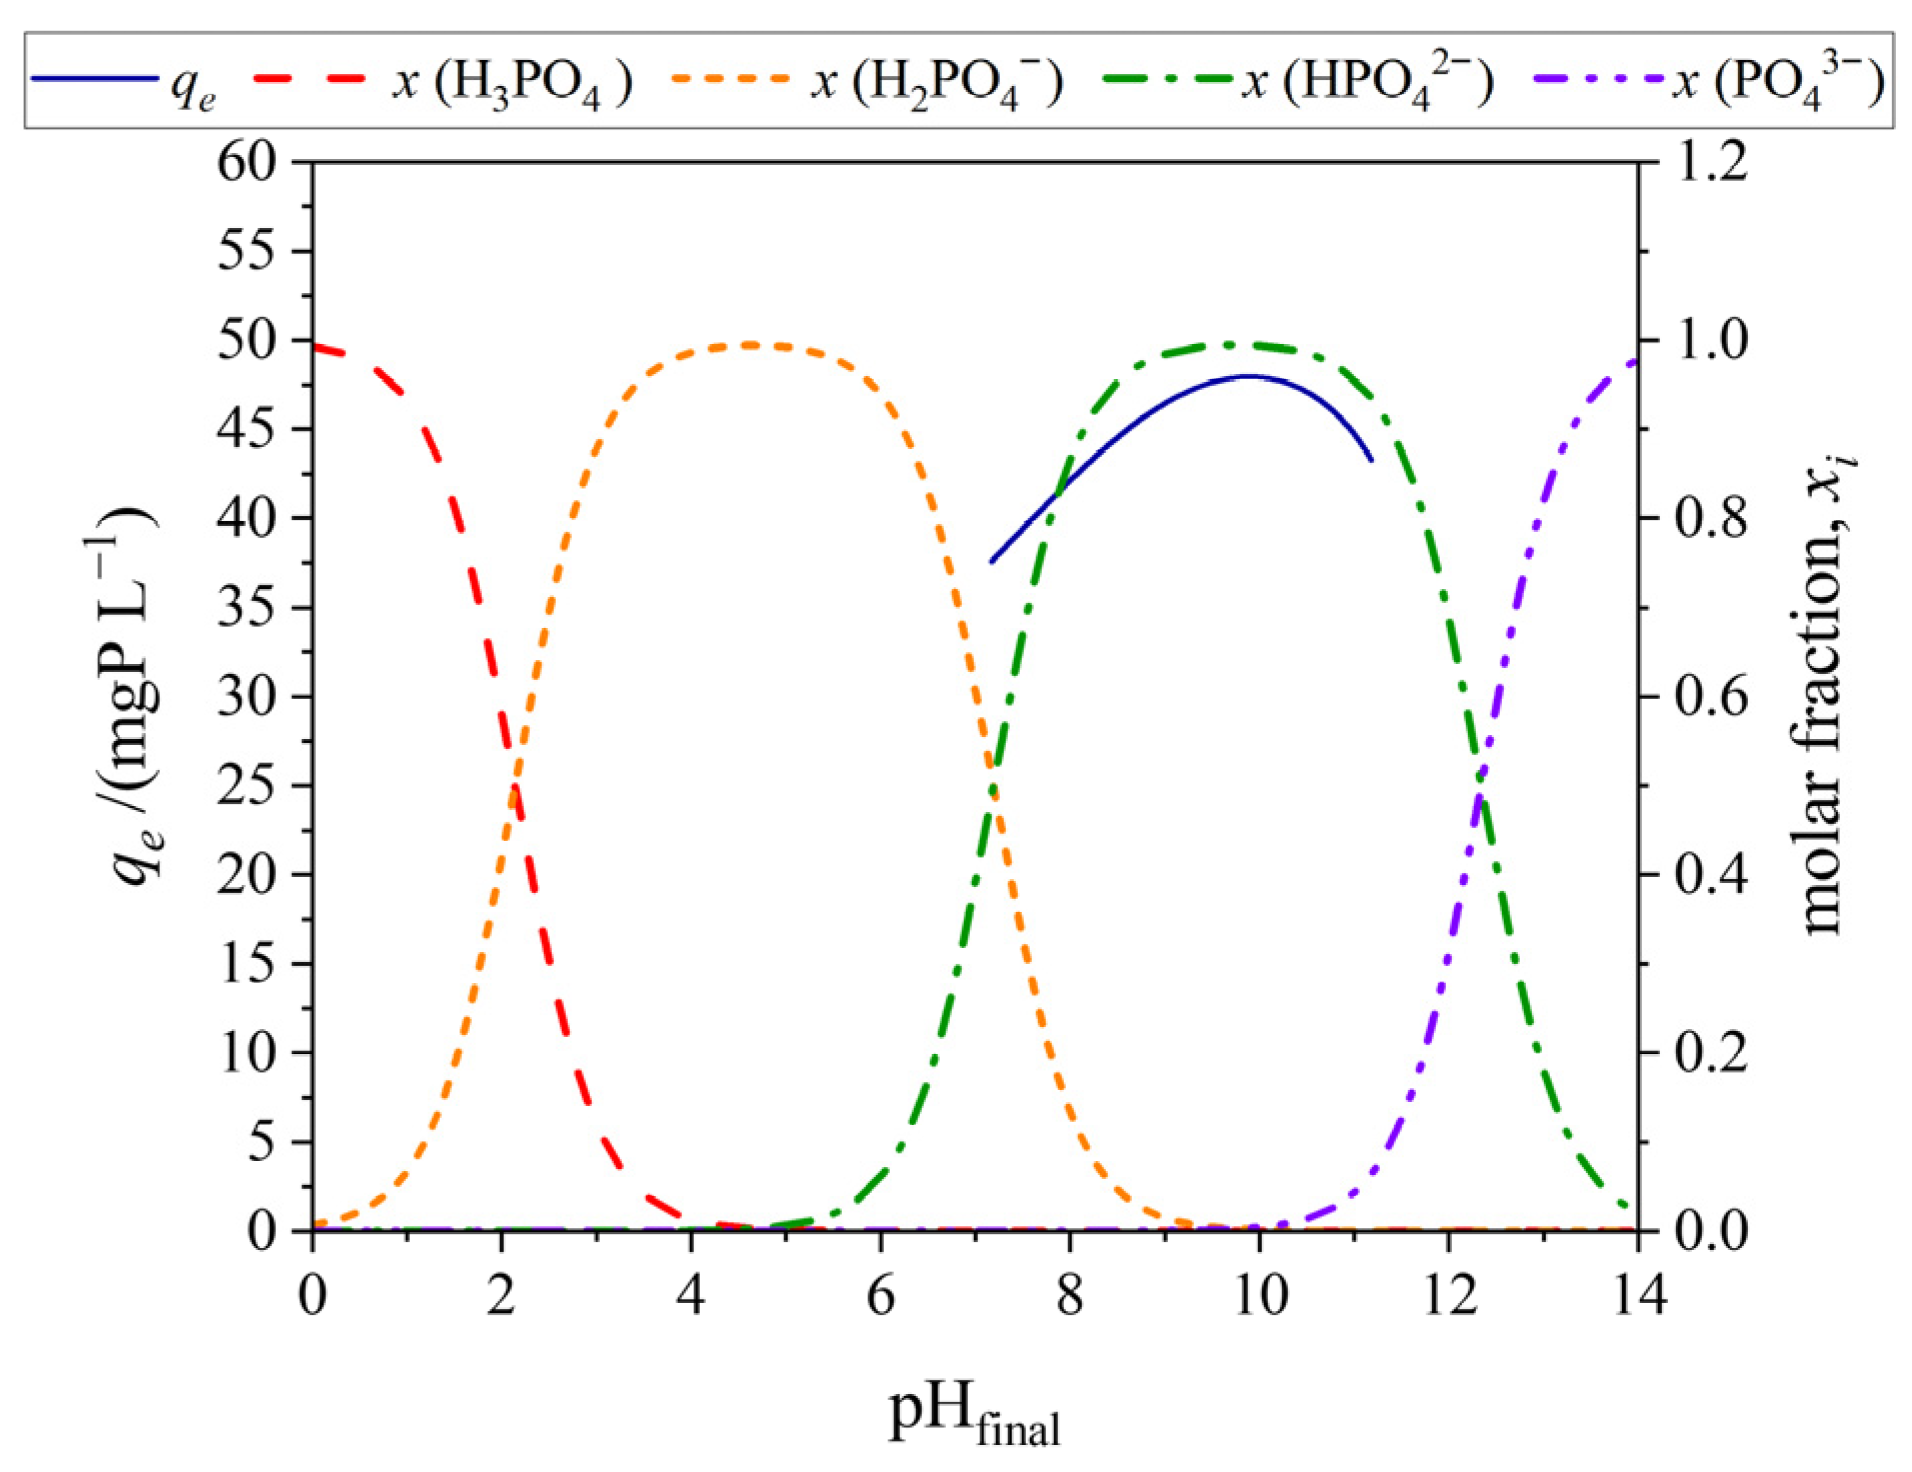
Figure 9 shows the phosphate speciation diagram as a function of pH, alongside the estimated adsorption capacity of the POA adsorbent at each corresponding final pH value (blue line from Figure 8B). The results reveal that maximum phosphate removal occurs when the dominant species in solution is the monohydrogen phosphate ion (HPO42−). As the concentration of this species decreases, either under more acidic or more alkaline conditions, a marked decline in removal is observed. This finding suggests that HPO42- is the primary species interacting with the adsorbent surface, playing a key role in the overall retention mechanism. At pH 8 and 11.5, where the HPO42− fraction decreases to approximately 0.9, the retention capacity drops by about 10%, likely due to changes in the binding affinity of the different phosphate species.

3.3.4. Phosphate Adsorption Performance

In this study, the phosphate removal capacity of Posidonia oceanica ash (POA) was assessed under various operational conditions, including variations in initial phosphate concentrations, absorbent dosage, temperature, and initial pH. The adsorption capacity ranged approximately from 30 mgP g−1 to 60 mgP g−1, depending on the specific conditions employed.
Table 4 presents a comparative overview of phosphate removal capacities reported in the literature for a variety of bio-based adsorbents, including the POA evaluated in this work. It can be observed that, compared to the direct use of Posidonia fibers or other agricultural fibers, the use of POA enables up to twelve times higher phosphorus removal. Similarly, when compared to ashes derived from plant or biological waste, POA exhibits more than twice the capacity of the best-performing of these materials. Even in comparison with carbon-based adsorbents, such as biochars from plant residues, the removal rates achieved with POA are significantly higher. These results demonstrate that POA outperforms many other biomass-derived materials, underscoring its potential as a cost-effective and efficient material for phosphorus recovery from aqueous systems.
Beyond its performance, it is noteworthy that POA is a byproduct of a combustion process in which its energy content is previously recovered, requiring only a simple washing pretreatment before use. In contrast, other waste-derived adsorbents that exhibit comparable or slightly higher adsorption capacities often require extensive and costly pretreatment (e.g., chemical activation, acid/base treatment, or pyrolysis), thereby compromising the overall economic and environmental viability of the process. Consequently, POA emerges as a promising alternative for sustainable phosphorus removal and resource recovery applications.
Finally, although the adsorption process with POA leads to basic final pH values (9.5–10.5), this limitation can be addressed through neutralization steps, such as those already implemented in wastewater treatment plants recovering struvite or calcium phosphates. Considering that the material has not been chemically modified or activated, the additional cost of neutralization may be offset by the absence of activation stages required for other adsorbents with similar performance, further supporting the practical feasibility of the proposed solution.

3.4. Leaching-Desorption Performance

Although the regeneration and reuse of the phosphorus-saturated POA may be technically feasible, this strategy would require chemical reagents, such as alkaline or saline solutions, to desorb the retained phosphorus. The use of such chemicals could not only increase operational costs but also lead to the partial dissolution of the active mineral phases responsible for phosphate adsorption. Therefore, an alternative and more sustainable management strategy is proposed: the direct agricultural application of POA-P as a phosphorus-enriched fertilizer.
This valorization pathway enhances the economic and environmental viability of the treatment process by avoiding costly regeneration steps and closing the material loop through a circular use of waste-derived resources. Given the basic nature of POA, as previously discussed in Section 3.1, this material is particularly suitable for acidic soils, where it could simultaneously supply essential nutrients and improve soil pH conditions.
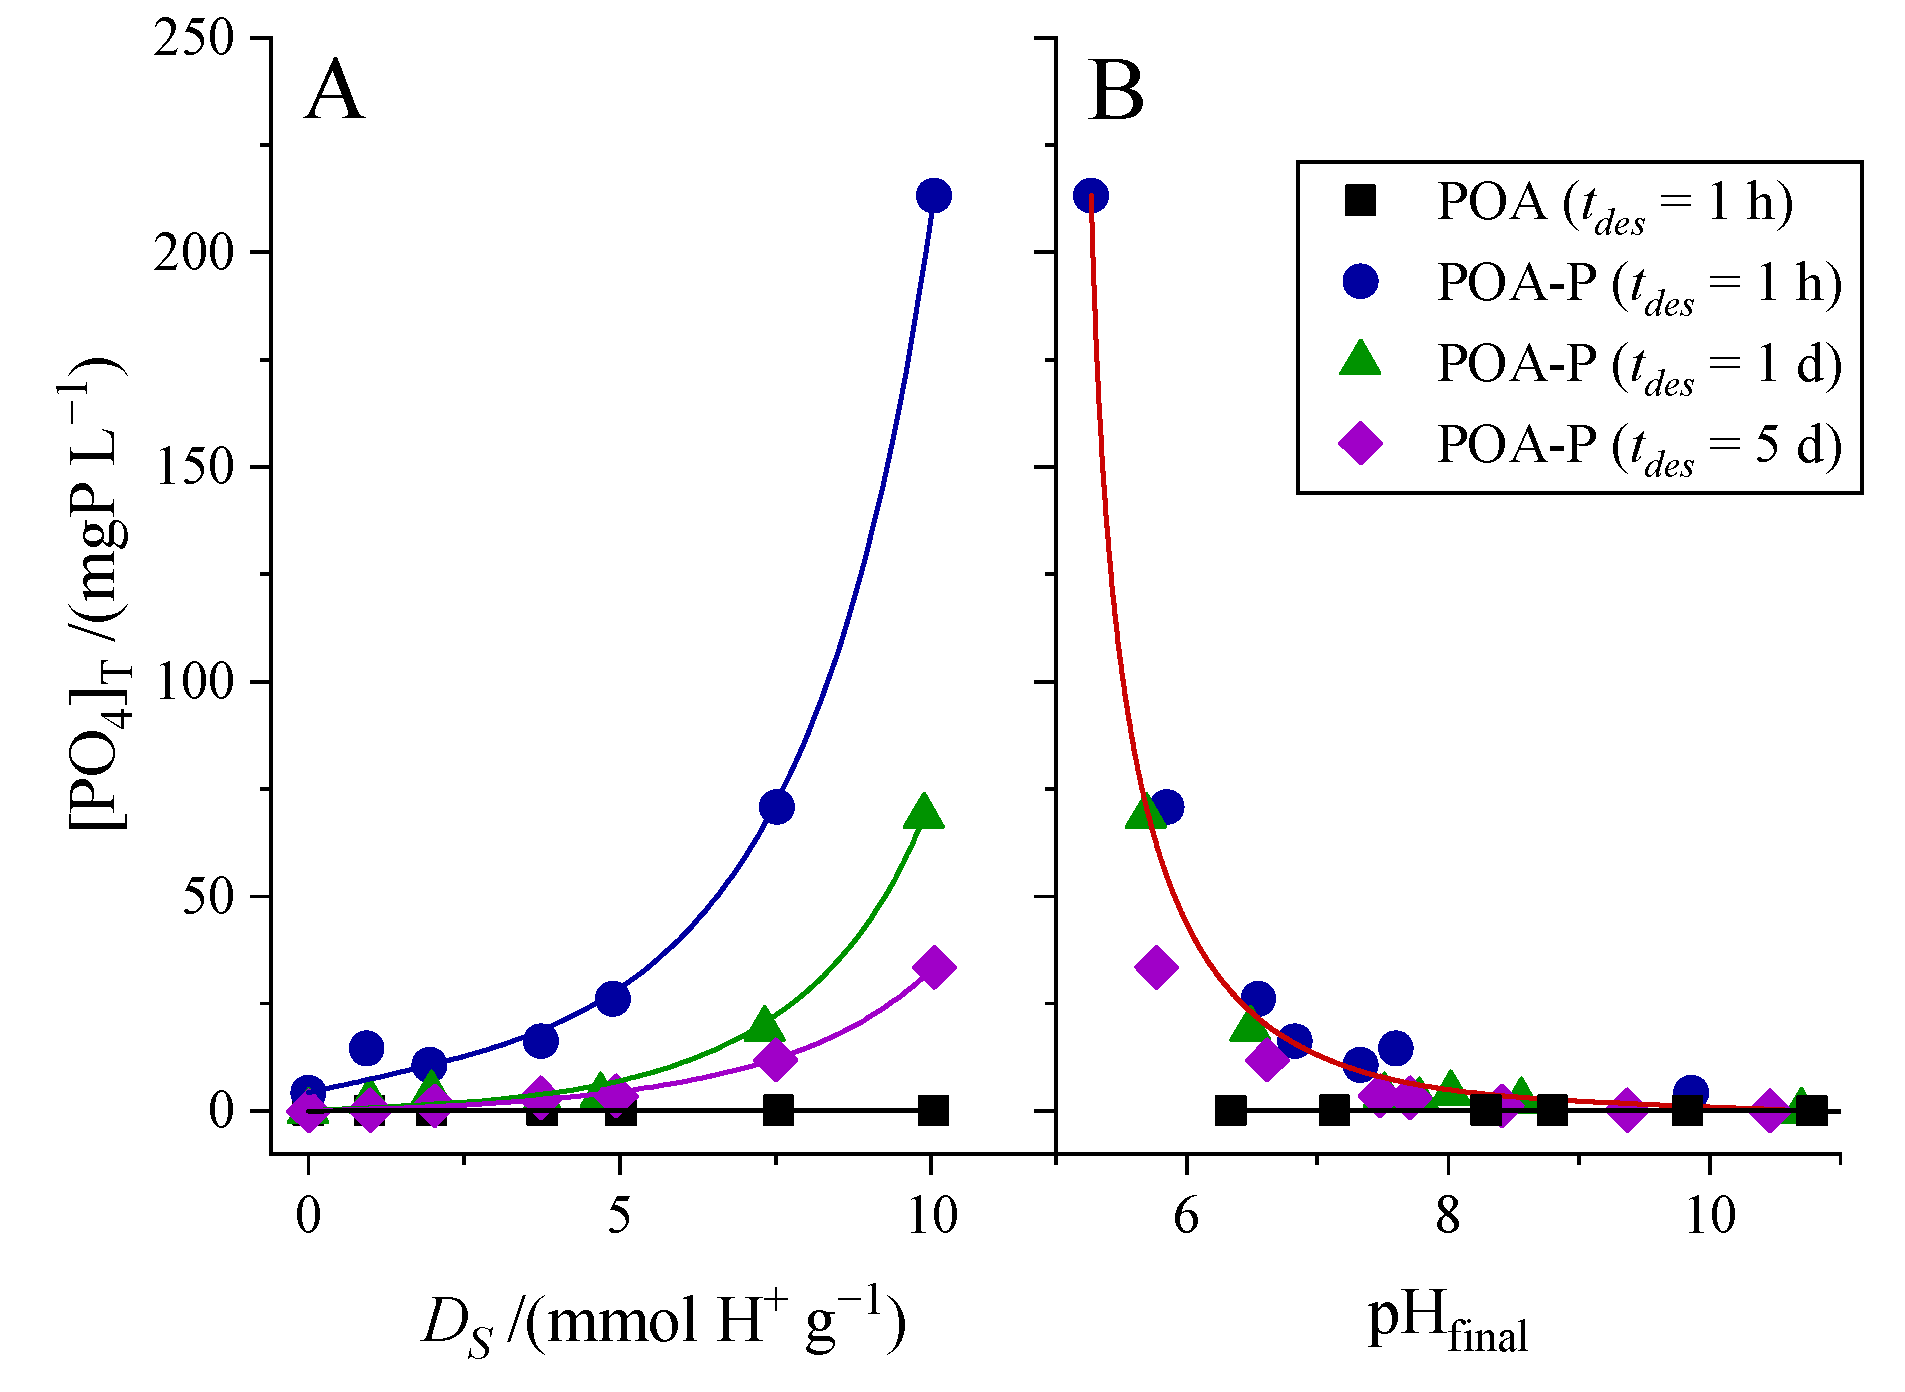
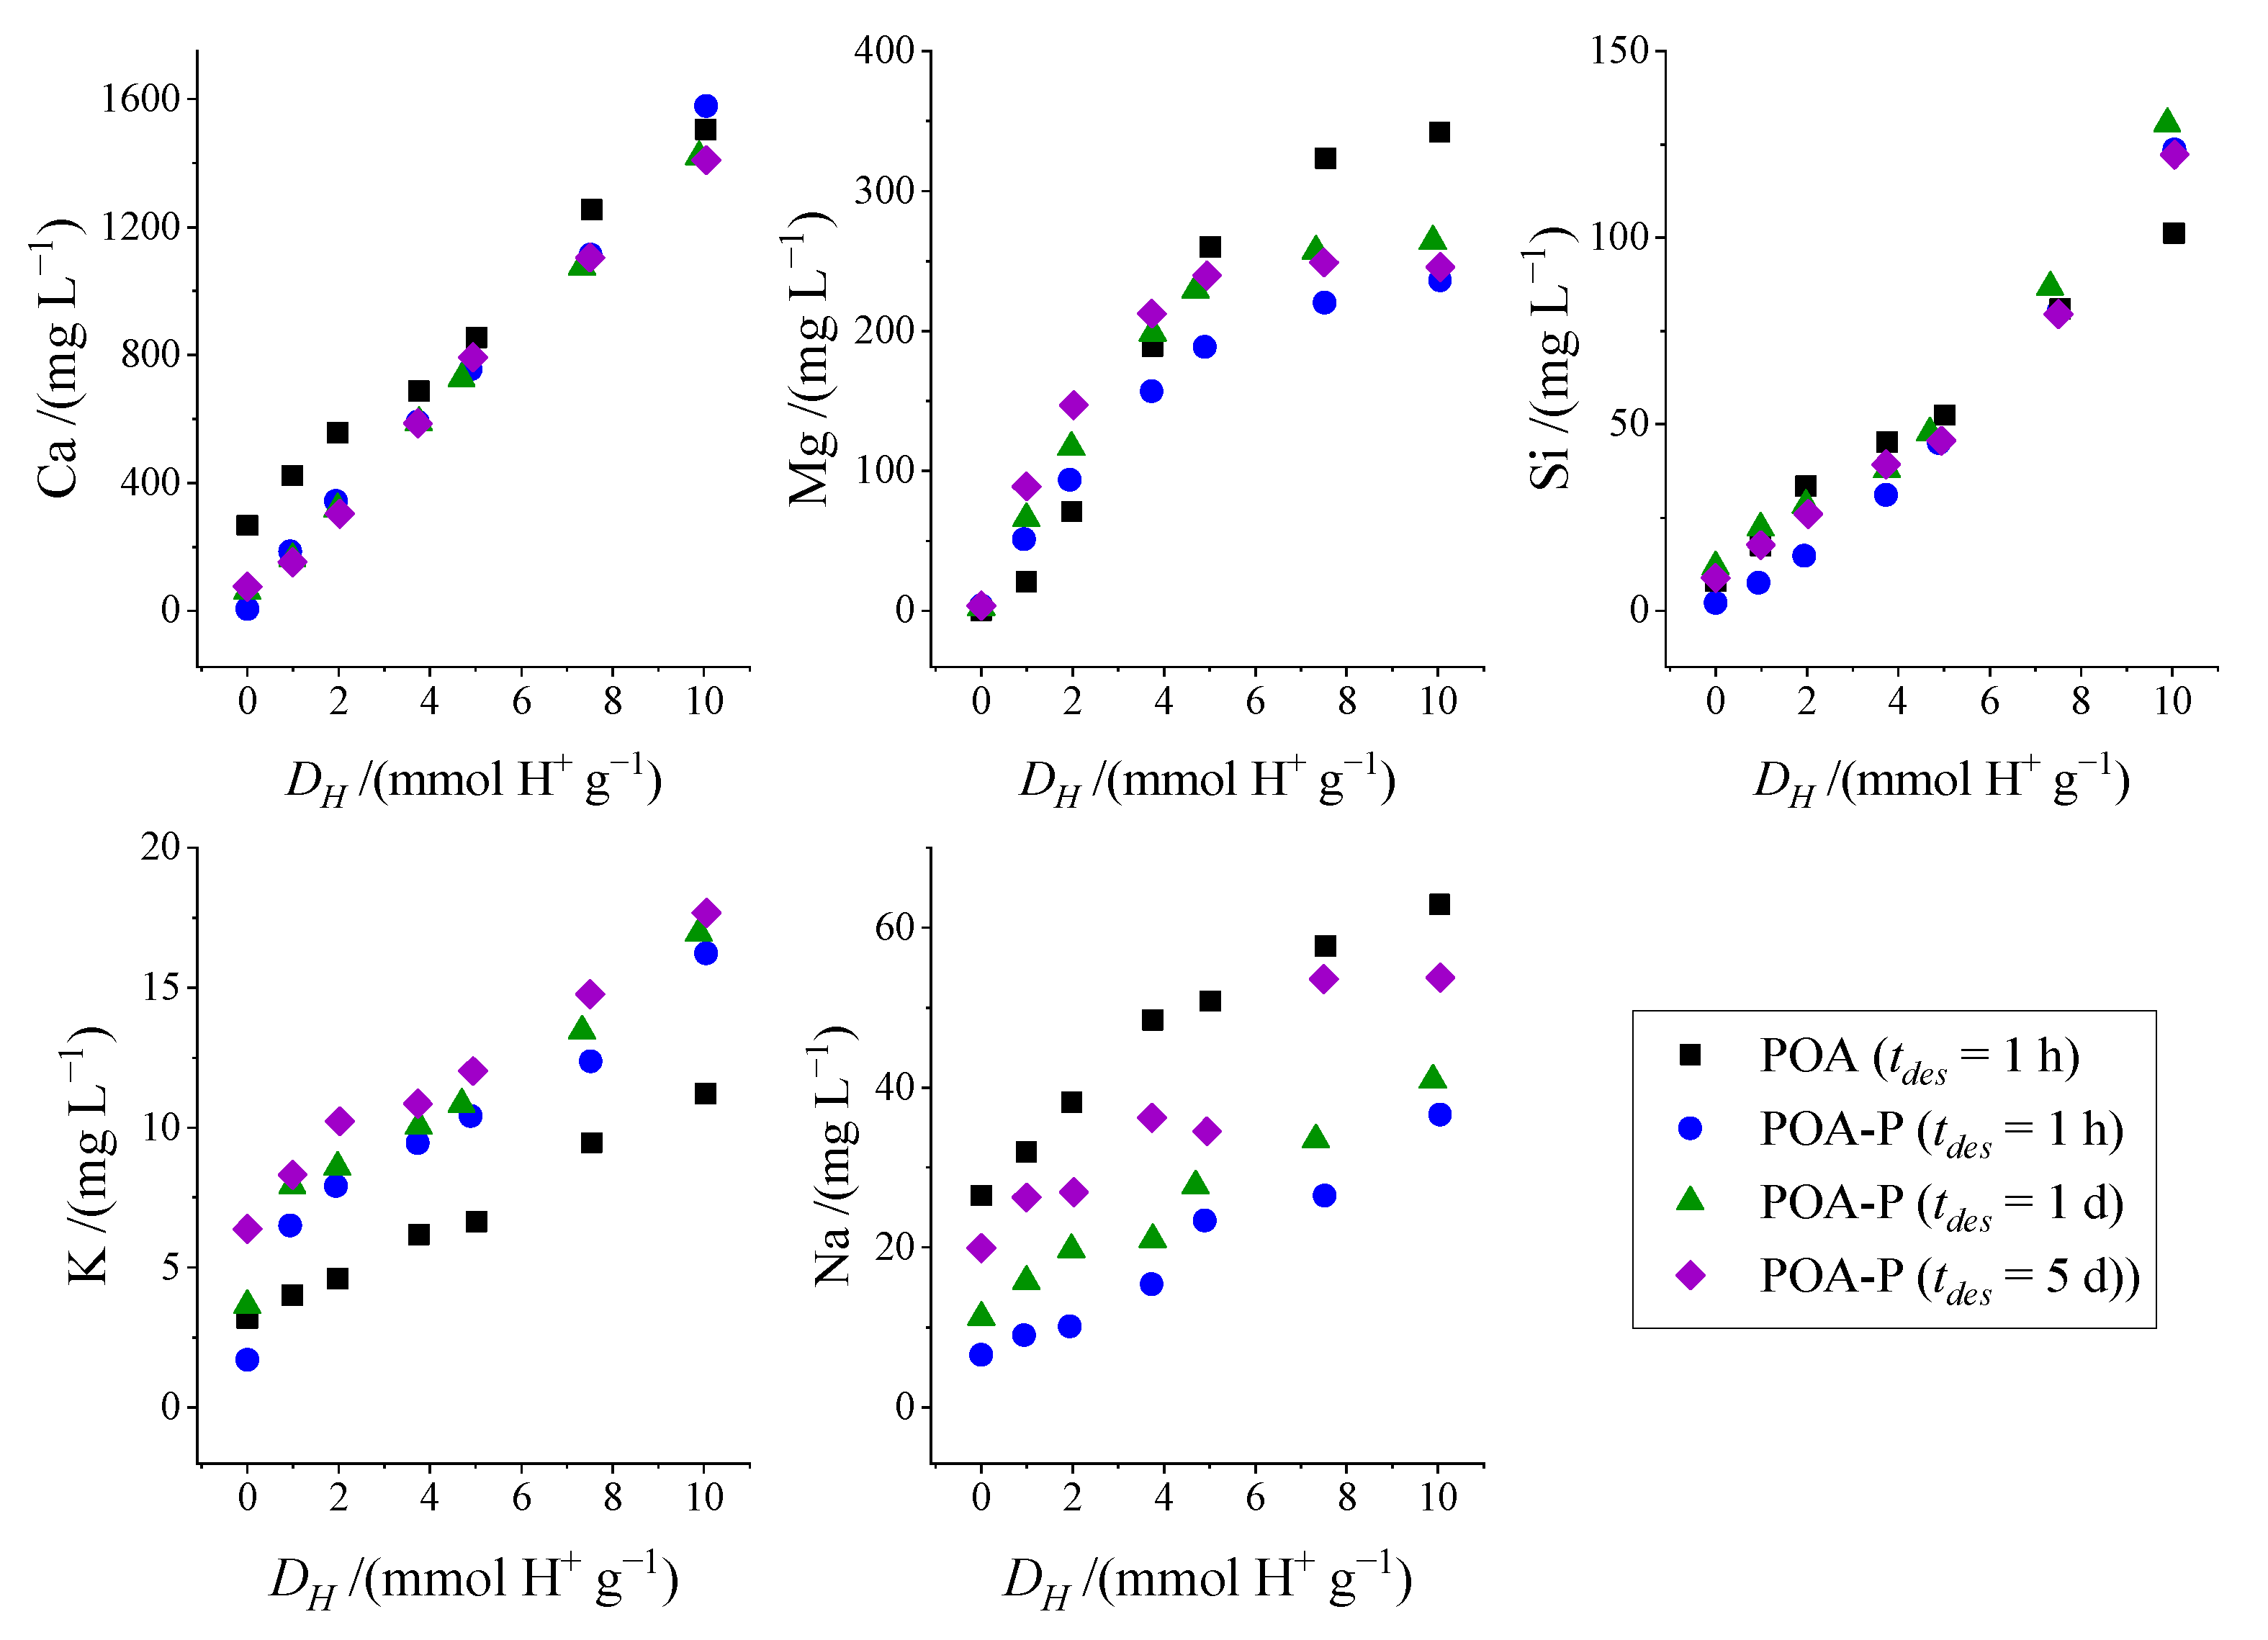
To further explore the stability and potential release of phosphorus from POA-P under relevant environmental conditions, a leaching-desorption test was performed. Figure 10 illustrates the phosphate release behavior of both the phosphorus-saturated ash (POA-P) and the original material (POA) in contact with deionized water under different conditions of contact time (tdes) and proton dose (DS).
The results show that using water alone as an extraction agent does not lead to significant phosphate desorption. Only in the test with a contact time of 1 h did the leachate reach a measurable phosphate concentration of 4.2 mgP L−1. However, this concentration decreased to zero as the contact time increased, indicating rapid stabilization of the system. This behavior is attributed to the high buffering capacity of the material, with the final pH rising from approximately 9.9 after one hour to 10.5–10.7 over longer durations. The original POA sample did not leach any detectable phosphorus under the same conditions, confirming that phosphate retention occurs only after the adsorption process and is not due to inherent soluble phosphorus content in the raw ash.
In any case, when POA-P interacts with soil, especially acidic soils, there will be a proton exchange between the acidic species in the soil and the material, which will neutralize the environment to varying degrees depending on soil characteristics. Several mechanisms may contribute to proton consumption and environmental neutralization. These include, firstly, the displacement of surface-associated cations during phosphate release, and secondly, the partial dissolution of the POA-P silicate framework, particularly under low pH conditions. In this context, phosphorus leaching was studied at different doses of externally added protons (i.e., initially added to the extractant). Since the system evolves over time, contact time was also considered.
A preliminary conclusion from Figure 10B is that, as the final pH of the suspension becomes more acidic, the concentration of released phosphorus increases, regardless of the contact time applied. Therefore, the environmental pH will directly influence leaching. For instance, at a final pH of 7, the phosphorus concentration reached 11.5 mgP L−1.
The effect of contact time is illustrated in Figure 10A. After 1 h of contact, the phosphorus concentration as a function of the added proton dose reached maximum values, with concentrations as high as 213 mgP L−1 at a proton dose of 10 mmol g−1. The maximum leached amount corresponds to approximately 45% of the total phosphorus retained during the adsorption stage. This indicates a high proportion of available phosphorus that could be utilized by plants.
However, phosphorus concentration decreases with increasing contact time. This is due to the system’s evolving pH over time, which eventually stabilizes at a final equilibrium value and possibly slow re-equilibration processes, such as re-adsorption or precipitation. In any case, given the high availability of phosphorus observed, and understanding phosphorus release as an equilibrium process, it can be assumed that release will be driven by demand from surrounding species. Thus, POA-P can be considered a phosphorus reservoir that gradually releases its content in response to environmental needs.
Figure 11 shows the leaching behavior of other cations present in the extract. The following cations present in the Posidonia ash composition were analyzed: calcium, magnesium, silicon, potassium, sodium, iron, and aluminum. However, the concentrations of Al and Fe were negligible at any acid dose applied. The minimal presence of iron and aluminum in leachate solutions, even under acidic conditions, indicates low mobility of these metals, possibly incorporated in the form of stable amorphous phases or poorly soluble oxides/hydroxides formed during combustion, which significantly reduces the risk of contamination and strengthens the environmental safety of POA-P agricultural applications.
Calcium and magnesium reached the highest concentrations, followed by silica. In addition to sodium, a portion of the potassium present in the solid was also leached, which is another beneficial element for soil applications. Except for sodium, whose concentration increases with contact time, the concentrations of the other analyzed cations appear to be relatively independent of this factor. The mechanisms governing the release of cations such as calcium, magnesium, potassium, and sodium indeed differ, particularly in the context of phosphate interactions. The interaction between phosphate and multivalent cations can lead to the formation of ternary surface complexes [69]. In contrast, sodium release is more pronounced in the absence of phosphate, as it is typically associated with basic surface sites as a counterion, while sodium may remain on the surface, due to the formation of ternary complexes, in the presence of phosphate.
Therefore, considering this material as a reservoir, these elements could be gradually released into the environment in response to demand, contributing to the long-term nutrient availability in soils.

4. Conclusions

Based on the results shown in this work, it can be concluded that ashes from Posidonia oceanica are very effective in removing phosphorus from aqueous solutions, with removal capacities falling among the highest reported for similar materials in the literature. The adsorption kinetics follow an Elovich model, which continues to remove phosphorus even after 96 h of contact. However, the material exhibits a high affinity for the adsorbate, achieving removals of around 75% within the first 12 h.
Phosphorus adsorption is an endothermic process, with adsorption capacity increasing with temperature. The Freundlich isotherm model accurately describes the observed behavior, indicating that the material is heterogeneous and exhibits a decrease in interaction strength as the coverage increases. The high affinity of the adsorbent for phosphorus enables high removal efficiencies even at low phosphorus concentrations.
Phosphorus removal is closely related to the final pH reached, with an optimal range between 9.5 and 10.5. Due to the basic nature of the adsorbent, the initial pH plays a key role in determining this outcome, along with the amount of adsorbent used. This pH range clearly corresponds to the predominance of the monoprotonated phosphate species, which appears to be critical in this removal process.
Finally, it has been demonstrated that the phosphorus retained by the adsorbent can be leached, suggesting that the material could also function as a fertilizer. Given its basic character, it would be more suitable for application in acidic soils, where it could also act as a neutralizer of that acidity. A higher level of acid exchange increases the availability of the various ions present in the material.
Future work should address the performance of this material under more realistic conditions, including the presence of natural organic matter and competing ions, in order to further validate its applicability and advance the development of the proposed solution.
This study highlights the innovative use of Posidonia oceanica ash as a novel adsorbent with superior performance compared to similar materials, offering a promising contribution to nutrient recovery and waste valorization strategies within the circular economy framework.

Author Contributions

Conceptualization, J.M., J.A.G. and A.E.P.; methodology, J.M. and J.A.G.; validation, J.M., J.A.G. and A.E.P.; formal analysis, J.M. and J.A.G.; investigation, J.M. and J.A.G.; resources, J.M. and A.E.P.; data curation, J.M., J.A.G. and A.E.P.; writing—original draft preparation, J.M.; writing—review and editing, J.M., J.A.G. and A.E.P.; visualization, J.M.; supervision, J.M. and J.A.G.; project administration, J.M.; funding acquisition, J.M. and A.E.P. All authors have read and agreed to the published version of the manuscript.

Funding

This research was partially funded by the Generalitat Valenciana—Conselleria de Educación, Cultura, Universidades y Empleo, through project CIPROM/2024/50.

Data Availability Statement

Data is contained within the article. In any case, the dataset is available on request from the authors.

Acknowledgments

The authors would like to acknowledge all who have directly or indirectly helped in carrying out this study.

Conflicts of Interest

The authors declare no conflicts of interest.

Abbreviations

The following abbreviations are used in this manuscript:
OECDOrganization for Economic Cooperation and Development
POPosidonia oceanica fiber
POAPosidonia oceanica ash
POA-PPhosphorus-saturated Posidonia oceanica ash
ICPInductively Coupled Plasma
OESOptical Emission Spectrometry
SEMScanning Electron Microscopy
PZCPoint of Zero Charge
PXRDPowder X-ray diffraction
TGAThermogravimetric analyses
DTADifferential thermal analyses

References

  1. Vigiak, O.; Udías, A.; Grizzetti, B.; Zanni, M.; Aloe, A.; Weiss, F.; Hristov, J.; Bisselink, B.; de Roo, A.; Pistocchi, A. Recent Regional Changes in Nutrient Fluxes of European Surface Waters. Sci. Total Environ. 2023, 858, 160063. [Google Scholar] [CrossRef]
  2. Fadiran, A.O.; Dlamini, S.C.; Mavuso, A. A Comparative Study of the Phosphate Levels in Some Surface and Ground Water Bodies of Swaziland. Bull. Chem. Soc. Ethiop. 2008, 22, 197–206. [Google Scholar] [CrossRef]
  3. Sellner, K.G.; Doucette, G.J.; Kirkpatrick, G.J. Harmful Algal Blooms: Causes, Impacts and Detection. J. Ind. Microbiol. Biotechnol. 2003, 30, 383–406. [Google Scholar] [CrossRef] [PubMed]
  4. Wilkinson, G.M.; Johnson, R.A. Eutrophication of Freshwater and Coastal Ecosystems. Encycl. Sustain. Technol. Second Ed. 2024, 2, 710–721. [Google Scholar] [CrossRef]
  5. Esfandi, F.; Mahvi, A.H.; Mosaferi, M.; Armanfar, F.; Hejazi, M.A.; Maleki, S. Assessment of Temporal and Spatial Eutrophication Index in a Water Dam Reservoir. Glob. J. Environ. Sci. Manag. 2018, 4, 153–166. [Google Scholar] [CrossRef]
  6. Moon, J.Y.; Lee, K.; Tanhua, T.; Kress, N.; Kim, I.N. Temporal Nutrient Dynamics in the Mediterranean Sea in Response to Anthropogenic Inputs. Geophys. Res. Lett. 2016, 43, 5243–5251. [Google Scholar] [CrossRef]
  7. Zhu, F.; Cakmak, E.K.; Cetecioglu, Z. Phosphorus Recovery for Circular Economy: Application Potential of Feasible Resources and Engineering Processes in Europe. Chem. Eng. J. 2023, 454, 140153. [Google Scholar] [CrossRef]
  8. Cheng, M.; Shi, C.; Hao, L.; Wang, X.; Guo, X.; Liu, R.; Hao, X. Sustainable Development of Phosphorus Recovery: From a Product Perspective. Sustain. Prod. Consum. 2023, 41, 275–290. [Google Scholar] [CrossRef]
  9. Chirilă Băbău, A.M.; Micle, V.; Damian, G.E.; Sur, I.M. Lead and Copper Removal from Sterile Dumps by Phytoremediation with Robinia Pseudoacacia. Sci. Rep. 2024, 14, 9842. [Google Scholar] [CrossRef]
  10. Pergent-Martini, C.; Pergent, G.; Monnier, B.; Boudouresque, C.F.; Mori, C.; Valette-Sansevin, A. Contribution of Posidonia Oceanica Meadows in the Context of Climate Change Mitigation in the Mediterranean Sea. Mar. Environ. Res. 2021, 165, 105236. [Google Scholar] [CrossRef]
  11. Gómez-Pujol, L.; Orfila, A.; Álvarez-Ellacuría, A.; Terrados, J.; Tintoré, J. Posidonia Oceanica Beach-Cast Litter in Mediterranean Beaches: A Coastal Videomonitoring Study. J. Coast. Res. 2013, 65, 1768–1773. [Google Scholar] [CrossRef]
  12. Mnafki, R.; Morales, A.; Sillero, L.; Khiari, R.; Moussaoui, Y.; Labidi, J. Integral Valorization of Posidonia Oceanica Balls: An Abundant and Potential Biomass. Polymers 2024, 16, 164. [Google Scholar] [CrossRef] [PubMed]
  13. Restaino, O.F.; Giosafatto, C.V.L.; Mirpoor, S.F.; Cammarota, M.; Hejazi, S.; Mariniello, L.; Schiraldi, C.; Porta, R. Sustainable Exploitation of Posidonia Oceanica Sea Balls (Egagropili): A Review. Int. J. Mol. Sci. 2023, 24, 7301. [Google Scholar] [CrossRef] [PubMed]
  14. Hashim, K.S.; Ewadh, H.M.; Muhsin, A.A.; Zubaidi, S.L.; Kot, P.; Muradov, M.; Aljefery, M.; Al-Khaddar, R. Phosphate Removal from Water Using Bottom Ash: Adsorption Performance, Coexisting Anions and Modelling Studies. Water Sci. Technol. 2021, 83, 77–89. [Google Scholar] [CrossRef]
  15. Drapanauskaite, D.; Buneviciene, K.; Silva, M.; Slepetiene, A.; Baltrusaitis, J. Phosphate Removal from Simulated Wastewater Using Industrial Calcium-Containing Solid Waste. J. Environ. Chem. Eng. 2021, 9, 106575. [Google Scholar] [CrossRef]
  16. Carricondo Anton, J.M.; González Romero, J.A.; Mengual Cuquerella, J.; Turegano Pastor, J.V.; Oliver Villanueva, J.V. Alternative Use of Rice Straw Ash as Natural Fertilizer to Reduce Phosphorus Pollution in Protected Wetland Ecosystems. Int. J. Recycl. Org. Waste Agric. 2020, 9, 61–74. [Google Scholar] [CrossRef]
  17. Carricondo, J.M.; Oliver-Villanueva, J.V.; Turégano, J.V.; González, J.A.; Mengual, J. Use of Phragmites Australis for Controlling Phosphorus Contamination in Anthropogenic Wetland Ecosystems. Environ. Technol. 2021, 42, 3055–3064. [Google Scholar] [CrossRef]
  18. Bala, R.; Dhankhar, R.; Chhikara, S.K. Sustainable Phosphate Removal with Acid-Modified Fly Ash: Kinetic, Isothermal, and Thermodynamic Insights. Nat. Environ. Pollut. Technol. 2025, 24, B4242. [Google Scholar] [CrossRef]
  19. Abbas, M.N. Phosphorus Removal from Wastewater Using Rice Husk and Subsequent Utilization of the Waste Residue. Desalin. Water Treat. 2015, 55, 970–977. [Google Scholar] [CrossRef]
  20. Karageorgiou, K.; Paschalis, M.; Anastassakis, G.N. Removal of Phosphate Species from Solution by Adsorption onto Calcite Used as Natural Adsorbent. J. Hazard. Mater. 2007, 139, 447–452. [Google Scholar] [CrossRef]
  21. Zhang, Z.; Xu, C.; Cheng, G.; Von Lau, E. Towards Carbon Neutrality: A Comprehensive Study on the Utilization and Resource Recovery of Coal-Based Solid Wastes. Int. J. Coal Sci. Technol. 2025, 12, 34. [Google Scholar] [CrossRef]
  22. Kim, J.A.; Vijayaraghavan, K.; Reddy, D.H.K.; Yun, Y.S. A Phosphorus-Enriched Biochar Fertilizer from Bio-Fermentation Waste: A Potential Alternative Source for Phosphorus Fertilizers. J. Clean. Prod. 2018, 196, 163–171. [Google Scholar] [CrossRef]
  23. Ganem, H.E.; Cohen, K.; Gildor, O.; Sha, M.; Wang, Q.; Radian, A. From Effluent to Fertilizer: Phosphorus Recovery and Reuse Using Granulated Iron-Oxyhydroxide-Montmorillonite Composites. Sci. Total Environ. 2025, 981, 179613. [Google Scholar] [CrossRef]
  24. ISO 18122:2022; Solid Biofuels—Determination of Ash Content. International Organization for Standardization: Geneva, Switzerland, 2022.
  25. González, J.A.; Mengual, J.; Palomares, A.E. Phosphorus Control and Recovery in Anthropogenic Wetlands Using Their Green Waste—Validation of an Adsorbent Mixture Model. Sustainability 2025, 17, 6153. [Google Scholar] [CrossRef]
  26. Rice, E.W.; Bridgewater, L.; Association, A.P.H.; Association, A.W.W.; Federation, W.E. Standard Methods for the Examination of Water and Wastewater; American Public Health Association: Washington, DC, USA, 2012; ISBN 9780875530130. [Google Scholar]
  27. UNE-EN 15958 2012; Aenor Fertilizers-Extraction of Water Soluble Phosphorus. European Committee for Standardization: Brussels, Belgium, 2012.
  28. Lagergren, S. Zur Theorie Der Sogenannten Adsorption Geloster Stoffe. Kungliga Svenska Ventenskapsakademiens. Handlinger 1898, 24, 1–39. [Google Scholar]
  29. Ho, Y.S.; McKay, G. Pseudo-Second Order Model for Sorption Processes. Process Biochem. 1999, 34, 451–465. [Google Scholar] [CrossRef]
  30. Aharoni, C.; Tompkins, F.C. Kinetics of Adsorption and Desorption and the Elovich Equation. Adv. Catal. 1970, 21, 1–49. [Google Scholar] [CrossRef]
  31. Kajjumba, G.W.; Emik, S.; Öngen, A.; Özcan, H.K.; Aydın, S. Modelling of Adsorption Kinetic Processes—Errors, Theory and Application. In Advanced Sorption Process Applications; Edebali, S., Ed.; IntechOpen: Rijeka, Croatia, 2018. [Google Scholar]
  32. Motulsky, H.; Christopoulos, A. Fitting Models to Biological Data Using Linear and Nonlinear Regression: A Practical Guide to Curve Fitting; Oxford University Press: Oxford, UK, 2004; ISBN 9780198038344. [Google Scholar]
  33. Langmuir, I. The Constitution and Fundamental Properties of Solids and Liquids. Part I. Solids. J. Am. Chem. Soc. 1916, 38, 2221–2295. [Google Scholar] [CrossRef]
  34. Freundlich, H. Über Die Adsorption in Lösungen. Zeitschrift für Phys. Chemie 1907, 57U, 385–470. [Google Scholar] [CrossRef]
  35. Temkin, M.I. Adsorption Equilibrium and the Kinetics of Processes on Nonhomogeneous Surfaces and in the Interaction between Adsorbed Molecules. Zh. Fiz. Chim. 1941, 15, 296–332. [Google Scholar]
  36. Bolster, C.H.; Hornberger, G.M. On the Use of Linearized Langmuir Equations. Soil Sci. Soc. Am. J. 2007, 71, 1796–1806. [Google Scholar] [CrossRef]
  37. Tran, H.N.; You, S.J.; Chao, H.P. Effect of Pyrolysis Temperatures and Times on the Adsorption of Cadmium onto Orange Peel Derived Biochar. Waste Manag. Res. 2016, 34, 129–138. [Google Scholar] [CrossRef] [PubMed]
  38. Tran, H.N.; You, S.J.; Hosseini-Bandegharaei, A.; Chao, H.P. Mistakes and Inconsistencies Regarding Adsorption of Contaminants from Aqueous Solutions: A Critical Review. Water Res. 2017, 120, 88–116. [Google Scholar] [CrossRef] [PubMed]
  39. Plis, A.; Lasek, J.; Skawińska, A.; Kopczyński, M. Thermo-Chemical Properties of Biomass from Posidonia Oceanica. Chem. Pap. 2014, 68, 879–889. [Google Scholar] [CrossRef]
  40. Plis, A.; Lasek, J.A.; Zuwała, J.; Yu, C.C.; Iluk, A. Combustion Performance Evaluation of Posidonia Oceanica Using TGA and Bubbling Fluidized-Bed Combustor (Batch Reactor). J. Sustain. Min. 2016, 15, 181–190. [Google Scholar] [CrossRef]
  41. Khiari, R.; Mhenni, M.F.; Belgacem, M.N.; Mauret, E. Chemical Composition and Pulping of Date Palm Rachis and Posidonia Oceanica—A Comparison with Other Wood and Non-Wood Fibre Sources. Bioresour. Technol. 2010, 101, 775–780. [Google Scholar] [CrossRef]
  42. Mencarelli, A.; Greco, R.; Cavalli, R.; Zilio, C.; Pighi, A.; Grigolato, S. Production and Quality Assessment of Pellets Made from Spruce Sawdust and Posidonia oceanica (L.) Delile. In Proceedings of the Biosystems Engineering Promoting Resilience to Climate Change-AIIA 2024-Mid-Term Conference, Padova, Italy, 17–19 June 2024; Sartori, L., Tarolli, P., Guerrini, L., Zuecco, G., Pezzuolo, A., Eds.; Springer Nature Switzerland: Cham, Switzerland, 2025; pp. 457–464. [Google Scholar]
  43. Jiang, H.; Lu, P.; Xue, Z.; Zhao, D.; Bu, C.; Ge, H.; Song, T. Prediction and Evaluation on Fuel Properties and Pyrolysis Characteristics of Combustible Industrial Solid Wastes. J. Energy Inst. 2022, 105, 232–241. [Google Scholar] [CrossRef]
  44. Voca, N.; Grubor, M.; Peter, A.; Kricka, T. Evaluation of Posidonia Oceanica Waste as a Biomass Source for Energy Generation. Bioenergy Res. 2019, 12, 1104–1112. [Google Scholar] [CrossRef]
  45. Boumanchar, I.; Charafeddine, K.; Chhiti, Y.; M’hamdi Alaoui, F.E.; Sahibed-dine, A.; Bentiss, F.; Jama, C.; Bensitel, M. Biomass Higher Heating Value Prediction from Ultimate Analysis Using Multiple Regression and Genetic Programming. Biomass Convers. Biorefinery 2019, 9, 499–509. [Google Scholar] [CrossRef]
  46. Ighalo, J.O.; Adeniyi, A.G. A Mini-Review of the Morphological Properties of Biosorbents Derived from Plant Leaves. SN Appl. Sci. 2020, 2, 509. [Google Scholar] [CrossRef]
  47. Li, M.; Liu, J.; Xu, Y.; Qian, G. Phosphate Adsorption on Metal Oxides and Metal Hydroxides: A Comparative Review. Environ. Rev. 2016, 24, 319–332. [Google Scholar] [CrossRef]
  48. Carricondo Anton, J.M.; Oliver-Villanueva, J.V.; Turégano Pastor, J.V.; Raigón Jiménez, M.D.; González Romero, J.A.; Mengual Cuquerella, J. Reduction of Phosphorous from Wastewater Through Adsorption Processes Reusing Wood and Straw Ash Produced in Bioenergy Facilities. Water Air Soil Pollut. 2020, 231, 128. [Google Scholar] [CrossRef]
  49. Largitte, L.; Pasquier, R. A Review of the Kinetics Adsorption Models and Their Application to the Adsorption of Lead by an Activated Carbon. Chem. Eng. Res. Des. 2016, 109, 495–504. [Google Scholar] [CrossRef]
  50. Zeng, L.; Li, X.; Liu, J. Adsorptive Removal of Phosphate from Aqueous Solutions Using Iron Oxide Tailings. Water Res. 2004, 38, 1318–1326. [Google Scholar] [CrossRef] [PubMed]
  51. Wu, F.C.; Tseng, R.L.; Juang, R.S. Characteristics of Elovich Equation Used for the Analysis of Adsorption Kinetics in Dye-Chitosan Systems. Chem. Eng. J. 2009, 150, 366–373. [Google Scholar] [CrossRef]
  52. Goh, K.H.; Lim, T.T. Geochemistry of Inorganic Arsenic and Selenium in a Tropical Soil: Effect of Reaction Time, PH, and Competitive Anions on Arsenic and Selenium Adsorption. Chemosphere 2004, 55, 849–859. [Google Scholar] [CrossRef] [PubMed]
  53. Zhao, H.; Cui, W.; Yang, Y.; Li, S.; Song, F.; Wang, M.; Shao, X.; Xu, X. Surfactant-Functionalized Fly Ash from Waste into Wealth: Collaboratively Scavenge of Heavy Metals and Antibiotics from Multi-Pollutant Wastewater. Sep. Purif. Technol. 2025, 375, 133862. [Google Scholar] [CrossRef]
  54. Sugiura, N. Further Analysts of the Data by Akaike’s Information Criterion and the Finite Corrections. Commun. Stat. Theory Methods 2007, 7, 13–26. [Google Scholar] [CrossRef]
  55. Burnham, K.P.; Anderson, D.R. Multimodel Inference: Understanding AIC and BIC in Model Selection. Sociol. Methods Res. 2004, 33, 261–304. [Google Scholar] [CrossRef]
  56. Burnham, K.P.; Anderson, D.R.; Huyvaert, K.P. AIC Model Selection and Multimodel Inference in Behavioral Ecology: Some Background, Observations, and Comparisons. Behav. Ecol. Sociobiol. 2011, 65, 23–35. [Google Scholar] [CrossRef]
  57. Mor, S.; Chhoden, K.; Ravindra, K. Application of Agro-Waste Rice Husk Ash for the Removal of Phosphate from the Wastewater. J. Clean. Prod. 2016, 129, 673–680. [Google Scholar] [CrossRef]
  58. Huang, W.; Wang, S.; Zhu, Z.; Li, L.; Yao, X.; Rudolph, V.; Haghseresht, F. Phosphate Removal from Wastewater Using Red Mud. J. Hazard. Mater. 2008, 158, 35–42. [Google Scholar] [CrossRef] [PubMed]
  59. Xiong, J.; He, Z.; Mahmood, Q.; Liu, D.; Yang, X.; Islam, E. Phosphate Removal from Solution Using Steel Slag through Magnetic Separation. J. Hazard. Mater. 2008, 152, 211–215. [Google Scholar] [CrossRef] [PubMed]
  60. Wahab, M.A.; Hassine, R.B.; Jellali, S. Posidonia oceanica (L.) Fibers as a Potential Low-Cost Adsorbent for the Removal and Recovery of Orthophosphate. J. Hazard. Mater. 2011, 191, 333–341. [Google Scholar] [CrossRef] [PubMed]
  61. Wahab, M.A.; Hassine, R.B.; Jellali, S. Removal of Phosphorus from Aqueous Solution by Posidonia oceanica Fibers Using Continuous Stirring Tank Reactor. J. Hazard. Mater. 2011, 189, 577–585. [Google Scholar] [CrossRef]
  62. Riahi, K.; Chaabane, S.; Thayer, B. Ben A Kinetic Modeling Study of Phosphate Adsorption onto Phoenix dactylifera L. Date Palm Fibers in Batch Mode. J. Saudi Chem. Soc. 2017, 21, S143–S152. [Google Scholar] [CrossRef]
  63. Jung, K.W.; Hwang, M.J.; Ahn, K.H.; Ok, Y.S. Kinetic Study on Phosphate Removal from Aqueous Solution by Biochar Derived from Peanut Shell as Renewable Adsorptive Media. Int. J. Environ. Sci. Technol. 2015, 12, 3363–3372. [Google Scholar] [CrossRef]
  64. Park, J.H.; Ok, Y.S.; Kim, S.H.; Cho, J.S.; Heo, J.S.; Delaune, R.D.; Seo, D.C. Evaluation of Phosphorus Adsorption Capacity of Sesame Straw Biochar on Aqueous Solution: Influence of Activation Methods and Pyrolysis Temperatures. Environ. Geochem. Health 2015, 37, 969–983. [Google Scholar] [CrossRef]
  65. Xu, G.; Zhang, Z.; Deng, L. Adsorption Behaviors and Removal Efficiencies of Inorganic, Polymeric and Organic Phosphates from Aqueous Solution on Biochar Derived from Sewage Sludge of Chemically Enhanced Primary Treatment Process. Water 2018, 10, 869. [Google Scholar] [CrossRef]
  66. Tao, X.; Huang, T.; Lv, B. Synthesis of Fe/Mg-Biochar Nanocomposites for Phosphate Removal. Materials 2020, 13, 816. [Google Scholar] [CrossRef]
  67. González, J.A.; Mengual, J. Enhanced Phosphate Adsorption Using Chemically Modified Walnut Shell Biochar: A Comparative Study of Activation Methods, Isotherm Uncertainty Analysis and Modelling. J. Water Process Eng. 2025, 77, 108468. [Google Scholar] [CrossRef]
  68. Bal Krishna, K.C.; Niaz, M.R.; Sarker, D.C.; Jansen, T. Phosphorous Removal from Aqueous Solution Can Be Enhanced through the Calcination of Lime Sludge. J. Environ. Manag. 2017, 200, 359–365. [Google Scholar] [CrossRef]
  69. Mendez, J.C.; Hiemstra, T. Ternary Complex Formation of Phosphate with Ca and Mg Ions Binding to Ferrihydrite: Experiments and Mechanisms. ACS Earth Sp. Chem. 2020, 4, 545–557. [Google Scholar] [CrossRef]
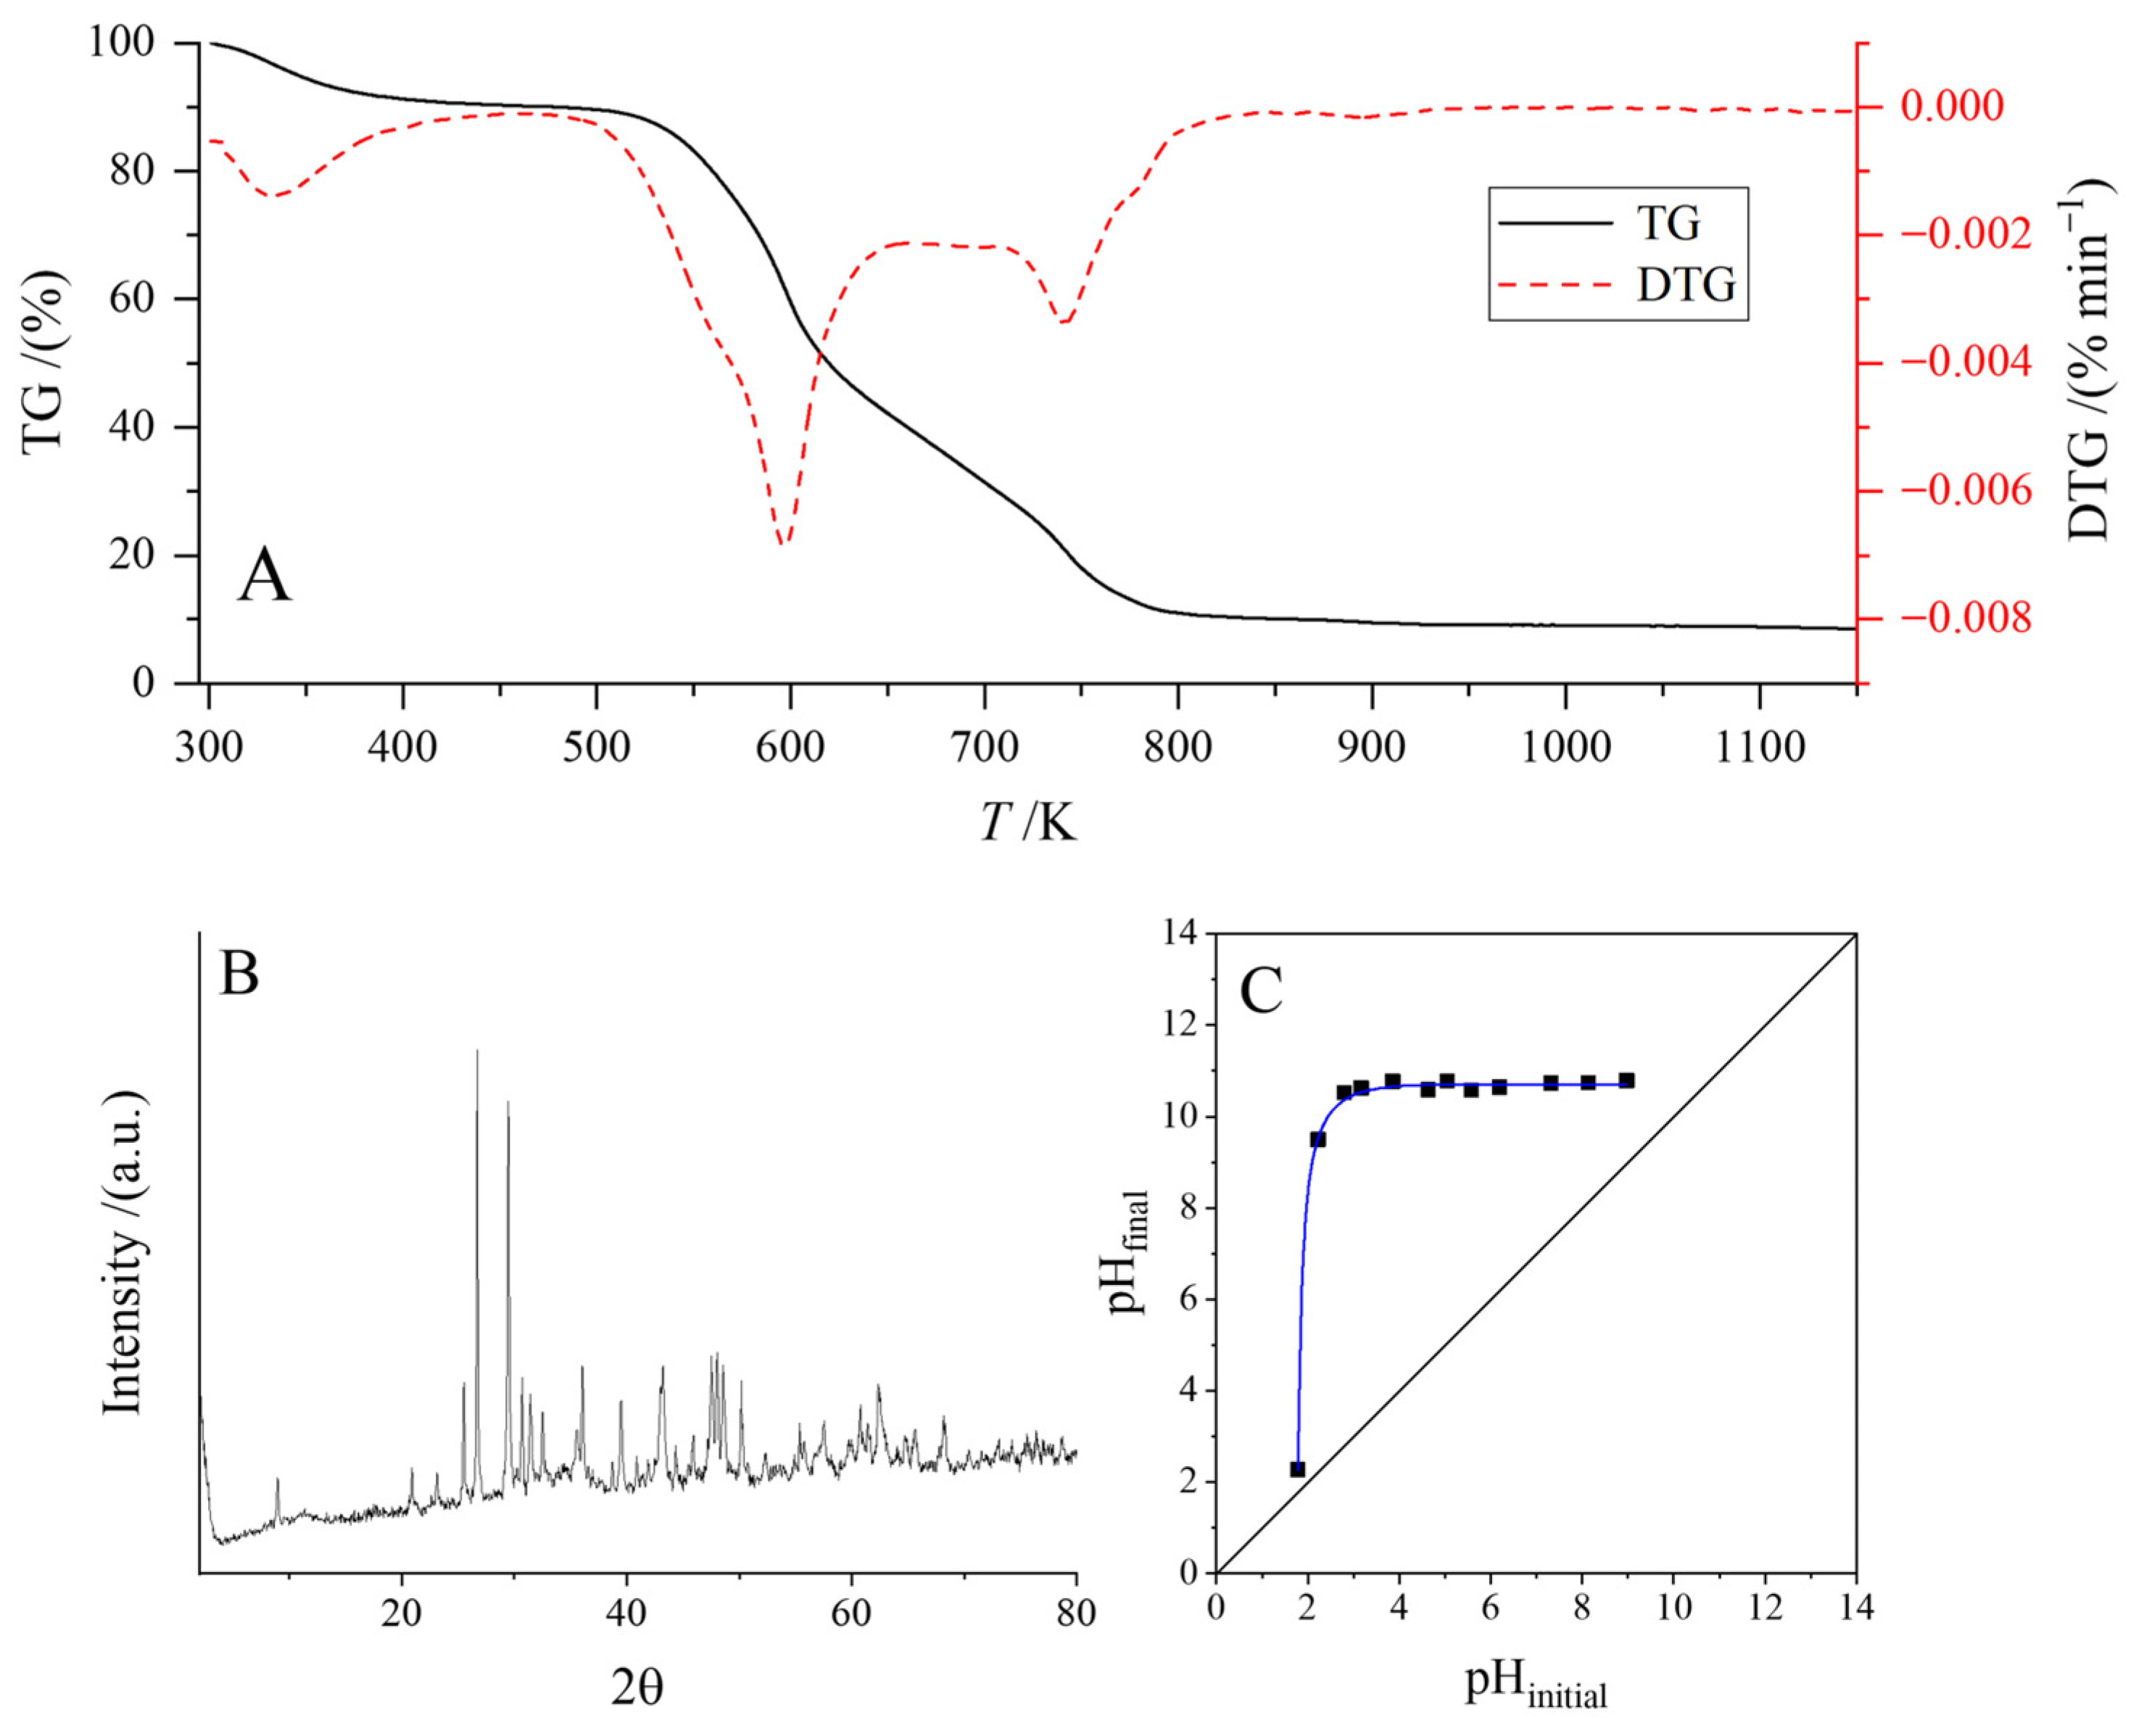
Figure 1. Characterization of the raw and adsorbent materials: (A) TG and DTG of PO (raw material); (B) X-ray diffraction of POA; (C) Point of zero charge for POA.
Agriengineering 07 00333 g001
Figure 2. Multiscale SEM analysis of Posidonia oceanica ash morphology.
Agriengineering 07 00333 g002
Figure 3. Kinetics of phosphate removal by POA at different temperatures: (A) 283 K; (B) 293 K; (C) 303 K. Adsorbent dose (D): 1.0 g L−1. Initial phosphate concentration (C0): 80 mgP L−1.
Agriengineering 07 00333 g003
Figure 4. Arrhenius plot for the kinetic adsorption of phosphorus on POA sample.
Agriengineering 07 00333 g004
Figure 5. Phosphorus adsorption isotherms on POA at different temperatures: (A) 283 K; (B) 293 K; (C) 303 K. Adsorbent dose (D): 1.0 g L−1.
Agriengineering 07 00333 g005
Figure 6. Effect of temperature on the isotherm constant of the POA sample. Adsorbent dose (D): 1.0 g L−1.
Agriengineering 07 00333 g006
Figure 7. Effect of adsorbent dose at 293 K on removal (A) and adsorption capacity (B) of phosphorus onto POA sample for two initial phosphate concentrations, 50 mgP L−1 and 100 mgP L−1.
Agriengineering 07 00333 g007
Figure 8. Effect of initial pH (A) and final pH (B) on adsorption capacity of phosphorus onto POA sample at 293 K. Initial phosphate concentration (C0): 100 mgP L−1. Adsorbent dose (D): 1.0 g L−1.
Agriengineering 07 00333 g008
Figure 9. Speciation diagram of phosphate as a function of pH and its relationship with the adsorption capacity of the POA sample.
Agriengineering 07 00333 g009
Figure 10. Phosphorus leaching-desorption behavior of POA samples at room temperature as influenced by proton dose (A) and the resulting final pH (B). Adsorbent dose (D): 10 g L−1.
Agriengineering 07 00333 g010
Figure 11. Leaching-desorption behavior of POA samples at room temperature for other cations. Adsorbent dose (D): 10 g L−1.
Agriengineering 07 00333 g011
Table 1. Physicochemical properties of the raw and adsorbent.
SamplesPOPOA
pHPZCn.d.10.7
BET surface area/(m2 g−1)n.d.13
External surface area/(%)n.d.86
Elementary analysis/(wt. %)
Carbon39.223.42
Nitrogen0.720.00
Hydrogen5.050.48
Sulfur0.701.85
Oxygen37.04n.d.
Composition/(wt. %)
Sin.d.11.0
Aln.d.1.6
Fen.d.4.0
Mgn.d.5.6
Can.d.11.4
Nan.d.1.2
Kn.d.0.8
Pn.d.0.2
n.d.: Not determined.
Table 2. Typical kinetic models for phosphate adsorption over POA at different temperatures.
ModelsT/K283293303
Pseudo-first-order
qe/(mgP g−1) 42.442.141.5
k1/(h−1) 0.3480.3880.487
R2 0.840.720.53
RMSE 4.35.15.6
Pseudo-second-order
qe/(mgP g−1) 44.544.044.1
k2/(g mgP−1 h−1) 0.0110.0120.013
R2 0.9250.850.74
RMSE 2.83.74.2
Elovich
α/(mgP g−1 h−1) 157.6193.0240.3
β/(g mgP−1) 0.1760.1850.181
R2 0.9720.9930.972
RMSE 1.70.781.4
Table 3. Isotherm models for phosphate adsorption over POA at different temperatures.
ModelsT/K283293303
Langmuir
qmax/(mg g−1) 48.550.757.0
KL/(mg−1 L) 3.2657.3823.063
R2 0.760.600.906
RMSE 4.696.023.25
ΔAICc 49.8
Freundlich
1/n 0.1200.1000.106
KF/(mg1−(1/n) L1/n g−1) 32.636.339.1
R2 0.9870.9400.938
RMSE 1.062.332.64
ΔAICc 0.0
Temkin
B/(mg g−1) 4.714.145.18
KT/(mg−1 L) 108878471834
R2 0.9720.9150.963
RMSE 1.532.762.03
ΔAICc 2.4
Table 4. Comparison of phosphate adsorption capacity of various bio-based adsorbents.
Precursor MaterialTreatmentDose/(g L−1)q/(mgP g−1)Ref.
Posidonia oceanica fiberRaw103.0[60]
Posidonia oceanica fiberRaw25.0[61]
Date palmRaw65.85[62]
Peanut shellBiochar17.6[63]
Sesame strawBiochar29.4[64]
Sewage sludgeBiochar115.2[65]
Walnut shellBiochar26.4[66]
Walnut shellBiochar14.7[67]
Rice strawAsh104.5[25]
Rice huskAsh21.6[57]
ReedAsh1.522.5[25]
Lime sludgeAsh120.8[68]
PaulowniaAsh512.0[48]
Wheat strawAsh58.4[48]
Barley strawAsh512.0[48]
Posidonia oceanica fiberAsh0.5–233.5–58.7This study
Disclaimer/Publisher’s Note: The statements, opinions and data contained in all publications are solely those of the individual author(s) and contributor(s) and not of MDPI and/or the editor(s). MDPI and/or the editor(s) disclaim responsibility for any injury to people or property resulting from any ideas, methods, instructions or products referred to in the content.