Article

Changes in Soil Physical Quality, Root Growth, and Sugarcane Crop Yield During Different Successive Mechanized Harvest Cycles

by
Igor Queiroz Moraes Valente
1,*,
Zigomar Menezes de Souza
1,
Gamal Soares Cassama
1,
Vanessa da Silva Bitter
1,
Jeison Andrey Sanchez Parra
1,
Euriana Maria Guimarães
1,
Reginaldo Barboza da Silva
2 and
Rose Luiza Moraes Tavares
3,*
1
School of Agricultural Engineering, State University of Campinas—UNICAMP, Campinas 13083-875, Brazil
2
School of Agricultural Sciences of Vale do Ribeira, São Paulo State University—UNESP, Campus Registro, Registro 11900-000, Brazil
3
Post-Graduate Program in Crop Production, University of Rio Verde—UniRV, Rio Verde 75901-970, Brazil
*
Authors to whom correspondence should be addressed.
AgriEngineering 2025, 7(10), 325; https://doi.org/10.3390/agriengineering7100325
Submission received: 3 July 2025 / Revised: 15 September 2025 / Accepted: 23 September 2025 / Published: 1 October 2025

Abstract

Due to its benefits and efficiency, mechanized sugarcane harvest is a common practice in Brazil; however, continuous traffic of agricultural machinery leads to soil compaction at the end of each harvest cycle. Hence, this study evaluated whether machine traffic affects soil physical and hydraulic properties, root growth, and crop productivity in sugarcane areas during different harvest cycles. Four treatments were performed consisting of an area planted with different stages (years) of sugarcane crop: T1 = after the first harvest—plant cane (area 1); T2 = after the second harvest—first ratoon cane (area 2); T3 = after the third harvest—second ratoon cane (area 3); T4 = after fourth harvest—third ratoon cane (area 4). Five sampling sites were considered in each area, constituting five replicates collected from four layers. Two collection positions were considered: wheel track (WT) and planting row (PR). Soil physical properties, root system, productivity, and biometric characteristics of the sugarcane crop were evaluated at depths of 0.00–0.05 m, 0.05–0.10 m, 0.10–0.20 m, and 0.20–0.40 m. Traffic during the sugarcane crop growth cycles affected soil physical and hydraulic properties, showing sensitivity to the effects of the different treatments, producing variations in root growth and crop productivity. Plant cane cycle showed lower soil penetration resistance, bulk density, microporosity, higher saturated soil hydraulic conductivity, and macroporosity when compared with the other cycles studied. In the 0.10–0.20 m layer, all treatments produced higher soil penetration resistance and density, and lower saturated soil hydraulic conductivity. Dry biomass, volume, and root area were higher for the plant cane cycle in the 0.00–0.05 m and 0.05–0.10 m layers compared with the other crop cycles. Root dry biomass is directly related to crop productivity in layers up to 0.40 m deep. Sugarcane productivity was affected along the crop cycles, with higher productivity observed in the plant cane and first ratoon cane cycles compared with the second and third ratoon cane cycles.

1. Introduction

Sugarcane (Saccharum officinarum L.) is an important crop for the world economy—for instance, it produces ethanol and/or co-generation of electricity in the renewable energy sector, and sugar for export. Brazil is the world’s largest sugarcane cultivator, with an estimated production of 676.96 million tons on 8.2 million hectares in the 2024/25 harvest. Southeastern Brazil is the largest sugarcane producer, accounting for 63.7% of the country’s production [1].
Sugarcane crops are highly mechanized from soil tillage (initial stage) to harvest final stage) [2,3,4,5]. Mechanized sugarcane harvesting has improved operational performance by meeting mill production schedules, eliminating the need for pre-harvest burning, reducing costs and the number of field operations, lowering field consumption and associated greenhouse gas emissions, and positively impacting human health in sugarcane areas [6]. Due to its benefits and efficiency in reducing costs, mechanized sugarcane harvesting is a widely used and consolidated practice in many Brazilian regions [6,7].
Since this crop requires intensive use of agricultural machinery at all stages of production for different sizes, weights, and purposes [8,9], problems involving soil compaction become harmful to the crop. As these machines are heavy and large, and due to the continuous traffic during sugarcane crop cycles, they may successively contribute to soil structure degradation as a result of tensions transferred to the soil [3,10,11], leading to soil compaction at the end of production cycles with reduced productivity and root growth [4,12,13]. Globally, soil compaction from mechanization is a growing concern. Strategies such as controlled traffic, reduced axle loads, and biological soil structuring are increasingly adopted to mitigate these effects.
Soil compaction refers to a reduction in soil volume and increase in bulk density due to external pressure, leading to loss of macroporosity [14]. While physical properties like soil penetration resistance, bulk density, and porosity have been used to evaluate the impacts of sugarcane production systems [15,16,17,18,19], other properties such as saturated hydraulic conductivity also play a key role in assessing soil physical quality [20].
Saturated soil hydraulic conductivity is an important soil property to help understand soil water storage, surface runoff, erosion, and water conductivity under saturated conditions [21,22,23], which makes this variable an important soil physical quality characteristic [24,25].
A well-developed root system with uniform distribution in the soil allows the plant to obtain a greater amount of available water, increasing its resistance to drought, ensuring water for growth and root biomass production, and obtaining the nutrients required for plant nutrition, directly impacting productivity and stalk quality [12,26]. However, the effects of soil compaction caused by traffic in the crop cycles reduce root biomass, hindering root penetration and consequently reducing air capacity and water and nutrient absorption, thereby reducing sugarcane productivity [12,13,16,26,27,28,29,30].
Studies show that soil compaction effects vary depending on depth, with subsoil layers being more prone to long-term structural degradation, which compromises root penetration and water movement.
Previous research has explored isolated aspects or single cycles of mechanized sugarcane harvesting, but integrated evaluations encompassing the cumulative effects of successive harvests are still lacking. Addressing this gap is essential for understanding the long-term impacts on soil physical and hydraulic properties, root development, and crop productivity under controlled traffic systems, which are increasingly relevant for sustainable management practices. Adopting appropriate soil management practices and assessing soil environmental indicators are important to minimize negative effects, promote healthy root development, and improve crop yield, given that the success of sugarcane plantations is related to ratoon regrowth [8,16].
Thus, understanding the effects on soil compaction can help develop an adequate planning for managing sugarcane areas. Moreover, since sugarcane crops are grown for five or six years, a detailed assessment of soil physical and hydraulic indicators is essential to help plan sugarcane plantation reform in advance. Hence, this study assessed whether machine traffic affects soil physical and hydraulic properties, root growth, and crop productivity in sugarcane areas with different harvest cycles.

2. Materials and Methods

2.1. Study Site

The experiment was conducted in a commercial sugarcane area of the Cerradão sugar mill in the city of Frutal, state of Minas Gerais, Southeastern Brazil (19°47.7′20″ south latitude and 49°25.5′80″ west longitude, 534 m above sea level). Its climate is tropical with a dry season (Aw) according to the Köppen and Geinge climate classification [31], with an average annual precipitation of 1175 mm and an average temperature of 24.9 °C.
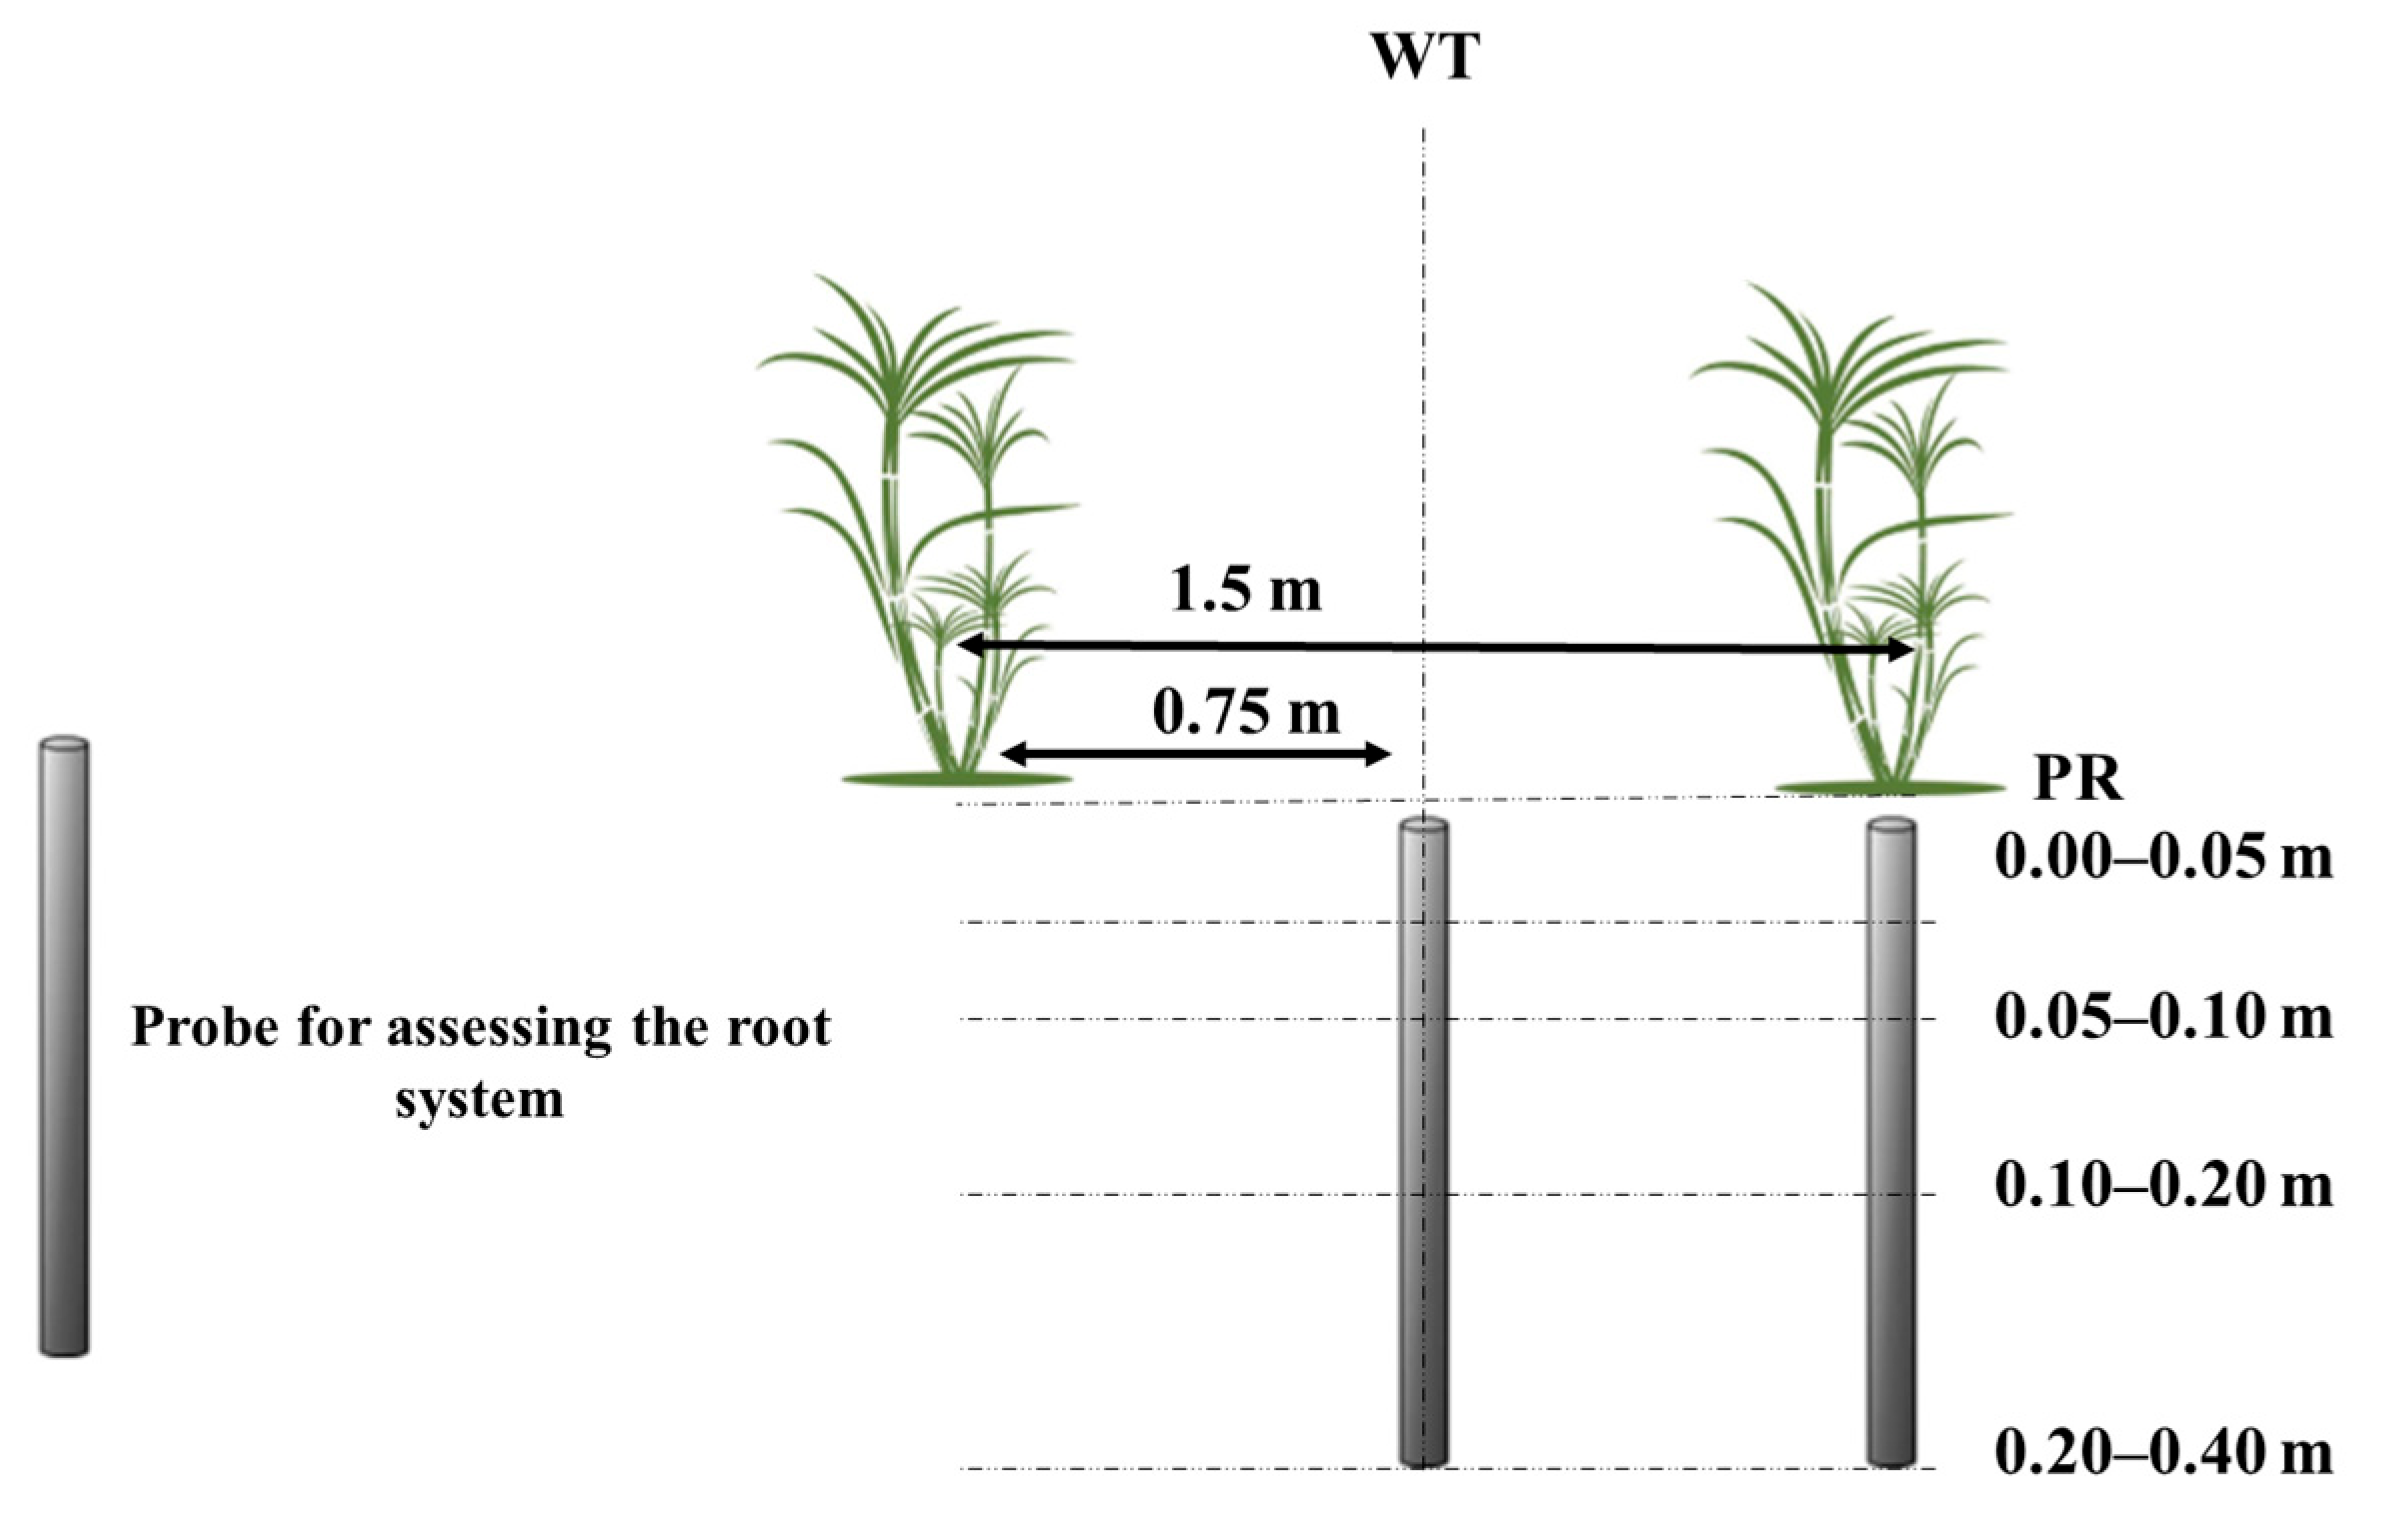
Its soil is a Red Latosol type with a medium sandy texture according to the Brazilian Soil Classification System [32], and Rhodic Hapludox soil with a sandy-clay loam texture according to the Soil Survey Staff [33]. Soil physical properties on the experimental area were characterized in April 2022 and included four successive harvesting cycles: plant cane, first, second, and third ratoon in the wheel track (WT), located 0.75 m from the planting row, and the planting row itself (PR), at the layers of 0.00–0.05 m, 0.05–0.10 m, 0.10–0.20 m, and 0.20–0.40 m (Table 1).

2.2. Treatments, Installation, and Experiment Procedures

Prior to the establishment of the sugarcane crop in 2018, the experimental area had been managed as extensive pasture for over two decades without conventional tillage or the use of agricultural machinery. As such, the initial soil conditions represented a minimally disturbed baseline. Preparation of the experimental areas began by eliminating pasture before implementing the sugarcane field using conventional soil tillage with harrowing (Ecoagrícola disc harrow, with 29-inch diameter discs) and subsoiling to a depth of 0.40 m (Civemasa STAC-P 500 subsoiler), both pulled by a Case 150 kW tractor.
For all treatments, sugarcane was manually planted using the RB 975201 variety in a C production environment in 0.30 m deep furrows, using 15 buds m−1 and interline spacing of 1.5 m. Manual planting was adopted to ensure uniform bud distribution and avoid additional compaction from machinery during establishment.
Additionally, herbicide was applied along the crop cycles using a John Deere M4030 182 kW self-propelled sprayer. In all crop cycles, harvest was performed using a John Deere CH 570 harvester with a rated/maximum power of 252 kW, mass of 21 Mg, 1.88 m gauge, and dry chain tracks with 0.457 m wide shoes. Harvest operations were performed at an average operating speed of 4.5 km h−1.
To ensure that all machine wheels always run in the same place, mechanized operations were performed under a traffic control system, with all machines using an automatic pilot system, an RTX-Trimble correction system in the transfer systems and Topnet® from Topcon® in the harvesters, which used maps of the experimental area containing the planting rows and a series of automatic guidance patterns. The automatic pilot system also had an integrated receiver with information from the GNSS satellite constellation, which is easily updatable, with 0.02 m accuracy in real time, capturing the existing reference networks by cell phone connection.
Each of the four treatments applied treatment consisted of a planted area with different stages (years) of sugarcane crop: T1 = after the first harvest—plant cane (area 1); T2 = after the second harvest—first ratoon cane (area 2); T3 = after the third harvest—second ratoon cane (area 3); T4 = after the fourth harvest—third ratoon cane (area 4). Five sampling sites were considered in each area, which constituted five replicates collected over four layers. Additionally, two collection sites were considered: wheel track (WT) and planting row (PR). For all treatments, a simple spacing of 1.50 m between planting rows was adopted.

2.3. Soil Sampling

After mechanical harvest of the experimental areas, undisturbed soil samples were collected from the 0.00–0.05 m, 0.05–0.10 m, 0.10–0.20 m, and 0.20–0.40 m layers, at the planting row (PR) and wheel track (WT) sites, corresponding to the interline (Figure 1). Forty undisturbed samples were collected from each area, totaling 160 samples for all treatments. Undisturbed samples were collected using stainless steel cylinders of 5 cm diameter and proper height to determine soil physical properties.

2.4. Soil Physical Properties

2.4.1. Soil Bulk Density, Particle Density, and Porosity

Soil bulk density (BD) was quantified by the volumetric ring method and was calculated by the ratio between the oven-dry soil mass at 105 °C and the sample volume [34]. Particle density (PD) was determined by the volumetric flask method [34]. Total porosity (TP) was calculated using the indirect method (TP = 1 − BD/PD). Microporosity (MiP) corresponded to the volumetric moisture retained in the soil sample submitted to 6 kPa tension on a tension table, and macroporosity (MaP) was measured by the difference between TP and MiP [34].

2.4.2. Soil Penetration Resistance (SPR)

SPR was quantified in a laboratory using undisturbed soil samples and a MARCONI MA 933 benchtop electronic penetrometer (MARCONI®), with a 4 mm solid cone tip and 30° half-angle and a constant penetration rate of 10 mm min−1. SPR measurements were obtained after equilibration of soil samples at 10 kPa in a Richards chamber. For each soil sample, three replicates were made, excluding readings from the upper and lower segment (1 cm) [26].

2.4.3. Saturated Hydraulic Conductivity (Ks)

Ks was determined by the variable head method using the automated measuring system KSAT [35] with undisturbed soil samples of 250 cm3 (8 cm diameter and 5 cm height). This device operates according to DIN ISO 18130-1 standards and is based on the inversion of Darcy’s law, where Ks is calculated using the product of the volumetric water flux (V) and the soil sample length (L) divided by the soil sample area (A), the time (t), and the hydraulic head gradient (H) along the flux direction.
The KSAT system is a permeameter that automatically measures the volumetric water flux and hydraulic head over time in a soil core fully saturated with water that is percolated perpendicularly to its cross-section during a constant head or variable head test. The water in the burette flows upwards through the sample and as the burette content is emptied, the pressure decreases. The pressure sensor of the KSAT system has a 0.001 kPa accuracy, 0.2 °C temperature sensor and can measure Ks values from 0.0001 to 50 m/day [35].
In the variable head test, Ks was calculated using Equation (1) and data were processed using the device software (KSAT v1.5.0) by adjusting the gradient of the hydraulic head (H) as a function of time (t) to determine coefficient b. During the hydraulic conductivity test, measurements are performed at room temperature. Since Ks is temperature dependent, the device measures the actual temperature and calculates the Ks values for a selected reference temperature (20 °C), thus minimizing the temperature effects during the test.
K s = A b u r A s × L × b
in which: Ks = saturated hydraulic conductivity (cm d−1); Abur = cross-sectional area of the burette (cm2); As = cross-sectional area of the soil sample (cm2); L = height of the soil sample (cm); b = coefficient.

2.5. Root System Assessment

Sugarcane root system was assessed in August 2022 after the sugarcane harvesting to study the effect of traffic throughout the harvest cycles on root system growth. Root biomass was assessed using a probe according to Otto et al. [26], in which stainless steel probes of 1 m in length and 0.055 m in diameter were used to collect soil samples containing roots, at the PR and WT sites, from the 0.00–0.05, 0.05–0.10, 0.10–0.20 and 0.20–0.40 m layers (Figure 2).
After collection, the samples underwent wet sieving under running water using sieves of 2.0 mm mesh to separate soil and roots. The roots were then dried at 65 °C for 24 h in ventilated ovens and weighed to obtain the dry mass. The roots were scanned using an optical scanner at 300 dpi resolution, and the images were processed on the SAFIRA® software (version 1.0) to determine area (AR) and root volume (RV).
Root dry biomass (RDB) was quantified and calculated according to Otto et al. [26], as described in Equation (2).
R D B = R D × V s
In which: RDB = root dry biomass (Mg ha−1); RD = root density (g dm−3) at the sampling sites in the planting row and wheel track; Vs = soil volume in the sample.

2.6. Sugarcane Productivity and Biometric Assessment

In mid-July 2022, two weeks before starting the mechanized harvest, the biometric and productivity assessments were conducted for the four treatments applied. Each replicate was assessed in three randomly distributed 5.0 m strips on the planting row. Sugarcane productivity was determined by manually cutting each evaluation strip, which was weighed on a digital scale with 0.1 kg precision. Then, the productivity assessment was converted to mega grams per hectare.
In each repetition, the stalks were counted along the 5.0 m evaluation strips to measure plant population. Finally, within the plants harvested to evaluate productivity in each designated strip, ten stalks were randomly selected for diameter and height evaluation. Stalk diameter was measured using a digital caliper, whereas stalk height was measured with a tape measure, determining the length between the plant base and the leaf.

2.7. Statistical Analyses

Data underwent normality test using the Shapiro–Wilk method (p > 0.05). When data presented non-normal distribution, they were transformed using the logarithmic function. Data were tested using analysis of variance (ANOVA) with interaction model between the following factors: crop cycles, sampling position, and depth. For significant results, means were compared by t-test at 5% probability. Statistical analyses were performed on the R Studio® software (Version 4.4.3).

3. Results and Discussion

Traffic effects on sugarcane crops in different harvest cycles changed the soil physical properties (Figure 3). Regardless of treatment, soil penetration resistance (SPR) in all soil layers was significantly higher in the wheel track (WT) than in the planting row (PR), excepting the T3 and T4 harvests in the 0.20–0.40 m layer. SPR values were lowest in the surface layer (0.00–0.05 m), ranging from 0.49 to 1.43 MPa at both WT and PR (Figure 3a). Values increased at the 0.05–0.10 and 0.10–0.20 m layers, ranging from 0.52 to 2.29 MPa (Figure 3b) and from 0.73 to 2.66 MPa (Figure 3c) at both PR and WT, respectively. The highest SPR values were observed in the 0.10–0.20 m layer, mainly at WT.
At the planting row and wheel track evaluation sites, SPR values were lower after the first sugarcane harvest (T1) compared with the fourth (T4), ranging from 0.49 MPa (Figure 3a) to 2.66 MPa (Figure 3b), with significant differences (p < 0.05) between treatments at the 0.00–0.05, 0.05–0.10, 0.10–0.20 and 0.20–0.40 m layers.
Machine traffic throughout the sugarcane crop cycles intensified SPR levels mainly at WT (Figure 3), agreeing with the results reported by Esteban et al. [16] and Guimarães Júnnyor et al. [36]. According to Luz et al. [37] and Cavalcanti et al. [17], the frequency of agricultural machine traffic for cultivation and harvesting makes soil compaction more critical close to the renewal of the sugarcane field. However, adoption of a traffic system controlled by the mill yielded lower SPR values at PR, thus avoiding physical degradation at the site [4,5,16,38].
Higher SPR values at PR were observed in the compacted layer at 0.10–0.20 m (Figure 3), as according to Guimarães Júnnyor et al. [8], in addition to machine traffic, the tension caused by loaded transshipment systems leads to increased pressure in the soil both vertically and horizontally, causing compaction in the planting row. However, SPR values at PR were lower than 2.0 MPa, indicating no obstacle to root system development at this site according to the limits adopted here. Thus, adopting controlled traffic results in more favorable physical conditions for the plant, preserving the ratoon region. According to Silva et al. [39] and Guimarães Júnnyor et al. [8], harvesting promotes the highest levels of compaction in sugarcane areas.
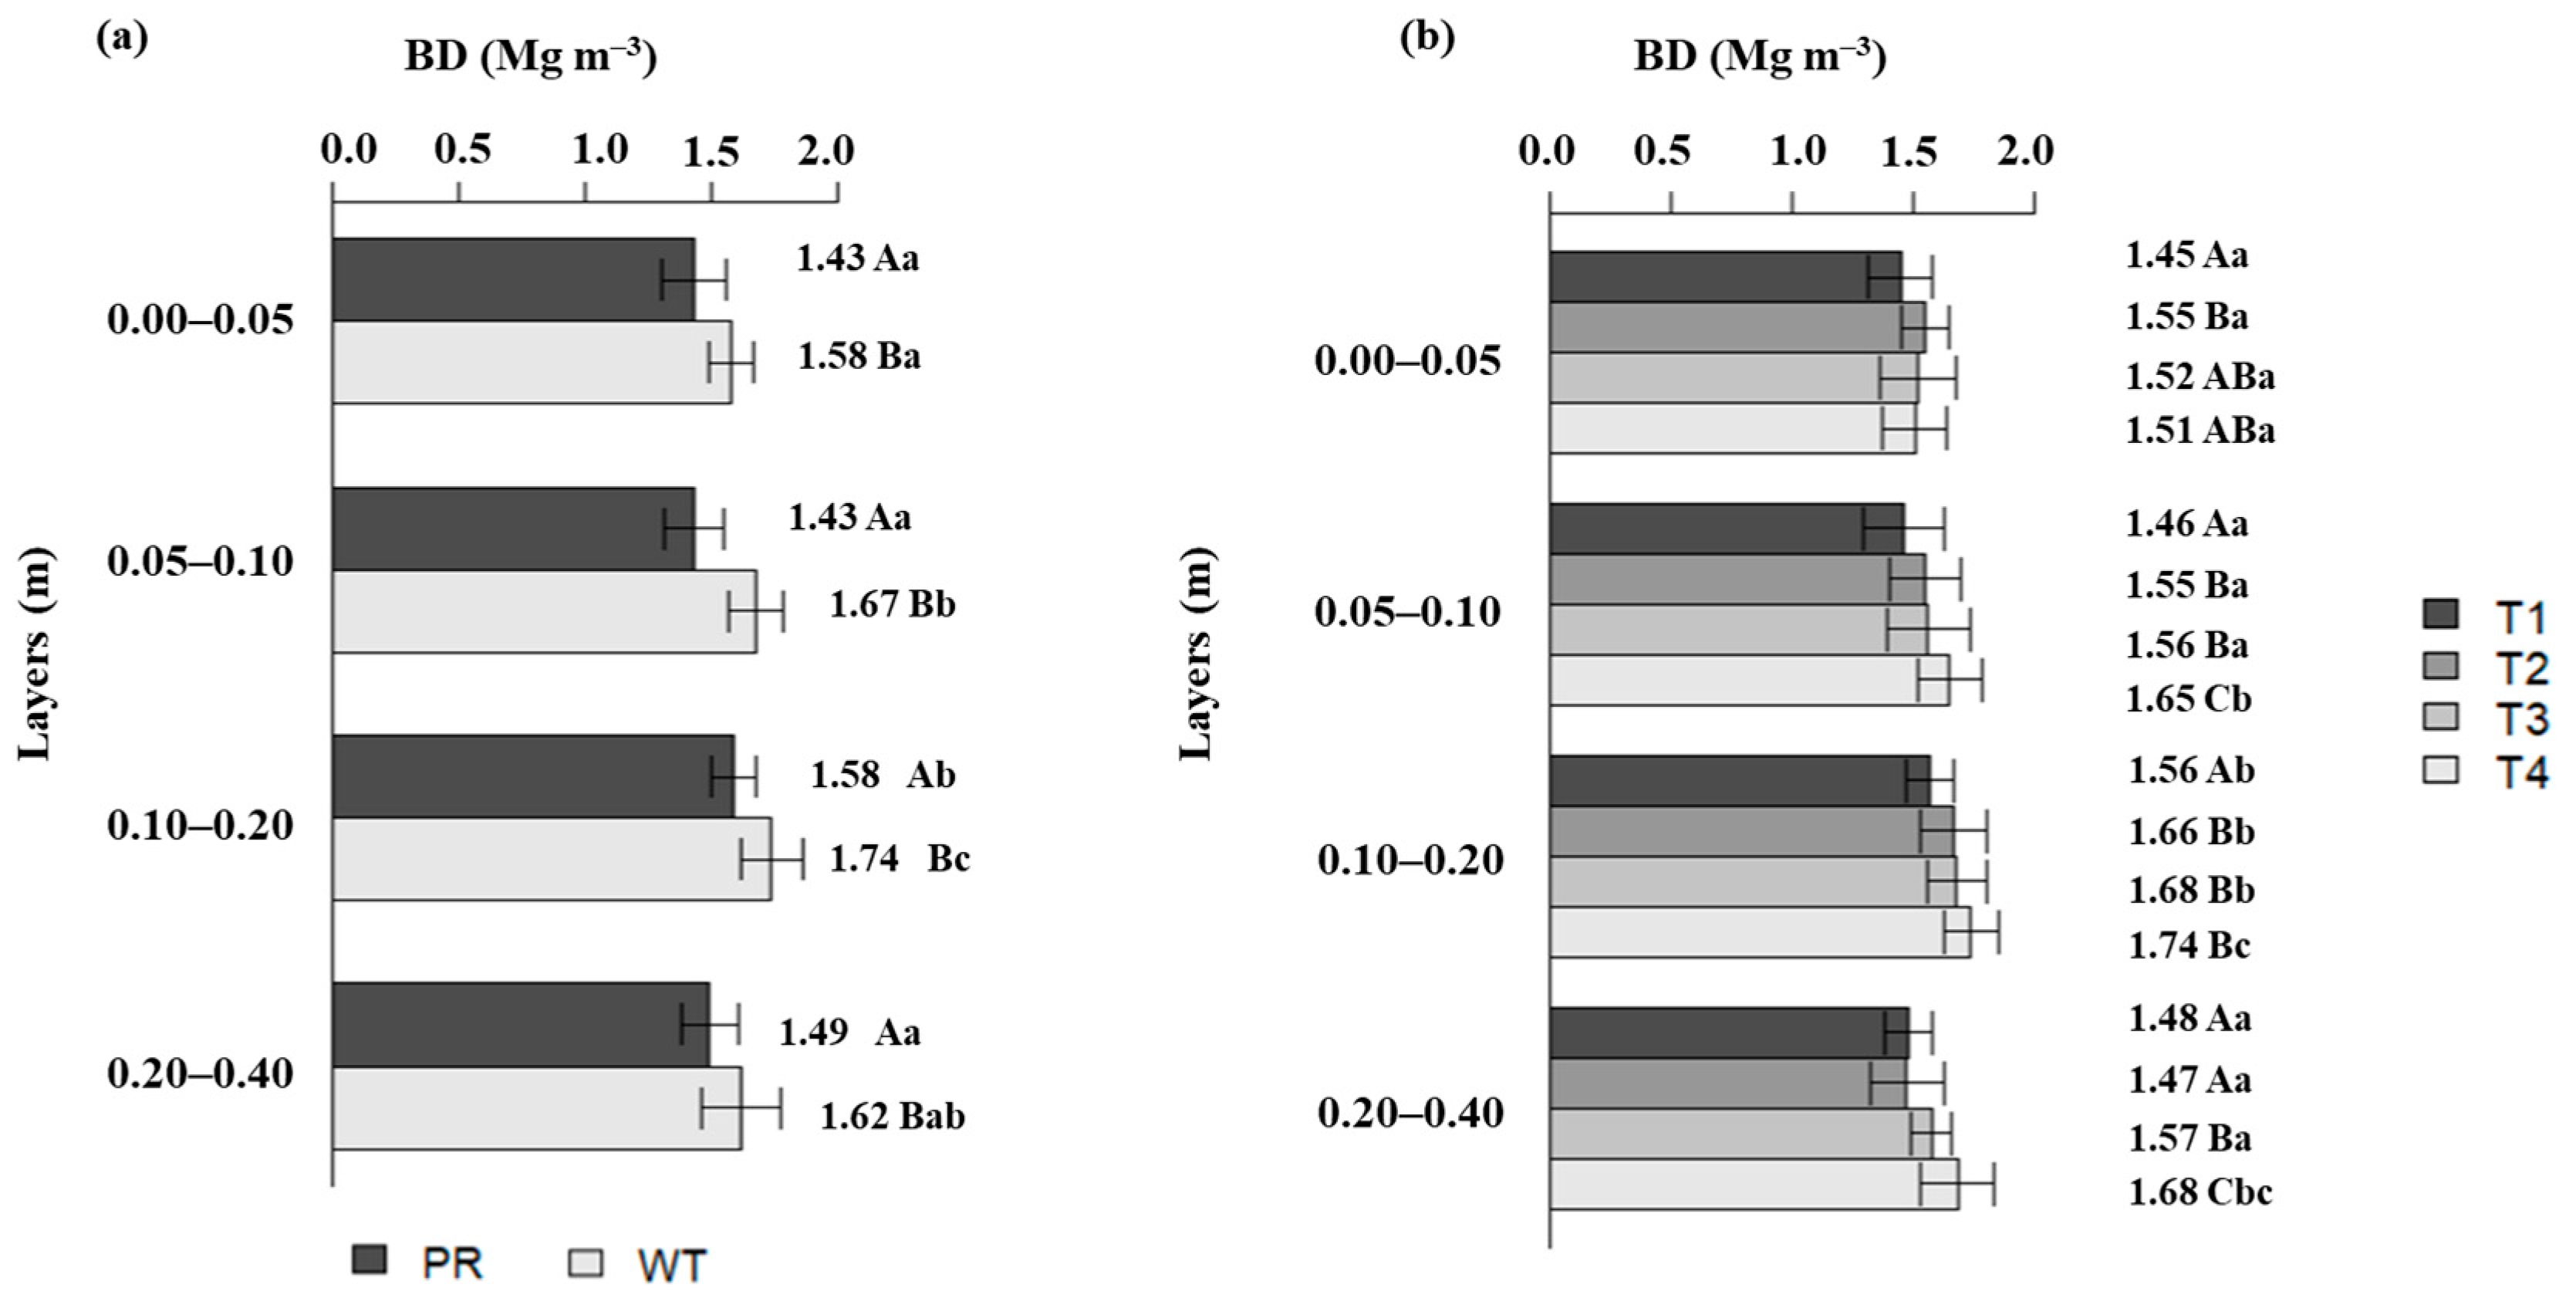
After the respective crop harvests, soil bulk density (BD) varied from 1.43 to 1.74 Mg m−3 (Figure 4). In all soil layers, BD values at PR were significantly lower (p < 0.05) than at WT; however, at both sites, values were highest at the 0.10–0.20 m layer (1.58 and 1.74 Mg m−3 for PR and WT, respectively) (Figure 4a). BD mean values were significantly lower in T1 at all soil layers, ranging from 1.45 to 1.56 Mg m−3, and in T2 at the 0.20–0.40 m layer (Figure 4b).
Significant differences (p < 0.05) were found in the BD mean values at the same layer for the different treatments (Figure 4b). At the 0.00–0.05 m layer, BD in T1 differed statistically from T2 with values of 1.45 and 1.55 Mg m−3, respectively. At the 0.05–0.10 m layer, BD decreased in the sequence T4 > T3 and T2 > T1, whereas at the 0.10–0.20 m layer, BD was lower in T1 compared with the other treatments. At the 0.20–0.40 m layer, BD in T1 (1.48 Mg m−3) and T2 (1.47 Mg m−3) was significantly lower than in T3 (1.57 Mg m−3), which in turn was lower than in T4 (1.68 Mg m−3). All treatments yielded the highest BD values at the 0.10–0.20 m layer: 1.56, 1.66, 1.68, and 1.74 Mg m−3 for T1 to T4, respectively. BD values in the other layers did not differ statistically from each other within each treatment, except for T4, where BD values increased as depth increased.
Mechanized harvesting of sugarcane crops can cause contrasting influences on soil BD (Figure 4). In the mechanized harvesting cycles, BD increased in all treatments, mainly at WT which showed the highest concentration of machine traffic, agreeing with data reported by Oliveira et al. [13]. BD increased in all treatments, mainly at the 0.10–0.20 m layer. Said increase after harvesting indicates that soil tillage effects for sugarcane implementation were suppressed by the impact of traffic and natural soil reconsolidation, and practically disappeared after mechanized harvesting events [3,13,17,40], with temporary soil tillage effects as the soil becomes compacted soon after the first harvesting due to intense harvest machine traffic and transshipment systems, in addition to phenomena including wetting and drying cycles [30,41].
Microporosity (MiP), responsible for water redistribution and retention in the soil, showed significant differences (p < 0.05) between the planting row and wheel track in the different treatments and soil layers (Table 2). For the two-way interaction of site vs. treatment, MiP ranged from 0.29 to 0.39 m3 m−3 and from 0.29 to 0.34 m3 m−3 at WT and PR, respectively. At WT, MiP in T1 and T2 (0.29 m3 m−3) was significantly lower than in T3 (0.33 m3 m−3) and T4 (0.39 m3 m−3).
At PR, MiP was significantly lower in T1 (0.29 m3 m−3) and T2 (0.30 m3 m−3) compared with T3 (0.33 m3 m−3) and T4 (0.34 m3 m−3), respectively. However, differences between sampling sites were observed only in T4, with a higher value at WT (0.39 m3 m−3) than at PR (0.34 m3 m−3). For the two-way interaction of site vs. layer, differences in MiP values were only obtained between layers at WT, with the lowest value at the 0.00–0.05 m layer. At the same soil layer, MiP values differed between the evaluation sites and were significantly higher at WT (0.35 m3 m−3) than at PR (0.31 m3 m−3).
Macroporosity (MaP) values showed significant differences (p < 0.05) between sampling sites for the different treatments and soil layers (Table 2). In the two-way interaction of site vs. treatment, MaP ranged from 0.046 to 0.061 m3 m−3 and from 0.062 to 0.11 m3 m−3 at WT and PR, respectively. No significant difference was observed between treatments at WT; at PR, MaP was significantly higher in T1 (0.11 m3 m−3) compared with T3 (0.089 m3 m−3), T4 (0.062 m3 m−3), and T2 (0.098 m3 m−3), with higher MaP in T2 vs. T4. In the same treatment, differences in MaP were observed between the evaluation sites, as MaP was significantly higher at PR than at WT, excepting T4. In the two-way interaction of site vs. layer, differences in MaP values were only obtained between layers at PR, with the lowest value observed at the 0.00–0.05 m layer. In the same treatment, we found differences in MaP values between the evaluation sites, as MaP was significantly higher at PR than at WT, excepting T4.
Our findings revealed that machine traffic in the crop cycles increased soil MiP at both evaluation sites, a fact caused by the transformation of macropores into micropores and, consequently, a reduction in macroporosity at PR (Table 2), corroborating the other results [4,13,16]. According to Oliveira et al. [13], mechanized harvesting of sugarcane increases MiP values at PR. Microporosity in the first plant cane cycle (T1) was lower than in the other crop cycles, that is, the values were higher after successive harvests, reducing in the sequence T1 < T2 < T3 < T4, agreeing with the results obtained by Oliveira et al. [13].
Agricultural machine traffic in sugarcane crop cycles affected soil porosity due to the compressive process that results in compaction (Table 2), thus decreasing soil volume by reducing macroporosity [42]. Soil compaction along the harvest cycles reduced the MaP value since the increase in soil bulk density decreases macropores due to the intense machine traffic in crop cycles, agreeing with the results obtained by Lima et al. [43], who found lower MaP values with increased soil compaction for soils with silt and clay content <500 g kg−1, a condition also found in the soil under study. According to Awe et al. [41], MaP increase at PR in surface layers can be attributed to biological activity of biopores resulting from the decomposition of sugarcane roots.
Reduced MaP due to machine traffic in the crop cycles negatively influences air-filled pores (Table 2) consequently decreasing water infiltration, gas exchange, and root propagation [41], as well as oxygen [11] and water supply to the plants. Our results indicate that MaP was sensitive to the soil compaction process in the sugarcane crop cycles, as reported in recent studies assessing the same crop [11,16,19,44].
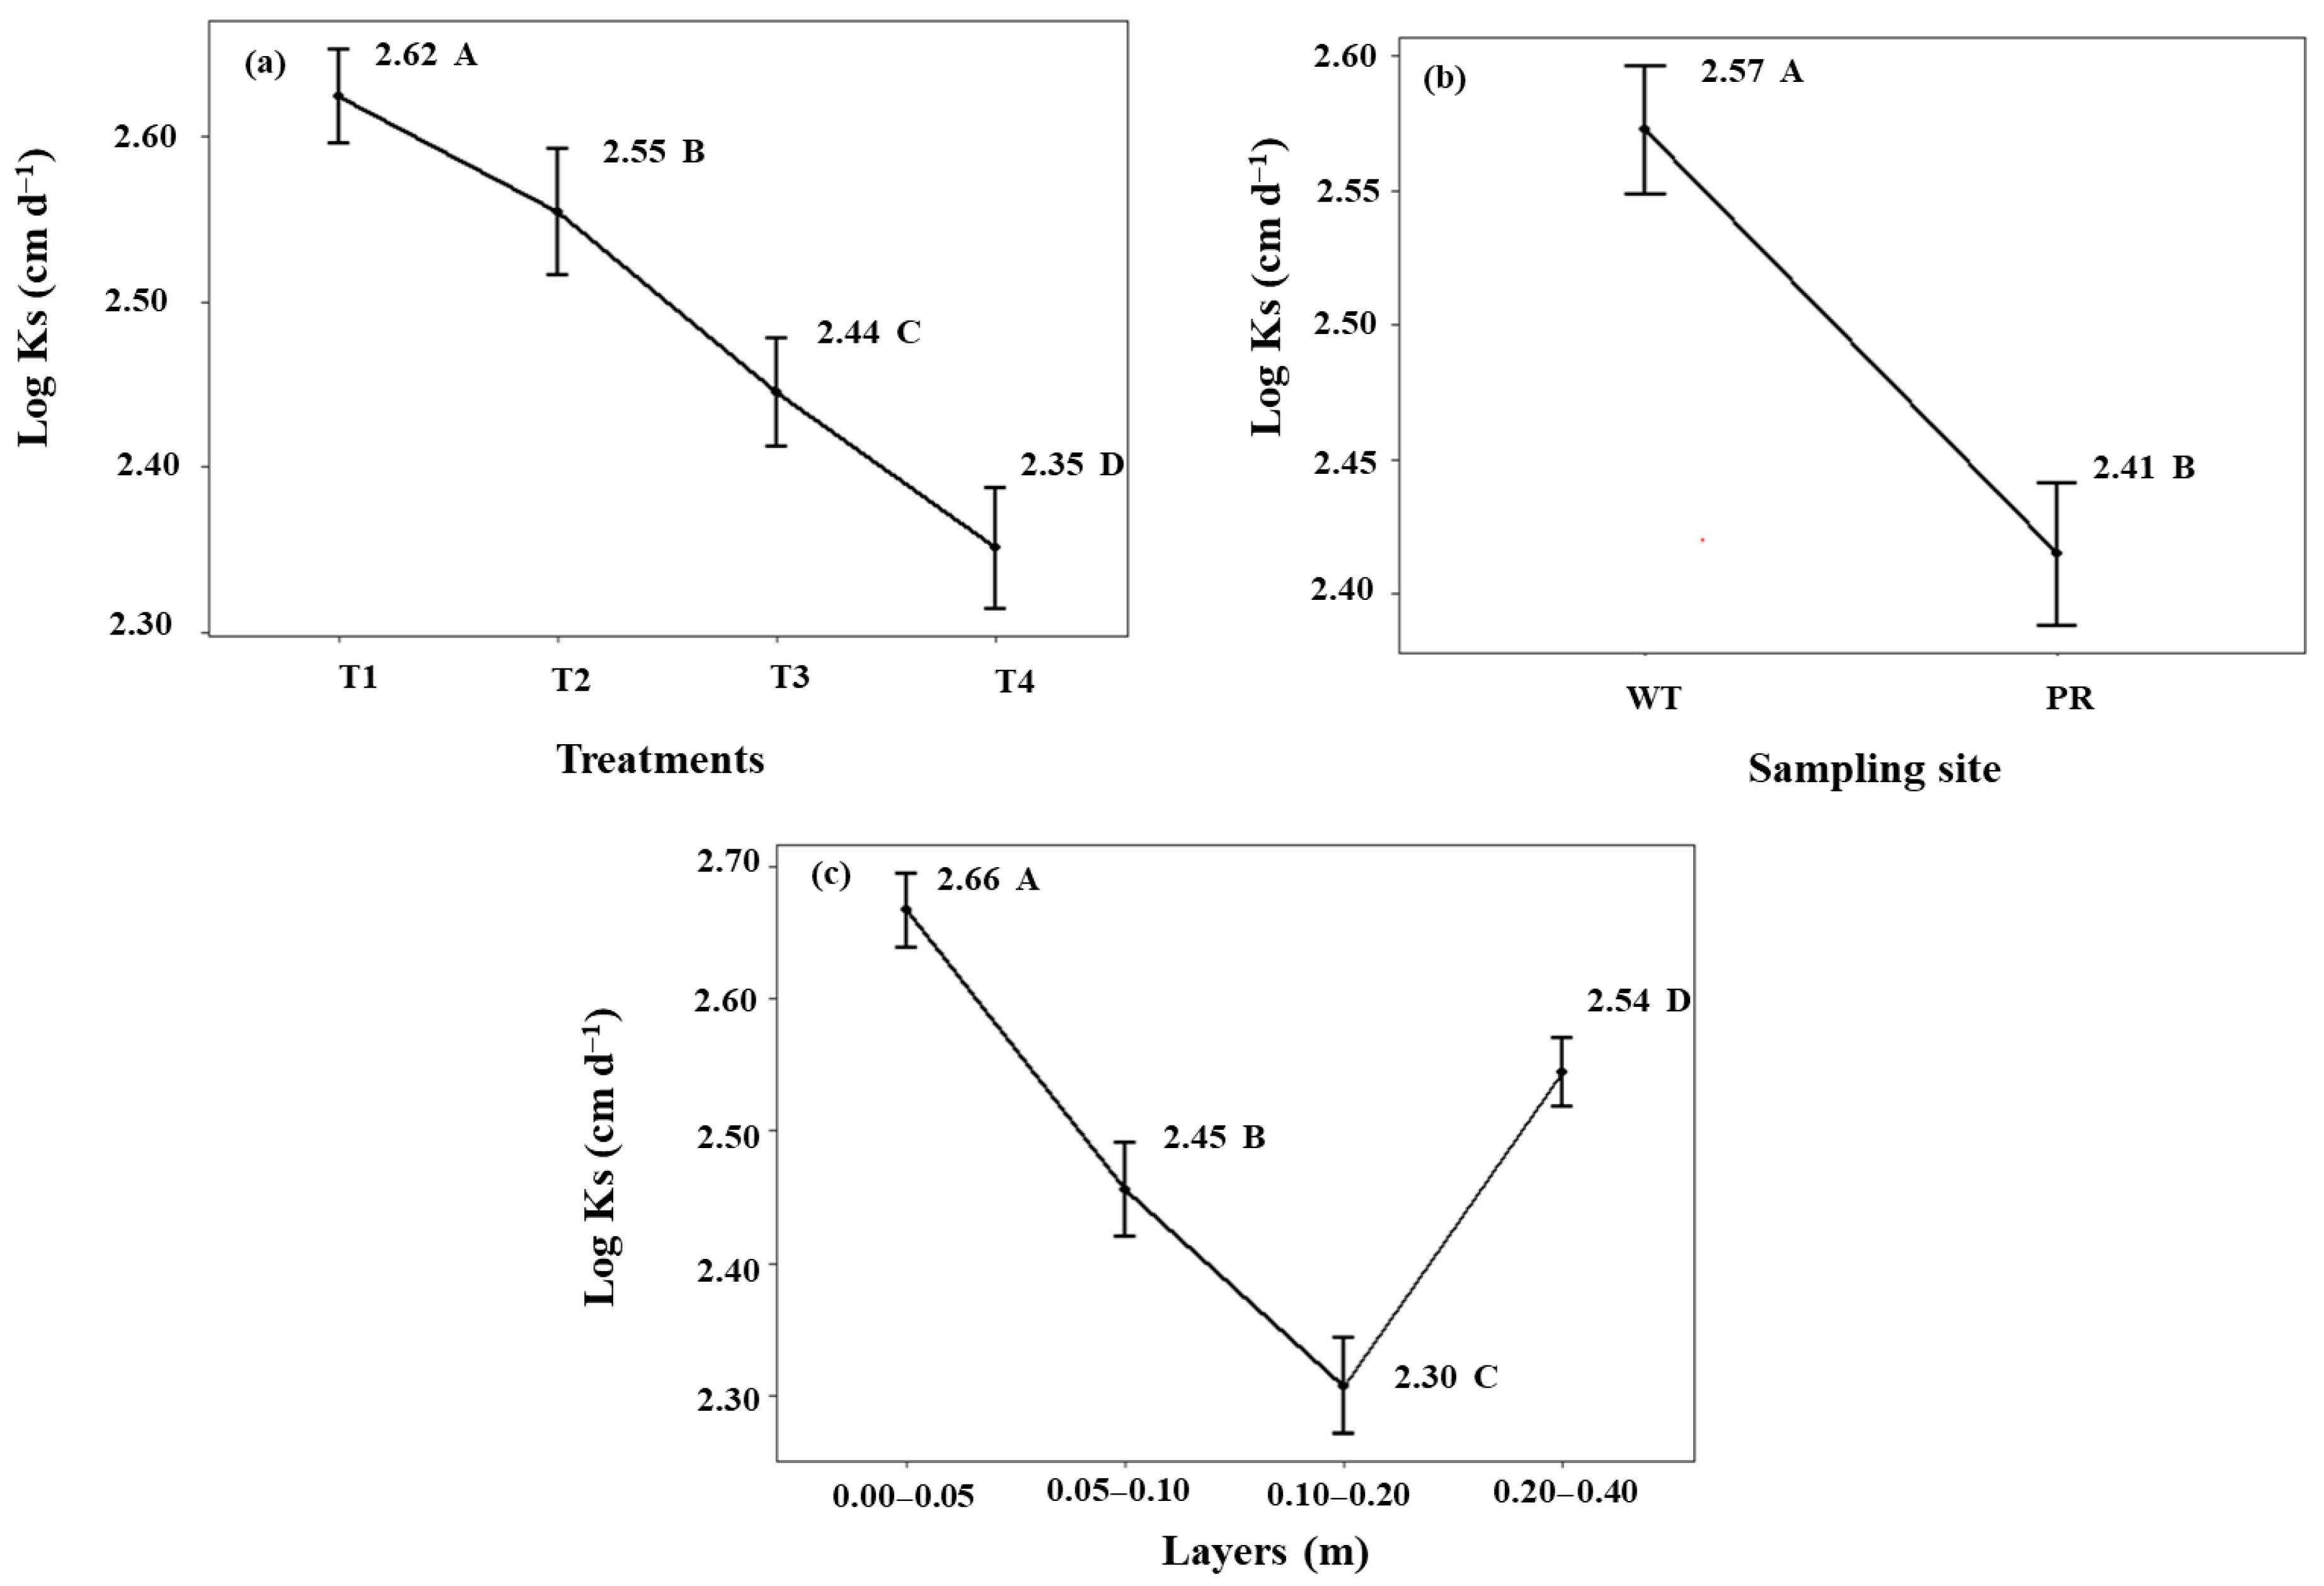
After mechanized harvesting of four sugarcane crop cycles, we observed no significant interaction between the factors (treatments x sampling site x layers) for saturated soil hydraulic conductivity. However, these factors were significant (p < 0.05) when analyzed individually (Figure 5). For the treatments, in the plant cane cycle (T1), Log (Ks) was higher compared with the other treatments, decreasing in the sequence T2 < T3 < T4 (Figure 5a). Like the other properties studied, Log (Ks) was higher at PR (Figure 5b). Significant differences were found for the soil layers, where the 0.10–0.20 m layer presented the lowest Log (Ks) value possibly due to the higher SPR and BD in the same layer (Figure 5c).
Soil compaction caused by machine traffic during harvest changed the saturated soil hydraulic conductivity (Figure 5). This effect negatively affects the main soil properties, productivity, and ecosystem services [10,20]. According to Mesquita and Moraes [45], saturated soil hydraulic conductivity is determined by the soil ability to conduct water depending on pore geometry and pore filling with water.
Figure 5 shows a marked reduction in Ks with increased harvest cycles, which is consistent with the literature, illustrating that compaction reduces macroporosity and affects water movement. Studies show that as the number of crop cycles (ratoons) increases, soil compaction induced by machine traffic in the crop cycles decreases the saturated soil hydraulic conductivity, thus reducing the volume of macropores that conduct water under saturated conditions [41]. Thus, a decrease in the saturated soil hydraulic conductivity reduces water storage in the soil due to lower infiltration, increasing the risk of soil erosion and greater surface runoff [10,46].
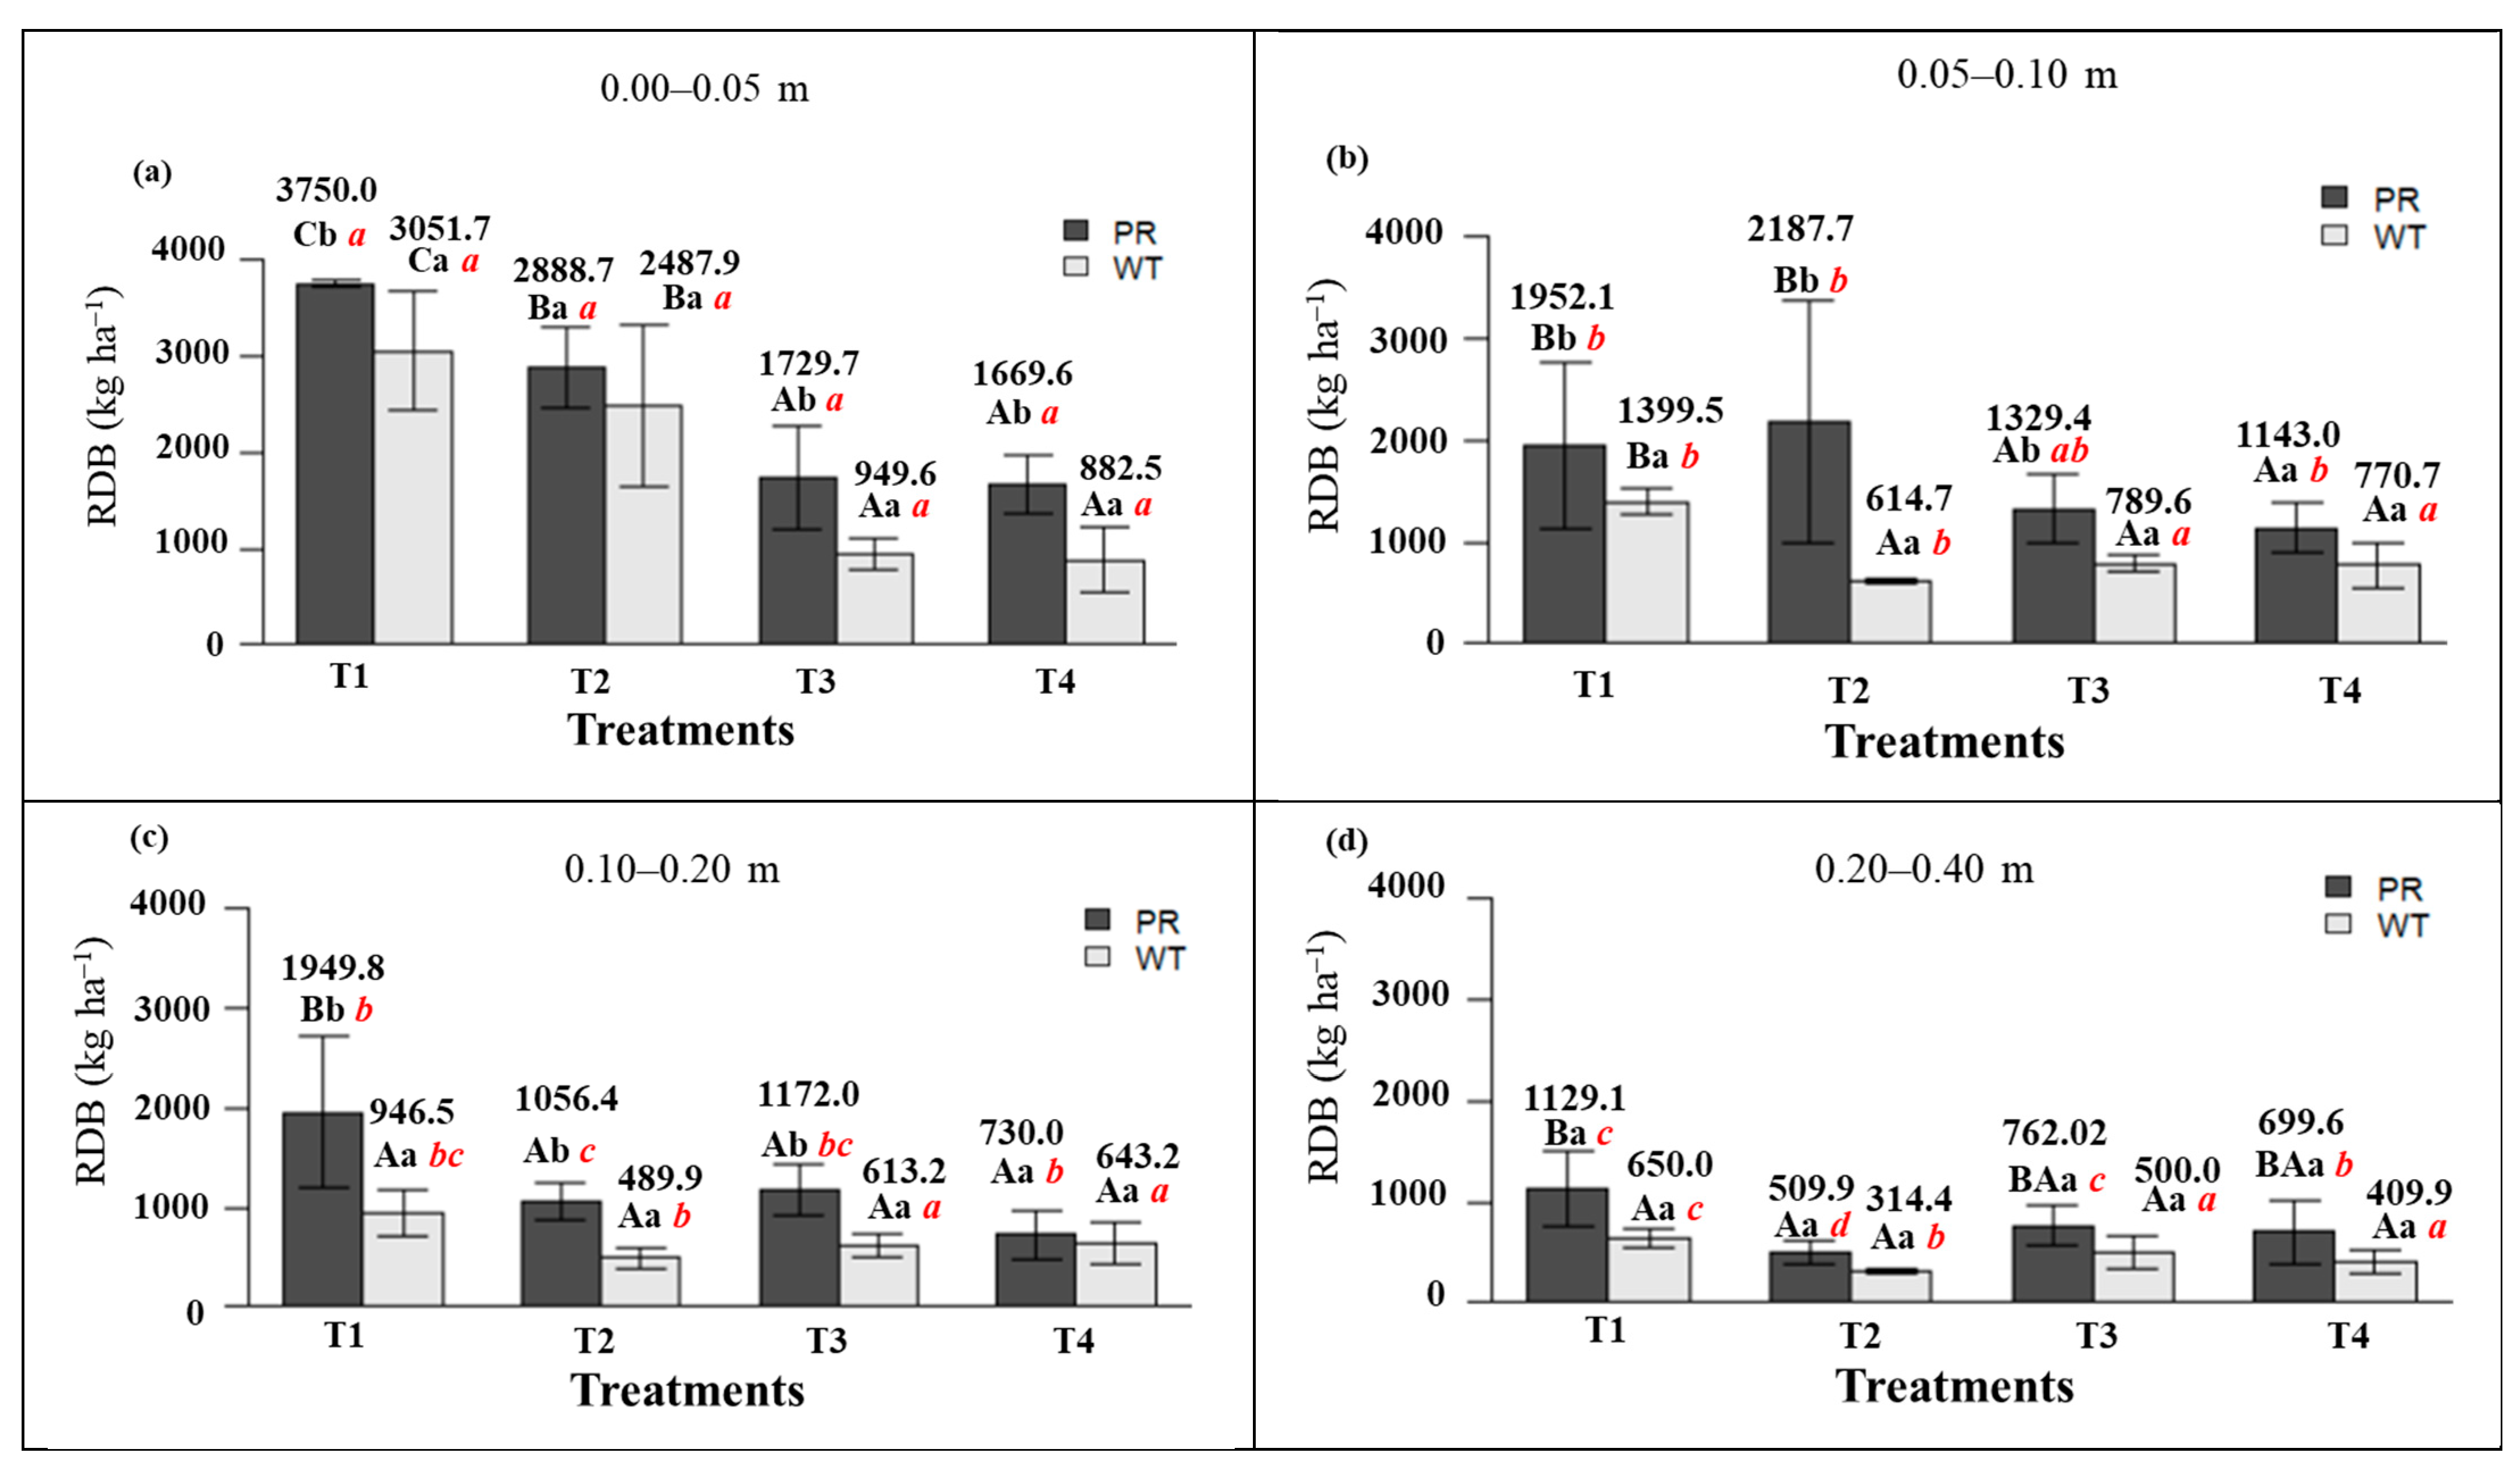
Root dry biomass (RDB) showed that sugarcane root growth was influenced by crop cycles at the sampling sites and soil layers (Figure 6). During the plant cane cycle (T1), the RDB obtained in the WT at the 0.00–0.05 and 0.05–0.10 m layers was significantly higher (p < 0.05) compared with the other treatments, ranging from 3051.7 kg ha−1 (T1) to 882.5 kg ha−1 (T4) and from 1399.5 kg ha−1 (T1) to 770.7 kg ha−1 (T4), respectively (Figure 6a,b), representing a decrease of about 28.9% at the 0.00–0.05 m layer and 55.06% at the 0.05–0.10 m layer.
For PR during T1, RDB at the 0.00–0.05 m and 0.05–0.10 m layers yielded statistically different means (p < 0.05) in comparison with the other treatments, ranging from 3757.0 kg ha−1 (T1) to 1669.6 kg ha−1 (T4) and from 1952.1 kg ha−1 (T1) to 1143.0 kg ha−1 (T4) (Figure 6a,b), representing a decrease of about 44.4% and 58.5% for both layers, respectively. Equal performance was observed for the 0.10–0.20 m layer, ranging from 1949.8 kg ha−1 (T1) to 730.0 kg ha−1 (T4), representing a decrease of about 37.43% (Figure 6c). For PR at the 0.20–0.40 m layer, statistically different means (p < 0.05) were obtained only between the T1 and the first ratoon cane cycle (T2), ranging from 1129.1 kg ha−1 (T1) to 509.9 kg ha−1 (T2), representing a decrease of around 45.1% in this layer. For the 0.10–0.20 m and 0.20–0.40 m layers in the WT, the means were not significant; however, higher RDB values were observed for T1.
For all treatments, RDB in the PR was higher than in the WT (p < 0.05) at the layers of 0.00–0.05 m (ranging from 3757.0 to 3051.7 kg ha−1), 0.05–0.10 m (1952.1 to 1399.5 kg ha−1) and 0.10–0.20 m (1949.8 to 946.5 kg ha−1) for T1 and for the second ratoon cane cycle (T3) at the layers of 0.00–0.05 m (1729.7 to 946.6 kg ha−1), 0.05–0.10 m (1329.4 to 789.6 kg ha−1) and 0.10–0.20 m (1172.06 to 613.2 kg ha−1) (Figure 6a–c). For T2, RDB showed a statistical difference between the evaluation sites at the layers of 0.05–0.10 m (2187.7 to 614.7 kg ha−1) and 0.10–0.20 m (1056.4 to 489.9 kg ha−1), respectively. The third ratoon cane cycle (T4) presented a difference between the means only for the 0.00–0.05 m layer (1669.6 to 882.5 kg ha−1) between the evaluation sites. For the 0.20–0.40 m layer, the means were not significant between WT and PR.
Surface layers of 0.00–0.05 m, 0.05–0.10 m, and 0.10–0.20 m at both sampling sites yielded the highest RDB value, with a sharp decrease at the 0.20–0.40 m layer, presenting statistically different means between them (p < 0.05) (Figure 6). In T1, mean RDB at the 0.00–0.05 m layer was statistically different from those in other layers at both evaluation sites; additionally, the 0.05–0.10 m layer differed from the 0.20–0.40 m layer. In T2, all layers showed different means between them for PR, unlike WT where the 0.00–0.05 m layer differed from the others, with the deeper layers showing statistically equal values.
In the second and third ratoon cane cycles (T3 and T4), no statistical difference was observed between the layers at WT. However, RDB in the PR at the 0.00–0.05 m layer differed from RDB at the 0.10–0.20 m and 0.20–0.40 m layers for T3. On the other hand, the 0.00–0.05 m layer yielded a different mean value for T4 when compared with the other layers.
Root system behavior influenced the crop cycles due to significant differences in RDB value (Figure 6). RDB concentration at PR in surface layers was consistent with previous findings in the literature investigating sugarcane areas [16,26,28,47].
Higher RDB values are expected during T1 due to favorable soil conditions. On the other hand, RDB values tend to decline following the crop cycles due to machine traffic in harvest operations, causing soil compaction and consequently preventing root development (Figure 6). The type of soil tillage can be harmful, leading to reduced RDB. According to Oliveira et al. [13], adopting a no-till system resulted in higher root growth and, consequently, higher RDB compared with other tillage systems, unlike our study which used conventional tillage. Moreover, according to Barbosa et al. [3] and Lovera et al. [12], medium texture soils tend to present higher RDB amounts, which is consistent with our study.
RDB behavior was equal for root volume and area, with the highest values obtained during T1 at the superficial layers of the soil (Figure 7). For the two-way interaction of treatments vs. sampling site, mean root volume (RV) values showed significant differences (p < 0.05). For PR, the first three crop cycles (T1, T2, and T3) were similar to each other but differed from T4, ranging from 6.7 to 5.7 cm3 dm−3 (Figure 6a). Unlike PR, WT had different mean values for T1 in relation to the other treatments, with T2 and T3 presenting similar values, but different from T4, ranging from 5.3 to 2.2 cm3 dm−3, respectively. Significant differences between the mean values were obtained when comparing the sampling sites within the same treatment.
Similar behavior was observed for root area (RA), where T1 and T2 were equivalent, but with T1 presenting different mean values (p < 0.05) from T3 and T4 at PR, ranging from 156.8 to 127.4 cm2 dm−3, respectively (Figure 7). At WT, the plant cane cycle (T1) presented significantly different mean values (p < 0.05) from the other treatments, ranging from 147.5 to 73.6 cm2 dm−3 (Figure 7c). Except for T1, the other treatments yielded different mean values when comparing the sampling sites. For the individual factor (layers) analysis, both RV and RA showed different mean values (p < 0.05) between the layers, achieving their highest values in the superficial layers (Figure 7b,d).
Like RDB, the other root system properties (RV and RA) were higher for the plant cane cycle (T1) (Figure 7). According to Alameda et al. [48], soil compaction can affect root characteristics and functioning, resulting in smaller roots. Esteban et al. [16] observed that an increase in surface area and root volume favors the development of the aerial part of the plants, promoting a greater exploration in soil volume.
Due to the continuous machine traffic in the crop cycles, the induced compaction tends to decrease the root area and volume, consequently decreasing the absorption of water and nutrients by the plant [49] and generating a gradual decrease in productivity. According to Faroni and Trivelin [50], after the sugarcane crop is cut, the roots remain active for a period and are later replaced by ratoon roots, resulting in root biomass accumulation. Hence, the more cuts in the sugarcane, the greater the possibility of superficially located ratoon roots.
The highest results of RV and RA in T1 (Figure 8) are consistent with the lowest SPR and BD values found in our study (Figure 3 and Figure 4). Moreover, RDB had an inversely proportional linearity with SPR and BD (Figure 8a,b). On the other hand, the relation between RDB and productivity was directly proportional, providing a higher level of uniformity for T1 (values close to the straight line) when compared with the third ratoon cycle (T4) (values dispersed along the straight line) (Figure 8c).
Biometric variables such as number of plants per hectare, height, diameter, and sugarcane productivity were significantly influenced by the treatment (Table 3). T1 yielded higher productivity compared with the other treatments, ranging from 95.96 to 40.04 Mg ha−1. Similar behavior was observed for the other biometric variables. According to Awe et al. [41], an increase in productivity of the plant cane cycle can be attributed to favorable soil conditions due to reduced soil density.
Stalk diameter showed significant differences (p < 0.05) only for T4, decreasing in the sequence T4 < T3 < T2 < T1 (Table 3). An increase in stalks leads to higher productivity level, as reported by Gava et al. [51] when analyzing varieties. A morphological property with the smallest variation is stalk diameter because this variable depends on the genetic characteristics of the plant, number of tillers, the space used, leaf height, and climatic conditions [52,53].
Similar behavior was observed for height and number of plants per hectare (Table 3). Height and number of plants per hectare were highest in the first harvest (T1), helping to increase crop productivity. Plant height is a key variable to ensure good yields since it is highly correlated with biomass [54].

4. Conclusions

Successive mechanized harvests under a controlled traffic system significantly affected soil structure, reduced root development, and lowered sugarcane yield. Plant cane and first ratoon cycles showed better physical conditions and productivity when compared with the second and third ratoon cycles. These results support the recommendation of planning field renewal and controlled traffic before the third ratoon to prevent excessive soil degradation and preserve crop productivity. Future studies should evaluate mitigation strategies and replicate findings in diverse soil-climate contexts. By providing robust evidence on the long-term effects of mechanized harvesting, this study contributes to developing sustainable sugarcane production systems and informing agricultural policy and management guidelines worldwide.

Author Contributions

Conceptualization, I.Q.M.V. and Z.M.d.S.; methodology, I.Q.M.V., J.A.S.P. and R.B.d.S.; validation, Z.M.d.S., R.L.M.T. and R.B.d.S.; investigation, I.Q.M.V., Z.M.d.S., R.L.M.T. and R.B.d.S.; data curation, I.Q.M.V., G.S.C., J.A.S.P., E.M.G. and V.d.S.B.; writing—original draft preparation, I.Q.M.V.; writing—review and editing, G.S.C., J.A.S.P., E.M.G., V.d.S.B., Z.M.d.S., R.L.M.T. and R.B.d.S.; visualization, I.Q.M.V.; supervision, Z.M.d.S., R.L.M.T. and R.B.d.S.; project administration, Z.M.d.S.; funding acquisition, Z.M.d.S. All authors have read and agreed to the published version of the manuscript.

Funding

Fundação AGRISUS—Agricultura Sustentável (Process nº PA 3054/21). Fundação de Amparo à Pesquisa do Estado de São Paulo (FAPESP)—Process nº 2021/09077-2).

Data Availability Statement

Data are available by the link: https://doi.org/10.47749/T/UNICAMP.2024.1404377.

Acknowledgments

To the “Coordenação de Aperfeiçoamento de Pessoal de Nível Superior—Brasil (CAPES)”—Financing Code 001; and process 88882.434687/2019-01.

Conflicts of Interest

The authors declare no conflicts of interest.

References

  1. CONAB—COMPANHIA NACIONAL DE ABASTECIMENTO. Acompanhamento da Safra Brasileira de Cana-de-Açúcar; v.10, n.3; CONAB: Brasília, Brazil, 2023. [Google Scholar]
  2. Silva, R.P.; Rolim, M.M.; Gomes, I.F.; Pedrosa, E.M.; Tavares, U.E.; Santos, A.N. Numerical modeling of soil compaction in a sugarcane crop using the finite element method. Soil Tillage Res. 2018, 181, 1–10. [Google Scholar] [CrossRef]
  3. Barbosa, L.C.; Magalhães, P.S.G.; Bordonal, R.O.; Cherubin, M.R.; Castioni, G.A.F.; Tenelli, S.; Franco, H.C.J.; Carvalho, J.L.N. Soil physical quality associated with tillage practices during sugarcane planting in south-central Brazil. Soil Tillage Res. 2019, 195, 104383. [Google Scholar] [CrossRef]
  4. Esteban, D.A.A.; Souza, Z.M.; Silva, R.B.; Lima, E.S.; Lovera, L.H.; Oliveira, I.N. Impact of permanent traffic lanes on the soil physical and mechanical properties in mechanized sugarcane fields with the use of automatic steering. Geoderma 2020, 362, 97–114. [Google Scholar] [CrossRef]
  5. Luz, F.B.; Gonzaga, L.C.; Castioni, G.A.F.; Lima, R.P.; Carvalho, J.L.N.; Cherubin, M.R. Controlled traffic farming maintains soil physical functionality in sugarcane fields. Geoderma 2023, 432, 116427. [Google Scholar] [CrossRef]
  6. Bordonal, R.O.; Carvalho, J.L.N.; Lal, R.; Figueiredo, E.B.; Oliveira, B.G.; La Scala Júnior, N. Sustainability of sugarcane production in Brazil. A review. Agron. Sustain. Dev. 2018, 38, 13. [Google Scholar] [CrossRef]
  7. Martins, M.B.; Marques Filho, A.C.; Drudi, F.S.; Bortolheiro, F.P.A.P.; Vendruscolo, E.P.; Esperancini, M.S.T. Economic efficiency of mechanized harvesting of sugarcane at different operating speeds. Sugar Tech 2021, 23, 428–432. [Google Scholar] [CrossRef]
  8. Guimarães Júnnyor, W.S.; Diserens, E.; De Maria, I.C.; Araujo-Junior, C.F.; Farhate, C.V.V.; Souza, Z.M. Prediction of soil stresses and compaction due to agricultural machines in sugarcane cultivation systems with and without crop rotation. Sci. Total Environ. 2019, 681, 424–434. [Google Scholar] [CrossRef]
  9. Jimenez, K.J.; Rolim, M.M.; Gomes, I.F.; Lima, R.P.; Berrío, L.L.A.; Ortiz, P.F.S. Numerical analysis applied to the study of soil stress and compaction due to mechanised sugarcane harvest. Soil Tillage Res. 2021, 206, 104847. [Google Scholar] [CrossRef]
  10. Keller, T.; Sandin, M.; Colombi, T.; Horn, R.; Or, D. Historical increase in agricultural machinery weights enhanced soil stress levels and adversely affected soil functioning. Soil Tillage Res. 2019, 194, 104293. [Google Scholar] [CrossRef]
  11. Castioni, G.A.F.; Lima, R.P.; Cherubin, M.R.; Bordonal, R.O.; Rolim, M.M.; Carvalho, J.L.N. Machinery traffic in sugarcane straw removal operation: Stress transmitted and soil compaction. Soil Tillage Res. 2021, 213, 105122. [Google Scholar] [CrossRef]
  12. Lovera, L.H.; Souza, Z.M.; Esteban, D.A.A.; Oliveira, I.N.; Farhate, C.V.; Lima, E.S.; Panosso, A.R. Sugarcane root system: Variation over three cycles under different soil tillage systems and cover crops. Soil Tillage Res. 2021, 208, 104866. [Google Scholar] [CrossRef]
  13. Oliveira, I.N.; Souza, Z.M.; Bolonhezi, D.; Totti, M.C.V.; Moraes, M.T.; Lovera, L.H.; Lima, E.S.; Esteban, D.A.A.; Oliveira, C.F. Tillage systems impact on soil physical attributes, sugarcane yield and root system propagated by pre-sprouted seedlings. Soil Tillage Res 2022, 223, 105460. [Google Scholar] [CrossRef]
  14. Stoessel, F.; Sonderegger, T.; Bayer, P.; Hellweg, S. Assessing the environmental impacts of soil compaction in Life Cycle Assessment. Sci. Total Environ. 2018, 630, 913–921. [Google Scholar] [CrossRef]
  15. Castioni, G.A.F.; Cherubin, M.R.; Menandro, L.M.S.; Sanches, G.M.; Bordonal, R.O.; Barbosa, L.C.; Franco, H.C.J.; Carvalho, J.L.N. Soil physical quality response to sugarcane straw removal in Brazil: A multi approach assessment. Soil Tillage Res. 2018, 184, 301–309. [Google Scholar] [CrossRef]
  16. Esteban, D.A.A.; Souza, Z.M.; Tormena, C.A.; Lovera, L.H.; Lima, E.S.; Oliveira, I.N.; Ribeiro, N.P. Soil compaction, root system and productivity of sugarcane under different row spacing and controlled traffic at harvest. Soil Tillage Res. 2019, 187, 60–71. [Google Scholar] [CrossRef]
  17. Cavalcanti, R.Q.; Rolim, M.M.; Lima, R.P.; Tavares, U.E.; Pedrosa, E.M.R.; Cherubin, M.R.; Gomes, I.F. Soil physical and mechanical attributes in response to successive harvests under sugarcane cultivation in Northeastern Brazil. Soil Tillage Res. 2019, 189, 140–147. [Google Scholar] [CrossRef]
  18. Carvalho, M.L.; Luz, F.B.; Lima, R.P.; Cavalieri-Polizeli, K.M.V.; Carvalho, J.L.N.; Cherubin, M.R. Assessment of soil physical quality and water flow regulation under straw removal management in sugarcane production fields. Sustainability 2022, 14, 841. [Google Scholar] [CrossRef]
  19. Delmond, J.G.; Guimarães Junnyor, W.S.; Brito, M.F.; Rossoni, D.F.; Araujo-Junior, C.F.; Severiano, E.C. Which operation in mechanized sugarcane harvesting is most responsible for soil compaction? Geoderma 2024, 448, 116979. [Google Scholar] [CrossRef]
  20. Horn, R.; Fleige, H. Risk assessment of subsoil compaction for arable soils in Northwest Germany at farm scale. Soil Tillage Res. 2009, 102, 201–208. [Google Scholar] [CrossRef]
  21. Khodaverdilo, H.; Cheraghabdal, H.K.; Bagarello, V.; Iovino, M.; Asgarzadeh, H.; Dashtaki, S.G. Ring diameter effects on determination of field-saturated hydraulic conductivity of different loam soils. Geoderma 2017, 303, 60–69. [Google Scholar] [CrossRef]
  22. Liu, X.; Zhu, Y.; Bennett, J.M.; Wu, L.; Li, H. Effects of sodium adsorption ratio and electrolyte concentration on soil saturated hydraulic conductivity. Geoderma 2022, 414, 115772. [Google Scholar] [CrossRef]
  23. Hervé-Fernández, P.; Muñoz-Arriagada, R.; Glucevic-Almonacid, C.; Bahamonde-Vidal, L.; Radic-Schilling, S. Influence of rangeland land cover on infiltration rates, field-saturated hydraulic conductivity, and soil Water repellency in Southern Patagonia. Rangel Ecol. Manag. 2023, 90, 92–100. [Google Scholar] [CrossRef]
  24. Alagna, V.; Bagarello, V.; Di Prima, S.; Giordano, G.; Iovino, M. Testing infiltration run effects on the estimated water transmission properties of a sandy-loam soil. Geoderma 2016, 267, 24–33. [Google Scholar] [CrossRef]
  25. Iovino, M.; Castellini, M.; Bagarello, V.; Giordano, G. Using static and dynamic indicators to evaluate soil physical quality in a Sicilian area. Land Degrad. Dev. 2016, 27, 200–210. [Google Scholar] [CrossRef]
  26. Otto, R.; Silva, A.P.P.; Franco, H.C.J.; Oliveira, E.C.A.; Trivelin, P.C.O. High soil penetration resistance reduces sugarcane root system development. Soil Tillage Res. 2011, 117, 201–210. [Google Scholar] [CrossRef]
  27. Ortiz, P.F.S.; Rolim, M.M.; Lima, R.P.; Tormena, C.A.; Cavalcanti, R.Q.; Pedrosa, E.M.R. A Soil physical assessment over three successive burned and unburned sugarcane annual harvests. Sugar Tech 2023, 25, 518–530. [Google Scholar] [CrossRef]
  28. Barbosa, L.C.; Souza, Z.M.; Franco, H.C.J.; Otto, R.; Rossi Neto, J.; Garside, A.L.; Carvalho, J.L.N. Soil texture affects root penetration in Oxisols under sugarcane in Brazil. Geoderma Reg. 2018, 13, 15–25. [Google Scholar] [CrossRef]
  29. Colombi, T.; Keller, T. Developing strategies to recover crop productivity after soil compaction—Plant eco-physiological perspective. Soil Tillage Res. 2019, 191, 156–161. [Google Scholar] [CrossRef]
  30. Luz, F.B.; Carvalho, M.L.; Borba, D.A.; Schiebelbein, B.E.; Lima, R.P.; Cherubin, M.R. Linking soil water changes to soil physical quality in sugarcane expansion areas in Brazil. Water 2020, 12, 3156. [Google Scholar] [CrossRef]
  31. Alvares, C.A.; Stape, J.L.; Sentelhas, P.C.; Gonçalves, J.L.M.; Sparovek, G. Köppen’s climate classification map for Brazil. Meteorol. Z. 2013, 22, 711–728. [Google Scholar] [CrossRef]
  32. Santos, H.G.; Jacomine, P.K.T.; Anjo, L.H.C.; Oliveira, V.A.; Lumbrelas, J.F.; Coelho, M.R.; Almeida, J.A.; Araujo Filho, J.C.; Oliveira, J.B.; Cunha, T.J.F. Sistema Brasileiro de Classificação de Solos, 5th ed.; Revista e Ampliada; Embrapa: Brasília, Brazil, 2018. [Google Scholar]
  33. Soil Survey Staff. Keys to Soil Taxonomy, 12th ed.; United States Department of Agriculture, Natural Resources Conservation Service: Washington, DC, USA, 2014. [Google Scholar]
  34. Teixeira, P.C.; Donagemma, G.K.; Fontana, A.; Teixeira, W.G. Manual de Métodos de Análise de Solos, 3rd ed.; edição Revista e Ampliada; Embrapa: Brasília, Brazil, 2017; 573p. [Google Scholar]
  35. UMS GmbH. Operation Manual KSAT; UMS GmbH: Munich, Germany, 2019. [Google Scholar]
  36. Guimarães Júnnyor, W.S.; De Maria, I.C.; Araujo-Junior, C.F.; Diserens, E.; Severiano, E.C.; Farhate, C.V.V.; Souza, Z.M. Conservation systems change soil resistance to compaction caused by mechanised harvesting. Ind. Crops Prod. 2022, 177, 114532. [Google Scholar] [CrossRef]
  37. Luz, F.B.; Castioni, G.A.F.; Tormena, C.A.; Freitas, R.S.; Carvalho, J.L.N.; Cherubin, M.R. Soil tillage and machinery traffic influence soil water availability and air fluxes in sugarcane fields. Soil Tillage Res. 2022, 223, 105459. [Google Scholar] [CrossRef]
  38. Souza, G.S.; Souza, Z.M.; Cooper, M.; Tormena, C.A. Controlled traffic and soil physical quality of an oxisol under sugarcane cultivation. Sci. Agric. 2015, 72, 270–277. [Google Scholar] [CrossRef]
  39. Silva, R.B.; Iori, P.; Souza, Z.M.; Pereira, D.M.G.; Vischi Filho, O.J.; Silva, F.A.M. Contact pressures and the impact of farm equipment on Latosol with the presence and absence of sugarcane straw. Cienc. Agrotec. 2016, 40, 265–278. [Google Scholar] [CrossRef]
  40. Cherubin, M.R.; Karlen, D.L.; Cerri, C.E.P.; Franco, A.L.C.; Tormena, C.A.; Davies, C.A.; Cerri, C.A. Soil quality indexing strategies for evaluating sugarcane expansion in Brazil. PLoS ONE 2016, 11, e0150860. [Google Scholar] [CrossRef] [PubMed]
  41. Awe, G.O.; Reichert, J.M.; Fontanela, E. Sugarcane production in the subtropics: Seasonal changes in soil properties and crop yield in no-tillage, inverting and minimum tillage. Soil Tillage Res. 2020, 196, 104447. [Google Scholar] [CrossRef]
  42. Schjønning, P.; Van Den Akker, J.J.H.; Keller, T.; Greve, M.H.; Lamandé, M.; Simojoki, A.; Stettler, M.; Arvidsson, J.; Reuning-Madsen, H. Driver- Pressure-State-Impact-Response (DPSIR) Analysis and Risk Assessment for Soil Compaction—A European Perspective. Adv. Agron. 2015, 133, 183–237. [Google Scholar]
  43. Lima, C.C.; De Maria, I.C.; Guimarães Júnnyor, W.S.; Figueiredo, G.C.; Dechen, S.C.F.; Bolonhezi, D. Root parameters of sugarcane and soil compaction indicators under deep strip tillage and conventional tillage. Sci. Rep. 2022, 12, 18537. [Google Scholar] [CrossRef] [PubMed]
  44. Cavalcanti, R.Q.; Rolim, M.M.; Lima, R.P.; Tavares, U.E.; Pedrosa, E.M.R.; Cherubin, M.R. Soil physical changes induced by sugarcane cultivation in the Atlantic Forest biome, northeastern Brazil. Geoderma 2020, 370, 114353. [Google Scholar] [CrossRef]
  45. Mesquita, M.G.B.F.; Moraes, S.O. A dependência entre a condutividade hidráulica saturada e atributos físicos do solo. Ci Rural 2004, 34, 963–969. [Google Scholar] [CrossRef]
  46. Pinheiro, E.A.R.; De Jong Van Lier, Q.; Šimůnek, J. The role of soil hydraulic properties in crop water use efficiency: A process-based analysis for some Brazilian scenarios. Agric. Syst. 2019, 173, 364–377. [Google Scholar] [CrossRef]
  47. Silva-Olaya, A.M.; Davies, C.A.; Cerri, C.E.P.; Allen, D.J.; Mello, F.F.C.; Cerri, C.C. Quantifying above and belowground biomass carbon inputs for sugar-cane production in Brazil. Soil Res. 2017, 55, 640–648. [Google Scholar] [CrossRef]
  48. Alameda, D.; Anten, N.P.R.; Villar, R. Soil compaction effects on growth and root traits of tobacco depend on light, water regime and mechanical stress. Soil Tillage Res. 2012, 120, 121–129. [Google Scholar] [CrossRef]
  49. Souza, G.S.; Souza, Z.M.; Silva, R.B.; Barbosa, R.S.; Araújo, F.S. Effects of traffic control on the soil physical quality and the cultivation of sugarcane. Rev. Bras. Ci Solo 2014, 38, 135–146. [Google Scholar] [CrossRef]
  50. Faroni, C.E.; Trivelin, P.C.O. Quantificação de raízes metabolicamente ativas de cana-de-açúcar. Pesq. Agropec. Bras. 2006, 41, 1007–1013. [Google Scholar] [CrossRef]
  51. Gava, G.C.; Silva, M.A.; Silva, R.C.; Jeronimo, E.M.; Cruz, J.S.; Kölln, O.T. Produtividade de três cultivares de cana-de-açúcar sob manejos de sequeiro e irrigado por gotejamento. Rev. Bras. Eng. Agric. Ambient. 2011, 15, 250–255. [Google Scholar] [CrossRef]
  52. Costa, C.T.S.; Ferr, V.M.; Endres, L.; Ferreira, D.T.R.; Gonçalves, E.R. Crescimento e produtividade de quatro variedades de cana-de-açúcar no quarto ciclo de cultivo. Rev. Caatinga 2011, 24, 56–63. [Google Scholar]
  53. Arcoverde, S.N.S.; Souza, C.M.A.; Orlando, R.C.; Silva, M.M.; Nascimento, J.M. Níveis de compactação e sistemas de preparo sobre atributos físicos do solo e componentes de produção da soja. Rev. Eng. Agric. 2019, 27, 142–156. [Google Scholar]
  54. Han, L.; Yang, G.; Dai, H.; Xu, B.; Yang, H.; Feng, H.; Li, Z. Modeling maize above-ground biomass based on machine learning approaches using UAV remote- sensing data. Plant Methods 2019, 15, 10. [Google Scholar] [CrossRef]
Figure 1. Schematic representation of soil sampling in sugarcane areas with different crop cycles in Frutal, Minas Gerais, Brazil. PR = planting row; WT = wheel track.
Agriengineering 07 00325 g001
Figure 2. Schematic representation for evaluation of the sugarcane root system in Frutal, Minas Gerais, Brazil. PR = planting row; WT = wheel track.
Agriengineering 07 00325 g002
Figure 3. Soil penetration resistance (SPR) after different cycles (treatments) of mechanized sugarcane harvesting. In the same soil layer (a) 0.00–0.05 m, (b) 0.05–0.10 m, (c) 0.10–0.20 m, (d) 0.20–0.40 m) Values followed by the same uppercase letter (comparing treatments at the same site), lowercase letter (comparing sites in the same treatment) do not differ from each other (t-test, p < 0.05). WT = wheel track; PR = planting row. Error bars indicate sample standard deviation.
Agriengineering 07 00325 g003
Figure 4. Soil bulk density (BD) after different cycles of mechanized sugarcane harvest: (a) two-way interaction of layer vs. site (a), values followed by the same uppercase letter (comparing sites at the same layer), lowercase letter (comparing layers in the same site) do not differ from each other (t-test, p < 0.05); (b) two-way interaction of layer vs. treatment (b), values followed by the same uppercase letter (comparing treatments at the same layer), lowercase letter (comparing layers in the same treatment) do not differ from each other (t-test, p < 0.05). WT = wheel track; PR = planting row. Error bars indicate sample standard deviation.
Agriengineering 07 00325 g004
Figure 5. Saturated soil hydraulic conductivity (Log Ks (cm d−1)) after mechanized harvest of four sugarcane crop cycles (a) Saturated soil hydraulic conductivity (Log Ks (cm d−1)) under different treatments, (b) saturated soil hydraulic conductivity (Log Ks (cm d−1)) at different sampling sites, and (c) saturated soil hydraulic conductivity (Log Ks (cm d−1)) at different soil layers (m). For individual interactions, values followed by the same letter do not differ from each other (t-test, p < 0.05). WT = wheel track; PR = planting row. Error bars indicate sample standard deviation.
Agriengineering 07 00325 g005
Figure 6. Root dry biomass (kg ha−1) after mechanized harvest of four sugarcane crop cycles (a) 0.00–0.05 m, (b) 0.05–0.10 m, (c) 0.10–0.20 m, (d) 0.20–0.40 m. For the three-way interaction of treatment vs. site vs. layers, values followed by the same uppercase letter (comparing treatments at the same site in the same layer), lowercase letter (comparing sites in the same treatment and in the same layer), lowercase in italics superscripted in red (comparing layers at the same site and in the same treatment) do not differ from each other (t-test, p < 0.05). WT = wheel track; PR = planting row. Error bars indicate sample standard deviation.
Agriengineering 07 00325 g006
Figure 7. Root system growth (area and volume) after mechanized harvest of four sugarcane crop cycles. For the two-way interaction of treatment vs. site (a,c), values followed by the same uppercase letter (comparing treatments at the same site) and lowercase letter (comparing sites in the same treatment) do not differ from each other (t-test, p < 0.05). For the individual interaction (b,d), values followed by the same letter do not differ from each other (t-test, p < 0.05). RV = root volume (cm3 dm−3); RA = root area (cm2 dm−3); WT = wheel track; PR = planting row. Error bars indicate sample standard deviation.
Agriengineering 07 00325 g007
Figure 8. Linear regression between root dry biomass, productivity, bulk density, and soil penetration resistance (0.00–0.40 m) for the four mechanized harvesting of sugarcane cycles in Frutal, Minas Gerais, Brazil. (a) The blue line represents the regression between soil penetration resistance (SPR) and root dry biomass, while the red circles indicate predicted values. The X-axis shows root dry biomass values, and the Y-axis shows SPR values, (b) The blue line represents the regression between soil bulk density (BD) and root dry biomass, while the red circles indicate predicted values. The X-axis shows root dry biomass values, and the Y-axis shows BD values and (c) The blue line represents the regression between productivity and root dry biomass, while the red circles indicate predicted values. The X-axis shows root dry biomass values, and the Y-axis shows productivity values. In all figures, the blue line represents the regression between the variables on the X- and Y-axes, showing the overall trend. The red circles indicate the predicted values from the regression model for each observation.
Agriengineering 07 00325 g008
Table 1. Characterization of physical properties of the dystrophic Red Latosol soil in the experimental area with sugarcane crops in Frutal, Minas Gerais, Brazil.
SSLayerBDTPMiPMaPSPR
(m)(Mg m−3) (m3 m−3) (MPa)
PR0.00–0.051.43 (0.13)0.44 (0.04)0.32 (0.03)0.10 (0.03)0.66 (0.26)
0.05–0.101.44 (0.11)0.41 (0.04)0.31 (0.05)0.10 (0.04)0.84 (0.30)
0.10–0.201.59 (0.08)0.40 (0.05)0.32 (0.05)0.08 (0.03)0.91 (0.28)
0.20–0.401.49 (0.11)0.39 (0.05)0.32 (0.03)0.07 (0.03)0.93 (0.37)
WT0.00–0.051.58 (0.11)0.39 (0.06)0.33 (0.04)0.04 (0.01)1.24 (0.31)
0.05–0.101.68 (0.10)0.36 (0.04)0.30 (0.03)0.05 (0.02)1.54 (0.57)
0.10–0.201.74 (0.12)0.37 (0.03)0.31 (0.02)0.06 (0.02)1.89 (0.51)
0.20–0.401.62 (0.15)0.38 (0.03)0.32 (0.02)0.05 (0.02)1.21 (0.36)
SS = sampling site; BD = bulk density; TP = total porosity; MiP = microporosity; MaP = macroporosity; SPR = soil penetration resistance; PR = planting row; WT = wheel track; values in parentheses indicate the standard deviation of the properties.
Table 2. Microporosity (MiP) and macroporosity (MaP) after mechanized harvesting of four sugarcane crop cycles. For the two-way interaction of treatment vs. site, values followed by the same uppercase letter in the row (comparing treatments at the same site) and lowercase letters (comparing sites in the same treatment) did not differ from each other (t-test, p < 0.05). For the two-way interaction of site vs. layer, values followed by the same uppercase letter in the row (comparing layer at the same site) and lowercase letters (comparing sites at the same layer) did not differ from each other (t-test, p < 0.05). WT = wheel track; PR = planting row.
Macroporosity (m3 m−3)
TreatmentT1T2T3T4
WT0.29 Aa0.29 Aa0.33 Ba0.39 Ca
PR0.29 Aa0.30 Aa0.33 Ba0.34 Bb
Layer (m)0.00–0.050.05–0.100.10–0.200.20–0.40
WT0.35 Aa0.32 Ba0.32 Ba0.32 Ba
PR0.31 Ab0.32 Aa0.30 Aa0.32 Aa
Macroporosity (m3 m−3)
TreatmentT1T2T3T4
WT0.061 Ab0.056 Ab0.059 Ab0.046 Ab
PR0.11 Aa0.098 Aba0.089 Ba0.062 Cb
Layer (m)0.00–0.050.05–0.100.10–0.200.20–0.40
WT0.047 Aa0.057 Aa0.060 Aa0.058 Aa
PR0.10 Ab0.10 Ab0.080 ABb0.073 Ba
PR = planting row; WT = wheel track; T1 = after first harvest—plant cane (area 1); T2 = after second harvest—first ratoon cane (area 2); T3 = after third harvest—second ratoon cane (area 3); T4 = after fourth harvest—third ratoon cane (area 4).
Table 3. Productivity and biometric variables after mechanized harvesting of four sugarcane crop cycles in Frutal, Minas Gerais, Brazil.
TreatmentProductivity (Mg ha−1)Diameter (cm)Height (m)NP/ha−1
T195.96 a3.03 a3.35 a57.33 a
T274.34 b2.95 a2.65 b55.67 a
T360.43 c2.92 a2.51 bc48.93 b
T440.04 d2.68 b2.26 c45.73 b
NP/ha−1 = number of plants per hectare; T1 = after first harvest—plant cane (area 1); T2 = after second harvest—first ratoon cane (area 2); T3 = after third harvest—second ratoon cane (area 3); T4 = after fourth harvest—third ratoon cane (area 4).
Disclaimer/Publisher’s Note: The statements, opinions and data contained in all publications are solely those of the individual author(s) and contributor(s) and not of MDPI and/or the editor(s). MDPI and/or the editor(s) disclaim responsibility for any injury to people or property resulting from any ideas, methods, instructions or products referred to in the content.