Article

Using a Computer Vision System for Monitoring the Exterior Characteristics of Damaged Apples

1
Department of Soils, Water and Agricultural Engineering, College of Agricultural & Marine Sciences, Sultan Qaboos University, Muscat 123, Oman
2
School of Agricultural Technology, King Mongkut’s Institute of Technology Ladkrabang, Bangkok 10520, Thailand
*
Author to whom correspondence should be addressed.
AgriEngineering 2025, 7(10), 318; https://doi.org/10.3390/agriengineering7100318
Submission received: 24 July 2025 / Revised: 9 September 2025 / Accepted: 19 September 2025 / Published: 24 September 2025
(This article belongs to the Section Pre and Post-Harvest Engineering in Agriculture)

Abstract

Mechanical damage like bruises produced during postharvest handling can lower market value, affect nutritional value, and pose food safety risks. The study evaluated bruises on apples using image processing. This research focuses on using computer vision for apple fruit damage detection. The fruits were subjected to three levels of impact using three ball weights (66, 98, and 110 g) dropped from 50 cm height and stored at 22 °C. The overall impact energies generated were 0.323 J (low), 0.480 J (medium), and 0.539 J (high). The bruise area and susceptibility of the damage, surface area of the fruit, and color were measured manually (colorimeter) and by image processing. The study found that the bruise area was significantly affected by impact force, where 110 g (0.539 J) damaged apples showed a bruise area of 4.24 cm2 after 21 days of storage at 22 °C. The images showed a significant change in the RGB values (Red, Green, Blue) over 21 days of storage when impacted at 0.539 J. The study showed that the greater the impact energy effect, the higher the weight loss under constant conditions of storage. After 21 days of storage, the 110 g mechanically damaged apples recorded the highest percentage of weight loss (6.362%). The study found a significant decrease in the surface area of 110 g bruised apples, with a smaller decrease in surface area for 66 g bruised fruit. The use of computer vision to detect bruise damage and other quality attributes of Granny Smith apples can be highly recommended to detect their losses.

1. Introduction

Apples (Malus domestica), a member of the Rosaceae family, are rich in dietary fiber and polyphenol antioxidants, making them one of the healthiest foods in a diet [1]. Apples are popular fruits with high nutritional content [2] and are considered a staple in the human diet, valued for their various health-promoting properties, and are a potential source of many nutrients like vitamins, pigments, and minerals [3]. However, apples are damaged during harvesting, shipping, grading, and sorting, affecting their market value, nutritional value, and food safety [2]. For instance, bruising is the most common type of mechanical injury that may appear after harvest, causing bacterial and fungal infections [4] and excessive moisture loss. Also, damaged apples can cause financial losses for growers and retailers [5]. Bruises can occur due to extreme impact or other compression forces that are concentrated in small areas of fresh produce surface against other fruit or a rigid surface [6,7]. Apple bruises result because of the failure of cells when the internal pressure reaches a critical value and can be recognized by the softening, flattening, or discoloration of the tissue [8]. Both softening and browning of the tissue are the result of enzymatic reactions taking place after the enzymes are brought into contact with polyphenols due to the rupturing of membranes and cell walls [9].
Generally, mechanical damage and bruising can significantly impact the physiological properties of fresh produce [10,11,12]. Ergun [13] found that bruising can lead to a reduction in firmness and increased fruit browning in ‘Galaxy’ apples. Mechanical damage can cause huge color changes in fruits and can lead to weight loss, especially in apple fruit, even after prolonged storage at low and high temperatures, as observed by Celik, Ustun, Erkan, Rennie and Akinci [14] and Fu, Du, Yang, Wang, Wu and Yang [15]. The reduction in surface area, fruit diameter, and size was also observed in other fruits like pomegranate because of mechanical damage, which accelerates the dehydration during ripening activities as found by Al-Dairi, Pathare, Al-Yahyai, Al-Habsi, Jayasuriya and Al-Attabi [16]. Overall, mechanical damage can show an adverse effect on the quality of fresh produce like apples during storage.
Knowledge related to the occurrence of mechanical damage in fresh produce is highly vital to lessen fresh fruit and vegetable quality reduction and to develop other strategies and solutions that assist in preventing such issues [17]. Thus, reproducing bruise impact mechanical damage at a laboratory scale was required by using drop and pendulum impact tests [6,18]. In the study of Hussein, Fawole and Opara [19], pomegranate fruits were subjected to low (20 cm), medium (40 cm), and high (60 cm) drop impacts by dropping the fruit once onto the cheek position on a hard surface. They stated that increasing the impact damage or energy can exhibit higher bruise area, bruise volume, and bruise susceptibility. More future research to develop advanced methods for bruise detection and reducing postharvest losses is essential.
To address these issues, a quick, easy, and non-destructive approach is needed for identifying fruit and vegetable damage, particularly for early bruise identification [20]. The non-destructive techniques (NDT) are increasingly performed to evaluate fruits’ external and internal quality and damage, providing a rapid, accurate, and non-invasive evaluation technique [21]. Traditional machine-learning techniques have shown excellent recognition, accuracy, and speed. Traditional fruit quality assessment methods, such as sensory evaluation, physical and chemical analysis, have not been able to meet the demands of rapid, accurate, and non-destructive evaluation in the modern fruit industry due to their strong subjectivity, destructive detection process, and low efficiency. This is due to the ongoing growth of the global fruit trade and the rising consumer expectations for taste, freshness, and safety of fruits [22]. Manual inspection takes time, and it is prone to error due to subjective factors. However, non-destructive procedures, such as biospeckle, machine vision, spectroscopy, ultrasonic and acoustic methods, hyperspectral imaging, nuclear magnetic resonance, X-ray imaging, and thermal imaging, are being developed to identify damaged fruits [23].
A computer vision system is one of the techniques that is used to detect bruises in fruits and vegetables. This facilitates its ability to detect bruises at first glance and avoid major losses. The process of identifying a fruit’s quality generally begins with image processing [24]. Computer vision is being used for detecting bruises on fruit, particularly when they develop on uneven, multicolored backgrounds, which are difficult to identify using traditional methods. These bruises are often difficult to detect due to their ill-defined boundaries and the potential for invasion during handling. Thus, a computer vision system and a fruit handling system are the two subsystems of a computer-mediated fruit quality evaluation and sorting system, consisting of an image processing module and a pattern recognition module [25].
The process of identifying a fruit’s quality generally begins with image processing. Taking a picture of the fruits is the first step in the process. After that, the picture is sent to the processing phase, where fruit characteristics like size, shape, and color may be extracted. And developing an integrated system for detecting bruises in the future. Thus, this research was basically conducted to evaluate the bruise magnitude of apples damaged by 3 different ball impactors (66, 98, 110 g) and to investigate quality changes as affected by the damage during 21 days of storage using a computer vision system. This study provides a baseline non-destructive way for evaluating several parameters, such as bruise area, color, and surface area, and allows for better tracking of quality changes over time.

2. Materials and Methods

2.1. Experimental Design

Apples ‘Granny Smith’ were purchased from the market of the same vendor and then transported to the Postharvest Laboratory and Technology, Sultan Qaboos University, Oman. Apples were sorted and cleaned, and a total of 15 apples of similar size, properties, and free from any defects were selected. The fruits were divided into 3 groups for the mechanical damage test.

2.2. The Drop Test Method and Storage

The drop test method of Hussein, Fawole and Opara [19] was used in the laboratory to generate bruises in apple fruit. In this study, the fruits were mechanically damaged by freely dropping 3 different stainless steel ball impactors individually, including 66 g, 98 g, and 110 g representing the low, medium, and high impact levels, respectively, from a drop height of 50 cm through a PVC hollow pipe (Figure 1). Equation (1) was followed to calculate the impact energy of each level.
Ei = mbgh
where Ei is the impact energy, mb is the mass of the dropped ball, g is the gravitational constant (9.81 m/s2), and h is the drop height (50 cm).
A total of five apple fruits were included per group/damage level. After the impact test, the created bruise region of the apple fruit was marked to facilitate bruise measurements. Table 1 presents the overall treatments used for the study. Before the impact test, the fruits from each treatment were analyzed for day-0 analysis (n = 5). The samples were stored at 22 °C for 21 days.

2.3. Computer Vision System (CVS)

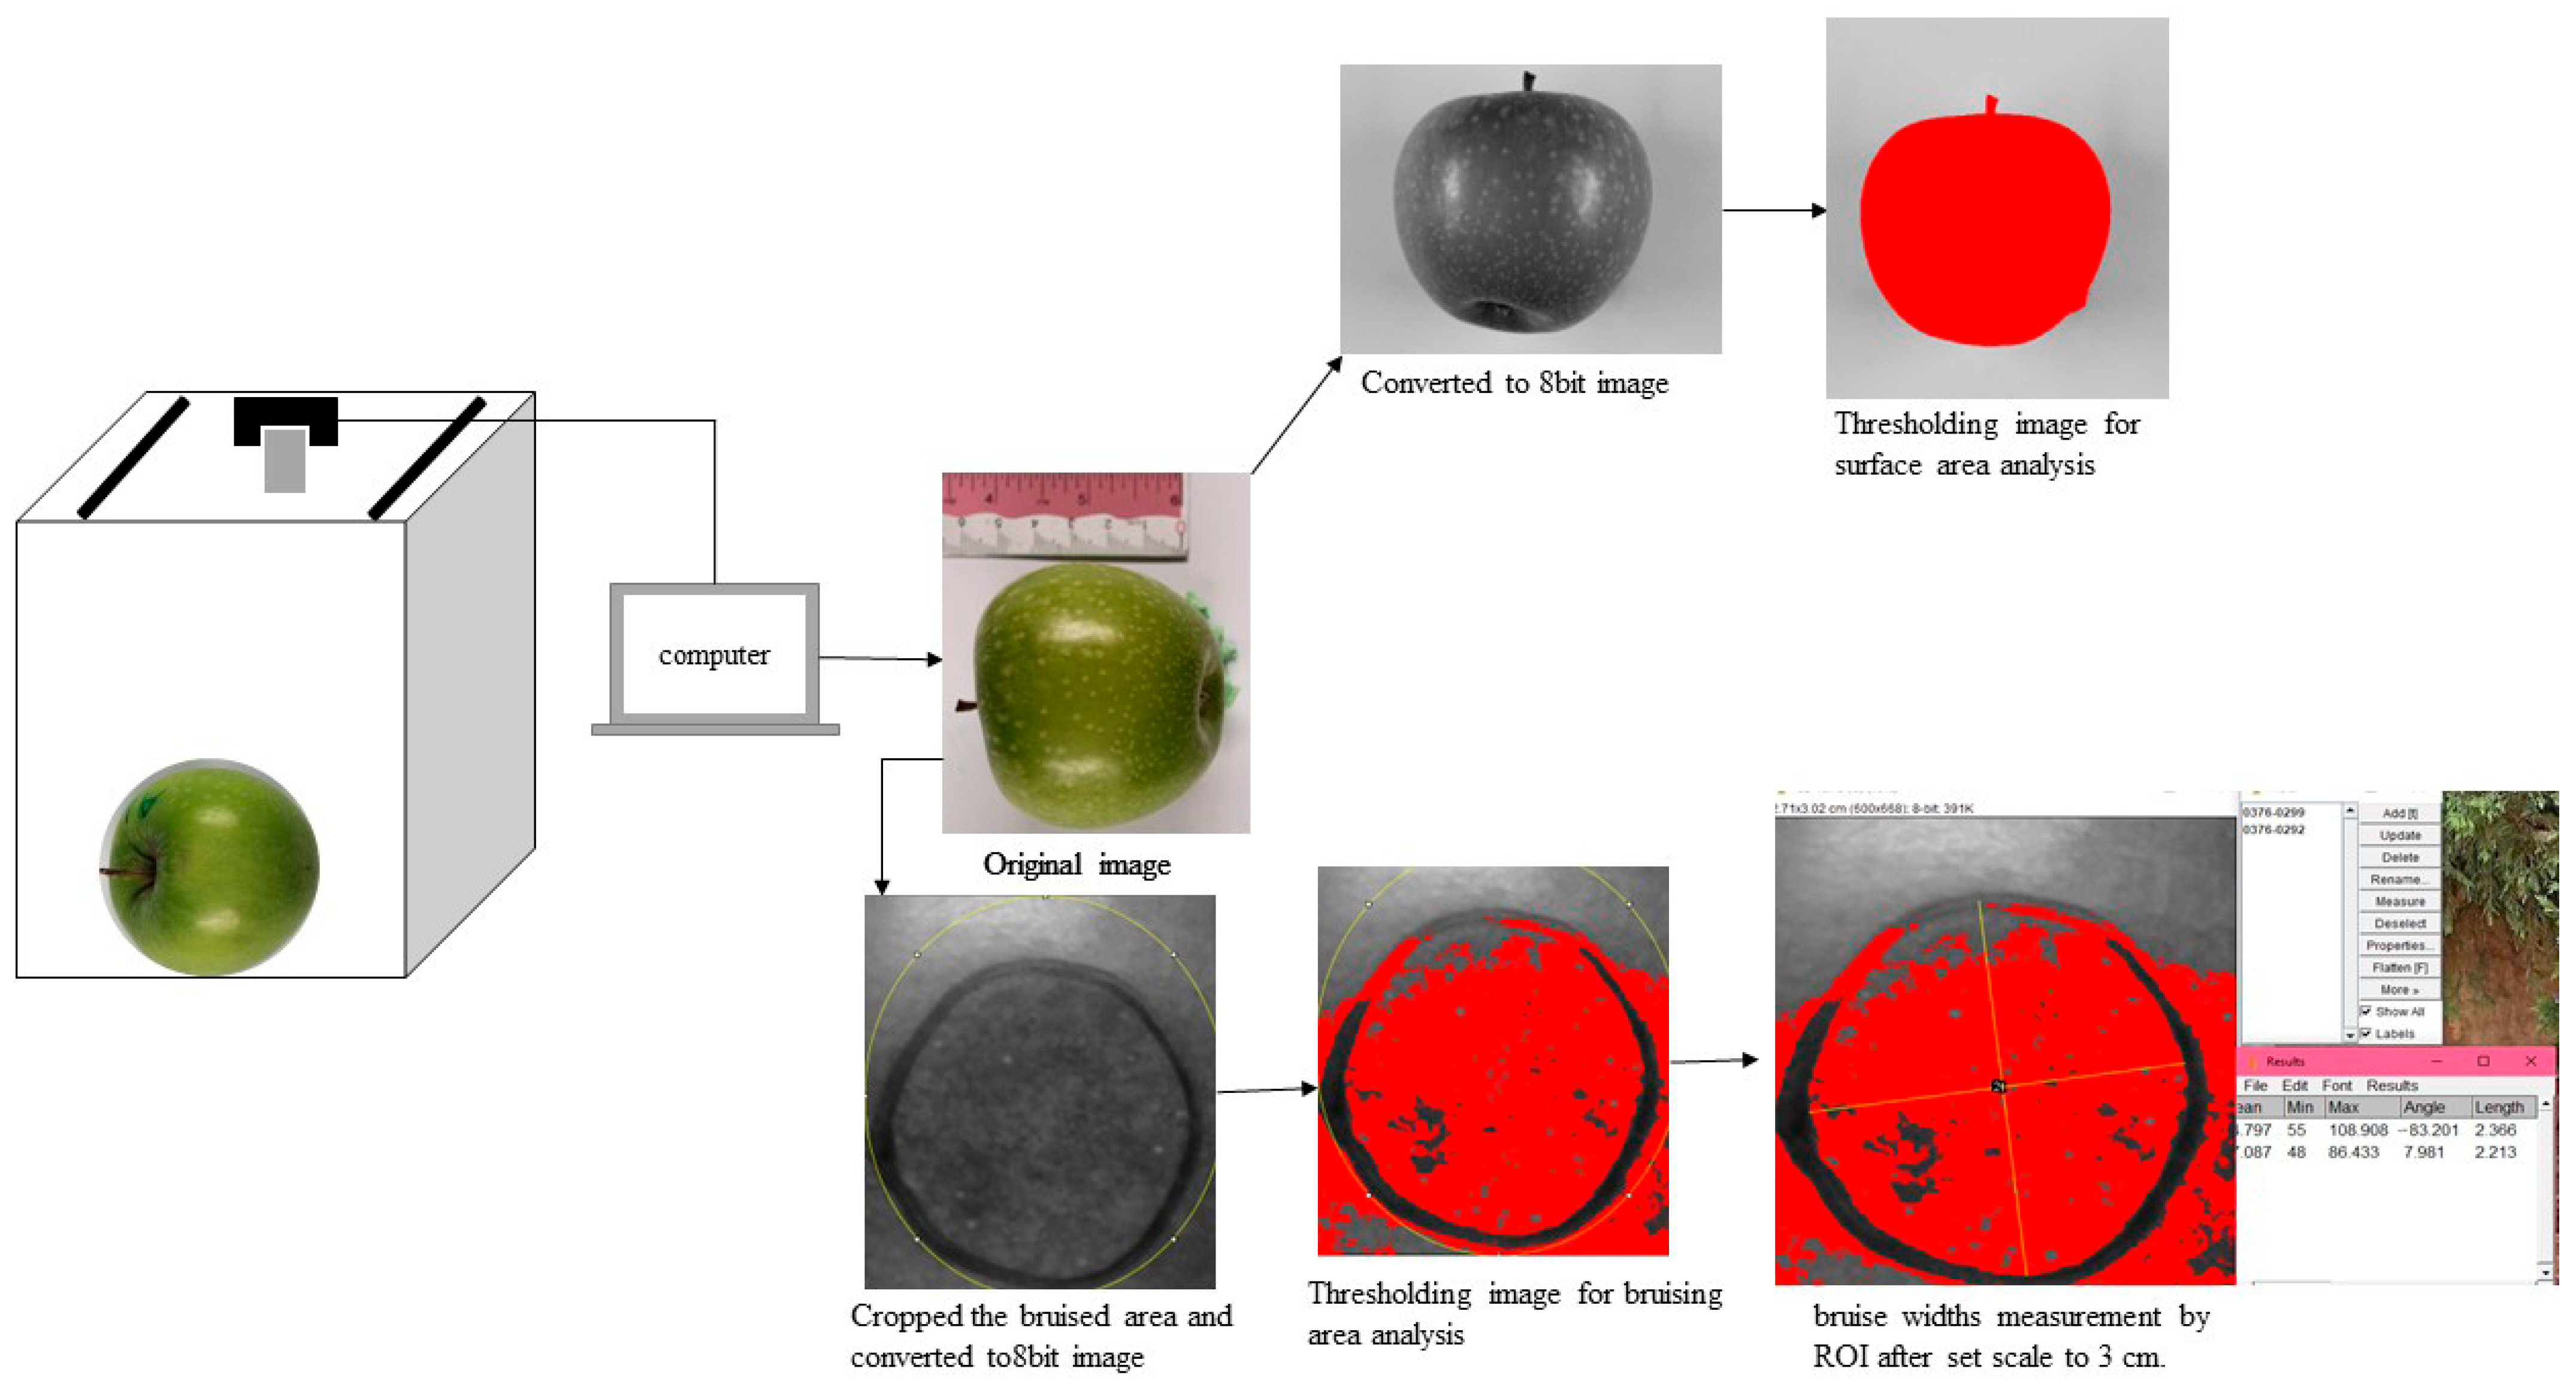
Following impact testing, a total of 240 images (2 images per treatment per replicate on days 0, 3, 6, 9, 12, 15, 18, and 21) of apple samples were captured during the 21 days of storage by using the computer vision system as described by Al-Dairi and Pathare [26]. Every image of apples was taken with a digital camera (Model: EOS FF0D, Canon Inc., Tokyo, Japan) at a distance of 30 cm (Figure 2). To prevent backscattering effects, a cardboard box was placed over the entire system in this instance. In addition, the apple sample was positioned with a strong contrast against a white background. Two 36 W long fluorescent tubes (Model: Dulux L, OSRAM, Milano, Italy) were used to illuminate apple samples so that the light was evenly distributed across the sample. The CVS setup used an auto operation mode, no flash mode, and an exposure time of 1/125 s. The RGB images of bruised apples were acquired with a resolution of 4272 × 2848 pixels. A personal computer’s USB port was used to connect the digital camera, and the images were stored for further processing. To capture the image with the highest quality possible, the camera’s EOS Utility remote shooting software (v. 2.10.2.0) was used. The JPG format was used to save the acquired images with 72-dpi resolution. All apple images were analyzed using ImageJ (v. 1.53, National Institute of Health, Bethesda, MD, USA) software (Figure 2).

2.4. Bruise and Physical Properties Measurement

Further measurements of bruise area and physical analyses (weight loss, surface area, and color) were performed at 3-day intervals for the 21-day storage period at room conditions (22 °C). The bruise area, color, and surface area were analyzed by conventional and computer vision system techniques.

2.4.1. Bruise Damage Analysis

For bruise area measurements by image processing (Figure 2), every original image was pre-processed, scaled, enhanced, and cropped. In order to separate the bruise zone on cropped images from other non-bruised areas of the fruit, the threshold method was performed after converting the image to an 8-bit image. The particle size tool was applied to determine the area of the bruised zone. Also, measuring the major and minor widths was applied to measure the bruised zone. The resulting values were obtained after calibration with the use of a ruler [16].
For the conventional technique, the bruised area of apples was marked before storage to identify the bruises during bruising measurement. The extent of the bruise injury was measured by a digital caliper (Model: Mitutoyo, Mitutoyo Corp., Kawasaki City, Kanagawa, Japan). According to Equations (2) and (3), the extent of bruise injury was measured in terms of bruise area (BA) (cm2) and susceptibility (BS) (cm2/J). Where the d1 and d2 are bruise widths and Ei is the impact energy [27,28].
B A = d 1 d 2 4 π
B S = B A E i

2.4.2. Surface Area

The surface area was determined by manual and computer analysis of the captured images. In the manual method, the values of width (W), thickness (T), and height (H) were measured by a digital caliper. The geometric mean diameter (D) (Equation (4)) was calculated to determine the surface area (A) of the apples (Equation (5)) [29].
D =   ( W × T × H )   3
A = ( D 2 4 ) π × 4
For image processing, the surface area was calculated using the ImageJ software (Figure 2). The scale had a 3 cm calibration. After adjusting the image’s brightness, color thresholding was applied. The size particle tool and the region of interest measurements were also performed to measure the thresholded area that represents the surface area of the whole apple fruit [16]. A total of 5 readings were taken from 5 fruits per day per treatment for measuring the surface area of the whole fruit.

2.4.3. Measurement of Color Change

A colorimeter (Model: NR110, Shenzhen ThreeNH Tech, Guangzhou, China) was used to measure the color of the apple fruit, and the results were reported in terms of L*a*b* color coordinates (CIEL*a*b* color space). The L* values indicate the lightness or darkness (0–100), a* indicates reddish or greenish (+ and −), and b* indicates yellowish or blueish (+ and −) [30]. The hue° angle and chroma (Equations (6) and (7)), which represent color purity and color saturation, respectively, were also calculated.
Hue ° = tan 1 ( b a )
Chroma = a 2 + b 2
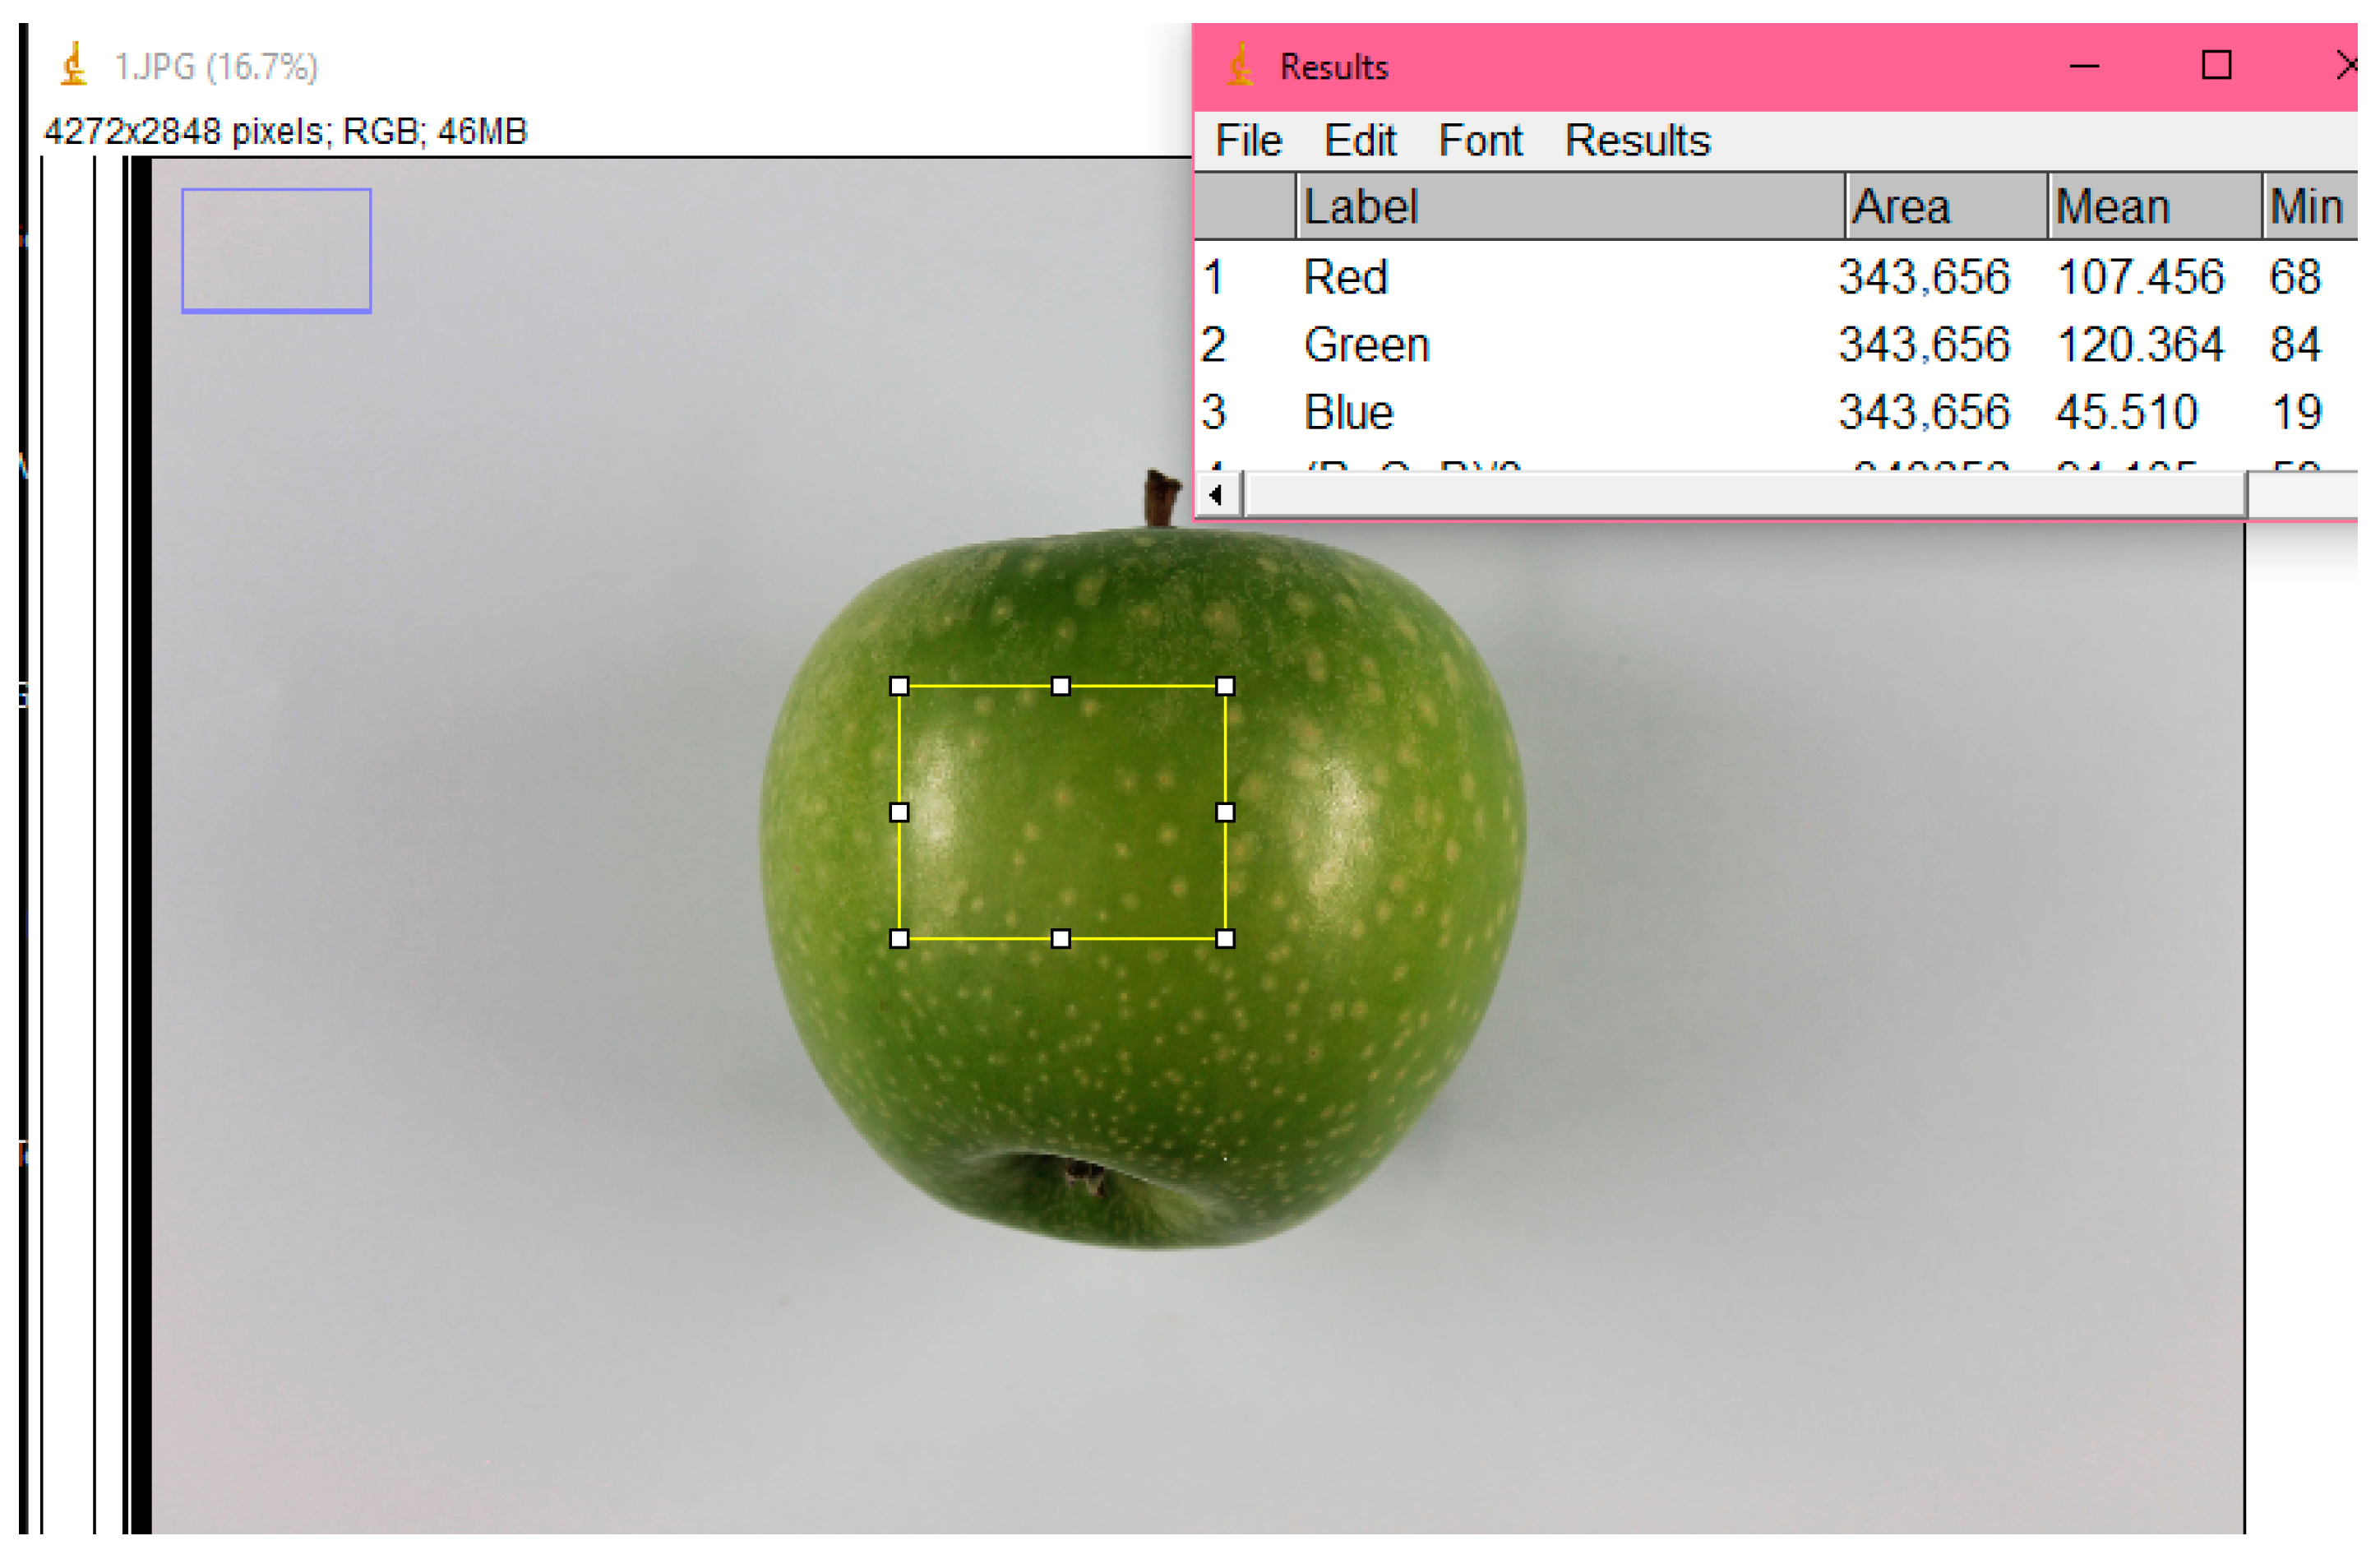
Furthermore, computer vision system technology was used to evaluate the color of apples. The analysis of every RGB value obtained from the system was done using the ImageJ software (Figure 3). The RGB values represent the red, green, and blue values, respectively, of the image, which were obtained using a histogram tool. Later, the RGB values were converted to the CIEL*a*b* color coordinates, which are typically employed in research to describe the color quality of food [16]. The RGB mean value was taken and converted to L*, a*, and b* values for the 15 samples over 21 days of storage. A total of 15 readings were taken from 5 fruits (3 readings per fruit) per day per treatment for each color parameter.

2.4.4. Weight Losses %

An electronic weight balance (Model: GX-4000, A & D Company, Tokyo, Japan) with an accuracy of ±0.01 g was used to determine the weight loss of apple fruit after it was subjected to bruise damage. The following calculation (Equation (8)) was used to compute the weight loss percentage (WL%) [26].
W L %   = W i W f W i × 100 %
where W i is the initial weight (g) of the fruit at the beginning of storage; and W f is the weight (g) of the apple at the time of sampling during storage for 21 days. The weight of each apple fruit was measured individually, and the average weight of the five measurements was utilized to represent the weight for each treatment.

2.5. Statistical Analysis

Data were statistically analyzed using Microsoft Excel 365 software. The analysis of variance (ANOVA) was performed to assess the effect of the study factors including measured methods (digital or manual; (A), impact damage (low, medium, high; (B), and storage days (21 days; (C) on bruise area, bruise susceptibility, surface area, and color parameters (L*a*b*) of apples at 95% significant level. All values were given as mean ± standard deviation (S.D.) of 5 readings (out of 5 samples) per treatment for bruise measurements, weight loss, and surface area, and 15 readings (out of 5 samples) per treatment for all color parameters per day.

3. Results and Discussion

3.1. Effect of Damage on Bruise Parameters

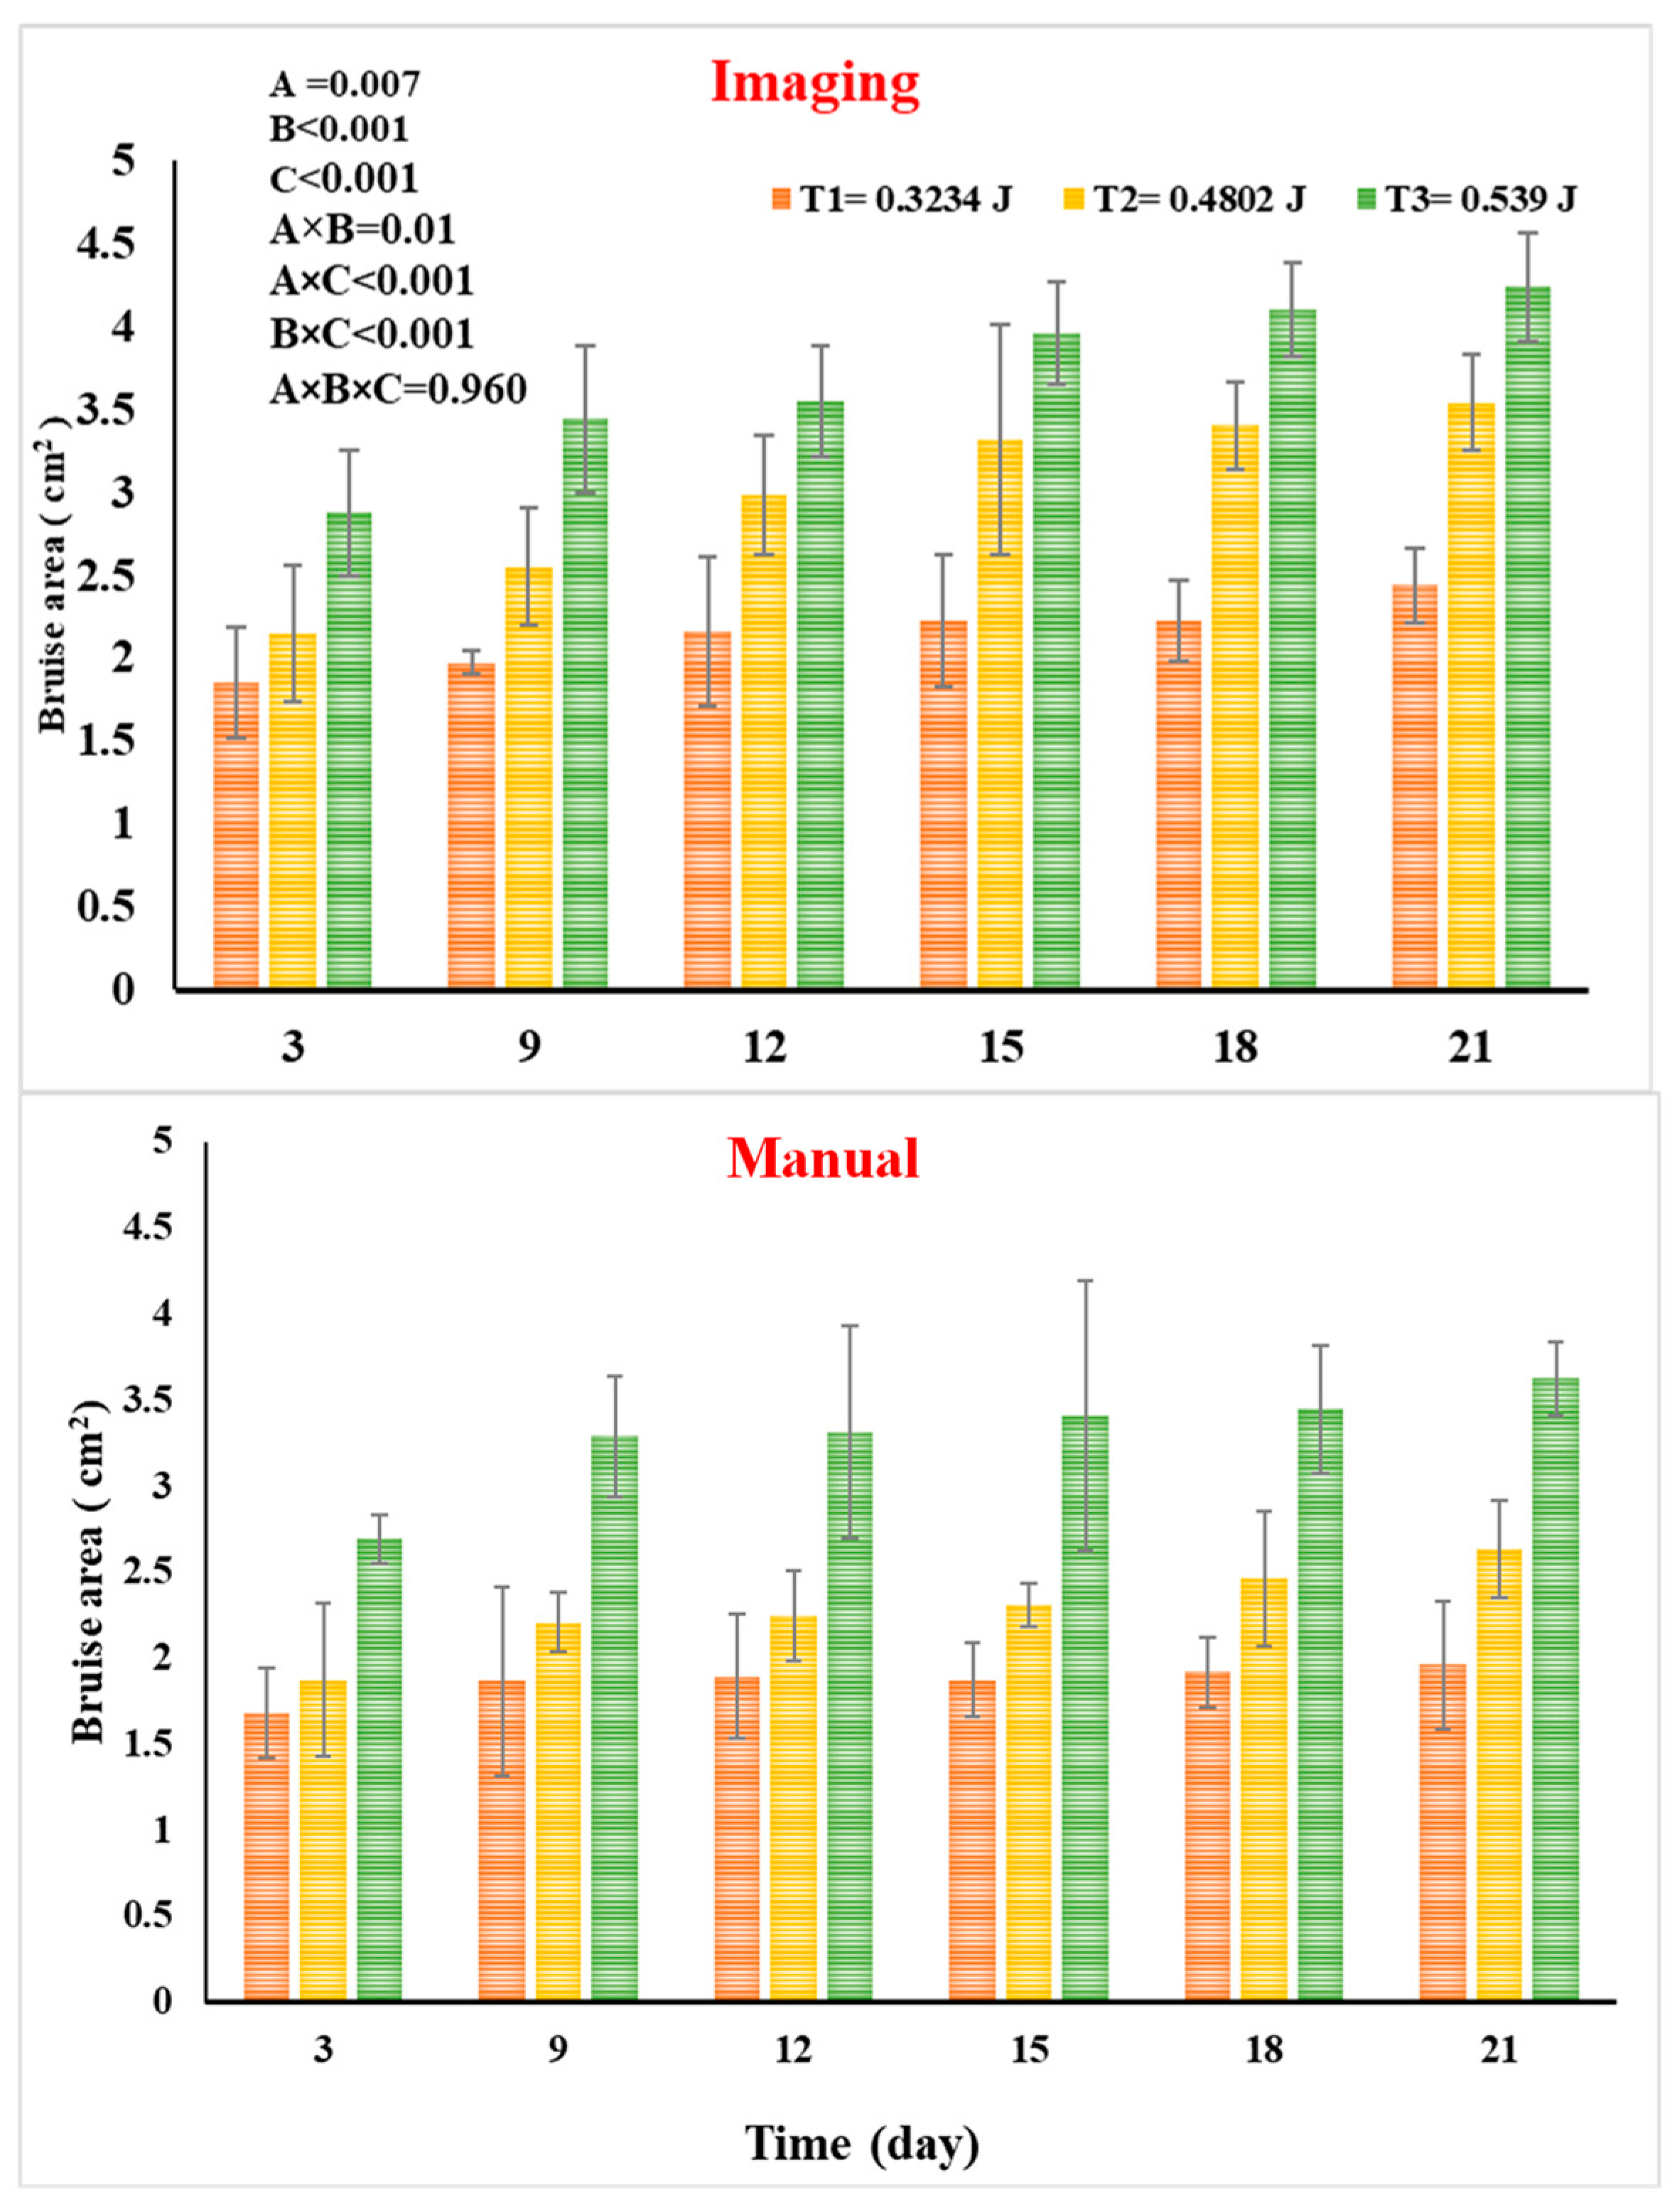
The results showed that the area of the bruise was significantly affected by the measured method (p = 0.007), the impact damage (p < 0.001, and the experimental period (p < 0.001). As impact damage and storage days increased, the bruised area increased. Whereas apples injured by a 110 g ball impactor (T3 = 0.539 J) had a high average bruise area (Figure 4). The average bruise area after 3 days was 2.691 cm2 for 110 g impactor bruised apples, while apples damaged by a 66 g ball impactor (0.323 J) were the least, reaching 1.68 cm2. After 21 days of storage, the bruise area was the highest at 110 g bruised apples with a value of 3.623 cm2. The lowest value of bruise area was observed in apple fruits impacted by 66 g of bruised apples (2.470 cm2).
The bruise area measured by image processing showed a similar trend of increment to the manual measurements. Besides, the values of BA were almost higher when measured by digital image. After 3 days of storage, the bruise area generated by the 110 g ball impactor was 2.88 cm2. After 21 days of storage, the bruise area of the 110 g bruised apples reached 4.240 cm2, where the difference was smaller than manual (Figure 4). Thresholding performed by ImageJ could be more accurate in detecting bruising than manual measurements. Generally, increasing ball impactor weight elevated the impact energy, which directly led to a modest rise in bruise area (BA). Storage at ambient temperatures has the potential to exacerbate bruising in fresh produce due to the active enzymes that cause cell wall breakdown and stiffness. The same findings were recorded where drop height affected the bruise area and bruise volume of bruised banana fruit Pathare and Al-Dairi [31] and bruise incidence, severity, and depth of potato [32].
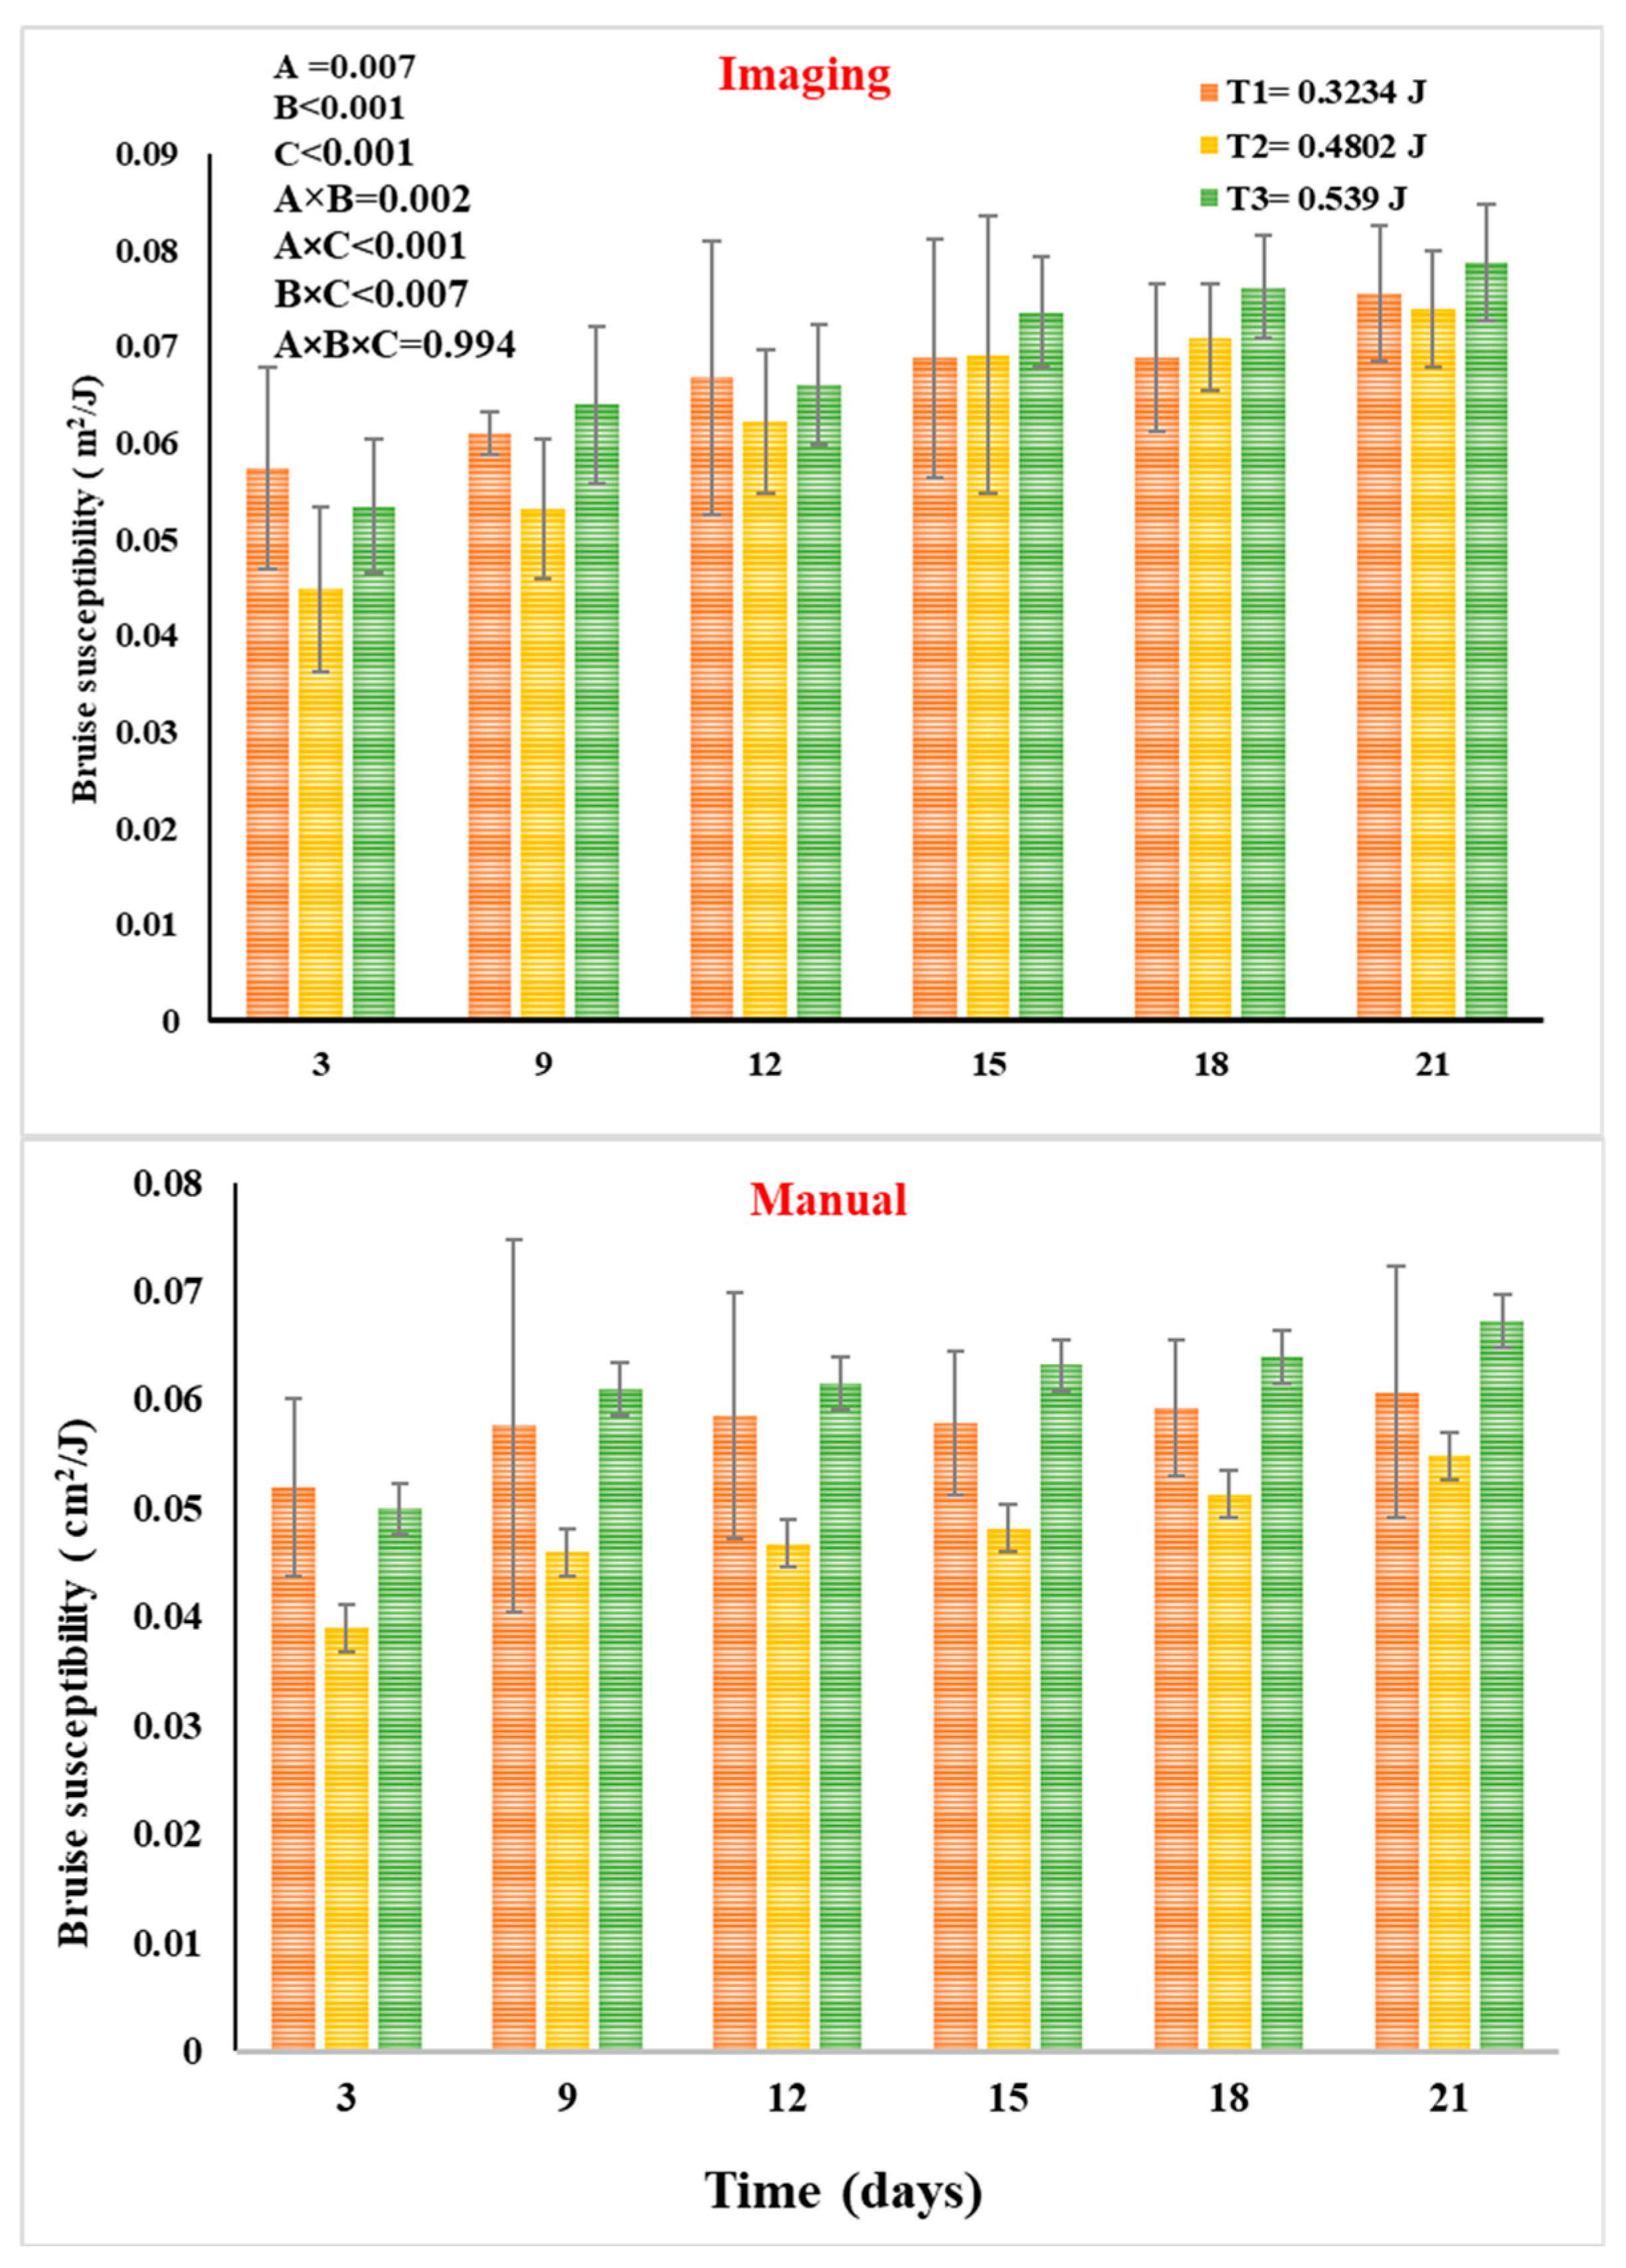
Furthermore, there was a significant variation in bruise susceptibility in bruised apples stored at ambient temperature (22 °C) for 21 days (p < 0.001). The BS was also statistically influenced by the measured method and impact damage (p < 0.05) (Figure 5). The bruise susceptibility increased over the 21 days of storage across all treatments in both apples, as measured by manual and image processing. For manual and image processing measurements, the bruise susceptibility of 110 g (0.5390 J) bruised apples was the highest, with values of 0.0670 cm2/J, and 0.0787 cm2/J, respectively, on the last day of storage. Using manual and image processing methods recorded a bruise susceptibility of 0.0610 cm2/J and 0.0755 cm2/J in apples bruised by a 66 g ball impactor. During all storage days, the bruise susceptibility values in 110 g bruised apples were the highest, followed by 66 g and 98 g, respectively, when measured manually. The bruised fruit measured non-destructively by image processing showed the highest value of bruise susceptibility at 110 g and 66 g, respectively, till day 11. However, the bruise susceptibility increased as impact damage increased on days 15 and 18.
All results are in agreement with the findings of Lu, Ishikawa, Kitazawa and Satake [33], who found that the bruise area (BA) increased with the increase in the drop heights in apples. Razavi, Asghari, Azadbakh and Shamsabadi [34] mentioned that increasing the impact energy elevated the intensity and severity of damage in fruit. Shafie, Rajabipour and Mobli [6] stated that bruising can be affected by the energy absorbed by the fruit during impact. Also, the results of the study confirmed that image processing can be considered as an alternative technique for measuring bruise magnitude along with manual bruise measurement. Recently, it has been confirmed that using image processing techniques was efficient in determining the bruise characteristics of other fruits like bananas [16]. By knowing how mechanical damage develops and how bruises can be distinguished using image-based techniques, farmers, growers, and packinghouses can enhance sorting and grading processes. Thus, it reduces the risk of damaged apples reaching the market. Besides, understanding the influence of handling and storage time on the development on bruise can guide growers, distributors, and traders to optimize postharvest practices like harvesting, packaging, and transportation.

3.2. Effect of Damage on Color

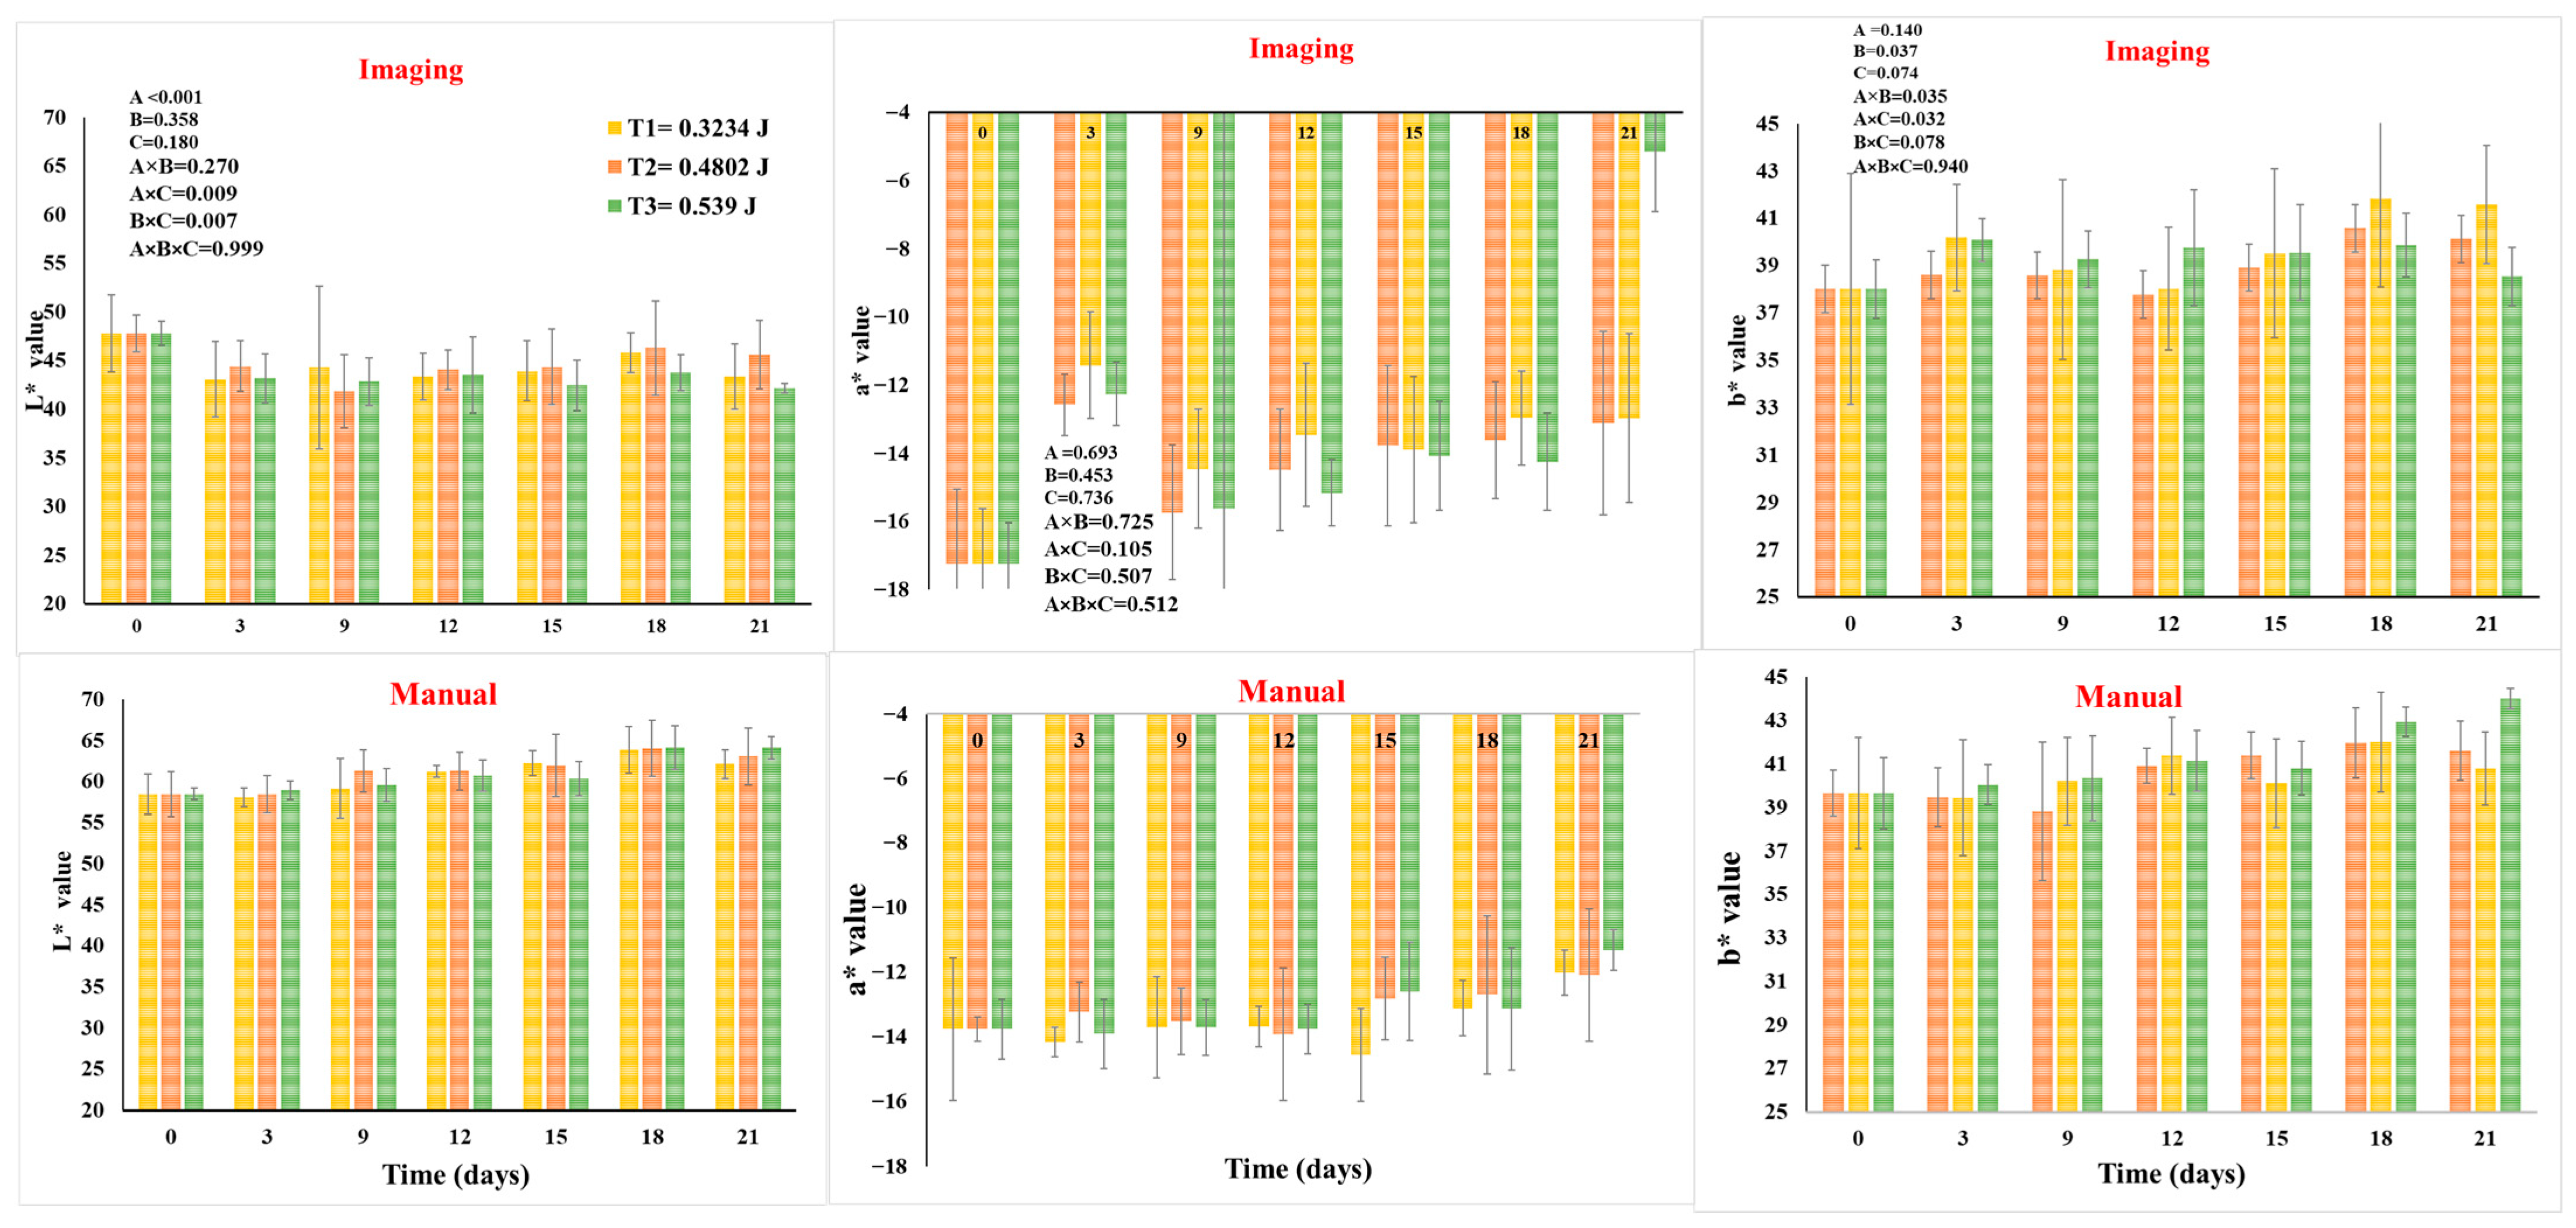
One of the most important factors in evaluating the quality of fresh food ingredients is color. In this study, a comparison between the color values of manual (colorimeter) and computer vision systems was conducted. As shown in Figure 6, the values of apples’ lightness (L*) differed significantly (p < 0.05) when measured digitally and manually, with no significant changes in redness-greenness (a*) and yellowness-blueness (b*). The results also indicated that impact damage level and storage duration did not have a statistically significant effect on L* and a* color values. While b* values showed some variation across different impact levels, no clear or consistent relationship was observed with the duration of storage. The lightness L*, redness-greenness (a*), and yellowness-blueness (b*) values of bruised apple fruit within 21 days of storage at 22 °C, measured by manual and computer vision systems, are shown in Figure 6. Besides, Table 2 shows the values of chroma and hue° changes in bruised apples measured manually and by a computer vision system during 21 days of storage. Regarding color values obtained by the colorimeter, the changes in skin color’s lightness (L*) increased gradually, especially in apples bruised by a 66 g ball impactor (0.3234 J), where the L* value was 55.358 and 62.107 on day 0 and day 21, respectively, as shown in Figure 6. As storage lasted, the apple became darker, especially in the 98 g bruised apples (T2 0.4802 J) and 110 g bruised apples (T3 0.539 J). Increasing the level of impact increased the a* value, which indicates the reduction of the green color component on the apple skin. In 110 g bruised apples, a change in a* value was observed from −14 on day 0 to −11.33 on day 21. In 66 g of bruised fruit, a few changes were observed in a* values during storage, which changed from −14.00 to −12.61 on the last day of storage. During 21 days of storage, the b* values increased by 9.90% in 110 g of bruised fruit (Figure 5).
The effect of bruising during storage on apple fruit showed no significant impact on the chroma Table 2. For manual measurements, the chroma values increased over time and were then followed by a slight fluctuation after day 18. For computer vision measurements, the value of chroma fluctuated over time and provided a similar pattern of increasing before it stabilized, where it showed higher changes in apples bruised by a 110 g impactor. The chroma values were mostly similar to those obtained by the manual technique. Across all conditions, the hue° values reported by the manual measurement were relatively ranging from 105.15° (day 0) to 104.43° (110 g bruised apples-day 21). For computer vision system results, the values were in the range of 97.60° (110 g bruised apples-day 210) and 114.41° (day 0). A slight drop in hue° value in 110 g bruised apples measured digitally can probably indicate the changes in color on day 21 because of bruising. The values of hue° recorded for this study indicated the changes of dark green color to bright yellowish-green [35]. Also, the obtained hue° range is considered typical for apples that undergo ripening and minor degradation [36]. This was previously indicated by the increase in b* value and increment in a* value, probably due to storage duration and bruising.
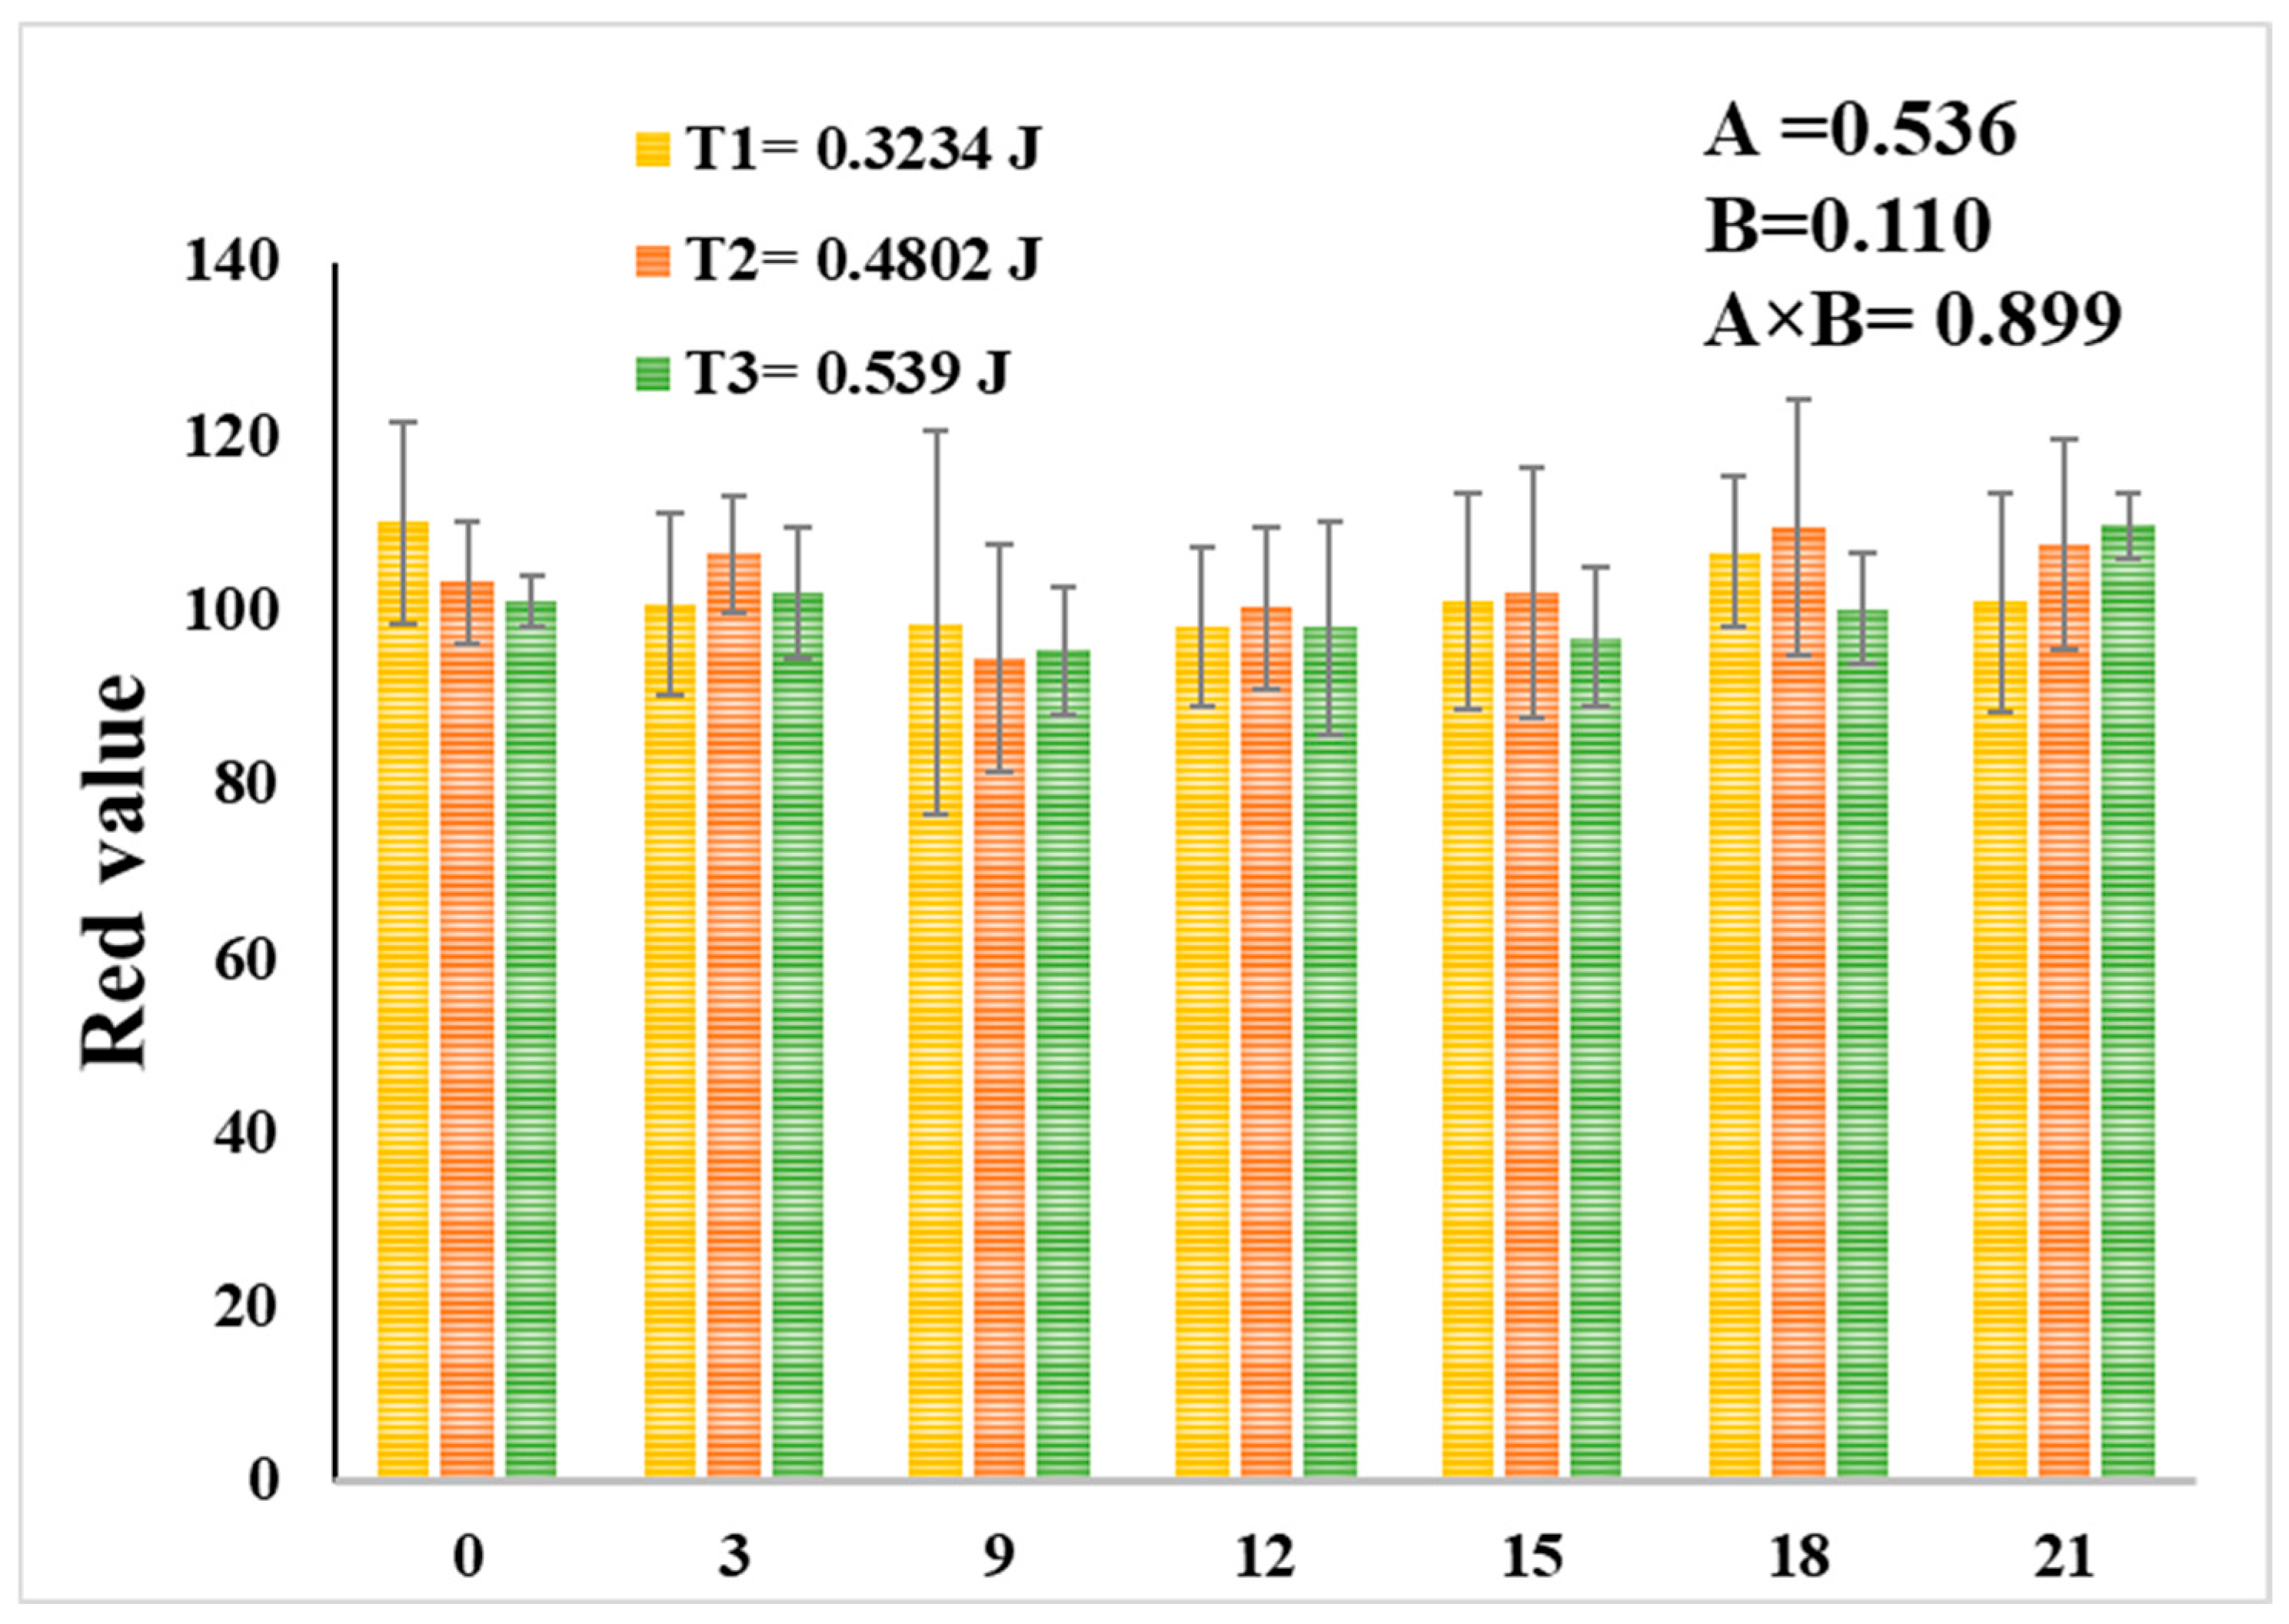
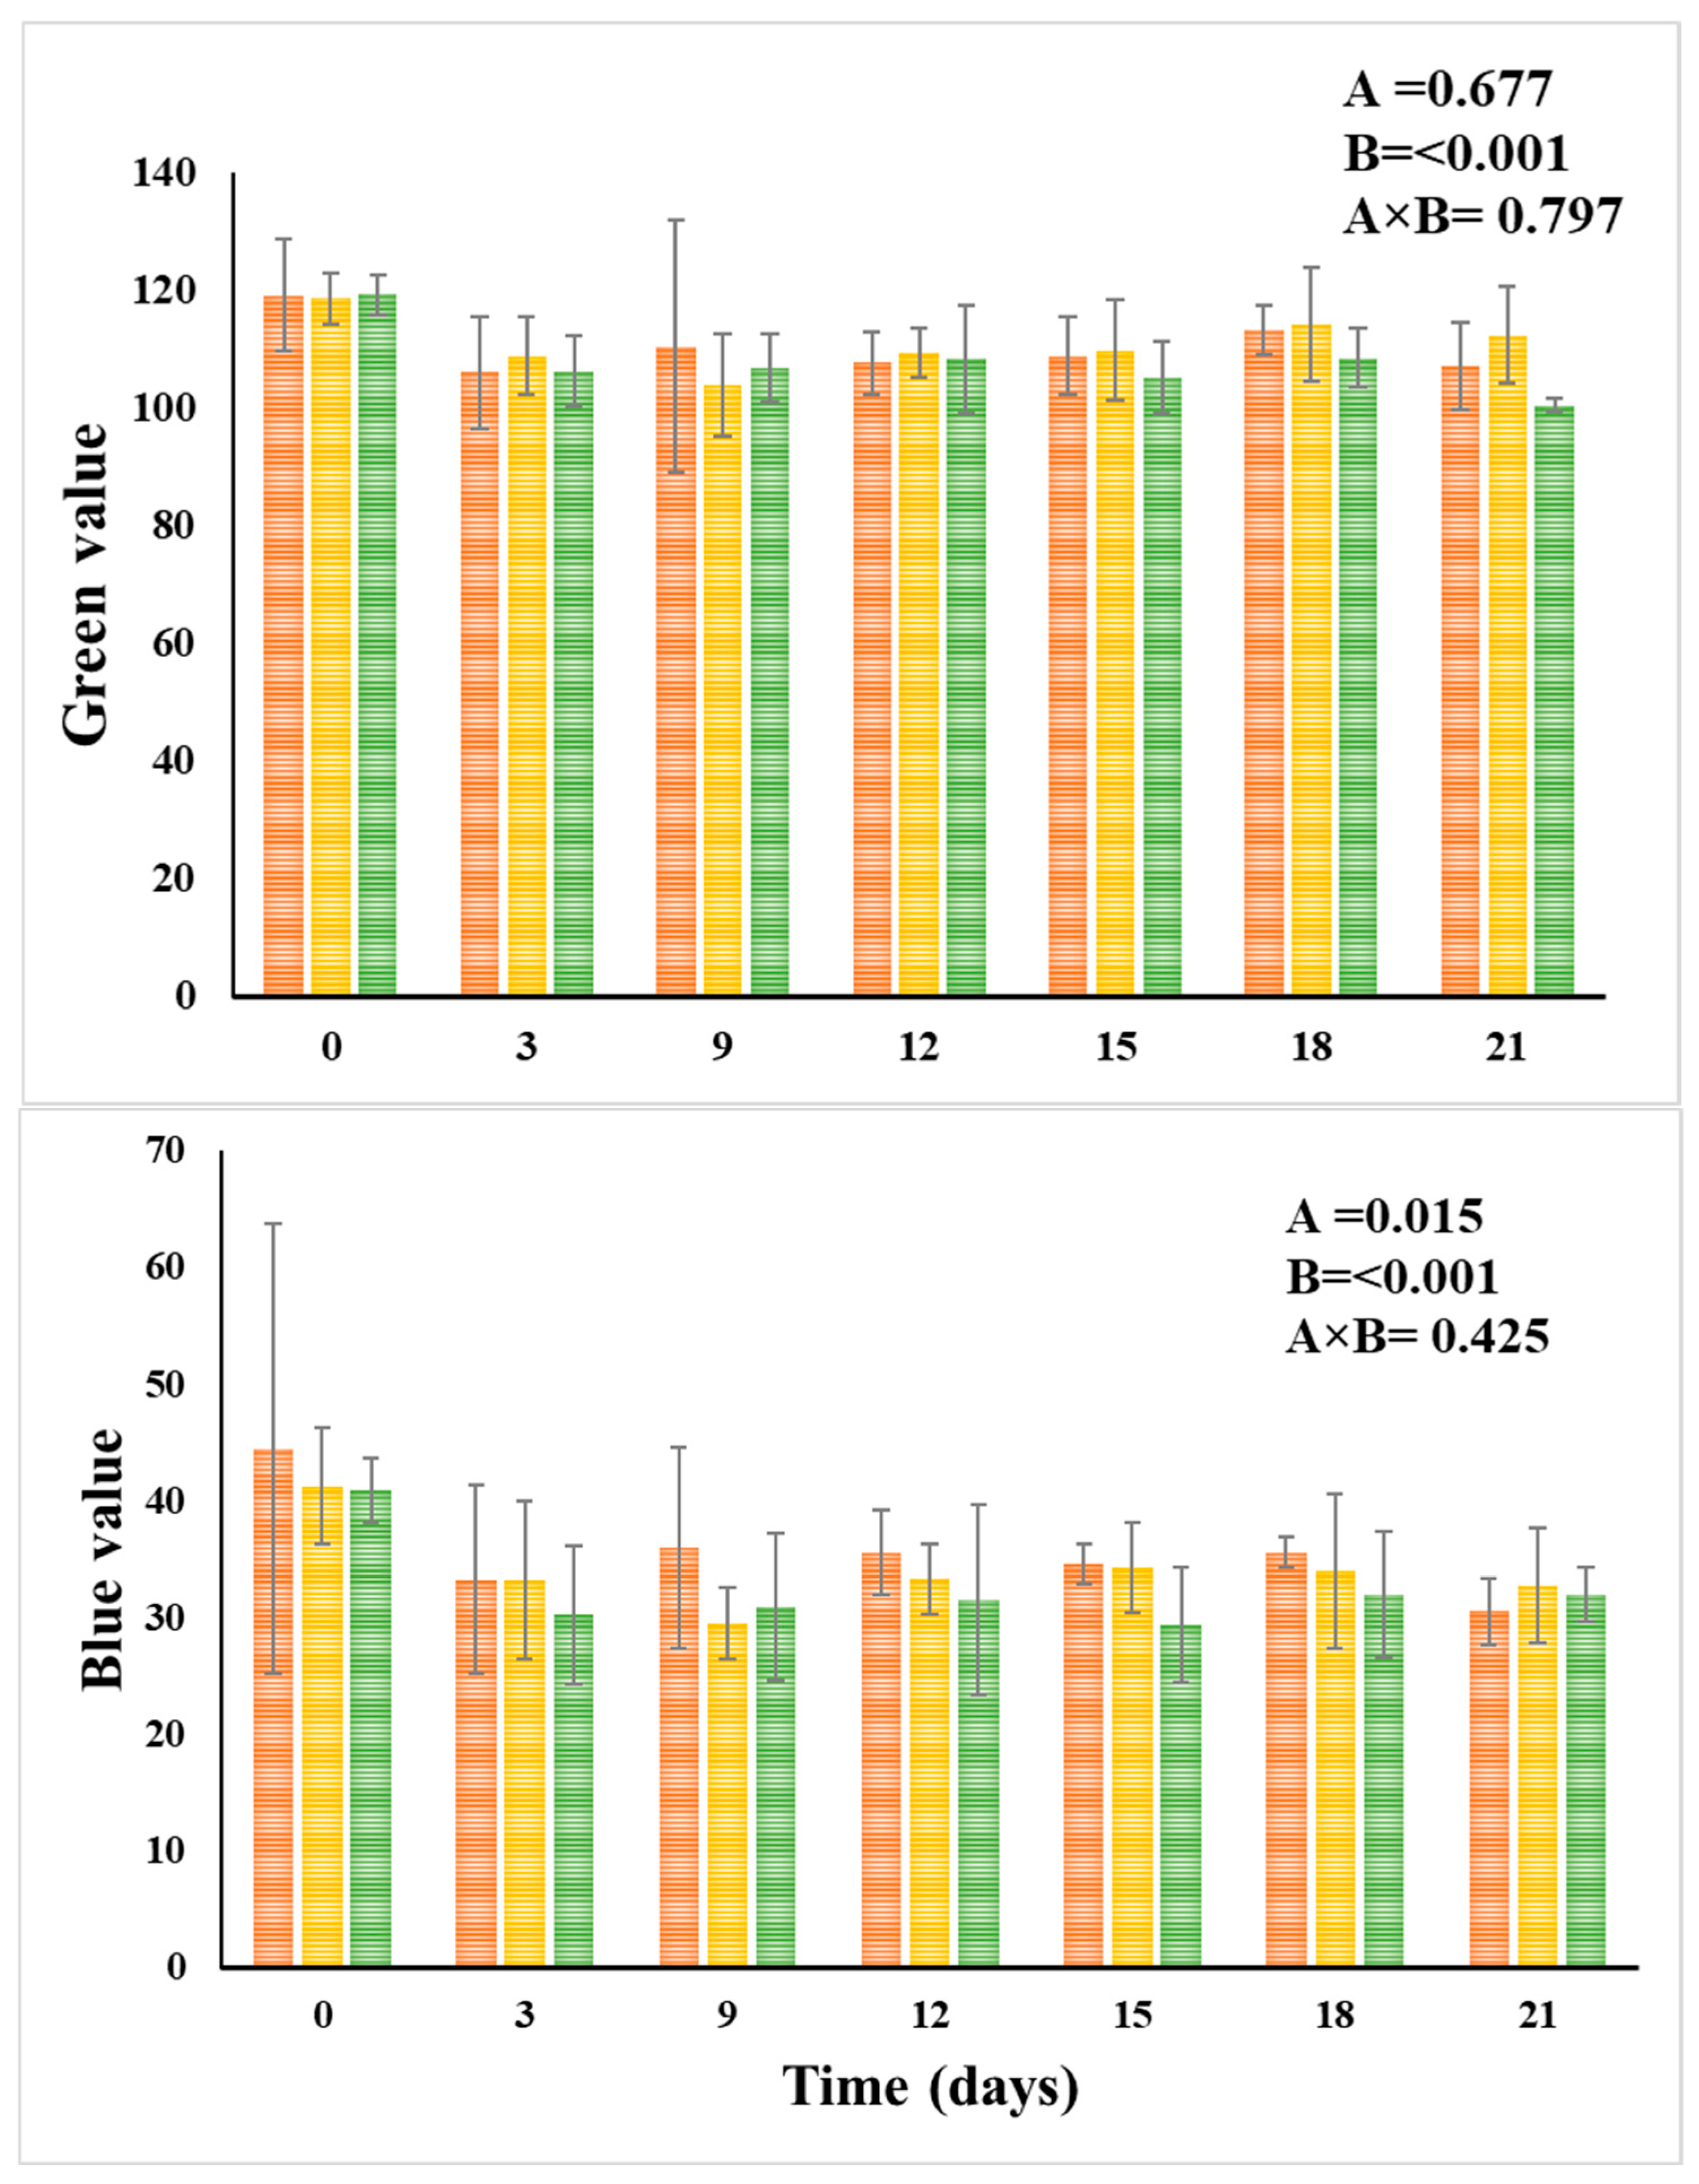
The color (L*a*b*) results obtained by computer analysis are shown in Figure 6 and Table 2. The readings were taken in RGB and then converted to L*, a*, and b* values. The L* value showed a reduction trend from days 3 to 11 and then increased till the last day of storage. Figure 6 revealed that the highest changes in a* value were found in 110 g bruised apples (from −17 on day 0 to −6 on day 21). After day 15, apples damaged from a 50 cm height by a 98 g impactor showed the highest b* increment, followed by 66 g and 110 g bruised apples. However, bruised apples impacted by 110 g were the greatest on days 9, 11, and 15 (Figure 6). Figure 7 shows the change in RGB over 21 days of storage. For RGB values, the G and B color spaces were more significantly (p < 0.05) influenced by storage temperature, indicating that temperature had a stronger effect on RGB color channels changes compared to impact damage levels. The green (G) value showed a significant change in 110 g and 66 g bruised apples, where it changed from 119 to 101. The variation in L*a*b* color space was higher compared to the RGB color space, which was also confirmed by Al-Dairi and Pathare [26], where the L*a*b* color space is the best to describe the color change of fresh produce.
The color change in bruised apples is attributed to cell membrane disruption causes the cell content to leak into intercellular gaps, causing an enzymatic browning response and subsequent discoloration inside the cells, as stated by Dobrzanski and Rybezynski [37]. In their study, they discovered that the bruise damage had a major impact on the color characteristics of damaged apples. Pathare and Al-Dairi [38] found that temperature, drop height, and storage time had a substantial impact on all color parameters of tomatoes, including lightness, redness, and yellowness. After storage at 22 °C, the study discovered that tomatoes with high-impact bruises had a greater effect on lightness (L*) and hue° (color purity) than tomatoes with medium and low drop impacts. In addition, the results of the Htike, Saengrayap, Kitazawa and Chaiwong [39] study showed that the values of the color characteristics (L*, a*, b*, and C) in guava fruit were strongly influenced by the quantity and height of drops, after image analysis. After four days of storage at 25 °C with 70% relative humidity, the L*, a*, b*, and C values were greater in the control treatment. The number of drops severely damaged the guava’s bruising, causing the most color variations in the peel.

3.3. Effect of Damage on Surface Area

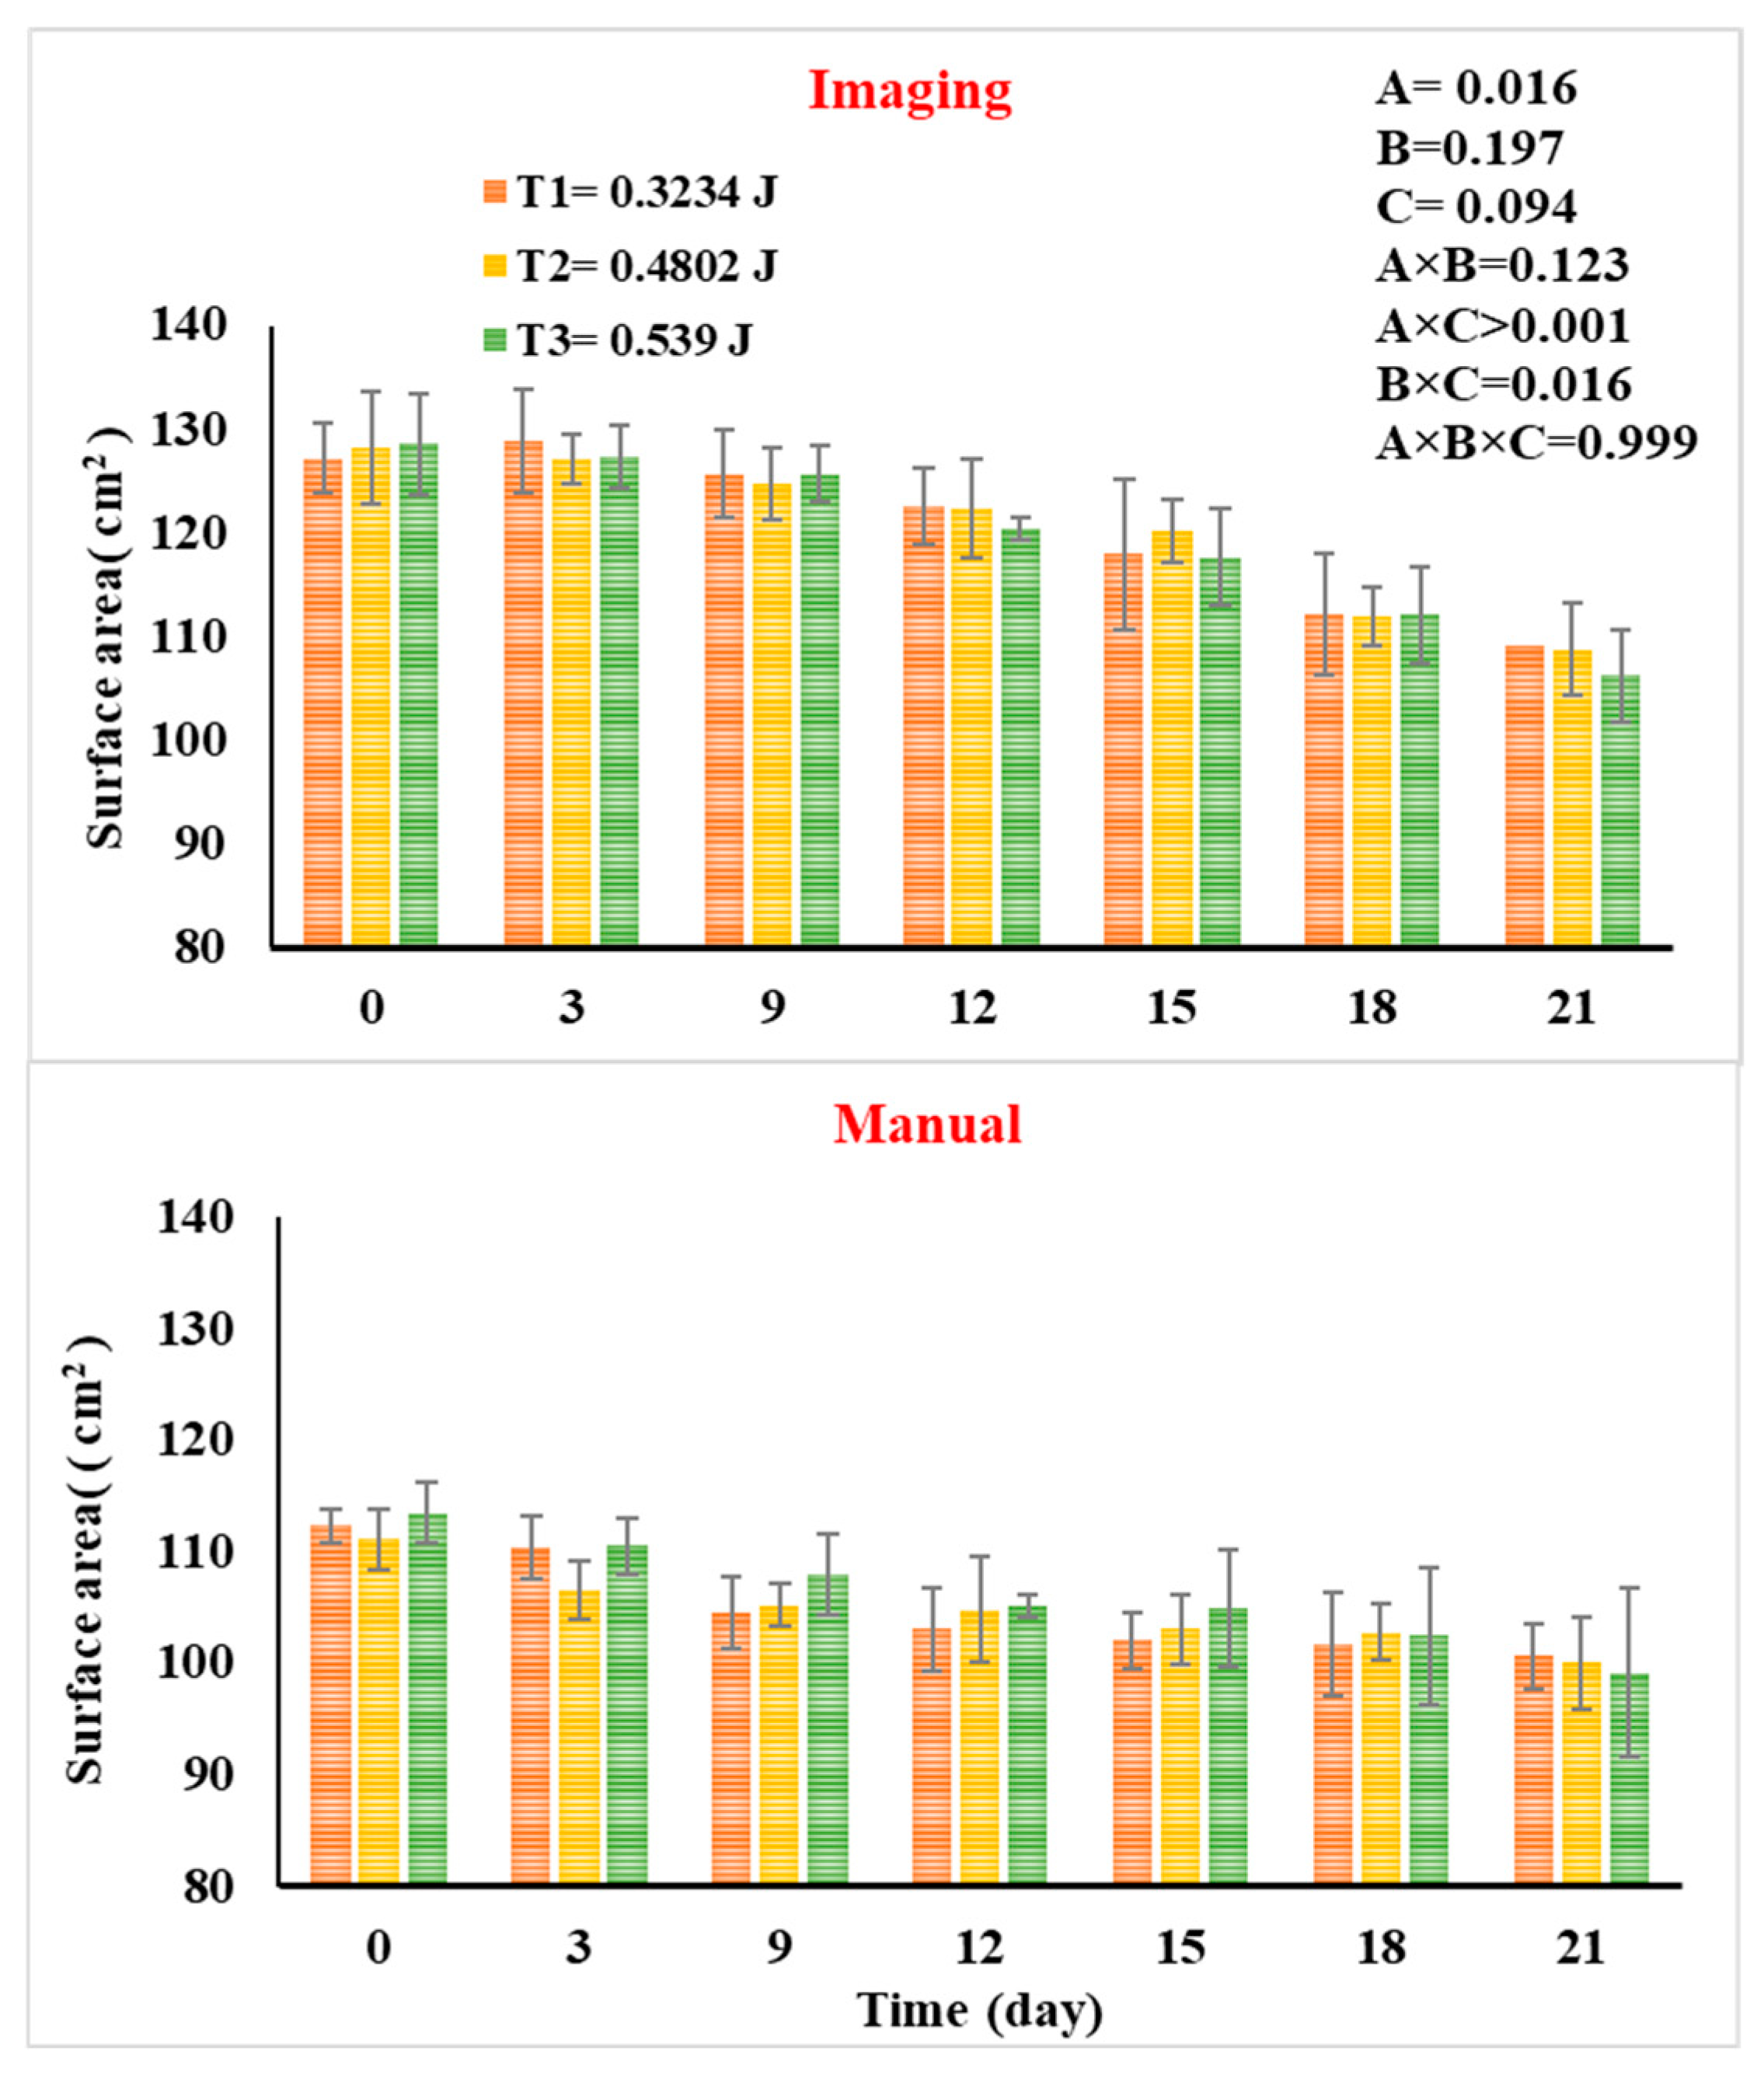
The surface area (SA) was significantly affected by the measurement method and the 21-day storage duration (p < 0.05), whereas impact damage levels did not result in any statistically significant (p > 0.05) variation in SA. The surface area of apples bruised by 60 g, 98 g, and 110 g and measured by manual and image processing techniques is shown in Figure 8. In this study, a reduction in surface area was observed in all treatments. The reduction in surface area was the least in 66 g bruised apples measured manually at 0.11% and by image processing techniques at 0.14%. For 110 g impactor bruised apples, the reduction % was 0.14% and 0.21% measured manually and in image-processed techniques, respectively. Overall, the variation between values was highly noticeable in the manually measured surface area. However, the findings can recommend the use of image processing to measure the surface area of any fresh produce.
Previous studies showed that fruit diameter and size measurements decrease with longer storage periods and ripening due to dehydration during maturation activities [26,29]. Another study found that surface area reduction in bruised bananas is influenced by drop height and storage conditions, with chilling injury, high temperature, and water loss potentially contributing to this decrease [40]. According to Pérez-López, Chávez-Franco, Villaseñor-Perea, Espinosa-Solares, Hernandez-Gomez and Lobato-Calleros [41], mechanical damage can lead to water loss that subsequently leads to a reduction in the surface size of peach fruit during storage at three maturity stages. Mechanical damage can also deteriorate the internal cell wall of fruit and vegetables, thus increasing the respiration rate and enzyme activities like cellulases and pectinases [42], which immediately influences the size characteristics of the fresh produce.

3.4. Effect of Damage on Weight Losses %

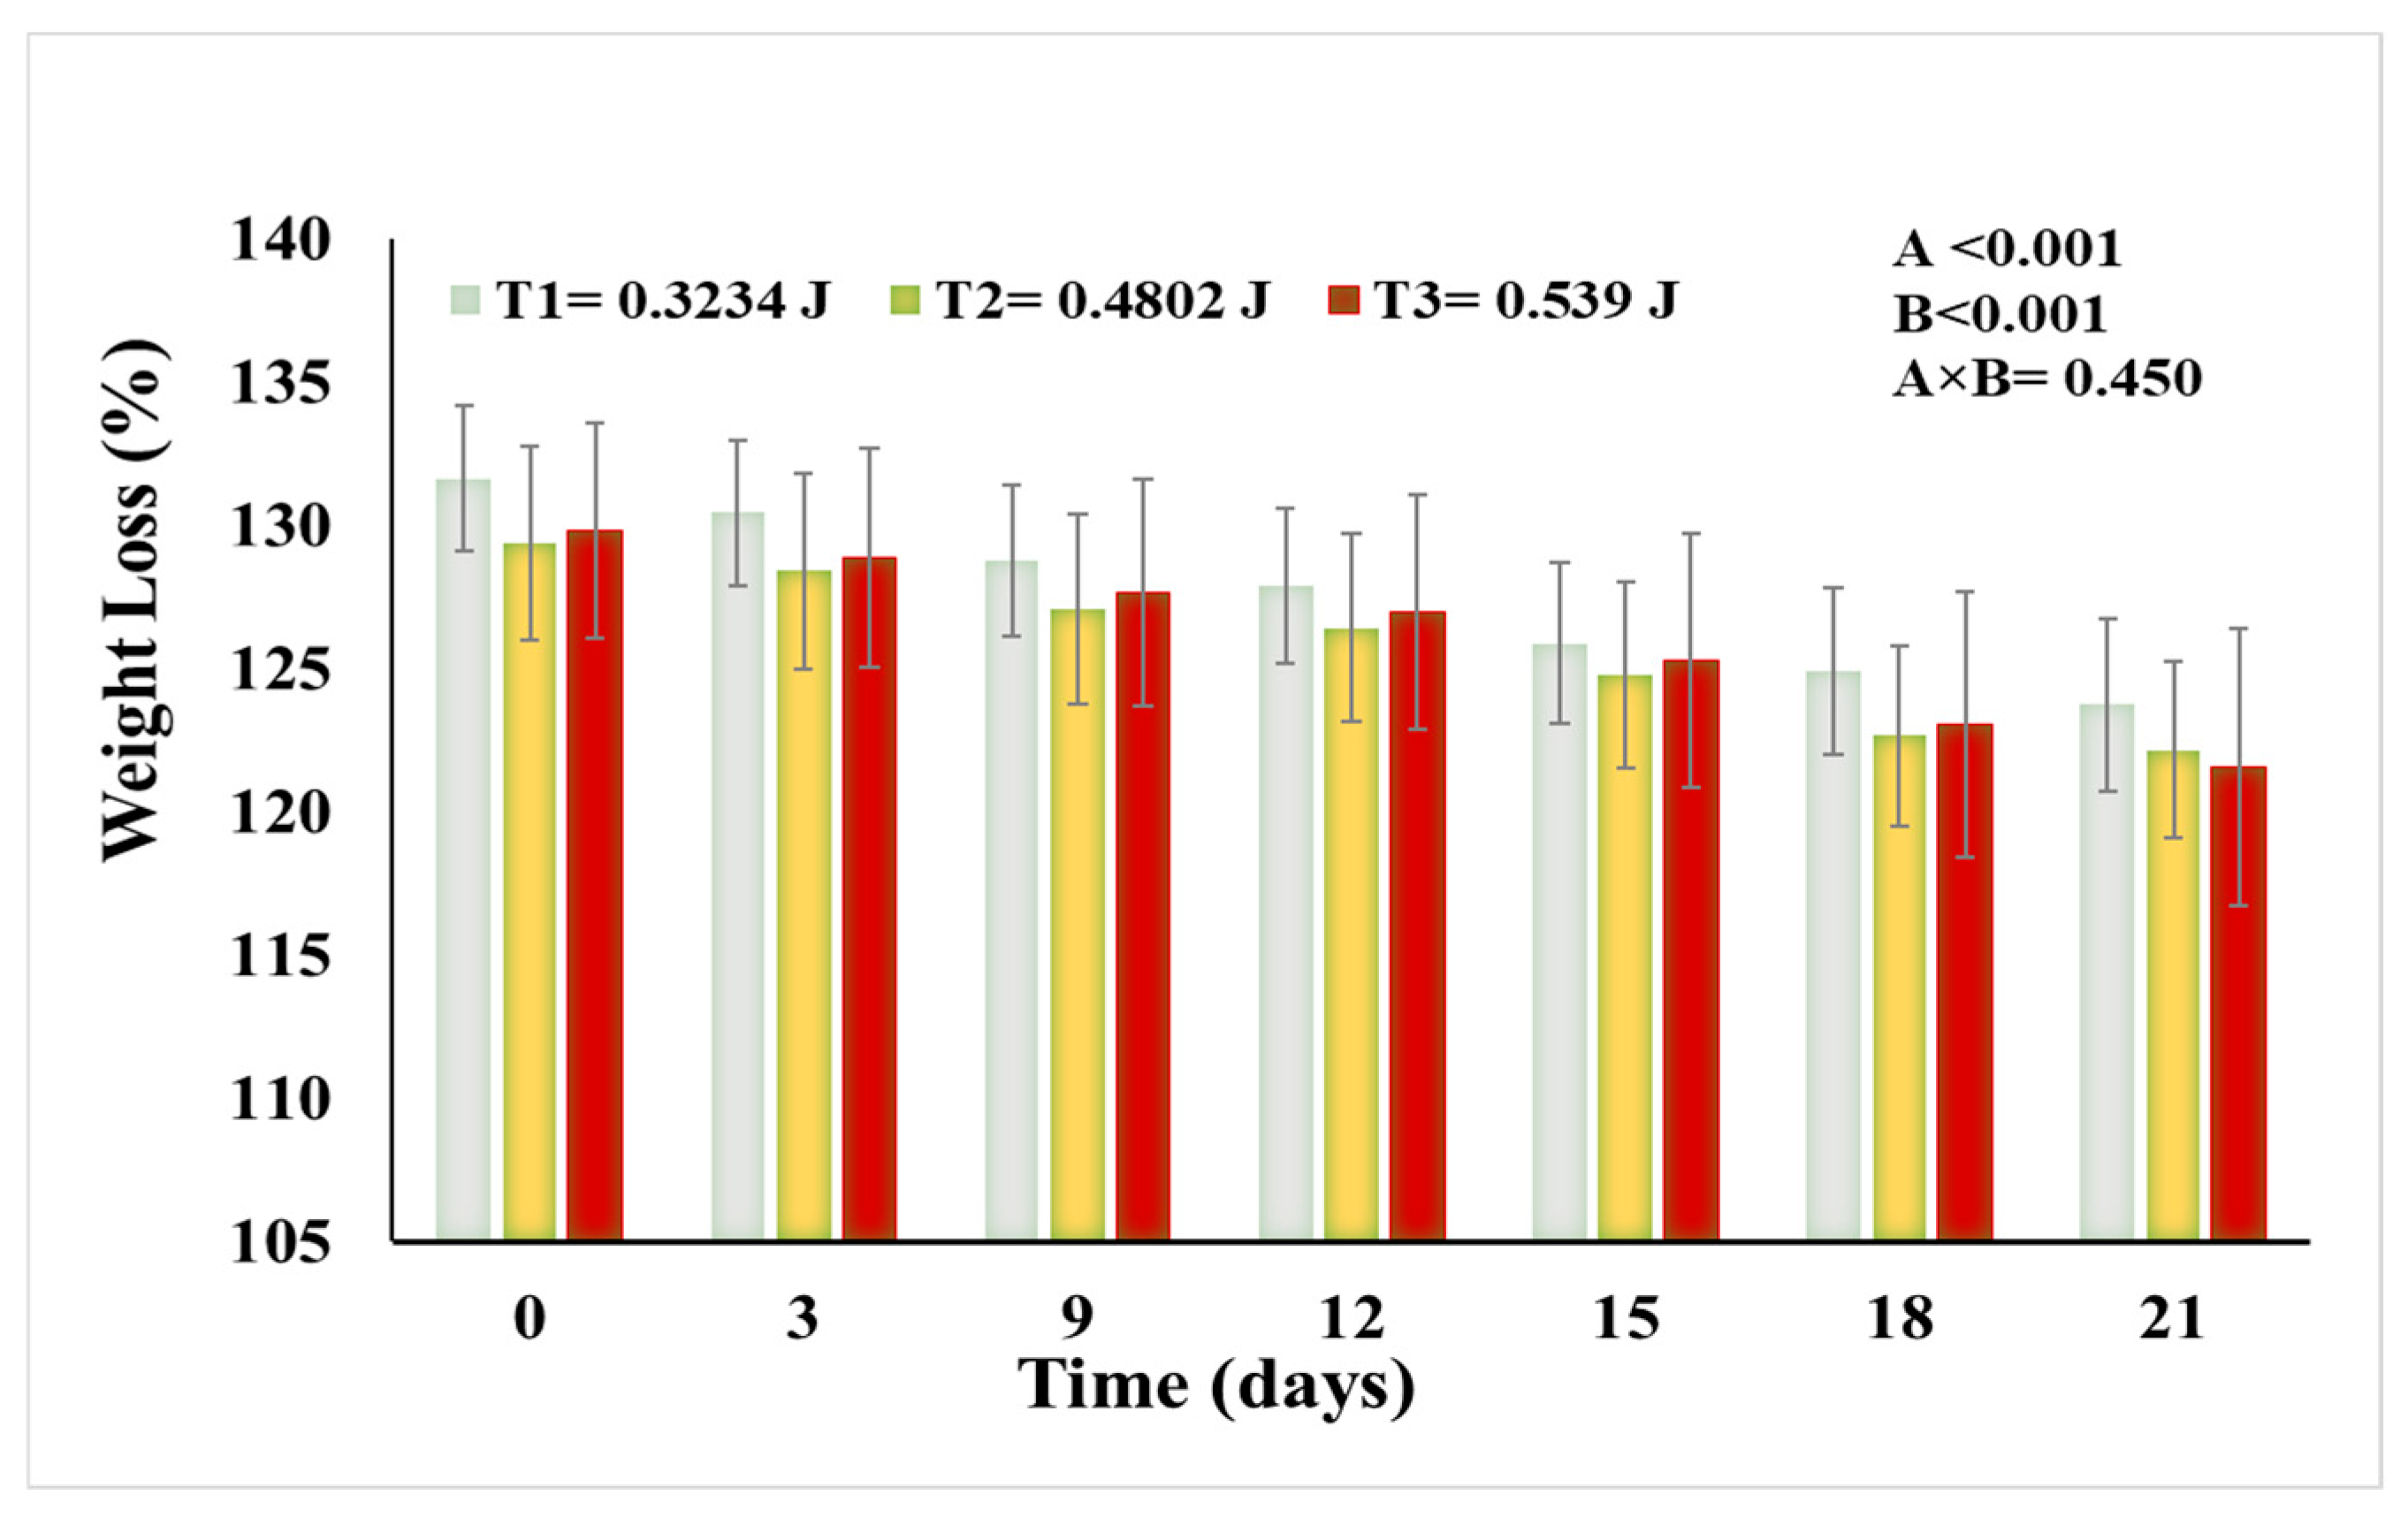
Figure 9 shows the percentage of weight loss for three levels of impact forces over 21 days. The weight loss was highly affected by storage duration and impact level (p < 0.05). The study found that the greater the energy, the higher the weight loss under constant conditions of storage (22 °C). When apples were bruised at a height of 50 cm using 110 g and 98 g of steel balls, a greater percentage of weight loss was revealed compared to the lowest impact (66 g) at 22 °C. After 3 days of storage, the weight loss percentage increased to reach 0.910%, 0.751%, and 0.729% for 66 g, 98 g, and 110 g of steel balls, respectively. On the last day of storage, the ball impactor of 110 g recorded a high percentage of weight loss in bruised apples with % of 6.362, whereas the ball impactor of 66 g led to a 5.993% weight reduction in the fruit. The weight loss observed in bruised apples may have been caused by tissue damage and changes in the permeability of the cell wall, which increased the rate of transpiration and respiration during storage [5]. According to Adi, Oduro and Tortoe [43], the reduction in the weight of fruit during storage is because of changes in tissue damage and the permeability of the cell wall, resulting in an increase in the moisture content loss to the surrounding environment. The findings of Wei, Xie, Mao, Xu, Luo, Xia, Zhao, Han and Lu [44] agreed with the results found by the study. They recorded that prolonged storage duration and mechanical damage increase the weight loss % in kiwifruit.

4. Conclusions

The current work investigated the effect of 3 impact damage levels using three different ball impactors, namely 60 g (low), 98 g (medium), and 110 g (high), on the bruise intensity and quality of apples during 21 days of storage using manual and digital processing techniques. This study focuses on using a computer vision system for early bruise identification, particularly for mechanically damaged apples. Impact force significantly affected the intensity of the bruise area, with a 110 g ball impactor (T3 = 0.539 J—high level) having the highest average bruise area after 3 days, where it reached 3.623 cm2 (manually) after 21 days. Image-processed measurements showed similar bruise area values as manual measurements. The bruise area and bruise susceptibility varied (p < 0.05) significantly with the usage of both techniques. This indicates that digital image analysis can be a good alternative technique to measure the bruise intensity of damaged apples. The results showed that the lightness (L*) does not change significantly over storage. A 66 g ball impactor (T1 = 0.3234 J—low) has less change in a* value than a 110 g ball impactor (T3 = 0.539 J) in manual and image measurements. The b* value increased faster in fruit when bruised by a 66 g ball impactor (T1 0.3234 J). The bruise damage by different ball weights elevated the weight loss percentage, where the highest impact force (110 g) resulted in a 6.362% weight loss, while the lowest impact force was 5.993% on the last day of storage. The decrease in surface area was less for 66 g of bruised apples and higher for 110 g of damaged apples. The study can recommend the utilization of computer vision systems and image processing methods to inspect the quality changes of fresh produce during the supply chain. The fruit sector can benefit from the study’s practical conclusions. The suggested non-destructive method can assist in identifying fruits that are getting close to rejection thresholds by measuring weight loss, color changes, and bruise area. This will enhance sorting decisions and lower postharvest losses. Maintaining marketable yield, reducing financial losses, and guaranteeing customer satisfaction across the supply chain all depend on even little variations in weight loss or surface degradation. Further research considering a wider range of storage conditions, drop heights, and the integration of other non-destructive techniques with advanced algorithms is recommended to enhance the reproducibility of the findings and broaden their applicability in postharvest practice.

Author Contributions

Z.A.-R.: Data collection, formal analysis, investigation, and writing the original draft. M.A.-D.: formal analysis, writing—review and editing. P.B.P.: Conceptualization, supervision, formal analysis, resources, funding acquisition, project administration, writing—review and editing. S.K.: Validation, writing—review and editing. All authors have read and agreed to the published version of the manuscript.

Funding

This work is based on research supported in part by Sultan Qaboos University under the Project code CL/SQU/QU/AGR/23/02. The authors also would like to thank the School of Agricultural Technology, King Mongkut’s Institute of Technology, Ladkrabang for the Academic Melting Pot (AMP) project (Grant no. KREF206803).

Institutional Review Board Statement

Not applicable.

Informed Consent Statement

Not applicable.

Data Availability Statement

All data generated or analyzed during this study are included in this published article.

Conflicts of Interest

The authors declare that they have no known competing financial interests or personal relationships that could have appeared to influence the work reported in this paper.

References

  1. Musacchi, S.; Serra, S. Apple fruit quality: Overview on pre-harvest factors. Sci. Hortic. 2018, 234, 409–430. [Google Scholar] [CrossRef]
  2. Akter, T.; Faqeerzada, M.A.; Kim, Y.; Pahlawan, M.F.R.; Aline, U.; Kim, H.; Kim, H.; Cho, B.-K. Hyperspectral imaging with multivariate analysis for detection of exterior flaws for quality evaluation of apples and pears. Postharvest Biol. Technol. 2025, 223, 113453. [Google Scholar] [CrossRef]
  3. Kistechok, A.; Wrona, D.; Krupa, T. Effect of storage conditions on the storability and nutritional value of new Polish apples grown in Central Poland. Agriculture 2023, 14, 59. [Google Scholar] [CrossRef]
  4. Singh, B.; Bhardwaj, V.; Kaur, K.; Kukreja, S.; Goutam, U. Potato periderm is the first layer of defence against biotic and abiotic stresses: A review. Potato Res. 2021, 64, 131–146. [Google Scholar]
  5. Fadiji, T.; Coetzee, C.; Chen, L.; Chukwu, O.; Opara, U.L. Susceptibility of apples to bruising inside ventilated corrugated paperboard packages during simulated transport damage. Postharvest Bio. Technol. 2016, 118, 111–119. [Google Scholar]
  6. Shafie, M.; Rajabipour, A.; Mobli, H. Determination of bruise incidence of pomegranate fruit under drop case. Int. J. Fruit Sci. 2017, 17, 296–309. [Google Scholar] [CrossRef]
  7. Xia, M.; Zhao, X.; Wei, X.; Guan, W.; Wei, X.; Xu, C.; Mao, L. Impact of packaging materials on bruise damage in kiwifruit during free drop test. Acta Physiol. Plantarum 2020, 42, 119. [Google Scholar]
  8. Diels, E.; van Dael, M.; Keresztes, J.; Vanmaercke, S.; Verboven, P.; Nicolai, B.; Saeys, W.; Ramon, H.; Smeets, B. Assessment of bruise volumes in apples using X-ray computed tomography. Postharvest Biol. Technol. 2017, 128, 24–32. [Google Scholar] [CrossRef]
  9. Li, Z.; Thomas, C. Quantitative Evaluation of Mechanical Damage to Fresh Fruits. Trends Food Sci. Technol. 2014, 35, 138–150. [Google Scholar] [CrossRef]
  10. Li, Y.; You, S.; Wu, S.; Wang, M.; Song, J.; Lan, W.; Tu, K.; Pan, L. Exploring the limit of detection on early implicit bruised ‘Korla’fragrant pears using hyperspectral imaging features and spectral variables. Postharvest Biol. Technol. 2024, 208, 112668. [Google Scholar] [CrossRef]
  11. Fernando, I.; Fei, J.; Stanley, R. Measurement and analysis of vibration and mechanical damage to bananas during long-distance interstate transport by multi-trailer road trains. Postharvest Biol. Technol. 2019, 158, 110977. [Google Scholar]
  12. Sun, Y.; Pessane, I.; Pan, L.; Wang, X. Hyperspectral Characteristics of Bruised Tomatoes as Affected by Drop Height and Fruit Size. LWT 2021, 141, 110863. [Google Scholar] [CrossRef]
  13. Ergun, M. Physical, physiochemical and Electrochemical Responses of ‘Galaxy’Apples to Mild Bruising. Eur. J. Hortic. Sci. 2017, 82, 244–250. [Google Scholar]
  14. Celik, H.K.; Ustun, H.; Erkan, M.; Rennie, A.E.; Akinci, I. Effects of bruising of ‘Pink Lady’apple under impact loading in drop test on firmness, colour and gas exchange of fruit during long term storage. Postharvest Biol. Technol. 2021, 179, 111561. [Google Scholar]
  15. Fu, H.; Du, W.; Yang, J.; Wang, W.; Wu, Z.; Yang, Z. Bruise measurement of fresh market apples caused by repeated impacts using a pendulum method. Postharvest Biol. Technol. 2023, 195, 112143. [Google Scholar] [CrossRef]
  16. Al-Dairi, M.; Pathare, P.B.; Al-Yahyai, R.; Al-Habsi, N.; Jayasuriya, H.; Al-Attabi, Z. Machine vision system combined with multiple regression for damage and quality detection of bananas during storage. Appl. Food Res. 2024, 4, 100641. [Google Scholar] [CrossRef]
  17. Lin, M.; Fawole, O.A.; Saeys, W.; Wu, D.; Wang, J.; Opara, U.L.; Nicolai, B.; Chen, K. Mechanical damages and packaging methods along the fresh fruit supply chain: A review. Crit. Rev. Food Sci. Nutr. 2022, 63, 10283–10302. [Google Scholar] [CrossRef]
  18. Ahmadi, E.; Ghassemzadeh, H.R.; Sadeghi, M.; Moghaddam, M.; Neshat, S.Z. The effect of impact and fruit properties on the bruising of peach. J. Food Eng. 2010, 97, 110–117. [Google Scholar] [CrossRef]
  19. Hussein, Z.; Fawole, O.A.; Opara, U.O. Effects of bruising and storage duration on physiological response and quality attributes of pomegranate fruit. Sci. Hortic. 2020, 267, 109306. [Google Scholar] [CrossRef]
  20. Mahanti, N.K.; Pandiselvam, R.; Kothakota, A.; Chakraborty, S.K.; Kumar, M.; Cozzolino, D. Emerging non-destructive imaging techniques for fruit damage detection: Image processing and analysis. Trends Food Sci. Technol. 2021, 20, 418–438. [Google Scholar] [CrossRef]
  21. Akter, T.; Bhattacharya, T.; Kim, J.-H.; Kim, M.S.; Baek, I.; Chan, D.E.; Cho, B.-K. A comprehensive review of external quality measurements of fruits and vegetables using nondestructive sensing technologies. J. Agric. Food Res. 2024, 15, 101068. [Google Scholar] [CrossRef]
  22. Liu, J.; Sun, J.; Wang, Y.; Liu, X.; Zhang, Y.; Fu, H. Non-Destructive Detection of Fruit Quality: Technologies, Applications and Prospects. Foods 2025, 14, 2137. [Google Scholar] [CrossRef]
  23. Nturambirwe, J.F.I.; Opara, U.L. Machine learning applications to non-destructive defect detection in horticultural products. Biosyst. Eng. 2020, 189, 60–83. [Google Scholar] [CrossRef]
  24. Yuan, Y.; Yang, Z.; Liu, H.; Wang, H.; Li, J.; Zhao, L. Detection of early bruise in apple using near-infrared camera imaging technology combined with deep learning. Infrared Phys. Technol. 2022, 127, 104442. [Google Scholar] [CrossRef]
  25. Al Ohali, Y. Computer vision based date fruit grading system: Design and implementation. J. King Saud. Univ. Comput. Inf. Sci. 2011, 23, 29–36. [Google Scholar] [CrossRef]
  26. Al-Dairi, M.; Pathare, P.B. Evaluation of Physio-chemical characteristics of ‘Fard’banana using computer vision system. J. Agric. Food Res. 2024, 15, 101057. [Google Scholar]
  27. Hussein, Z.; Fawole, O.A.; Opara, U.L. Investigating bruise susceptibility of pomegranate cultivars during postharvest handling. Afr. J. of Rural Dvlpmt. 2017, 2, 33–39. [Google Scholar]
  28. Du, D.; Wang, B.; Wang, J.; Yao, F.; Hong, X. Prediction of bruise susceptibility of harvested kiwifruit (Actinidia chinensis) using finite element method. Postharvest Biol. Technol. 2019, 152, 36–44. [Google Scholar] [CrossRef]
  29. Dagdelen, C.; Aday, M.S. The effect of simulated vibration frequency on the physico-mechanical and physicochemical properties of peach during transportation. LWT 2021, 137, 110497. [Google Scholar] [CrossRef]
  30. Htike, T.; Saengrayap, R.; Aunsri, N.; Tontiwattanakul, K.; Chaiwong, S. Investigation and Evaluation of Impact Bruising in Guava Using Image Processing and Response Surface Methodology. Horticulturae 2021, 7, 411. [Google Scholar] [CrossRef]
  31. Pathare, P.B.; Al-Dairi, M. Effect of mechanical damage on the quality characteristics of banana fruits during short-term storage. Discover Food 2022, 2, 4. [Google Scholar] [CrossRef]
  32. Hendricks, R.L.; Olsen, N.; Thornton, M.K.; Hatzenbuehler, P. Susceptibility of Potato Cultivars to Blackspot and Shatter Bruise at Three Impact Heights. Am. J. Potato Res. 2022, 99, 358–368. [Google Scholar] [CrossRef]
  33. Lu, F.; Ishikawa, Y.; Kitazawa, H.; Satake, T. Assessment and Prediction of Repetitive Impact Damage to Apple Fruit using Pressure-Sensitive Film Technique. J. Food Agric. Environ. 2012, 10, 156–160. [Google Scholar]
  34. Razavi, M.S.; Asghari, A.; Azadbakh, M.; Shamsabadi, H.-A. Analyzing the pear bruised volume after static loading by Magnetic Resonance Imaging (MRI). Sci. Hortic. 2018, 229, 33–39. [Google Scholar] [CrossRef]
  35. Molina-Corral, F.J.; Espino-Diaz, M.; Jacobo, J.L.; Mattinson, S.D.; Fellman, J.K.; Sepulveda, D.R.; Gonzalez-Aguilar, G.A.; Salas-Salazar, N.A.; Olivas, G.I. Quality attributes during maturation of ‘Golden Delicious’ and ‘Red Delicious’ apples grown in two geographical regions with different environmental conditions. Not. Bot. Horti Agrobot. Cluj-Napoca 2021, 49, 12241. [Google Scholar] [CrossRef]
  36. Pathare, P.B.; Opara, U.L.; Al-Said, F.A. Colour measurement and analysis in fresh and processed foods: A review. Food Bioprocess Technol. 2013, 6, 36–60. [Google Scholar] [CrossRef]
  37. Dobrzanski, B.; Rybezynski, R. Colour change of apple as a result of storage, shelf-life, and bruising. Int. Agrophysics 2002, 16, 261–268. [Google Scholar]
  38. Pathare, P.B.; Al-Dairi, M. Bruise damage and quality changes in impact-bruised, stored tomatoes. Horticulturae 2021, 7, 113. [Google Scholar] [CrossRef]
  39. Htike, T.; Saengrayap, R.; Kitazawa, H.; Chaiwong, S. Fractal image analysis and bruise damage evaluation of impact damage in guava. Inf. Process. Agric. 2024, 11, 217–227. [Google Scholar] [CrossRef]
  40. Al-Dairi, M.; Pathare, P.B.; Al-Yahyai, R.; Jayasuriya, H.; Al-Attabi, Z. Evaluation of chemical quality attributes in bruised bananas during storage. LWT 2024, 197, 115904. [Google Scholar] [CrossRef]
  41. Pérez-López, A.; Chávez-Franco, S.; Villaseñor-Perea, C.; Espinosa-Solares, T.; Hernández-Gómez, L.; Lobato-Calleros, C. Respiration rate and mechanical properties of peach fruit during storage at three maturity stages. J. Food Eng. 2014, 142, 111–117. [Google Scholar] [CrossRef]
  42. Huang, H. Molecular Regulation Mechanisms of Ripening, Senescence and Stress Resistance in Fruits and Vegetables. Agronomy 2024, 14, 1703. [Google Scholar] [CrossRef]
  43. Adi, D.D.; Oduro, I.N.; Tortoe, C. Physicochemical changes in plantain during normal storage ripening. Sci. Afr. 2019, 6, e00164. [Google Scholar] [CrossRef]
  44. Wei, X.; Xie, D.; Mao, L.; Xu, C.; Luo, Z.; Xia, M.; Zhao, X.; Han, X.; Lu, W. Excess water loss induced by simulated transport vibration in postharvest kiwifruit. Sci. Hort. 2019, 250, 113–120. [Google Scholar] [CrossRef]
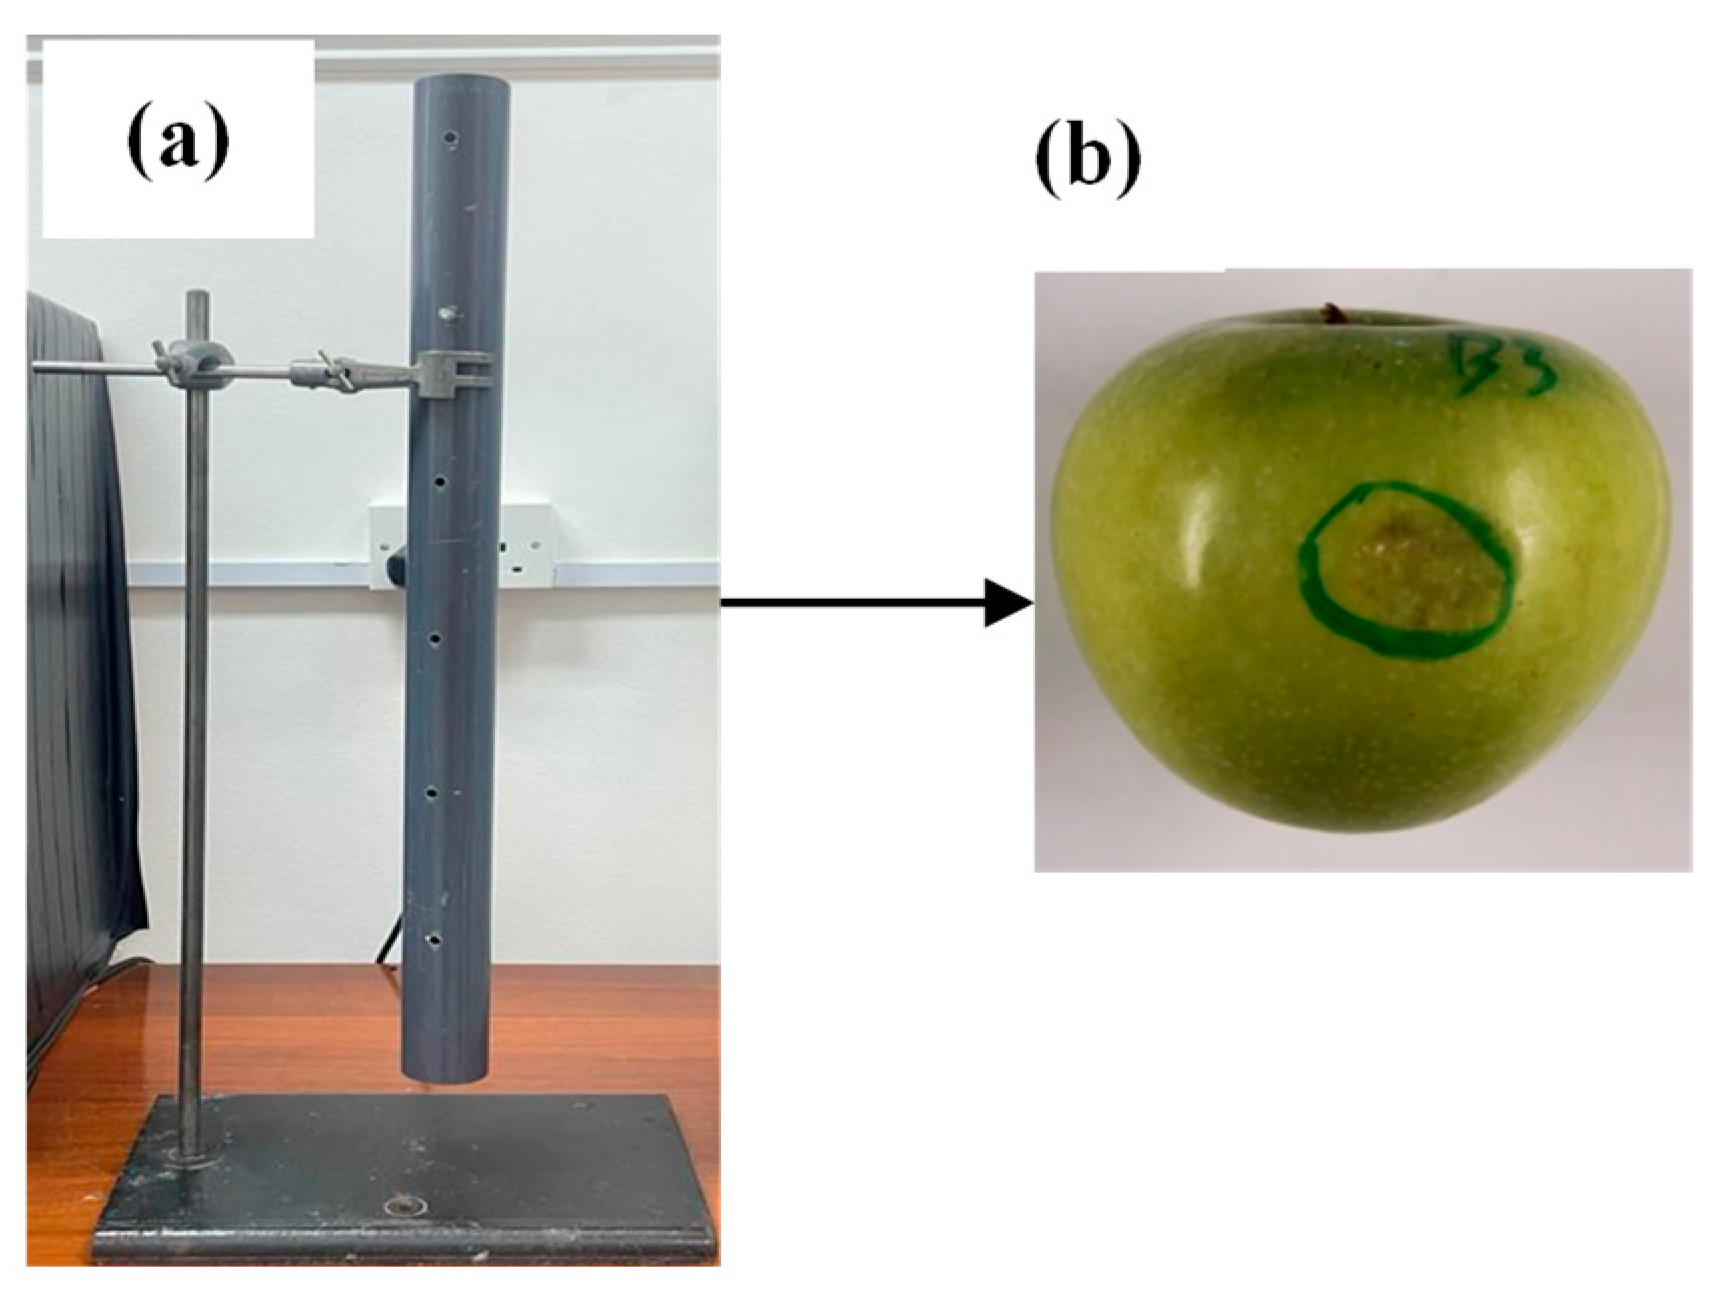
Figure 1. The setup of the drop impact test (a) and the resulting bruise after impact on the apple (b).
Agriengineering 07 00318 g001
Figure 2. Establishing an experimental setting and using an image analysis process to identify bruises and measure the surface area.
Agriengineering 07 00318 g002
Figure 3. The RGB values of apple by ImageJ analysis. The yellow square indicates the exact region where color is measured.
Agriengineering 07 00318 g003
Figure 4. Bruise area of apple fruit impacted at different forces (T1 = 0.323 J, T2 = 0.480 J, and T3 = 0.539 J) measured digitally and manually. The error bars represent the mean ± SD of 5 readings per 5 fruit replicates per day. A = measured methods, B = impact damage, C = storage days.
Agriengineering 07 00318 g004
Figure 5. Bruise susceptibility of apple fruit impacted at different forces (T1 = 0.323 J, T2 = 0.480 J, and T3 = 0.539 J) measured digitally and manually. The error bars represents the mean ± SD of 5 readings per 5 fruit replicates per day. A = measured methods, B = impact damage, C = storage days.
Agriengineering 07 00318 g005
Figure 6. ‘L*, a*, b* values of apple fruit impacted at different forces (T1 = 0.323 J, T2 = 0.480 J, and T3 = 0.539 J) measured digitally and manually. The error bars represents the mean ± SD of 15 readings per 5 fruit replicates per day’. A = measured methods, B = impact damage, C = storage days.
Agriengineering 07 00318 g006
Figure 7. The RGB color values of apple fruit impacted at different forces (T1 = 0.323 J, T2 = 0.480 J, and T3 = 0.539 J) measured digitally and manually. The error bars represents the mean ± SD of 15 readings per 5 banana replicates per day. A = impact damage, B = storage days.
Agriengineering 07 00318 g007aAgriengineering 07 00318 g007b
Figure 8. Surface area of apple fruit impacted at different forces (T1 = 0.323 J, T2 = 0.480 J, and T3 = 0.539 J) measured digitally and manually. The error bars represents the mean ± SD of 5 readings per 5 fruit replicates per day. A = measured methods, B = impact damage, C = storage days.
Agriengineering 07 00318 g008
Figure 9. The weight losses % of apple fruit impacted at different forces (T1 = 0.323 J, T2 = 0.480 J, and T3 = 0.539 J). The error bars represents the mean ± SD of 15 readings per 5 fruit replicates per day. A = impact damage, B = storage days.
Agriengineering 07 00318 g009
Table 1. The overall treatment of the study.
Treatment Ball Mass (g) Impact Energy (J)Level of Damage
1660.3234Low
2980.4802Medium
31100.539High
Table 2. The values of Chroma and Hue° changes of the apple during 21 days at constant temperature (22 °C) and different impact energy (T1 = 0.323 J, T2 = 0.480 J, and T3 = 0.539 J). The data are shown as the mean ± SD of 15 readings out of 5 fruits per treatment.
Chrome Hue°
Manual Measurements
TimeT1T2T3T1T2T3
040.76 ± 2.6040.76 ± 2.6040.76 ± 2.60109.15°± 0.44105.15° ± 0.44105.15° ± 0.44
341.92 ± 1.4541.6 ± 2.8342.39 ± 1.42109.74° ± 1.24108.55° ± 1.24−109.15° ± 0.71
941.16 ± 3.5442.41 ± 2.2642.61 ± 2.13109.46° ± 1.11108.59° ± 1.10108.78° ± 1.16
1143.13 ± 1.0343.66 ± 2.7243.38 ± 1.60108.50° ± 0.91108.60° ± 0.72108.50° ± 1.08
1543.87 ± 1.7842.1 ± 2.4142.69 ± 1.96109.38° ± 0.64107.71° ± 1.01107.17° ± 0.68
1843.98 ± 1.8243.88 ± 3.3644.9 ± 2.01107.36° ± 1.08106.82° ± 0.76107.00° ± 0.35
2143.3 ± 1.5342.54 ± 2.6743.51 ± 0.78106.11° ± 1.10106.51° ± 0.69104.43° ± 0.64
Computer vision system
TimeT1T2T3T1T2T3
039.38 ± 1.0739.38 ± 1.0739.38 ± 1.07114.41° ± 1.09114.41° ± 1.09114.41° ± 1.09
340.61± 1.5041.77± 2.4341.92 ± 2.43108.04° ± 0.70105.86° ± 0.80107.01° ± 0.78
941.66 ± 2.1041.43 ± 1.1342.26 ± 2.63112.18° ± 0.38110.43° ± 0.34111.69° ± 0.82
1140.46 ± 1.4440.33 ± 2.1442.54 ± 1.33110.98° ± 0.60109.49° ± 0.62110.88° ± 0.72
1541.28 ± 1.8241.89 ± 1.4041.97 ± 1.95109.50° ± 0.26109.37° ± 0.42109.58° ± 0.67
1842.80 ± 2.4743.79 ± 1.7842.34 ± 1.38108.55° ± 0.28107.22° ± 0.59109.66° ± 0.81
2142.20 ± 1.9743.56 ± 2.5538.88 ± 2.52108.12° ± 0.36107.33° ± 0.5497.60° ± 1.12
Disclaimer/Publisher’s Note: The statements, opinions and data contained in all publications are solely those of the individual author(s) and contributor(s) and not of MDPI and/or the editor(s). MDPI and/or the editor(s) disclaim responsibility for any injury to people or property resulting from any ideas, methods, instructions or products referred to in the content.