Article

Concept of a Cyber–Physical System for Control of a Self-Cleaning Aquaponic Unit

by
Kristiyan Dimitrov
1,*,
Nayden Chivarov
1,
Stefan Chivarov
1,
Tsvetelina Paunova-Krasteva
2,
Emil Filipov
3 and
Albena Daskalova
3
1
Institute of Information and Communication Technologies, Bulgarian Academy of Sciences, 1000 Sofia, Bulgaria
2
Institute of Microbiology, Bulgarian Academy of Sciences, 1113 Sofia, Bulgaria
3
Institute of Electronics, Bulgarian Academy of Sciences, 72 Tzarigradsko Shousse Blvd., 1784 Sofia, Bulgaria
*
Author to whom correspondence should be addressed.
AgriEngineering 2024, 6(4), 3843-3874; https://doi.org/10.3390/agriengineering6040219
Submission received: 15 August 2024 / Revised: 17 October 2024 / Accepted: 18 October 2024 / Published: 23 October 2024

Abstract

:
The article aims to present a cyber–physical system (CPS) to support the cultivation of aquaculture in a closed aquaponic system using the deep-water culture (DWC) method. The CPS uses precision sensors as TriOxmatic 700 IQ (for dissolved oxygen and water temperature), AmmoLyt Plus 700 IQ (for ammonium), NiCaVis 701 IQ NI (for nitrites and nitrates), SensoLyt® 700 IQ (for pH), and SL-M5 (for water level). It is built with a Raspberry Pi 4, 8 GB as a server, OpenHAB 3.0 software, and other specialized software for measuring water parameters. Some of the parameters are maintained completely autonomously, while others are indirectly controlled. Basic knowledge of hydroponics and aquaculture is required to set up the system, but day-to-day maintenance can be carried out by employees who receive instructions from the CPS. A method for the physical modification of the fish tank surface by using laser processing is proposed. This results in a change in surface topography (creating diverse microstructure patterns) and its roughness, which is of crucial importance for the bacterial adhesion mechanism.

1. Introduction

A significant part of the total fish yield in the European Union (EU) is provided by aquaculture. These are artificially enclosed spaces in natural reservoirs, or artificially created ones for the purpose of growing different types of fish or seafood, where there exists some kind of environmental control. In the last 20 years in the EU, aquaculture has had a sustainable growth rate, as the production of fish by aquaculture from the total production has increased from about 15% in 2000 to about 20% in 2021. [1]. In the last two decades, net pens have also been widely used [2]. Wastewater recirculation has a major impact on reducing pollution in aquaculture [3].
The first reports of using aquaponics date from about the 12th century, when the Aztecs grew plants on rafts in ponds where there were fish. Modern aquaponics began its development in the 1970s of the 20th century but has gained more and more popularity in recent years, especially in regions where there is a lack of fertile soil and water or where the available spaces are limited.
When growing fish and other aquatic animals, waste products, such as excrements, urine, ammonia excretion by the fish gill, food scraps, and others, turn into harmful substances, such as ammonia NH3, nitrites NO2−, and hydrogen sulphide H2S, which cause water pollution that can be extremely dangerous for fish in aquaculture. This can lead to large economic losses, as well as negative environmental impacts on a global scale [4,5]. One of the advantages of aquaponics is the closed cycle in which fish waste released through the gills and urine (urine being mainly ammonia) is converted through the processes of nitrification [6] and mineralization [7]. Solid waste is also released, with some of it being converted into ammonia thanks to microbial activity [6]. This process leads to biological contamination of the waste water. A minimal water resource is used in aquaponics since, in a well-balanced system, the only water losses are expected from evaporation [8]. Also, in aquaponics, there is a high yield per unit area for both the fish grown and the plants. Thus, for the latter, it is not necessary to use artificial fertilizers, except for the need for some micronutrients (such as iron, zinc, boron, copper, manganese, and molybdenum) [6] and macronutrients (such as nitrogen, phosphorus, potassium, calcium, magnesium, and sulfur) [6], due to the nitrification process that provides the necessary nitrates for plants [9,10]. The need for these nutrients can be determined by the condition of the plants, the various symptoms for which can be found in [6]. Taking into account the facts mentioned above, it can be assumed that the proposed CPS initiative is directly connected to the UN Sustainable Development Goals (SDGs) 2, 6, and 12. One of the main problems in aquatic systems is biofouling [11]. The basic requirements for any aquaculture are related to the good water quality and its maintenance.
Numerous approaches have been developed to avoid fouling effects; however, most of them rely on utilizing chemical treatments and creating specific coatings. An alternative method is the physical modification of the material by applying laser radiation to introduce microstructures and control their roughness, which is crucial for bacterial adhesion [12]. The results obtained in this study are focused on proposing an efficient design of antifouling and antimicrobial surfaces with properties suitable for use in aquaponics systems. These properties are related to improving the fouling resistance and sustainable processing by optimizing the texturing routes for laser-induced micro/nanostructuration. The idea of combining the development of a cyber–physical system for controlling the water quality parameters with surface treatment via laser processing is to propose a synergetic, innovative antifouling and self-cleaning non-leaching surface with increased health and safety impact and controlled biofilm formation leading to the control of water quality.
Lately, applying laser radiation to creating micro- and nano-patterned surfaces of diverse materials has been shown to possess antibacterial and/or antifouling properties [13]. Numerous studies have found that surface texture influences microbial species by regulating bacterial surface interactions. The governing mechanism of antifouling and antimicrobial microstructure surfaces relies on bacterial cell surface interactions. The basic strategy for the creation of biomimetic surfaces exhibits a number of examples from nature (lotus leaf effect, cicada wing) [14].
Aquaculture contributes more than 15% yearly to protein consumption globally and is under increasing growth. However, it is affected by progressive fouling, expressed in the continuous accumulation of a biofilm (microorganisms) and, finally, the formation of a macroorganism on fish breeding tanks, thus resulting in undesired bacterial growth and leading to diverse fish disease perturbations in ecosystems. This is why control over the fouling process is essential [15].
Biofilm development (microfouling) is a main outcome of bacteria colonization on a surface. This effect can evolve on any type of surface in the presence of microbes. Biofilms are difficult to eliminate because of the self-produced matrix where the bacteria tend to proliferate.
Most of the established solutions used to prevent biofilm development rely on the use of biocide-leaching surfaces. This type of surface leads to a decrease in biofilm formation; however, the overall effect is chemical pollution. Thus, non-toxic fouling control surfaces represent a promising solution that efficiently reduces both the antibiotic use [16] in freshwater aquaculture and the biofilm formation on fish tank surfaces. The expected long-term advantages arising are (I) a decrease in fish infections in aquaculture, (II) a decrease in the cleaning frequencies of the tanks, and (III) a decrease in the need for fish antibiotics, all of which lead to a more responsible model of fish breeding.
In this regard, the aim of this research is creating an automated control system that will make it easier to manage and balance aquaponic systems and lead to their wider use, while at the same time reducing the amount of aquaculture grown in which there is no recirculation of water and, hence, no pollution of the environment.

2. Basic Types of Aquaponic Systems

There are different techniques that can be used to realize an aquaponic unit. The main ones are the media bed technique, the nutrient film technique (NFT), and the deep-water culture technique (DWC) [6]. Each of them has advantages and weaknesses. For the purpose of this study, the DWC method is considered. Its advantages are many. It is suitable for commercial purposes and can be managed easily. Aquaponic systems built using the DWC method are resistant to power cuts and breakdowns because of the large amount of water. From another point of view, water evaporation is also minimal because of polystyrene sheets floating on the water surface. The plants are grown in small holes in the plates and the roots are immersed directly in the water, from where they obtain nutrients and oxygen. This method is mainly used for the production of lettuce and basil, but it is suitable for all types of low-stemmed vegetables.
Aquaponic systems can be located outdoors or indoors. The specifics of the climate in the region determine whether a system can be implemented outdoors; however, an indoor location is to be preferred [17] since, as constant conditions are ensured, maintaining the water temperature on cold days is less expensive and precipitation does not affect the water quality.

3. Materials and Methods

3.1. Components of the Aquaponic System

An aquaponic system based on the DWC method must contain the following components: a fish tank, a mechanical filter, a biofilter, troughs for growing plants (floating rafts), a water circulation pump, air pumps with air stones, and a pipe network. Further, sensors and actuators are required to implement the proposed cyber–physical system for measuring and regulating the water parameters. The development requirements of the CPS are summarized in Table 1.
The system must have sensors for measuring the water temperature, dissolved oxygen DO, nitrite NO2−, nitrate NO3−, pH, and ammonium NH4+. In order to determine the concentration of total ammonia nitrogen TAN and ammonia NH3, in this case, a calculation method was used based on the concentration of NH4+, depending on the pH and water temperature. Measuring and controlling these parameters within certain limits determines the balance to be maintained in the aquaponic system, which is described in detail in Section 4. Maintaining this balance by controlling the above parameters in turn determines the requirements to the CPS.
Figure 1 presents a block diagram of the CPS components and the connections between them. The wi-fi router creates a common network for the entire system, to which Node-MCU controllers and Raspberry PI4 are connected. In this case, the IQ SensorNet controller 28X is connected to the network via the Enternet. All sensors except the water level sensors are wired to these controllers with a plug-and-play connection. Node-MCU controllers receive and transmit data to the network using the MQTT Broker. Actuators are connected to Node-MCU controllers through relay modules. The system can be modified, and sensors can be used via a mod bus, for example.
Figure 2 shows the components of the aquaponic system and the location of the sensors and actuators. Table 2 shows the parameters measured and the control mechanisms.
The requirements for the construction of the aquaponic system are briefly discussed below, but they are not the subject of discussion in this article.
The water tank volume should be considered according to the number of fish and the stocking density. On average, there should be about 20 kg of fish per 1000 L of water. It is preferable to use polypropylene or have such a coating in order to perform laser processing, according to the method proposed.
The size of the particulate filter (mechanical filter) and of the biofilter are also determined by the number of fish. The biofilter size depends also on the material used in it—Bio Balls [6,18], volcanic rock or bottle caps, and the size of the surface on which the nitrifying bacteria can grow. Floating rafts should be deep enough for plant roots [6] and convenient for staff to service.
The circulation pump should be able to pump out the entire amount of water in the system within 1 to 2 h. Typically, 80% of the pumped water is returned to the fish tank, and 20% goes to the floating rafts. It is better to choose circulation pipes with a larger diameter to reduce their resistance, taking into account the possibility of dirt layering on the inside. A description of building an aquaponic system can be found in [6].
Sensors with the required resolution and high reliability should be selected. The following sensors (Table 3) are suitable and have been tested with the CPS for this purpose.
All other sensors with similar characteristics can be used and connected to the proposed system. All types of level sensors are suitable, as long as they have a normally open contact, such as, e.g., the SL-M5.

3.2. Laser Processing of the Polypropylene

Polypropylene is a durable polymer that is FDA (US Food and Drug Administration) -approved for the food industry and does not break down easily, making it a good alternative for use in fish tanks. Because of its low cost, excellent chemical resistance, good mechanical characteristics, and ease of fabrication, polypropylene (PP) is a good candidate for applications in medical accessories, construction materials, and transportation. Moreover, polypropylene is non-toxic and does not leach chemicals into the water environment, thus being safe for use in aquaculture.
A femtosecond Spitfire Ti: Sapphire laser source (Spectra Physics) was used in the current studies. The main characteristics of the laser radiation used are as follows: central wavelength of 800 nm, pulse duration of τ~60 fs, maximum output power of 6 W, and repetition rate of 1 kHz. The laser beam has a Gaussian profile and a mean spot diameter of 25 μm, as measured by a beam profilometer. For surface texturation, the samples were positioned by means of a Thorlabs commercial submicrometric XY translation stage, with the ability to change the distance between two adjacent rows and control the scanning speed.
Scanning electron microscopy (SEM) analyses were performed to analyze the surface morphology before and after laser processing. The SEM images were acquired by a SEM (Hitachi SU5000 + EDS/WDS Thermo Scientific ANAMAT or LYRA I XMU) at an accelerating voltage (HV) of 20 kV. The samples were carbon sputtered.
A Zeta-20 3D optical profiler (Zeta Instruments, KLA, Milpitas, CA, USA) at 20× magnification with ProfilmOnline software v.4.0.6.3 (https://www.profilmonline.com, accessed on 5 February 2024) was used to estimate the surface roughness.

3.3. Biofilm Experiments

3.3.1. Microorganism and Culture Conditions

The strain Pseudomonas aeruginosa 27853 used in the present study was purchased from the American Type Culture Collection (ATCC). The strain maintenance included storage in 8% DMSO at −80 °C. After multiple passages through Tryptic Soy Broth (HiMedia, Bedford, PA, USA), the strain was stored on Tryptic Soy Agar (HiMedia, Bedford, PA, USA) slants for the upcoming experiments. To conduct the biofilm cultivation, the laser-treated and non-laser-treated polypropylene structures, the latter used as a control probe, were pretreated with ethanol, washed, and UV-sterilized. Overnight bacterial culture was calibrated to McFarland standard (approximately 1 × 10⁷ colony forming units CFU/mL) in TSB. The bacterial inoculum was dropped in a 24-well plate with a volume of each well of 2 mL in order to cover the treated surfaces, and they were incubated for 24 h at 37 °C without shaking for biofilm grown.

3.3.2. SEM Investigations

Following the cultivation procedure described in 3.3.1, the planktonic cells were removed, and the polypropylene structures were triply washed with 0.1 M Na cacodylate buffer (pH 7.2) and fixed with 4% glutaraldehyde for 2 h at 4 °C. The post-fixation procedure was performed for 1 h with a solution of 1% OsO4 and incubated again at 4 °C, dehydrated via a graded ethanol series and sputter-coated with a thin layer of gold using a vacuum evaporator (Edwards, Stansted, UK). The Pseudomonas aeruginosa biofilms were observed on a Lyra/Tescan scanning electron microscope (TESCAN GROUP a.s., Brno, Czech Republic) with an accelerating voltage of 20 kV and 10 randomly selected digital images per sample.

3.3.3. Evaluation of Bacterial Viability

To evaluate the bacterial cells viability, pre-sterilized laser-treated and non-laser-treated structures (used as a control group) were co-cultivated with 2 mL overnight 1:100 diluted bacterial culture in a 24-well plate. After a 24 h incubation period at 37 °C, the planktonic cells were removed and the biofilm was collected with sterile swabs. The bacterial suspension was serial diluted in 0.9% NaCl and 100 µL were transferred onto TSA using the drop-plated technique, followed by incubation for 24 h at 37 °C. The number of surviving bacterial cells was counted from three different petri dishes.

4. Maintaining Balance in Aquaponic Systems

In order to balance an aquaponic unit, it is necessary to know and manage the occurring processes. One of the most important indicators is the water quality, which is expressed as its suitability for certain applications. Depending on the intended usage of the water, there are certain parameters that must be reached in order to define the water quality; these parameters have different values for fish, for plants, and for proper bacterial development. Therefore, it is necessary to find the golden mean where all organisms coexist in symbiosis [6,19]. In an aquaponic unit, it is necessary to monitor the water temperature, the dissolved oxygen (DO), the dissolved carbon dioxide (CO2), the presence of ammonia (NH3), nitrites (NO2−), nitrates (NO3−), the power of hydrogen pH, the alkalinity, as well as the development of various bacterial groups [6].

4.1. Temperature (t)

The water temperature parameter is particularly important in aquaculture, as it is determined by the particular species. Fish are mainly divided into warm-water and cold-water types [6,20]. Warm-water fish inhabit water bodies with temperatures between 22 °C and 32 °C, while cold-water fish live at temperatures between 10 °C and 18 °C [6]. In order for an aquaponic system to be more effective, selecting the fish to grow should be made bearing in mind the local climate. In the cases of drastic winter/summer temperature variation, it is preferrable to exchange the fish type twice a year, even if the aquaponic system is located indoors. This will result in lower system maintenance costs. However, the water temperature should also be considered as related to the bacterial ecosystem. For the successful and rapid development of nitrifying bacteria, it is necessary to maintain a temperature above 17 °C [6,21]. Adding fish to the aquaponic system is not recommended before a stable colony of nitrifying bacteria is established, following which the nitrifying bacteria can be subjected to lower temperatures, down to 10 °C. In such a case, their productivity would decrease by a factor of two. For plants, the recommended water temperature is between 16 °C and 30 °C. When choosing the fish type, the right plants should be selected accordingly [22]. A larger biofilter should be considered if cold-water fish are kept.

4.2. Power of Hydrogen (pH)

The power of hydrogen pH has an extremely strong impact on the processes taking place in an aquaponic unit. It affects the fish, plants, and bacteria directly and indirectly by affecting other water parameters [23]. Fish have a relatively large range of pH tolerance, from 6.5 to 8.5 [24]. But a rapid pH change can lead to stress, disease, and death. Therefore, the pH should not change by more than 0.3 within 24 h [6,21]. Nitrifying bacteria are much more sensitive to pH—at pH values below 6, they have difficulty transforming ammonia into nitrites and nitrates, which reduces the biofilter’s efficiency. The pH value is also responsible for the uptake of macro- and micro-elements by plants. The most favorable range for plants is between 6 and 6.5; values above 7.5 [6] or even above 7 [25] can stop the absorption of some elements, such as phosphorus and iron, which can lead to nutritional deficiency.

4.3. Water Hardness

Water has two types of hardness characteristics: general hardness (GH) and carbonate hardness (KH), the latter being important for aquaponic purposes. KH, also called alkalinity, represents the total amount of carbonates (CO32−) and bicarbonates (HCO3) that are dissolved in water and is measured as the amount of CaCO3 in mg/L. Alkalinity plays the role of a buffer, preventing the pH from becoming too low due to nitrification processes. The carbonate and bicarbonate that are dissolved in the water connect to the H+ ions released during nitrification, thus removing them from the water. The pH then remains constant even as new H+ ions are added. Balancing the aquaponic system does not necessitate a continuous monitoring of the KH if it is within the recommended limits of 60–140 mg/L [6]. It suffices that the water added to the system has the required hardness [6]. This is why the direct use of rainwater or water with a very low carbonate hardness without pretreatment is not recommended. If the added water cannot provide the necessary carbonate hardness KH as needed to maintain the pH balance, other actions would also be required—bases, such as potassium hydroxide (KOH) and calcium hydroxide (Ca(OH)2), could be added. It is safer to add calcium carbonate (CaCO3) or potassium carbonate (K2CO3), which will also raise both KH and pH. This can be performed by adding crushed eggshells, finely crushed clams, coarse limestone grit, and crushed chalk [6].

4.4. Dissolved Oxygen

The dissolved oxygen (DO) represents the amount of molecular oxygen in the water measured in mg/L. DO has major effects on all three types of organisms: fish, plants, and bacteria. Although oxygen is always dissolved in the water due to the contact with air, this amount is not sufficient, which requires additional enrichment of the water by means of air pumps. The water ability to hold oxygen depends on its temperature, so that more intensive aeration of the water is necessary at higher temperatures. An environment in which DO is from 4 to 8 mg/L is the most favorable for nitrifying bacteria, while for plants it is sufficient to be above 3 mg/L. Depending on the type of fish, a concentration of 4 to 6 mg/L should be maintained for most warm-water fish, while for cold-water fish this value is 6 to 8 mg/L [26]. If the DO concentration becomes less than that required by the fish species, it cannot efficiently convert energy into a usable form, which reduces the fish growth, feed efficiency, and swimming ability [26]. Although the water is continuously circulated, in medium- and large-size aquaponic systems, it is important to monitor the DO level not only in the fish tank but also in the biofilter and floating rafts. A low DO concentration in the water reduces the concentration of oxygen in fish blood, while the nitrites hinder the transfer of oxygen in the blood. Therefore, DO deficiency boosts the nitrites’ toxicity [27,28,29,30].

4.5. Carbon Dioxide CO2

Breathing causes fish to release carbon dioxide (CO2), which lowers the pH level. This effect is amplified at higher water temperatures and stocking densities [6]. High levels of carbon dioxide CO2 will worsen fish health [31]. As a general rule, aquaponic systems which are supplied with pure oxygen do require some form of CO2 stripping, while aquaponic systems supplied with aeration for oxygen supplementation do not [31]. In a well-implemented DO system, the dissolved CO2 is carried upwards to the water surface by the air [6,21].

4.6. UV Radiation

Nitrifying bacteria are particularly sensitive to UV radiation prior to their colony being fully developed, following which its effect is insignificant. Therefore, it is necessary to shade the biofilter and fish tank until a stable colony of bacteria is established. It is preferable that they remain protected from direct sunlight at all times to prevent the development of micro and macroalgae. Microalgae (phytoplankton) turn the water green and strongly affect the DO and pH. Due to photosynthesis, during the day they increase the DO and pH level, but at night they consume oxygen and release CO2, which also decreases the pH [6]. These rapid changes are strongly undesirable in aquaponics. Macroalgae may block the circulation pump, pipes, or other elements of the system [6]. In general, both types of algae can significantly reduce the nutrients available to plants, thus slowing their growth.

4.7. Total Nitrogen

The total nitrogen amount consists of ammonia, nitrites (NO2−), and nitrates (NO3−). In water, ammonia exists in two forms: ammonia (NH3) and ammonium ions, or ammonium (NH4+). While ammonia NH3 is highly toxic to fish, ammonium is not [6,31,32]. The total amount of ammonia and ammonium is called total ammonia nitrogen (TAN). The form of ammonia is mainly determined by the water pH and is less dependent on the temperature [33]. In an acidic environment, when the pH level is under 7, almost all of the ammonia is in the form of ammonium (NH4+). When the pH level rises above 7.5, the level of NH3 starts increasing, and that of NH4+ starts decreasing. At pH values around 9–9.5, both forms are present in equal amounts. At pH levels above 11, almost all of the ammonia is in the toxic form of NH3. [33].
For aquaponics purposes, it is necessary to know the concentration of the toxic form of ammonia, NH3. However, measuring it directly in water is impossible with the existing test kits or electronic sensors, which measure the total amount of ammonia, or TAN. Some electrical sensors can only measure the NH4+ concentration separately. The easiest way to determine the level of NH3 is by using tables obtained empirically [33,34,35,36] or derive it from the value of TAN or NH4+ according to formulas derived empirically [34,37].
Ammonia (NH3) formation takes place when fish process their food, which consists mainly of protein. In this process, about 25% [38,39,40] to 30% [6] of the food is absorbed by the fish for their growth; about 35% is released from them in the form of urine or through the gills as ammonia; and about 40% is released as solid waste, which is again converted into ammonia by the bacteria present in the water [41]. Ammonia in both forms is absorbed by nitrifying bacteria, which convert it into nitrite (NO2−) and then into nitrate (NO3−). These substances are toxic to fish and must not exceed certain concentrations. In general, the levels of ammonia (NH3) and nitrites (NO2−) should not be higher than 1 mg/L, while the levels of nitrates (N03−) should not exceed 300 mg/L [42]. For each concrete fish species, there exist permissible values that must be respected [43], the goal being to maintain the concentration of NH3 and NO2− below 0.1 mg/L. Prolonged exposure to higher concentrations of these substances, even below the permissible norms, can lead to stress and diseases of the fish [6,21]. From another point of view, these substances are the essential nutrients for plants; they can also absorb ammonia and nitrites, with nitrates being absorbed most easily [44]. Therefore, it is necessary to have a stable colony of nitrifying bacteria to reduce the amount of ammonia and nitrites to almost zero values.

4.8. Electrical Conductivity (EC) and Total Dissolved Solids (TDSs)

Salinity is an indicator of the concentration of salts in water. It presents the amount of sodium chloride (NaCl) and some plant nutrients that are actually salts. A high salinity can negatively affect vegetable production, especially if it is of sodium chloride origin, as sodium is toxic to plants [6]. Water salinity can be measured with an electrical conductivity (EC) meter; the measurement unit is (μS/cm). Information about the salinity of the water with which the aquaponic system is supplemented can also be obtained from local government reports on water quality. Salinity can also be measured with a TDS meter, with a measurement unit of ppm or mg/L. It is recommended that low salinity water sources be used, where the EC is less than 1500 μS/cm, or the TDS concentration is less than 800 ppm [6]. Although EC and TDS meters are commonly used to measure the total amount of nutrient salts in the water, these meters do not provide a precise reading of the nitrate levels, which can be better monitored in another way [6]. Measuring electrical conductivity does not guarantee the presence of individual nutrients, but it is a simple, commonly used method of providing total soluble salts in a nutrient solution [45].

4.9. Mechanical Filtration

Mechanical filtration is particularly important for deep-water culture aquaponic systems. It separates and removes solid and suspended fish waste from aquariums, which is very important for fish health [6]. In addition, the wastes can clog the systems and disrupt the water flow. There are many types of mechanical filters, including sedimentation tanks, sand or bead filters, radial-flow clarifiers, and baffle filters. Mechanical separators (clarifiers) are the most commonly used filters. They use the properties of water to separate particles [6].

4.10. Bacterial Development and Biofiltration

Nitrification is probably the most important process in an aquaponic system. Nitrifying bacteria can be basically divided into two groups; the first one comprises ammonia-oxidizing bacteria (AOB) and the second, nitrite-oxidizing bacteria (NOB). The AOB oxidize ammonia to NO2−; as a secondary product, positive hydrogen ions H+ are released, which can decrease the pH. The NOB oxidize nitrites (NO2−) to nitrates (NO3−) [6,46]. A sufficiently large area is needed where the nitrifying bacteria can establish a stable colony, be able to transform the ammonia released by the fish into nitrates, and establish a balance in the system where ammonia and nitrites are in minimal amounts. The balance is disturbed if these start rising. One reason could be that the biofilter is too small for the number of fish in the aquaponic system. To overcome the imbalance, the size of the biofilter should be increased, the number of fish should be reduced, or the fish feed should be temporarily reduced. Another reason could be a nitrifying bacteria problem caused by the water quality. Then all parameters of the water quality should be checked and adjusted to the necessary limits favorable to the bacteria.
In addition to nitrifying bacteria, heterotrophic bacteria also play an important role in aquaponic systems. They use organic carbon as a food source and participate in the decomposition of solid fish and plant waste. As mentioned above, part of the processed fish food is released as an organic mixture containing proteins, carbohydrates, fats, vitamins, and minerals. Plants cannot absorb these micronutrients when they are in a solid form. Heterotrophic bacteria metabolize these wastes through a process called mineralization, the result of which are the basic microelements necessary for plant growth becoming available [6,47]. Heterotrophic bacteria require the same conditions as nitrifying bacteria. They can be found anywhere in the aquaponic system but are mostly concentrated in areas with solid waste accumulation.
In addition to beneficial bacteria, poor water quality can contribute to the development of bacteria that are harmful to the system.
The first ones belong to the group of sulfate-reducing bacteria, which reproduce at low DO levels (anaerobic conditions) and in the cases of an excessive accumulation of solid waste that cannot be assimilated by the heterotrophic bacteria [6]. In the presence of sulfate-reducing bacteria, a process takes place whereby sulfur (S) is oxidized, and hydrogen sulfide (H2S) is produced. At higher concentrations, the smell of spoiled eggs is sensed. However, this can be prevented by maintaining the required DO levels and properly and regularly cleaning the mechanical filter [6].
Other unwanted bacteria form the group of denitrifying bacteria. This type of microorganisms, as the sulfate-reducing bacteria, develop under anaerobic conditions. Denitrifying bacteria convert nitrates into atmospheric nitrogen, thus leading to a lack of nutrients necessary for plants. In certain cases, it can reach a total nitrogen loss of over 50% [48]. Despite their negative effect, in very large systems, when the nitrate level is too high, the development of these bacteria can become necessary to balance the system.
The third unwanted group of bacteria are those that cause diseases. Some of these bacteria can affect fish, and others can affect plants; and there are also those that can cause diseases in humans. Good hygiene must be maintained to protect the system. The bacteria can be transmitted through food or in other pathways [49]. Wild animals, rodents, and birds should be prevented from accessing the tanks. Rainwater collected from the roofs of buildings where bird excrements may be present should not be used without being previously treated with the appropriate preparations. Also, aquaponic water should not come into contact with plant leaves [6].

4.11. Surface Treatment of the Fish Tank

To minimize the contamination of the surface due to microfouling, one of the possible nondestructive approaches is producing a hierarchical micro or nanostructures by employing femtosecond laser processing which alters the polymer-based surface and induces a groove-like texture. This effect changes the surface roughness characteristics and affects the bacteria’s adhesion to the substrate.
In this study, an additional surface treatment using an ultrashort pulse laser is applied to modulate the polymeric (polypropylene) surface roughness via micropatterning. The femtosecond laser pulses can generate the non-linear absorption of photons in the target surface, thus enabling the processing of materials that would otherwise be transparent to the laser wavelength. Ultra-short pulse durations are associated with high peak powers, which boost material removal rates and increase the processed zone quality. In the case of ultrafast lasers, non-thermal processing is the main mechanism of material modification, which is then characterized by the absence of heat-affected zones and side effects due to melting. Due to the direct breaking of molecular and atomic bonds, the process develops without heating, so that clean ablation without recast material takes place. Surface processing using ultrashort pulse lasers is used to generate self-cleaning surfaces—the main goal when creating antifouling surfaces. The laser-induced formation of micro- and nano-scale structures and groove-like patterns will be achieved. The present study uses a laser-based non-contact structuring in view of studying the efficacy and safety of the proposed platforms for the development of pollution-free surfaces.
A recap of the presented water quality parameters that are controlled by the cyber–physical system is presented in Table 4.

5. Algorithms of Cyber Physical System Operation

Table 5 shows the abbreviations used in the block diagrams of the working algorithms of the proposed CPS.

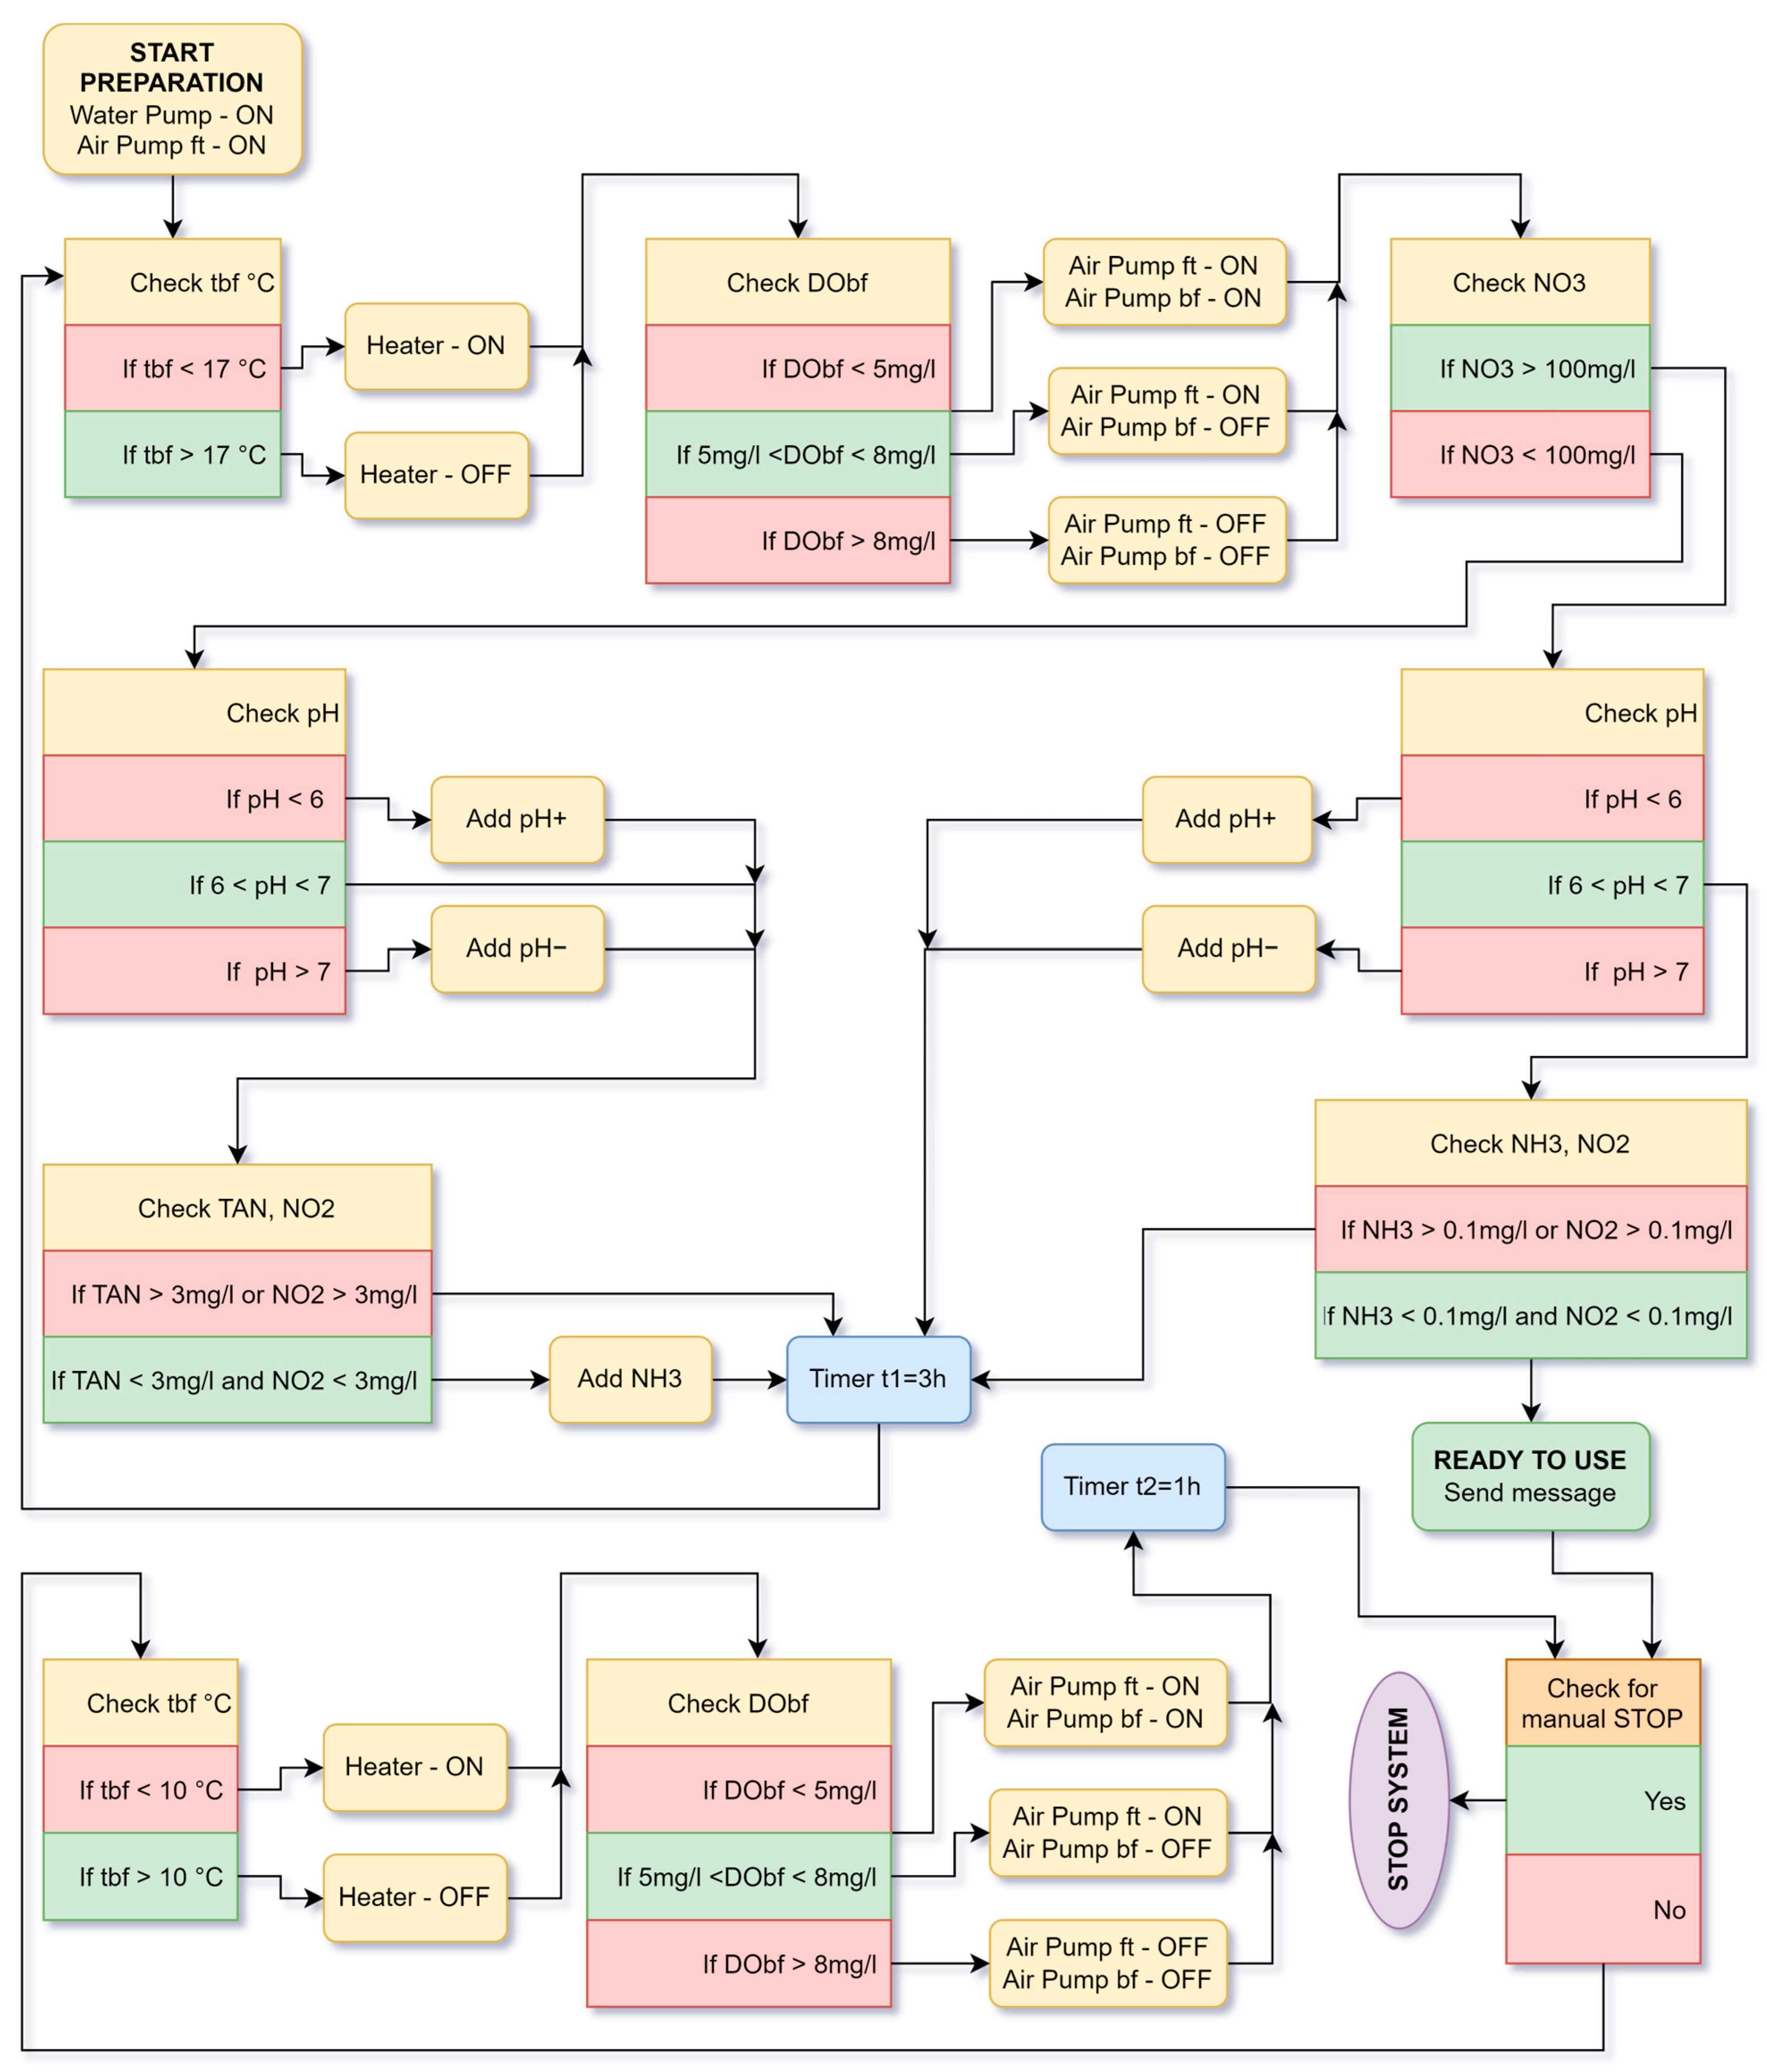
5.1. Bacterial Growth Startup Cycle in Aquaponic System

The preparation of the aquaponic system takes about 3 to 5 weeks or even longer under unfavorable conditions for nitrifying bacteria [6]. This time can be approximated to the lower limit if certain conditions are strictly maintained. Therefore, it is important to maintain specific water parameters. The algorithm of the startup cycle is shown in Figure 3.
The water circulation pump must be permanently switched on. The system first checks the temperature in the biofilter and, if necessary, turns on the heater, which must ensure the minimum favorable temperature of 17 °C for the development of nitrifying bacteria. Its power must be chosen so that it can maintain the required water temperature without a quick rise of its values, which can trigger a negative effect on the fish during normal operation of the system. The dissolved oxygen in the biofilter (DObf) is then checked. With permissible DObf values of 4 to 8 mg/L, the system maintains a minimum value of 5 mg/L. At DObf < 5 mg/L, the system turns on the air pumps in the fish tank and the biofilter. At 5 mg/L < DObf < 8 mg/L, the air pump in the fish tank continues to work as the main pump of the system, and the pump in the biofilter shuts down. At DObf > 8 mg/L, both air pumps are switched off. After that, the level of nitrates is checked, which is one of the indicators of the development of the colony of nitrifying bacteria.
If the concentration of nitrates NO3− is below 100 mg/L, the system first checks the pH and, if necessary, adds substance for its regulation through an auger mechanism. The auger run time is adjusted so that the pH change in the system is slow enough, as mentioned above. After that, the nitrite NO2− concentration and the calculated value of the TAN based on the ammonium NH4+ concentration are checked. Provided that both parameters fulfill the following conditions, TAN < 3 mg/L and NO2− < 3 mg/L, ammonia in a certain form is added. This can be in the form of finely ground fish food or pure ammonia. Thus, the conditions are created for the development of AOB and then NOB. If even one of these parameters exceeds the above norm, then the concentration of ammonia is sufficient for the development of both types of nitrifying bacteria, and it is not necessary to add an additional amount of ammonia. Then, the system waits for 3 h and starts the cycle from the beginning.
If the concentration of nitrates NO3− is above 100 mg/L, this is an indicator of the existence of a developed colony of NOB. Then, the system checks the pH and, if necessary, adjusts it, starts Timer t1, and starts the cycle from the beginning again. If the pH is within acceptable limits, then the system checks the nitrite concentration and the calculated ammonia NH3. If either parameter has a value greater than 0.1 mg/L, the system starts Timer t1 and then starts the cycle from the beginning. If both parameters have a value lower than 0.1 mg/L, it means that the colony of nitrifying bacteria is sufficiently developed, and stocking and planting can be started. The CPS sends a message that it is ready and waiting to be stopped manually.
If this condition is not fulfilled, the system enters a new cycle where it first checks the temperature and, if necessary, controls the heater, keeping the temperature above 10 °C, which is enough to support a developed colony of nitrifying bacteria. The amount of dissolved oxygen in the biofilter is then checked, and the air pumps in the fish tank and biofilter are turned on if necessary. Then, Timer t2 is activated. If no stop has been activated at this time, the system returns to the beginning of the new cycle and checks the temperature again.

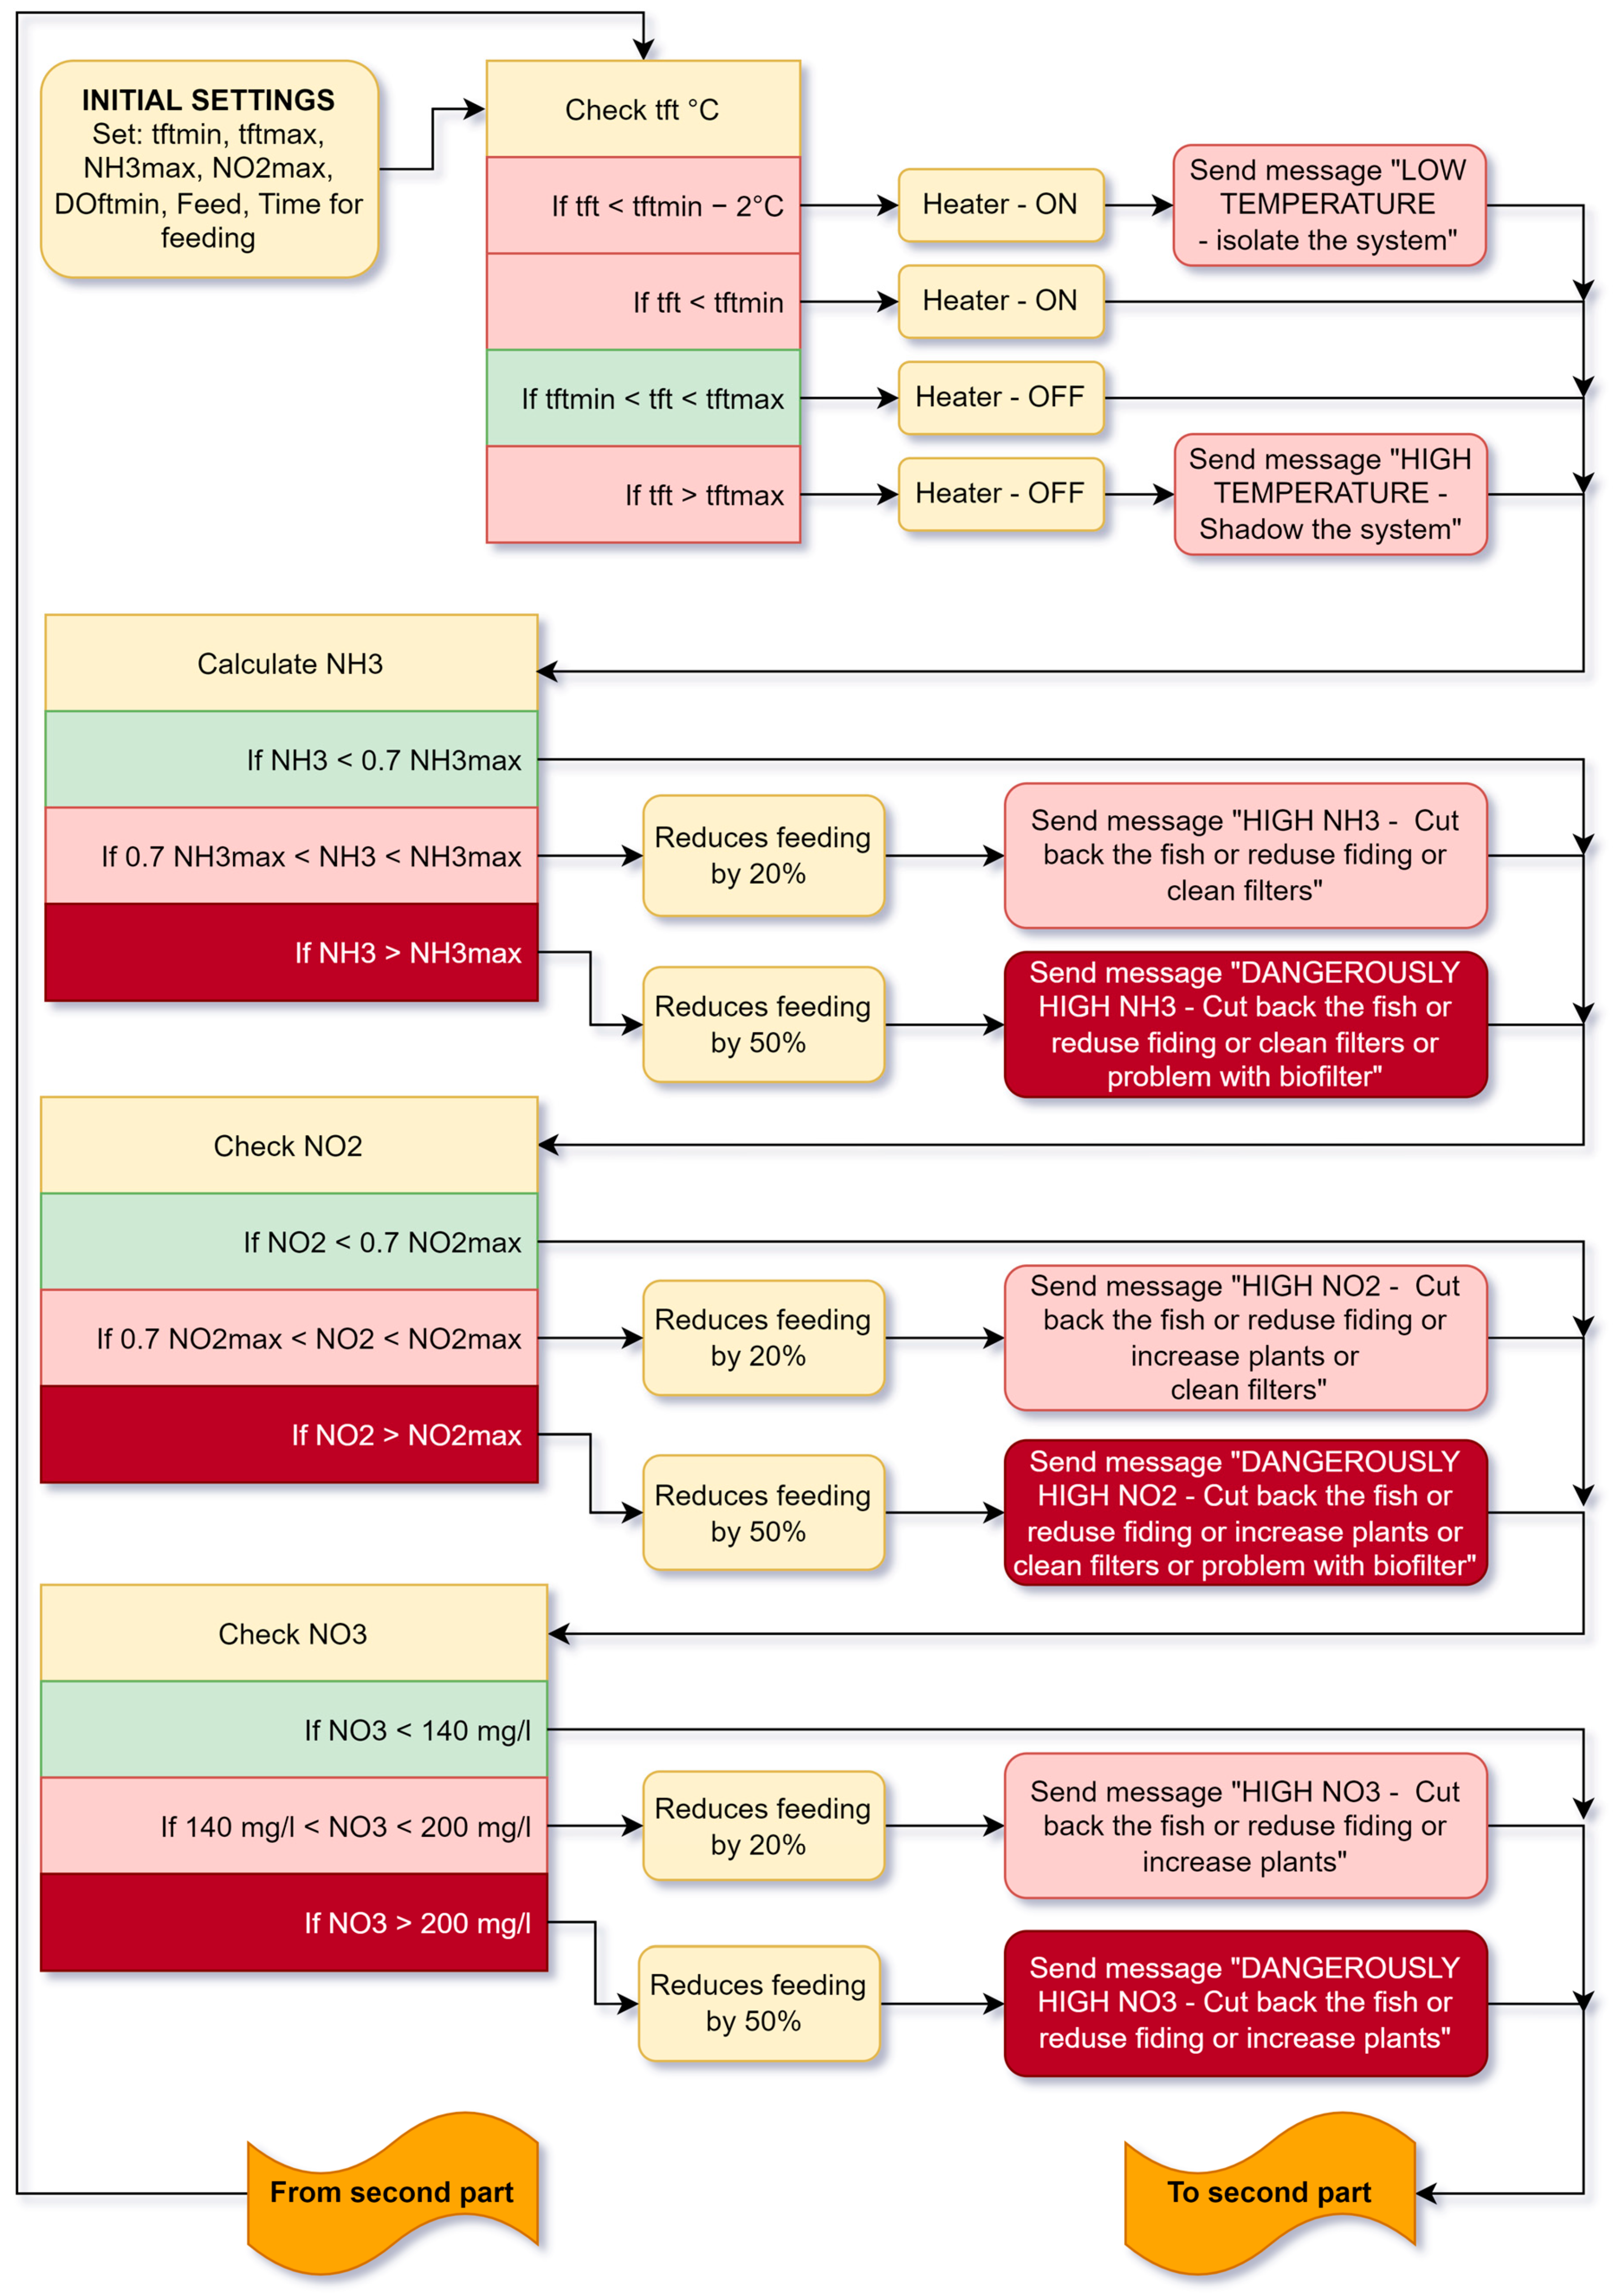
5.2. Working Algorithm of the Aquaponic System

The working algorithm of the aquaponic system is divided into two parts. Its first part is shown in Figure 4. After establishing the set parameters of the water, it is possible to proceed with stocking and planting. Before starting the CPS, it is necessary to enter the initial parameters that it has to maintain. They are specific to different types of fish and plants. Parameters include the minimum and maximum fish tank water temperature (tftmin and tftmax), maximum allowed concentration of ammonia (NH3max) and nitrites (NO2max), minimum concentration of dissolved oxygen in the fish tank (DOftmin), amount of food for one feeding (feed), and number and time for feedings per day (time for feeding). After startup, the CPS first checks the temperature in the fish tank (tft), and if it is dangerously low, more than 2 °C below the tftmin, the system, in addition to turning on the heater, sends a message with the text “Dangerously low temperature °C” to the operator with recommendations for action on their part. If the temperature is above the minimum level, the heater is turned off by default. If it is above the maximum, a message is also sent with recommendations for action by the operator.
The system then calculates the ammonia concentration NH3 from the ammonium NH4+, temperature, and pH values. At a concentration of 70% of the set maximum allowed value, the system records in its memory a reduction of the amount of food by 20% for the next feeding and sends a message to the operator with the value of ammonia and its maximum permissible value, as well as recommendations for performing one or more of the following actions, namely, reduce the number of fish in the tank, reduce the amount of fish food permanently, or inspect and clean the mechanical filter and biofilter if necessary.
When the concentration of ammonia NH3 exceeds the permissible value, the system saves in its memory a reduction of food by 50% for the next feeding and again sends a message with a similar text, in which case there may be a problem with the biofilter, or it may be too small.
The processes of changing the parameters in an aquaponic system are rather inert, and a big change within a few hours is not possible. However, when problems are detected with some of the parameters, the system can partially compensate for them. Thus, it prevents the creation of conditions that can lead to a permanent deterioration of fish health. For this reason, the staff must take action to maintain balance in the aquaponic system.
Afterwards, the system performs checks of the nitrite NO2− concentration, and if the concentration is high, it again performs actions to reduce the food of the fish by 20% or 50% for the next feeding and sends recommendations to the operator. In this case, the reason for the increase in nitrites, in addition to the above, may also be a lack of sufficient plants.
The next action of the system is to check the nitrate NO3− level. Again, at a high concentration, feeding is reduced, in which case the causes cannot arise from problems with the biofilter or nitrifying bacteria. The reasons may be too many fish, not enough plants, or overfeeding the fish, when part of the food remains uneaten.
After detecting dangerous ammonia, nitrites, and nitrates, the system checks the amount of dissolved oxygen in the fish tank first and compares it to the set values for the specific fish species. The air pump in the fish tank should have such a capacity that the DO would not exceed 8 mg/L, even when the fish are few. It works continuously to ensure good water circulation in the fish tank; when more oxygen is needed, the other air pumps are turned on.
The second part of the algorithm is shown in Figure 5. To ensure that the DO level would not fall below the set minimum value, the system aims to maintain it 20% above the set point. If the oxygen level in the fish tank is greater than 1.2 DOftmin, the system checks the dissolved oxygen level in the biofilter (DObf). Nitrifying bacteria require the level to be above 4 mg/L, and the system maintains it to be above 5 mg/L. In this case, if it is above 5 mg/L, the dissolved oxygen in the floating raft (DOfr) is checked. If it is above the set value of 4 mg/L, the system turns off the air pumps in the biofilter and the floating rafts. If it is below 4 mg/L, the air pump in the biofilter is turned off and turned on in the floating rafts.
Otherwise, if DObf < 5 mg/L, we have the following cases: If DOfr > 4 mg/L, the air pump in the biofilter is switched on, and in the floating rafts, it is switched off. If DOfr < 4 mg/L, both pumps are switched on. In the second case, if DOftmin < DOft < 1.2 DOftmin, then the system turns on the air pump in the biofilter. With the continuous circulation of water from the biofilter to the fish tank as the DObf increases, the DOft also increases. Then, the system checks DOfr. If it is lower than the set value, the air pump in the floating rafts is also turned on. If it is above the set value, it is turned off.
In the third case, when for some reason the DOft level drops below the set value, the system first checks the current state of the air pumps in the biofilter and in the floating rafts. If one of them is off, the system turns on both pumps, which is not considered an emergency mode because the DO level in the system can be increased automatically. A situation when both pumps have been turned on and continue running but the system sends a message to the operator with the oxygen level may mean that there is some problem with the system. It could be an air pump failure, a broken air hose, or the presence of a large quantity of algae or phytoplankton that consumes a large amount of oxygen at night.
Finally, the system checks the pH value, which should be maintained between 6 and 7. In the process of nitrification, the pH level decreases, so that in most cases, in normal exploitation, it does not increase above 7. The pH can increase drastically in the cases when a small number of fish is present in the tank or from the high evaporation rate of water in summer (more specifically, when water with a very high pH and high hardness is added frequently). For pH levels lower or higher than set, the system adds a compound to increase or decrease the pH values, respectively, with this adjustment being considered as a temporary solution. The frequent addition of a compound to maintain the pH can deteriorate the water quality. Therefore, in these cases, the system sends a message to the operator to take action for the problem’s long-term solution. If a low pH level is frequently detected, it is recommended to add water from another water source with a higher hardness and a higher pH. In such conditions, limestone can also be added to the system, or the number of fish can be reduced. When the pH value is constantly high, in areas with high water hardness, it is recommended to increase the stocking density of the fish or to add pre-treated rainwater that has very low hardness. After completing the cycle, the system waits for the Timer t2 and returns to the beginning again to check the parameters.

5.3. Feeding Cycle

The feeding cycle is shown in Figure 6. Two to three feedings per day are recommended, with the total amount of food per day tailored to the number of fish, i.e., the total quantity of food per day should be adjusted according to the number of fish present. Usually, a ratio of 1:100 is used, or for every 1 kg of fish, 10 g of feed per day is required [6]. When the set time for feeding the fish is reached, the system first checks the memory for recorded feeding corrections. If only 20% of the corrections are stored in the memory, it reduces the auger run time from the set feeding time by 20%. This is valid only for the next feed. If there are 50% corrections recorded, regardless of whether there are also 20% corrections, the system reduces the auger run time to half of the set time for the next feeding. Every time a fish is removed, new fish are added, or periodically as the fish grows, the amount of feed should be adjusted by the operator. The system then saves the new set auger run time, which remains unchanged until the next manual change. If there is no correction recorded, the system drives the auger for the set time. After the feeding is finished, the system clears the memory of the saved feeding corrections and waits for the next feeding time. Meanwhile, the new feeding corrections are recorded, if any.

5.4. Water Addition Cycle

The system monitors the water level in the fish tank and in the biofilter. The water circulation pump is located in the biofilter and pumps about 80% of the water to the fish tank and 20% to the floating rafts. Water from the fish tank flows by gravity into the mechanical filter, which in turn overflows into the biofilter. In the same way, the water from the floating rafts also overflows into the biofilter. The system loses water through evaporation or plant growth, so the level must be measured in the biofilter from where it is pumped. When a low level is detected, the system opens the electric solenoid water valve to fill with water until the set upper level is reached. The level sensor in the fish tank serves to report an emergency if there is damage to the tank that can cause the death of the fish in a very short time. Finally, the system sends a message to the operator when a problem is detected.

6. Test and Result

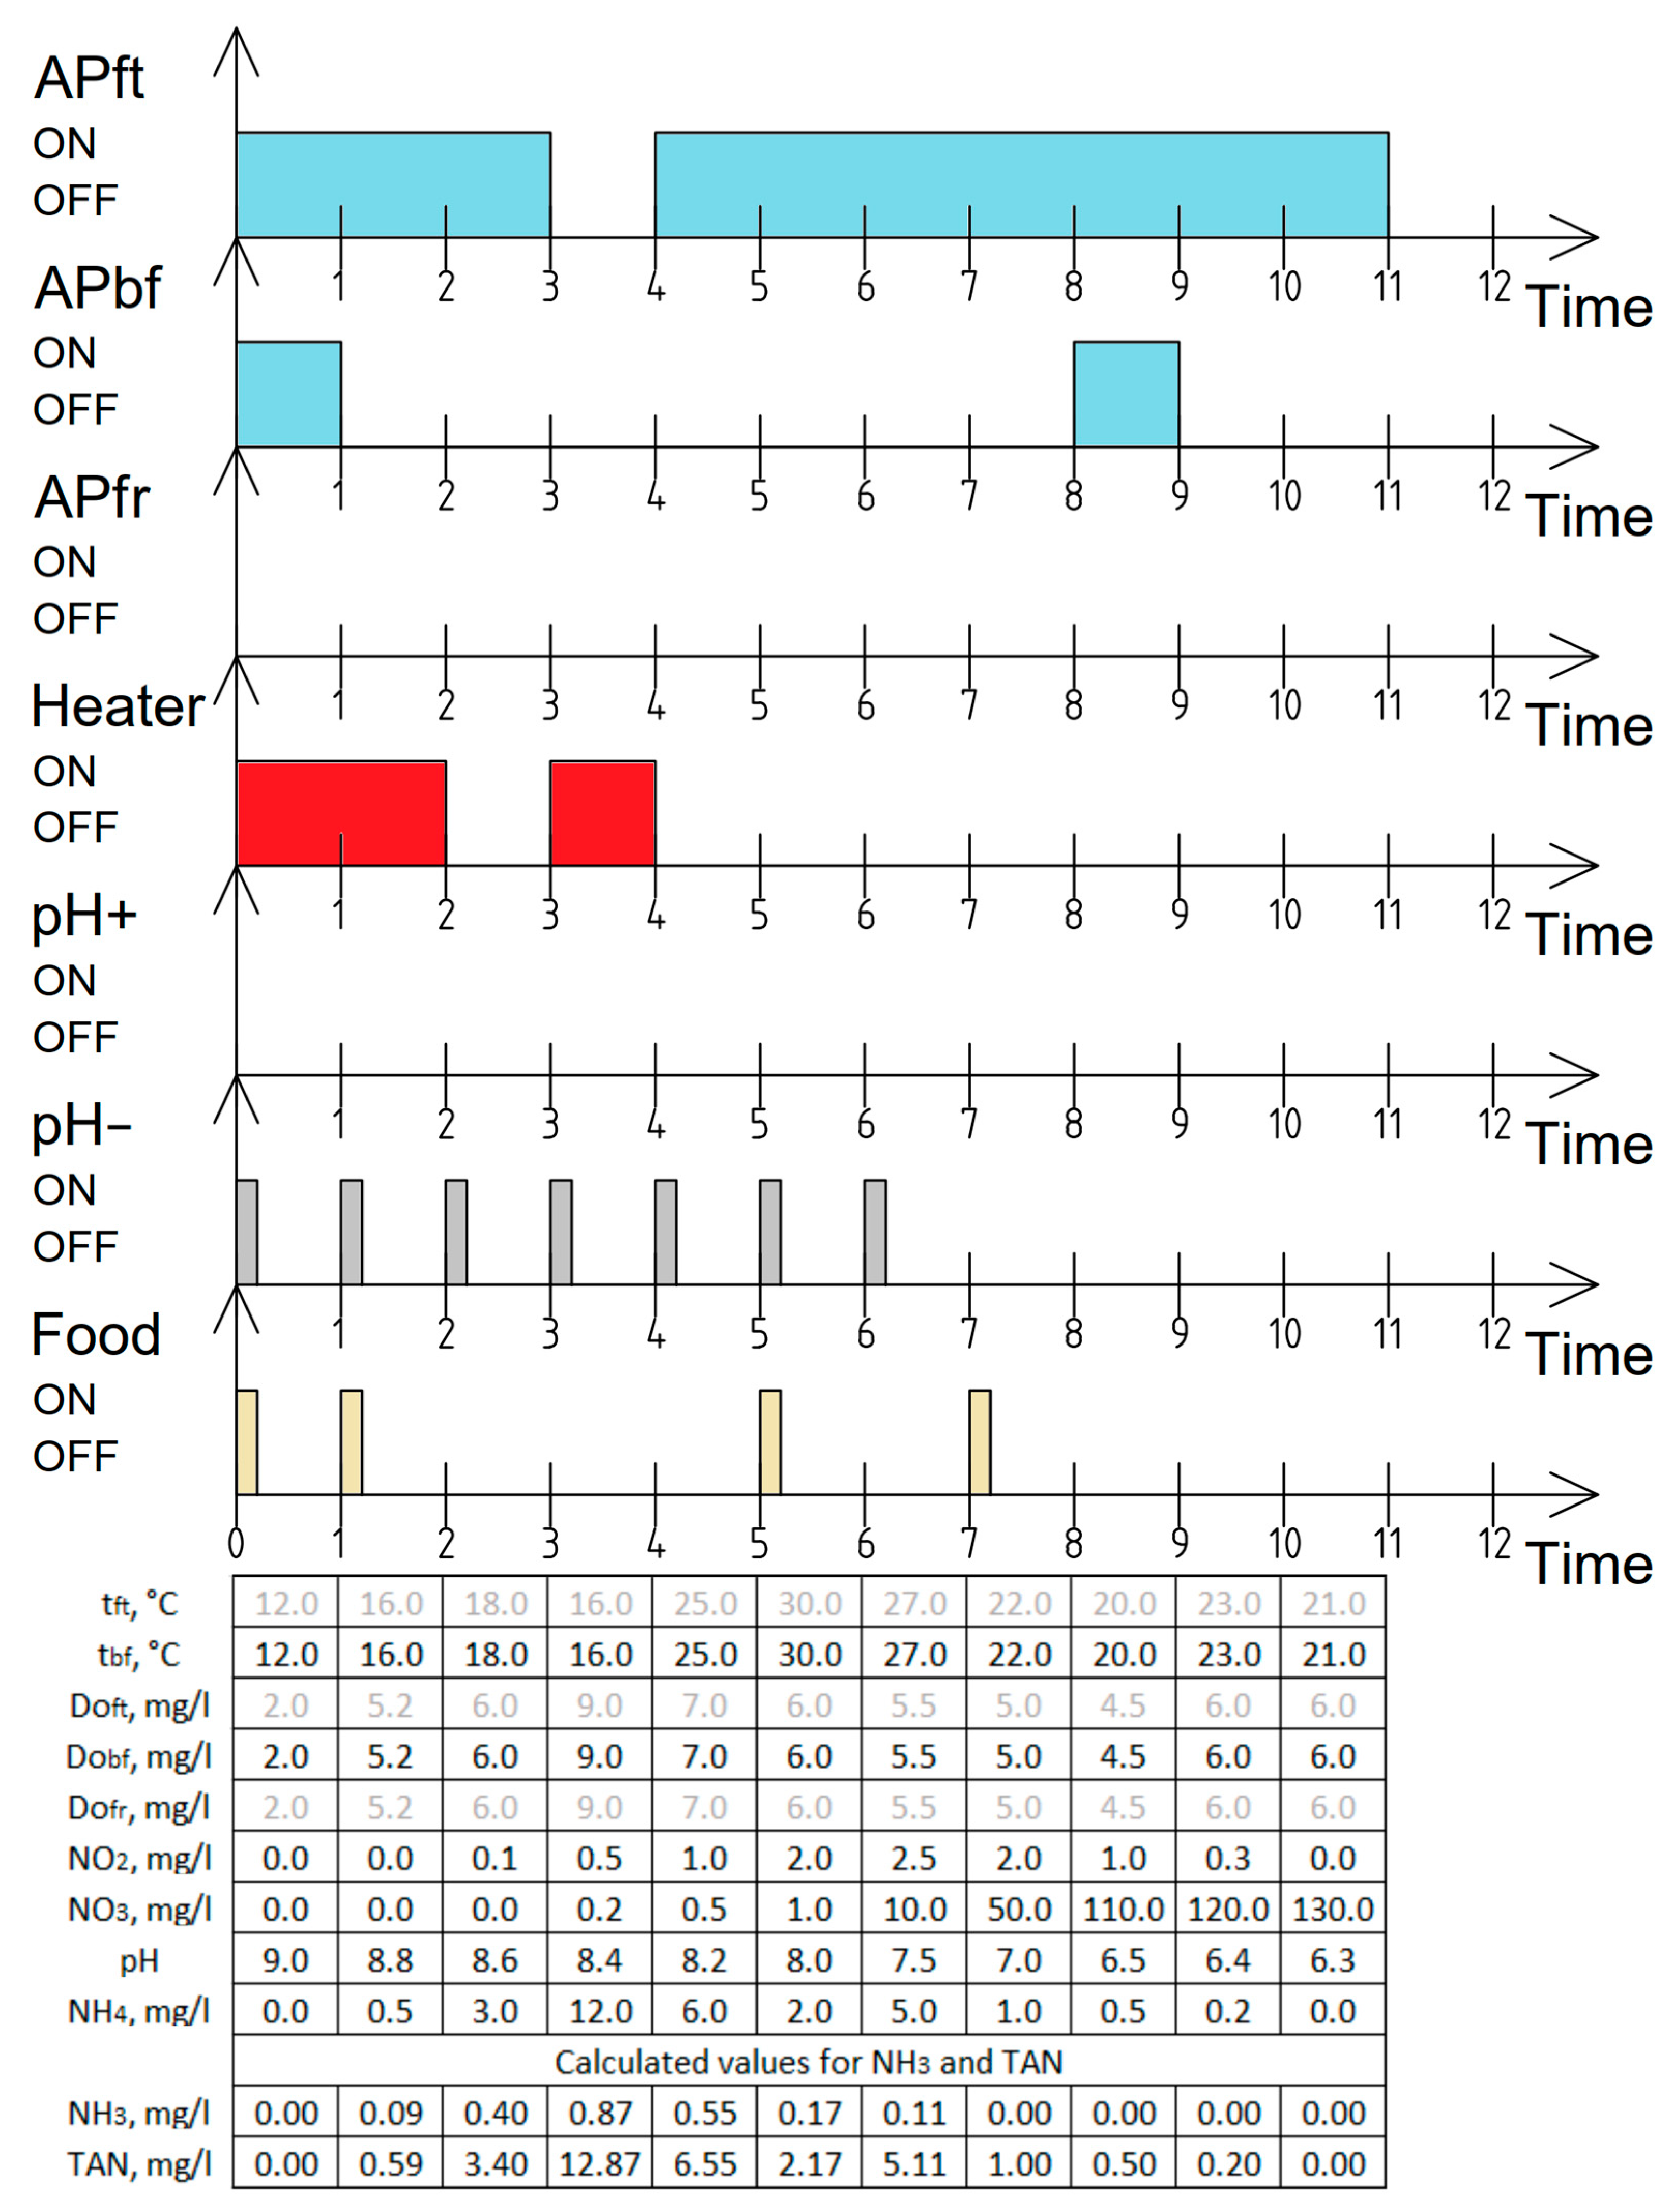
6.1. Test of Cyber–Physical System Work

To perform the system tests, an experimental set up has been implemented with a Raspberry Pi 4 8 GB server and the OpenHAB 3.0 operating system. Software has been developed to control an aquaponic system according to the above algorithms. Testing the CPS in a real aquaponic system would take many months, with tests having to be performed in locations with varying water hardness. Therefore, tests were made for the operation of the system under laboratory conditions. For this purpose, the software and hardware were tested by transmitting synthesized data via MQTT Broker instead of using signals from the relevant sensors. The system performance was analyzed with data that would be measured in a real-world situation, including acquired synthesized data for temperature deviation in the fish tank and biofilter, rate of dissolved oxygen in the fish tank, biofilter, and floating raft, as well as nitrite, nitrate, pH, and ammonium NH4+ levels in the fish tank. The received data for ammonium NH4+ are converted to ammonia NH3 and total ammonia nitrogen TAN by calculation. The actuators were replaced with signal lamps, counting the operating time of each one. The correctness of the messages sent to the operator was also checked. When data were submitted via the MQTT Broker, they were written to memory and became available for reading by the system. When submitting new data via the MQTT Broker, the old values were replaced by the new ones, so if a new value was not received for a parameter, it retained the old value and remained available for reading again. This was done because the time to read accurate values for some of the monitored parameters in the water can reach several minutes or even more than 10 min. But this does not represent complications, since the aquaponic system is quite inert.
In Figure 7, the system’s operation in the startup cycle can be seen. During a certain interval of time, data are transmitted to the system, and remain stored in memory until the next transmission. The system is set to tbfmin = 17 °C, 5 mg/L < DObf < 8 mg/L, 6 < pH < 7, TAN and NO2− greater than 3 mg/L until NO3− reaches values greater than 100 mg/L, and then they should be reduced to values less than or equal to 0.1 mg/L, for which the readiness of the system should be considered. In the startup cycle, the system does not read the data shown in a lighter color in the table underneath Figure 7. Upon reading the recorded data in the first column, the system turns on the heater and air pumps in the fish tank and biofilter, activates the feed auger (ammonia), and the pH reducer auger according to the set parameters. Calculated values for TAN and NH3 can also be checked. By tracking the following parameter values, it was found that the system was working correctly according to the set data. After reading the values in the last column, an email message was sent to the operator stating that the startup cycle was complete.
In Figure 8, the working cycle of the system can also be traced with the following initial conditions set: tftmin = 12 °C, tftmax = 18 °C, NH3max = 0.4 mg/L, NO2max = 0.4 mg/L, DOftmin = 4 mg/L, auger run time pH −/+ =12 min, feed = 18 min, feeding time 12:30 and 19:00 o’clock. The auger’s run time is set to be much longer than the actual ones, so that the system performance can be more easily monitored during the tests. The test was started at 10:00 a.m., with a cycle time of 1 h. The system correctly controls the air pumps in the biofilter and floating raft, the heater, and the pH augers. At 12:30, the feeding auger was activated at the set time. At 1:00 p.m., when a low pH was detected, in addition to auger actuation, a message with the pH value was sent. On the next cycle, when a high temperature was detected, the system also sent a message with the value. At 3:00 p.m., a message was sent about high NO2− above 70 percent of the permissible value with advice to reduce it.
In addition, a correction was recorded to reduce the feed auger time by 20%. At 17:00 o’clock, pH and an NH3 levels greater than acceptable were read out, and a message with their values was sent with advice on how to adjust them. In addition, a 50% feed correction was recorded. As can be seen from the graph, the time of the next feed was cut in half. The system also reacted to both the high NO3− values and the low temperature in the last test cycle.

6.2. Surface Treatment

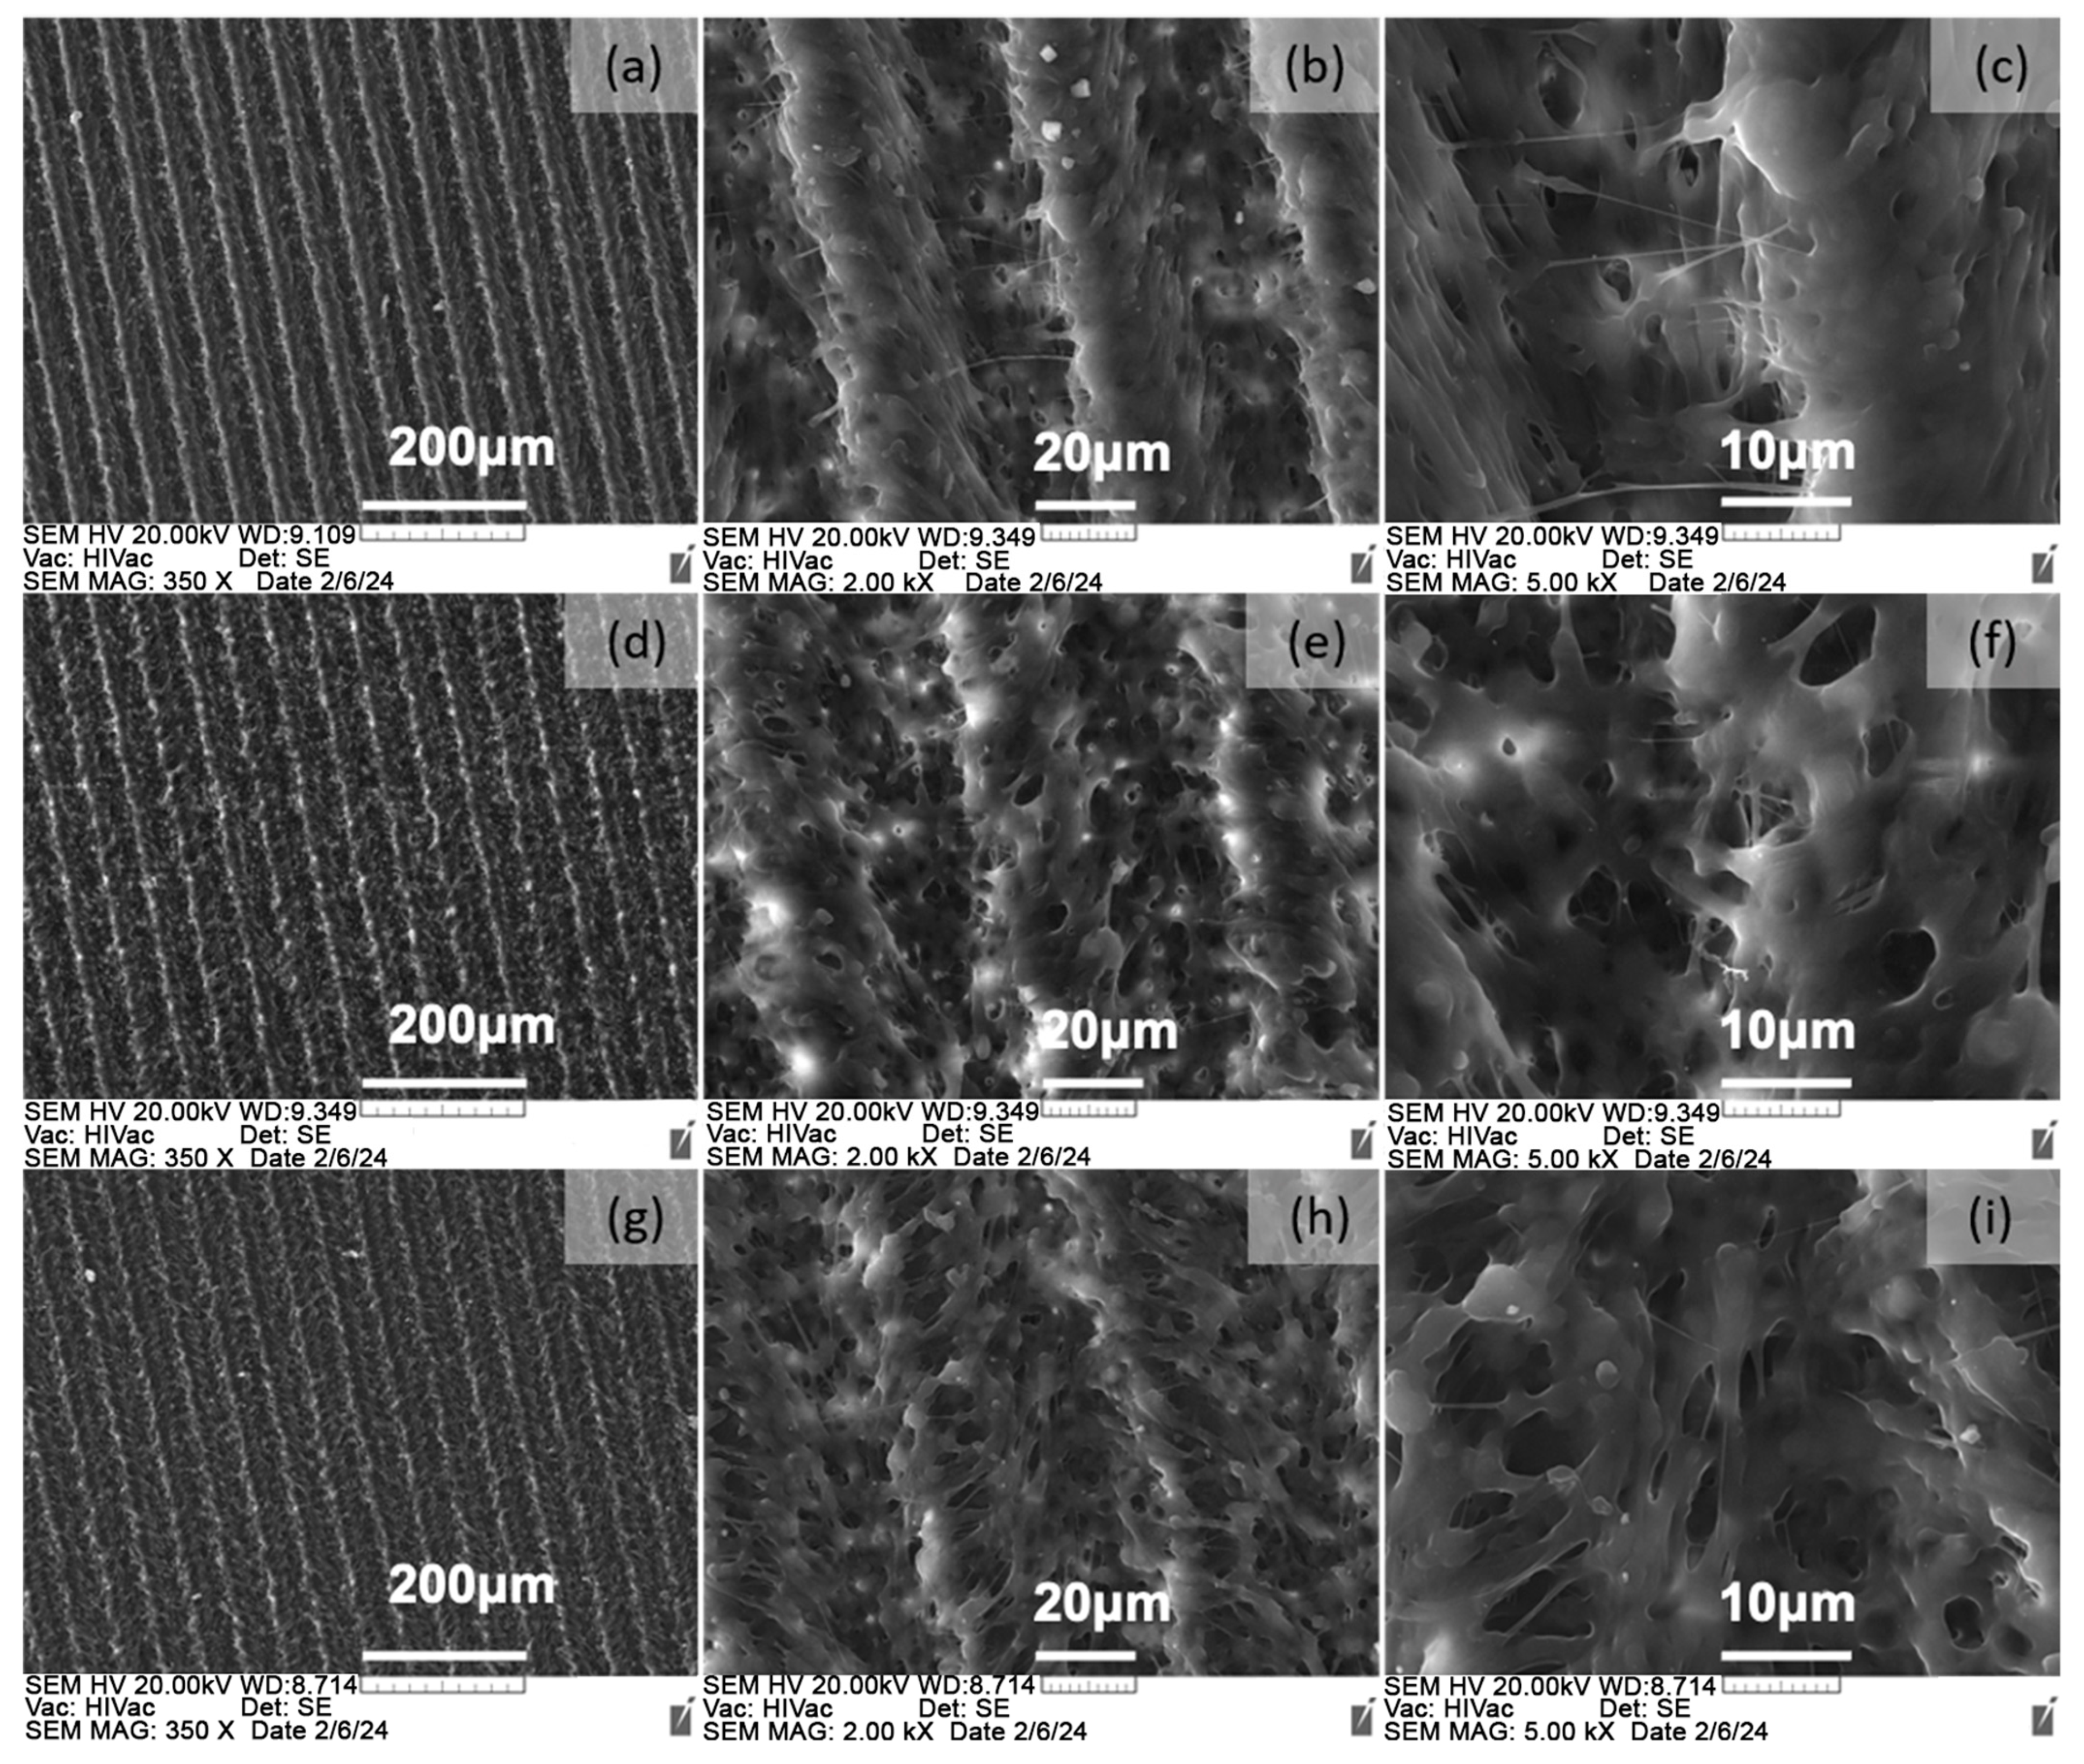
6.2.1. Surface Morphology Analysis

SEM images showing the morphological features of the laser-processed surfaces are presented in Figure 9 below.
The surface topography is greatly affected by the laser illumination applied. Figure 9 shows that the laser scanning velocity affects the depth of the produced micro-channels. As seen, decreasing the scanning speed value to 5.16 mm/s leads to the depth of the created micro stripes (Figure 9a–c) becoming more distinct, with the formation of interconnected fibers developed due to material ablation and redistribution. Furthermore, increasing the scanning speed from 7.6 mm/s to 32 mm/s produces changes in the pattern morphology—the channel depth decreases. A smooth transition is seen from clearly expressed geometries forming micro-channel-like structures with defined depths to rows with less pronounced sharpness and depth. It is evident that the laser scanning speed greatly affects the rate of pulse overlap during laser processing. Lower values of scanning velocities correspond to a high degree of pulse overlap, which in turn, leads to the formation of the deeper etching of the material and the development of surrounding high peaks. The number of applied laser pulses (N) accumulated on the irradiated surface area can be defined by Equation (1).
N = (πDν)/(4Vα),
where D is the diameter of the ablated spot, ν is the pulse repetition rate, and V is the scanning speed of the translation stage.
The overlap ratio of separate laser-ablated spots is defined by Equation (2):
η = 1 − V/(νD),
The above formulas express the dependence of the number of applied laser pulses N on D and V and ν. These parameters are of primary importance when choosing a given type of texturing. Thus, in our specific case, the lower scanning speed values led to a pattern where the higher number of laser pulses impinging on the surface area created conditions for increasing the material removal and ablation, which is confirmed by the increase in the depth of the created rows—Figure 10a, and the obtained Sa = 5.2 µm.
Polypropylene (PP) possesses a simple basic chemical structure—a repetition of CH2 units. EDX spectra of control (non-ablated) and laser-processed polypropylene were acquired from the inside of the ablated zone. The analysis revealed the detection of hydrogen atoms from the hydrocarbon chain of the polypropylene. Moreover, the detailed elemental analysis shows about 90% of carbon and approximately 10% of oxygen, this being valid for both control and laser-ablated polypropylene.
The laser patterning introduced did not alter the surface chemistry of the polymer as detected from the EDX spectra taken from the control and laser-processed polypropylene sample—Figure 10a,b.
The energy dispersive X-ray analysis (EDX) performed over an area on the control (non-laser-treated) and laser-processed polypropylene surfaces did not detect any difference in the chemical elements’ composition before and after laser-texturing. The amount of carbon and oxygen components is in the same range when compared to the control sample in Figure 10a,b.

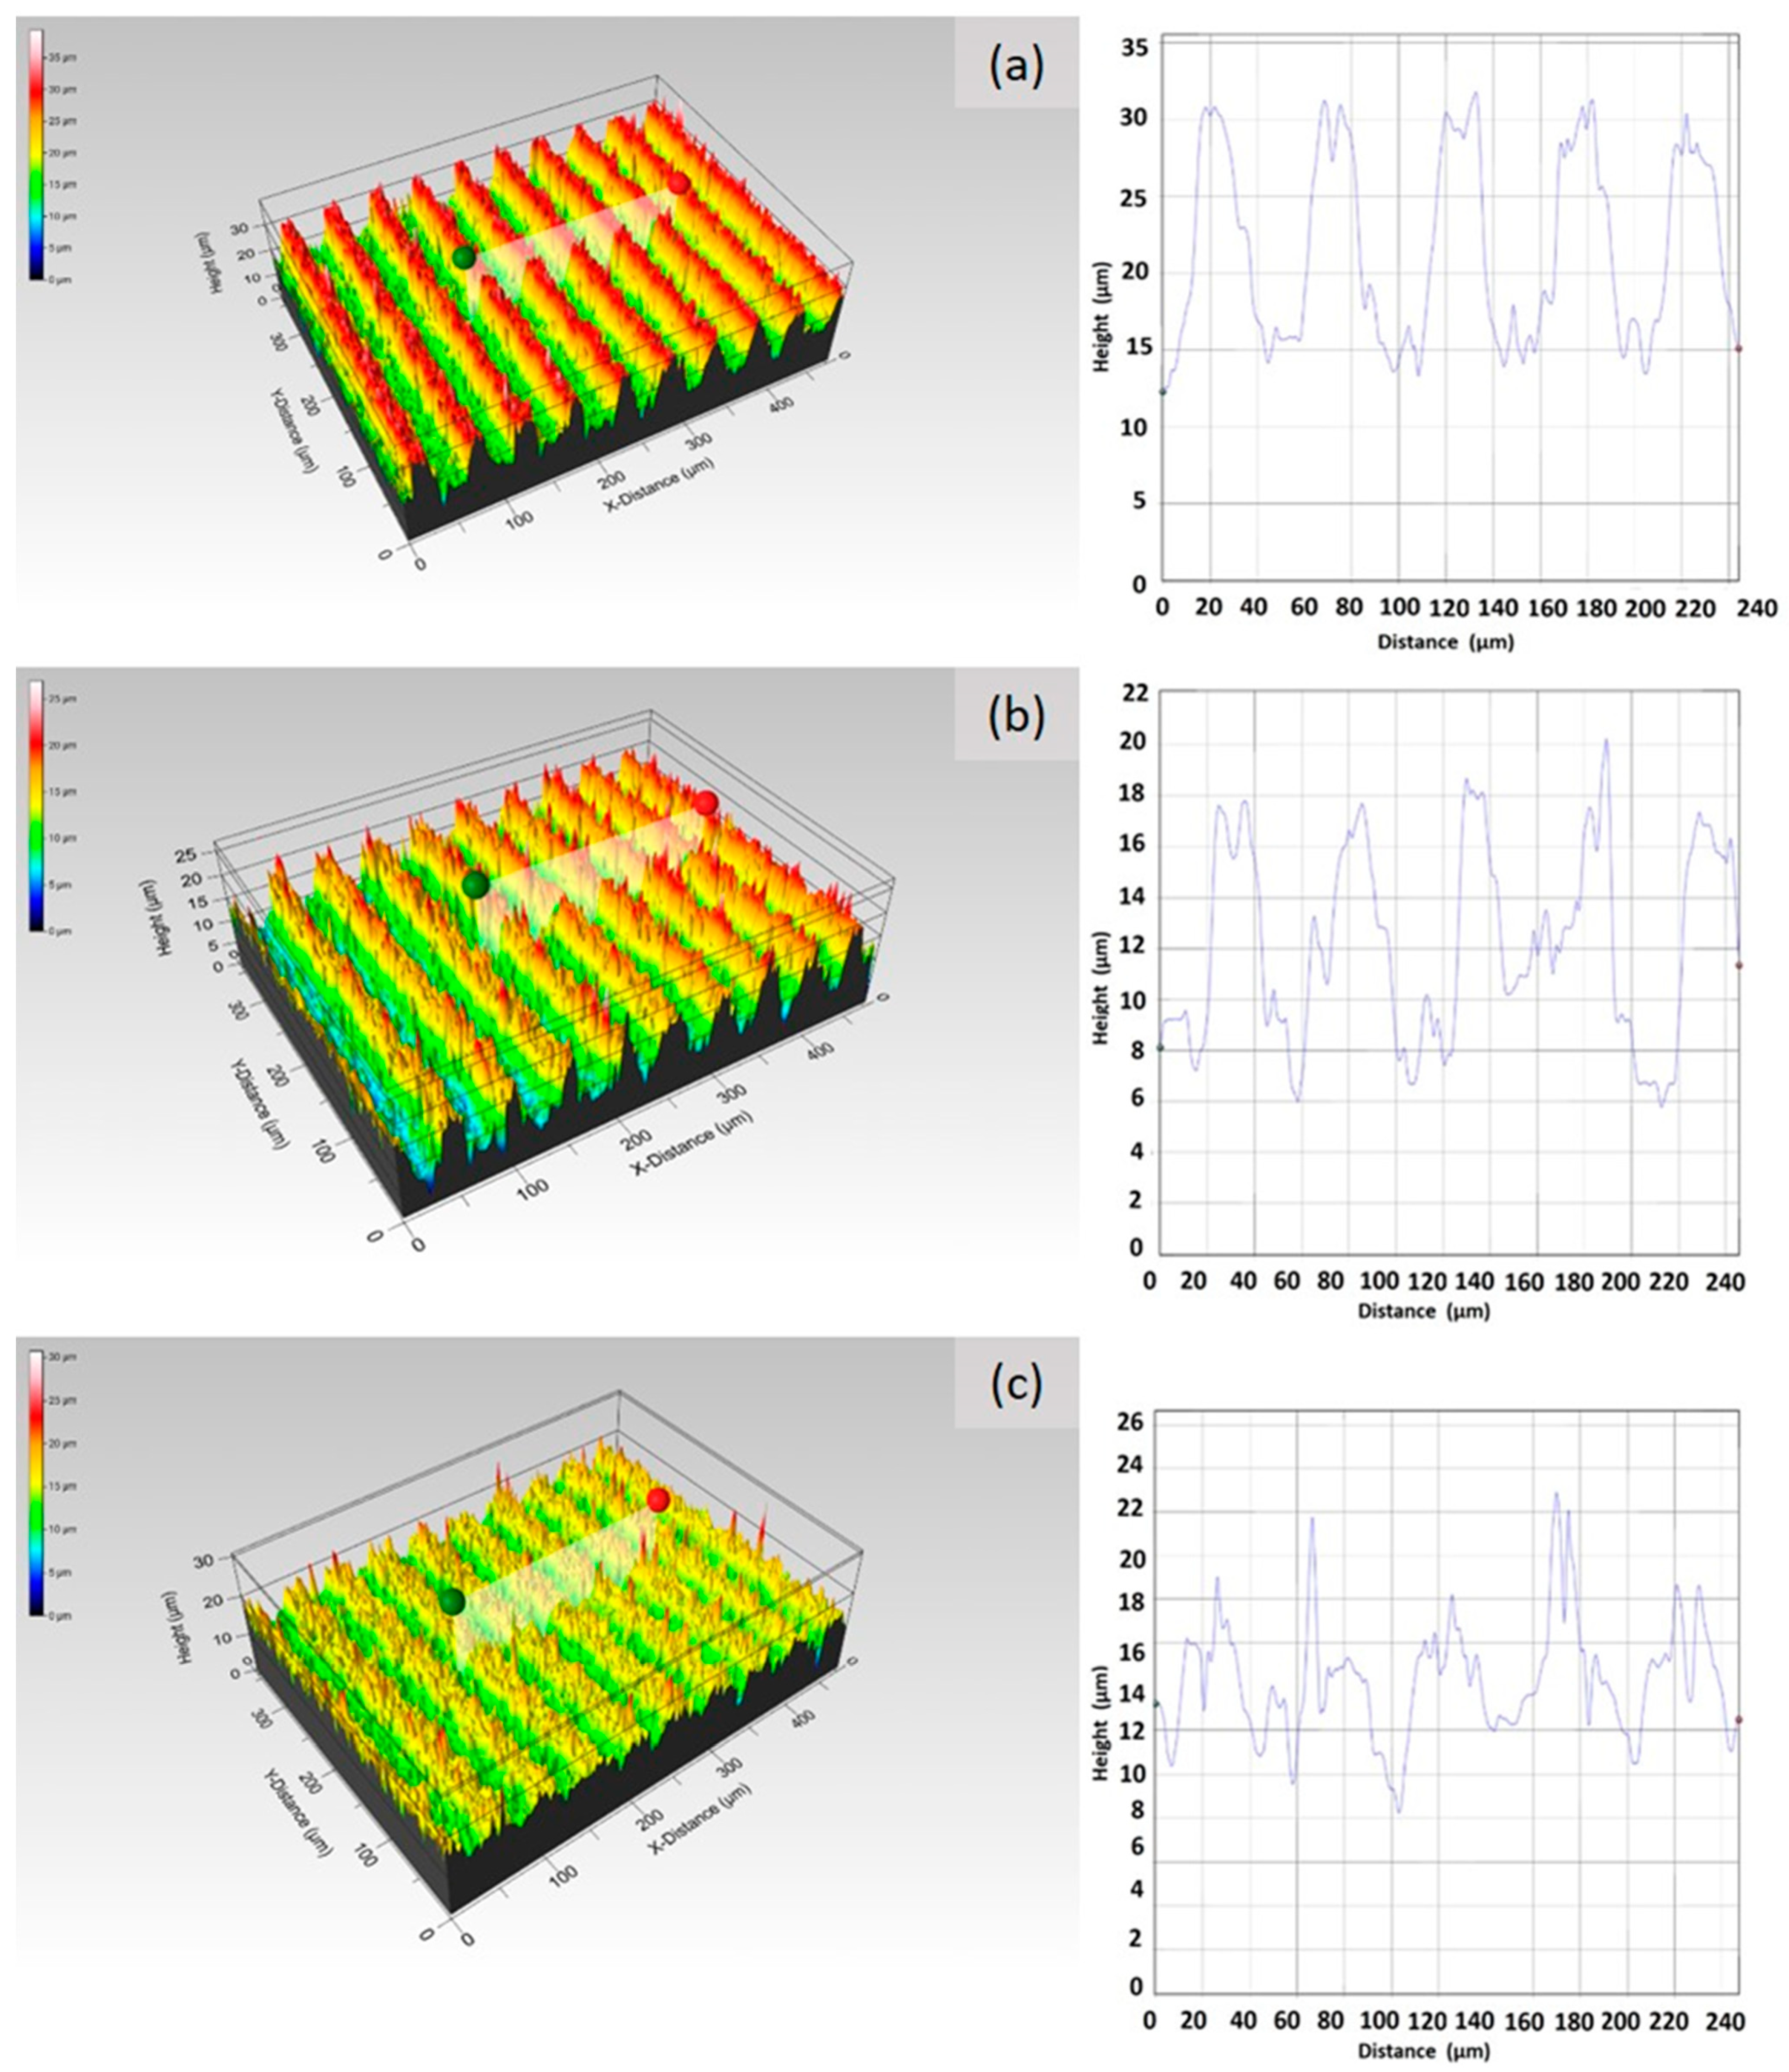
6.2.2. Surface Topography Analysis

The abovementioned changes in the surface morphology directly influence the roughness parameters of the laser-textured surfaces. Moreover, the results obtained from optical profilometry measurements illustrated a correspondence with the observed morphology in the different scanning regimes. A lower scanning speed value results in a higher surface roughness—Figure 11a. Surface roughness changes have been identified as one of the main causes of surface wettability modification that could affect the surface’s biological response.
The non-processed (control) polypropylene surface exhibited a surface roughness (Sa) value of 0.41 µm. The final roughness for the three types of laser processing regimes was found to be correspondingly Sa = 5.2 µm for V = 5.16 mm/s, Sa = 3.4 µm for V = 7.6 mm/s, and Sa = 1.8 µm for V = 32 mm/s, i.e., the lower the Sa value, the smoother the surface of the polypropylene surface. Different studies have shown that bacteria cell walls extend when in contact with patterned surfaces [50,51]. Due to the surface roughness difference between the three processing conditions (Figure 11a–c), the appearance of antimicrobial characteristics could be established with respect to polished surfaces, since the bactericidal efficiency depends strongly on the height and distance between the morphological structures. Laser-texturing should be employed to control bacterial attachment only by geometrical means in a non-destructive manner. Gnilitskyi et al. demonstrated that the surface topography of a metal surface (stainless steel) drastically reduced the formation of two different strains of bacteria [52] only by creating nanotextures.
Lutey et al. [53] found that the response of the bacteria S. aureus to laser-structured stainless steel appears to be more dependent on the average surface roughness; moreover, the results for E. coli demonstrated that the spike-like features, formed with an average surface roughness of 8.6 µm, affected the bacterial cells’ retention. In our case, the maximum achieved roughness without inducing damage to the polypropylene substrate was 5.2 µm, which falls within the roughness limits achieved by Lutey et al. [53].
Another study by Helbig et al. [54] demonstrated that structures in the micron and submicron domains influenced the initial attachment of Staphylococcus epidermidis and Escherichia coli. It was found that the highest number of S. epidermidis was detected on surfaces with periodicities in the range of 1 µm; furthermore, increased periodicities of approximately 5 µm led to a decrease in the number of attached cells. For E. coli, no significant difference in the number of adherent cells was detected for periodicities between 1 µm and 5 µm.

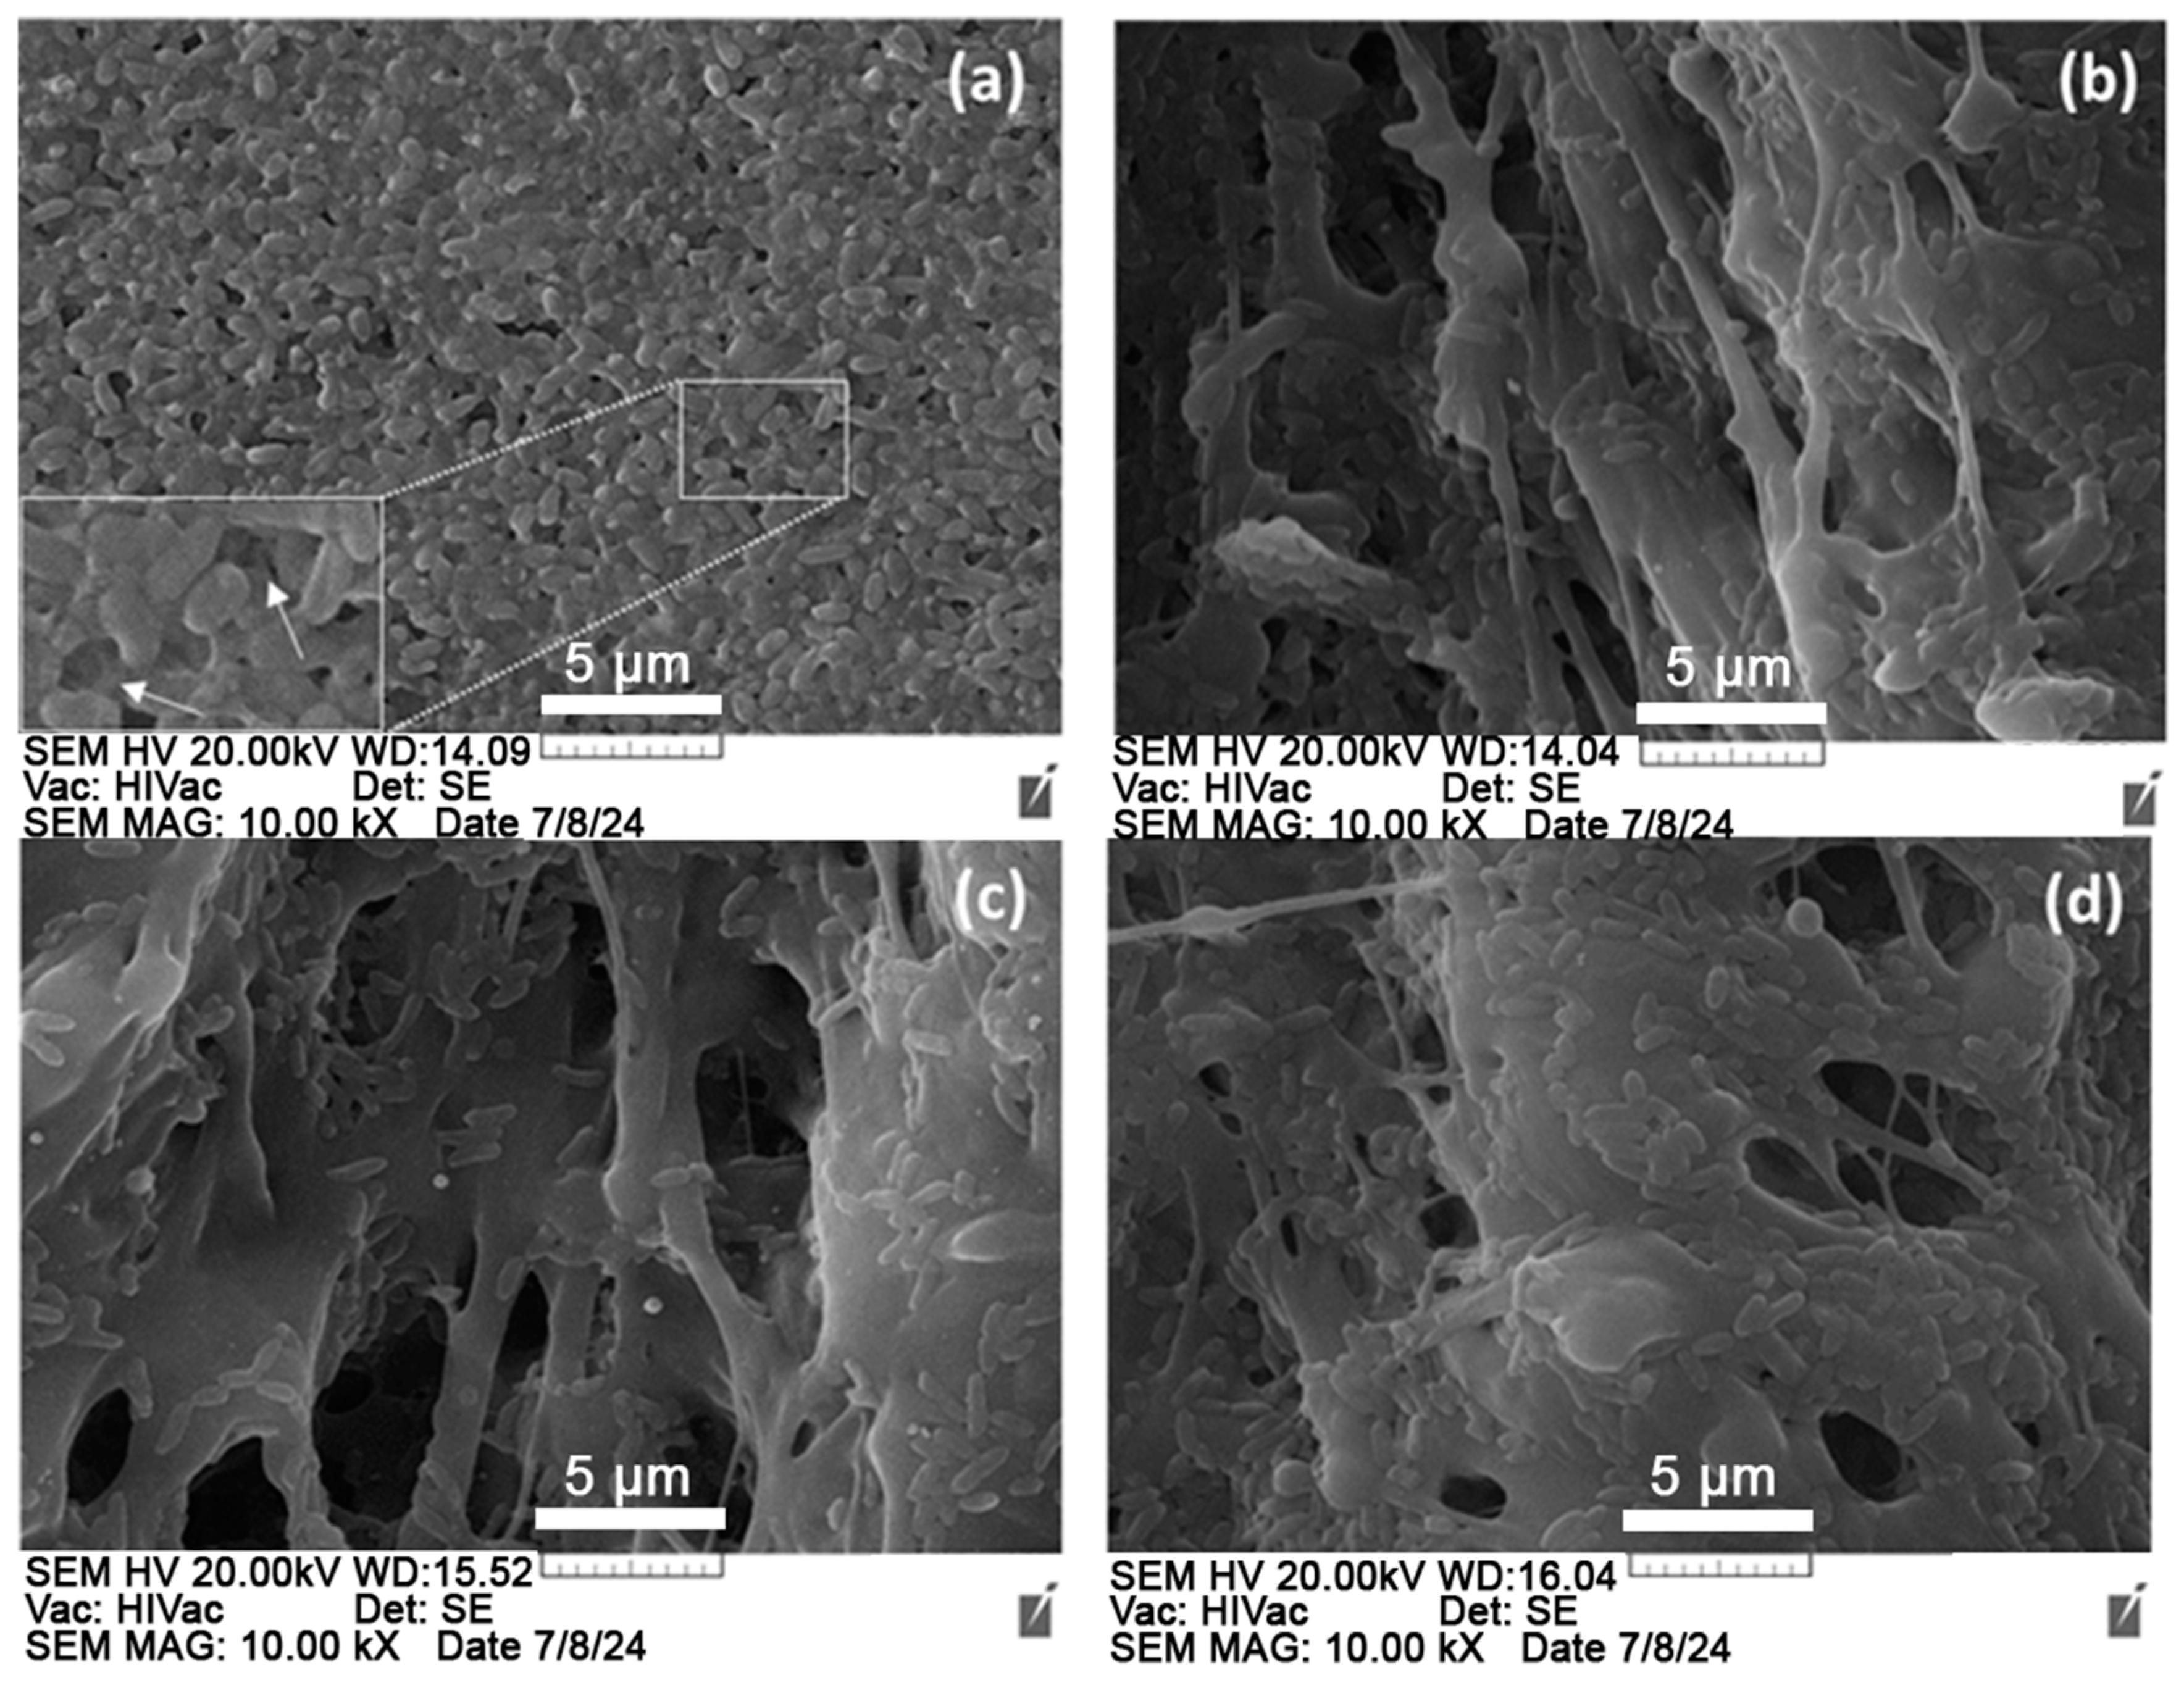
6.2.3. Effects of the Surface Topography on the Biofilm Formation

In our studies, we used P. aeruginosa, which are Gram-negative aerobic bacteria known as opportunistic pathogens spread in soil, water pools, plants, animals, and humans. Its biofilm-forming capacity is often associated with infections on implantable and non-implantable medical devices, surfaces in hospitals and food industry equipment, water pipelines, and foods [55,56,57]. Biofilm formation is one of the adaptive mechanisms of P. aeruginosa which determines its high resistance to different antibiotics and determines it as a pathogen with high priority according to the World Health Organization [58,59]. Based on the morphological micrographs presented, a detailed analysis of the three-dimensional structure of the biofilm community was conducted concerning the presence or absence of cellular malformations and the possible anti-adhesive effect of the underlying substrate. The surface topography of the formed biofilms of P. aeruginosa ATCC 27853 was observed using scanning electron microscopy (SEM) after appropriate processing of the biological samples. In the control samples cultivated on non-laser-treated surfaces, a biofilm covering a significant portion of the substrate was observed within 24 h. The biofilm morphotype was characterized by numerous tightly adhered cells forming biofilm structures without visible morphological deformations. Multilayering was also noticed in the biofilm consortium, with underlying layers of bacterial cells (Figure 12a—zoom image, white arrows). The architecture, mechanical properties, and dynamics of the formed biofilm are crucial for the physiology of the cells within it, as well as for the access to nutrients [60]. Moreover, biofilm-synthesized extracellular polymeric substances influence the resistance of pathogenic bacteria to the host’s adaptive and innate immune systems [57].
After cultivation on laser-textured surfaces, a significant reduction in the number of microbial cells and the amount of biofilm formed was seen (Figure 12b–d). Observations at the 24th hour on all three treated surfaces showed a noticeable reduction in the adhesiveness of the bacterial cells, the presence of looseness, and the inability to form multi-layered biofilm structures. The modifications in the surface topography of the underlying polypropylene surface applied in the present study were probably largely responsible for the anti-adhesive and possible exfoliation effects of the laser-textured surfaces. Similar SEM research revealed changes in the bacterial adhesion of Staphylococcus aureus, which, according to researchers, depended significantly on the structure of the substrate [61]. Our previous research on laser-treated ceramic tablets showed detailed morphological changes in cells of E. coli ATCC 25922. Moreover, these results revealed antibacterial activity and morphological changes related to cell wall deformations, including unipolar indentations, folds, and furrows. These data were supported by bacterial survival determination using a classical agar inoculation method [62].
Similar scientific data provide rich information on the distribution of bacterial cells in the biofilm depending on the underlying substrate, biofilm biomass, and its structural–functional characteristics. Such studies are beneficial for the timely monitoring of developing biofilms, which in turn may have an inhibitory effect on the physiology of various ecosystems or for tracking biofilm virulence when it comes to pathogenic biofilms.

6.2.4. Effects on Bacterial Viability

The classical agar plating methodology was used to quantitatively determine the bacterial viability within a biofilm after cultivation on laser-treated and non-laser-treated structures. The results obtained after co-cultivation on a laser-treated structure from the individual groups showed a significant reduction in the number of viable cells associated with the biofilm (Figure 13). The percentage of surviving cells at surfaces textured by the laser at V = 7.6 mm/s, V =32 mm/s, and P = 20 mW was reduced in the range between 27 and 24% when compared to the control sample. A significant reduction in bacterial cell count, approximately 6%, was observed for surfaces textured at parameters V = 5.16 mm/s, P = 20 mW (Group 1). Comparatively, the data were also confirmed by the SEM micrographs, where a reduction in adhesiveness and number of cells was clearly visible when compared to the control sample (Figure 12).

7. Conclusions

This article reviewed the parameters responsible for water quality and how they affect an aquaponic system. On this basis, a cyber–physical system has been developed for monitoring a minimum number of parameters, during the control of which it is expected that the parameters that are not monitored (such as hydrogen sulfide H2S, carbon dioxide CO2, and carbonate hardness KH) will remain within ranges of values acceptable for the system. The system has been tested under laboratory conditions by tracking its work under various conditions both in the startup cycle and under normal operating conditions. During the tests performed with data transmitted via MQTT Broker to the CPS, it was found that the system works correctly and sends messages to the operator. It also adjusts the water temperature, the pH, and the dissolved oxygen DO according to the set limits. It controls feeding in a way that automatically reduces harmful substances, such as ammonia NH3, nitrites NO2−, and nitrates NO3−. The system allows all monitored parameters to be changed, thus being suitable for different types of plants and fish.
Compared to other similar monitoring and control systems in aquaponic systems, the proposed system has significantly more autonomy. A large number of the current systems only offer monitoring or remote monitoring; few of the existing systems have the possibility of remotely controlling the executive mechanisms while also sending messages with the values of the parameters that are out of the norm [63]. At the same time, the proposed CPS has the ability to independently manage all executive mechanisms, with staff only performing activities, such as planting and harvesting plants, stocking and removing fish, and adjusting the amount of fish food according to whether fish are added or removed from the tank.
The initial results presented on changes in the surface roughness and topography without surface damage to the polypropylene material by laser processing demonstrated that the morphological structures produced are within the range of dimensions of surfaces with already proven structural characteristics that have a strong effect on the surface bactericidal properties.

Author Contributions

Conceptualization, N.C. and K.D.; methodology, K.D., A.D., T.P.-K., E.F. and S.C.; software, K.D. and S.C.; validation, N.C. and K.D.; formal analysis, N.C. and K.D.; investigation, K.D.; resources, N.C.; data curation, K.D., T.P.-K., E.F. and A.D.; writing—original draft preparation, K.D.; writing—review and editing, K.D. and A.D.; visualization, K.D.; supervision, N.C.; project administration, N.C. and K.D.; funding acquisition, N.C. All authors have read and agreed to the published version of the manuscript.

Funding

Ministry of Education and Science under the National Science Program INTELLIGENT ANIMAL HUSBANDRY, grant agreement N D01-62/18.03.2021.

Informed Consent Statement

Not applicable.

Data Availability Statement

The data presented in this study are available in the article.

Acknowledgments

The research leading to these results has received funding from the Ministry of Education and Science under the National Science Program INTELLIGENT ANIMAL HUSBANDRY, grant agreement N D01-62/18.03.2021, and EU H2020, Grant Agreement AIMed No. 861138.

Conflicts of Interest

The authors declare no conflicts of interest.

References

  1. Total Production of Fishery Products (Million Tonnes of Live Weight, EU, 2000–2021). Available online: https://ec.europa.eu/eurostat/statistics-explained/index.php?title=Aquaculture_statistics (accessed on 1 February 2024).
  2. Isaacson, M.; Allyn, N.; Loverich, G. Development of a net pen system for aquaculture farming. Can. J. Civ. Eng. 2011, 20, 189–200. [Google Scholar] [CrossRef]
  3. van Rijn, J. Waste treatment in recirculating aquaculture systems. Aquac. Eng. 2013, 53, 49–56. [Google Scholar] [CrossRef]
  4. Wahyuningsih, S.; Effendi, H.; Wardiatno, Y. Nitrogen removal of aquaculture wastewater in aquaponic recirculation system. Aquac. Aquar. Conserv. Legis. 2015, 8, 491–499. [Google Scholar]
  5. Li, X.; Li, J.; Wang, Y.; Fu, L.; Fu, Y.; Li, B.; Jiao, B. Aquaculture industry in China: Current state, challenges, and outlook. Rev. Fish. Sci. 2011, 19, 187–200. [Google Scholar] [CrossRef]
  6. Somerville, C.; Cohen, M.; Pantanella, E.; Stankus, A.; Lovatelli, A. Small-Scale Aquaponic Food Production: Integrated Fish and Plant Farming; FAO Fisheries and Aquaculture Technical Paper; FAO: Rome, Italy, 2014. [Google Scholar]
  7. Van Stappen, G.; Salie, K.; Stander, H. Inoculating Fish Sludge from Aquaponics with Microbes to Enhance Mineralisation of Phosphorus; Ghent University: Flanders, Belgium, 2020. [Google Scholar]
  8. Resources, N. Food Production and Water Conservation in a Recirculating Aquaponic System in Saudi Arabia at Different Ratios of Fish Feed to Plants. J. World Aquac. Soc. 2008, 39, 510–520. [Google Scholar]
  9. Graber, A.; Junge, R. Aquaponic Systems: Nutrient recycling from fish wastewater by vegetable production. Desalination 2009, 246, 147–156. [Google Scholar] [CrossRef]
  10. Goddek, S.; Delaide, B.; Mankasingh, U.; Ragnarsdottir, K.V.; Jijakli, H.; Thorarinsdottir, R. Challenges of sustainable and commercial aquaponics. Sustainability 2015, 7, 4199–4224. [Google Scholar] [CrossRef]
  11. Cai, W.; De La Fuente, L.; Arias, C.R. Biofilm Formation by the Fish Pathogen Flavobacterium columnare: Development and Parameters Affecting Surface Attachment. Appl. Environ. Microbiol. 2013, 79, 5633–5642. [Google Scholar] [CrossRef]
  12. Schwibbert, K.; Richter, A.M.; Krüger, J.; Bonse, J. Laser TexturedSurfaces: A Way to Control Biofilm Formation? Laser Photon-Rev. 2024, 18, 2300753. [Google Scholar] [CrossRef]
  13. Ge, X.; Ren, C.; Ding, Y.; Chen, G.; Lu, X.; Wang, K.; Ren, F.; Yang, M.; Wang, Z.; Li, J.; et al. Micro/nano-structured TiO2 surface with dual-functional antibacterial effects for biomedical applications. Bioact. Mater. 2019, 4, 346–357. [Google Scholar] [CrossRef]
  14. Li, X.; Du, S.; Ma, C.; Shi, T.; Qi, W.; Yang, H. Nano-SiO2 based anti-corrosion superhydrophobic coating on Al alloy with mechanical stability, anti-pollution and self-cleaning properties. Ceram. Int. 2024, 50, 9469–9478. [Google Scholar] [CrossRef]
  15. Roalkvam, I.; Drønen, K.; Dahle, H.; Wergeland, H. Microbial Communities in a Flow-Through Fish Farm for Lumpfish (Cyclopterus lumpus L.) During Healthy Rearing Conditions. Front. Microbiol. 2019, 10, 1594. [Google Scholar] [CrossRef]
  16. Bondad-Reantaso, M.G.; MacKinnon, B.; Karunasagar, I.; Fridman, S.; Alday-Sanz, V.; Brun, E.; Le Groumellec, M.; Li, A.; Surachetpong, W.; Karunasagar, I.; et al. Review of alternatives to antibiotic use in aquaculture. Rev. Aquac. 2023, 15, 1421–1451. [Google Scholar] [CrossRef]
  17. Amri, A.; Sari, S.; Yusoff, A.; Roslan, H.; Ibrahim, N.; Muji, S.Z.M. Development of Indoor Aquaponic System with Monitoring Mechanism for Tilapia and Pak Choy. Evol. Electr. Electron. Eng. 2022, 3, 879–887. [Google Scholar]
  18. Masłon, A.; Tomaszek, J.A. A Study on the Use of the BioBall® as a Biofilm Carrier in a Sequencing Batch Reactor. Bioresour. Technol. 2015, 196, 577–585. [Google Scholar] [CrossRef]
  19. Sheikh, B. Hydroponics: Key to sustain agriculture in water stressed and urban environment. Pak. J. Agric. Agril. Eng. Vet. Sci. 2006, 22, 53–57. [Google Scholar]
  20. Sallenave, R. Important Water Quality Parameters in Aquaponics Systems; Circular 680, College of Agricultural, Consumer and Environmental Sciences, New Mexico State University: Las Cruces, NM, USA, 2016. [Google Scholar]
  21. Thorarinsdottir, R. Aquaponics Guidelines; Haskolaprent: Reykjavik, Iceland, 2015; ISBN 978-9935-9283-1-3. [Google Scholar] [CrossRef]
  22. Palm, H.W.; Bissa, K.; Knaus, U. Significant factors affecting the economic sustainability of closed aquaponic systems. Part II: Fish and plant growth. Aquac. Aquar. Conserv. Legis. Int. J. Bioflux Soc. 2014, 7, 3. [Google Scholar]
  23. Wongkiew, S.; Hu, Z.; Chandran, K.; Lee, J.W.; Khanal, S.K. Nitrogen transformations in aquaponic systems: A review. Aquac. Eng. 2017, 76, 9–19. [Google Scholar] [CrossRef]
  24. Timmons, M.B.; Ebeling, J.M.; Wheaton, F.W.; Summerfelt, S.T.; Vinci, B.J. Recirculating Aquaculture Systems, 2nd ed.; Cayuga Aqua Ventures: New York, NY, USA, 2002. [Google Scholar]
  25. Tyson, R.V.; Simonne, E.H.; White, J.M.; Lamb, E.M. Reconciling water parameters impacting nitrification in aquaponics: The pH levels. Proc. Fla. State Hortic. Soc. 2004, 117, 79–83. [Google Scholar]
  26. Wedemeyer, G.A. Physiology of Fish in Intensive Culture Systems; Chapman & Hall: New York, NY, USA, 1996. [Google Scholar]
  27. Luo, S.; Wu, B.; Xiong, X.; Wang, J. Short-term toxicity of ammonia, nitrite, and nitrate to early life stages of the rare minnow (Gobiocypris rarus). Environ. Toxicol. Chem. 2016, 35, 1422–1427. [Google Scholar] [CrossRef]
  28. Jensen, F.B. Nitrite disrupts multiple physiological functions in aquatic animals. Comp. Biochem. Physiol. A 2003, 135, 9–24. [Google Scholar] [CrossRef] [PubMed]
  29. Williams, E.M.; Eddy, F.B. Chloride uptake in freshwater teleosts and its relationship to nitrite uptake and toxicity. J. Comp. Physiol. B 1986, 156, 867–872. [Google Scholar] [CrossRef]
  30. Kroupova, H.; Machova, J.; Svobodova, Z. Nitrite influence on fish: A review. Vet. Med. 2005, 11, 461–471. [Google Scholar] [CrossRef]
  31. Espinal, C.A.; Matulić, D. Recirculating Aquaculture Technologies. In Aquaponics Food Production Systems; Springer: Berlin/Heidelberg, Germany, 2019; pp. 35–76. [Google Scholar]
  32. Zhou, L.; Boyd, C.E. An assessment of total ammonia nitrogen concentration in Alabama (USA) ictalurid catfish ponds and the possible risk of ammonia toxicity. In Aquaculture and Aquatic Sciences; School of Fisheries, Auburn University: Auburn, AL, USA, 2015. [Google Scholar]
  33. Zhou, L.; Boyd, C.E. Ammonia Nitrogen Management in Aquaculture Ponds. In Aquaculture and Aquatic Sciences; School of Fisheries, Auburn University: Auburn, AL, USA, 2015. [Google Scholar]
  34. Calculation of Unionized Ammonia in Fresh Water Storet Parameter Code 00619, FLORIDA DEPARTMENT OF ENVIRONMENTAL PROTECTION CHEMISTRY LABORATORY METHODS MANUAL, TALLAHASSEE. Revision 2. Ph.D. Thesis, Florida DEP Laboratory, Tallahassee, FL, USA, 2001.
  35. Emerson, K.; Russo, R.C.; Lund, R.E.; Thurston, R.V. Aqueous ammonia equilibrium calculations: Effect of pH and temperature. J. Fish. Res. Board Can. 1975, 32, 2379–2383. [Google Scholar] [CrossRef]
  36. Francis-Floyd, R.; Watson, C.; Petty, D.; Pouder, D.B. Ammonia in Aquatic Systems; University of Florida: Gainesville, FL, USA, 2022. [Google Scholar] [CrossRef]
  37. Purwono, A.R.; Muhammad, H.; Mochamad, A.B. Ammonia-Nitrogen (NH3-N) and Ammonium-Nitrogen (NH4+-N) Equilibrium on The Process of Removing Nitrogen by Using Tubular Plastic Media. J. Mater. Environ. Sci. 2017, 8, 4915–4922. [Google Scholar]
  38. Yogev, U.; Sowers, K.R.; Mozes, N.; Gross, A. Nitrogen and carbon balance in a novel near-zero water exchange saline recirculating aquaculture system. Aquaculture 2017, 467, 118–126. [Google Scholar] [CrossRef]
  39. Boyd, C.E. Overview of aquaculture feeds: Global impacts of ingredient use. In Feed and Feeding Practices in Aquaculture, 1st ed.; Davis, D.A., Ed.; Woodhead Publishing: Cambridge/London, UK, 2015; pp. 3–25. [Google Scholar]
  40. Neori, A.; Krom, M.D.; van Rijn, J. Biogeochemical processes in intensive zero-effluent marine fish culture with recirculating aerobic and anaerobic biofilters. J. Exp. Mar. Biol. Ecol. 2007, 349, 235–247. [Google Scholar] [CrossRef]
  41. Evans, D.H.; Piermarini, M.P.; Choe, K.P. The multifunctional fish gill: Dominant site of gas exchange, osmoregulation, acid-base regulation, and excretion of nitrogenous waste. Physiol. Rev. 2005, 85, 97–177. [Google Scholar] [CrossRef]
  42. Masser, M.P.; James Rakocy, J.; Thomas, M.; Losordo, T.M. Recirculating Aquaculture Tank Production Systems: An Overview of Critical Considerations; SRAC Publication No. 452; SRAC Publication: Stoneville, MS, USA, 1999. [Google Scholar]
  43. Thangam, Y. Histopathological studies on nitrite toxicity to freshwater fish, Cirrhinus mrigala. IOSR JESTFT 2014, 8, 2319–2402. [Google Scholar] [CrossRef]
  44. Buzby, K.M.; Lin, L.S. Scaling aquaponics systems: Balancing plant uptake with fish output. Aquac. Eng. 2014, 63, 39–44. [Google Scholar] [CrossRef]
  45. Yang, T.; Kim, H.-J. Characterizing Nutrient Composition and Concentration in Tomato-, Basil-, and Lettuce-Based Aquaponic and Hydroponic Systems. Water 2020, 12, 1259. [Google Scholar] [CrossRef]
  46. Kasozi, N.; Abraham, B.; Kaiser, H.; Wilhelmi, B. The complex microbiome in aquaponics: Significance of the bacterial ecosystem. Ann. Microbiol. 2021, 71, 1. [Google Scholar] [CrossRef]
  47. Keesman, K.J.; Körner, O.; Wagner, K.; Urban, J.; Karimanzira, D. Thomas Rauschenbach, Simon Goddek, Aquaponics Systems Modelling, In Aquaponics Food Production Systems; Springer: Berlin/Heidelberg, Germany, 2019; pp. 267–299. [Google Scholar]
  48. Hu, Z.; Lee, J.W.; Chandran, K.; Kim, S.; Brotto, A.C.; Khanal, S.K. Effect of plant species on nitrogen recovery in aquaponics. Bioresour. Technol. 2015, 188, 92–98. [Google Scholar] [CrossRef] [PubMed]
  49. Mori, J.; Smith, R. Transmission of waterborne fish and plant pathogens in aquaponics and their control with physical disinfection and filtration: A systematized review. Aquaculture 2019, 504, 380–395. [Google Scholar] [CrossRef]
  50. Zheng, S.; Bawazir, M.; Dhall, A.; Kim, H.-E.; He, L.; Heo, J.; Hwang, G. Implication of Surface Properties, Bacterial Motility, and Hydrodynamic Conditions on Bacterial Surface Sensing and Their Initial Adhesion. Front. Bioeng. Biotechnol. 2021, 9, 643722. [Google Scholar] [CrossRef]
  51. Cheng, Y.; Feng, G.; Moraru, C.I. Micro- and Nanotopography Sensitive Bacterial Attachment Mechanisms: A Review. Front. Microbiol. 2019, 10, 191. [Google Scholar] [CrossRef]
  52. Gnilitskyi, I.; Rymar, S.; Iungin, O.; Vyshnevskyy, O.; Parisse, P.; Potters, G.; Zayats, A.V.; Moshynets, O. Femtosecond laser modified metal surfaces alter biofilm architecture and reduce bacterial biofilm formation. Nanoscale Adv. 2023, 5, 6659–6669. [Google Scholar] [CrossRef]
  53. Lutey, A.H.A.; Gemini, L.; Romoli, L.; Lazzini, G.; Fuso, F.; Faucon, M.; Kling, R. Towards Laser-Textured Antibacterial Surfaces. Sci. Rep. 2018, 8, 10112. [Google Scholar] [CrossRef]
  54. Helbig, R.; Günther, D.; Friedrichs, J.; Rößler, F.; Lasagni, A.; Werner, C. The impact of structure dimensions on initial bacterial adhesion. Biomater. Sci. 2016, 4, 1074–1078. [Google Scholar] [CrossRef]
  55. Chen, H.; Wei, Z.; Sun, G.; Su, H.; Liu, J.; Hu, B.; Zhou, X.; Lou, L. Formation of biofilms from new pipelines at both ends of the drinking water distribution system and comparison of disinfection by-products formation potential. Environ. Res. 2020, 182, 109150. [Google Scholar] [CrossRef]
  56. Sharan, M.; Vijay, D.; Dhaka, P.; Bedi, J.S.; Gill, J.P.S. Biofilms as a microbial hazard in the food industry: A scoping review. J. Appl. Microbiol. 2022, 133, 2210–2234. [Google Scholar] [CrossRef] [PubMed]
  57. Damyanova, T.; Dimitrova, P.; Borisova, D.; Topouzova-Hristova, T.; Haladjova, E.; Paunova-Krasteva, T. An overview of biofilm-associated infections and the role of phytochemicals and nanomaterials in their control and prevention. Pharmaceutics 2024, 16, 162. [Google Scholar] [CrossRef] [PubMed]
  58. Stoitsova, S.R.; Paunova-Krasteva, T.S.; Borisova, D.B. Modulation of biofilm growth by Sub-inhibitory amounts of antibacterial substances. In Microbial Biofilms; Dhanasekaran, D., Thajuddin, N., Eds.; InTech: London, UK, 2016. [Google Scholar]
  59. World Health Organization. Prioritization of Pathogens to Guide Discovery, Research and Development of New Antibiotics for Drug-Resistant Bacterial Infections, Including Tuberculosis; World Health Organization: Geneva, Switzerland, 2017.
  60. Flemming, H.-C.; van Hullebusch, E.D.; Neu, T.R.; Nielsen, P.H.; Seviour, T.; Stoodley, P.; Wingender, J.; Wuertz, S. The biofilm matrix: Multitasking in a shared space. Nat. Rev. Microbiol. 2023, 21, 70–86. [Google Scholar] [CrossRef] [PubMed]
  61. Kouider, N.; Hamadi, F.; Mallouki, B.; Bengoram, J.; Mabrouki, M.; Zekraoui, M.; Ellouali, M.; Latrache, H. Effect of stainless steel surface roughness on Staphylococcus aureus adhesion. Int. J. Pure Appl. Sci. 2010, 4, 1–7. [Google Scholar]
  62. Daskalova, A.; Sezanova, K.; Angelova, L.; Paunova-Krasteva, T.; Gergulova, R.; Kovacheva, D.; Rabadjieva, D. Ultra-Short Laser-Assisted Micro-Structure Formations on Mg/Zn Double-Doped Calcium Phosphate Ceramics for Enhanced Antimicrobial Activity. Materials 2023, 16, 6626. [Google Scholar] [CrossRef]
  63. Yanes, A.R.; Martinez, P.; Ahmad, R. Towards automated aquaponics: A review on monitoring, IoT, and smart systems. J. Clean. Prod. 2020, 263, 121571. [Google Scholar] [CrossRef]
Figure 1. CPS block diagram.
Agriengineering 06 00219 g001
Figure 2. Aquaponic system components.
Agriengineering 06 00219 g002
Figure 3. Algorithm of startup cycle.
Agriengineering 06 00219 g003
Figure 4. First part of working algorithm.
Agriengineering 06 00219 g004
Figure 5. Second part of working algorithm.
Agriengineering 06 00219 g005
Figure 6. Feeding cycle.
Agriengineering 06 00219 g006
Figure 7. Monitoring the system performance during the startup cycle.
Agriengineering 06 00219 g007
Figure 8. Monitoring the system performance during the working cycle.
Agriengineering 06 00219 g008
Figure 9. SEM images of three types of surface topography in the form of micro-channel structure and corresponding laser parameters: (ac) V = 5.16 mm/s, P = 20 mW; (df) V = 7.6 mm/s, P = 20 mW; (gi) V = 32 mm/s, P = 20 mW. SEM image magnification from left to right is correspondingly 350×, 2.00 kx; 5.00 kx.
Agriengineering 06 00219 g009
Figure 10. EDX analysis taken over an area of control—non-laser-treated (a) and laser-processed (V = 5.16 mm/s, P = 20 mW) polypropylene surface (b).
Agriengineering 06 00219 g010
Figure 11. 3D optical profilometry measurements of the surface topography and corresponding cross-sectional images of the produced patterns after laser processing with (a) V = 5.16 mm/s, P = 20 mW; (b) V = 7.6 mm/s, P = 20 mW; and (c) V = 32 mm/s, P = 20 mW.
Agriengineering 06 00219 g011
Figure 12. SEM images demonstrating the P. aeruginosa biofilm cultivation onto three types of laser-textured surfaces: (a) control non-laser-treated surfaces; the magnified image marks with white arrows the presence of underlying layers of bacterial cells in the biofilm community. Laser-textured surfaces with the following parameters: (b) V = 5.16 mm/s, P = 20 mW; (c) V = 7.6 mm/s, P = 20 mW; and (d) V = 32 mm/s, P = 20 mW. Bar = 5 µm.
Agriengineering 06 00219 g012
Figure 13. Effects of co-cultivation on surfaces textured by laser at V = 7.6 mm/s, V = 32 mm/s, V = 5.16 mm/s, and P = 20 mW on the bacterial viability of P. aeruginosa. The percentage of viable bacterial cells within biofilms was quantified by the after-drop-plated technique on agar, where the control probe was defined as 100% and the other probes were calculated accordingly. Mean values were presented with standard deviations of ≤12%. Statistical analysis was processed using OriginPro 6.1.
Agriengineering 06 00219 g013
Table 1. Requirements to the CPS development.
DescriptionDescription
Ammonia MonitoringThe CPS shall monitor the critical water parameter ammonia (NH3) within the fish tank.
Nitrite MonitoringThe CPS shall monitor the critical water parameter nitrite (NO2−) to ensure safe levels in the aquaponic system.
Nitrate MonitoringThe CPS shall monitor the critical water parameter nitrate (NO3−) to ensure safe levels in the aquaponic system.
pH Level MonitoringThe CPS shall monitor the pH level in the water and provide alerts when pH deviates from the set range.
Temperature MonitoringThe CPS shall monitor the water temperature in both the fish tank and biofilter, ensuring it stays within species-specific ranges.
Dissolved Oxygen MonitoringThe CPS shall monitor the dissolved oxygen (DO) levels in the fish tank, biofilter, and floating rafts to maintain optimal conditions for fish and bacteria.
Water Level MonitoringThe CPS shall monitor the water levels in the fish tank and biofilter and control the solenoid valve for maintaining water levels.
Automated Fish FeedingThe CPS shall control the fish feeding mechanism through an auger, adjusting the amount and frequency of feed based on the system’s conditions.
Air Pump ControlThe CPS shall control the air pumps in the fish tank, biofilter, and floating rafts, maintaining oxygen levels within the set parameters.
pH RegulationThe CPS shall regulate the pH levels by controlling augers that dispense pH-altering substances when necessary.
Continuous OperationThe CPS shall operate continuously with minimal manual intervention, ensuring stable and autonomous system functionality.
Alarm and Messaging SystemThe CPS shall provide alarms and a messaging system to notify operators in case of parameter deviations, such as temperature, oxygen levels, or pH fluctuations.
Data LoggingThe CPS shall log real-time data from all monitored parameters for analysis and troubleshooting.
System ScalabilityThe CPS shall allow scalability, enabling the addition of new sensors and control mechanisms as the aquaponic unit expands.
User InterfaceThe CPS shall have an intuitive user interface for operators to monitor system status and manually adjust parameters when necessary.
Water Quality ManagementThe CPS shall maintain water quality by automatically adjusting parameters such as oxygen, ammonia, and pH, to ensure healthy conditions for both fish and plants.
Nutrient ManagementThe CPS shall monitor and manage nutrient levels, ensuring that plants receive adequate nutrients for optimal growth.
Adaptive Feeding ManagementTo prevent overfeeding, the CPS shall adjust fish feeding rates based on water quality parameters such as ammonia and nitrites.
Table 2. Measured parameters and control mechanisms in an aquaponic system.
SensorsLocations
Water temperature, t °CFish tank, biofilter
Dissolved oxygen, DOFish tank, biofilter, floating rafts
Nitrite, NO2Fish tank
Nitrate, NO3Fish tank
Power of hydrogen, pHFish tank
Ammonium NH4+Fish tank
Ammonia NH3 (Calculated)-
Total ammonia nitrogen TAN (Calculated)-
Water level sensorFish tank, biofilter
Control systemsLocations
Water pumpBiofilter
Air pumpBiofilter, Biofilter, Floating rafts
HeaterFish tank
Auger for adding pH−Biofilter
Auger for adding pH+Biofilter
Auger for adding fish foodFish tank
Electric solenoid water valveBiofilter
Table 3. Sensors.
Table 3. Sensors.
ModelMeasurementMeasuring RangeResolution for
TriOxmatic 700 IQDO0–60 mg/L0.1 mg/L
Temperature−5–60 °C0.1 °C
AmmoLyt Plus 700 IQAmmonium, NH4+0.1–129 mg/L0.1 mg/L
NiCaVis 701 IQ NINitrites NO20.1–120 mg/L0.1 mg/L
Nitrates NO30.1–300 mg/L0.1 mg/L
SensoLyt® 700 IQpH0.00–14.000.01
SL-M5Water level--
Table 4. Parameters of water maintained by the system.
Water ParameterMeasurement LocationTolerance RangeMaintained by the System
Temperature, t °CFish tank (working cycle)Depending on fish type above 10 °CNot lower than the set
Biofilter (startup cycle)17 Not lower than 17
Power of hydrogen, pHFish tank6–76–7
Dissolved oxygen, DO, mg/LFish tank4–6 *, 6–8 **5–6 *, 6–8 **
Biofilter4–85–8
Floating raftsAbove 34–8
Ammonia, NH3, mg/LFish tank ***<3 *, <1 **Not higher than the set according to the specific fish species ****
Nitrate, NO3−, mg/LFish tank<1Not higher than the set according to the specific fish species ****
Nitrite, NO2−, mg/LFish tank<300<200 ****
* Warm-water fish; ** cold-water fish; *** the amount of ammonia NH3 is calculated from the measured value of ammonium NH4+; **** control of this parameter may require staff intervention.
Table 5. Parameter abbreviations.
AbbreviationsDescription
tft, °C Water temperature in fish tank
tbf, °C Water temperature in biofilter
tftmin, °C Set minimum water temperature in fish tank
tftmax, °C Set maximum water temperature in fish tank
tbfmin, °C Set minimum water temperature in biofilter
DOft, mg/L Concentration of dissolved oxygen in fish tank
DObf, mg/L Concentration of dissolved oxygen in biofilter
DOfr, mg/L Concentration of dissolved oxygen in floating raft
DOftmin, mg/L Set minimum concentration of dissolved oxygen in fish tank
pH Power of hydrogen in fish tank
NO2, mg/L Nitrite in fish tank
NO2max, mg/L Set maximum nitrate in fish tank
NO3, mg/L Nitrate in fish tank
NH3, mg/L Ammonia in fish tank
NH3max, mg/L Set maximum ammonia in fish tank
NH4, mg/L Ammonium in fish tank
TAN, mg/L Total ammonia nitrogen in fish tank
Feed, sec Auger feeding time
Air pump ft Air pump in fish tank
Air pump bf Air pump in biofilter
Air pump fr Air pump in floating raft
Disclaimer/Publisher’s Note: The statements, opinions and data contained in all publications are solely those of the individual author(s) and contributor(s) and not of MDPI and/or the editor(s). MDPI and/or the editor(s) disclaim responsibility for any injury to people or property resulting from any ideas, methods, instructions or products referred to in the content.

