2.1. Soil Properties
This research utilized soil samples collected from the 0–100 mm layer of a paddy field in Huzhou City, Zhejiang Province, China, characterized as typical clay soil. The soil particle size and its distribution were measured, and the following results were obtained: particles with d < 0.5 mm comprised 9.8%, d = 0.5~0.7mm comprised 29.5%, d = 0.7~0.9 mm comprised 41.9%, and diameter d > 0.9 mm constituted 18.8%. The average moisture content was measured to be 19.68%. The average volumetric weight, compactness, and specific gravity of the soil were 1.355 × 10
3 kg/m
3, 461.5 Kpa, and 2.44, respectively. Relevant test methods are outlined in
Table 1.
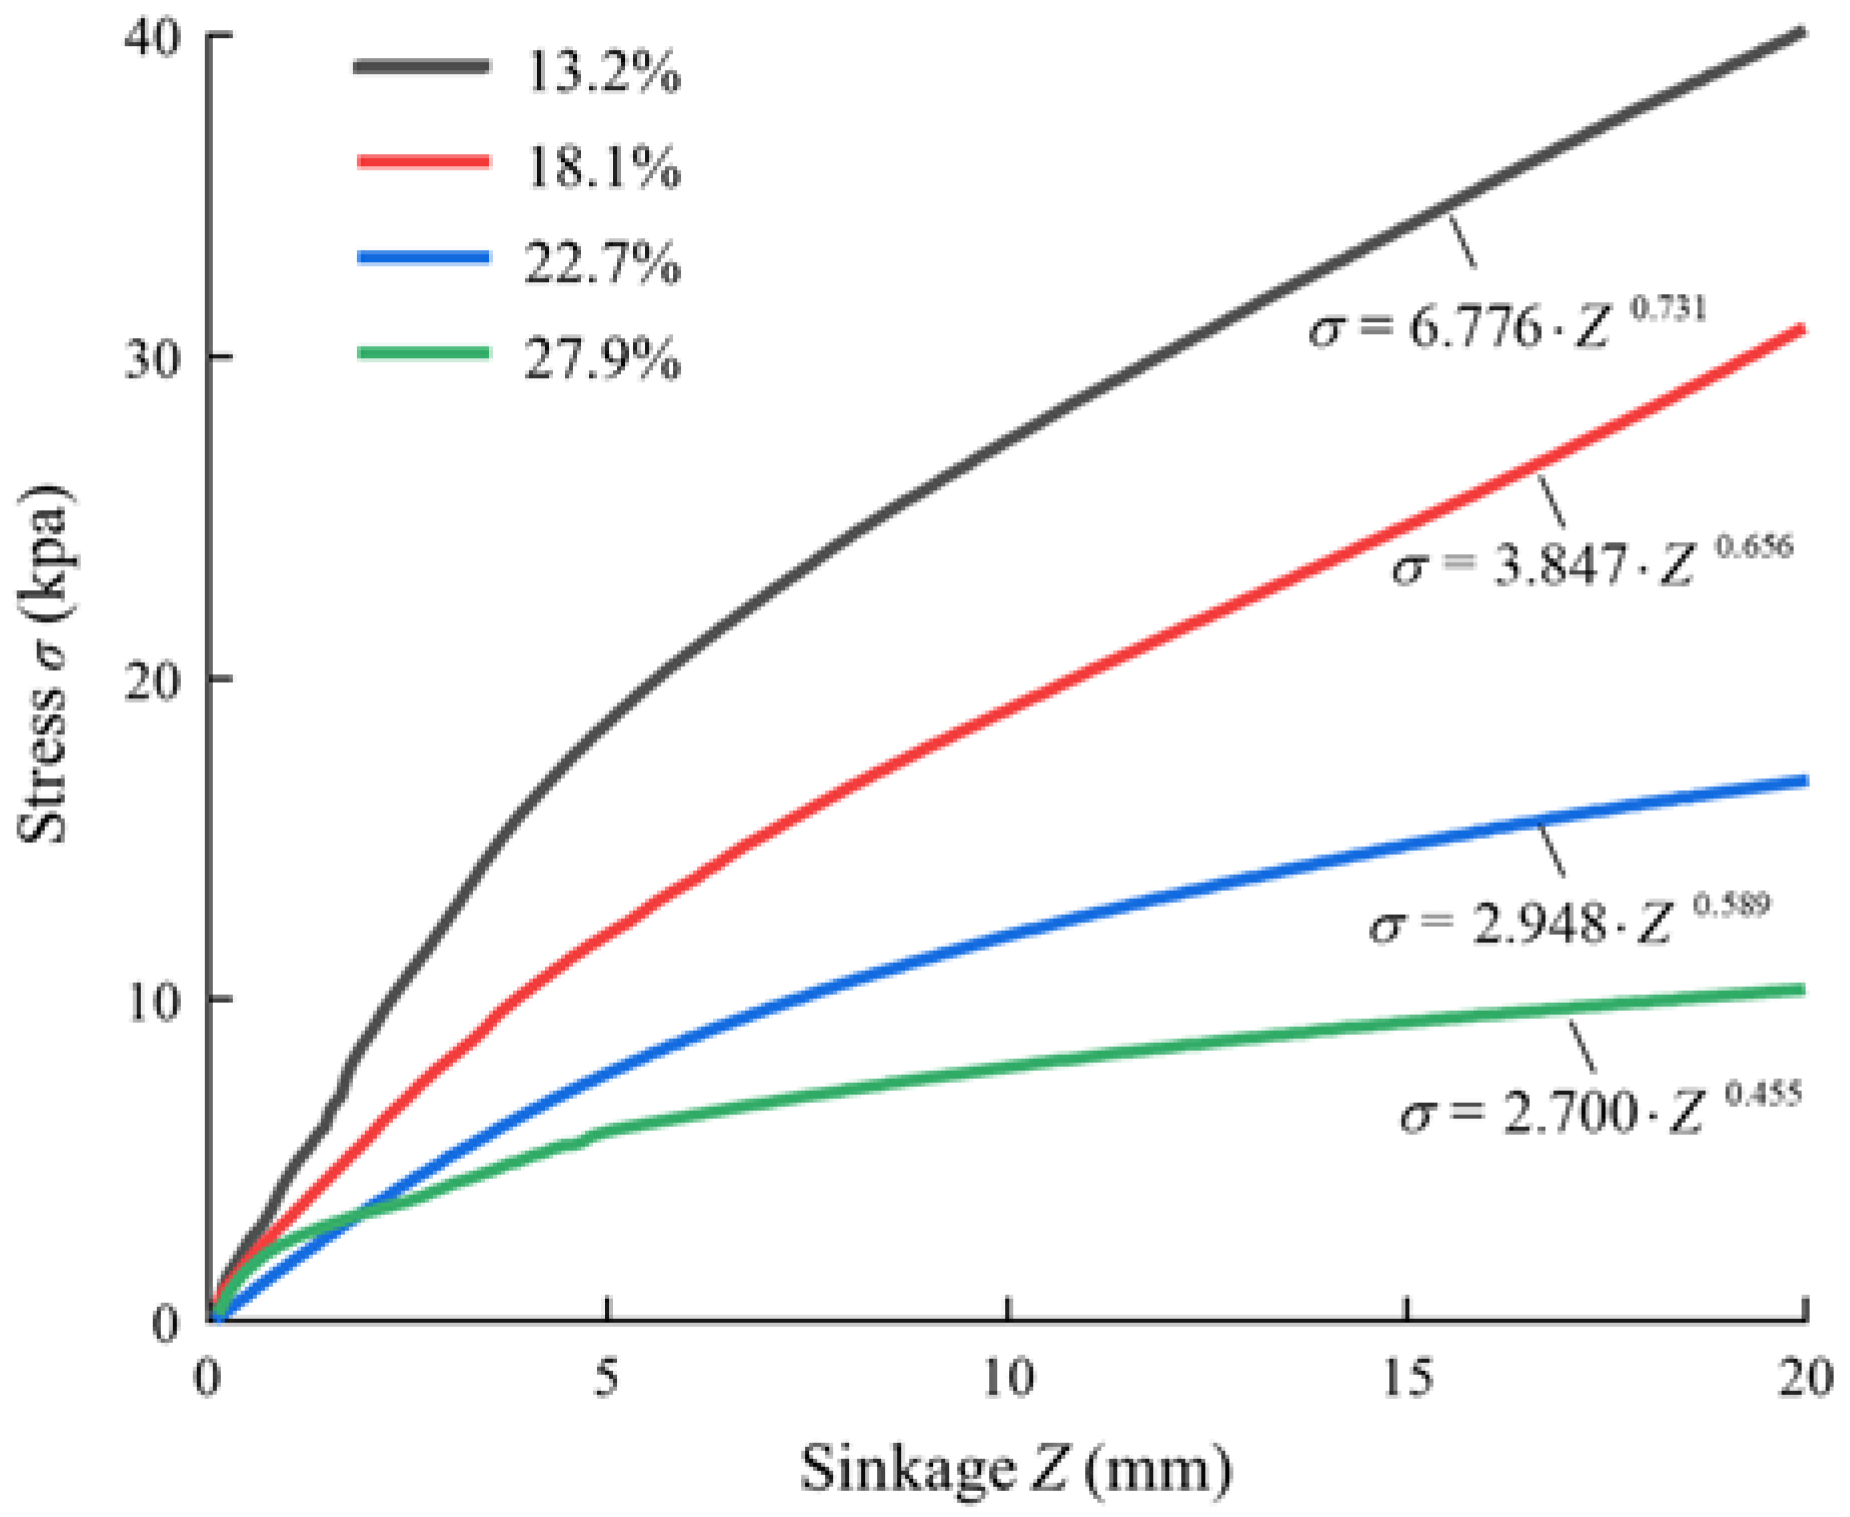
The target moisture content in the experiment was 13%, 18%, 23%, and 28% (with increments of 4%). To obtain different moisture contents, the soil was spread flat in a cool, ventilated area to less than 10% moisture content. A motorized sprayer was used to ensure that the water was evenly mixed with the soil in the preparation of soil with different moisture contents. After spraying the calculated amount of water into the soil, five samples were randomly taken from the soil, and the moisture content was measured. Once the deviation of the actual moisture content from the target moisture content is less than 1 percent, the soil preparation is complete. Otherwise, the process is repeated. The observed moisture content during the experiment was measured at 13.2%, 18.1%, 22.7%, and 27.9%, respectively.
2.2. Plate Sinkage Test (PST) and DEM Parameter Calibration Principle
The plate sinkage test (PST) is able to visualize the soil pressure-sinking characteristics. In this research, the PST was carried out to calibrate and verify the soil DEM parameters. The soil pressure–sinkage relationship can be expressed as an exponential function [
4,
22].
where
Z is the subsidence, m;
σ is the grounding pressure, KN·m
−2;
K is the sinking modulus; and
n is the soil deformation exponent.
Sinking modulus
K depends on the soil property and plate geometry. According to Bekker’s theory [
23],
where
kc is the modulus of cohesion deformation;
kφ is the modulus of friction deformation;
b is the plate width (radius of a circular plate or width of a rectangular plate), m.
The parameters
K and
n could characterize the nonlinear soil pressure–sinkage relationship. Their values can be acquired by experiment and curve fitting. Simulation tests with DEM parameters as variables were also carried out. The optimal DEM parameter combinations can be obtained using
K and
n values as optimization objectives. Compared with the single-point calibration method [
24], this calibration method can reflect the nonlinear characteristics of the soil pressure-sinking process, overcome the influence of nonlinear factors on the calibration results, and improve the reliability of parameter calibration.
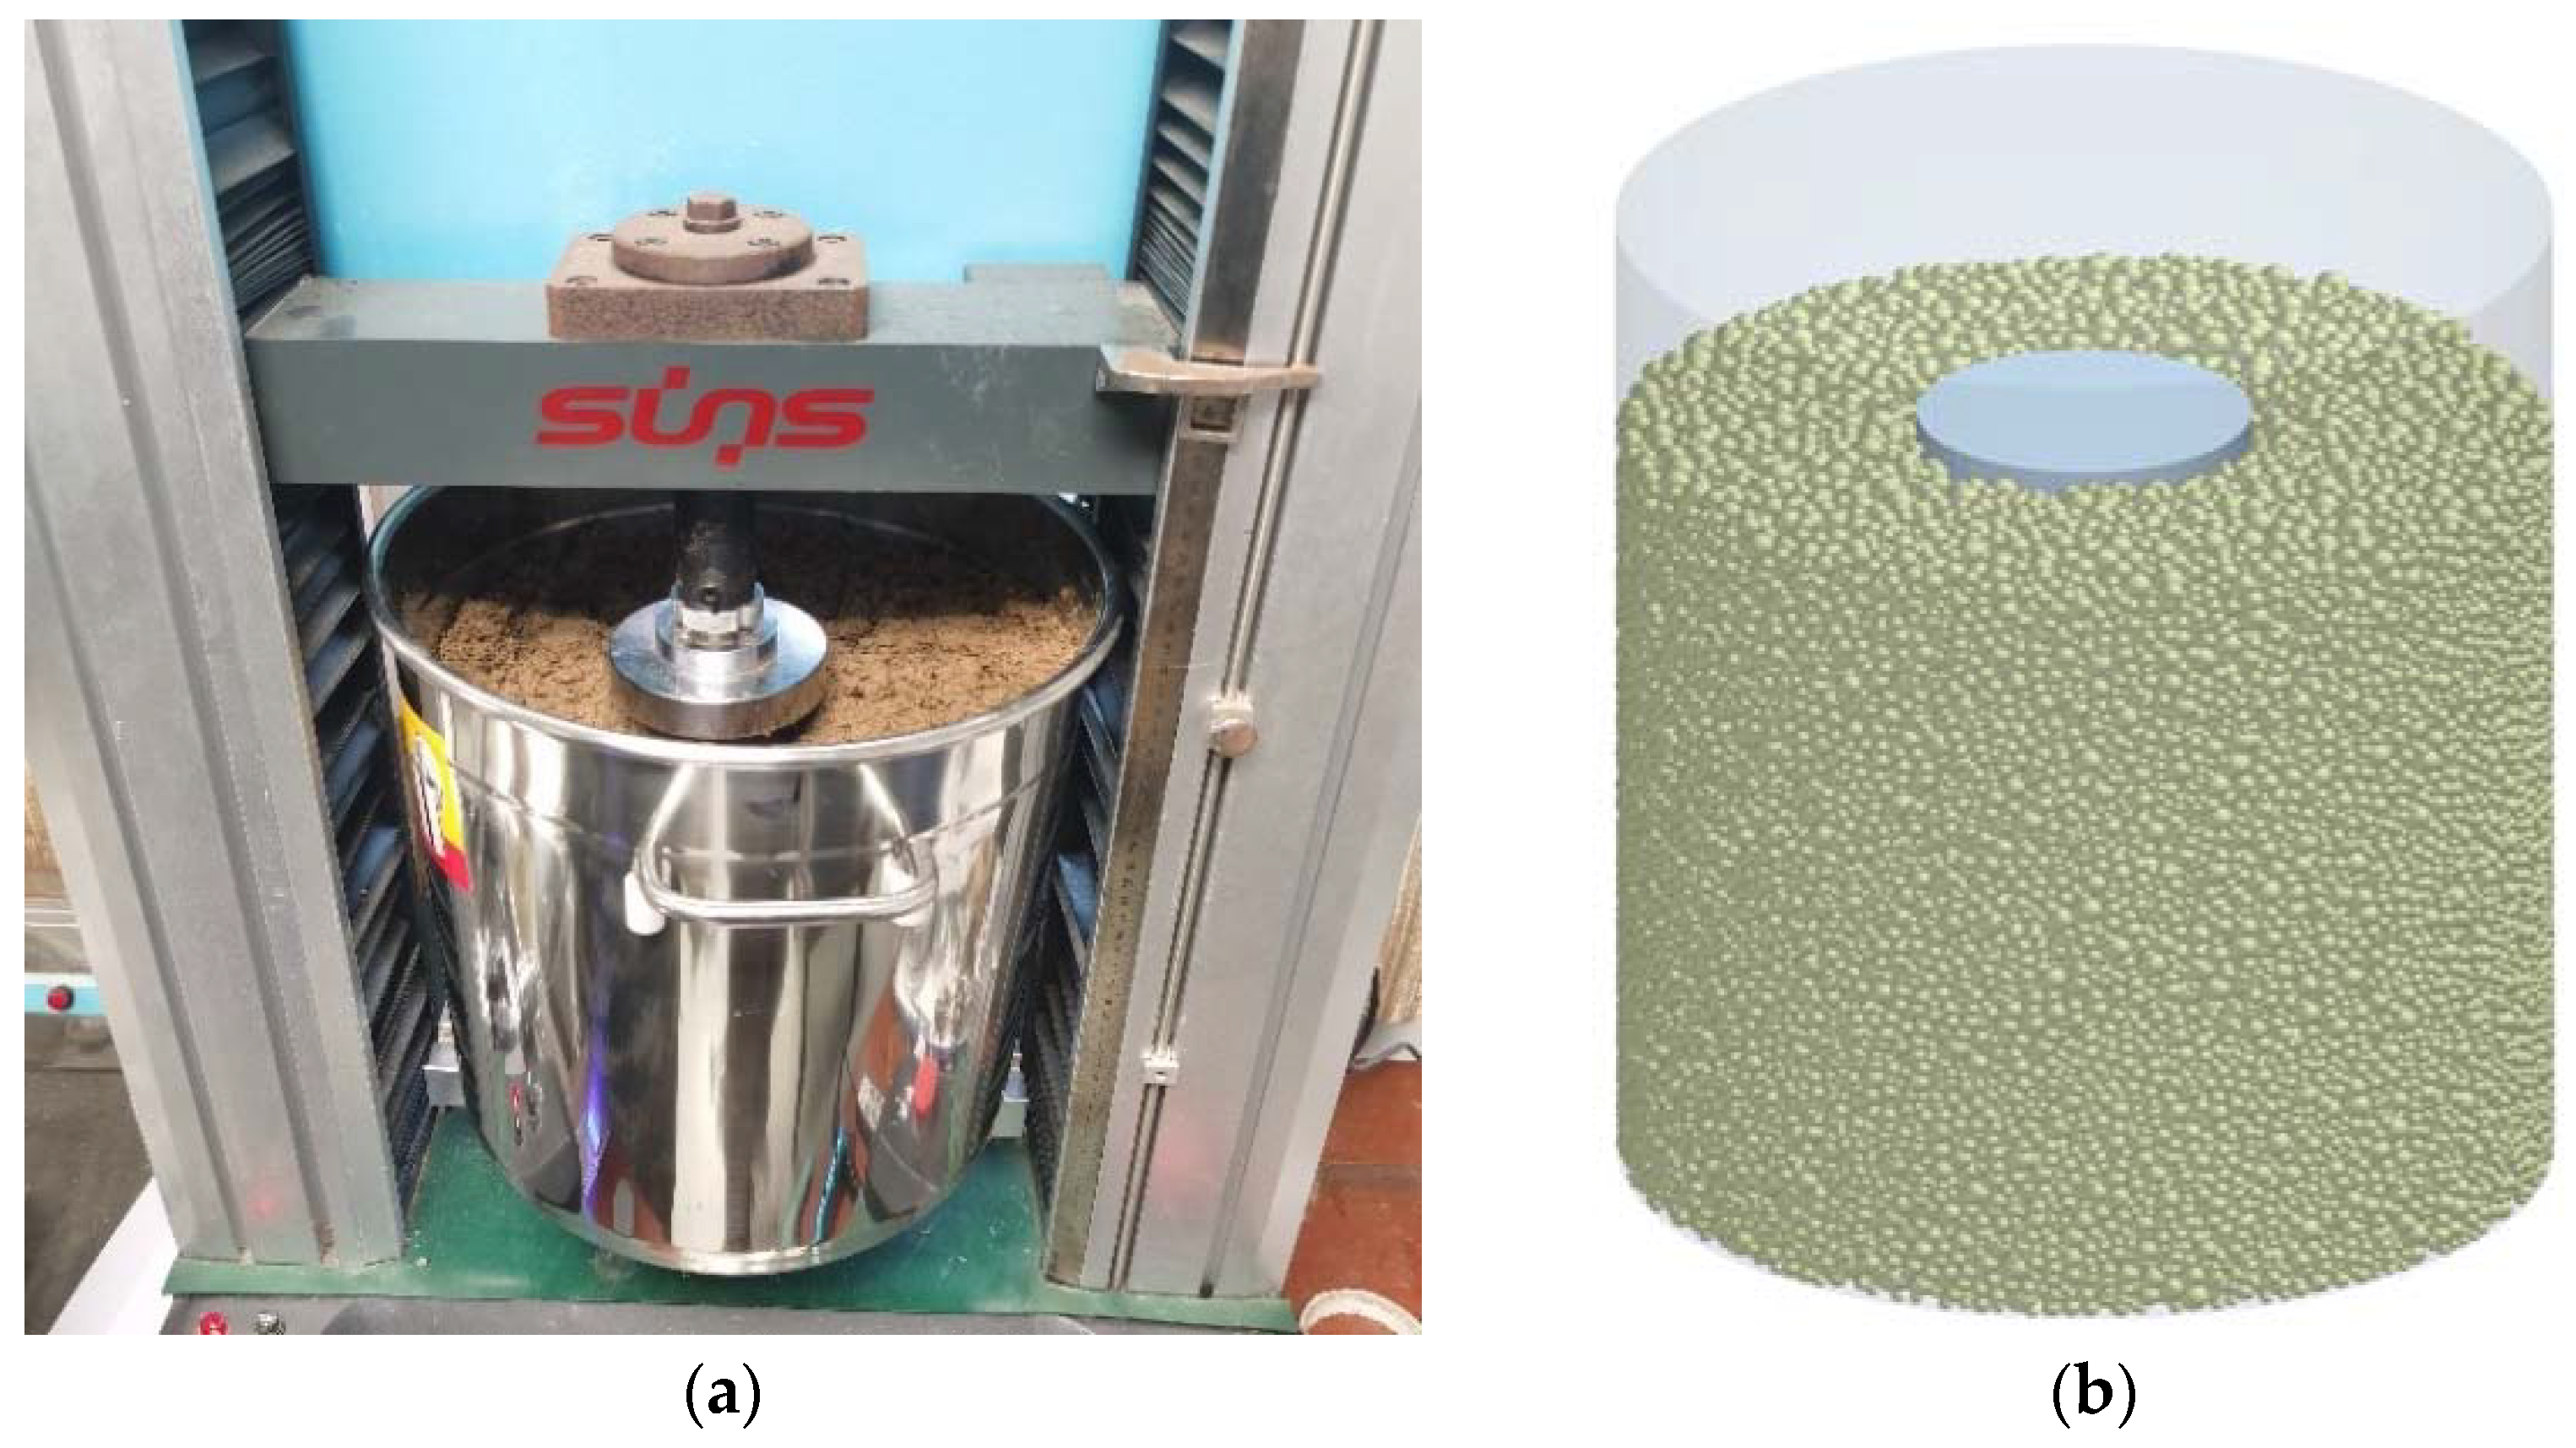
In this research, four soils with different moisture contents (13.2%, 18.1%, 22.7%, and 27.9%) were used. A steel cylinder with a diameter of 300 mm and a height of 300 mm was used to place the soil, as shown in
Figure 1. To achieve the same bulk density in the field, the soil in the cylinder was compacted to predetermined depths marked on the inside wall using a metal plate of the same internal diameter as the cylinder. To avoid the influence of boundary effects on the test results, the ratio of the diameter of the steel cylinder to the pressure plate should be not less than 3 [
12], and a 100 mm diameter steel plate was used for the PST. The pressure was loaded and recorded by a universal testing machine (utm6503, Suns, Shenzhen, China) at a loading speed of 0.008 m·s
−1. 0.025 m was set as the total sink depth. Three trials with the same parameters were repeated and averaged.
2.3. Contact Model Theory and Parameters to Be Calibrated
The contact model is a description of the behavior of elements in contact with each other. The Edinburgh Elasto-Plastic Adhesion Model (EEPA) includes an adhesion component as a function of plastic contact deformation, as well as a nonlinear hysteresis spring model to account for elastic-plastic contact deformation [
25]. The model can reflect the volume of soil particles before and after compaction and the viscosity–plasticity relationship between particles.
In the EEPA, the total normal force (
Fn) mainly consists of the hysteretic rebound force (
fhys) and the normal damping force (
fnd):
where
u is the unit normal vector from the point of contact to the mass center;
f0 is the initial bond strength of the particles, Pa;
k1 is the loading stiffness coefficient;
k2 is the unloading stiffness coefficient;
kadh is the adhesion stiffness coefficient;
δp is the particle contact overlap;
f0 is the constant pull-off force;
βn is the damping factor; and
vn is the normal velocity, m·s
−1.
The key parameters in normal damping force (
fnd) were given by:
where
m* is the equivalent mass of the particles;
e is the coefficient of restitution.
The particle contact tangential force (
ft) consists of tangential stiffness (
fts) and tangential damping (
ftd):
The tangential stiffness (
fts) is calculated using the iterative theory:
where
fts(n−1) is the tangential force at a given moment, N;
γt is the particle tangential stiffness coefficient; and
δt is the tangential overlap.
The tangential damping (
ftd) is mainly determined by the tangential damping factor
βt and the interparticle tangential velocity
vt:
Soil particles slide against each other, and the tangential friction of soil particles conforms to the Coulomb friction criterion. Therefore, the particle shear strength limits under positive stress are as follows:
where
fct is the limit of tangential friction between particles, N;
μ is the coefficient of rolling friction.
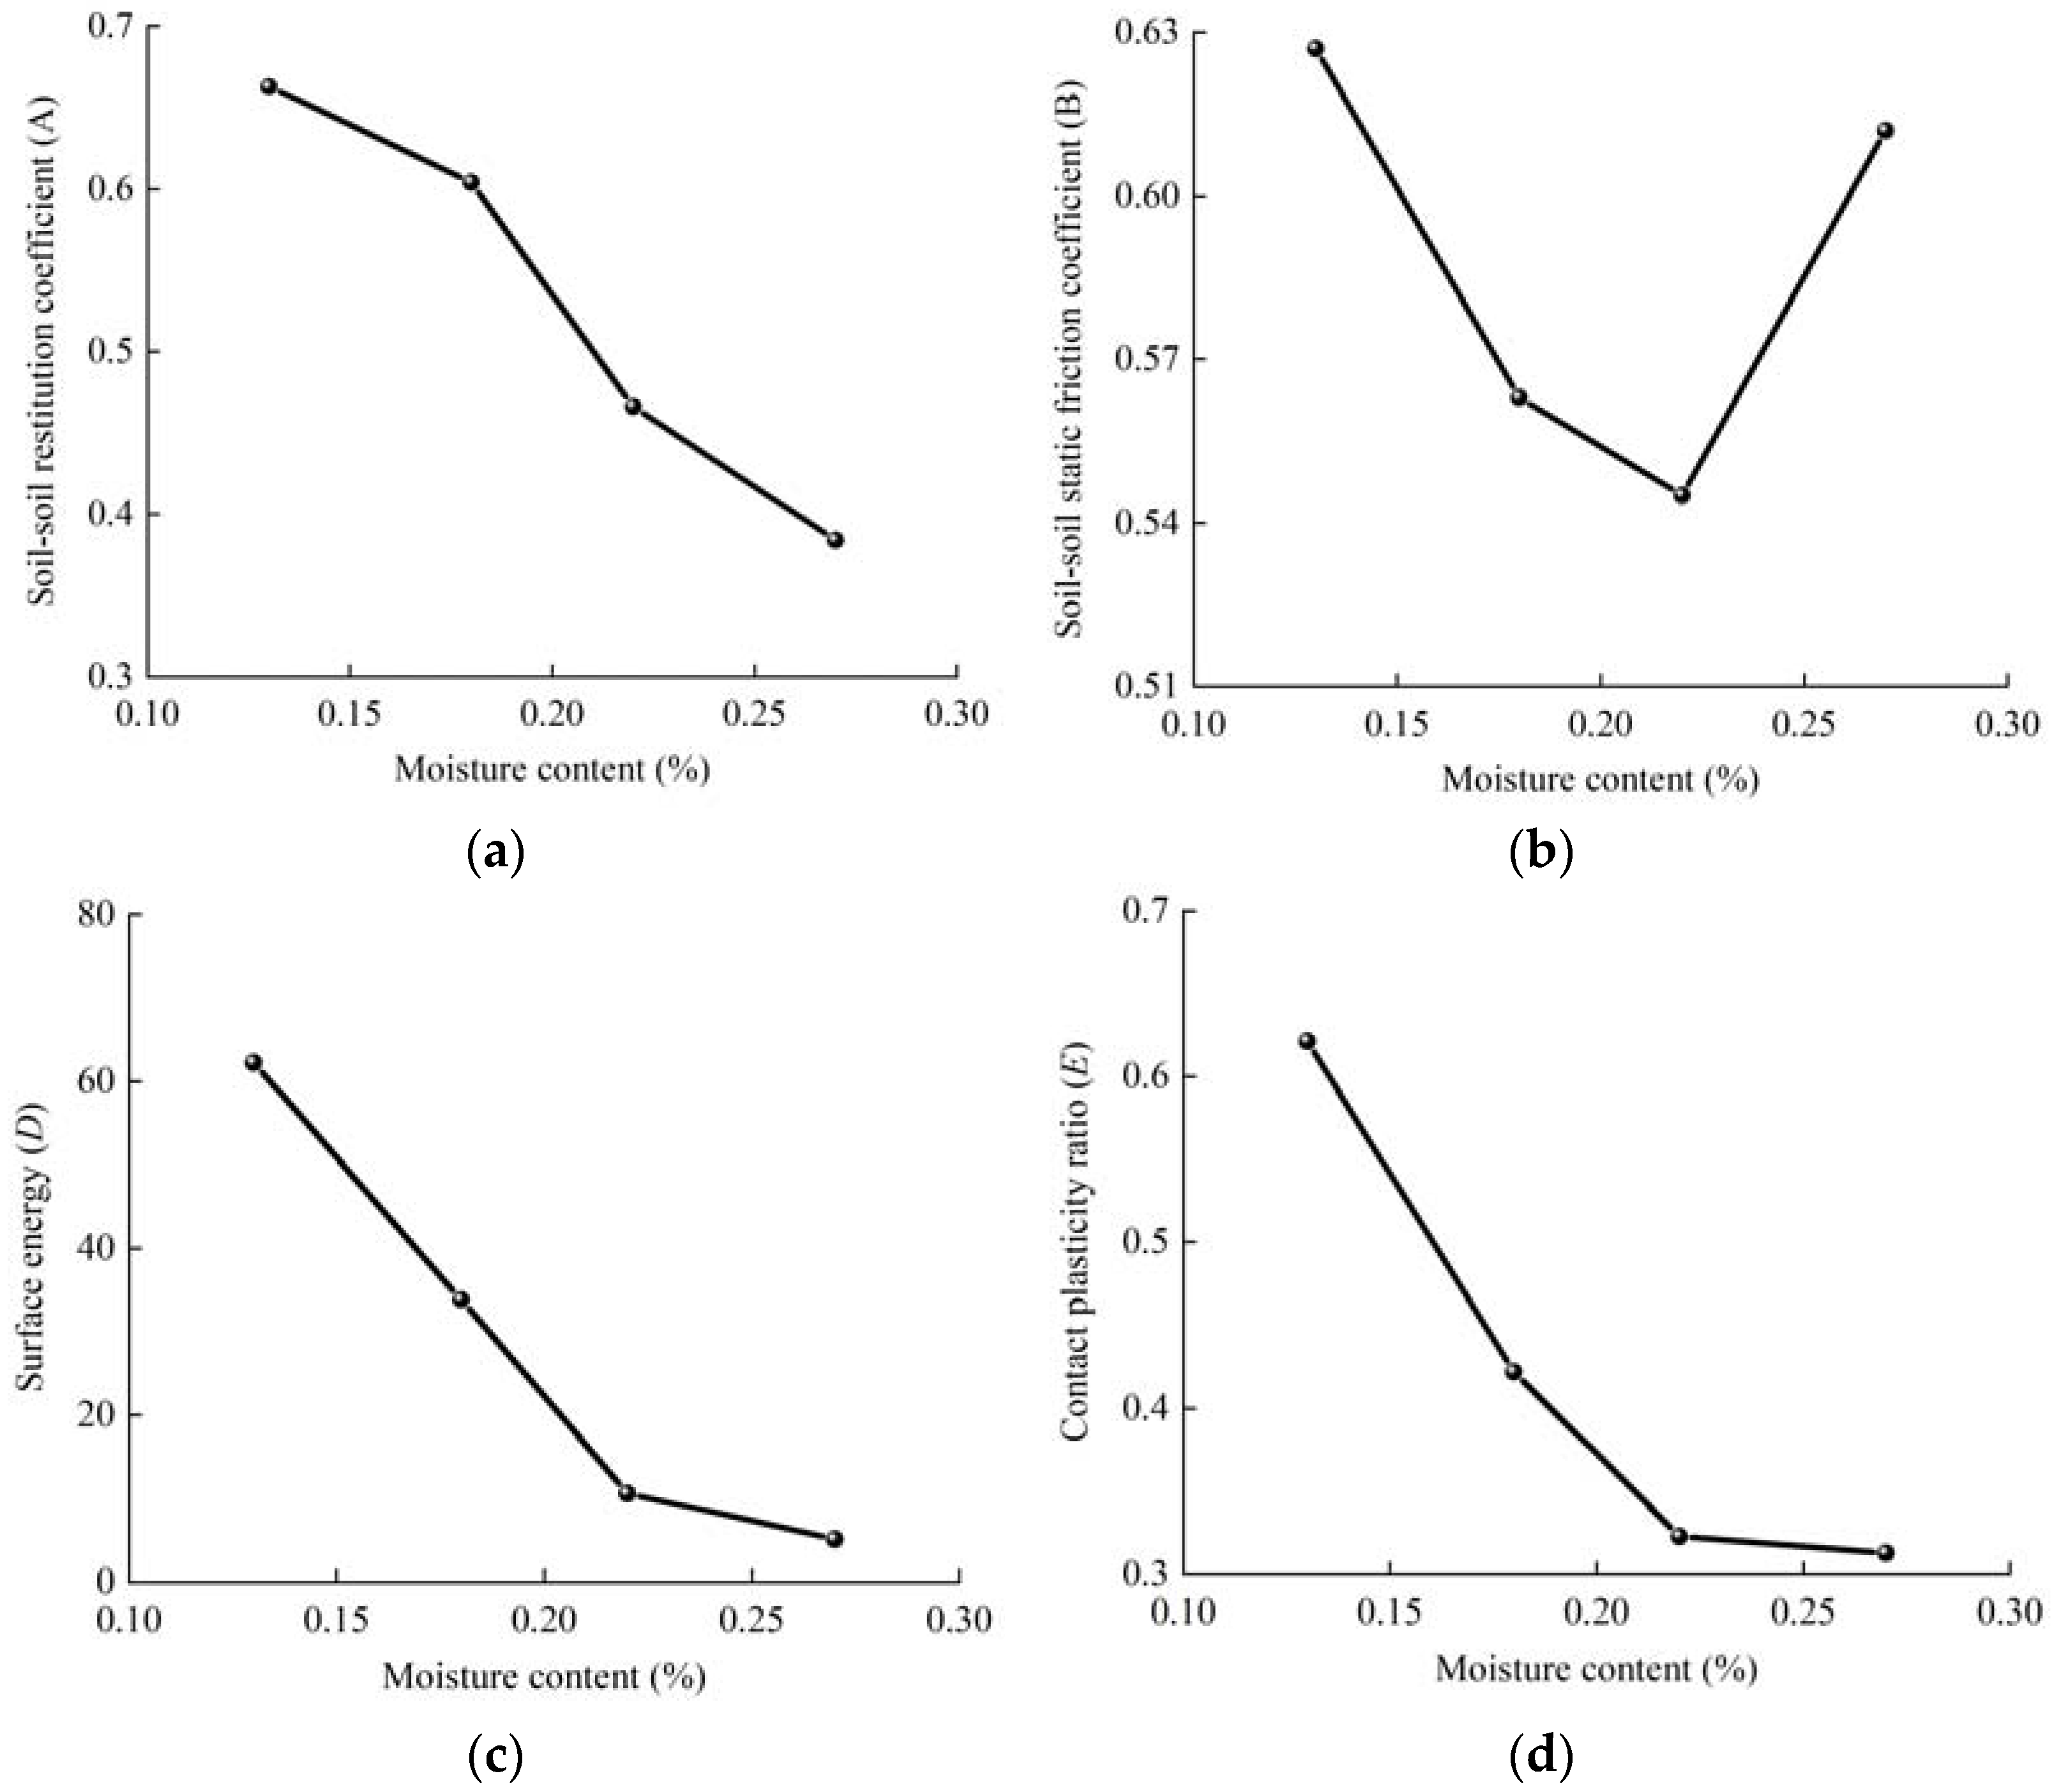
Thus, the parameters that need to be calibrated in EEPA DEM simulations are surface energy, contact plasticity ratio, tensile exp, and the tangential stiff multiplier. In addition, particle interaction parameters that need to be calibrated are the coefficient of restitution, the coefficient of sliding friction, and the coefficient of rolling friction.
2.4. Discrete Element Models for Plate Sinkage Test
The PST DEM simulation was developed in the software EDEM_v2021 (EDEM Academic 2021, DEM Solutions Ltd., Edinburgh, UK). Spherical particles with 5 mm, 4 mm, 3 mm, and 2 mm were created, and their percentages were 18.8%, 41.9%, 29.5%, and 9.8%, respectively, according to the size distribution statistic result. The particles were randomly generated in a cylinder with a height of 400 mm and a diameter of 300 mm (
Figure 1b). The total particle number was 99,700, and the average void volume fraction was 40.5%.
To apply compressive stress to the particles, a circular steel plate with a diameter of 100 mm was created. PST were simulated with a sinkage depth of 0.025 m and a loading speed of 0.008 m
−s, which was the same as the experiment. The simulation time step and save interval were set at 3 × 10
−5 s and 0.1 s, respectively. The load on the soil is calculated from the total force of the plate.
Table 2 lists the DEM parameters utilized in the simulations [
10,
12]. Soil-metal contact parameters were no longer calibrated due to their insignificant impact on PST simulation [
17].
2.5. DEM Parameters Calibration Method
The parameters to be calibrated include three soil–soil contact parameters and four EEPA parameters, as shown in
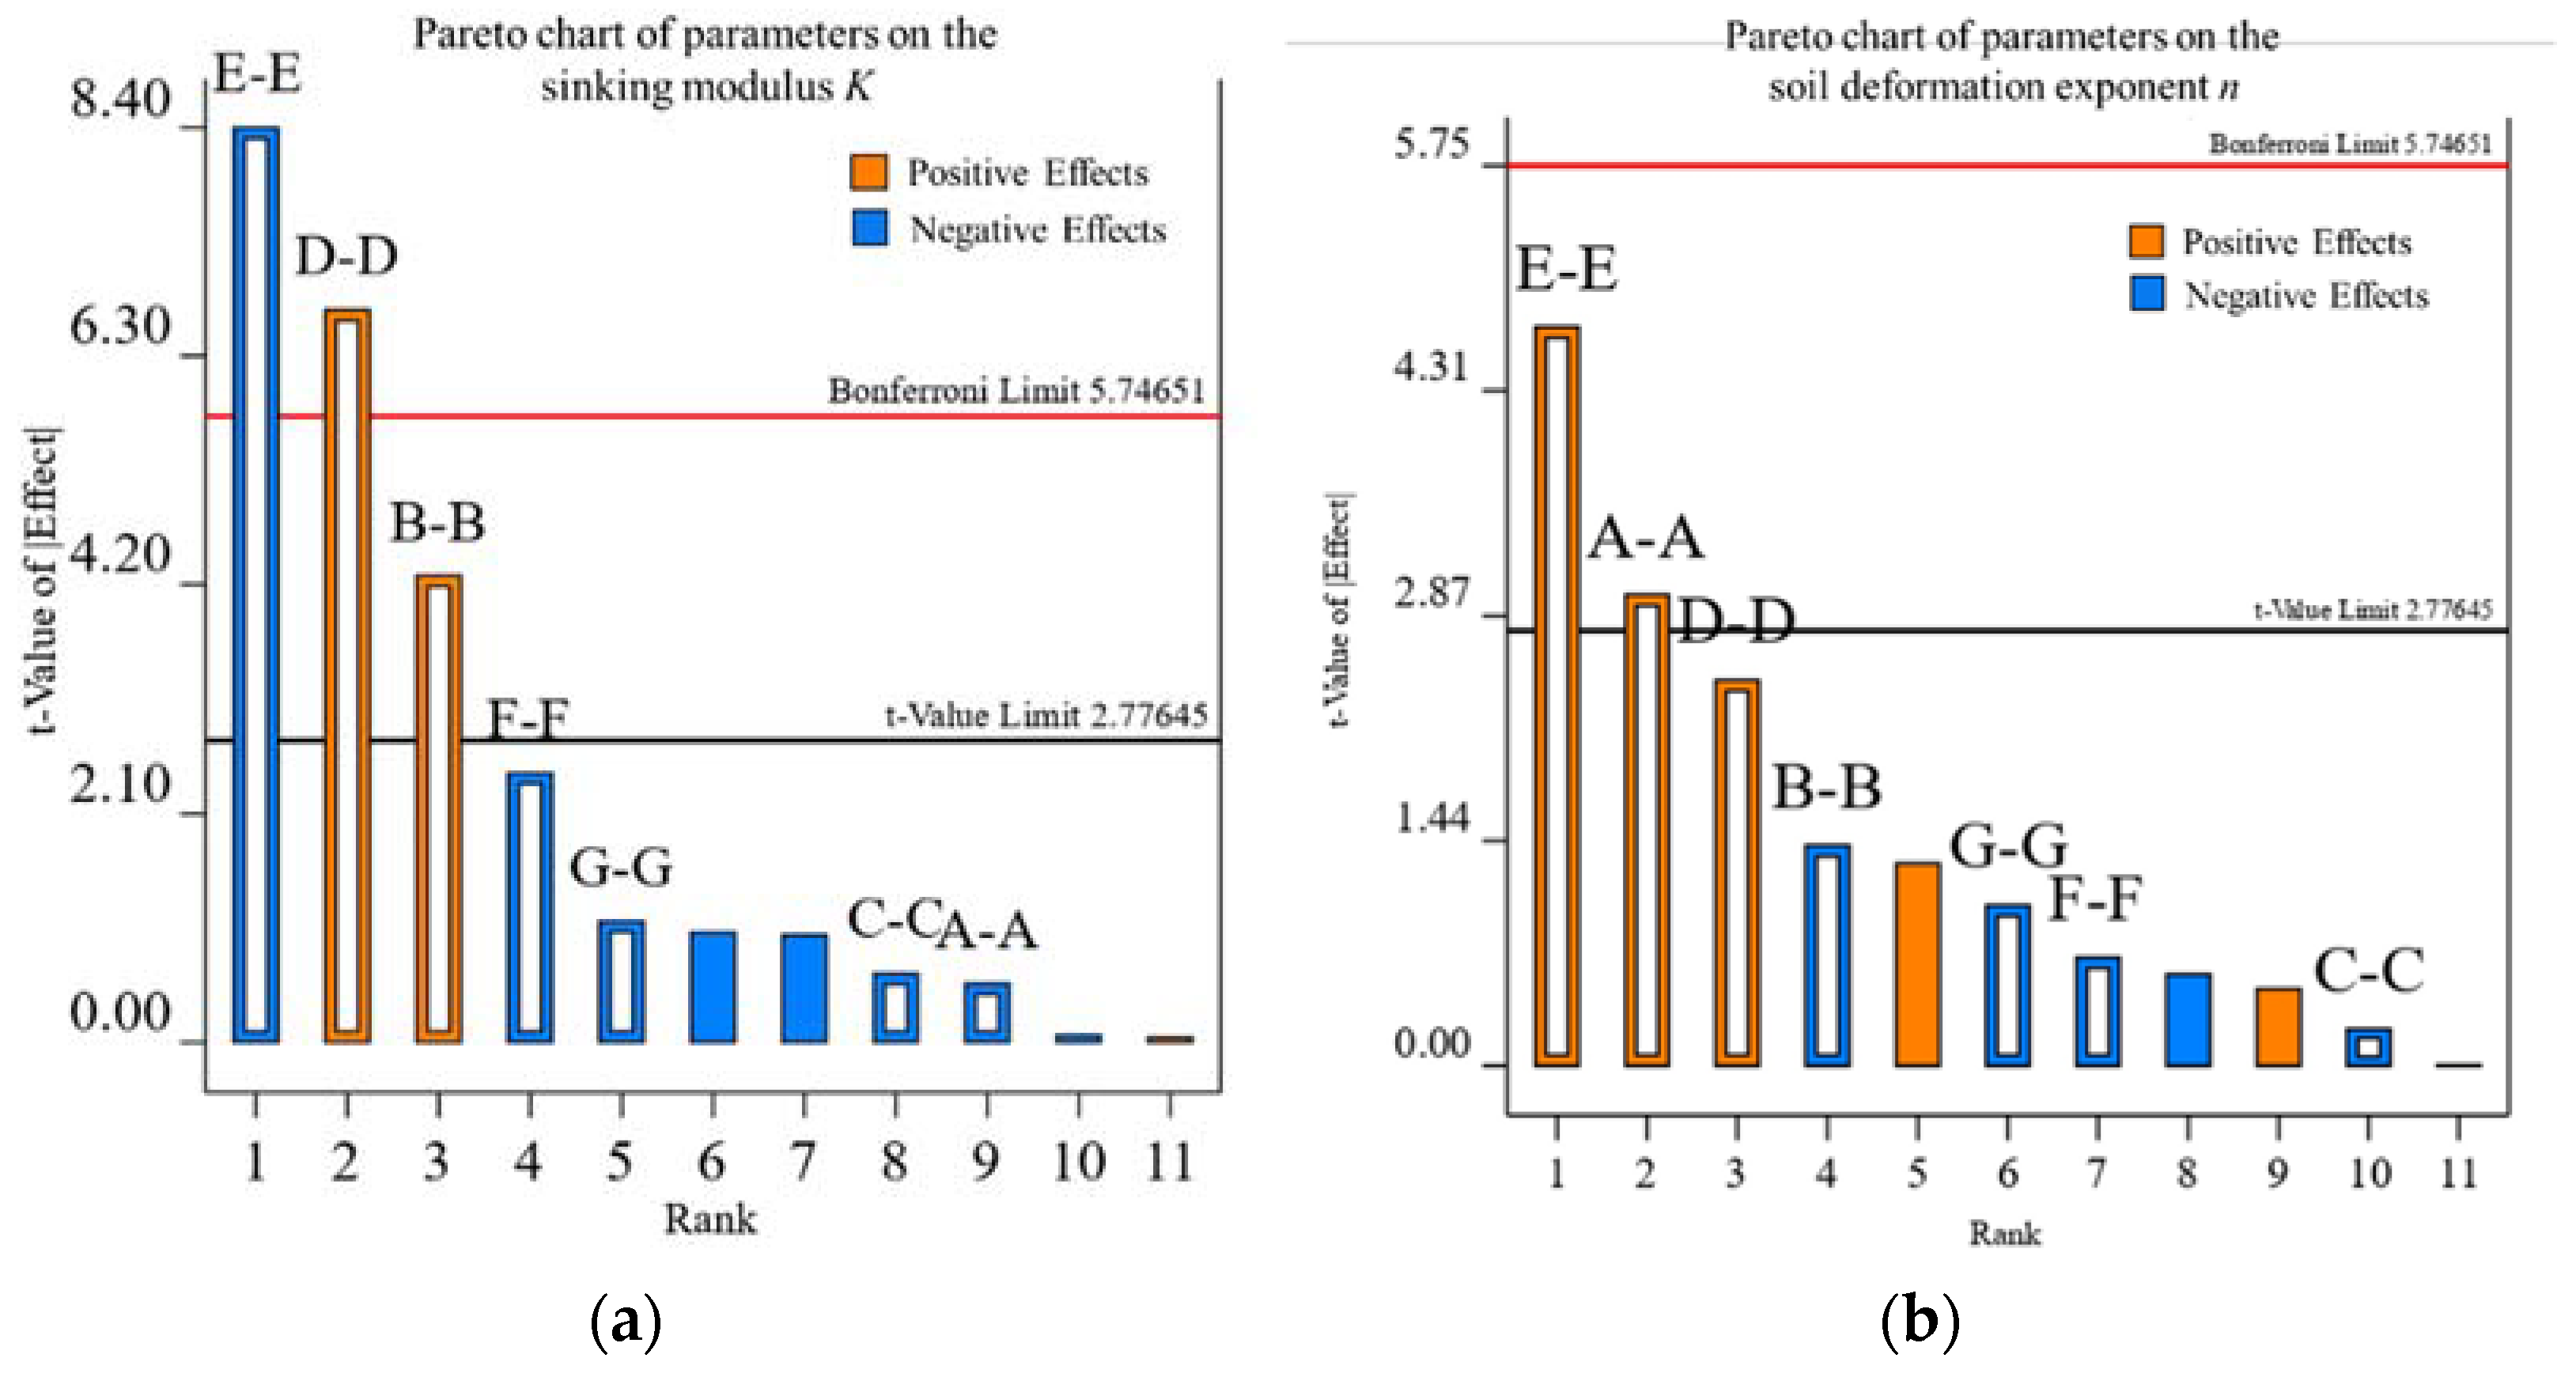
Table 3. Due to the large number of parameters, it is difficult to calibrate them directly. A sensitivity analysis of the above parameters to the pressure–sinkage relationship was first carried out by the Plackette–Burman (PB) test with 11 factors and 1 central point. Four parameters were identified for calibration through sensitivity analysis, as shown in
Table 4.
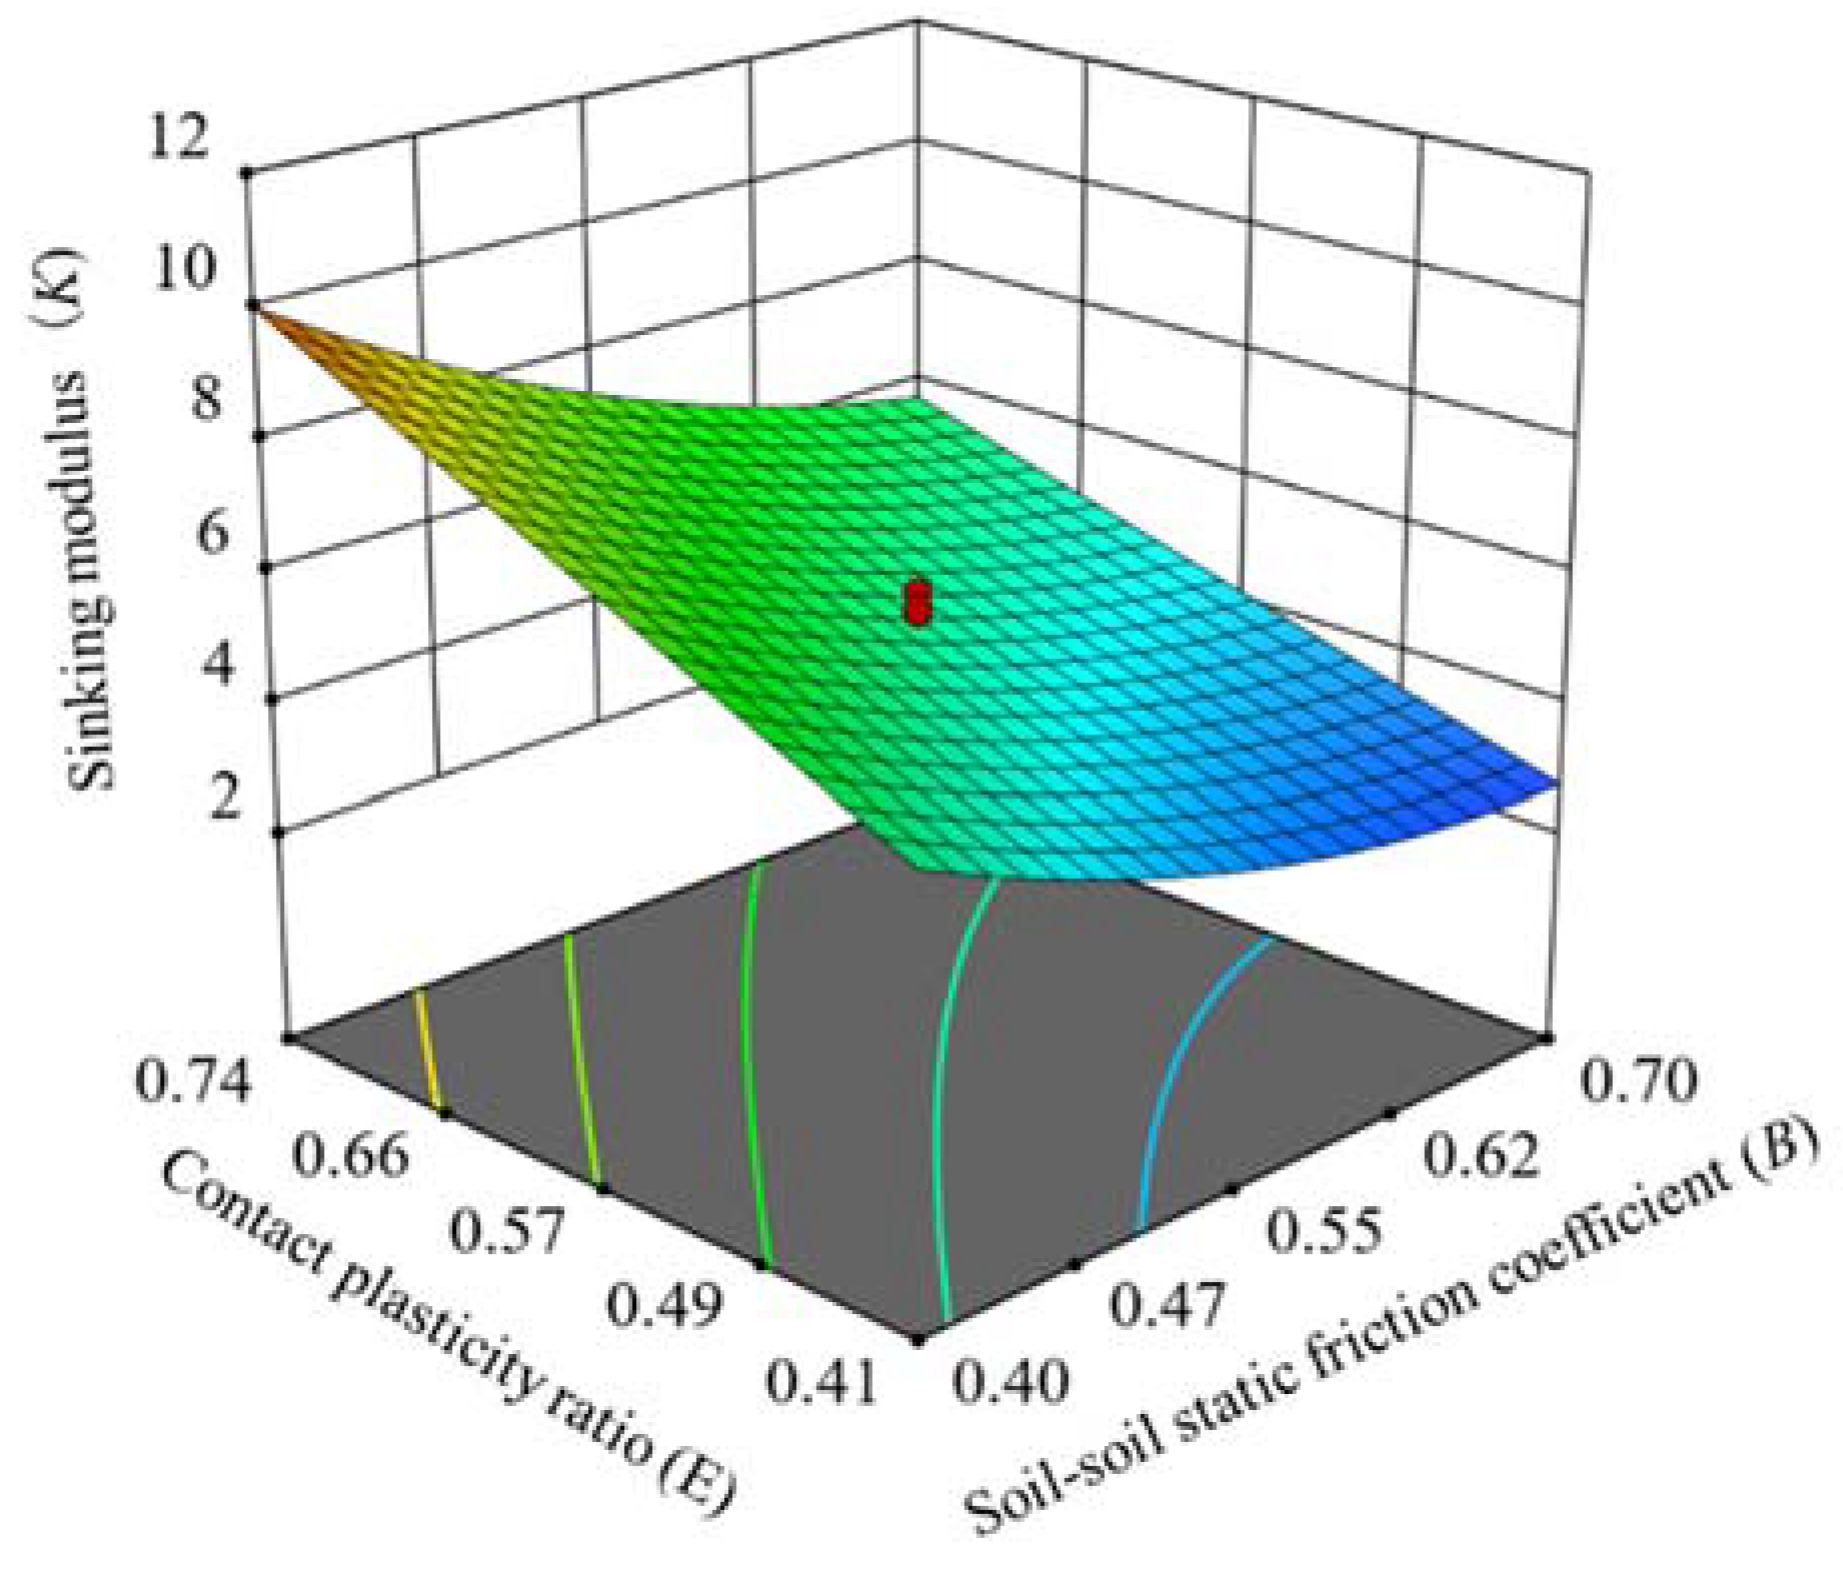
Parameter combinations can be optimized through the Central Composite (CC) test. The relationship between the characteristic parameters (sinking modulus
K and soil deformation exponent
n) and the sensitive DEM parameters could be analyzed by regression analysis of experiments near the centroid, and mathematical models of the influencing factors and response variables were developed. The test parameter level is shown in
Table 4. Other insensitive parameters follow the middle level in the PB test. Considering the randomness of the DEM simulation [
13], 10 trials with the same parameters were repeated and averaged.
2.6. Verification Experiment
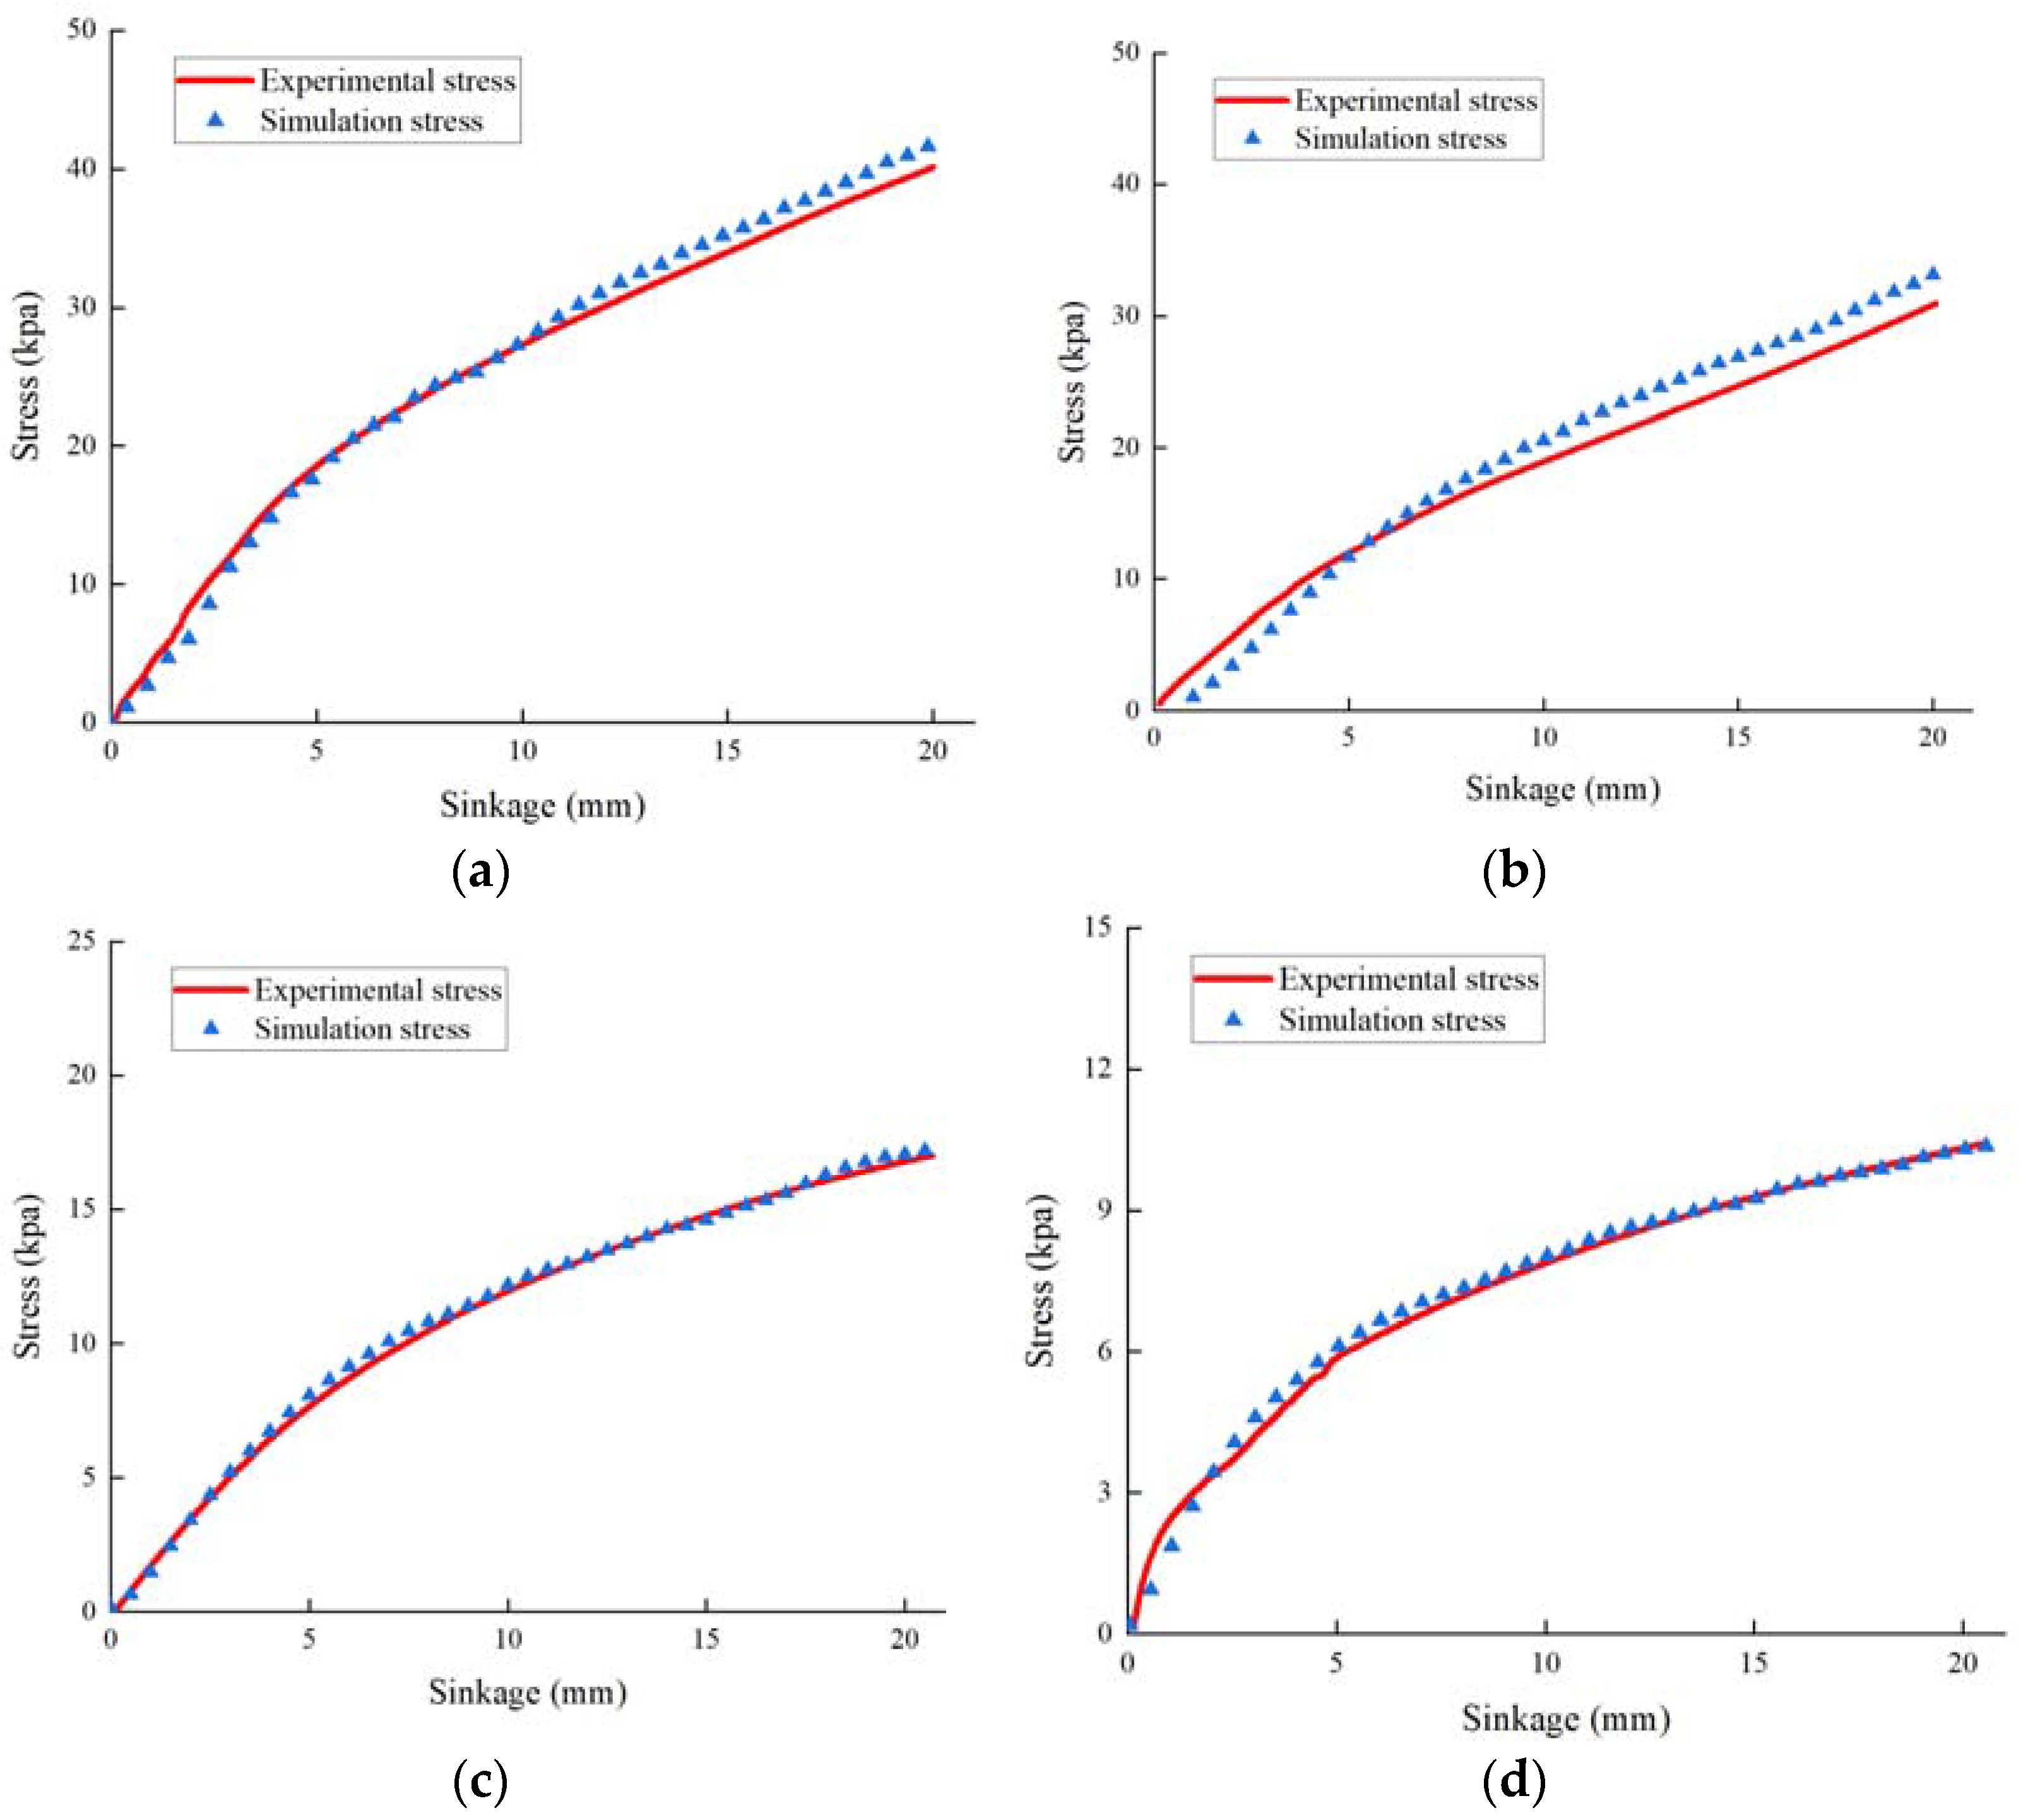
Two methods were used to verify the validity of the simulation model. The first method was the comparison of the pressure-sink curves and characteristic parameters (
K and
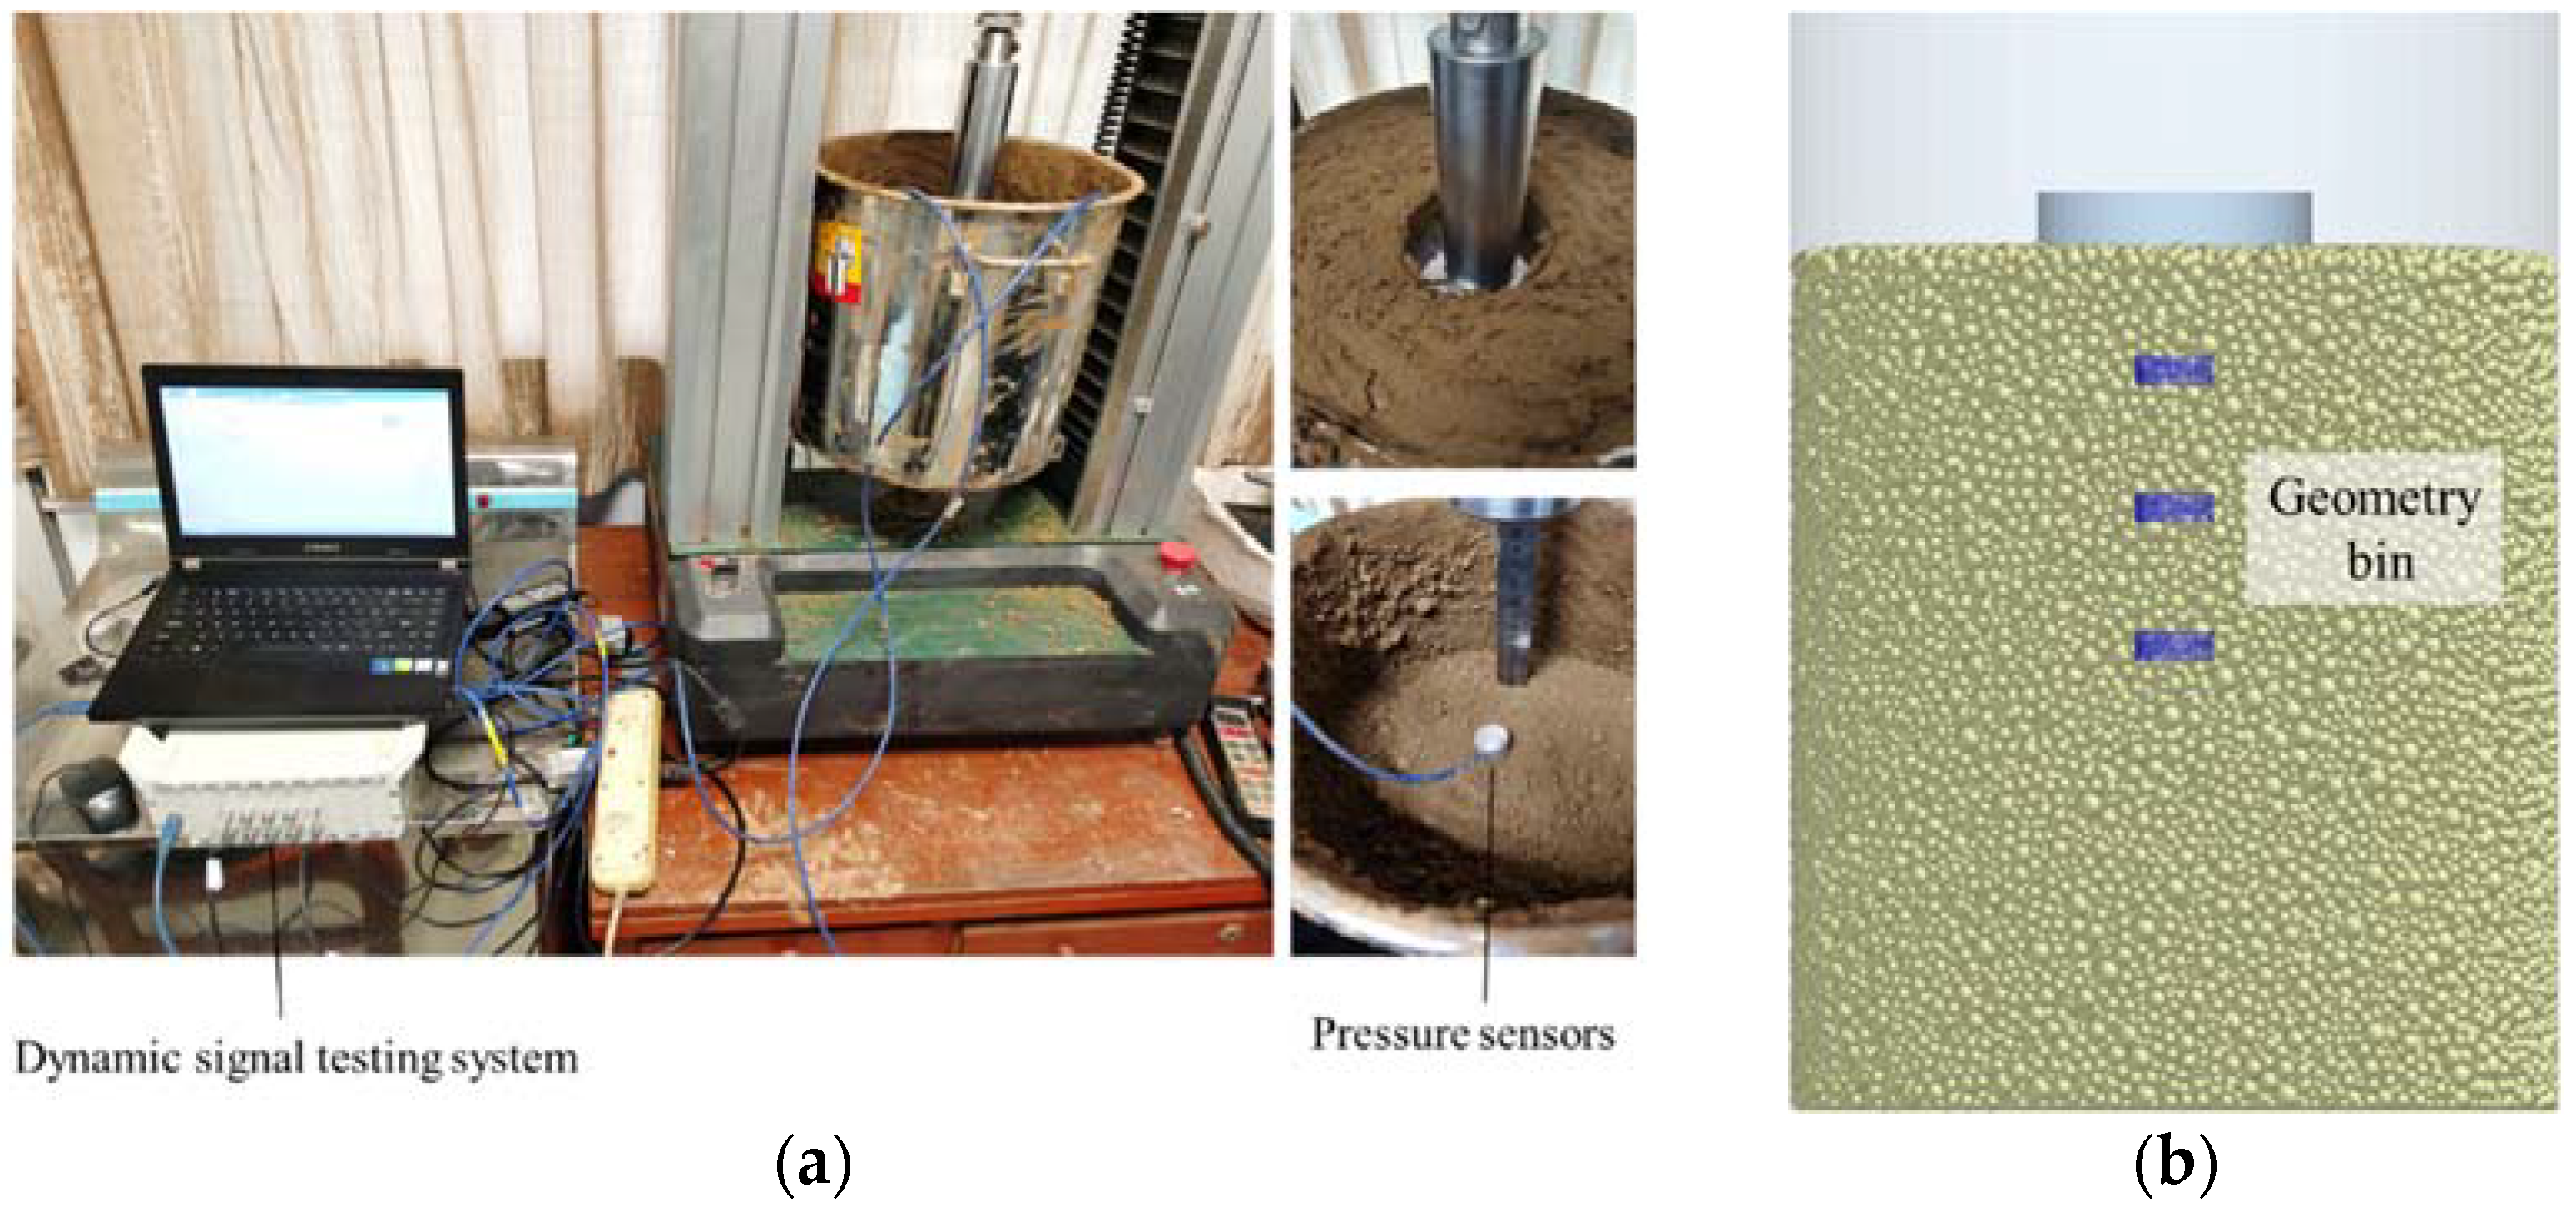
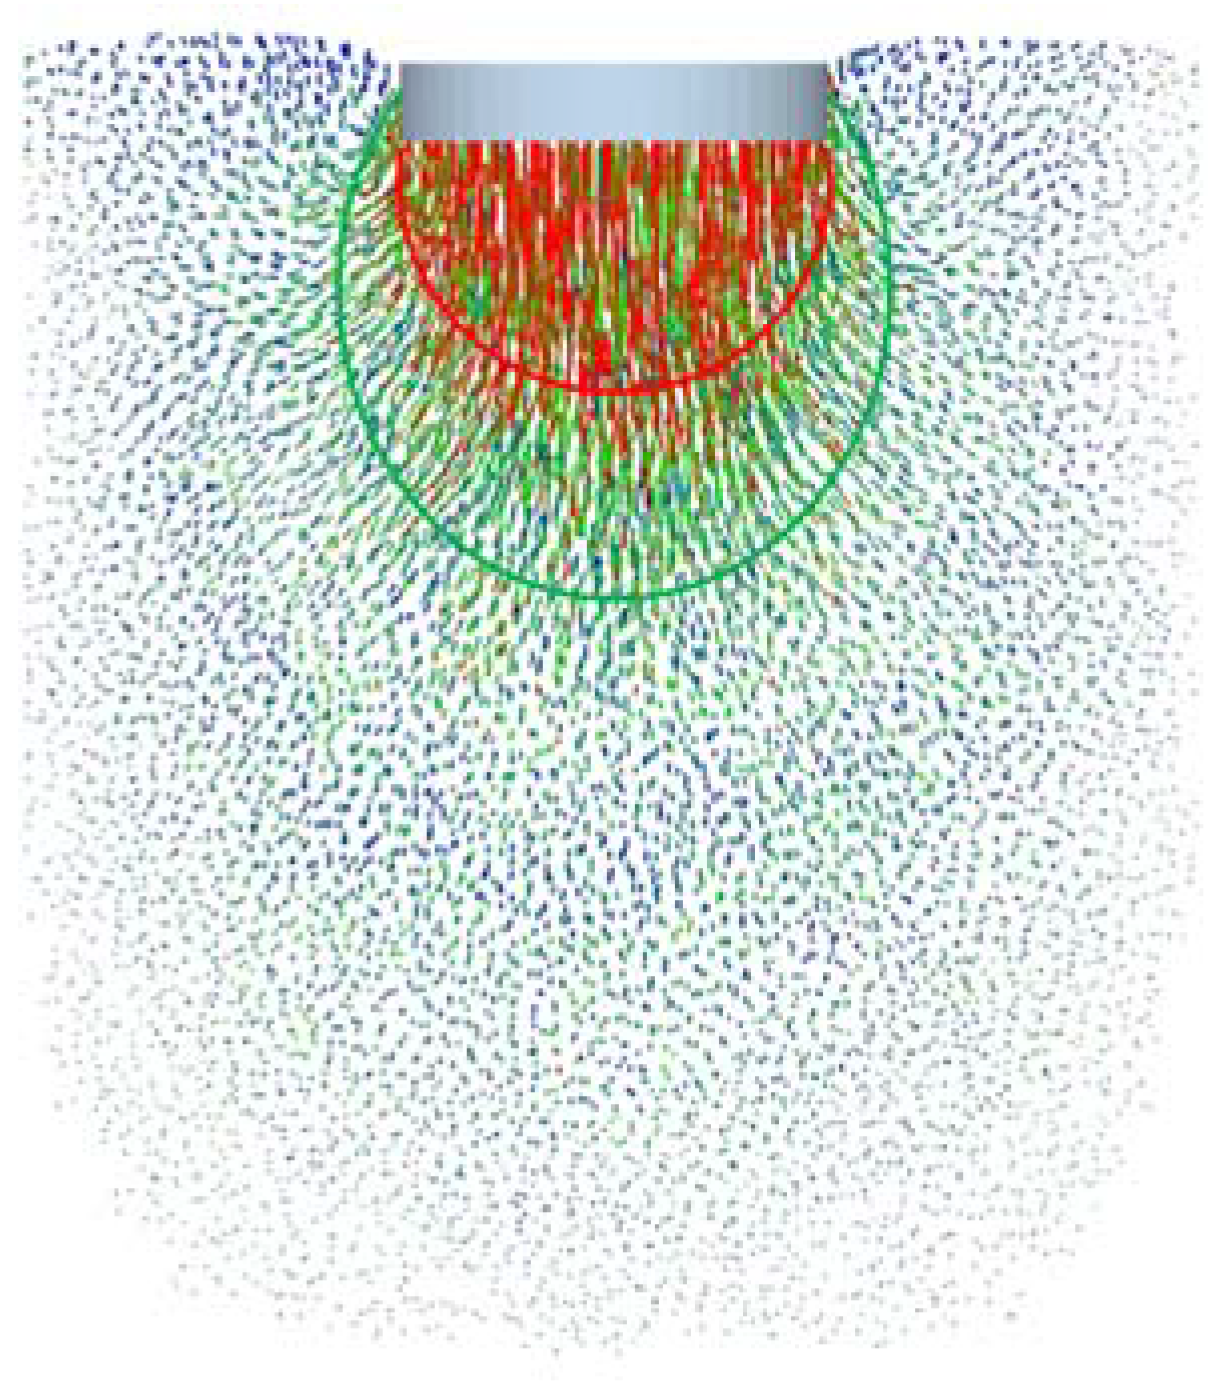
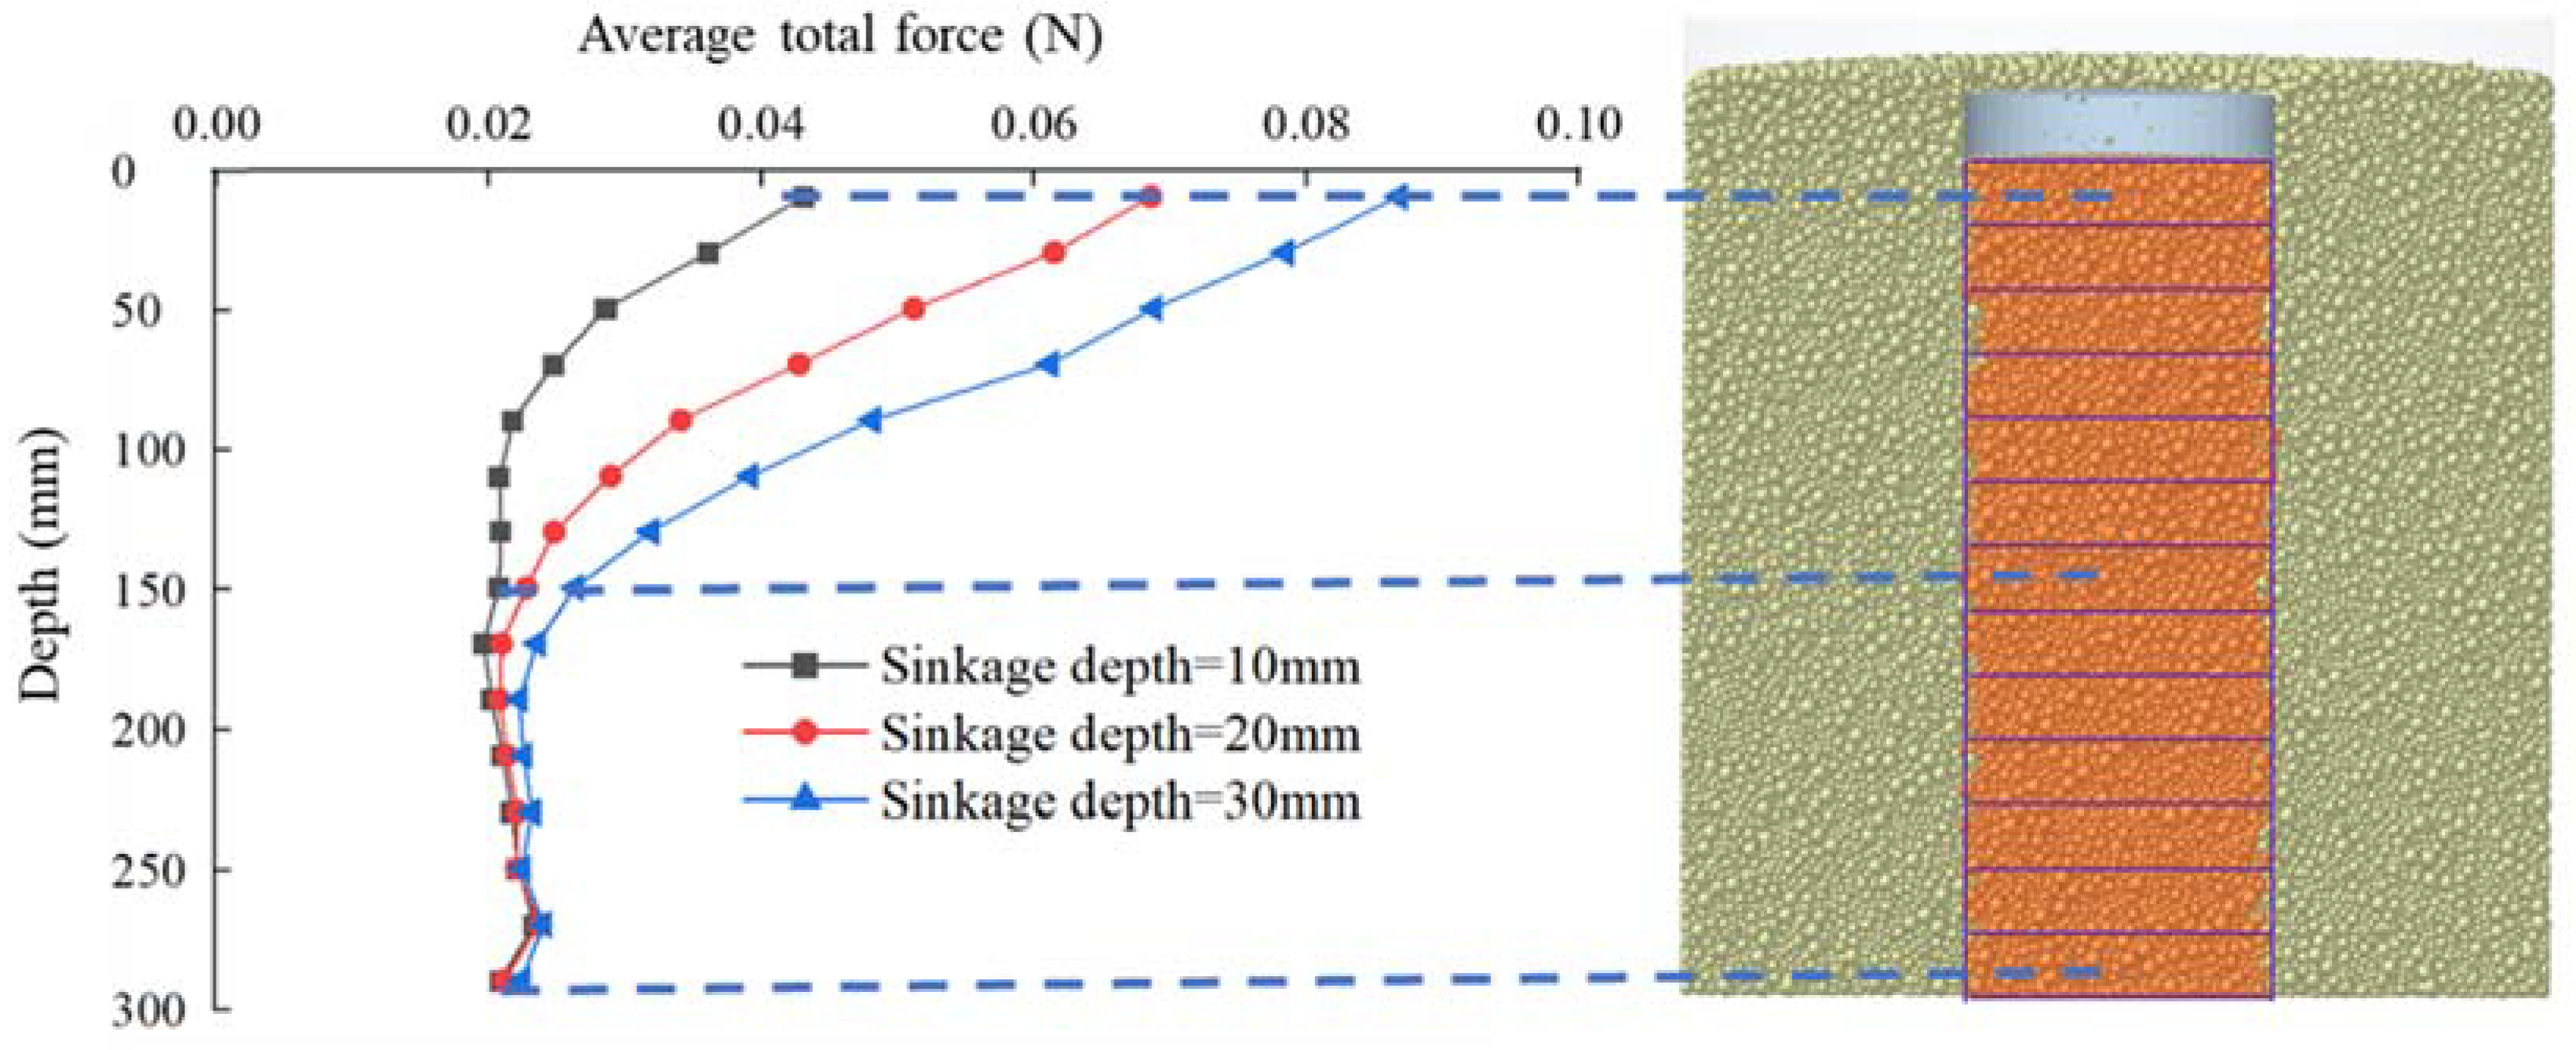
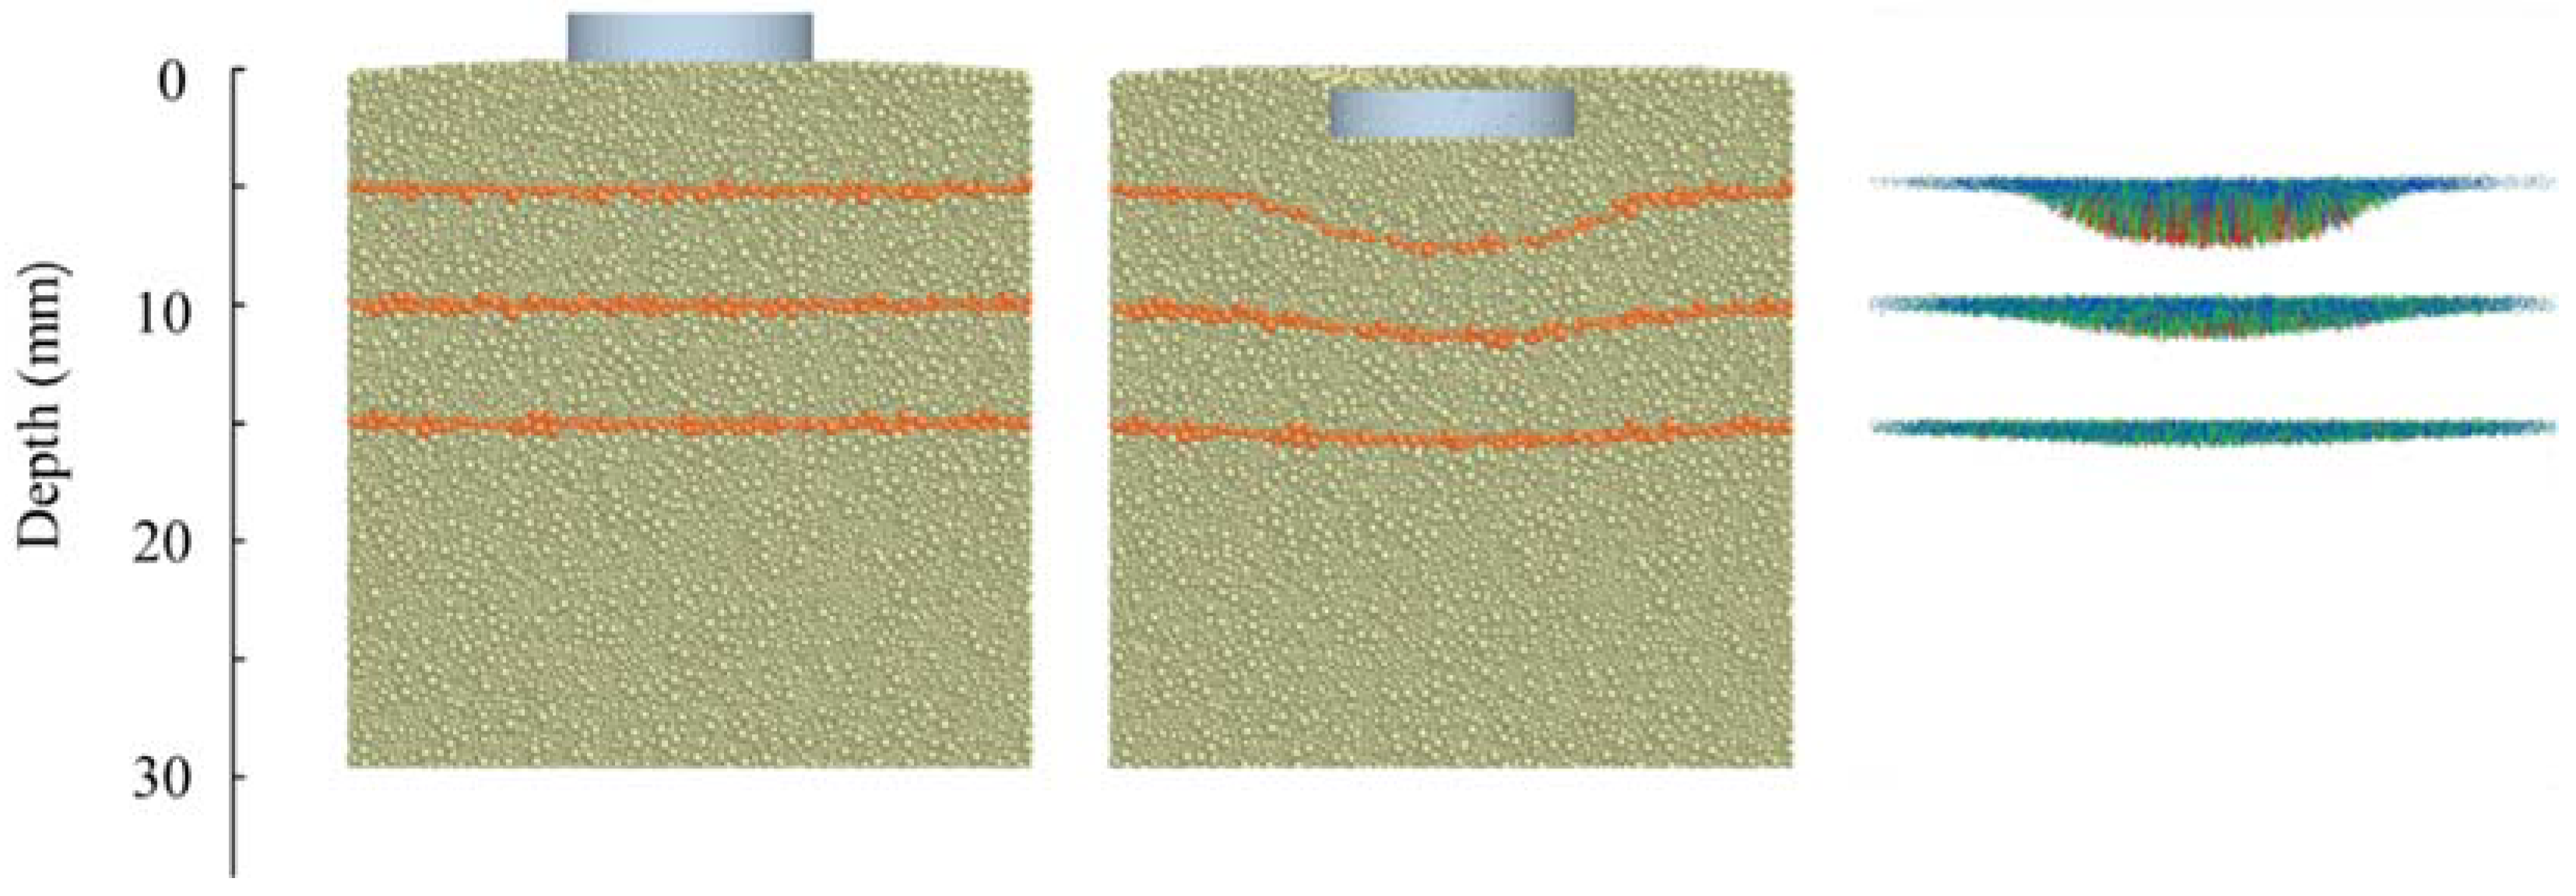
n) between experimental and simulation results using calibration results. The second method was the comparison of soil internal stress at different depths obtained from experiments and simulations. The dynamic signal test system (DH5922N, Donghua, Taizhou, China) and pressure sensors were used to test internal soil stress. The sensors were placed inside the soil below the plate at depths of 50 mm, 100 mm, and 150 mm, respectively, as shown in
Figure 2a. In the simulation, three geometric bins were arranged inside the soil at the same position as shown in
Figure 2b. The soil moisture content was 22.7% in the verification experiment.
