Article

Performance of a UHF RFID Detection System to Assess Activity Levels and Lying Behaviour in Fattening Bulls

1
Department of Sensors and Modelling, Leibniz Institute for Agricultural Engineering and Bioeconomy e.V., Max-Eyth-Allee 100, 14469 Potsdam, Germany
2
Department of Veterinary Medicine, Institute of Animal Hygiene and Environmental Health, Freie Universität Berlin, Robert-von-Ostertag-Str. 7-13, 14163 Berlin, Germany
*
Author to whom correspondence should be addressed.
AgriEngineering 2024, 6(2), 1886-1897; https://doi.org/10.3390/agriengineering6020110
Submission received: 26 March 2024 / Revised: 11 June 2024 / Accepted: 18 June 2024 / Published: 20 June 2024
(This article belongs to the Section Livestock Farming Technology)

Abstract

:
Animal welfare strongly influences the health and performance of cattle and is an important factor for consumer acceptance. One parameter for the quantification of health status is the lying duration, which can be deployed for the early detection of possible production-related illnesses. Usually, 3D-accelerometers are the tool to detect lying duration in cattle, but the handling of bulls sometimes has special requirements because frequent manipulation in daily farming routines is often not possible. An ultrahigh-frequency (UHF) radio-frequency identification (RFID) system was installed in a beef cattle barn in Germany to measure the activity and lying time of bulls. Such UHF RFID systems are typically used for estrus detection in dairy cows via activity level, but can also be considered, for instance, as an early detection for lameness or other diseases. The aim of the study was to determine whether the estimations of activity level and lying duration can also be traced in husbandry systems for fattening bulls. Two groups of bulls (Uckermärker cattle, n = 10 and n = 13) of the same age were equipped with passive UHF RFID ear transponders. Three cameras were installed to proof the system and to observe the behaviour of the animals (standing, lying, and moving). Furthermore, accelerometers were attached to the hind legs of the bulls to validate their activity and lying durations measured by the RFID system in the recorded area. Over a period of 20 days, position (UHF RFID) and accelerometer data were recorded. Videos were recorded over a period of five days. The UHF RFID system showed an overall specificity of 95.9%, a sensitivity of 97.05%, and an accuracy of 98.45%. However, the comparison of the RFID and accelerometer data revealed residuals (ԑ) of median lying time (in minutes per day) for each group of ԑGroup1 = 51.78 min/d (p < 0.001), ԑGroup2 = −120.63 min/d (p < 0.001), and ԑGroup1+2 = −34.43 min/d (p < 0.001). In conclusion, UHF RFID systems can provide reliable activity and lying durations in 60 min intervals, but accelerometer data are more accurate.

1. Introduction

One way to evaluate the health and comfort of cattle is to measure lying behaviour and activity levels. Lying time is an indirect marker for rumination time. Bulls spend 63.4% of rumination time lying down and only 36.5% of rumination time in a standing position [1]. Additionally, reductions in lying time hint at lameness or other diseases caused by housing conditions [2]. Farmers are highly interested in innovative, digital, and affordable technology that provides early detection of illness, a better overview of the herd, and reliable real-time data from their animals [3]. However, there are disadvantages to using accelerometers to observe fattening bulls because their fast growth necessitates adjustments of the attachment straps every three weeks. This scenario is reasonable for research questions but may not be practicable for daily farming routines. Based on safety aspects, this method is also not recommended for farmers working in bull husbandry [4]. The frequent capturing of the bulls for adjustment purposes may result in higher risk exposure for employees and the higher occurrence of stress for the animals. Therefore, UHF RFID can represent an animal- and customer-friendly alternative for monitoring fattening bulls or other species in which accelerometers attached to the leg are not feasible, because the passive sensor ear tag only needs to be equipped once.
Radio-frequency identification first appeared in herd management in the 1970s [5]. The first application was to assign specific information from an individual sensor to a specific animal in a certain moment [6,7,8]. RFID systems have been used to measure feeding behaviour in feedlot steers [9] as well as activity levels in dairy cows [10]. In dairy production, it is a valid method for detecting the ovulation date [11] by measuring activity. One common system uses UHF RFID antennas, which are placed in different spots around the barn, and cows equipped with sensor ear tags. The use of systems such as the one in our experiment was validated in recent years for measuring activity and feeding behaviour [12].
The objective of our study was to determine whether the UHF RFID setup we used is also suitable for collecting behavioural measurements from bulls on a smaller scale. Feedlot pens mostly provide an area smaller than 50 m2 for European standards (minimum 4 m2 per cattle as recommended by the European Food Safety Authority, EFSA). Therefore, the UHF RFID system must be very accurate to prevent false-positive events. Our hypothesis was that a UHF RFID system can reliably detect each motion of the bulls and can be used to accurately measure activity and lying times in fattening bulls.

2. Materials and Methods

2.1. Animals and Housing

The study took place in a typical closed German barn for feedlot cattle located in Groß Kreutz (52° 24′ 13.856″ N 12° 46′ 50.736″ E; Brandenburg). A total of 23 bulls aged 14 months ± 14 d with an average weight of 600 kg ± 50 kg were equipped with UHF RFID sensor ear tags to measure activity levels and lying behaviour. The animals were divided into two groups. Both groups were kept in a pen with an area of slatted floor with two bowl watering troughs. Thirteen bulls were kept in a pen with a concrete slatted floor (CSF), and 10 bulls were kept in a pen with a slatted floor with rubber mats (RM). Group 1 was held on the CSF and Group 2 on the RM. Group 1 had a total area of 49.72 m2 with dimensions of 13.20 m × 4.11 m (4.03 m2/bull), and the pen was subdivided into two connected areas through a concentrate feeding station (FS) in the middle of the pen. The FS split the compartment into two areas, which were connected through a gap with dimensions of 1.8 m × 1.90 m (Figure 1a). Group 2 (Figure 1b) was kept in a pen with dimensions of 13.20 m × 3.47 m and a total area of 40.25 m2 (3.83 m2/bull); the pen had one FS on each side. Every bull was labelled with a number using animal marking spray on both flanks to facilitate recognition on the video recordings. The bulls were fed twice a day with TMR (90% corn silage, 7.1% rapeseed extraction meal, 2% straw, 0.6% vilomin, 0.2% feeding lime, and 0.1% animal feed salt). They also had access to the concentrate feed machine, which was limited to three meals (pellets consisted of live yeast, selenium, and other major and trace elements and vitamins) a day and 2 kg per bull and meal.

2.2. Radio-Frequency Identification (RFID)

All 23 bulls were equipped with passive transponder ear tags (CattleData GmbH, Augsburg, Germany). The ear tags were attached in advance to add FSs to the pens with sensors that could recognize cattle ear tags. Each pen had two UHF RFID antennas (CattleData GmbH, Augsburg, Germany) for the detection of activity levels and one (Group 2) or two antennas (Group 1) for the detection of TMR intake (detection of the head of a bull in the area of the feed alley). The pen of Group 1 was divided into two areas by the FSs and, therefore, needed two feeding antennas, whereas Group 2 only needed one feeding antenna because there was no division. Feeding antennas were installed at a height of 2.84 m and in line with the feeding fence. Antennas for activity detection were placed at the back of the barn at a height of 2.57 m (Figure 1). The main difference between the antennas was that the activity antennas had an elliptical range with a diameter of approximately 10 m, whereas the feeding antennas had a narrow beam down to the feeding fence and a wide beam to the sides (7.5 m to the left and the right).
An electromagnetic wave was sent to a chip inside the ear tag via the antennas. The wave loaded the chip, and an understated wave was sent back to the antenna, which detected the signal and identified the animal. When an ear tag switched from the electromagnetic field of one activity antenna to another, the bull was recognized, and this event was recorded as a movement called a zone transition (ZT). The disadvantage of this technique is that it could only recognize ZTs between antennas rather than exact locations, such as with a global positioning system.
The change in registry between activity antennas was called a ZT and represented a moment of movement. An absence of ZTs over a long period was considered to reflect resting behaviour. Since we could not assume that a short absence of ZTs indicated a lying-down event, we set a threshold that would guarantee a complete rest. Thus, we assumed that the absence of ZTs for 30 min indicated a potential lying-down event, but only the absence of a movement for 60 min strongly indicated that lying behaviour occurred.

2.3. Video Analysis

Three video cameras (Amazon Blink outdoor security camera, Amazon Europe Core S.à.r.l., Luxembourg) were installed 2.20 m above the ground to proof the UHF RFID system. Two cameras were used to record the divided pen of Group 1, and one camera was used to record the pen of Group 2. Video recordings were conducted over a period of five days in May/June 2022. For the performance test of the UHF RFID system with video data, a total of 09:43:52 h on Day 1 (12:29:16 to 21:43:08), 09:25:06 h on Day 2 (11:28:08 to 20:53:14), 14:27:41 h on Day 3 (07:01:02 to 21:28:43), 14:13:32 h on Day 4 (07:18:59 to 21:32:31), and 14:26:21 h on Day 5 (06:57:31 to 21:23:36) were analysed, resulting in a total of 62:16:32 h of video data.
Using BORIS (v.8.6.5, Department of Life Sciences and Systems Biology, University of Torino, Italy), one person manually labelled all bulls’ movements. When a bull walked from one compartment of the pen to another and was recognized by RFID, this was defined as a “true ZT”. If the animal was standing or lying between the two antennas and only moved its head, but was also recognized by RFID (i.e., did not walk to a different area), this was defined as a “false ZT”. Subsequently, each ZT was compared with the video from that interval to determine whether it was a true or false ZT.

2.4. Accelerometer

Ten bulls (five of each group) were equipped with one IceTag3D™ activity sensor (Peacock Technology Ltd., Stirling, UK) on one hind leg. The IceTag3D™ is a noninvasive, electronic sensor that measures animal activity with three-dimensional acceleration technology. The sensor captures data every second and stores data for up to 60 days. The data were manually downloaded via USB with IceReader and IceManager software (IceRobotics, Edinburgh, UK) after detachment. The daily data per bull and lying behaviour were calculated from the activity/lying data per second. Over a period of 20 days (24 May 2022 until 13 June 2022), in addition to lying and activity times, lying bouts were recorded.
For our evaluation, we compared the two systems, using the lying time from the accelerometer as a reference and the calculated lying time from the RFID system.

2.5. Statistical Analysis

For the first part of our performance test of UHF RFID with observations from video recordings, we used binary classifiers, where the positive predictive value represents precision and the recall (the fraction of events that are successfully retrieved) can indicate sensitivity. Furthermore, we calculated the specificity, accuracy, false-positive rate (possibility of a false alarm), and false-negative rate according to the following definitions and formulas:
  • Positives (P): events during which a bull was observed on video to move between two antenna zones.
  • Negatives (N): events during which a bull was not observed on video to move between two antenna zones.
  • True positives (TP): positives also identified in the RFID data of the same bull.
  • False positives (FP): negatives also identified in the RFID data of the same bull.
  • True negatives (TN): negatives not recorded in the RFID data of the same bull.
  • False negatives (FN): positives not recorded in the RFID data of the same bull.
Sensitivity [%] = TP/P × 100
Specificity [%] = TN/N × 100
Precision [%] = TP/(TP + FP) × 100
Accuracy [%] = (TP + TN)/(P + N) × 100
False-positive rate [%] = FP/N × 100
False-negative rate [%] = FN/P × 100
For the second part of the performance test, the data from the UHF RFID and the accelerometer data were tested for normal distribution and linear correlation (Bravais–Pearson). The critical value to determine statistical significance was defined as p < 0.05.
All datasets from the accelerometer and RFID systems were evaluated with JMP 16.1 Ink (SAS Institute Inc., Cary, North Carolina 27513, USA).

3. Results

3.1. Analysing the Activity Data Captured by the RFID System and Cameras

Over a period of five days, videos were recorded of the pens of both groups of bulls, yielding 1743 observed events (mean of 75.78 ± 5.28 events per bull), which were categorized into positives, negatives, and true and false positives and negatives, respectively (Table 1).
Comparison of the two groups revealed that Group 2 had a quite similar possibility of false alarms by a similar specificity and accuracy. Furthermore, Group 1 showed a higher precision and a higher false-negative rate but a lower sensitivity (Table 2).

3.2. Analysing the Lying Times of Bulls from UHF RFID and Accelerometer Data

For all 10 bulls attached with accelerometers, the individual daily lying durations were investigated for both sensor systems. The mean, standard error (SE), and p-value were determined and collected in Table 3. For a better understanding, we compared the durations of the individuals among the groups and for one sensor system as well as in-between accelerometers and UHF RFID sensors.
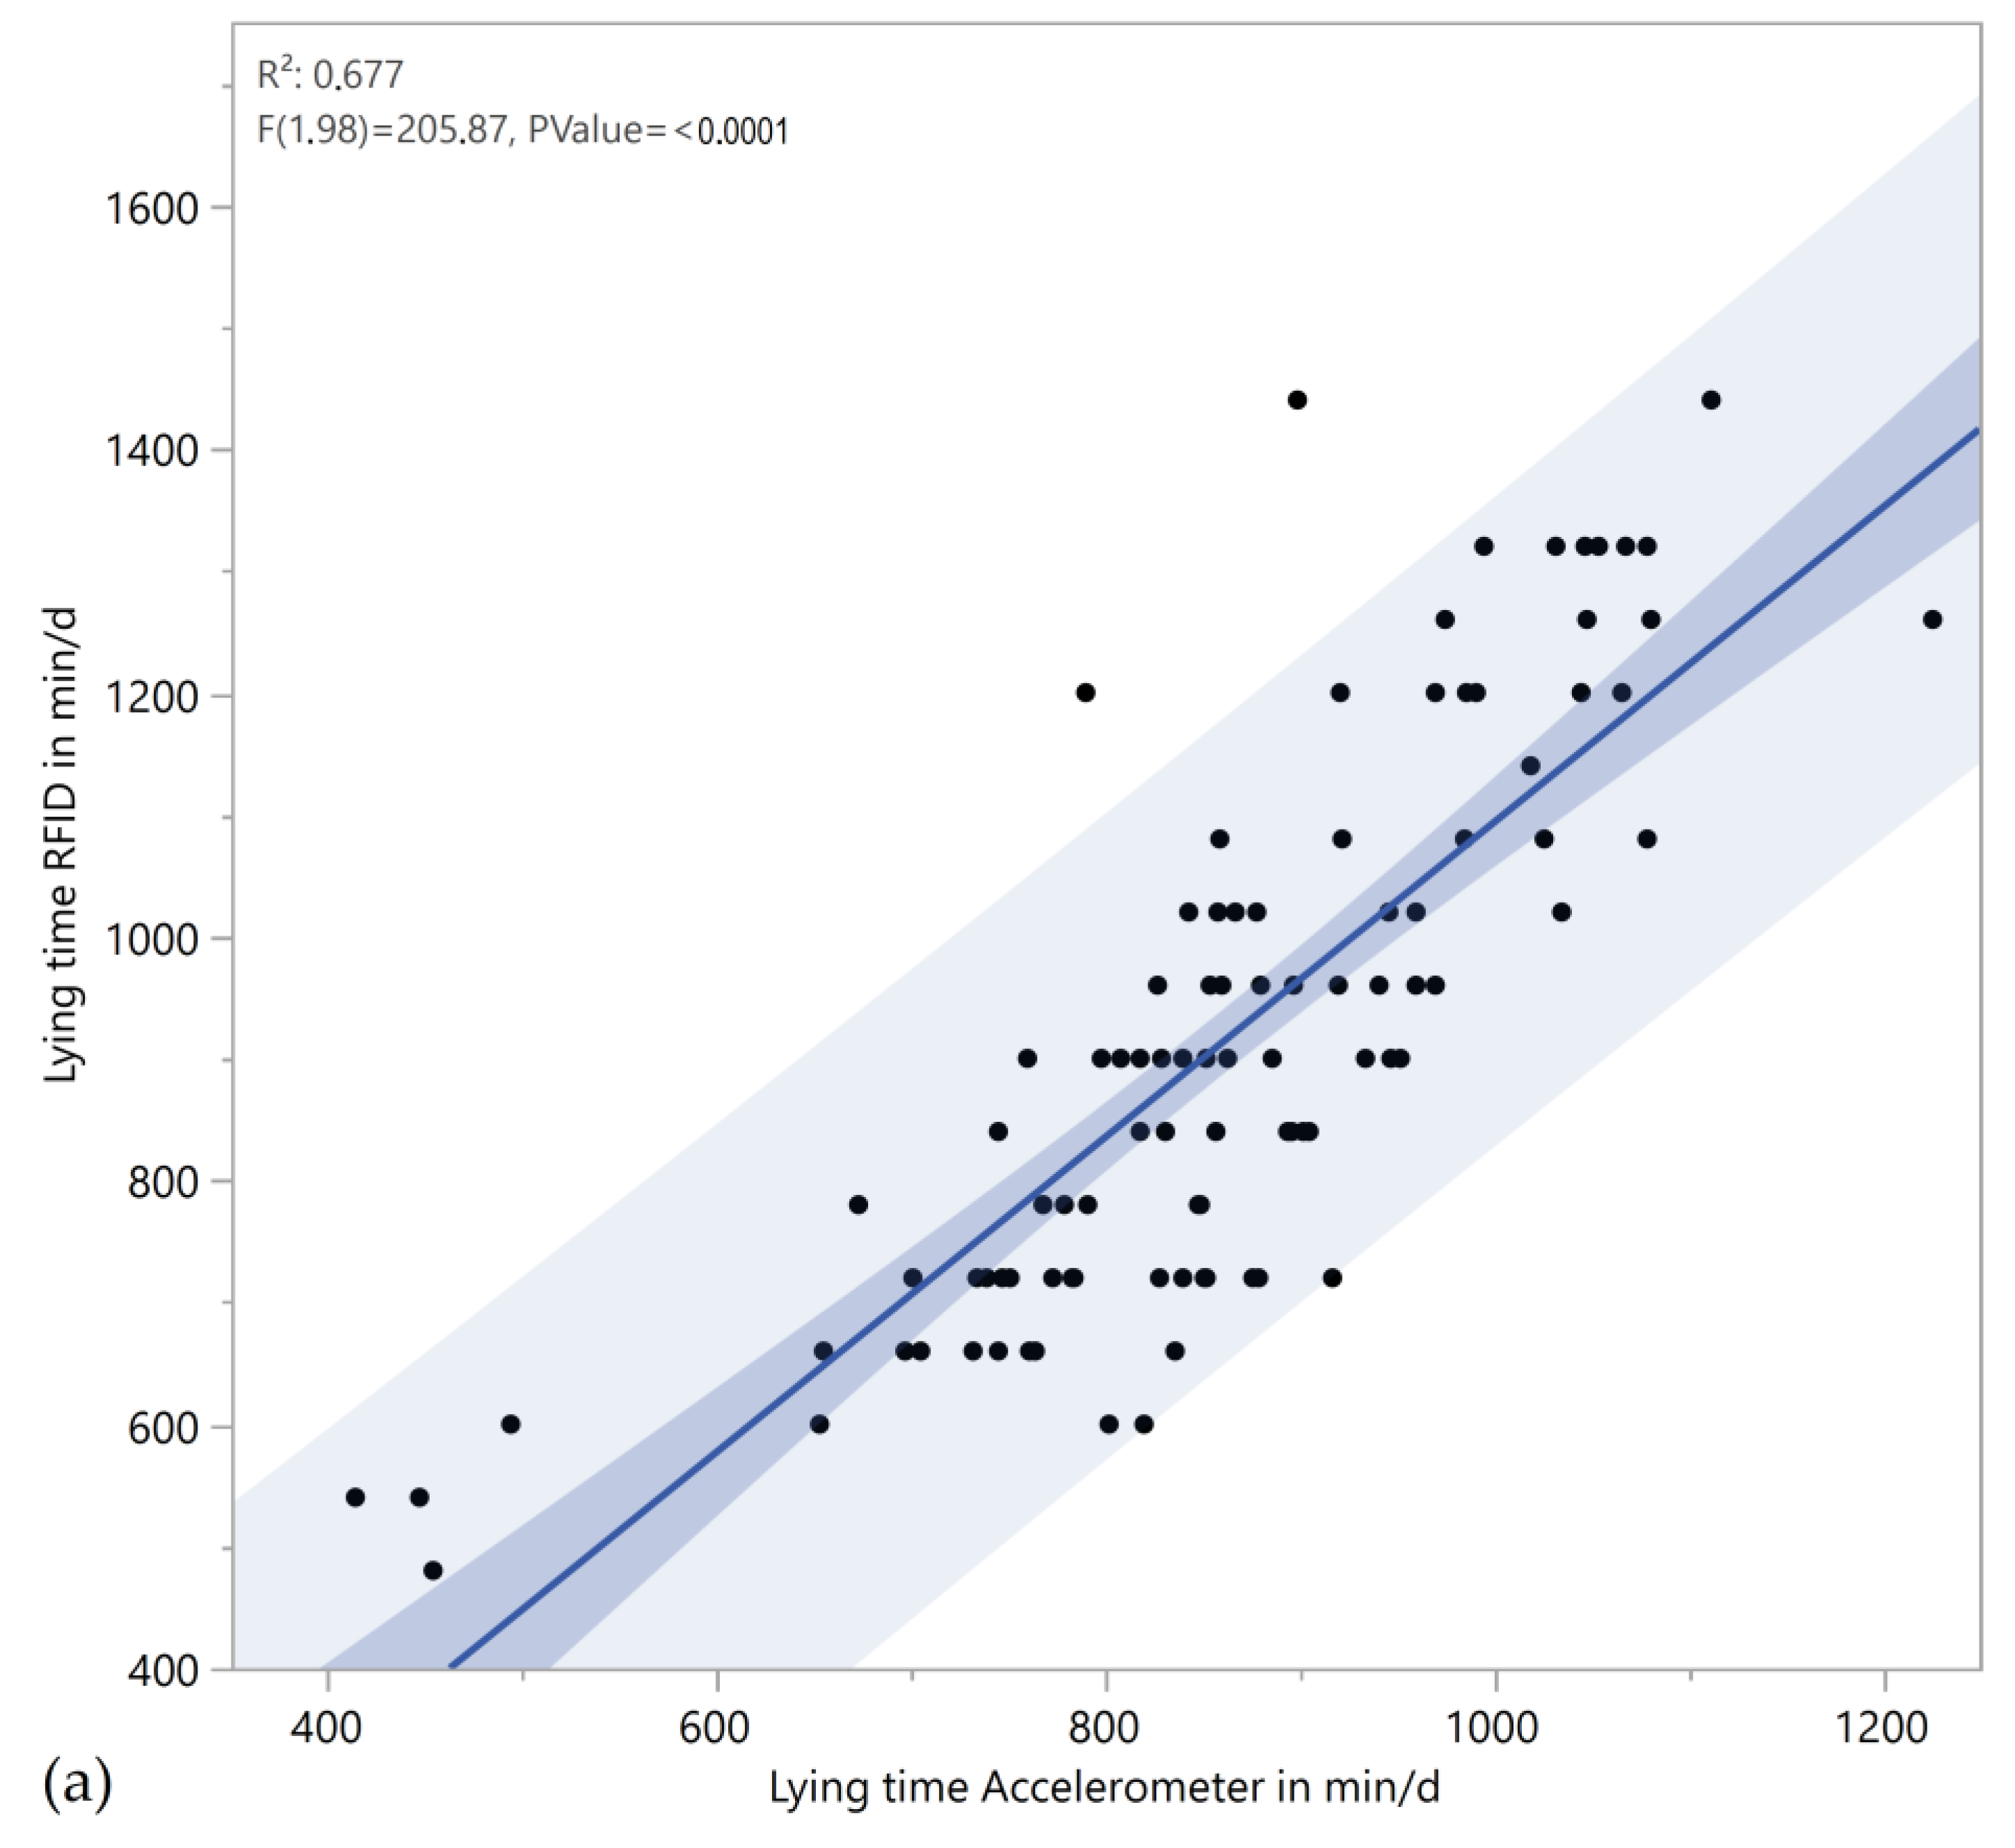
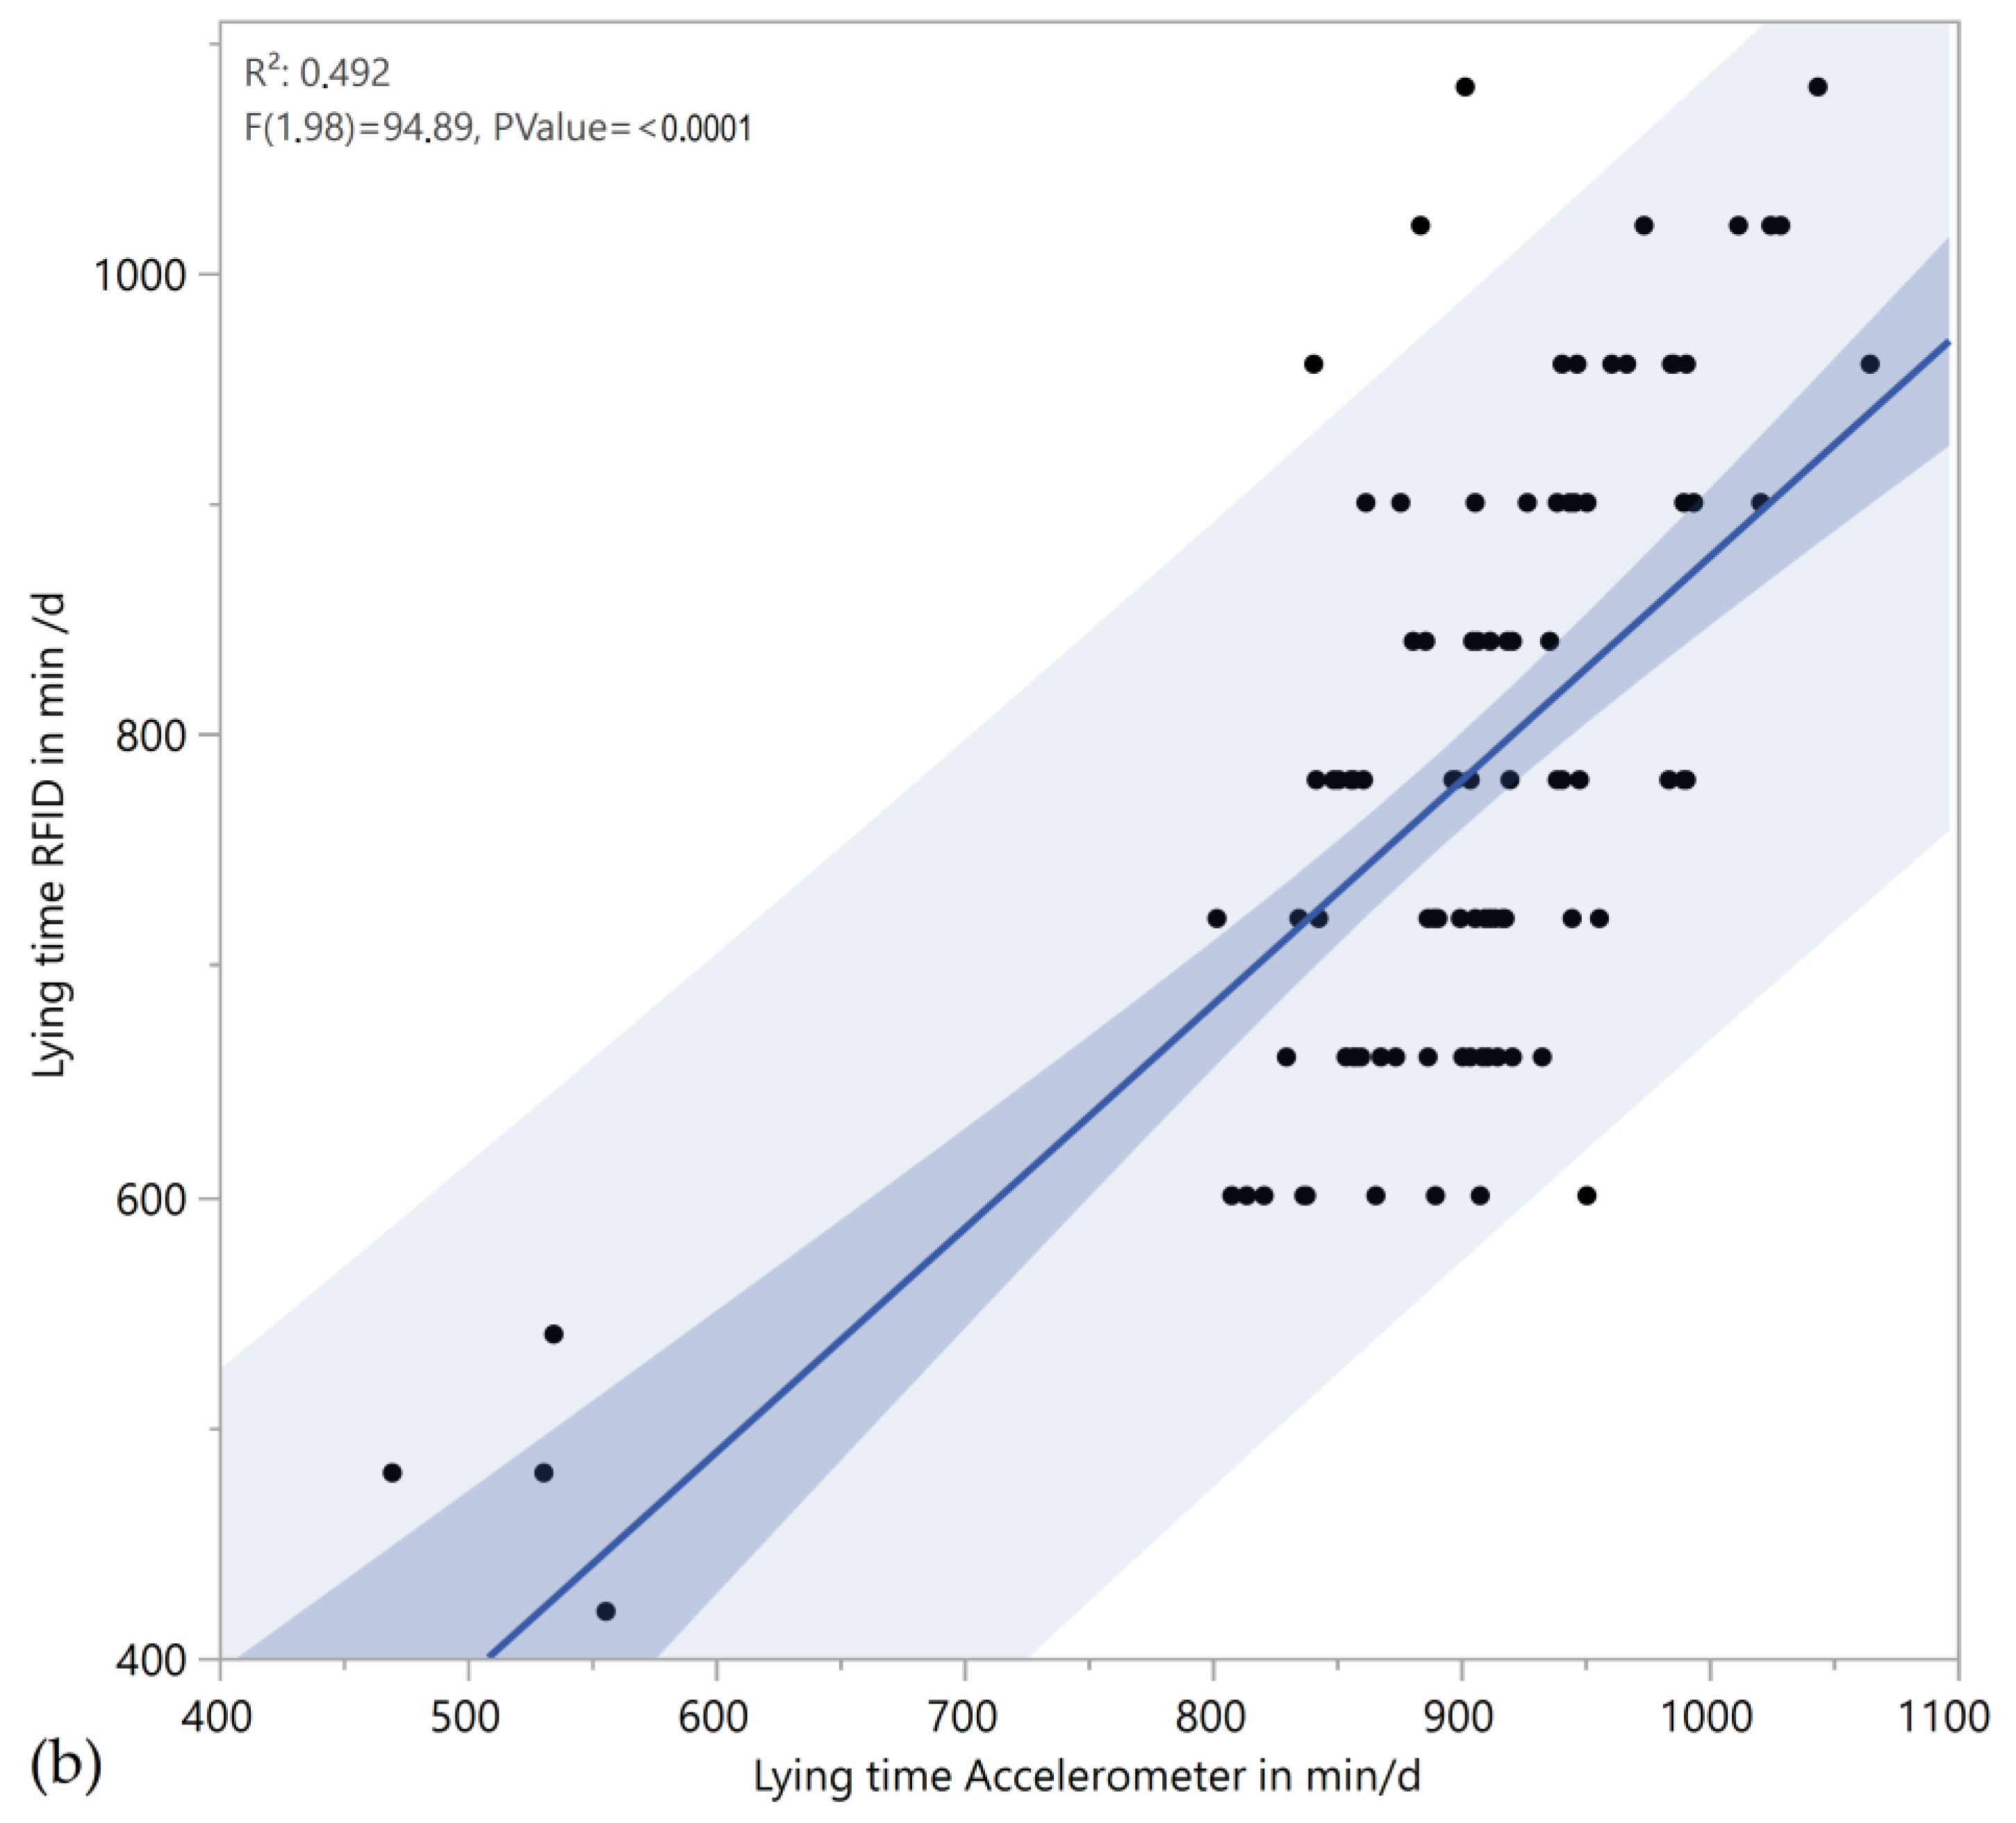
To quantify the deviation from the median between the RFID and accelerometer systems, we calculated the residual (ԑ) for Groups 1+2, Group 1, and Group 2. However, the residual for Groups 1+2 (ԑGroup1+2) was −34.43 min/d, p < 0.001. The 95% confidence interval (CI) for the residual of Groups 1+2 95% CI Group1+2 was [−13.53, −55.33]. The residuals and 95% CIs for Group 1 and Group 2 were 51.78 min/d [79.39, 24.17], p < 0.001 and −120.63 min/d [−100.02, −141.24], p < 0.001. In Figure 2, we present the linear correlation between the mean lying duration of both groups individually and combined. Pearson correlation coefficients (r = √(R2)) were ra = 0.823 for Group 1, rb = 0.701 for Group 2, and rc = 0.686 for Group 1+2.
The interpretation of lying times from ten bulls (five per group) equipped with accelerometer and RFID ear tags resulted in two different distributions. The accelerometer data of Groups 1+2 showed a symmetrical distribution with a median lying time of 893 min/d. The lower quartile was at 835 min/d, and the upper quartile was at 946 min/d, with a minimum of 673 min/d and a maximum of 1112 min/d. The distribution of the RFID data was asymmetric with a leftward shift. The median lying time of the ten bulls was 780 min/d, with a lower quartile at 720 min/d and an upper quartile at 960 min/d. The lowest outlier was 360 min/d, and the highest outlier was 1360 min/d. A clear difference between the distributions of the accelerometer and the RFID was observed (Figure 3).
The leftward shift of the median from the RFID data distribution (Figure 3) was pronounced in Group 2. In this group, the RFID data had a median of 780 min/d, which was different from the accelerometer data median of 908 min/d. Additionally, both quartiles and the minimum lying time were significantly lower in the RFID data for Group 2.

4. Discussion

4.1. Performance Test of the UHF RFID System by Comparisons with Video Observations (the Gold Standard)

The results of the UHF RFID system data with video data were comparable to those of other UHF RFID validation studies in recent publications [9,12]. The average precision was 97.5%, and the average accuracy was 98.45%, which is similar to that of Adrion et al. [12], who used a UHF RFID system to measure head positions in dairy cows and reported a precision of 93.8% and an accuracy of 96.6%. The differences in precision, sensitivity, false-positive rates, and false-negative rates between Groups 1 and 2 could be caused by the constructions of the two pens. False-positive events mostly occurred when a bull lay down in the region in which the two antenna signals intersected; in this case, small head movements triggered ZTs although the animal did not show actual movement/walking activity. False-negative events, on the other hand, occurred if the RFID could not capture activities correctly. One reason for uncaptured activities is the mentioned dead spots. Because Group 1 had its FSs in the middle of the pen, the effect of this dead spot is less than that in Group 2, which had the FSs on the sides. This led to a false-negative rate of 3.44% for Group 1 and 2.33% for Group 2, which is appropriate. This was also visible in the deviation of precision, which was 1.15% higher in Group 1. Thus, we had a higher accuracy (by 0.68%) in this group than in Group 2.

4.2. Comparing the Lying Times of Bulls between UHF RFID Data and Accelerometer Data

The accelerometers (IceTag3D™ activity sensor; IceRobotics, Edinburgh, UK) we used for this study have been validated and customized for use in cattle [13,14,15,16]. Quantifying the locomotion and lying behaviour with these kinds of sensors is a common practice, especially in dairy farming [17]. Nevertheless, their use in beef cattle is much less examined [18]. Lying behaviour, particularly for our study the lying time, has showed to be a valuable parameter for the assessment of animal welfare [2]. The average lying time of a fattening bull was estimated to be 889 ± 12 min/d [19]. Our accelerometer results confirmed this value, with a median of 893 ± 11.39 min/d. Therefore, we can assume that the lying times from the accelerometer data were correct in our study. The motion sensor inside the accelerometer captured the position of steers every second so that we were able to specify the cumulative lying time to within one second. This measurement accuracy was not possible with the RFID technique since we could only assume that an animal did not move within an area during a specific time frame. For this reason, we had to set a time-frame limit based on bout duration. The motivation of cattle to stand is mainly caused by feeding times and operations within the barn [2]. Munksgaard and Simonsen [20] showed that bulls which were forced into prolonged standing for 7 h twice a day would spent almost all of the remaining time (95%) lying down. When it comes to the duration of the single lying bout, the mean bout duration strongly varied from less than 20 min to over 150 min [21]. Furthermore, Jensen et al. [22] suggests that cattle prefer to have lying bouts that last at least 30 min, or even better, 50–80 min. Therefore, the absence of ZTs for 30 min could be considered a potential lying bout, but only the absence of movement for 60 min could guarantee a full rest.
Comparing the mean lying time of the accelerometers, we can see that the animals from Group 2 had a longer daily lying time with 893 min/d than those in Group 1 with 857 min/day. This result may sound plausible since we consider that the bulls in Group 1 were held on CSF and the bulls in Group 2 had a slatted floor with RM. However, Keane et al. [23] oppositely presents no significant effects of RM on lying duration and dirt scores in their study. Similar assertions were made in previous years [24,25]. Nevertheless, Hickey et al. [26] mentioned a longer lying duration on straw bedding compared to CSF in finishing steers. Considering this, we could only witness a minor difference in mean lying durations from accelerometer data of 36 min/d more on RM in comparison to CSF. In comparison, the mean lying durations of RM vs. CSF from the UHF RFID data are 136.2 min/d. The variations in these values apparently are too high to produce a reliable statement for the advantage of one floor type. One objective of the present study was to determine whether we can utilize the movement activity from UHF RFID systems to estimate the lying times of bulls. We chose a linear Bravais–Pearson correlation to compare the results of the calculated lying durations from UHF RFID data with those from accelerometer data (Figure 2). Group 1 held on CSF showed the most linear association with ra = 0.823 (Figure 2a), which indicates a significant positive correlation. In Group 2, we could see a more moderate, but still strong, correlation by rb = 0.701 (Figure 2b). This may also result from the mentioned setup and overlapping signals. The lower correlation coefficient in Group 2 leads to a rc = 0.686 for Group 1+2 in total. Overall, this can be interpreted as a significant positive correlation from UHF RFID lying durations in comparison with accelerometer durations that were already validated [13,15,16,27]. In Group 1, the median lying time according to the RFID data of 900 min/d was very close to our expected outcome of 889 min/d [19]. The problem mentioned above regarding issues with antenna overlap caused an asymmetric distribution of lying time per day in the UHF RFID data, with a leftward shift in Group 2, which led to an equivalent distribution within both groups. Compared with the median lying time according to the accelerometer data of 908 min/d, the low RFID median of Group 2 (720 min/d) can result from a higher number of animals mistakenly rated as active although they were lying down. In contrast, in Group 1, the RFID and accelerometer data indicated a similar median, despite a wider range of quartiles and outliers, and a symmetrical distribution. For Groups 1+2, the residual of the median was −34.34 min/d, indicating that the accelerometer data had an average 34.34 min/d higher lying duration. In contrast, Group 2 had a high negative value of −120.63 min/d. This also supports the assumption that more bulls exhibited false-positive ZTs in Group 2 than in Group 1, with ԑGroup1 = 50.78 min/d. Thus, preventing the overlap of antenna coverage is one way to reduce false-positive events. Because of the elliptical shape of the antenna’s receptive field, it is difficult to prevent overlaps without generating dead spots in which no signal can reach the transponder ear tags. One possible solution would be to place additional antennas with a smaller radius inside the pen. This would create wider coverage with fewer dead spots and minimum overlap.

5. Conclusions

This performance study of a UHF RFID system revealed that it has high precision and accuracy for detecting movements within even small areas under 50 m2. However, the comparison with accelerometer data revealed that the number of false-positive animal movements was still too high to obtain the exact activity and lying times of the analysed bulls. Our first results are promising and show that the deployment of UHF RFID systems has a good perspective for monitoring animal movements in bull husbandry, besides the conventional usage in dairy production. Because UHF RFID systems are suitable for the detection of movement, they could also find implementation for deriving lying durations from longer activity absence. Although not as accurate as the data from accelerometers, UHF RFID data can provide reliable activity and lying times. However, the UHF RFID system neither registers the actual lying duration nor lying bouts and can only give out narrow lying intervals up to 60 min. This must be taken into account for the interpretation.

Author Contributions

Conceptualization, K.F., G.H. and J.H.; methodology, K.F., G.H. and J.H.; software, K.F.; validation, K.F., J.H., G.H. and C.A.; formal analysis, K.F., J.H. and C.A.; investigation, K.F., G.H. and J.H.; resources, K.F., G.H. and J.H.; data curation, K.F. and C.A.; writing—original draft preparation, K.F.; writing—review and editing, K.F., J.H., T.A. and G.H.; visualization, K.F.; supervision, G.H. and T.A.; project administration, K.F. and G.H.; funding acquisition, G.H. and T.A. All authors have read and agreed to the published version of the manuscript.

Funding

This work was financially funded by the German Federal Ministry of Food and Agriculture (BMEL) based on a decision of the Parliament of the Federal Republic of Germany, granted by the Federal Office for Agriculture and Food (BLE; grant number: 28N304208).

Data Availability Statement

None of the data have been deposited in an official repository. Information can be provided by the authors upon request.

Acknowledgments

The authors are grateful to the Leibniz Institute for Agricultural Engineering and Bioeconomy (ATB, Potsdam, Germany) for providing research facilities and to the BMEL and the BLE for financial support. The authors acknowledge and thank the staff of the Educational and Research Institute in Groß Kreutz (LVAT).

Conflicts of Interest

The authors declare that they have no conflicts of interest. The funders had no role in the design of the study; in the collection, analyses, or interpretation of data; in the writing of the manuscript; or in the decision to publish the results.

References

  1. Paudyal, S. Using rumination time to manage health and reproduction in dairy cattle: A review. Vet. Q. 2021, 41, 292–300. [Google Scholar] [CrossRef] [PubMed]
  2. Tucker, C.B.; Jensen, M.B.; de Passillé, A.M.; Hänninen, L.; Rushen, J. Invited review: Lying time and the welfare of dairy cows. J. Dairy Sci. 2020, 104, 20–46. [Google Scholar] [CrossRef] [PubMed]
  3. Neethirajan, S. The role of sensors, big data and machine learning in modern animal farming. Sens. Bio-Sens. Res. 2020, 29, 100367. [Google Scholar] [CrossRef]
  4. Sheldon, K.J.; Deboy, G.; Field, W.E.; Albright, J.L. Bull-related incidents: Their prevalence and nature. J. Agromedicine 2009, 14, 357–369. [Google Scholar] [CrossRef] [PubMed]
  5. Brown-Brandl, T.M.; Adrion, F.; Maselyne, J.; Kapun, A.; Hessel, E.F.; Saeys, W.; Van Nuffel, A.; Gallmann, E. A Review of Passive Radio Frequency Identification Systems for Animal Monitoring in Livestock Facilities. Appl. Eng. Agric. 2019, 35, 579–591. [Google Scholar] [CrossRef]
  6. Kampers, F.W.H.; Rossing, W.; Eradus, W.J. The ISO standard for radiofrequency identification of animals. Comput. Electron. Agric. 1999, 24, 27–43. [Google Scholar] [CrossRef]
  7. Houston, B.; Li, T.; Riley, P.; Xu, C.; Wolfendale, A.; Hurst, G.; Hammond, K.; McIntosh, A.; Yerbury, M.; Davies, L. Overcoming the Problems of Identifying and Recording Livestock under Extensive Management; Instituut voor Mechanisatie, Arbeid en Gebouwen: Wageningen, The Netherlands, 1983. [Google Scholar]
  8. Holm, D.; Bobbett, R.; Koelle, A.; Landt, S.; Sanders, W.; Depp, S.; Seawright, G. Passive electronic identification with temperature monitoring. In Proceedings of the Symposium on cow identification system and their applications, Wageningen, The Netherlands, 8 April 1976; pp. 125–129. [Google Scholar]
  9. Sowell, B.; Bowman, J.; Branine, M.; Hubbert, M. Radio frequency technology to measure feeding behavior and health of feedlot steers. Appl. Anim. Behav. Sci. 1998, 59, 277–284. [Google Scholar] [CrossRef]
  10. Achour, B.; Belkadi, M.; Saddaoui, R.; Filali, I.; Aoudjit, R.; Laghrouche, M. High-accuracy and energy-efficient wearable device for dairy cows’ localization and activity detection using low-cost IMU/RFID sensors. Microsyst. Technol. 2022, 28, 1241–1251. [Google Scholar] [CrossRef]
  11. Saint-Dizier, M.; Chastant-Maillard, S. Towards an Automated Detection of Oestrus in Dairy Cattle. Reprod. Domest. Anim. 2012, 47, 1056–1061. [Google Scholar] [CrossRef]
  12. Adrion, F.; Keller, M.; Bozzolini, G.; Umstatter, C. Setup, Test and Validation of a UHF RFID System for Monitoring Feeding Behaviour of Dairy Cows. Sensors 2020, 20, 7035. [Google Scholar] [CrossRef]
  13. McGowan, J.E.; Burke, C.; Jago, J.G. Validation of a technology for objectively measuring behaviour in dairy cows and its application for oestrous detection. In Proceedings of the New Zealand Society of Animal Production, Wanaka, New Zealand, 20–22 June 2007; Volume 67, pp. 136–142. [Google Scholar]
  14. Robért, B.D.; White, B.J.; Renter, D.G.; Larson, R.L. Determination of lying behavior patterns in healthy beef cattle by use of wireless accelerometers. Am. J. Vet. Res. 2011, 72, 467–473. [Google Scholar] [CrossRef] [PubMed]
  15. Trénel, P.; Jensen, M.B.; Decker, E.L.; Skjøth, F. Technical note: Quantifying and characterizing behavior in dairy calves using the IceTag automatic recording device. J. Dairy Sci. 2009, 92, 3397–3401. [Google Scholar] [CrossRef] [PubMed]
  16. Nielsen, L.R.; Pedersen, A.R.; Herskin, M.S.; Munksgaard, L. Quantifying walking and standing behaviour of dairy cows using a moving average based on output from an accelerometer. Appl. Anim. Behav. Sci. 2010, 127, 12–19. [Google Scholar] [CrossRef]
  17. Rutten, C.J.; Velthuis, A.G.J.; Steeneveld, W.; Hogeveen, H. Invited review: Sensors to support health management on dairy farms. J. Dairy Sci. 2013, 96, 1928–1952. [Google Scholar] [CrossRef] [PubMed]
  18. Richeson, J.T.; Lawrence, T.E.; White, B.J. Using advanced technologies to quantify beef cattle behavior. Transl. Anim. Sci. 2018, 2, 223–229. [Google Scholar] [CrossRef] [PubMed]
  19. Belaid, M.A.; Rodriguez-Prado, M.; Chevaux, E.; Calsamiglia, S. The Use of an Activity Monitoring System for the Early Detection of Health Disorders in Young Bulls. Animals 2019, 9, 924. [Google Scholar] [CrossRef] [PubMed]
  20. Munksgaard, L.; Simonsen, H.B. Behavioral and pituitary adrenal-axis responses of dairy cows to social isolation and deprivation of lying down. J. Anim. Sci. 1996, 74, 769–778. [Google Scholar] [CrossRef] [PubMed]
  21. Westin, R.; Vaughan, A.; de Passillé, A.M.; DeVries, T.J.; Pajor, E.A.; Pellerin, D.; Siegford, J.M.; Vasseur, E.; Rushen, J. Lying times of lactating cows on dairy farms with automatic milking systems and the relation to lameness, leg lesions, and body condition score. J. Dairy Sci. 2016, 99, 551–561. [Google Scholar] [CrossRef] [PubMed]
  22. Jensen, M.B.; Pedersen, L.J.; Munksgaard, L. The effect of reward duration on demand functions for rest in dairy heifers and lying requirements as measured by demand functions. Appl. Anim. Behav. Sci. 2005, 90, 207–217. [Google Scholar] [CrossRef]
  23. Keane, M.P.; McGee, M.; O’riordan, E.G.; Kelly, A.K.; Earley, B. Effect of floor type on performance, lying time and dirt scores of finishing beef cattle: A meta-analysis. Lifestock Sci. 2018, 212, 57–60. [Google Scholar] [CrossRef]
  24. Gygax, L.; Mayer, C.; Westerath, H.S.; Friedli, K.; Wechsler, B. On-farm assessment of the lying behaviour of finishing bulls kept in housing systems with different floor qualities. Anim. Welf. J. 2007, 16, 205–208. [Google Scholar] [CrossRef]
  25. Rouha-Muelleder, C.; Absmanner, E.; Kahrer, E.; Zeiner, H.; Scharl, T.; Leisch, F.; Troxler, J. Alternative housing systems for fattening bulls under Austrian conditions with special respect to rubberised slatted floors. Anim. Welf. 2012, 21, 113–126. [Google Scholar] [CrossRef]
  26. Hickey, M.; Earley, B.; Fisher, A. The effect of floor type and space allowance on welfare indicators of finishing steers. Ir. J. Agric. Food Res. 2003, 42, 89–100. [Google Scholar]
  27. Robert, B.; White, B.J.; Renter, D.G.; Larson, R.L. Evaluation of three-dimensional accelerometers to monitor and classify behavior patterns in cattle. Comput. Electron. Agric. 2009, 67, 80–84. [Google Scholar] [CrossRef]
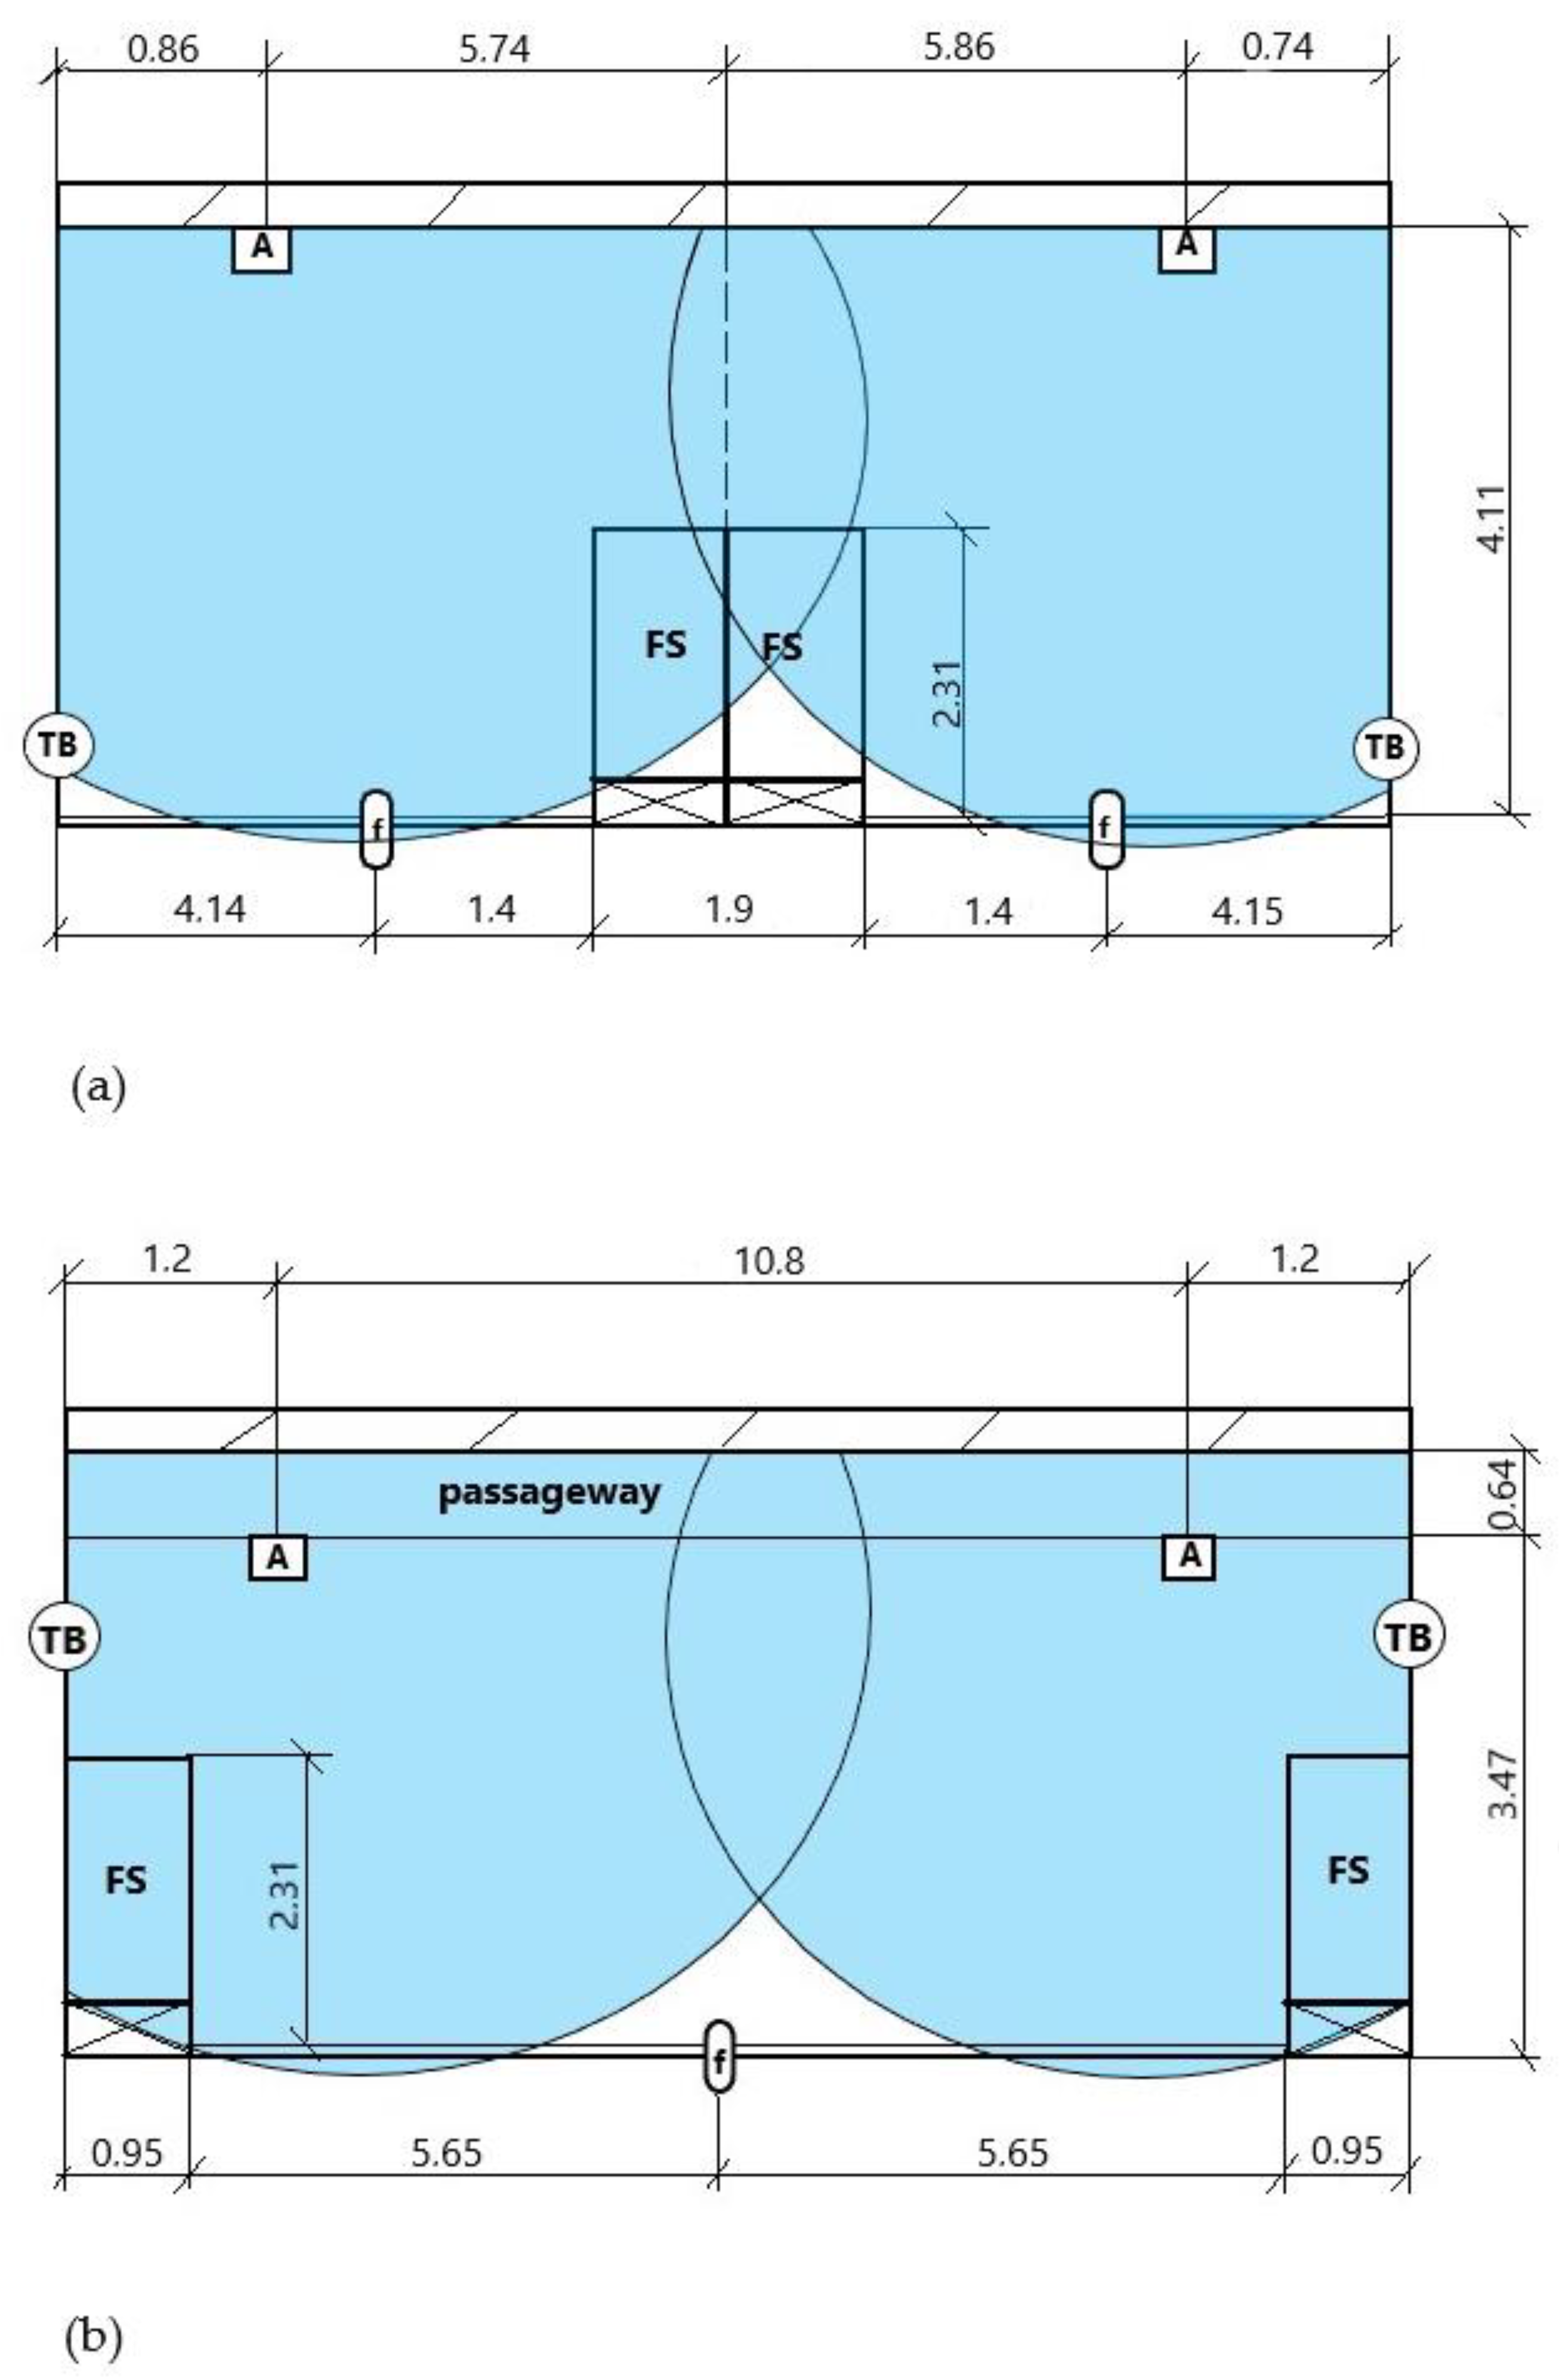
Figure 1. Floor plan and dimensions of the pens of Group 1 (a) and Group 2 (b), including the elliptical range (blue area) of the activity antennas (A); f = feeding antenna, FS = concentrate feeding station, TB = drinking bowl.
Agriengineering 06 00110 g001
Figure 2. Correlation of median lying durations (in min/d) between accelerometer and RFID data from Group 1 (a) and Group 2 (b).
Agriengineering 06 00110 g002aAgriengineering 06 00110 g002b
Figure 3. Boxplot of lying time (in min/d) in 10 bulls (five per group) over a period of 20 days according to continuous accelerometer and UHF RFID data in min/d. (a) Group 1, (b) Group 2, (c) both Groups.
Agriengineering 06 00110 g003aAgriengineering 06 00110 g003b
Table 1. Overview of captured movements between RFID antenna zones and division into binary classifiers.
TotalPositivesNegativesTrue PositivesFalse
Positives
True NegativesFalse Negatives
Group 19036112925901228021
Group 28404733674621535211
Both Groups1743108465910522763232
Table 2. Rates of possible observational errors from movements between RFID antenna zones.
Sensitivity (%)Specificity (%)Accuracy (%)Precision (%)False-Positive Rate (%)False-Negative Rate (%)
Group 196.5695.8998.8998.014.113.44
Group 297.6795.9198.2196.864.092.33
Both Groups97.0595.998.4597.54.092.96
Table 3. Comparison of lying durations from 10 bulls (five per group) over a period of 20 days according to continuous accelerometer and UHF RFID data.
Mean Lying Time Accelerometer in min/dMean Lying Time UHF RFID in min/dSEp-Value
Group 1856.62908.413.910.0003
Group 2892.83772.210.390.0001
Both Groups874.73840.310.60.0014
Difference
Group 1/Group 2
−36.21136.218.730.0005
SE = standard error.
Disclaimer/Publisher’s Note: The statements, opinions and data contained in all publications are solely those of the individual author(s) and contributor(s) and not of MDPI and/or the editor(s). MDPI and/or the editor(s) disclaim responsibility for any injury to people or property resulting from any ideas, methods, instructions or products referred to in the content.