Abstract
Agriculture is one of the most essential activities for humanity. Systems capable of automatically harvesting a crop using robots or performing a reasonable production estimate can reduce costs and increase production efficiency. With the advancement of computer vision, image processing methods are becoming increasingly viable in solving agricultural problems. Thus, this work aims to count green oranges directly from trees through video footage filmed in line along a row of orange trees on a plantation. For the video image processing flow, a solution was proposed integrating the YOLOv4 network with object-tracking algorithms. In order to compare the performance of the counting algorithm using the YOLOv4 network, an optimal object detector was simulated in which frame-by-frame corrected detections were used in which all oranges in all video frames were detected, and there were no erroneous detections. Being the scientific and technological innovation the possibility of distinguishing the green color of the fruits from the green color of the leaves. The use of YOLOv4 together with object detectors managed to reduce the number of double counting errors and obtained a count close to the actual number of oranges visible in the video. The results were promising, with an mAP50 of 80.16%, mAP50:95 of 53.83%, precision of 0.92, recall of 0.93, F1-score of 0.93, and average IoU of 82.08%. Additionally, the counting algorithm successfully identified and counted 204 oranges, closely approaching the actual count of 208. The study also resulted in a database with an amount of 644 images containing 43,109 orange annotations that can be used in future works.
1. Introduction
Agriculture is one of the most essential activities for humanity. Fruits are a great source of nutrients in most people’s diets. Thus, continuous production is necessary to meet global demands [1]. One of the ways to increase production quality and reduce costs is through technological innovations such as computer vision, which has undergone significant advances in pre-harvest fruit image processing. The two computer vision applications that have recently developed the most in this area relate to fruit production estimation and robotic harvesting sectors, as shown by [2].
Pre-harvest fruit crop production estimation is an essential task in precision agriculture. The procedure offers several benefits to producers. For example, performing site-specific management based on production estimation optimizes the number of materials needed, such as agricultural chemicals and fertilizers. It reduces the cost of labor in growing and harvesting production [3]. Production estimation has other benefits, such as estimating the storage capacity needed to store the fruits after harvest [4].
1.1. Problem Statement and Paper Contributions
This work proposes a solution for evaluating the production of oranges in the rows of the orange grove through detecting and tracking the fruits via image processing along the video frames. To accomplish that task, a new dataset of images of green oranges (pre-harvest) was created. Being the scientific and technological innovation the possibility of distinguishing the green color of the fruits from the green color of the leaves. This set was used to train a green–orange detector and the respective detected objects, marked by bounding boxes, go through a tracking process to compute the count.
This work aims to count green oranges directly from the trees through video footage filmed in line along a row of orange trees on the plantation. As the images acquired for the detection and counting of fruits in this type of environment are dense scenes in large quantities (that is, images or videos with a large number of objects, often accompanied by a large number of occlusions or overlaps [5]) there are some challenges in the task of detecting and counting pre-harvest fruits, and among the complicating aspects, they highlight: (i) occlusion, (ii) the size of objects to be detected in the images and (iii) the complex background [6], as can be seen in Figure 1.
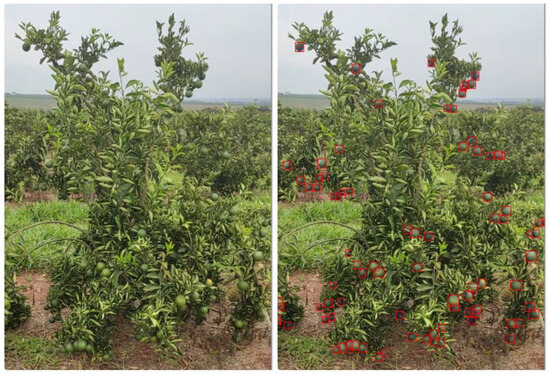
Figure 1.
The original image of oranges is depicted on the left, while on the right, the same image is displayed with distinctive red bounding boxes delineating each orange.
Some works found in the literature present similar proposals to this one. However, most perform the counting of the fruits using images or count ripe oranges [7,8,9,10], unlike this work that performs the count using video and with green oranges.
Another contribution of this work was to create a database with labeled images of pre-harvest green oranges and make them available to the scientific community. The green–orange image database is a challenging dataset due to the arrangement of the oranges in the trees, the daytime lighting and the similarity in color between the foliage and the oranges. Thus, there are high levels of occlusion due to the foliage and the fruits themselves, uncontrolled lighting due to daytime lighting, and significant similarity of color between the fruits and the background due to the maturation stage of the oranges. All characteristics of images of the fruit in nature [11].
1.2. State of the Art and Related Work
Recent advances have been made in this field [2,12]. Nevertheless, there are still many challenges, such as variation in lighting conditions, object occlusion or overlap, low contrast between fruits and foliage, and variation in the shape and position of the fruits [13,14]. However, computer vision systems based on Deep Learning [15] can deal with these challenges, and are essential and necessary resources for the recognition of complex objects in external environments [16].
Algorithms based on Deep Learning have proven to be one of the most robust ways to detect objects [17,18]. In particular, the object detection algorithms of the YOLO family [19] have proven to be effective for counting fruits directly from trees [20,21,22]. Object detection results can be integrated by associating the data using object trackers to perform in-line fruit counts in the field [23].
In a study conducted by Liu and Kumar [23], they introduced a cost-effective and lightweight fruit counting pipeline. This pipeline relies exclusively on a monocular camera. Its functionality initiates with a fruit and tree trunk detection component employing convolutional neural networks (CNNs). Subsequently, it employs a tracking mechanism to monitor the movement of fruits and tree trunks across images, facilitated by a Kalman filter that integrates inputs from the CNN detectors and an optical flow estimator. Ultimately, the system estimates fruit count and generates a map using an efficient semantic structure-from-motion algorithm based on fruit features. This algorithm transforms two-dimensional (2D) fruit and trunk trajectories into 3D landmarks, effectively addressing double counting scenarios. The study reported that for trees with fewer than 185 mangoes, the monocular system exhibited an average undercount of 3%. However, for trees with more than 185 mangoes, the system undercounted by 16%.
In their recent work, Sozzi and Francesco [24] explored the application of Convolutional Neural Networks (CNNs) for object detection in the context of viticulture, with a specific focus on grape yield estimation. To address this, the authors evaluated six versions of the You Only Look Once (YOLO) object detection algorithm, including YOLOv3, YOLOv4, YOLOv5x, and others, for real-time bunch detection and counting in white grape varieties. Importantly, grape yield estimation was based on image data, rather than video. Their results demonstrated that YOLOv5x and YOLOv4 achieved F1-scores of 0.76 and 0.77, respectively. Furthermore, the final YOLOv5x model exhibited the ability to estimate the number of bunches per plant with an average error of 13.3% per vine.
Cardellicchio and Vito [25] present a study on plant phenotyping, which involves the examination of complex plant traits to assess their status under various life-cycle conditions. This paper specifically focuses on the detection of phenotypic traits in tomato plants using YOLOv5. They have effectively identified nodes, fruit, and flowers within a challenging dataset obtained during a stress experiment involving multiple tomato genotypes. The models have learned how to identify and automatically extract significant phenotyping traits on images of tomato plants at different growth stages under various stress conditions.
Wang and He [26] addressed the crucial challenge of rapid and accurate detection of apple fruitlets prior to fruit thinning. The primary objective of this study was to develop a precise apple fruitlet detection method with a compact model size, employing a channel-pruned YOLO V5s Deep Learning algorithm. Experimental results demonstrated the effectiveness of the channel-pruned YOLO V5s model under varying conditions, achieving a recall rate of 87.6%, a precision rate of 95.8%, and an F1 score of 91.5%.
Long and Darrell [27] pointed out that occlusion is one of the biggest challenges in dense scene quantities. There are two main types of occlusion: scene occlusion and inter-object occlusion [5]. Scene occlusion occurs when other non-object elements in the scene occlude the object; inter-object occlusion occurs when objects detected in the environment overlap other objects.
The reduced size of the objects, in this case, the oranges, in the image is another challenge in dense scenes in quantities. This problem causes objects to have a low resolution, making them subject to noise and lighting changes that can lead to inaccurate detections.
The complex background includes two situations; the primary and most relevant for this work is that the background is similar to the objects, which makes it difficult to distinguish between the object and the background. Green oranges are easily confused with tree foliage, which makes detection and counting more complex when compared to ripe oranges.
One of the main limitations of using techniques based on Deep Learning is the image database used to train the system [28]. The database must be large enough, with representative samples of the scenario to be treated and well labeled to perform the detection task efficiently. Therefore, preparing the database is one of the tasks that demand more effort and work in applying techniques based on Deep Learning. In addition, not all databases proposed in other works are available to be used, which makes the reproducibility of experiments complex [28], as is the case of the pre-harvest green oranges database.
The fruit count can be divided into two steps, detection of fruits, already discussed in the previous paragraphs, and tracking fruits through a sequence of frames of the footage of the trees. To count the fruits in the video is necessary to carry out the correspondence of each fruit in the adjacent frames. A given orange in several frames must be identified, and other oranges must be distinguished from it simultaneously. However, tracking the same oranges for identification is challenging, as their location and appearance vary due to environmental factors, such as lighting conditions and camera movement in the in-line footage of the rows of orange trees [29]. Many works in the literature deal with fruit detection; however, few use detection and tracking to perform fruit counting, especially for greenish fruits and under unstable lighting conditions [29]. Even if foliage, branches, or other oranges occlude an orange, it is still necessary to track it. Otherwise, the orange will be counted twice or more each time it is detected again in successive video frames.
2. Materials and Methods
Algorithms based on methods that use Deep Learning are the most efficient way to perform object detection [17,18]. The YOLO (You Only Look Once) approach proposes the use of a neural network that simultaneously predicts bounding boxes and class probabilities, distinguishing itself from previous object detection algorithms that repurposed classifiers for this purpose. By adopting a fundamentally different approach to object detection, YOLO has achieved state-of-the-art results, outperforming other real-time object detection algorithms significantly [19].
In contrast to methods such as Faster RCNN [30], which identify potential regions of interest using the Region Proposal Network and subsequently conduct recognition on those regions separately, YOLO performs all its predictions through a single fully connected layer. While approaches employing Region Proposal Networks require multiple iterations for the same image, YOLO accomplishes the task in a single iteration.
Considering speed and accuracy, YOLOv4 has presented good performance among object detection models recently [31]. The YOLO V4 architecture has undergone significant modifications, with a renewed emphasis on data comparison, leading to substantial performance improvements. Its defining characteristic is its integration of various components, resulting in notably high performance. In essence, YOLO V4 can be described as a combination of CSP Darknet53, SPP, Pan, and YOLO V3 [32].
The primary contributions of YOLO V4 include the introduction of an efficient target detection model, an investigation into the impact of state-of-the-art (SOTA) techniques during training, and the optimization of SOTA methods for single-GPU training. YOLO V4 also reorganizes the target detector framework into Input, Backbone, Neck, and Head components, utilizing multiple anchor points for a single ground truth. Key improvements in YOLO V4 encompass the inclusion of SPP, the utilization of the MISH activation function, data augmentation techniques like Mosaic/Mixup, and the adoption of the GIOU (Generalized Intersection over Union) loss function [33].
Recent studies have harnessed YOLO-based models, including YOLOv3, YOLOv4, and YOLOv5, for fruit detection, demonstrating their significant potential in accurately identifying fruit directly on trees [34,35,36,37]. Notably, the results achieved with YOLOv4 [32] have been found to be similar to those obtained with YOLOv5. Given this similarity in performance, YOLOv4 was chosen as the model of preference for orange detection in this work.
2.1. Creation of the Green Oranges Dataset
To carry out the YOLOv4 training to detect pre-harvest green oranges, a database containing images of oranges directly from the trees and duly annotated is necessary. It is one of the contributions of the present study, the creation of a pre-harvest and duly annotated green oranges dataset. Among the types of oranges available in the place where the images for the database were acquired, the type chosen for this work was the variety called “folha murcha”, which is a Valencia-type orange tree [38], with data collection occurring between 7 and 6 months before harvest.
Data were obtained in the field using a Xiaomi Redmi Note 9PRO smartphone camera in both portrait and landscape orientations. At the same time, the camera operator walked in a straight line parallel to the row of orange trees being filmed. Data collection took place on 15 March 2021 and 18 April 2021. The orange trees were filmed in 1920 × 1080 p resolution at 60 frames per second. The images for the database were taken from the video frames at 3-s intervals.
The oranges were divided into three categories: green oranges, ripe oranges, and spoiled oranges. Furthermore, they were annotated using the online tool CVAT (COMPUTER VISION ANNOTATION TOOL) [39] totaling 644 images with 43,109 annotated oranges, of which 532 images were separated for training and 112 images for tests. Among these annotations, 42,710 belong to the green orange class, 368 to the spoiled orange class, and 31 to the ripe orange class. It is important to emphasize that both vertical and horizontal image orientations were incorporated to augment the dataset’s generality. Unlike Rauf and Chan’s dataset [40], which focuses exclusively on 1465 images of ripe oranges, our dataset includes a significant number of green oranges.
In Figure 2, the oranges properly annotated using the CVAT tool are shown, where green oranges are annotated with blue bounding boxes, ripe oranges with yellow bounding boxes and spoiled oranges with pink bounding boxes.
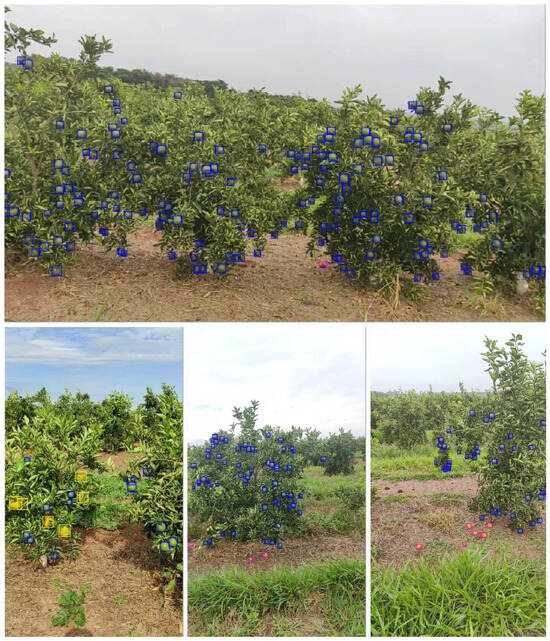
Figure 2.
Annotated oranges. Green oranges are denoted by blue bounding boxes, ripe oranges by yellow bounding boxes, and spoiled oranges by pink bounding boxes.
2.2. YOLOv4 Model Training
The YOLOv4 training was performed using the Darknet framework on the Google Colab platform with the Tesla P100-PCIE-16GB GPU. We configured and tuned the YOLOv4 architecture for our custom database. The main source code of the Darknet framework was prepared by [32]. We modified the last three layers of YOLOv4 to be compatible with the number of classes in our database, following the authors’ guidelines [32]. The original YOLOv4 was trained in 80 classes; therefore, we have changed the number of classes to three: “green orange”, “ripe orange”, and “spoiled orange”. We set the width × height of the network input image to 1056 × 1056. This input value was chosen to consider the size of the oranges in the image, if the oranges become smaller than 11 × 11 pixels after resizing the image in the input, this can compromise the quality of network detections. Data augmentation techniques and network hyperparameters were kept at default values. In addition, the maximum number of training epochs was set at 6000 following the formula provided by the authors (number of classes × 2000) [32].
Tensorflow [41] is a machine learning framework that works in data processing and has a wide variety of libraries and resources that allow the use of the latest Deep Learning algorithms and models in a flexible way. After The YOLOv4 model had been trained, the model was converted to a Tensorflow model, using the following source code as a basis to perform the conversion [42].
2.3. Orange Counting System
It is possible to use only detection to count objects. However, as discussed earlier, detection systems often fail in some occlusion and lighting situations. Thus, relying solely on the number of detections in an image to perform the orange count would be a wrong decision, especially in a pre-harvest scenario where the abovementioned situations are pretty standard. For this reason, a counting system must cover these limitations to ensure counting accuracy. One of the ways to achieve this is by assigning a unique ID to each orange detected and tracking it through video frames. In this way, obtaining more reliable results in counting objects in case of detection system failures is possible.
The system used in this work uses two methods of tracking the oranges using a unique ID across the frames. The first uses the Euclidean distance between the centroids of the objects detected via YOLOv4 in subsequent frames to relate the IDs of the oranges of the previous frame with the detected oranges by YOLOv4 in the current frame. The second uses object tracking algorithms to match the IDs of the oranges of the previous frame with the oranges of the current frame that YOLOv4 has not detected.
The first method, based on the Euclidean distance between centroids, is divided into four steps. Step 1: Obtain the coordinates of the bounding boxes and calculate their centroids. Step 2: Calculate the Euclidean distance between objects in the previous frame and objects in the current frame. Step 3: Update object coordinates. Step 4: Register objects with new IDs.
In step 1, the algorithm receives the coordinates of the bounding boxes and calculates their respective centroids. Assuming this is the first received set of bounding boxes. Each centroid, or object, is assigned a unique ID, as shown in the left image of Figure 3. The object’s centroids are calculated at each video frame using the bounding boxes. However, instead of assigning new unique IDs to objects detected in the current frame, it is first necessary to determine if it is possible to associate the centroids of the new objects with the centroids of the objects of the previous frame. It is done through step 2.
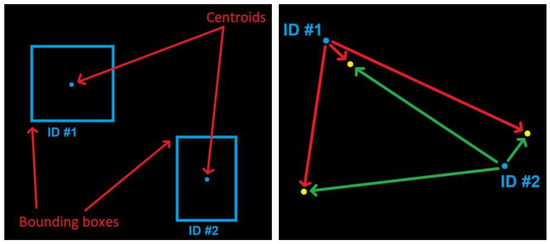
Figure 3.
Two-step process for centroid ID assignment. Step 1 (left) assigns IDs based on bounding box coordinates, while Step 2 (right) calculates Euclidean distances between centroids from previous and current frames.
In step 2, the Euclidean distance between each pair of object centroids of the previous frame and centroids of objects of the current frame is calculated. In the right image of Figure 3, the centroids of the objects of the previous frame are represented by the two blue dots, and the yellow dots represent the centroids of the objects of the current frame. Arrows represent Euclidean distances.
The central assumption made in the first method is that objects in consecutive frames tend to move little. In this way, the distance between the centroids of the same object in 2 consecutive frames will be smaller than the distances between all other centroids.
In step 3, the centroids of objects with the smallest Euclidean distance between them will have their IDs related, as shown in the left image of Figure 4. However, if the number of new objects is greater than the number of existing objects in the previous frame, or if these objects are at a distance greater than 70 pixels from all objects that have not been associated with an ID, then it will not be possible to associate the IDs of objects from the previous frame with all objects in the current frame, such as is shown in the left image of Figure 4 with the isolated yellow dot. Therefore, it is necessary to associate these new objects with new IDs in step 4.
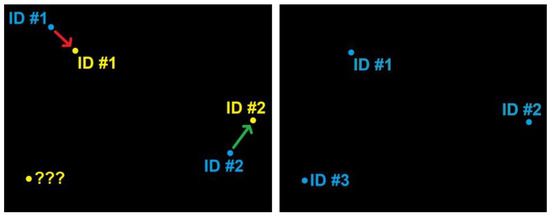
Figure 4.
Step 3 (left), associating centroids based on Euclidean distances, except for isolated objects or too-distant ones. In Step 4 (right), objects with high detection confidence receive new IDs.
In step 4, objects that have not been associated with objects with existing IDs have new IDs assigned to them if the detection confidence of this object is 85% or more, as shown in the right image of Figure 4. This situation happens when an object, which was not part of the previous frames, is detected.
In Figure 5, we can see the first method for ten consecutive frames. In frame number 163, there are three oranges with IDs numbered 81, 80, and 77, each with a circle of different colors inside it to facilitate the identification of oranges of identical IDs in different frames. The smaller black circle inside the orange represents a YOLOv4-detected orange in that frame. It is possible to notice that the oranges move very little between consecutive frames, which facilitates the attribution of the IDs between the oranges frame by frame.
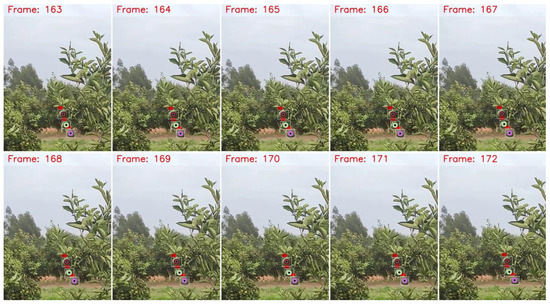
Figure 5.
In ten consecutive frames, Frame 163 highlights three oranges with IDs 81 (brown), 80 (green), and 77 (pink), tracked via color-coded circles. Smaller black circles within each orange indicate YOLOv4 detections in that frame. Source: Research data.
2.4. Object-Tracking Algorithm
The second method of tracking oranges through video frames with a unique ID is used when it is impossible to relate an object’s ID from the previous frame to an object that YOLOv4 has detected in the current frame. In this case, we use object-tracking algorithms to make this relationship.
In this process, the objective of object tracking algorithms is to estimate the object’s state (position) over time [43]. When there is no change in the environment, tracking objects is not overly complex, but this is usually not the case. Various disturbances in the real world can disrupt tracking, including occlusion, variations in lighting, change of viewpoint, rotation and blurring due to motion [44]. The steps used to track the object in the video involve:
- Selecting the object (target) in the initial frame with a bounding box;
- Initializing the tracker with information about the frame and the bounding box of the object;
- Using subsequent frames to find the new bounding box of the object in these frames.
In this work, the following object trackers are used for comparison: the Dlib correlation tracker (Dlib tracker) [45], Boosting [46], Multiple Instance Learning (MIL) [47], MedianFIow [48], Kernelized Correlation Filter (KCF) [44] and Channel and Spatial Reliability Tracker (CSRT) [49]. These algorithms were selected for their robustness and because they are implemented in the OpenCV and Dlib-ml libraries. Except for the Dlib tracker, which is implemented using the Dlib-ml library [50], all other object trackers are implemented using the OpenCV (The Open Source Computer Vision) library [44,51].
The Dlib Correlation Tracker focuses on robust scale estimation, while Kernelized Correlation Filter (KCF) adjusts channel characteristics and introduces CN features for tracking. The Channel and Spatial Reliability Tracker (CSRT) combines DCF with spatial and channel reliability, enabling adaptable and accurate short-term tracking, even for non-rectangular objects. In contrast, Boosting treats tracking as a binary classification task and continually updates the classifier for the target object, thereby enhancing its robustness. Median Flow, on the other hand, identifies tracking failures through the comparison of forward and backward trajectories, ensuring the robustness of tracking through discrepancy measurements. Additionally, Multiple Instance Learning (MIL) enhances the robustness of discriminative classifiers used in “tracking by detection” techniques, effectively mitigating inaccuracies in the tracker.
Object trackers are used to estimating the object’s position when YOLOv4 cannot detect the object in the image in the current frame. It is possible because the trackers only need the previous frame and the object’s bounding box. After that, object trackers can track the object frame by frame without the help of YOLOv4. The entire process is shown in the flowchart in Figure 6.
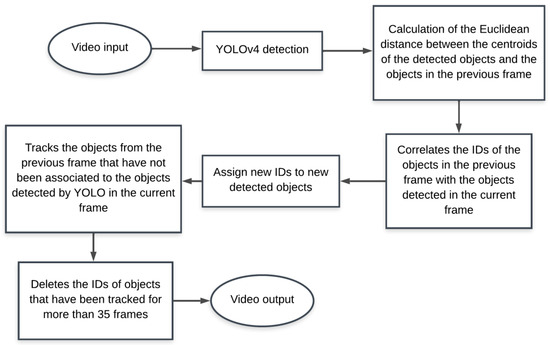
Figure 6.
Counting algorithm flowchart.
Figure 7 shows an example of this situation using the Dlib tracker. In frame 196, the orange of ID 85 was detected by YOLOv4; this is demonstrated by the black circle inside. In frame 197, the orange of ID 85 was not detected by YOLOv4; the white circle inside it visually demonstrates this, which indicates that the object tracking algorithm is tracking the orange. The orange is then tracked through the frames even if YOLOv4 fails to detect it again. This tracking process takes place for 35 frames, if YOLOv4 cannot detect the orange again within those 35 frames, then the ID of that orange is deleted, and the object tracking algorithm stops tracking it.
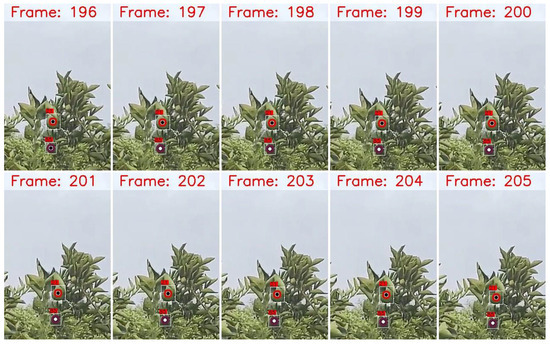
Figure 7.
In Frame 196, ID 85 orange is initially detected by YOLOv4 (black circle), with IDs 21 and 85 represented by red and purple circles. In Frame 197, YOLOv4 does not detect the same orange (white circle), but the object tracking algorithm effectively maintains tracking. Source: research data.
3. Results and Discussions
Ten seconds of a video were chosen whose images were not used to compose the database to test the counting algorithm. So, in order to compare the performance of the algorithm using YOLOv4, a situation was simulated in which the detection algorithm used would detect all oranges in all video frames without committing any detection error. This was achieved by manually annotating all oranges in all the 600 frames of the 10-s video with bounding boxes. This information was used frame by frame to simulate an optimal detection. The actual number of 208 oranges possible to see in the video was also counted. The counting algorithm was then tested using YOLOv4 and the simulated optimal object detector together with each of the mentioned above object-tracking algorithms.
After training YOLOv4, the network acquired the parameters as displayed in Table 1. The training process utilized 532 images with the classes, “green orange”, “ripe orange”, and “spoiled orange”. It is noteworthy that the parameters presented in the table reflect the network’s performance on a separate set of 112 test images. These test images were not part of the training dataset, ensuring an impartial evaluation of the model’s performance.

Table 1.
YOLOv4 parameters.
True Positives (TP) represent instances where the model correctly predicts a label that matches the ground truth. True Negatives (TN) occur when the model correctly abstains from predicting a label that is indeed not part of the ground truth. On the other hand, False Positives (FP) arise when the model erroneously predicts a label that is not supported by the ground truth. Conversely, False Negatives (FN) occur when the model fails to predict a label that is present in the ground truth.
Intersection over Union (IoU) is a metric that quantifies the overlap between the coordinates of the predicted bounding box and the ground truth box. A higher IoU value indicates that the predicted bounding box coordinates closely resemble those of the ground truth box. When evaluating multiple detections, the Average IoU is calculated as the mean IoU of all the detections made. This metric provides an overall measure of how well the predicted bounding boxes align with the ground truth boxes on average.
The Precision metric assesses how effectively true positives (TP) can be identified out of all positive predictions (TP + FP), while Recall evaluates the ability to locate true positives (TP) within all predictions (TP + FN). Both Precision and Recall are fundamental in evaluating the performance of object detection algorithms. Additionally, the F1-Score, often described as their harmonic mean, offers a balanced single metric that necessitates both Precision and Recall to be simultaneously high for the F1-Score to increase. This provides a comprehensive assessment of a detector’s performance, considering both the ability to minimize false positives and false negatives. Notably, the Precision, Recall, and F1-Score values presented in Table 1 are computed with an Intersection over a Union (IoU) threshold of 50%.
Average Precision (AP) quantifies the detection model’s performance by calculating a weighted mean of precision scores across different confidence thresholds, accounting for the increase in recall from the previous threshold. Mean Average Precision (mAP) serves as a comprehensive metric to assess the overall performance of a detection model. It extends the evaluation by calculating Average Precision (AP) at multiple Intersection over Union (IoU) thresholds. The mAP is derived by averaging the AP scores across these IoU thresholds, offering a thorough assessment of the model’s accuracy across a spectrum of bounding box overlap conditions. Specifically, mAP0.5 represents the mAP calculated at an IoU threshold of 0.5, while mAP0.5:0.95 extends the analysis across a range of IoU thresholds from 0.5 to 0.95, with 0.05 increments.
It is important to emphasize that the 10 s video, comprising 600 frames, differs from the training and test datasets. The test images were exclusively utilized to evaluate the network’s image detection performance. In contrast, the 10 s video is employed to assess the counting algorithm’s performance, which is specifically tailored for video sequences. This distinction ensures a separate evaluation, clearly separate from the image detection task, within the scope of this study.
The counting algorithm using the frame-by-frame corrected detections obtained the results shown in Table 2. As the detections were corrected frame by frame, to compare with the results obtained using the YOLOv4 network, there is no detection omission (oranges that were not detected in frames) and no false detections (objects that were detected as being orange, but which are not). The number of oranges counted by the algorithm remained close to the correct number of oranges, no matter which object tracker was used or even if none was used.

Table 2.
Orange count with the simulated optimal object detector.
This is because whenever an orange is visible in the frame, it will be detected as the detections were manually corrected frame by frame. That way, when the object trackers are used, they are not tracking the oranges because if the orange was not detected, it is because it is no longer visible in the frame and not because the object detector failed. Thus, even if no object tracker is used, the number of oranges counted is still very close, even if the double counting number and the ID repetition number (situation in which the same ID is used in two oranges, generally when the first orange is occluded and soon after a new orange is detected nearby and the same ID of the occluded orange is assigned to the new detection) are more significant.
When the counting algorithm is used with YOLOv4 to perform the detection of oranges, we have a more significant discrepancy in the number of oranges counted, as shown in Table 3. The number of omission of detections was 15 oranges, meaning that during all frames, there were 15 oranges that YOLOv4 did not detect even once in all frames. It does not mean that YOLOv4 failed to detect oranges 15 times in all frames, but rather that it missed 15 oranges in all frames at least once, so if the same orange was missed in multiple frames, it counts as an omission of detection only. If an orange appeared in 100 frames but was detected by YOLOv4 in 20 frames, it does not count as an omission of detection, as it is possible to track the orange in frames where YOLOv4 was unable to detect it using the object trackers.

Table 3.
Orange count with YOLOv4.
The number of erroneous detections was 2, meaning that the network detected two objects as being orange and they were not. In the same way, even though YOLOv4 has detected the same object erroneously in several frames, this counts only as one false detection. The number of double countings of oranges and repetitions of the same ID for different oranges was also higher when no tracker was used than when any of the proposed object trackers were used.
It was already expected because now, unlike the detections corrected frame by frame, there were times when the orange was visible in the frame, but YOLOv4 did not detect it. In this way, having an object tracker to be able to track the oranges in the frames in which YOLOv4 fails helps to reduce the number of double counting. Because if YOLOv4 detects the orange again in future frames, reassign the ID of the orange being tracked by the object tracker instead of assigning a new ID.
Although frame-by-frame corrected detections are more accurate than YOLOv4-produced detections, the orange counting algorithm came closer to the correct number of oranges when using YOLOv4 detections than when using frame-by-frame corrected detections. This is because when using the corrected detections, there are no omissions of detections or wrong detections, so the only errors present are double counting errors and ID repetition errors. ID repetition errors are much rarer than double-counting errors, especially when using an object tracker. Thus, double counting errors constitute the majority of errors when using corrected detections. By their nature, double-counting errors tend to overestimate the number of oranges counted. That is, they tend to introduce a positive error in the final count of the number of oranges.
When using the detections made by YOLOv4, there are some detection failures. Some oranges are not detected at all in every frame, either because of occlusion or lighting, and some objects are detected as being orange when they are not. We have a total of 15 oranges that were not detected and two objects that were erroneously detected as oranges. In this way, we have a more significant error due to the oranges that were not detected than the objects detected wrongly. Unlike double counting, the error introduced by the omission of detection tends to underestimate the correct number of oranges. That is, it introduces a negative error in the final count. Thus, when the detections made by YOLOv4 are used, the error introduced by the omission of detection tends to balance the error introduced by the double counting. That is why the counting algorithm arrived at a count closer to the actual value when using YOLOv4 detections than frame-by-frame corrected detections.
It is also possible to notice that there was no significant difference in the count when different object trackers were used. It is because the object tracker only tracks the object for a maximum of 35 frames after the object detector can no longer detect it. If, after these 35 frames, the object detector has not detected a nearby orange that can be assigned to the orange tracked by the object tracker, the ID of that orange is deleted. The video acquisition was performed at 60 frames per second; there are no significant variations from one frame to its subsequent frame, as seen in Figure 7. Therefore, at 35 frames, there are no significant variations in the orange image between the first frame and the last one, which makes it very difficult to track, making the object trackers have similar performances.
In Figure 8, 20 frames are shown spaced from the first frame to the last of the 10 s video, where it is possible to see the counting algorithm with YOLOv4 for detection and the Dlib tracker for tracking objects. In the upper-left corner of each frame is indicated, respectively, from top to bottom:
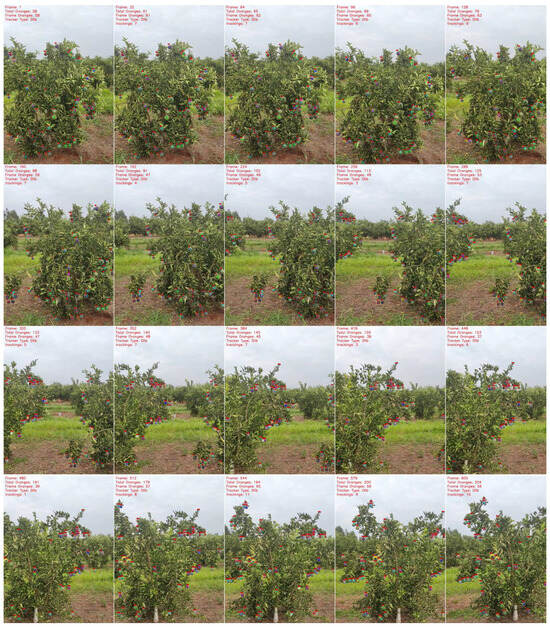
Figure 8.
Twenty frames from a 10 s video, illustrating YOLOv4 detection and Dlib tracking for counting and tracking oranges. Black circles signify successful detection, while white circles denote undetected oranges, with unique IDs represented by colored circles within orange bounding boxes.
- The number of that frame;
- The total number of oranges already counted by the algorithm;
- The total number of oranges present in that frame;
- The type of object tracker used;
- The number of oranges being tracked by the object tracker.
In the upper-left corner of each orange’s bounding box, we have a legend indicating the ID number assigned to that orange. The larger colored circles are used to distinguish oranges of different IDs visually. The smaller black and white circles within the larger colored circles are used to indicate whether the object detector detected that orange in that frame or not—black if the object detector was able to detect and white if the object detector was not able, and therefore, the object tracker is being used to track orange through the respective frames.
In Figure 9, we have a situation of occlusion by a branch in which the algorithm can reassign the same ID to the respective oranges, thus avoiding double counting. In frame 208, the algorithm is tracking the oranges of IDs 13 and 91, and we can see from the black circle marking that the object detector detected both in that frame. In frame 228, both oranges are no longer detected by the object detector, as it is possible to see by the marking of the white circle. Currently, the oranges are being tracked using the Dlib object tracker. In frame 248, both oranges are detected again by the object detector, and their IDs are reassigned without double counting.
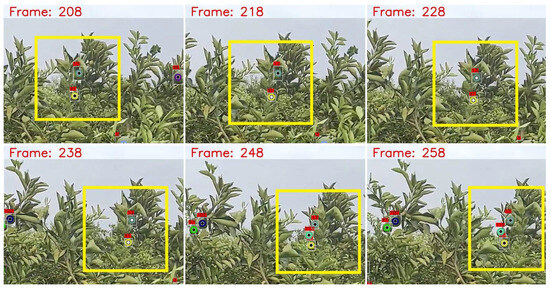
Figure 9.
Occlusion caused by a branch. It successfully reassigns IDs to prevent double counting. Frames 208 and 228 show tracking with black circles when the object detector does not detect, and frame 248 reassigns IDs upon detection.
Unlike the situation shown in Figure 9, in which there was an occlusion situation, but the counting algorithm reassigned the orange IDs, thus avoiding double counting, in Figure 10, we have an occlusion situation in which the algorithm was not able to avoid double counting. The orange of ID 84 was being tracked until the moment it was occluded by foliage and is no longer detected by the object detector in frame 156. After not being detected again by the object detector in the following frames, the algorithm stops tracking this orange in frame 186. However, in frame 280, that same orange is again detected by the object detector after the foliage stops obstructing her line of sight. However, in this case, we do not have the position of the ID 84 bounding box next to it to reassign the same ID since the algorithm stopped tracking it at frame 186, so a new ID number 124 is assigned to that orange, so the same orange was counted twice.
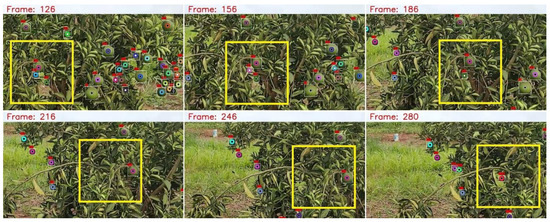
Figure 10.
This scenario highlights occlusion challenges. It tracked orange ID 84 (indicated by a blue circle), which became obscured by foliage in frame 156 and remained undetected until frame 280. Upon re-detection, it received a new ID, 124 (indicated by a red circle), resulting in inadvertent double counting.
This same occlusion and double counting situation shown in Figure 10 occurs again in Figure 11. The orange in frame 126 is being tracked by the algorithm and has ID 11. In frame 144, this orange is no longer detected by the object detector and becomes tracked by the Dlib object tracker. In frame 162, as the object detector could not detect the orange again due to the occlusion caused by the foliage, the algorithm stopped tracking the orange and stopped showing its ID and its bounding box in subsequent frames. However, in frame 218, that same orange is again detected by the object detector, now receiving ID number 102, so the same orange was counted twice.
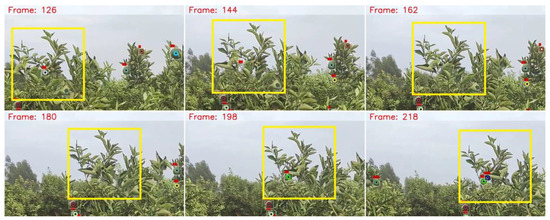
Figure 11.
In Frame 126, the algorithm tracks orange ID 11 (gray circle) and shifts to Dlib tracking by Frame 144 as the object detector stops. By Frame 162, foliage occlusion leads to tracking cessation and ID removal. In Frame 218, the same orange is detected as ID 102 (blue circle), resulting in double counting.
In Figure 12, we have another double counting situation, but this time instead of occlusion due to foliage, occlusion occurs due to another orange. The orange of ID 99 was being tracked by the algorithm, as it is possible to see in frames 256 and 268. However, in frame 280, the orange of ID 99 is obstructed by the orange of ID 103 and is no longer detected by the object detector. At that moment, the Dlib object tracker now carries out the orange tracking. As the object detector cannot detect the orange of ID 99 again in subsequent frames, the algorithm stops tracking this orange and stops showing its bounding box and its ID in the frames, as seen in frame 301. However, the orange that had been obstructed by the orange ID 103 becomes visible again in frame 316, as it is impossible to reassign ID 99, as it was discarded in previous frames, the algorithm assigns the new ID number 133. Thus, performing the double counting of the same orange.
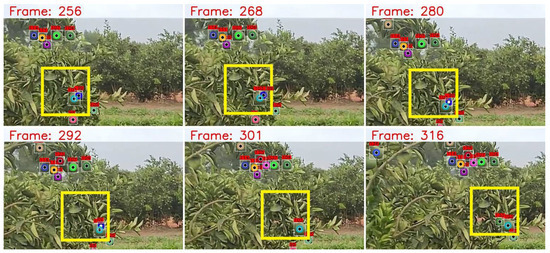
Figure 12.
A double counting scenario due to occlusion, where one orange obstructs another. Initially, orange ID 99 (dark blue) is tracked but gets obscured by orange ID 103 (light blue) in frame 280, leading to Dlib tracking. As the object detector fails to rediscover ID 99, it receives a new ID, 133 (green), resulting in double counting.
4. Conclusions
This study addressed the problems of detecting, tracking, and counting oranges from video footage of the plantation. For the video image processing flow, a solution was proposed to integrate the YOLOv4 network with object tracking algorithms, providing promising results.
The YOLOv4 network demonstrated competence in detecting small oranges compared to the image size and greens with a color closely resembling the surrounding foliage. At the same time, the object tracking algorithms benefited from the information provided by YOLOv4 to position the images. Bounding boxes in oranges and performing tracking at times when YOLOv4 could not detect them, thus reducing the double counting error.
Frame-by-frame corrected detections were employed, detecting all oranges in every video frame without any erroneous detections. This allowed for a comparison of the counting algorithm’s performance using the YOLOv4 network. The results were promising, with an mAP50 of 80.16%, mAP50:95 of 53.83%, Precision of 0.92, Recall of 0.93, F1-Score of 0.93, and Average IoU of 82.08%. Additionally, the counting algorithm successfully identified and counted 204 oranges, closely approaching the actual count of 208. The utilization of YOLOv4 and object trackers reduced the number of double-counting errors, resulting in a count that closely matched the actual number of oranges visible in the video.
The study also resulted in a database with an amount of 644 images with 43,109 annotated oranges that can be used in future works.
Author Contributions
Conceptualization, M.F.G., R.K., C.M.G.A. and O.C.d.M.L.; Methodology, M.F.G., R.K., F.C.F., C.M.G.A. and O.C.d.M.L.; Software, M.F.G.; Validation, M.F.G., I.R.F., R.K., F.C.F., C.M.G.A. and O.C.d.M.L.; Formal analysis, M.F.G.; Investigation, M.F.G.; Resources, M.F.G.; Data curation, M.F.G.; Writing—original draft preparation, M.F.G.; Writing—review and editing, M.F.G., I.R.F., R.K., F.C.F., C.M.G.A. and O.C.d.M.L.; Supervision, R.K., F.C.F., C.M.G.A. and O.C.d.M.L.; Project administration, R.K., C.M.G.A. and O.C.d.M.L. All authors have read and agreed to the published version of the manuscript.
Funding
This research was funded by: National Council for Scientific and Technological Development (CNPq) and National Council for the Improvement of Higher Education (CAPES).
Data Availability Statement
Part of the dataset supporting our reported results can be accessed at the following link: https://github.com/MatheusFelipeGremes/green_orange_dataset, accessed on 20 December 2021. For any additional data inquiries or access requests, please contact the corresponding author.
Acknowledgments
For their support National Council for Scientific and Technological Development (CNPq) and National Council for the Improvement of Higher Education (CAPES).
Conflicts of Interest
The authors declare that they have no known competing financial interests or personal relationships that could have appeared to influence the work reported in this paper.
References
- Abdullahi, H.S.; Sheriff, R.; Mahieddine, F. Convolution neural network in precision agriculture for plant image recognition and classification. In Proceedings of the 2017 Seventh International Conference on Innovative Computing Technology (INTECH), Luton, UK, 16–18 August 2017; Volume 10, pp. 256–272. [Google Scholar]
- Gremes, M.F.; Krummenauer, R.; Andrade, C.M.G.; Lima, O.C.d.M. Pre-Harvest Fruit Image Processing: A Brief Review. Braz. J. Exp. Des. Data Anal. Inferent. Stat. 2021, 1, 107–121. [Google Scholar] [CrossRef]
- Yamamoto, K.; Guo, W.; Yoshioka, Y.; Ninomiya, S. On plant detection of intact tomato fruits using image analysis and machine learning methods. Sensors 2014, 14, 12191–12206. [Google Scholar] [CrossRef]
- Wang, Q.; Nuske, S.; Bergerman, M.; Singh, S. Automated crop yield estimation for apple orchards. In Experimental Robotics, Proceedings of the 13th International Symposium on Experimental Robotics, Québec City, QC, Canada, 18–21 June 2012; Springer: Berlin/Heidelberg, Germany, 2013; pp. 745–758. [Google Scholar]
- Zhang, Q.; Liu, Y.; Gong, C.; Chen, Y.; Yu, H. Applications of deep learning for dense scenes analysis in agriculture: A review. Sensors 2020, 20, 1520. [Google Scholar] [CrossRef]
- Fu, L.; Gao, F.; Wu, J.; Li, R.; Karkee, M.; Zhang, Q. Application of consumer RGB-D cameras for fruit detection and localization in field: A critical review. Comput. Electron. Agric. 2020, 177, 105687. [Google Scholar] [CrossRef]
- Zhang, X.; Toudeshki, A.; Ehsani, R.; Li, H.; Zhang, W.; Ma, R. Yield estimation of citrus fruit using rapid image processing in natural background. Smart Agric. Technol. 2022, 2, 100027. [Google Scholar] [CrossRef]
- Dorj, U.-O.; Lee, M.; Yun, S.-S. An yield estimation in citrus orchards via fruit detection and counting using image processing. Comput. Electron. Agric. 2017, 140, 103–112. [Google Scholar] [CrossRef]
- Zhang, W.; Wang, J.; Liu, Y.; Chen, K.; Li, H.; Duan, Y.; Wu, W.; Shi, Y.; Guo, W. Deep-learning-based in-field citrus fruit detection and tracking. Hortic. Res. 2022, 9, uhac003. [Google Scholar] [CrossRef] [PubMed]
- Maldonado, W., Jr.; Barbosa, J.C. Automatic green fruit counting in orange trees using digital images. Comput. Electron. Agric. 2016, 127, 572–581. [Google Scholar] [CrossRef]
- Chen, S.W.; Shivakumar, S.S.; Dcunha, S.; Das, J.; Okon, E.; Qu, C.; Taylor, C.J.; Kumar, V. Counting apples and oranges with deep learning: A data-driven approach. IEEE Robot. Autom. Lett. 2017, 2, 781–788. [Google Scholar] [CrossRef]
- Fermo, I.R.; Cavali, T.S.; Bonfim-Rocha, L.; Srutkoske, C.L.; Flores, F.C.; Andrade, C.M.G. Development of a low-cost digital image processing system for oranges selection using hopfield networks. Food Bioprod. Process. 2021, 125, 181–192. [Google Scholar] [CrossRef]
- Wu, S.; Zhong, S.; Liu, Y. Deep residual learning for image steganalysis. Multimed. Tools Appl. 2018, 77, 10437–10453. [Google Scholar] [CrossRef]
- Krizhevsky, A.; Sutskever, I.; Hinton, G.E. Imagenet classification with deep convolutional neural networks. Adv. Neural Inf. Process. Syst. 2012, 25, 1097–1105. [Google Scholar] [CrossRef]
- LeCun, Y.; Bengio, Y.; Hinton, G. Deep learning. Nature 2015, 521, 436–444. [Google Scholar] [CrossRef]
- Santos, T.T.; de Souza, L.L.; dos Santos, A.A.; Avila, S. Grape detection, segmentation, and tracking using deep neural networks and threedimensional association. Comput. Electron. Agric. 2020, 170, 105247. [Google Scholar] [CrossRef]
- Kamilaris, A.; Prenafeta-Boldú, F.X. Deep learning in agriculture: A survey. Comput. Electron. Agric. 2018, 147, 70–90. [Google Scholar] [CrossRef]
- Kamilaris, A.; Prenafeta-Boldú, F.X. A review of the use of convolutional neural networks in agriculture. J. Agric. Sci. 2018, 156, 312–322. [Google Scholar] [CrossRef]
- Redmon, J.; Divvala, S.; Girshick, R.; Farhadi, A. You only look once: Unified, real-time object detection. In Proceedings of the Conference on Computer Vision and Pattern Recognition (CVPR), Las Vegas, NV, USA, 27–30 June 2016; pp. 779–788. [Google Scholar]
- Koirala, A.; Walsh, K.B.; Wang, Z.; McCarthy, C. Deep learning—Method overview and review of use for fruit detection and yield estimation. Comput. Electron. Agric. 2019, 162, 219–234. [Google Scholar] [CrossRef]
- Bresilla, K.; Perulli, G.D.; Boini, A.; Morandi, B.; Grappadelli, L.C.; Manfrini, L. Single-shot convolution neural networks for real-time fruit detection within the tree. Front. Plant Sci. 2019, 10, 611. [Google Scholar] [CrossRef]
- Ge, Y.; Xiong, Y.; Tenorio, G.L.; From, P.J. Fruit localization and environment perception for strawberry harvesting robots. IEEE Access 2019, 7, 147642–147652. [Google Scholar] [CrossRef]
- Liu, X.; Chen, S.W.; Liu, C.; Shivakumar, S.S.; Das, J.; Taylor, C.J.; Underwood, J.; Kumar, V. Monocular camera based fruit counting and mapping with semantic data association. IEEE Robot. Autom. Lett. 2019, 4, 2296–2303. [Google Scholar] [CrossRef]
- Sozzi, M.; Cantalamessa, S.; Cogato, A.; Kayad, A.; Marinello, F. Automatic bunch detection in white grape varieties using YOLOv3, YOLOv4, and YOLOv5 deep learning algorithms. Agronomy 2022, 12, 319. [Google Scholar] [CrossRef]
- Cardellicchio, A.; Solimani, F.; Dimauro, G.; Petrozza, A.; Summerer, S.; Cellini, F.; Renò, V. Detection of tomato plant phenotyping traits using YOLOv5-based single stage detectors. Comput. Electron. Agric. 2023, 207, 107757. [Google Scholar] [CrossRef]
- Wang, D.; He, D. Channel pruned YOLO V5s-based deep learning approach for rapid and accurate apple fruitlet detection before fruit thinning. Biosyst. Eng. 2021, 210, 271–281. [Google Scholar] [CrossRef]
- Long, J.; Shelhamer, E.; Darrell, T. Fully convolutional networks for semantic segmentation. In Proceedings of the IEEE Conference on Computer Vision and Pattern Recognition, Boston, MA, USA, 7–12 June 2015; pp. 3431–3440. [Google Scholar]
- Naranjo-Torres, J.; Mora, M.; Hernández-García, R.; Barrientos, R.J.; Fredes, C.; Valenzuela, A. A review of convolutional neural network applied to fruit image processing. Appl. Sci. 2020, 10, 3443. [Google Scholar] [CrossRef]
- Itakura, K.; Narita, Y.; Noaki, S.; Hosoi, F. Automatic pear and apple detection by videos using deep learning and a Kalman filter. OSA Contin. 2021, 4, 1688–1695. [Google Scholar] [CrossRef]
- Girshick, R. Fast r-cnn. In Proceedings of the IEEE Conference on Computer Vision and Pattern Recognition, Boston, MA, USA, 7–12 June 2015; pp. 1440–1448. [Google Scholar]
- Wang, C.-Y.; Bochkovskiy, A.; Liao, H.-Y.M. Scaled-yolov4: Scaling cross stage partial network. In Proceedings of the IEEE Computer Society Conference on Computer Vision and Pattern Recognition, Nashville, TN, USA, 20–25 June 2021; pp. 13029–13038. [Google Scholar]
- Bochkovskiy, A.; Wang, C.-Y.; Liao, H.-Y.M. Yolov4: Optimal speed and accuracy of object detection. arXiv 2020, arXiv:2004.109342020. [Google Scholar]
- Jiang, P.; Ergu, D.; Liu, F.; Cai, Y.; Ma, B. A Review of Yolo algorithm developments. Procedia Comput. Sci. 2022, 199, 1066–1073. [Google Scholar] [CrossRef]
- Koirala, A.; Walsh, K.B.; Wang, Z.; McCarthy, C. Deep learning for realtime fruit detection and orchard fruit load estimation: Benchmarking of ‘MangoYOLO’. Precis. Agric. 2019, 20, 1107–1135. [Google Scholar] [CrossRef]
- Liu, G.; Nouaze, J.C.; Mbouembe, P.L.T.; Kim, J.H. YOLO-tomato: A robust algorithm for tomato detection based on YOLOv3. Sensors 2020, 20, 2145. [Google Scholar] [CrossRef]
- Wu, L.; Ma, J.; Zhao, Y.; Liu, H. Apple detection in complex scene using the improved YOLOv4 model. Agronomy 2021, 11, 476. [Google Scholar] [CrossRef]
- Yan, B.; Fan, P.; Lei, X.; Liu, Z.; Yang, F. A real-time apple targets detection method for picking robot based on improved YOLOv5. Remote Sens. 2021, 13, 1619. [Google Scholar] [CrossRef]
- Junior, R.P.L. A Citricultura no Paraná; IAPAR: Londrina, Brazil, 1992. [Google Scholar]
- Roberts, D.; Wang, M.; Calderon, W.T.; Golparvar-Fard, M. An annotation tool for benchmarking methods for automated construction worker pose estimation and activity analysis. In Proceedings of the International Conference on Smart Infrastructure and Construction 2019 (ICSIC), Cambridge, UK, 8–10 July 2019; pp. 307–313. [Google Scholar]
- Rauf, H.T.; Saleem, B.A.; Lali, M.I.U.; Khan, M.A.; Sharif, M.; Bukhari, S.A.C. A citrus fruits and leaves dataset for detection and classification of citrus diseases through machine learning. Data Brief 2019, 26, 104340. [Google Scholar] [CrossRef] [PubMed]
- Tang, Y. TF.Learn: TensorFlow’s high-level module for distributed machine learning. arXiv 2016, arXiv:1612.04251. [Google Scholar]
- Wotherspoon, J. GitHub—theAIGuysCode/tensorflow-yolov4-tflite: YOLOv4, YOLOv4tiny, YOLOv3, YOLOv3-tiny Implemented in Tensorflow 2.0, Android. Convert YOLO. 2021. Available online: https://github.com/theAIGuysCode/tensorflow-yolov4-tflite (accessed on 20 December 2021).
- Wu, Y.; Lim, J.; Yang, M.-H. Online object tracking: A benchmark. In Proceedings of the 2013 IEEE Conference on Computer Vision and Pattern Recognition, Portland, OR, USA, 23–28 June 2013; pp. 2411–2418. [Google Scholar]
- Brdjanin, A.; Dardagan, N.; Dzigal, D.; Akagic, A. Single object trackers in opencv: A benchmark. In Proceedings of the 2020 International Conference on INnovations in Intelligent SysTems and Applications (INISTA), Novi Sad, Serbia, 24–26 August 2020; pp. 1–6. [Google Scholar]
- Danelljan, M.; Häger, G.; Khan, F.; Felsberg, M. Accurate scale estimation for robust visual tracking. In Proceedings of the British Machine Vision Conference, Nottingham, UK, 1–5 September 2014. [Google Scholar]
- Grabner, H.; Grabner, M.; Bischof, H. Real-time tracking via on-line boosting. Bmvc 2006, 1, 6. [Google Scholar]
- Babenko, B.; Yang, M.-H.; Belongie, S. Visual tracking with online multiple instance learning. In Proceedings of the 2009 IEEE Conference on computer vision and Pattern Recognition, Miami, FL, USA, 20–25 June 2009; pp. 983–990. [Google Scholar]
- Kalal, Z.; Mikolajczyk, K.; Matas, J. Forward-backward error: Automatic detection of tracking failures. In Proceedings of the 2010 20th International Conference on Pattern Recognition, Istanbul, Turkey, 23–26 August 2010; pp. 2756–2759. [Google Scholar]
- Lukezic, A.; Vojir, T.; Zajc, L.Č.; Matas, J.; Kristan, M. Discriminative correlation filter with channel and spatial reliability. In Proceedings of the IEEE Conference on Computer Vision and Pattern Recognition, Honolulu, HI, USA, 21–26 July 2017; pp. 6309–6318. [Google Scholar]
- King, D.E. Dlib-ml: A machine learning toolkit. J. Mach. Learn. Res. 2009, 10, 1755–1758. [Google Scholar]
- Culjak, I.; Abram, D.; Pribanic, T.; Dzapo, H.; Cifrek, M. A brief introduction to OpenCV. In Proceedings of the 2012 Proceedings of the 35th International Convention MIPRO, Opatija, Croatia, 21–25 May 2012; pp. 1725–1730. [Google Scholar]
Disclaimer/Publisher’s Note: The statements, opinions and data contained in all publications are solely those of the individual author(s) and contributor(s) and not of MDPI and/or the editor(s). MDPI and/or the editor(s) disclaim responsibility for any injury to people or property resulting from any ideas, methods, instructions or products referred to in the content. |
© 2023 by the authors. Licensee MDPI, Basel, Switzerland. This article is an open access article distributed under the terms and conditions of the Creative Commons Attribution (CC BY) license (https://creativecommons.org/licenses/by/4.0/).