Article

Development and Evaluation of a Small-Scale Apple Sorting Machine Equipped with a Smart Vision System

by
Nesar Mohammadi Baneh
1,
Hossein Navid
1,*,
Jalal Kafashan
2,*,
Hatef Fouladi
3 and
Ursula Gonzales-Barrón
4,5
1
Department of Biosystems Engineering, University of Tabriz, Tabriz 5166616471, Iran
2
Department of Mechanical Engineering in Agro Machinery & Mechanization, AERI, AREEO, Karaj 3135933151, Iran
3
Department of Laser and Plasma, University of Shahid Beheshti, Tehran 1983969411, Iran
4
Centro de Investigação de Montanha (CIMO), Instituto Politécnico de Bragança, Campus de Santa Apolónia, 5300-253 Bragança, Portugal
5
Laboratório para a Sustentabilidade e Tecnologia em Regiões de Montanha, Instituto Politécnico de Bragança, Campus de Santa Apolónia, 5300-253 Bragança, Portugal
*
Authors to whom correspondence should be addressed.
AgriEngineering 2023, 5(1), 473-487; https://doi.org/10.3390/agriengineering5010031
Submission received: 30 December 2022 / Revised: 30 January 2023 / Accepted: 1 February 2023 / Published: 24 February 2023

Abstract

:
One of the most important matters in international trades for many local apple industries and auctions is accurate fruit quality classification. Defect recognition is a key in online computer-assisted apple sorting machines. Because of the cavity structure of the stem and calyx regions, the system tends to mistakenly treat them as true defects. Furthermore, there is no small-scale sorting machine with a smart vision system for apple quality classification where it is needed. Thus, the current study focuses on a highly accurate and feasible methodology for stem and calyx recognition based on Niblack thresholding and a machine learning technique using k-nearest neighbor (k-NN) classifiers associated with a locally designed small-scale apple sorting machine. To find an appropriate mode, the effects of different numbers of k and metric distances on stem and calyx region detection were evaluated. Results showed the effectiveness of the value of k and Euclidean distances in recognition accuracy. It is found that the 5-nearest neighbor classifier and the Euclidean distance using 80 training samples produced the best accuracy rates, at 100% for stem and 97.5% for calyx. The significance of the result is very promising in fabricating an advanced small-scale and low-cost sorting machine with a high accuracy for the horticultural industry.

1. Introduction

Apples are one of the most popular fruits worldwide with an annual production of over 80 million metric tons. Thus, the apple industry, including sorting systems, is as important as the production of apples and the supply chain in the international trade market of fruit. In general, a key subsystem of an advanced fruit sorting system consists of a computer vision system (CVS). By now, the developments in computer vision have empowered a range of applications not only for fruit defect detection, but also for quality classification. On the other hand, the classification of fresh fruit has shown more complexities that should be resolved. Tian et al. [1] reviewed research that applied computer vision technology in agricultural automation and concluded that this technology has wide engagement potential in the future works of various agriculture-related matters. Moreover, computer-assisted fruit classification presents many challenges either due to similarities in color or characteristics [2,3,4]. The key problem of apple defect detection is identifying characteristics of defects such as size and location [5]. One of the challenges in computer vision-based apple sorting is no obvious distinction between the stem-end/calyx and real defect. The stem end/calyx appears in binary images as a dark object and may be confused with true defects. If a proper image processing method is not developed, the inspection system will tend to mistakenly sort the fruits, thereby causing a decrease in the accuracy of the classification system.
In order to solve this problem, researchers have applied numerous methods [3]. Some researchers attempted to design and construct a system to orientate the fruit in such a way that this region would not exist in the images [6,7,8,9]. Others used several algorithms for the identification of these regions. For instance, Cheng et al. [10] applied a near-infrared and mid-infrared dual camera system for online stem end/calyx recognition. Employing blob analysis and blob labeling to identify true defects from calyxes, the accuracy of the system to recognize both defects and stem ends/calyx was estimated at 92% in the range of 700–750 nm wavelengths. In another work, Ekramirad et al. [11] used NIR hyperspectral imaging for defect detection of apples in the wavelength of 900–1700 nm and a gradient tree boosting (GTB) ensemble classifier to achieve accuracy of up to 97%. However, the use of this system in industrial sorters was hindered by the high cost of the imaging equipment. Mohana and Probhakar [12] introduced shape features for stem and calyx region recognition and compared Fourier, Radon, and multifractal approaches for shape description. The stem end/calyx was segmented by multi-thresholding and differentiated from defects using multiple classifiers such as SVM, ANN, and the linear discriminant classifier (LDC). The best classification results were achieved by the SVM classifier, reaching accuracy rates of 98% and 94% for the stem region and calyx, respectively. The authors claimed that this method can be carried out offline and can be used as one of the steps in apple sorters. A hyperspectral imaging system for distinguishing the stem end and calyx from bruises was employed by Xing et al. [13]. Using this approach, accuracies of 100% for Golden Delicious and 98.33% for Jonagold apples were obtained. In this method, there was no fruit rotation, and the feeding system had a low speed. Mizushima and Lu [14] used a radius function for the stem detection of apples. The radius function is a function of the number of contour points and the distance between the contour points and the centroid [15]. Evolution-constructed features were utilized by Zhang et al. [16] for automated stem and calyx detection from images acquired in the infrared spectrum. Results showed that bruises and blemishes were differentiated from the stem/calyx at an accuracy of 94%. Differences in the 3D shape information of the stem/calyx and defects for automated stem/calyx detection were used by Jiang et al. [17]. Using the shape-from-shading method (SFS), 2D-NIR images of apples were extended to 3D reconstruction, and an overall accuracy of 90.15% was achieved. Wen and Tao [18] used a NIR/MIR imaging system for distinguishing the stem/calyx from defects. NIR is sensitive to true defects and the stem/calyx regions while the MIR camera is only sensitive to the stem/calyx. The stem ends and calyxes were classified with recognition rates of 98.86% and 99.34%, respectively. Penman [19] used blue light for the determination of concavities such as the stem and calyx on the apples and analyzed the reflection patterns that depend on the shape and orientation of apples. When the stem and calyx were near the center of view of the fruits, the results were better than when they were near the perimeter. Moallem et al. [20] considered two cases of stem location within the image inside and outside the apple and used a morphological method and a Mahalanobis distance classifier in a computer-based apple grading algorithm. The final decision for stem detection was made by combining the results of the two methods. They used k-means clustering method (k = 2) and Cb components of YCbCr color space for calyx detection. Results of detection for stem outside the apple and calyx was good, but the similarity between stem region and defects led to incorrect results in the case of stem inside the apple. In this experiment, the evaluation was based on one image per apple, meaning that more efforts would be necessary for real-time experiments involving multiple images of apples, in addition to improving the recognition in cases when the stem end is inside the apple. Sofu et al. [21] used the geometrical and color features of the stem, calyx, and actual defects to distinguish these areas in an online apple grading system. They do not report distinct results of stem/calyx detection, but the overall sorting rate results of their system were 79–89% for speeds of 0.2 and 0.05 m/s, respectively. Color, structural and textural features for discriminating between stem/calyx and true defects as well as RELIEF algorithm were used by Zhang et al. [22] for feature selection. A weighted RVM classifier is used for classification of candidate regions into stem/calyx or defects. Overall accuracy result was 95.63%. Zhang et al. [23] used a structured light system for reconstructing the 3D concave shape of the stem/calyx region. NIR structured light was used because it reflects the property of the material and is independent of color variation. The system correctly identified stem/calyx at an average accuracy of 96.8%. Lv et al. [24] used salient target detection by convex hull center priori and Markov adsorption chain and Otsu method thresholding for segmentation of red Fuji apple. The proposed method showed a better result than k- mean clustering method and region growing method. In another work, Lv et al. [25] used contrast limited adaptive histogram equalization (CLAHE) algorithm and R-B color difference for edge detection and segmentation of bagged green apple images to overcome problems of highlighted area caused by natural light reflection. By this approach, the more complete fruit region of apples was obtained. Beyaz [26] used a webcam and LabView platform for analyzing color change of damaged area on the Mondial Gala, Mitch Gala and Jonagold apple varieties. The method could determine the damages caused by finger touch force. Results showed that the analysis of images can be used for determining damaged area by changes in color of this region. Unay and Gosselin [27] proposed an approach based on statistical, textural and shape features, and introduced them into LDC, nearest neighbor, fuzzy nearest neighbor, SVM, and AdaBoost classifiers. Results showed that SVM presented the best performance, with a recognition accuracy of 99% for stem and 100% for calyx. Xia et al. [28] applies a fringe projection system to identify the stem and calyx of apples based on their concave shape. A 3D surface of the front half of an apple reconstructed and followed by threshold segmentation and a 2D convex hull technique. By this approach they could identify stem and calyx with 98.93% accuracy. Some researchers used Convolutional Neural Network (CNN) based on deep learning technology for image classification of food products. Liu et al. [29] stated that results obtained by CNN have better performance than traditional machine learning algorithms and used CNN as a depth feature extractor for food material such as apple. Defective apples by this approach could be classified by the rate of 96.5%. In another work, Wu et al. [30] also proposed an automatic detection method for stem and calyx detection based on laser induced light backscattering imaging and CNN algorithm and they obtained better results than conventional machine learning algorithms. Li et al. [31] developed a lightweight convolutional neural network so-called WearNet, for surface scratch detection and achieved precise results with a smaller model size and higher speed detection, in comparison to other commonly used CNN algorithms.
Most of the experiments carried out for stem and calyx recognition were offline and did not involve real-time sorting experiments. Furthermore, the high cost of the pieces of equipment involved prohibits their adoption in industrial scale. However, it is still a challenging task to accurately detect the apple defect area on the automatic sorting line [32]. Transition and feeding speed are other important factors that also affect the deployment of the approaches described in real-time applications. Hence, the absence of a comprehensive and practical apple sorting system is observed.
The objective of this research was to evaluate an online identification of stem/calyx of apple based on the nearest neighbor, k-nearest neighbor classifiers with different values of k and three metric distances, and segmentation by Niblack thresholding. Results were compared to obtain the best classifier and metric distance for an online apple sorting machine.

2. Materials and Methods

2.1. Image Acquisition System

The imaging system consisted of a VGA color camera with a resolution of 640 × 480 pixels. A lighting chamber with the dimensions of 51 × 35 × 40 cm (L, W, H) was used. Apples were conveyed by a biconical roller conveyor into the imaging chamber. The conveyor length in the field of view of the camera was 51 cm. So, the image resolution in the x-direction was calculated as:
r e s o l u t i o n   i n   t h e   x   d i r e c t i o n = 510 640 = 0.797 m m p i x  
The x-direction was the direction of forward movement of the conveyor. A pair of 10 white colored power LEDs with the color temperature of 6000–6500 k was used as a lighting source. This wavelength range was chosen to produce a maximum difference between the intensity of sound and defected area of apple surface. The light sources were arranged on two sides of the lighting chamber. The LEDs were placed in front of the chamber wall, and the light was reflected from the wall into the chamber. Also, a concave shape was made of calk paper and placed in front of the light source to act as a diffuser; this is, for light to be diffused in a more uniform way. A schematic of the light source arrangement is shown in Figure 1. Apples were rotated while moved forward by the biconical roller so that all sides of apples could be inspected by the imaging system. The biconical roller conveyor is also shown in Figure 2.

2.2. Stem and Calyx Recognition

The proposed system for stem and calyx recognition consisted of the training and the testing phase. In the training phase, images of apples were acquired offline by manually placing apples in different directions in the field of view (FOV) of the camera and saved individually in a personal computer.
Apples were framed in the FOV in such a way that different positions of stem/calyx in the images could be evaluated. In order to assess the effect of the number of training samples on the results, two training subsets consisting of 40 and 80 samples were created. In the testing phase, color RGB images were acquired at a frame rate of 30 fps and processed in real-time by the image processing system. For the classification of stem/calyx, two methods of NN and k-NN, using values of k from 3 to 5, were applied under three different metric distances.

2.3. Classification Method

Nowadays, classification techniques are one of the main approaches for food quality evaluation. Computer vision simulates human thinking by the application of advanced classification system. This method helps in complex, fast and consistent decision-making [33]. In a classification problem, chosen features of objects are measured and compared with a set of previously set criteria in order to sort such objects in a set of limited classes.
Nearest neighbor (NN) is one of the statistical classification methods that use statistical properties of observations from training samples to classify new objects. The NN is a non-parametric method that assigns a sample into a class. The class of a new sample is determined by measuring the distance to the nearest training set, which is called metric distance. The k-NN is an extended method of the NN by taking k nearest points into account. When using this classifier, several design choices must be evaluated. The most suitable number of neighbors of k and measuring distances should be defined in order to obtain the best predictions. Choosing a high number of k results in a linear classifier while choosing a low number of k results in a nonlinear classifier. Furthermore, the design towards acquiring suitable training data is an important issue. The notion of distance is one of the bases for classification. There is not an appropriate distance for all the problems; instead, the distance is specific to every classification problem. The right choice of distance is one of the most decisive steps for determining the object classes. In this study, three metric distances were used: maximum, sum (also known as Manhattan distance) and Euclidean. The Euclidean distance or Euclidean metric is the ordinary straight-line distance between two points in Euclidean space. The Euclidean distance between points of p and q is the length of the line segment connecting them ( p q ¯ )   as Equation (2) (Figure 3).
d ( p , q ) = d ( q , p ) = ( q 1 p 1 ) 2 + ( q 2 p 2 ) 2 + + ( q n p n ) 2 = i = 1 n ( q i p i ) 2  
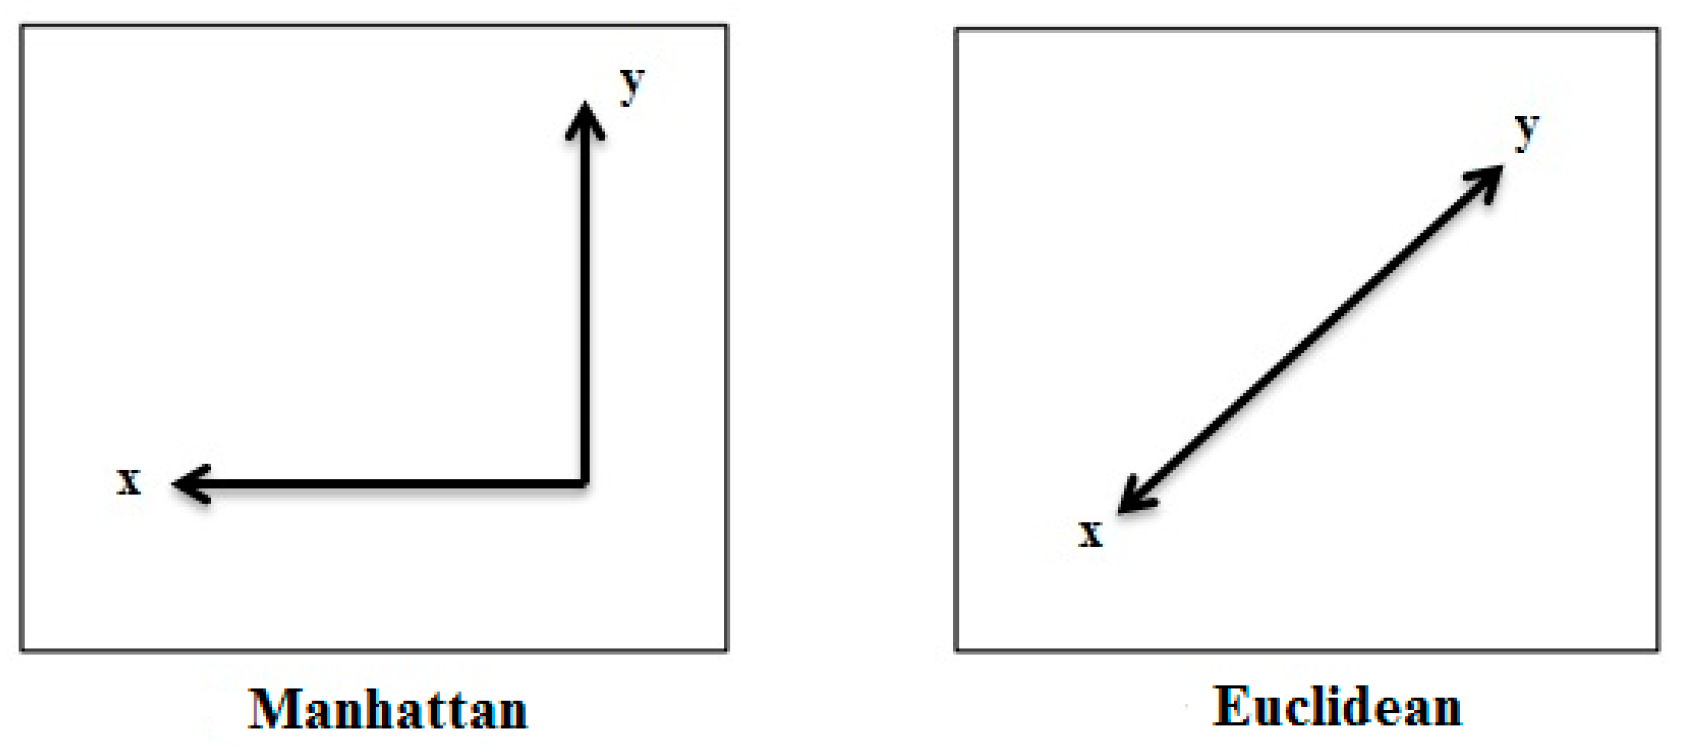
Taxicab geometry is a form of geometry in which the distance between two points is the sum of the absolute difference of their coordinates. The Manhattan distance, also known as rectilinear distance, city black distance or taxicab metric, is defined as the sum of lengths of the projections of the line segment between the points onto the coordinate axes (Equation (3)). The difference between Euclidean and Manhattan distances is shown in Figure 4.
d = i = 1 n | X i Y i |  
The k-nearest neighbor algorithm is one of the most popular classifiers used in food products sorting problems. It assigns an object to a category that is the most representative among the k-nearest samples of that object. Nearest samples are found by metric distance measure using the distance information of the nearest samples. Performance of k-NN highly depends on the k parameter and size of training set. Both of which should be large enough for optimal performance and small enough to avoid computational overload [34].

2.4. Feature Extraction

Feature extraction computes the feature vectors in the feature space from the input image. Necessary or appropriate properties features are extracted from the input image to distinguish images of different classes and, thus, prevent feeding of unnecessary information into the machine learning. The goal of classification is the definition of which feature to use. Feature values of different classes should have significant differences. In this particular classification study, different types of shape descriptors were used. A shape descriptor is a feature vector based on particle analysis measurements. In this research, the range of pixel-based size of stem and calyx regions was defined by multiple samples. Firstly, the algorithm defined the size of candidate regions, and only those candidate regions whose size fell within the range were introduced onto classifier. By doing this, the effect of size on the shape description was eliminated. Shape description was based on shape features that are invariant to scale changes, rotation, and mirror symmetry. Six features were used for shape description in particle classification algorithms for stem and calyx definition. These features are described below.
Feature 1 was Circularity of the sample. This feature is a function of perimeter and area of the sample. The circularity of a circle is 1. The circularity ratio of the calyx is higher than that of the stem.
Feature 2 was Elongation of the sample. This feature is especially useful for stem definition. Feature 3 was Convexity of the sample. Convexity is defined as the ratio of the convex hull over that of the original contour. Feature 4 was the presence of holes in the samples. Because stem/calyx regions and defects appeared in images as a hole, this feature is useful for the determination of these regions in the image.
Feature 5 was the spread of the sample, while Feature 6 was Slenderness of the shape.

2.5. Segmentation of Image by Niblack Thresholding

Images of apples were fed to the training phase algorithm. In order to evaluate the effect of the training set sample size, two training sets, containing 40 and 80 samples, were prepared. The proposed system contained the following steps: pre-processing, classification algorithm optimization, class definition, and training. In the image pre-processing step, the background was removed by setting the region of interest (ROI). In the next steps, the detection algorithms were applied to the ROI space instead of the whole image. The cropped RGB image was converted into a binary image by thresholding, so as to clarify the stem and calyx region or other dark regions with low intensity. Local thresholding was applied instead of general thresholding for segmentation. The threshold T ( x , y ) is a cut-off grey-level value used to convert an image into a black-and-white image, according to Equation (4),
b ( x , y ) = { 0   if   I ( x , y ) T ( x , y ) 1   otherwise  
where b (x, y) is the resulting binary image and I (x, y) is the intensity of a pixel in location (x, y) in the image. In this approach, images were converted into smaller sub-images and the threshold was defined for each of them based on local properties such as the variance range or the surface fitting parameters of neighbor pixels. One of the most efficient local thresholding methods is the Niblack thresholding algorithm. In this method, a threshold is defined for each region by moving a rectangle window across the grey-scale image. The threshold computed by the mean (m) and standard deviation (s) for all pixels in the rectangular region is:
T Niblack = m + k * s = m   + k 1 NP   ( P i m ) 2 = m + k   P i 2 NP m 2  
where NP is the number of all pixels in the image, T is the threshold value, m is the mean of P i pixels, and k is a constant that depends on the extent of noise in the background and is equal to −0.1 [35]. The local mean in Equation (5) could be defined by the convergence image of I( x 0 , y 0 ). The value of I( x 0 , y 0 ) from the primary image was computed by Equation (6):
I ( x 0 , y 0 ) = x = 1 x 0 y = 1 y 0 f ( x , y )    
The convergence image of the local mean in the rectangular region could be defined by Equation (7):
m ( x 0 , y 0 ) . N = I ( x 0 + Δ x , y 0 + Δ y ) + I ( x 0 Δ x 1 , y 0 Δ y 1 ) I ( x 0 Δ x 1 ,   y 0 + Δ y ) I ( x 0 + Δ x , y 0 Δ y 1 )  
where m ( x 0 , y 0 ) is the local mean value in the rectangular region with the coordinate center ( x 0 , y 0 ) ;   ( y 0 Δ y , x 0 Δ x ) is the top left corner coordinate; ( y 0 + Δ y , x 0 + Δ x ) is the down right corner coordinate; and N is the number of pixels in the rectangle, which is computed by:
N = ( 2 Δ x + 1 ) ( 2 Δ y + 1 )  
It is well-known that local thresholding leads to more accurate results than universal thresholding. However, results depend on the rectangular window size. When the rectangle size is smaller, more accurate results are obtained, although at the expense of longer processing times. The images were converted to a binary image whereby dark objects appeared as black regions. The dark objects were separated from bright ones, while objects touching the ROI were deleted. In the binary image, all of the dark regions except the stem/calyx region were removed. The remaining object in the image was a dark region belonging to the stem or calyx. Two methods of NN and k-NN were appraised for classification. The number of k was varied from 3 to 5 in order to assess the effect of k. The maximum, Manhattan, and Euclidean distance metrics were selected one by one. Two classes of stem and calyx were introduced. Then, in the last step, the recognition algorithm was trained. Apples were placed in different positions on the conveyor so that the system could be trained to locate the stem/calyx located in many situations in the images, such as the center and near the periphery of the apple.

3. Results and Discussion

The results of training were set by k-NN, k = 3, and Euclidean metric distance, as shown in Figure 5. Evaluations of 80 training samples showed that the minimum area of the calyx region was 80 pixels, and the maximum area of the stem region was 250 pixels. Thus, to reduce the computational time of the process, only the regions whose areas were greater than 80 pixels were evaluated. The classification results of stem and calyx detection are shown in Table 1.
As can be seen in Table 1, the accuracy of the system for stem classification is high, and it can detect the stem completely by all classification methods and metric distances. One of the reasons is the special shape of the stem region, which facilitates its discrimination from true defects. Detection accuracy of the calyx was lower than the stem. The calyx shape and the pixel-based area of this region is more similar to true defects, and thus the system incurs more errors differentiating the calyx from true defects. When the calyx falls near the periphery of the apple boundary in the image, the error rate can be even higher. By increasing the number of training samples, the accuracy of the system in calyx classification using all classification methods and metric distances could be increased. The accuracy was maximized by the k-NN with k = 5 and Euclidean distance.
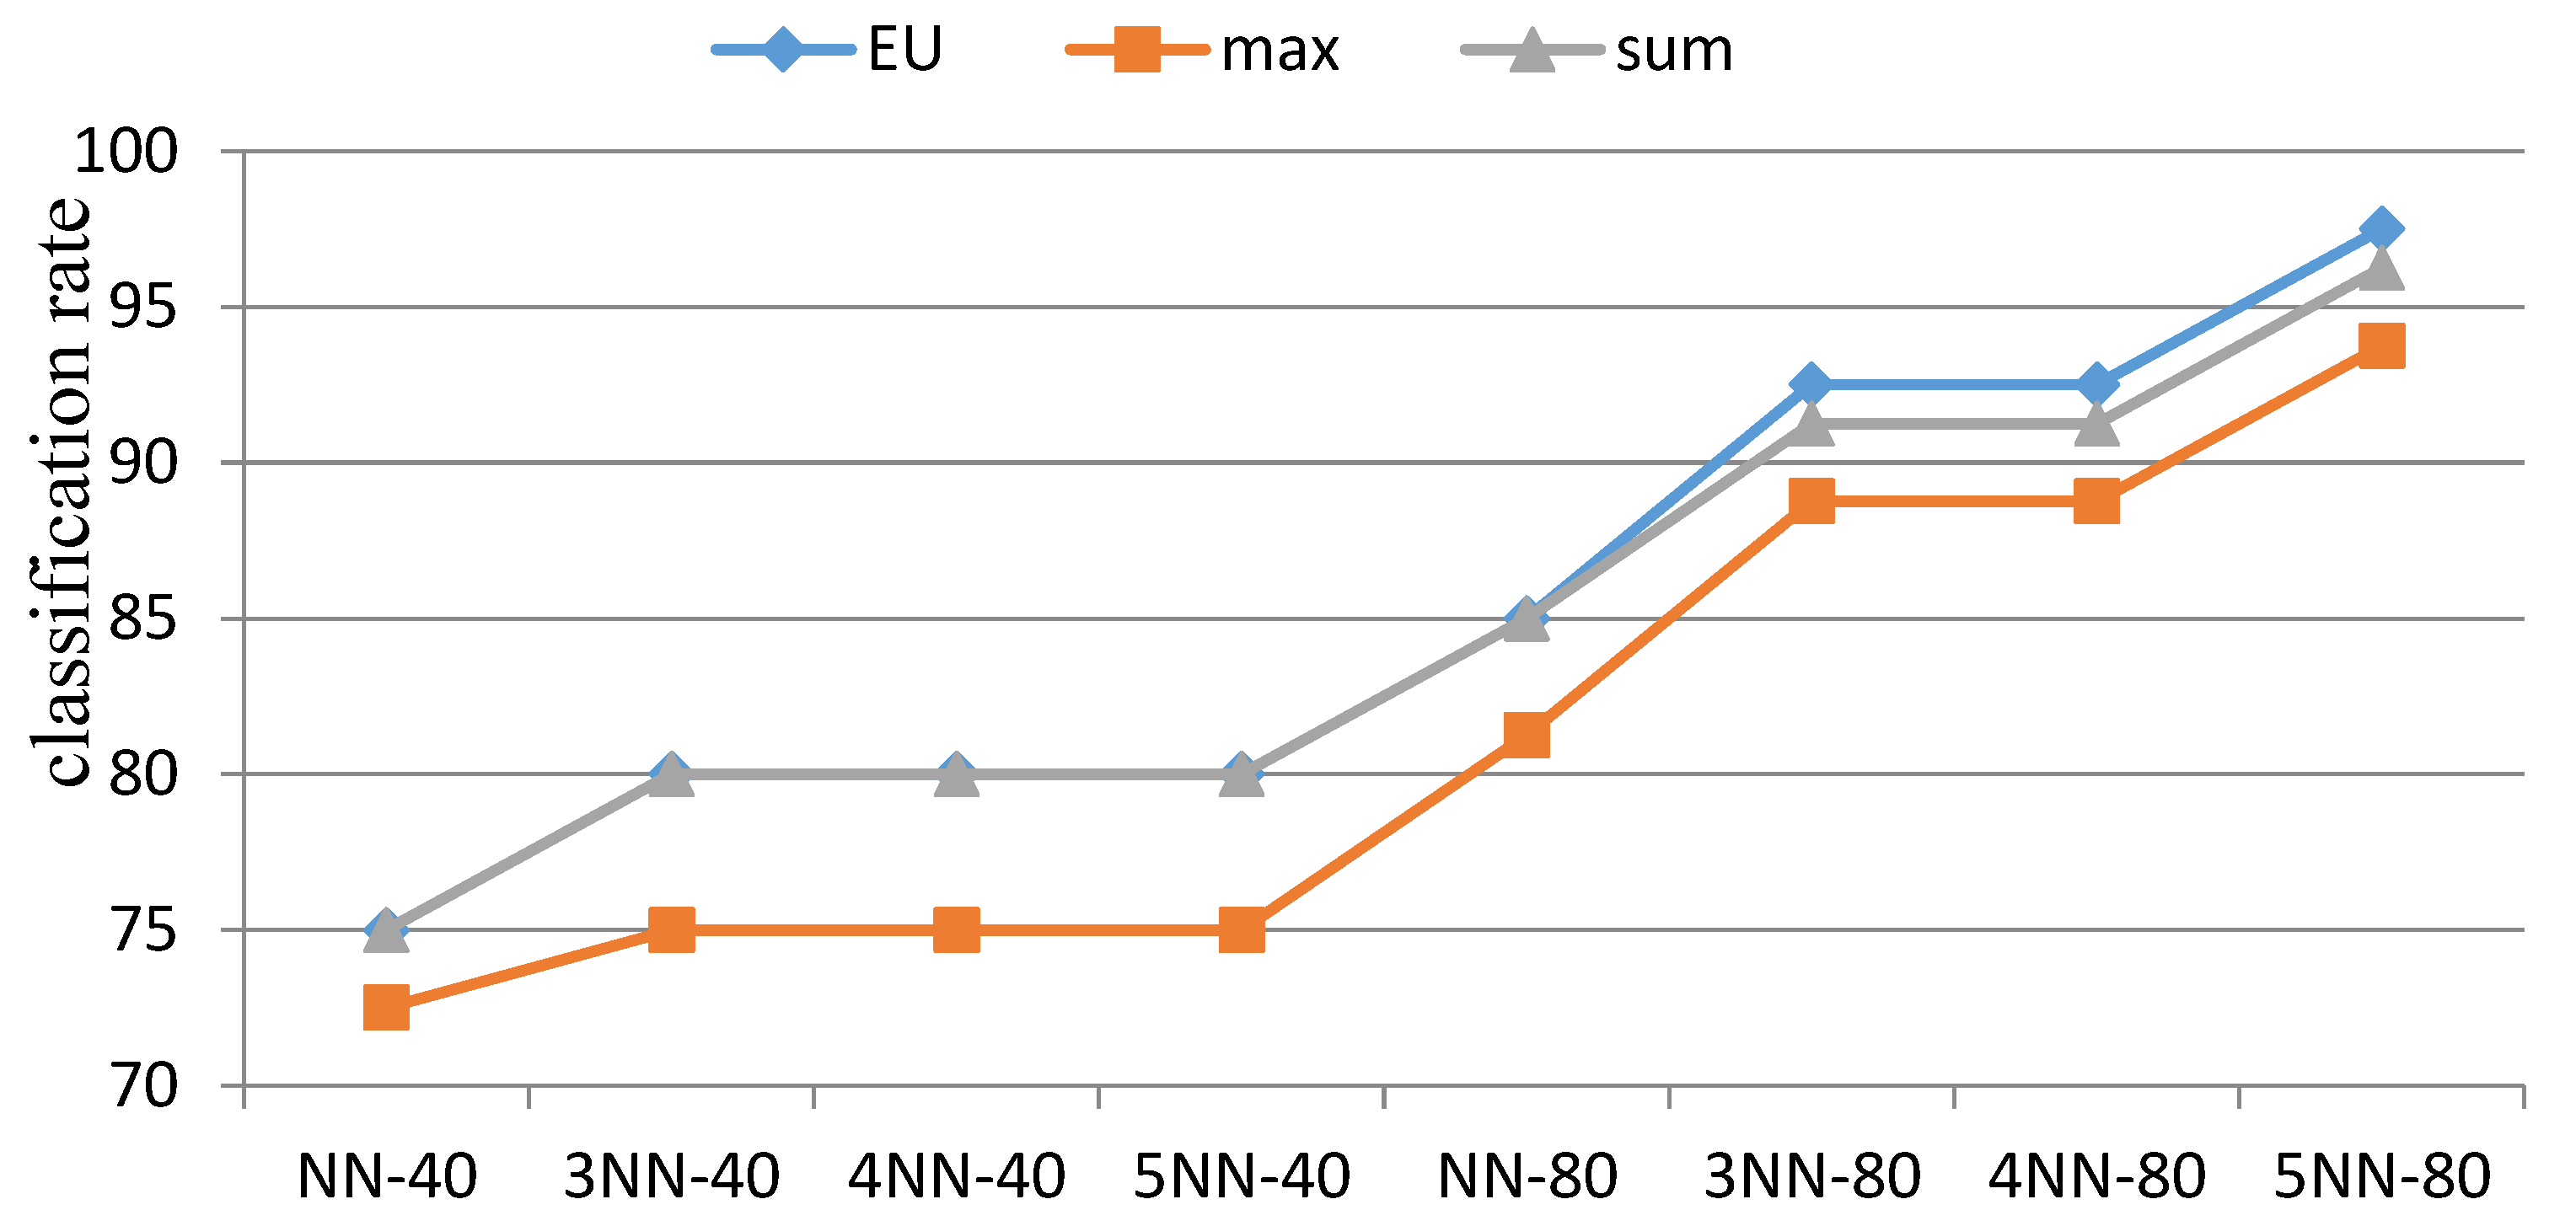
The number of training samples has an important effect on the performance of the classification algorithms. Using an insufficient number of training samples, the classification accuracy would not have significantly increased, even using the strongest algorithm. The results of the calyx classification by four types of classifiers are shown in Figure 6. Using 40 samples for training, an increase in k had a negligible effect on the detection accuracy; however, when the training set was doubled, increasing k led to a noticeable improvement in the classification rate. The accuracy was the highest at k = 5 and using the Euclidean distance. Classification rates by Euclidean and sum metrics were generally higher than the maximum distance metric, although significant differences were not observed between the Euclidean and sum distances. In this research, the poorest performance was observed for the maximum metric distance. Simultaneous effects of the k number and training set on calyx classification are shown in Figure 7. By increasing k and the training samples, accuracy was improved. For k = 3, this increase was significant, although the classification performance was not improved by increasing k from 3 to 4. By increasing k, the classification rate by Euclidean distance was higher than the other two metric distances.
All the classifiers could completely detect the apple stem. Thus, an identification score was defined as a criterion for evaluating the different situations in stem detection. The classification score is an indicator for identifying a class of a given sample using the classifier. In general, if the identification score is higher than 800, it is considered as appropriate, and if higher than 900, it is desirable. The highest value of the identification score was assumed to be 1000. Analysis of variance was done on the identification scores by assessing the simultaneous effect of the classification algorithm, metric distance, and training number. The results (Table 2) show that metric distance had no significant effect on the stem identification score, while the effects of training sample size and classification method were significant at 1% and 5% levels, respectively. The analysis of variance showed that the interaction effect of the metric distance and the number of training samples was not significant on stem identification score, although interactions were significant. The interactions between training sample size and classification method were significant at the 1% level; between metric distance and classification method at the 5% level; and the three-way interaction at the 1% level. The comparisons between the means of these three factors are shown in Table 3. Results showed that the 4-NN classifier, Euclidean metric distance, and 80 training samples led to the best performance, although the differences between the three classifiers were only slight.
The poorest result was obtained by using 40 training samples, the NN classifier, and the maximum distance. Detection rates of the maximum distance were lower than the other two metrics in all conditions. In addition, k = 5 produced maximum accuracy. However, by increasing k, the computational time was increased; therefore, a compromise should be attained between accuracy and speed detection for the stem/calyx. Further increasing the value of k showed that the accuracy does not change significantly, but the computational time increases.
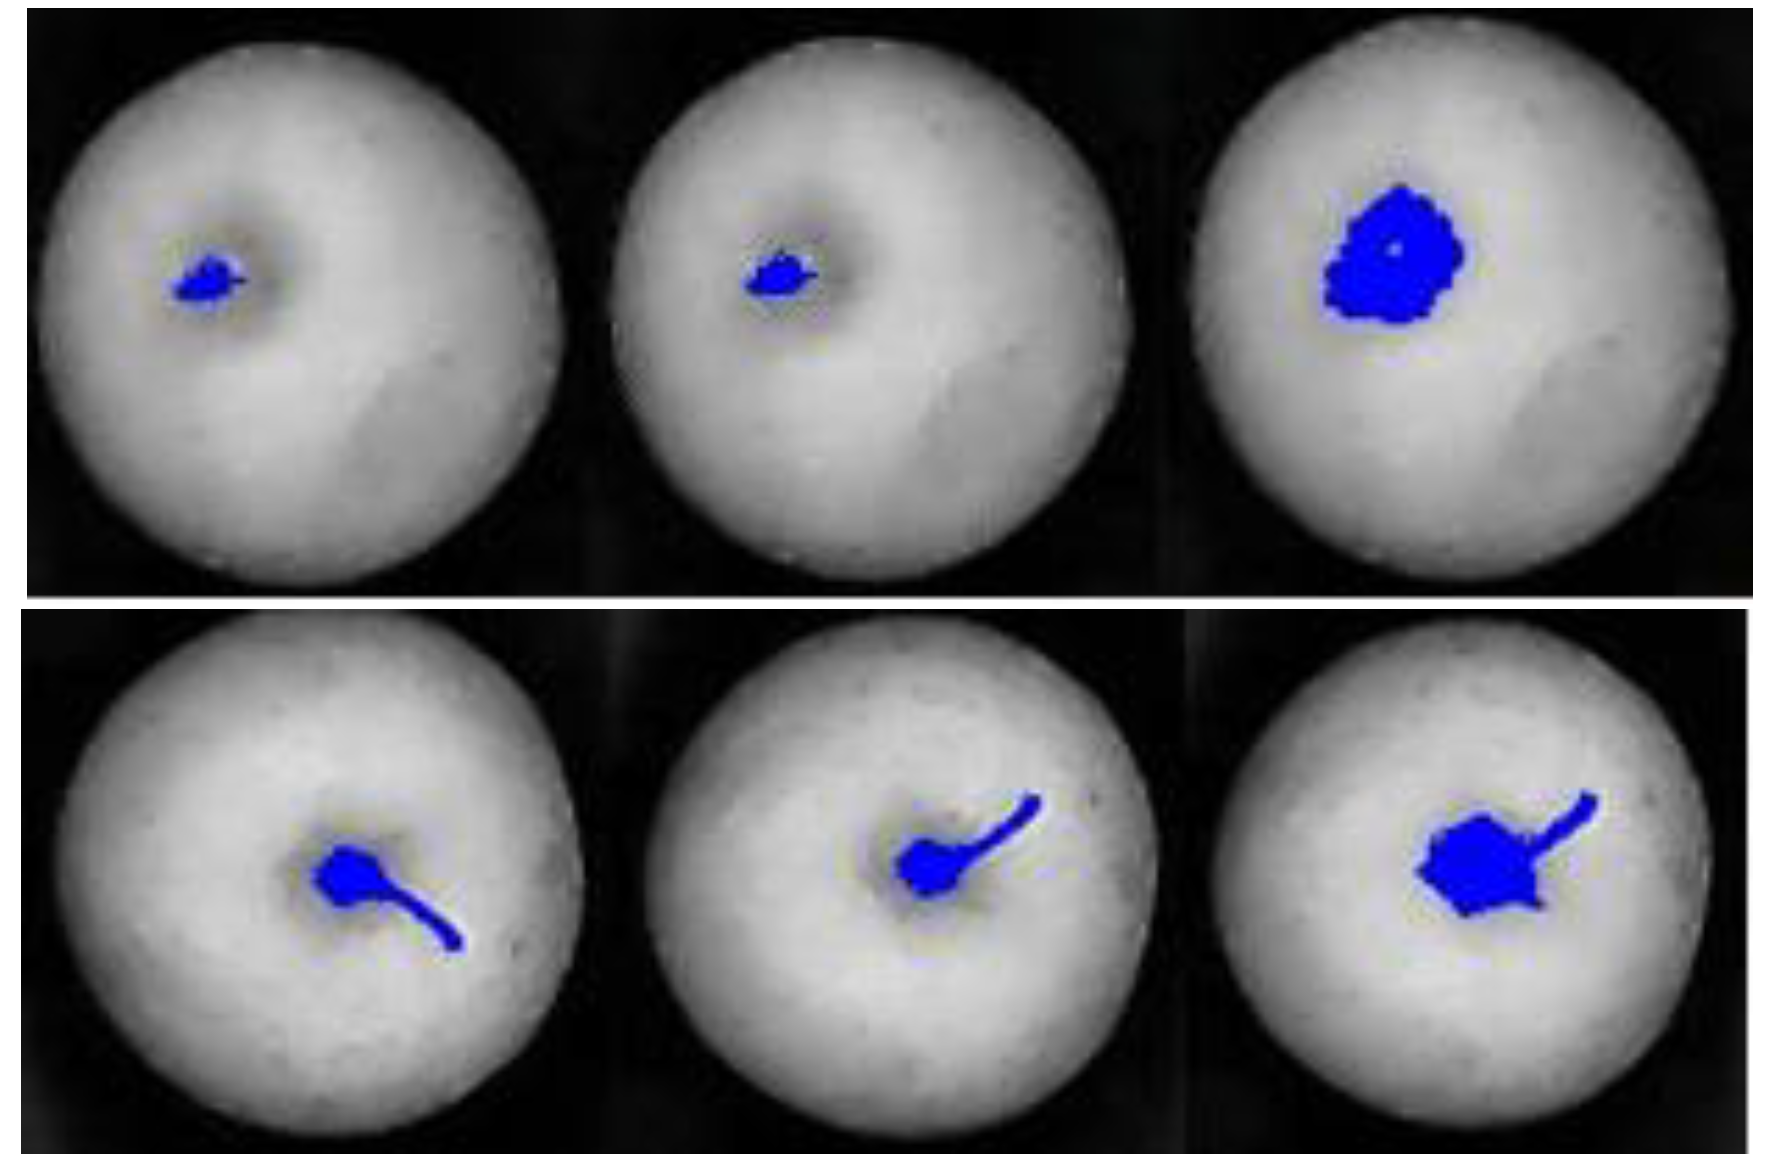
The results show that the success of the algorithm in identifying the stem/calyx region highly depended on training classifier. Local thresholding is another determinant of the classification accuracy. By this approach, the segmentation of the candidate region can be more accurately performed. Figure 8 shows the segmentation of the stem and calyx regions using clustering and inter-variance as the global thresholding approach and Niblack as the local thresholding approach. As can be seen in Figure 8, the regions segmented by clustering and inter-variance were smaller than the exact shape of the stem and calyx. One of the advantages of this method is the accurate shape extraction by local thresholding. The main disadvantage of using local thresholding is its high computational load, particularly for the online classification process. Nevertheless, by precisely defining the search window and other related parameters, this computational time could be optimized in this study.
In this study, the combination of local thresholding and machine learning led to more precise results than previous works. The results were comparable to other studies that utilized complicated and high-cost equipment such as near-infrared structural lighting [23,36] and hyperspectral imaging [37]. Unlike when using a thermal imaging camera, uniform temperature distribution is unnecessary in this methodology. Moreover, noises due to uneven lighting have no problematic matter compared to hyperspectral imaging. In the study, the uniform illumination caused the local thresholding to increase the precision of binarization. Here, up to 97% accuracy was obtained for calyx recognition and all of stem end regions either with or without the stem in the images were successfully recognized (100%). The results were improved both in precision and computational time in comparison to other documented studies. For example, the recognition rate reported using the SVM classifier and monochrome camera with a 750 nm filter was 100% for stem and 99.5% for calyx, but the system only captured one view of each fruit [27]. Indeed, this reduces the value of quality control since other views of fruit are significantly unobserved. Zhang et al. [23] used NIR-coded structural light and obtained a precision of 90.25%, Yu et al. [38] used hyperspectral imaging and obtained a precision of 95%, and Wu et al. [30] used laser-scattering spectroscopic images and CNN algorithms and obtained a precision of 92.5%. This shows that the results add value to quality control, discrimination accuracy, computational time, and the development of low-cost and small-scale fruit sorting machines.
The cost of a machine vision system mainly depends on the cost of imaging equipment. In this research, a conventional VGA camera was used whose imaging system is significantly more cost-effective in comparison to other performed research. Moreover, the use of an appropriate algorithm and a designed conveying system eliminated having to use expensive cameras and a complicated lighting system. The cost of the conveying system was also comparable to the complex equipment used by some researchers in Table 4.

4. Conclusions

In this research, a combination of Niblack local thresholding and machine learning techniques was used for online stem/calyx detection in a small-scale and low-cost apple-sorting machine. Niblack thresholding produces precise segmentations of apple images, allowing the extraction of the stem/calyx region. The recognition performance is directly dependent on the segmentation process. A precise stem/calyx shape extraction leads to more precise feature extraction and classification. Both the true defects and the stem/calyx regions were identified in this segmentation step. By removing the true defects, the tested classifiers were trained by binary images of the stem/calyx. When the calyx region fell near the boundary of the apple in the images, the accuracy of detection was lower. The 5-nearest neighbor classifier and the Euclidean distance using 80 training samples produced the best accuracy rates, at 100% for stem and 97.5% for calyx. By eliminating many pre-processing algorithms and having precise detection of the stem/calyx region shapes, the computational time was reduced, which makes it possible to use this method in online processes. The required time for image processing operations was 201 ms, and the computing time for stem and calyx detection was 60 ms by a PC Intel(R) Core (TM) 2 Due CPU. In this system, five apples could be classified per second. While the determination of the best classifier is still a challenging task, researchers have attempted different types of classifiers. In this study, the combination of local thresholding with k-NN produced encouraging results. The combined algorithms led to increased accuracy in detection, which would also be appropriate for online detection in real-time sorting processes by commercial equipment on a small scale. As a future work, this could be implemented in real-time grading operations not only for apples, but also for other similar fruits.

Author Contributions

Methodology, N.M.B., H.N. and J.K.; software, H.F.; investigation, N.M.B., H.N. and J.K.; writing—original draft preparation, N.M.B., H.N. and J.K.; writing—review and editing, U.G.-B.; project administration, H.N.; supervision, J.K. All authors have read and agreed to the published version of the manuscript.

Funding

This research received no external funding.

Data Availability Statement

The data are not publicly available due to the restrictions and privacy of the project.

Acknowledgments

The authors are immensely grateful to Yuita arum Sari from computer vision research group of Brawijia University, Indonesia and Gaetano Impoco, researcher in image analyze and application of CoRFiLac, Italy for their valuable comments either on an earlier version of the abstract or on the first edition of the manuscript.

Conflicts of Interest

The authors declare no conflict of interest.

References

  1. Tian, H.; Wang, T.; Liu, Y.; Qiao, X.; Li, Y. Computer vision technology in agricultural automation—A review. Inf. Process. Agric. 2019, 7, 1–19. [Google Scholar] [CrossRef]
  2. Dutta, M.K.; Sengar, N.; Minhas, N.; Sarkar, B.; Goon, A.; Banerjee, K. Image processing based classification of grapes after pesticide exposure. LWT Food Sci. Technol. 2016, 72, 368–376. [Google Scholar] [CrossRef]
  3. Baneh, N.M.; Navid, H.; Kafashan, J. Mechatronic components in apple sorting machines with computer vision. J. Food Meas. Charact. 2018, 12, 1135–1155. [Google Scholar] [CrossRef]
  4. Saldana, E.; Siche, R.; Castro, W.; Huaman, R.; Quevedo, R. Measurement parameter of color on yacon (Smallanthus sonchi-folius) slices using a computer vision system. LWT Food Sci. Technol. 2014, 59, 1220–1226. [Google Scholar] [CrossRef]
  5. Zhang, W.; Hu, J.; Zhou, G.; He, M. Detection of Apple Defects Based on the FCM-NPGA and a Multivariate Image Analysis. IEEE Access 2020, 8, 38833–38845. [Google Scholar] [CrossRef]
  6. Bennedsen, B.; Peterson, D.; Tabb, A. Identifying defects in images of rotating apples. Comput. Electron. Agric. 2005, 48, 92–102. [Google Scholar] [CrossRef]
  7. Blasco, J.; Aleixos, N.; Molto, E. Machine Vision System for Automatic Quality Grading of Fruit. Biosyst. Eng. 2003, 85, 415–423. [Google Scholar] [CrossRef]
  8. Chio, Y.C.; Chen, C.H. Development of online apple bruise detection system. Eng. Agric. Environ. Food 2017, 10, 223–232. [Google Scholar] [CrossRef]
  9. Throop, J.; Aneshansley, D.; Anger, W.; Peterson, D. Quality evaluation of apples based on surface defects: Development of an automated inspection system. Postharvest Biol. Technol. 2005, 36, 281–290. [Google Scholar] [CrossRef]
  10. Cheng, X.; Tao, Y.; Chen, Y.R.; Lou, Y. NIR-MIR dual sensor machine vision system for online apple stem end/calyx recog-nition. Trans. ASAE 2003, 46, 551–558. [Google Scholar] [CrossRef] [Green Version]
  11. Ekramirad, N.; Khaled, A.Y.; Doyle, L.E.; Loeb, J.R.; Donohue, K.D.; Villanueva, R.T.; Adedeji, A.A. Nondestructive Detection of Codling Moth Infestation in Apples Using Pixel-Based NIR Hyperspectral Imaging with Machine Learning and Feature Selection. Foods 2021, 11, 8. [Google Scholar] [CrossRef] [PubMed]
  12. Mohana, S.H.; Prabhakar, C.J. Stem- calyx recognition of an apple using shape descriptors. Signal Image Process. Ternational J. 2014, 5, 17–31. [Google Scholar]
  13. Xing, J.; Jancsók, P.; De Baerdemaeker, J. Stem-end/Calyx Identification on Apples using Contour Analysis in Multispectral Images. Biosyst. Eng. 2007, 96, 231–237. [Google Scholar] [CrossRef]
  14. Mizushima, A.; Lu, R. A low-cost color vision system for automatic estimation of apple fruit orientation and maximum equatorial diameter. Trans. ASABE 2013, 56, 813–827. [Google Scholar]
  15. Kafashan, J.; Tijskens, B.; Ramon, H. Shape modelling of fruit by image processing. Commun. Agric. Appl. Biol. Sci. 2005, 70, 161–164. [Google Scholar]
  16. Zhang, D.; Lillywhite, K.D.; Lee, D.-J.; Tippetts, B.J. Automated apple stem end and calyx detection using evolution-constructed features. J. Food Eng. 2013, 119, 411–418. [Google Scholar] [CrossRef]
  17. Jiang, L.; Zhu, B.; Cheng, X.; Luo, Y.; Tao, Y. 3D structure reconstruction and analysis in automated apple stem-end/calyx identification. Trans. ASABE 2009, 52, 1775–1784. [Google Scholar] [CrossRef]
  18. Wen, Z.; Tao, Y. Dual-camera NIR/MIR imaging system for stem-end/calyx identification in apple defect sorting. Trans. ASAE 2000, 43, 449–452. [Google Scholar] [CrossRef]
  19. Penman, D.W. Determination of stem and calyx location on apples using automatic visual inspection. Comput. Electron. Agric. 2001, 33, 7–18. [Google Scholar] [CrossRef]
  20. Moallem, P.; Serajoddin, A.; Pourghassem, H. Computer vision-based apple grading for golden delicious apples based on surface features. Inf. Process. Agric. 2017, 4, 33–40. [Google Scholar] [CrossRef] [Green Version]
  21. Sofu, M.; Er, O.; Kayacan, M.; Cetişli, B. Design of an automatic apple sorting system using machine vision. Comput. Electron. Agric. 2016, 127, 395–405. [Google Scholar] [CrossRef]
  22. Zhang, B.; Huang, W.; Wang, C.; Gong, L.; Zhao, C.; Liu, C.; Huang, D. Computer vision recognition of stem and calyx in apples using near-infrared linear-array structured light and 3D reconstruction. Biosyst. Eng. 2015, 139, 25–34. [Google Scholar] [CrossRef]
  23. Zhang, C.; Zhao, C.; Huang, W.; Wang, Q.; Liu, S.; Li, J.; Guo, Z. Automatic detection of defective apple using NIR coded and structured light and fast lightness correction. J. Food Eng. 2017, 203, 69–82. [Google Scholar] [CrossRef]
  24. Lv, J.; Ni, H.; Wang, Q.; Yang, B.; Xu, L. A segmentation method of red apple image. Sci. Hortic. 2019, 256, 108615. [Google Scholar] [CrossRef]
  25. Lv, J.; Wang, F.; Xu, L.; Ma, Z.; Yang, B. A segmentation method of bagged green apple image. Sci. Hortic. 2019, 246, 411–417. [Google Scholar] [CrossRef]
  26. Beyaz, A. Harvest glove and LabView based mechanical damage determination on apples. Sci. Hortic. 2018, 228, 49–55. [Google Scholar] [CrossRef]
  27. Unay, D.; Gosselin, B. Stem and calyx recognition on ‘Jonagold’ apples by pattern recognition. J. Food Eng. 2007, 78, 597–605. [Google Scholar] [CrossRef]
  28. Xia, M.; Zhu, H.; Wang, Y.; Cai, J.; Liu, L. Stem and Calyx Identification of 3D Apples Using Multi-Threshold Segmentation and 2D Convex Hull. Photonics 2022, 9, 346. [Google Scholar] [CrossRef]
  29. Liu, Y.; Pu, H.; Sun, D.W. Efficient extraction of deep image features using convolutional neural network (CNN) for applica-tions in detecting and analysing complex food matrices. Trends Food Sci. Technol. 2021, 113, 193–204. [Google Scholar] [CrossRef]
  30. Wu, A.; Zhu, J.; Ren, T. Detection of apple defect using laser-induced light backscattering imaging and convolutional neural network. Comput. Electr. Eng. 2019, 81, 106454. [Google Scholar] [CrossRef]
  31. Li, W.; Zhang, L.; Wu, C.; Cui, Z.; Niu, C. A new lightweight deep neural network for surface scratch detection. Int. J. Adv. Manuf. Technol. 2022, 123, 1999–2015. [Google Scholar] [CrossRef]
  32. Liang, X.; Jia, X.; Huang, W.; He, X.; Li, L.; Fan, S.; Li, J.; Zhao, C.; Zhang, C. Real-Time Grading of Defect Apples Using Semantic Segmentation Combination with a Pruned YOLO V4 Network. Foods 2022, 11, 3150. [Google Scholar] [CrossRef] [PubMed]
  33. Abdullah, M.; Guan, L.; Lim, K.; Karim, A. The applications of computer vision system and tomographic radar imaging for assessing physical properties of food. J. Food Eng. 2004, 61, 125–135. [Google Scholar] [CrossRef]
  34. Van der Heiden, F.; Duin, R.; de Ridder, D.; Tax, D. Classification, Parameter Estimation, and State Estimation: An Engineering Approach Using MATLAB; Wiley: New York, NY, USA, 2004. [Google Scholar]
  35. Nirpjeet, K.E.; Rajpreet, K.E. A review on various methods of image thresholding. Int. J. Comput. Sci. Eng. 2011, 3, 3441–3443. [Google Scholar]
  36. Zhang, B.; Huang, W.; Gong, L.; Li, J.; Zhao, C.; Liu, C.; Huang, D. Computer vision detection of defective apples using automatic lightness correction and weighted RVM classifier. J. Food Eng. 2015, 146, 143–151. [Google Scholar] [CrossRef]
  37. Pineda, I.; Alam, N.; Gwun, O. Calyx and Stem Discrimination for Apple Quality Control Using Hyperspectral Imaging. Int. Conf. Technol. Trends 2018, 274–287. [Google Scholar] [CrossRef]
  38. Yu, Y.; Velastin, S.A.; Yin, F. Automatic grading of apples based on multi-features and weighted K-means clustering algorithm. Inf. Process. Agric. 2020, 7, 556–565. [Google Scholar] [CrossRef]
  39. Xiao-Bo, Z.; Jie-Wen, Z.; Yanxiao, L.; Holmes, M. In-line detection of apple defects using three color cameras system. Comput. Electron. Agric. 2009, 70, 129–134. [Google Scholar] [CrossRef]
  40. Unay, D.; Gosselin, B.; Kleynen, O.; Leemans, V.; Destain, M.F.; Debeir, O. Automatic grading of bi-colored apples by mul-tispectral machine vision. Comput. Electron. Agric. 2011, 75, 204–212. [Google Scholar] [CrossRef] [Green Version]
  41. Baranowski, P.; Mazurek, W.; Pastuszka-Woźniak, J.; Majewska, U. Detection of early bruises in apples using hyperspectral data and thermal imaging. J. Food Eng. 2012, 110, 345–355. [Google Scholar] [CrossRef]
  42. Dubey, S.R.; Jalal, A.S. Detection and Classification of Apple Fruit Diseases Using Complete Local Binary Patterns. In Proceedings of the 2012 Third International Conference on Computer and Communication Technology, Allahabad, India, 23–25 November 2012; pp. 346–351. [Google Scholar] [CrossRef]
  43. Suresha, M.; Shilpa, N.A.; Soumya, B. Apples grading based on SVM classifier. Int. J. Comput. Appl. 2012, 975, 8878. [Google Scholar]
  44. Mohana, S.H.; Prabhakar, C.J.; Praveen Kumar, P.U. Surface defect detection and grading of apples. In Proceedings of the International conference on MPCIT, Shimoga, India, 19–21 December 2013; pp. 57–64. [Google Scholar]
  45. Mizushima, A.; Lu, R. An image segmentation method for apple sorting and grading using support vector machine and Otsu’s method. Comput. Electron. Agric. 2013, 94, 29–37. [Google Scholar] [CrossRef]
  46. Susnjak, T.; Barczak, A.; Reyes, N. A decomposition machine-learning strategy for automated fruit grading. In Proceedings of the World Congress on Engineering and Computer Science, Vol II WCECS, San Francisco, CA, USA, 23–25 October 2013. [Google Scholar]
  47. Mendoza, F.; Lu, R.; Cen, H. Grading of apples based on firmness and soluble solids content using Vis/SWNIR spectroscopy and spectral scattering techniques. J. Food Eng. 2014, 125, 59–68. [Google Scholar] [CrossRef]
  48. Toylan, H.; Kuscu, H. A Real-Time Apple Grading System Using Multicolor Space. Sci. World J. 2014, 2014, 292681. [Google Scholar] [CrossRef] [PubMed] [Green Version]
  49. Sadegaonkar, V.D.; Wagh, K.H. Automatic sorting using computer vision and image processing for improving apple quality. Int. J. Innov. Res. Dev. 2015, 4, 11–14. [Google Scholar]
  50. Zhang, B.; Fan, S.; Li, J.; Huang, W.; Zhao, C.; Qian, M.; Zheng, L. Detection of Early Rottenness on Apples by Using Hyperspectral Imaging Combined with Spectral Analysis and Image Processing. Food Anal. Methods 2015, 8, 2075–2086. [Google Scholar] [CrossRef]
  51. Vakilian, K.A.; Massah, J. An apple grading system according to European fruit quality standard using Gabor filter and arti-ficial neural networks. Sci. Study Res. Chem. Chem. Eng. Biotechnol. Food Ind. 2016, 17, 75–85. [Google Scholar]
  52. Keresztes, J.C.; Goodarzi, M.; Saeys, W. Real-time pixel based early apple bruise detection using short wave infrared hyperspectral imaging in combination with calibration and glare correction techniques. Food Control 2016, 66, 215–226. [Google Scholar] [CrossRef]
  53. Fan, S.; Li, J.; Zhang, Y.; Tian, X.; Wang, Q.; He, X.; Zhang, C.; Huang, W. On line detection of defective apples using computer vision system combined with deep learning methods. J. Food Eng. 2020, 286, 110102. [Google Scholar] [CrossRef]
  54. Henila, M.; Chithra, P. Segmentation using fuzzy cluster-based thresholding method for apple fruit sorting. IET Image Process. 2020, 14, 4178–4187. [Google Scholar] [CrossRef]
  55. Shurygin, B.; Smirnov, I.; Chilikin, A.; Khort, D.; Kutyrev, A.; Zhukovskaya, S.; Solovchenko, A. Mutual Augmentation of Spectral Sensing and Machine Learning for Non-Invasive Detection of Apple Fruit Damages. Horticulturae 2022, 8, 1111. [Google Scholar] [CrossRef]
  56. Tang, Y.; Bai, H.; Sun, L.; Wang, Y.; Hou, J.; Huo, Y.; Min, R. Multi-Band-Image Based Detection of Apple Surface Defect Using Machine Vision and Deep Learning. Horticulturae 2022, 8, 666. [Google Scholar] [CrossRef]
Figure 1. Schematic of light sources arrangement in the locally designed imaging chamber (perspective and front view).
Agriengineering 05 00031 g001
Figure 2. Biconical roller conveyor used for conveying apples in the locally made apple sorting machine (top and front view).
Agriengineering 05 00031 g002
Figure 3. Euclidean distance between points p and q.
Agriengineering 05 00031 g003
Figure 4. Difference between Manhattan and Euclidean distances in measuring the distance between points x and y.
Agriengineering 05 00031 g004
Figure 5. Results of training system with the definition of two classes by the k-NN classifier, k = 3, and Euclidean distance as the metric distance.
Agriengineering 05 00031 g005
Figure 6. Calyx identification results by NN, 3-NN, 4-NN, and 5-NN classifiers at the different training sample size and distances.
Agriengineering 05 00031 g006
Figure 7. The effect of k parameter and number of training samples on calyx identification at the different metric distances.
Agriengineering 05 00031 g007
Figure 8. Results of stem/calyx segmentation by clustering (left), inter-variance (middle), and Niblack (right) thresholding approaches.
Agriengineering 05 00031 g008
Table 1. Classification rates for stem and calyx detection by NN, 3-NN, 4-NN, and 5-NN; 40 training samples and 80 training samples; and 3 metric distances: Euclidean (Eu), maximum (max), and Manhattan (sum).
Classification Method Metric Distance
EuclideanMaximumSum
Training set408040804080
NNstem100100100100100100
calyx758572.581.257585
3-NNstem100100100100100100
calyx8092.57588.758091.25
4-NNstem100100100100100100
calyx8092.57588.758091.25
5-NNstem100100100100100100
calyx8097.57593.758096.25
Table 2. ANOVA for the effect of classifier, training sample size, and metric distance on stem identification score.
SourceType III Sum of SquaresdfMean SquareFSig.
Method224,748.909374,916.3032.4380.021
Number of training samples316,714.9091316,714.90910.3060.000
Metric distances147,470.576273,735.2882.3990.060
Classification methods × training samples362,626.613120,875.3544.5040.002
Classification methods × metric distances420,985.857670,164.3092.6150.013
Training samples × metric distances159,939.660279,969.8302.9800.053
Classification methods × training samples × metric distances509,843.426684,973.9043.1670.004
Error(s)7,898,122.09125730,731.993
Total1.034 × 108264
Corrected Total8,587,056.485263
a. R Squared = 0.961 (Adjusted R Squared = 0.957)
Table 3. Comparison of means for stem classification scores produced by different classification methods, training sample sizes, and metric distances.
MeanStandard Deviation
Classification method
NN698.712200.660
3-NN766.287170.801
4-NN766.621173.498
5-NN777.030171.299
Training sample size
40714.606166.956
80789.719187.770
Metric distance
Euclidean770.693167.833
Maximum718.806200.560
Sum766.988165.513
Table 4. The most important mechatronic components applied by different researchers in high-tech apple sorting systems (2010–2022).
AuthorsYearConveying TypeImaging TypeLighting TypePattern Recognition Type
Xiaobo et al. [39]2010cone shape roller conveyorthree-color CCD camerasN/AN/A
Unay et al. [40]2011N/Amonochrome cameraN/AN/A
Baranowski et al. [41]2012N/Ahyperspectral and thermal camerasN/AN/A
Shive Rame and Anand Singh [42]2012N/AN/AN/Amulticlass SVM
Suresha et al. [43]2012N/AN/AN/ASVM
Mohana et al. [44]2013N/AN/AN/Ak-NN classifier
Mizushima and Lu [45]2013N/ACCD color cameraeight LED lightslinear SVM and Otsu method
Sasnjak et al. [46]2013roller conveyorN/AN/AN/A
Zhang et al. [16]2013N/AN/AN/AECO features and GA
Mendoza et al. [47]2014N/AN/Aquartz tungsten halogen light sourceN/A
Toylan and Kuscu. [48] 2014roller conveyorcomplementary metal oxide semiconductor color camerafour fluorescent lampsa method based on multicolor space
Zhang et al. [36]2015N/Amultispectral vision systemtwo pairs of visible LED light sources and NIR LED light sourcesRVM classifier
Sadegaonkar and Wagh [49]2015roller conveyorN/AN/AN/A
Zhang et al. [50]2015N/Ahyperspectral monochrome CCD cameraN/ASPA and a binary PLS-DA
Vakilian and Massaah [51]2016shielded conveyor beltCCD color cameraN/AGabor filter and NN classifier
Sofu et al. [21]2016two channels roller conveyortwo CCD video camerasN/AN/A
Keresztes et al. [52]2016conveyor beltinfrared line scan camerafour 20 W DC tungsten halogen spotsN/A
Chio and Chen [8]2017revolving trayN/AN/AN/A
Wu et al. [30]2020N/Alaser-induced backscattering imaging systemsemiconductor laserconvolutional neural networks (CNN)
Fan et al. [53]2020black fruit cup conveyortwo commercial RGB camerastwo light-
emitting diode (LED) strips
convolutional neural networks (CNN)
Henila and Chithra [54]2020N/ACCD cameraN/Afuzzy cluster-based thresholding (FCBT) method
Shurygin et al. [55]2022table with rubber roller hyperspectrometer BaySpec OCI-Ftungsten-
halogen lamps
random forest (RF) classifiers
Tang et al. [56]2022N/Anear-infrared industrial cameraadjustable ring light sourceU-Net
Disclaimer/Publisher’s Note: The statements, opinions and data contained in all publications are solely those of the individual author(s) and contributor(s) and not of MDPI and/or the editor(s). MDPI and/or the editor(s) disclaim responsibility for any injury to people or property resulting from any ideas, methods, instructions or products referred to in the content.