Article

Hybrid Metaheuristic Algorithm for Optimizing Monogastric Growth Curve (Pigs and Broilers)

by
Marco Antonio Campos Benvenga
1,
Irenilza de Alencar Nääs
1,*,
Nilsa Duarte da Silva Lima
2 and
Danilo Florentino Pereira
3
1
Graduate Program in Production Engineering, Universidade Paulista, R. Dr. Bacelar 1212, São Paulo 04026-002, Brazil
2
Department of Animal Science, Federal University of Roraima, BR 174, km 12, Monte Cristo, Boa Vista 69300-000, Brazil
3
Department of Management, Development and Technology, School of Science and Engineering, São Paulo State University—UNESP, Av. Domingos da Costa Lopes 780, Tupã, São Paulo 17602-496, Brazil
*
Author to whom correspondence should be addressed.
AgriEngineering 2022, 4(4), 1171-1183; https://doi.org/10.3390/agriengineering4040073
Submission received: 25 June 2022 / Revised: 1 November 2022 / Accepted: 15 November 2022 / Published: 28 November 2022

Abstract

:
Brazil is one of the world’s biggest monogastric producers and exporters (of pig and broiler meat). Farmers need to improve their production planning through the reliability of animal growth forecasts. Predicting pig and broiler growth is optimizing production planning, minimizing the use of resources, and forecasting meat production. The present study aims to apply a hybrid metaheuristic algorithm (SAGAC) to find the best combination of values for the growth curve model parameters for monogastric farm animals (pigs and broilers). We propose a hybrid method to optimize the growth curve model parameters by combining two metaheuristic algorithms Simulated Annealing (SA) and Genetic Algorithm (GA), with the inclusion of a function to promote the acceleration of the convergence (GA + AC) of the results. The idea was to improve the coefficient of determination of these models to achieve better production planning and minimized costs. Two datasets with age (day) and average weight (kg) were obtained. We tested three growth curves: Gompertz, Logistic, and von Bertalanffy. After 300 performed assays, experimental data were tabulated and organized, and a descriptive analysis was completed. Results showed that the SAGAC algorithm provided better results than previous estimations, thus improving the predictive data on pig and broiler production consistency. Using SAGAC to optimize the growth parameter models for pigs and broilers led to optimizing the results with the nondeterministic polynomial time (NP-hardness) of the studied functions. All tuning of the growth curves using the proposed SAGAC method for broilers presented R2 above 99%, and the SAGAC for pigs showed R2 above 94% for the growth curve.

1. Introduction

By the mid-19th century, Gompertz [1] proposed a sigmoid function that describes growth as being the slowest at the start and end of a given period. Because a stable population would consequently have a saturation-level point and form a numerical upper bound on the growth size, Verhulst [2] proposed to limit this constraint and introduced the Logistic growth function. Afterward, Winsor [3] studied the parallelism between the Gompertz curve and the Logistic one. The Gompertz and the Logistic curves have similar properties, making them useful for the empirical representation of growth phenomena. Von Bertalanffy [4] postulated the General System Theory (GST), a logical concept applicable to all systems-related sciences, implying that specific principles have pertinence to systems. It explains the occurrence of isomorphous laws in various scientific fields. Such concepts were, after that, used to develop growth curves in living organisms and used as a basis for the genetic development of farm animals [5,6,7].
Growth is a continuous function during the animal’s life, from embryonic stages to adult age. Growth models mathematically explain it with biological meaning parameters [6]. Most functions are resultant of empirical data from specific experiments. Associating parameters with animal productivity and reproductive traits is a valuable resource for selection programs [8]. Using the growth curve, it is possible to describe animal body changes, such as size, mass, volume, and other units of performance interest. Furthermore, relative growth rates are essential for evaluating growth performance and efficiency [9].
Pig and broiler growth depends on feed efficiency and varies with the animal’s age or stage of production. The study of animal growth models facilitates monitoring their development, which can help establish the optimum slaughter time. Growth curves help explain body development patterns in birds and pigs [6]. The growth curve can be analyzed in three defined stages: (1) shortly after birth or hatching when there is a moderate growth rate; (2) after a certain age, the curve settles, and the growth rate is maximum; and (3) at the end of growth, the rate is slowed down and ends in an asymptote in the mature phase [10]. The use of non-linear models helps consolidate large volumes of information into a set of constraints that can be explained biologically [7,11,12].
The growth rate is the main focus of pig farming systems, including key performance indicators such as weight gain, feed intake, and feed conversion [7,13,14,15]. Current broilers are high-yielding and growing due to excellent feed conversion [16]. As development progresses, a more significant amount of energy is destined for the maintenance of the organism, thus reducing the mass gain and growth of the animals [17]. Growth curves are vital to support monogastric breeding programs. The three previously described functions (Gompertz, Logistic, and von Bertalanffy) generate satisfactory results; however, they differ slightly along the curve. Mathematic models such as growth curves that result from field trials cannot necessarily be applied to all datasets, because they are developed from specific experimental conditions. A way to search for the optimal growth curve is to use the hybrid metaheuristic algorithm strategy. By optimizing the growth curve model, we can define the increase in body weight as a function of age based on the weight vs. age indicators, which is critical for the production of monogastric animals.
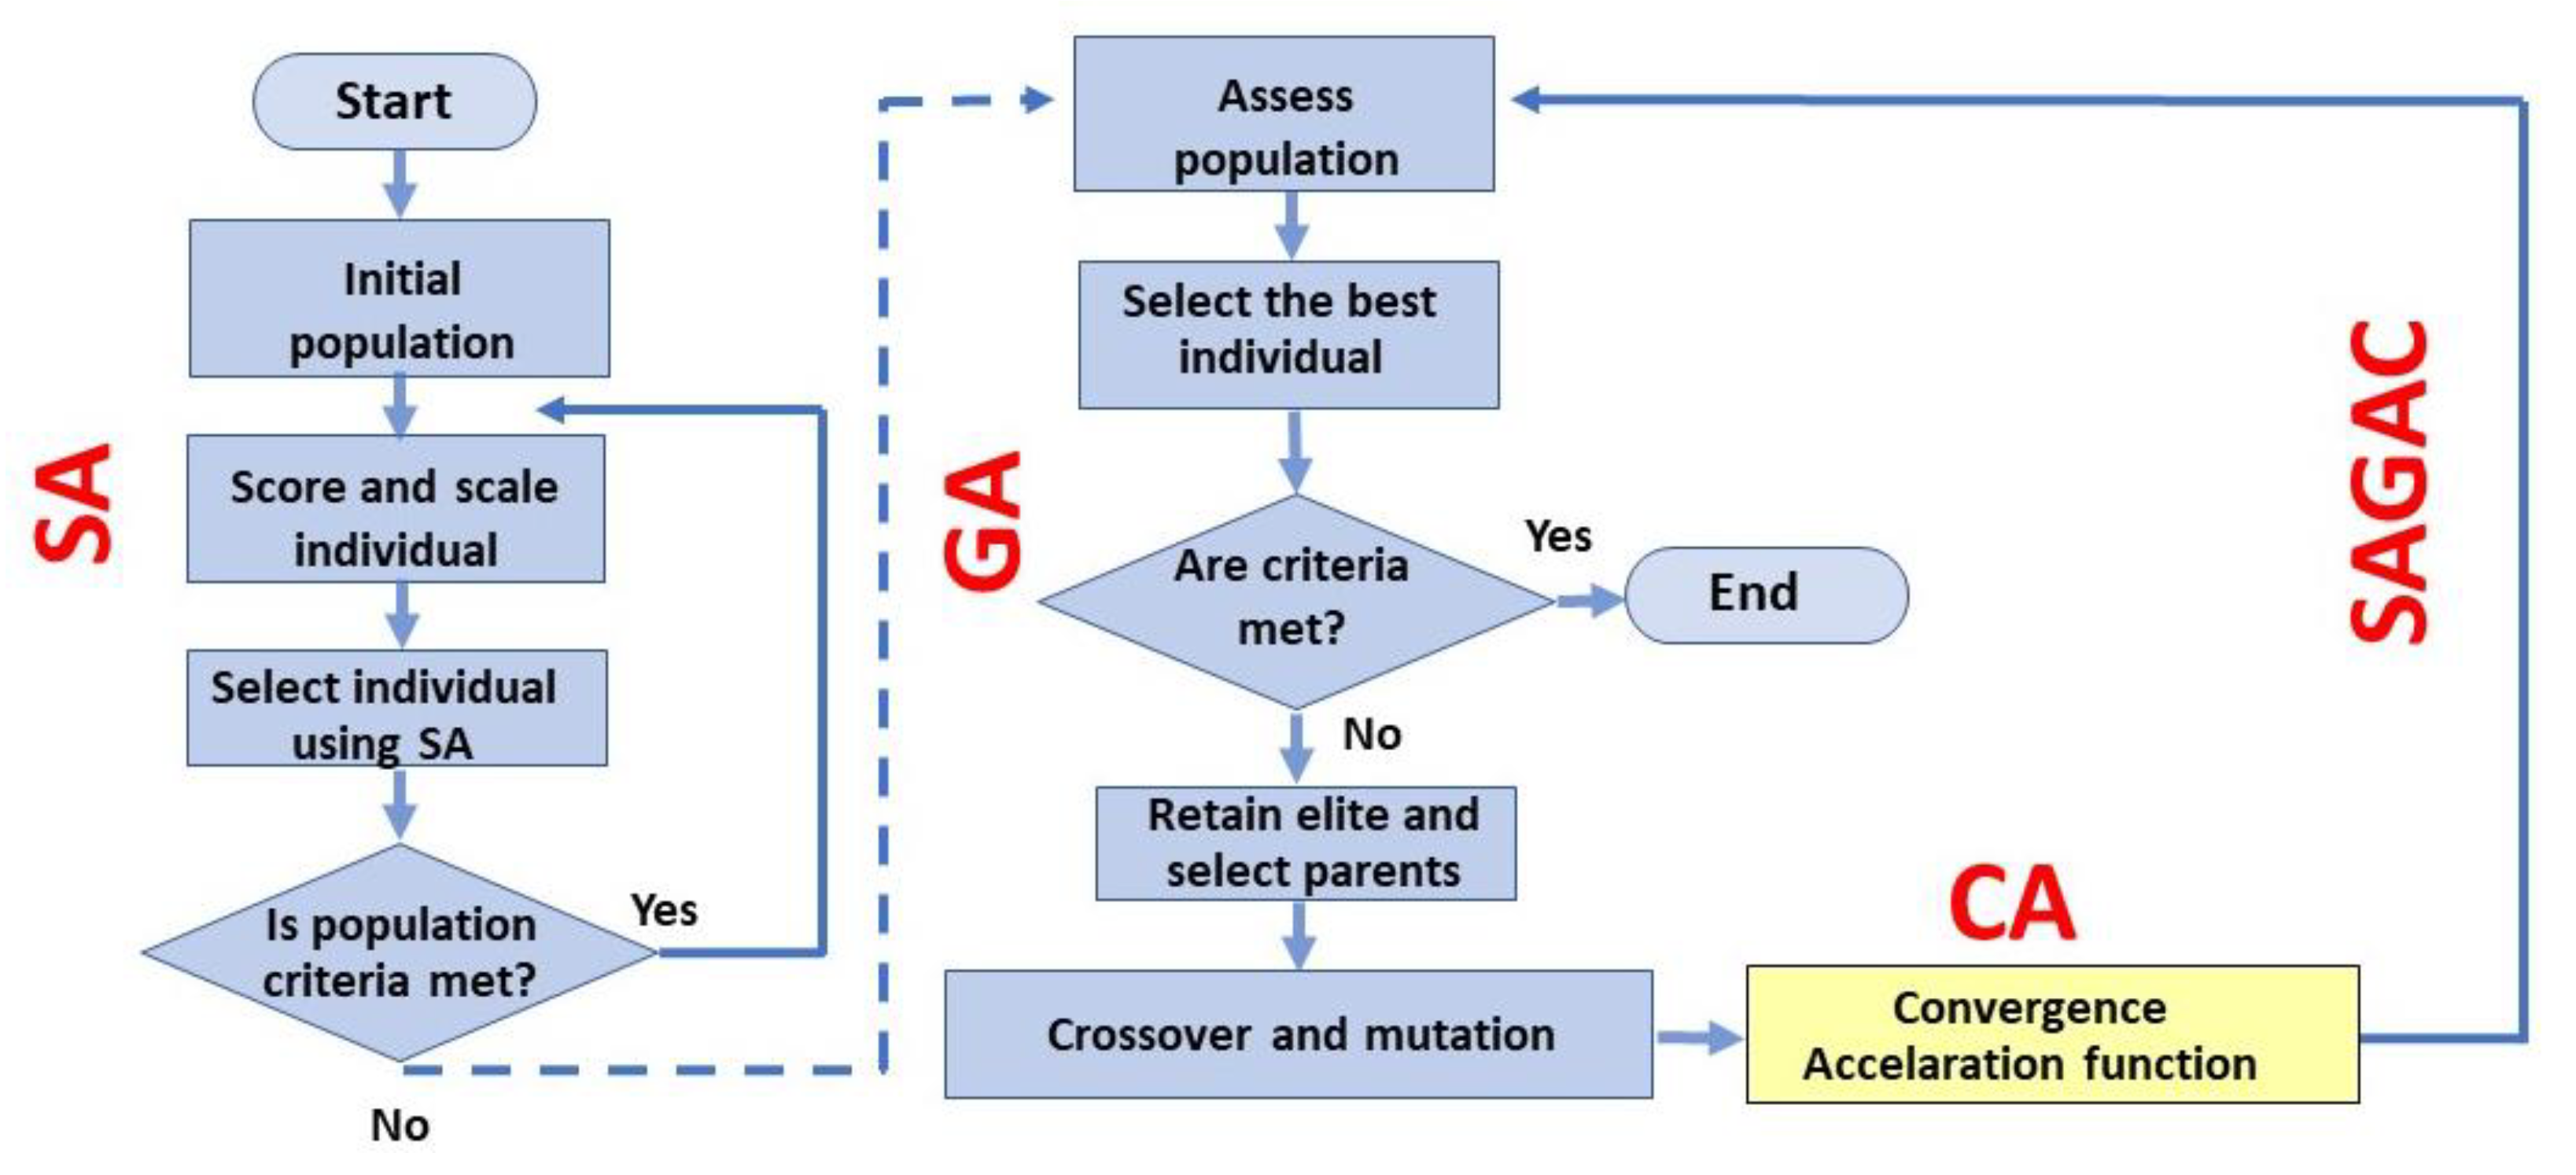
Simulated Annealing (SA) is a metaheuristic algorithm that applies a metal cooling process simulation. This method reaches a better status than the current one. If some movement generates the worst status, it may be accepted according to probability [18]. The second algorithm is the Genetic Algorithm (GA). GA is also a metaheuristic algorithm that applies a search and optimization method based on Charles Darwin’s theory of natural selection of species, according to which it is advocated that over the generations of a population of individuals of any species, only the best or most adapted to the environment in which they live will survive. GAs are search algorithms based on the principles of natural selection and genetics, inspired by the biological evolution of living beings; therefore, surviving individuals have a chance to pass on their genetic code to subsequent generations [19,20].
In the current literature, there is no consensus on the best model to describe the growth curve of monogastric animals. The differences between the models may be due to many reasons, including breed or population structure, sex, feeding management, environmental conditions, sampling, and statistical methods. Metaheuristics algorithms are usually used in problems with combinatorial analysis features with many possible solutions. In this case of growth curves, the average quantity of possible solutions is nearly 1.17 × 10¹² (NP-hardness in the computational complexity theory). The present study proposes optimizing the parameters of monogastric growth curves by applying a hybrid metaheuristic algorithm (SAGAC) to field data to select the best available growth curve model functions of monogastric farm animals (pigs and broilers).

2. Materials and Methods

2.1. Database of Age and Live Weight

A sample of an actual dataset with age (day) and average weight (kg) was extracted from [21]. To assess the coefficient of determination for the growth curves in pigs, the sample data of age/average pig live weight are shown in Table 1. They were used to evaluate the coefficient level of the growth curves.
One essential piece of information calculated using this data is the total average live weight ( y ¯ = 2.66 kg), and it was used in Equation (4). This research used historical information on the growth of broilers in the period from 0 to 41 days. The variables used were retrieved from previous research [2,4,21] and are x (age, day), and y (weight, g), shown in Table 2.

2.2. Growth Curve Models

The present study evaluated four growth curve models, two of which are generic (Equations (1) and (2)), described by [22], and two specific ones, Equation (3) for pigs [22] and Equation (4) for broilers [23].
G o m p e r t z   ( y ^ ) = y 1 . e [ ( L K ) ( 1 e K t ) ]
V o n   B e r t a l a n f f y   ( y ^ ) = A [ 1 b ( e K t ) ] 3
L o g i s t i c   f o r   p i g s   ( y ^ ) = A ( 1 e K t ) m
L o g i s t i c   f o r   b r o i l e r s   ( y ^ ) = A ( 1 + e L ( t K ) )
where y1 = the first occurrence of independent variable y of the data sample; K = postnatal maturity rate, in which high values indicate early maturity and low values delayed maturity; L = the angle of the growth curve when t is 1, or the specific initial growth rate; A = the upper asymptotic weight when t; m = the constant that determines the behavior of the function, enabling a variable inflection point; and b = the constant of integration without biological interpretation.
Table 3 shows the specific range of values of the models’ parameters. This range of values is used by the SAGAC algorithm to vary the values in the equations and to calculate the y ^ estimated for each age (shown in Table 1).
The range values permitted for variation in the SAGAC algorithm are defined in Table 3. The precision levels of the parameters are different from each other, and the parameter y1 has no level variation with a unique value (1.7421). After the SAGAC algorithm calculates estimated values ( y ^ ) for all ages (day) in the sample data, the coefficient of determination (R2) may be calculated using Equation (5).
M a x i m i z e   R 2 = i = 1 n ( y   ^ i y ¯ ) 2 i = 1 n ( y i y ¯ ) 2
where y = the independent variable of the data, y ¯ = the mean of the independent variables, and y ^ = the estimated value of y (sample data) according to the models.

2.3. The Hybrid Metaheuristic Algorithm (SAGAC)

The model is formed using two algorithms, Simulated Annealing (SA) and the Genetic Algorithm (GA), with the inclusion of a mechanism (function) that promotes acceleration of the convergence (GA + AC) of the obtained results. The SA algorithm acts on the generation of individuals who make up the modified Genetic Algorithm’s initial population (GA + AC). Using the SA algorithm makes it possible to obtain a composition of a good-quality initial population, that is, pre-optimized individuals. In this topic, the SAGAC algorithm is presented in detail, including which parts compose it and how it works. First, it is critical to mention that SAGAC is a hybrid metaheuristic algorithm formed by two algorithms.
The main novelty presented by the SAGAC algorithm is the inclusion of a mechanism (function) in the Genetic Algorithm that can promote a convergence acceleration (AC) of the obtained results; that is, the improvement in the obtained results tends to occur in a smaller number of generations. This mechanism (function) acts within the Genetic Algorithm in the crossover functionality. The integration of the convergence acceleration (AC) mechanism (function) with the Genetic Algorithm (GA) is named (AGAC). The first stage of SAGAC’s functionality is in charge of Simulated Annealing (SA). SA generates the individuals for the initial population or the first generation. The modified Genetic Algorithm (AGAC) uses this initial population or generation. With the use of the SA algorithm, it is possible to obtain a composition of an initial population of good-quality, pre-optimized individuals.
The behavior of the routine of the AGAC algorithm promotes convergence acceleration. After crossing, there is an evaluation of the generated individuals (children) and a verification of the quality improvement concerning the individuals of the elite population group. If this does not occur, the individual(s) child(ren) is(are) discarded, and the individual (Father) of worse quality is replaced by another individual from the elite group that is closer and better than the individual (Father) who was changed. After the exchange of the individual (Father), a new crossing occurs for the generation of the missing individual(s) child(ren). This sequence of steps is repeated until both children satisfy the improvement criterion or the stipulated limit of the number of attempts is reached. Figure 1 presents the flowchart of the SAGAC hybrid algorithm.
With each cycle of processing of the Simulated Annealing (SA) algorithm, the best result (individual) is stored to compose the initial population used by the modified Genetic Algorithm (GA) with the convergence acceleration mechanism (AGAC). Figure 2 shows the GA with the inclusion of the convergence acceleration mechanism CA [24], with a mechanism to increase the probability of an individual’s continuous evolution over the generations.
The algorithm checks whether they have the minimum qualifications to be part of the elite in each generation of children. If this does not occur, these children are disposed of, and a generation of others is added after changing one of the parents with the worst evaluation [25]. In the case of SAGAC, the variables that influence the algorithm’s behavior are its processing parameters [18,26,27]. The values for the SAGAC algorithm’s parameter setup and their performance in the optimization process are shown in Table 4.

2.4. Statistical Analysis

After optimizing the process and comparing the performance between both the RSM algorithms [28] and SAGAC, a sample of optimization assays was performed with the SAGAC algorithm. This test aimed to observe the stability of the results produced by it. A total of 300 assays were performed using 200 generations. We plotted the results convergence of one experiment. Because in 200 generations, there was no apparent stabilization of the curve convergence, we processed a demonstrative assay with 250 generations to determine the curve convergence after the 200 generations. After the 300 assays, the experimental data were tabulated and organized, and a descriptive analysis was presented. The descriptive statistical analysis was performed using the data from the results of the 300 assays. We used R² (the coefficient of determination) to determine the proportion of variance in the dependent variable that the independent variable can explain to compare the models. The coefficient of determination (R²) is used to identify the strength of a model.

3. Results

3.1. The Analysis of the Algorithms SA and GA

The use of a new hybrid algorithm (SAGAC), as a union of two or more algorithms, such as SA and GA, is presented as an innovation to improve the performance of the optimization process. The comparison between this new hybrid algorithm, SAGAC, and its ancestor algorithms, SA and GA, is necessary to verify the effectiveness of the hybridization. Then, a set of 300 experiments on the growth curve optimization with the ancestor algorithms was conducted, and the results were compared with the SAGAC results. The experimental data of the SAGAC, SA, and GA algorithms were tabulated and organized, and the descriptive analysis is displayed in Figure 3. The boxplot graph describes the data dispersion from the performance of each algorithm.
An analysis of the results of the 300 experimental assays of each algorithm makes it possible to identify the specific performance of each algorithm in the optimization process. When comparing the updated results produced by the Simulated Annealing (SA) techniques and the Genetic Algorithm (GA), it is feasible to observe that the SA and GA algorithms present a lower performance than that of the SAGAC algorithm. Meanwhile, the union of the two algorithms (SA and GA) in a new hybrid algorithm (SAGAC) makes the performance more effective.

3.2. Optimization Experiments

After the implementation and setup of the parameters of the SAGAC algorithm, a series of experimental trials were performed. The results data were collected and tabulated. According to the data, it is possible to identify the performance of the SAGAC algorithm in process optimization. The convergence curve of the resulting data (Figure 4) was generated using the coefficient of determination of the growth curves obtained with value-parameter combination after 250 algorithm interactions (Generation) for broilers and pigs.
Table 5 presents the results obtained by the standard growth curves (von Bertalanffy, Logistic, and Gompertz) [22] after applying the SAGAC algorithm. Comparing the data of the coefficient of determination is possible to check that the SAGAC algorithm finds values for the parameters that give the model the best R² value for all models. Comparing the R² values obtained using SAGAC between models, the Logistic model has the best coefficient of determination, suggesting that it can provide more reliable prevision values.
Results from [7] indicate that the Logistic and von Bertalanffy curves did not accurately estimate both the initial and slaughter weights. On the other hand, the Gompertz equation [1] was the most adequate to describe the pigs’ growth curve. The result in the present study is similar to [22]. However, when optimized using the hybrid metaheuristic algorithm (SAGAC), we found a rate of improvement (1%) compared to the Logistic and von Bertalanffy models. This might suggest that these models are more accurate and adjusted or that the other models have a superior flexibility in adjustment rates in the growth curves. After carrying out the experimental tests, the data generated by the SAGAC algorithm using the Gompertz, Logistic, and von Bertalanffy models, which simulate the growth curve of broilers, are compared with each other and presented in Table 6.
Among the models studied, the Gompertz model has the highest coefficient of determination when analyzing the results presented for broilers, which explains the behavior of the curves, with the Logistic model having the second-best outcome. Considering the results’ correlation, which measures the correspondence between the pairs of values presented between the sample data and the simulated data, the Gompertz model is more successful, followed by the von Bertalanffy model. Figure 5 illustrates the simulated curves of the models with the errors between the database curves for broilers and pigs. The shaded area is the distance between the actual value and the simulated one.
According to this numerical evidence, the Logistic model improves adherence to the data sample curve and promotes a more confident prevision of swine and broiler growth. The numerical evidence of this adherence is available in Table 3.
The boxplot graph (Figure 6) presents the data dispersion from the performance of the SAGAC algorithm on the standard growth curve models. Detailed data on this performance are shown in Table 3.
The data shown in Table 7 refer to the SAGAC algorithm’s behavior in 300 optimization assays to determine the parameter values for the process. It is possible to note that the average relation between the standard deviations and means measures is equal to 0.83%, which means that the deviation of the results is small, which means a slight oscillation. Because the SAGAC results present a slight deviation fluctuation, it explains that the algorithm is stable.

4. Discussion

We tested the metaheuristic hybrid algorithm SAGAC to find the best fit among the possible models available for pig and broiler growth. The growth curve parameters provide an opportunity to design selection strategies by modifying either feeding practices or the genetic makeup of the growth curve shape. The quality of fit of a model of an animal species, among other factors, is dependent on the number of weight-age parameters evaluated (sex, breed, management, age of the animal) [22]. The classical Logistic growth equation [2] has been used as a basis for several extended models. Each is helpful to accommodate physical growth without the constraint that the maximum growth rate should occur at half of the carrying capacity in the case of population dynamics or the maximum possible dimension for the physical growth of the system being tested [29]. Previous experimental research was carried out to directly assess the genetic variation inherent in the growth parameters of chickens using a cross-incorporating progeny of both sexes [30]. The authors’ results indicate a moderate improvement using the genetic modifications, mainly due to biological limitations. Our results suggest enhancing the animals’ weight prediction by optimizing the growth curve parameter values. This is reached by the adherence of the simulated growth curve to the empirical ones.
Vertical management of the poultry and swine industries facilitates product segmentation and a precision approach to optimization solutions for strategic and operational decisions, such as the ’best combination of parameter values of growth models’ that would promote slaughter time planning [31]. A comprehensive computational study might solve the integrated planning problem when considering solutions for optimizing the production chain. Hatching eggs, allocating broiler flocks on farms, and collecting broilers for slaughter were applied to accurate data. They showed that value could be added to planning, improving solutions by 15 to 24% [32].
The metaheuristics algorithms use their strategies to search the result set for a better possible outcome in a short time of processing. The SAG successfully optimized cassava starch hydrolysis to produce biofuel [
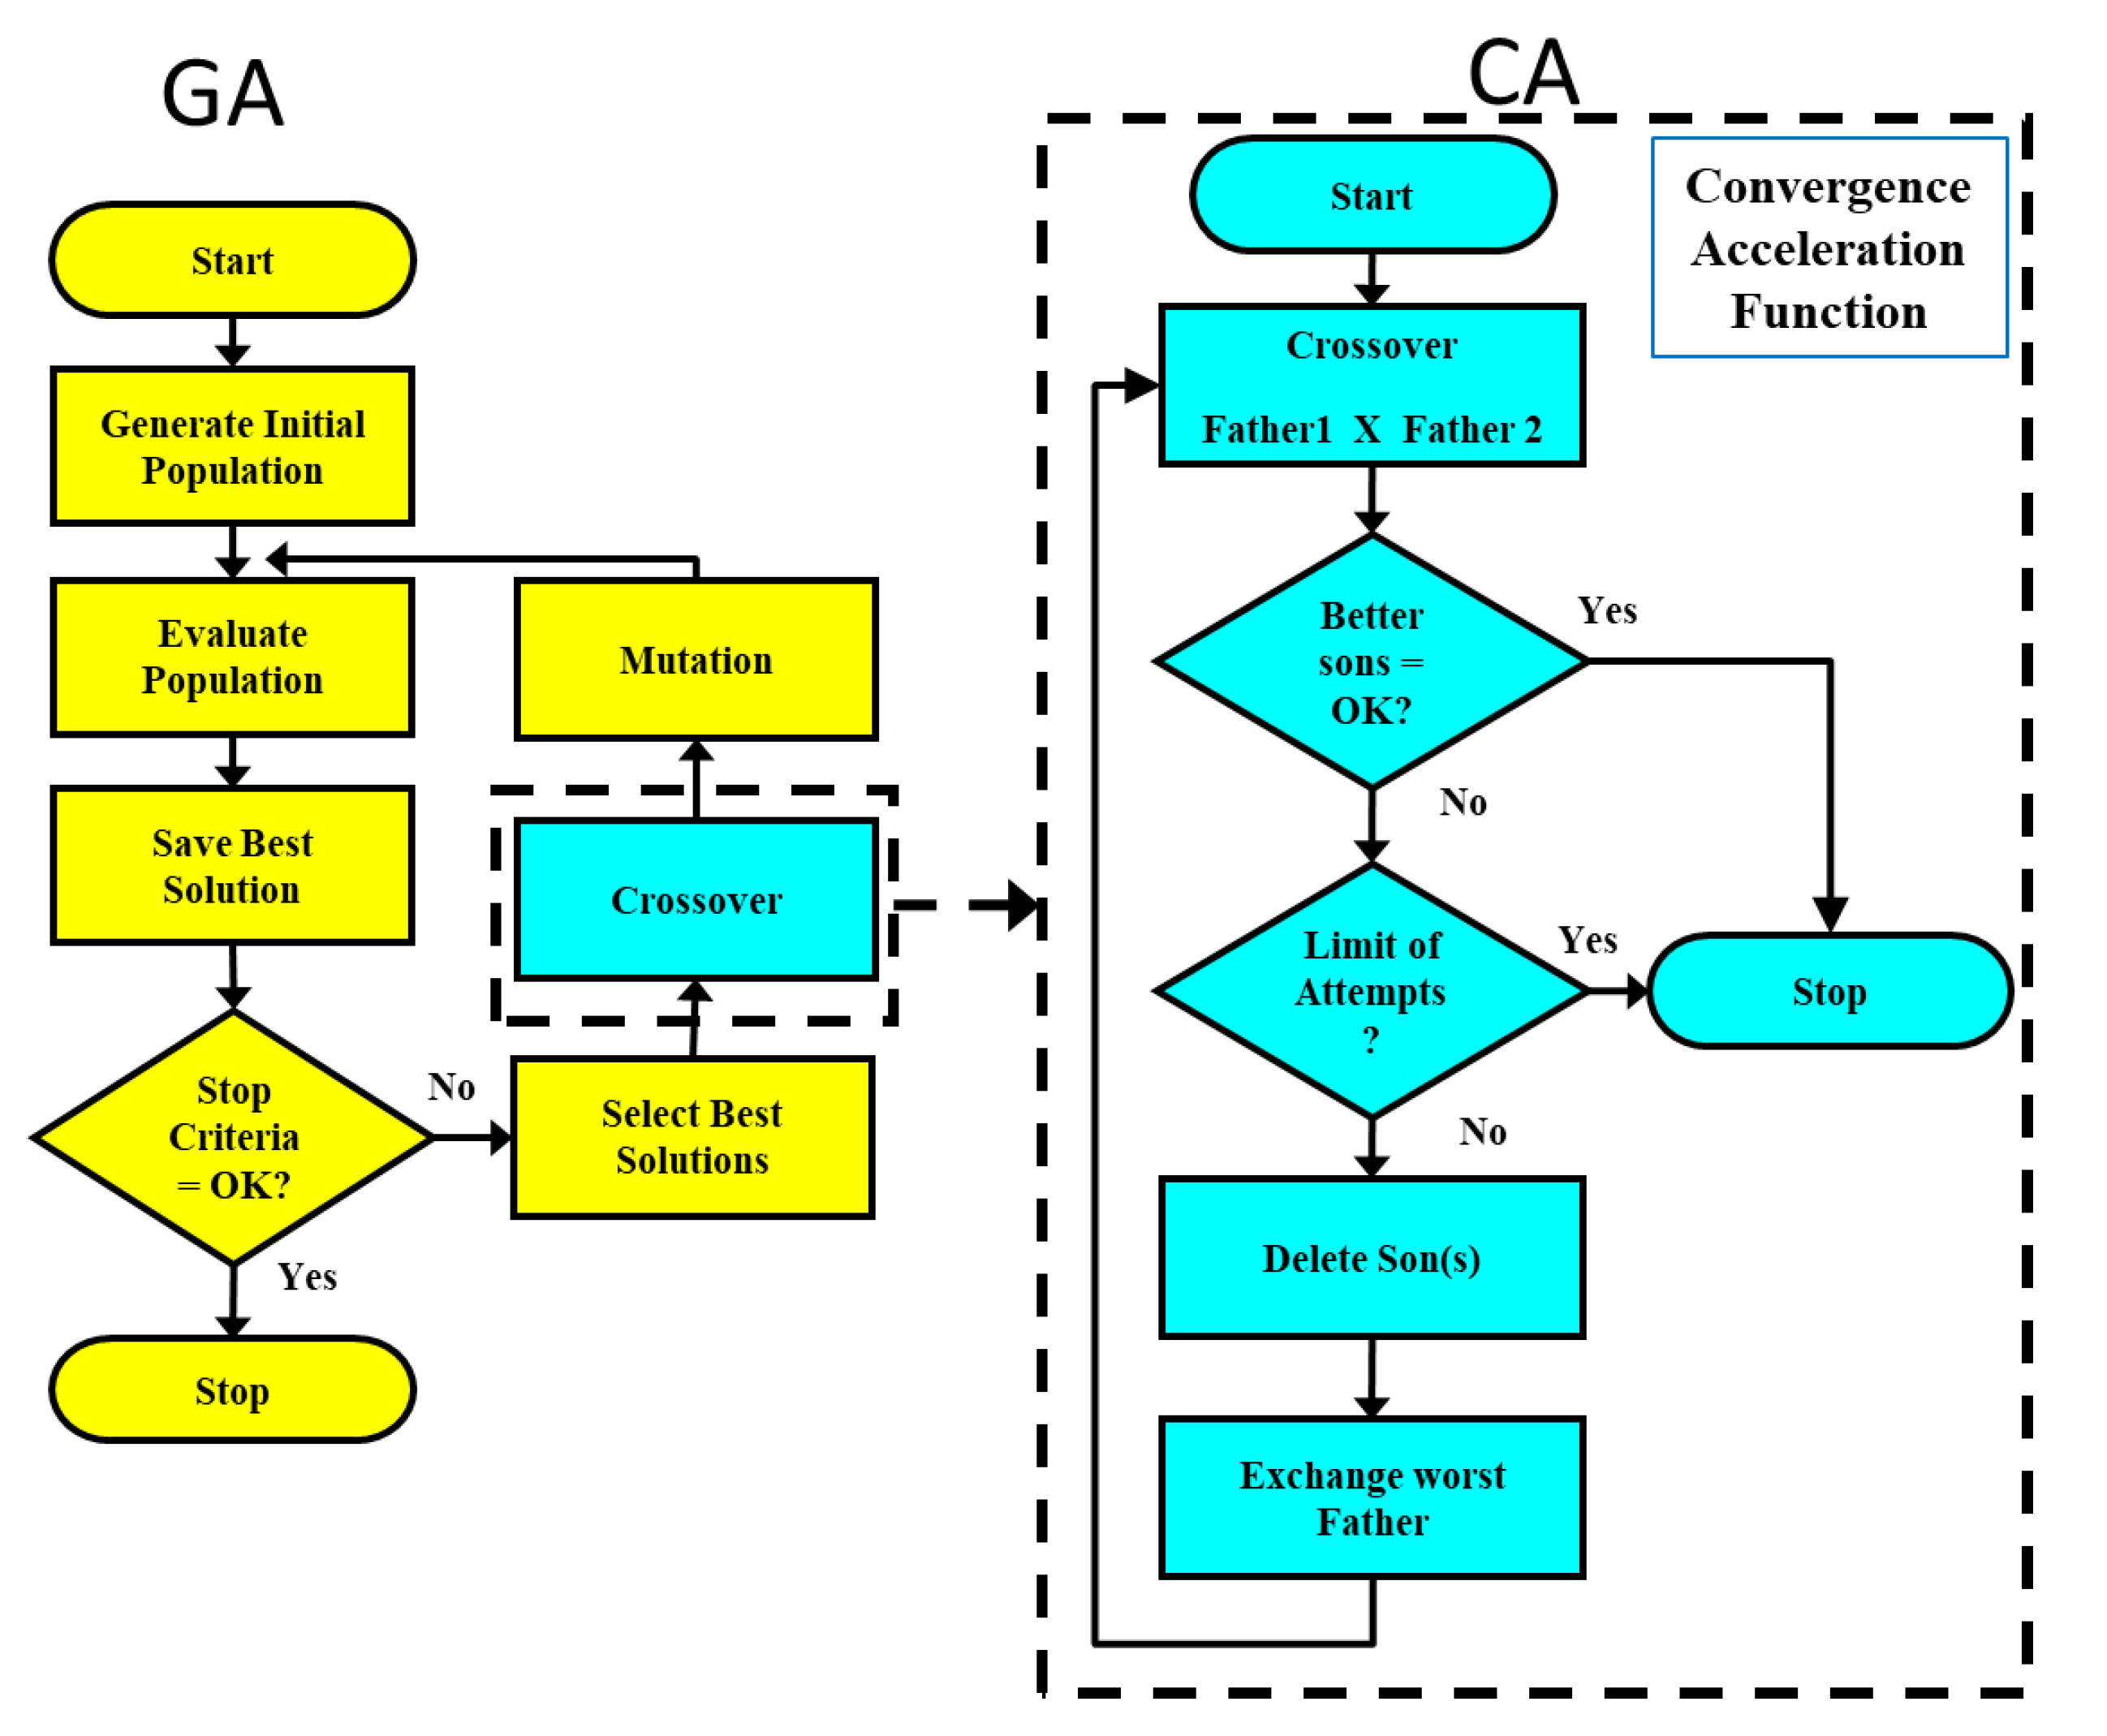
33]. The SAGAC was previously applied to optimize the pre-processing vacuum cooling of broccoli handling [
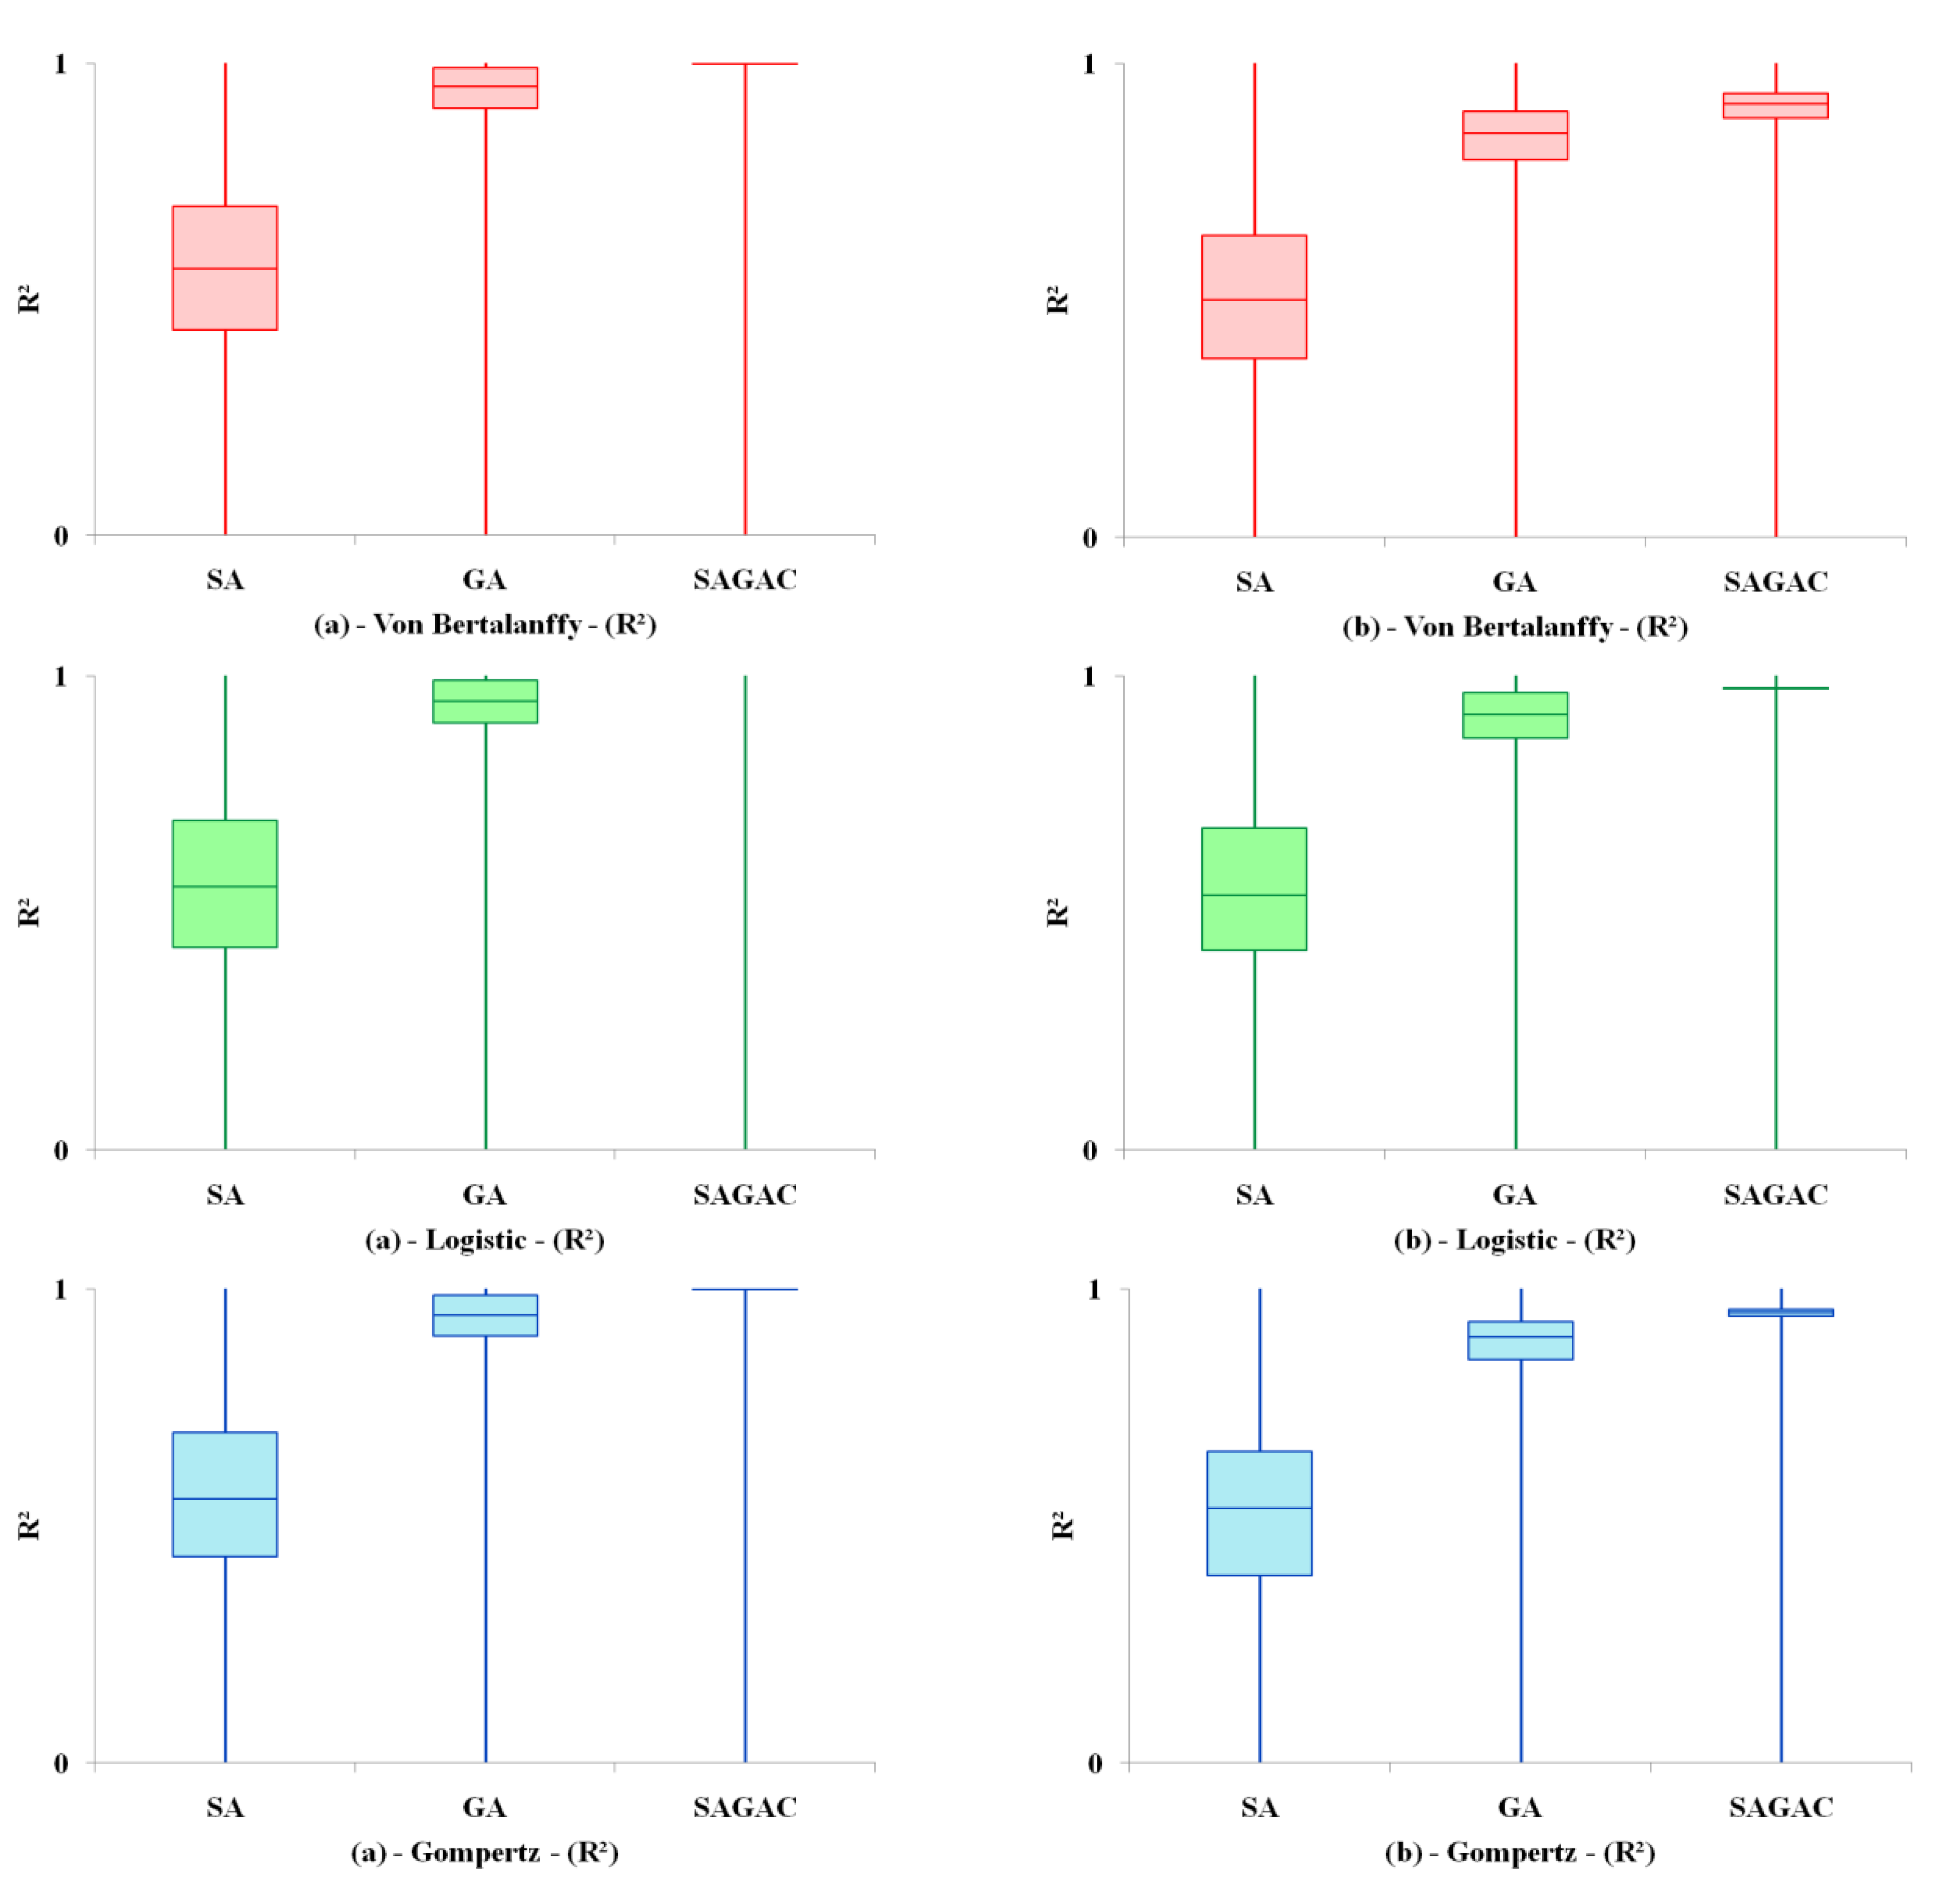
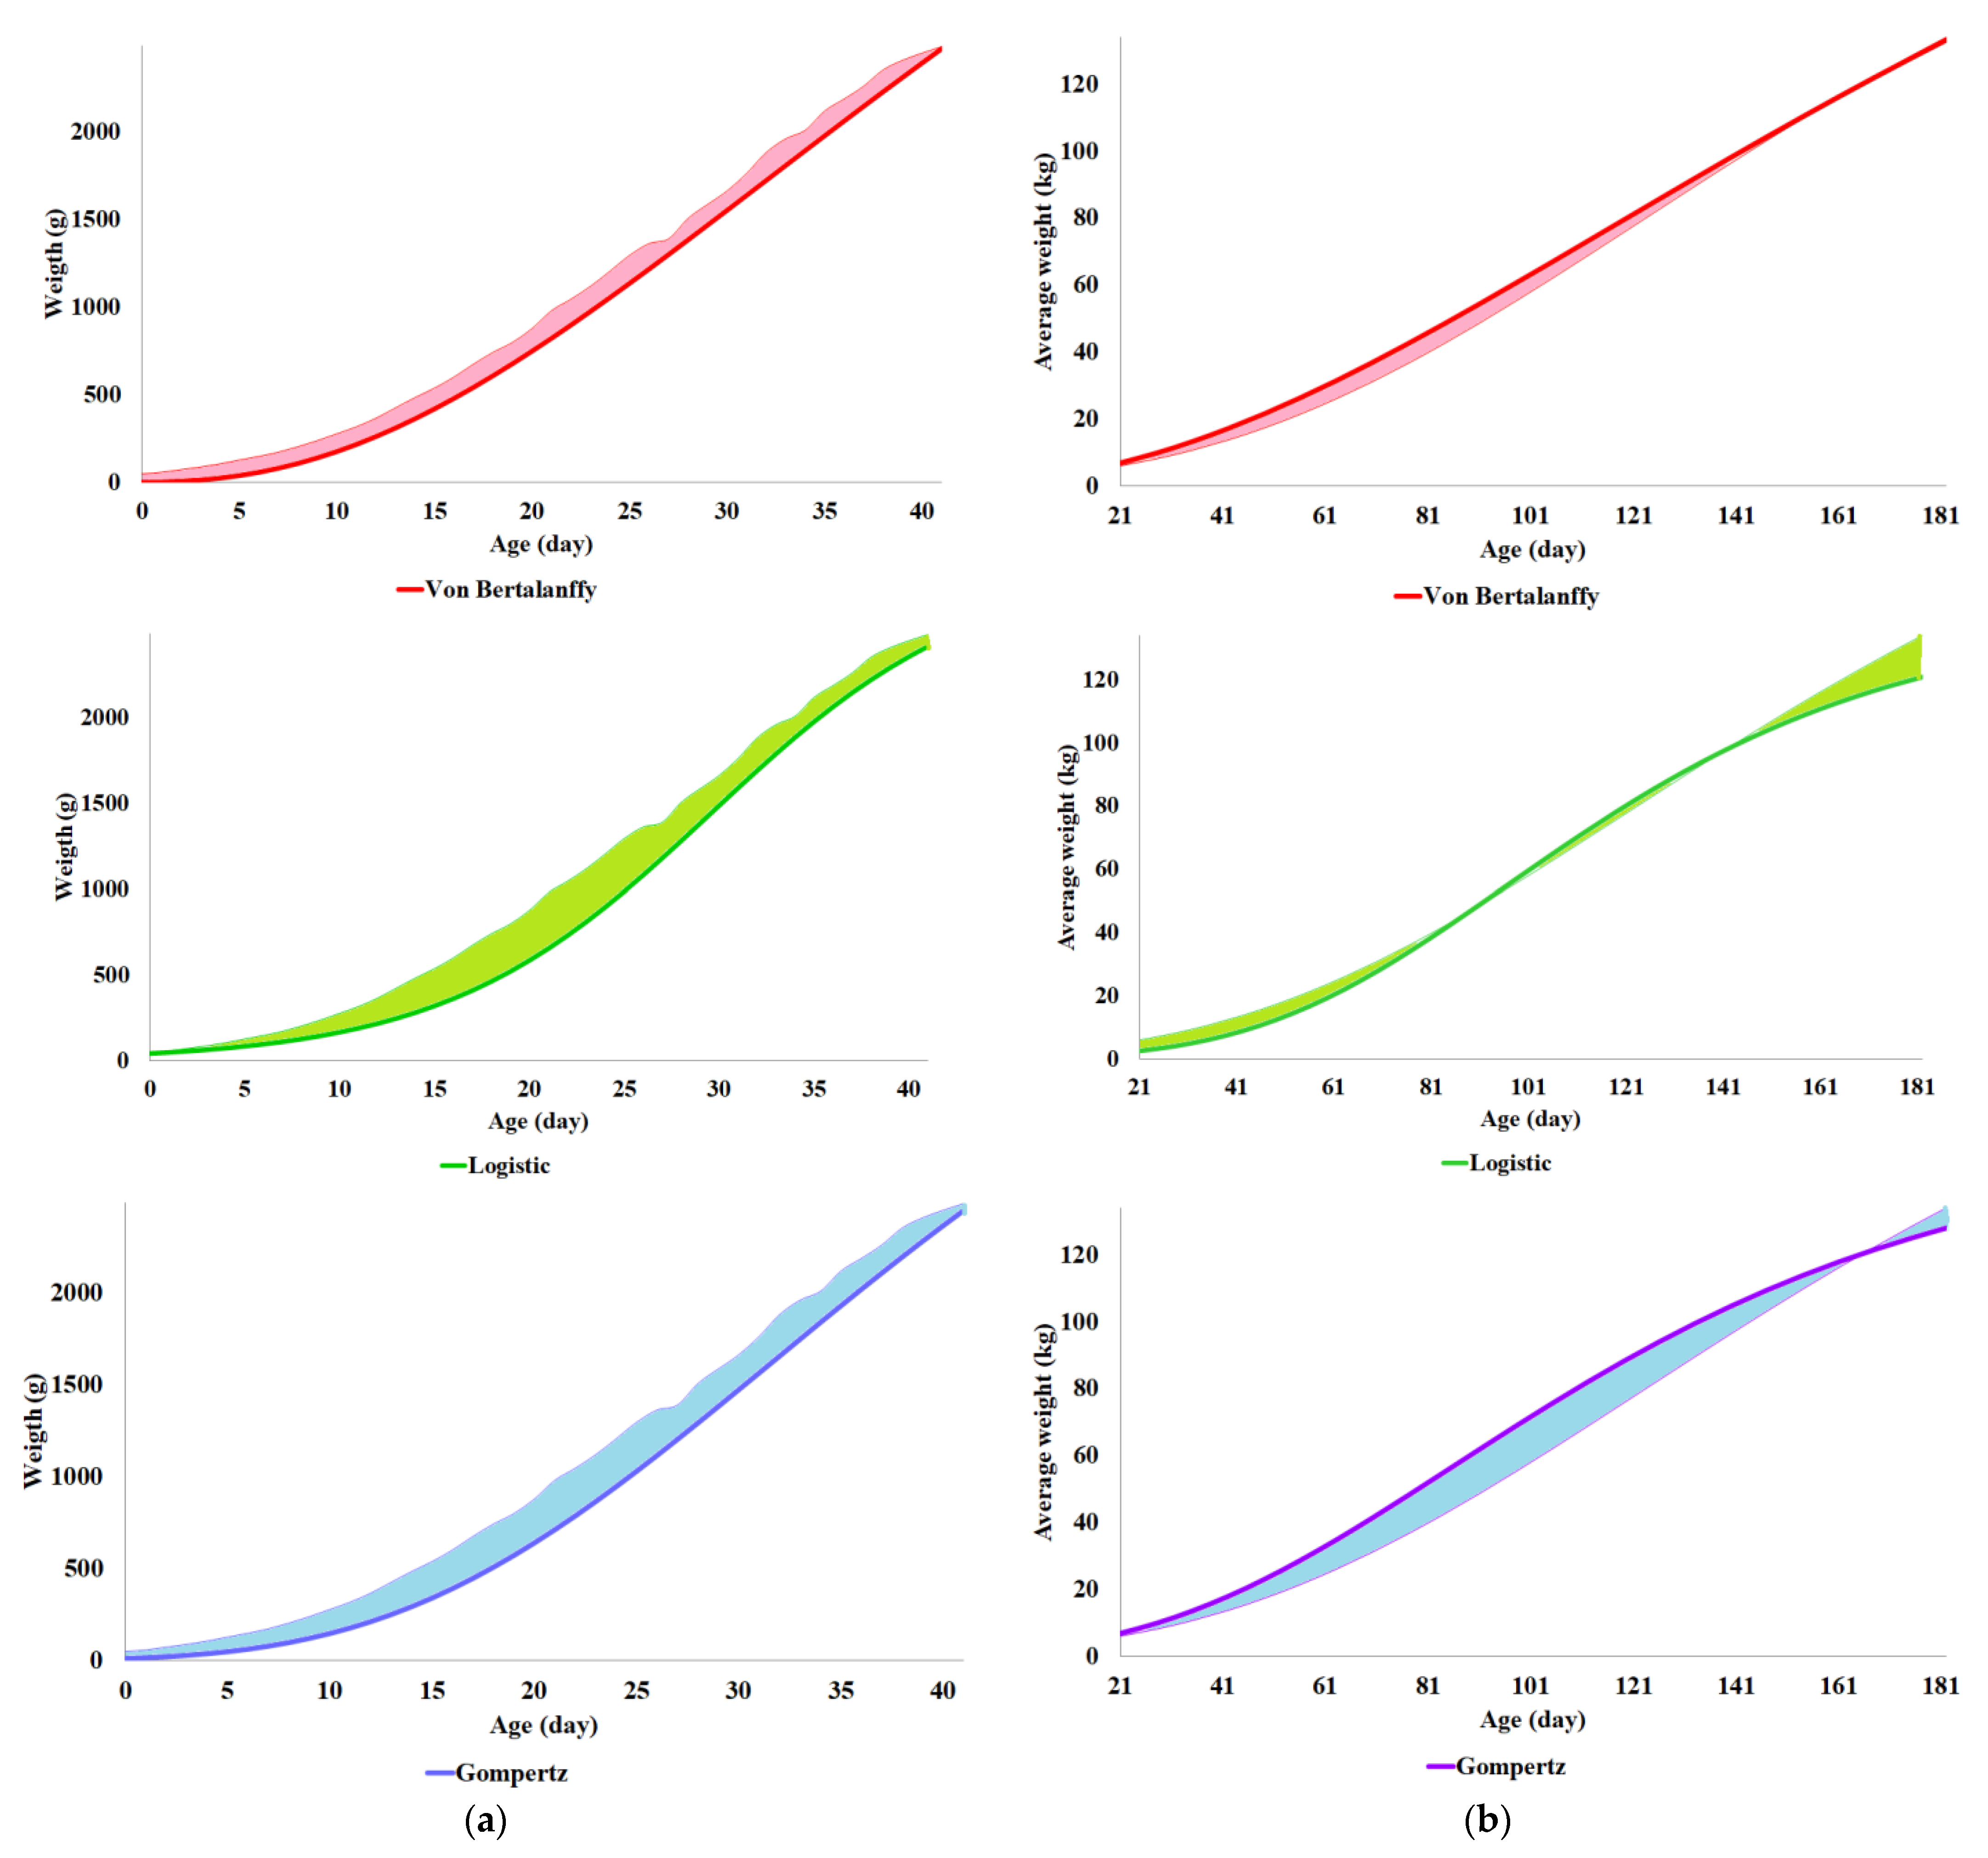
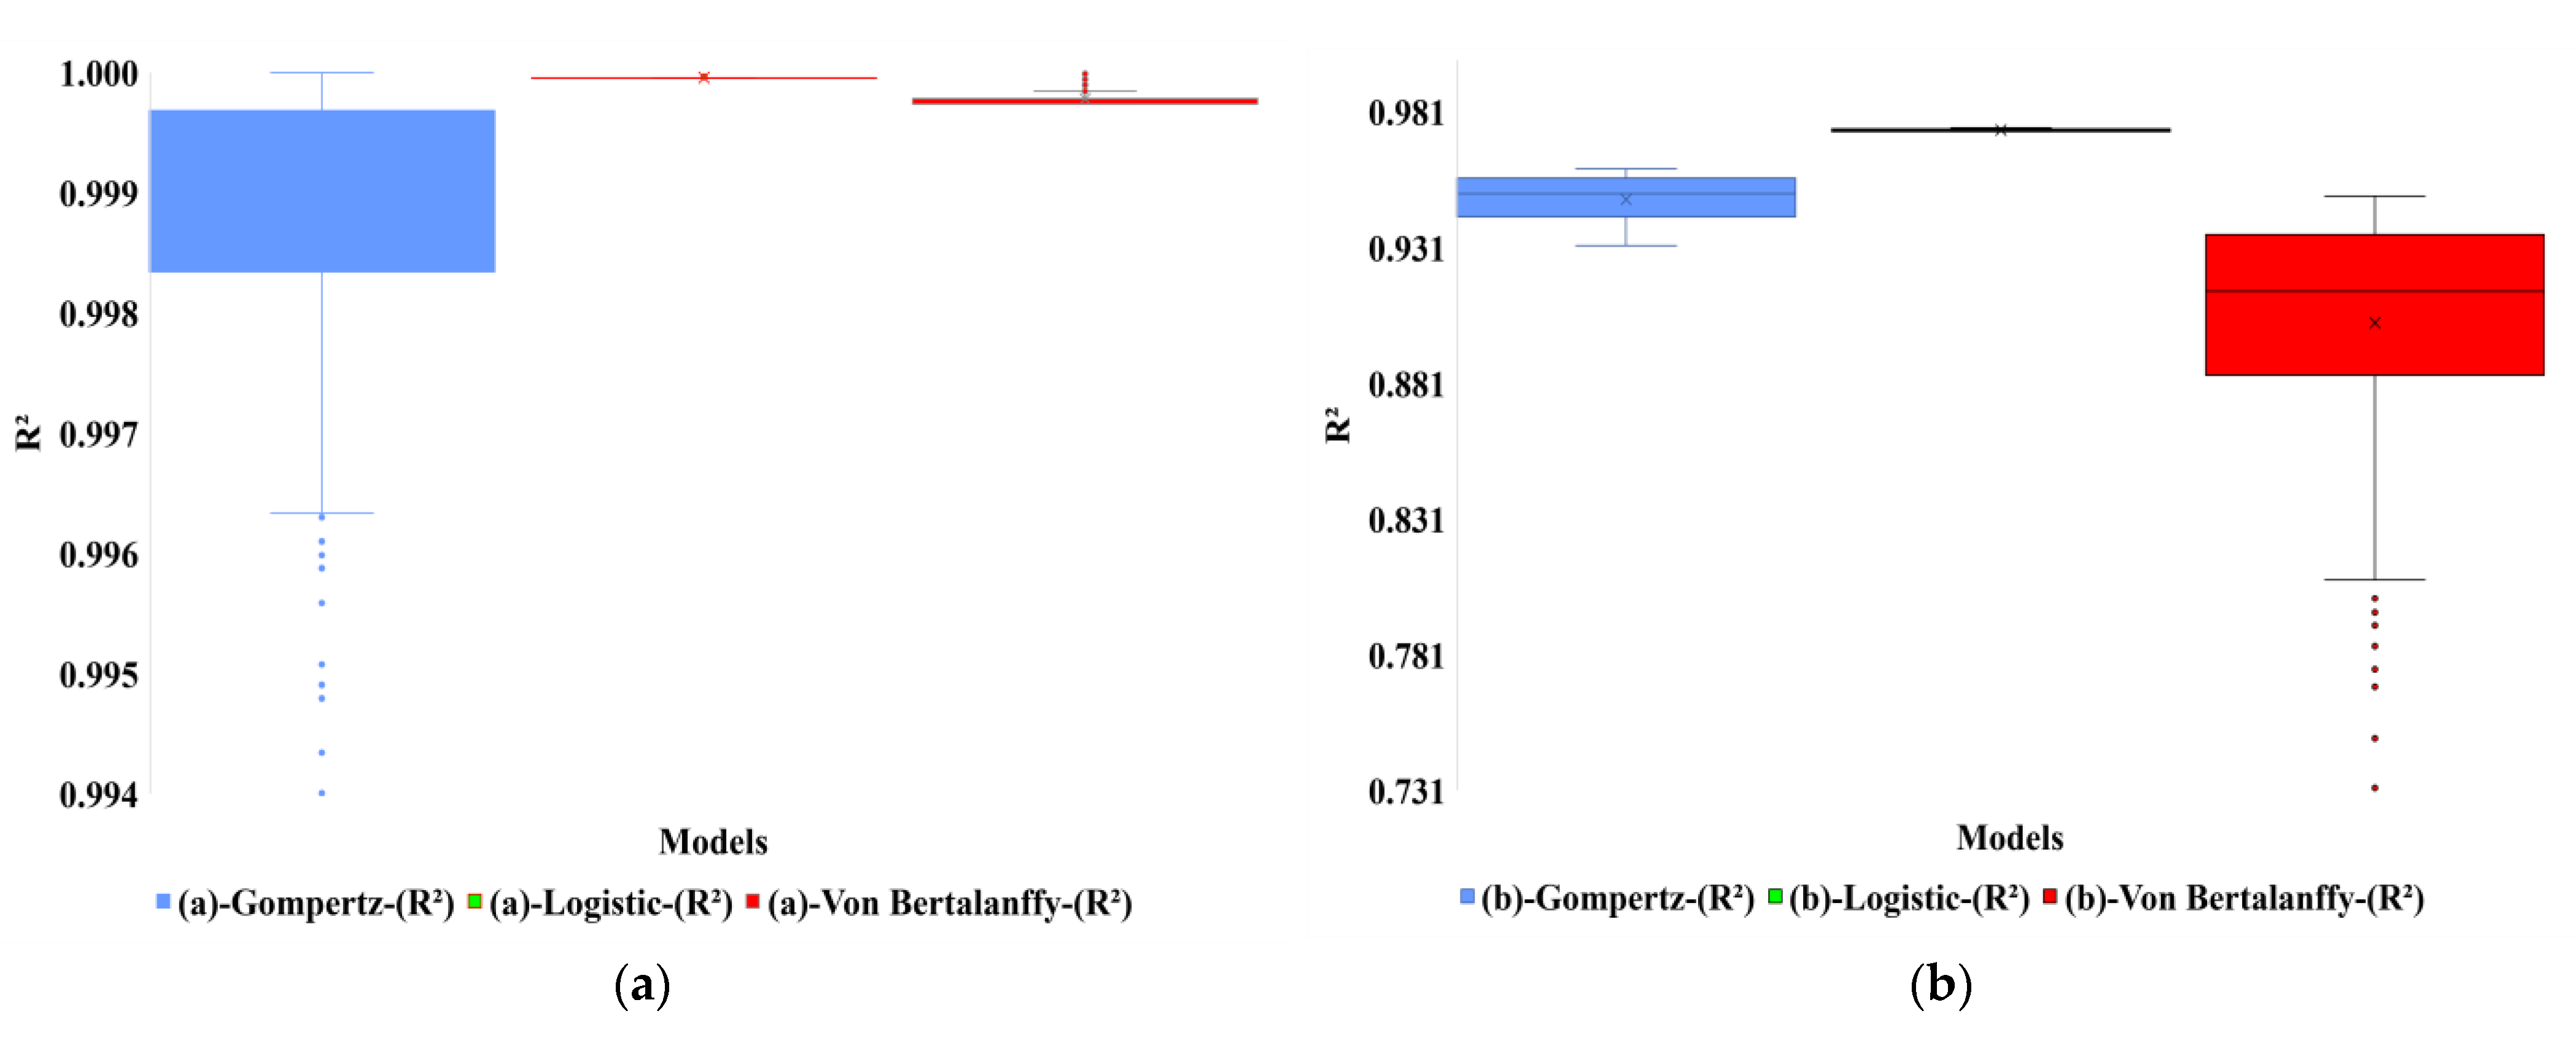
34]. The refined combination of SA and GA (SAG) and adding the convergence acceleration function (AC) improved the performance of the hybrid algorithm (SAGAC) in the optimization process. One characteristic of SAGAC that could be considered a limitation is that the algorithm does not have the optimal result for each problem; however, it finds a satisfactory result due to the complexity of the problem. The computational cost (due to the NP-hardness of the functions) is often unfeasible if an exact algorithm is used for these problems. Our findings show that the Logistic model fits live weight data very well for studying the growth of pigs (R2 = 0.9738). The best-fitted model for the broiler is the Gompertz model (R2 = 0.999998). This result agrees with [6], who found that the Gompertz model was the best model for male and female broilers.
The biological interpretations rationalized for parameters from growth functions and their specific cases have been a primary reason for their popularity [35]. The von Bertalanffy equation was directly argued from metabolic laws [8]. Biological understandings have evolved after choosing a mathematical model on empirical grounds, so it is not unexpected that the functions do not always hold for all models and datasets [36,37,38,39]. Therefore, the curve growth functions vary depending on the species and environmental conditions of housing. In our study, there is a slight difference in the results; however, using the SAGAC algorithm decreases that disparity.
There is a constant search for tools and methods to improve production and meat quality [40]. The forecasting of pig growth to devise the market is optimizing production planning and management. In the present research, a hybrid metaheuristic algorithm (SAGAC) was tested to better estimate the model’s parameters for predicting pig and broiler growth curves, thus promoting greater reliability in the predictive data of the meat supply chain.

5. Conclusions

The current models for predicting growth curves for monogastric farm animals are developed using experimental data (curve fitting), and these models cannot generalize these curves to other datasets. All tuning of the growth curves using the proposed SAGAC method for broilers presented an R2 value above 99%, and the SAGAC for pigs presented an R2 value above 94% for the growth curve. Our study showed that within the three tested models for each monogastric animal (pig and broiler), there is a prevalence of the Logistic model for pig production and the Gompertz model for broiler production.
This study proposes applying SAGAC to optimize the growth parameter models for pigs and broilers, effectively reducing the NP-hardness of the studied functions. Our results improve prediction reliability and enhance production planning quality, minimizing production costs.

Author Contributions

Conceptualization, I.d.A.N., N.D.d.S.L., M.A.C.B. and D.F.P.; methodology, M.A.C.B., I.d.A.N. and N.D.d.S.L.; software, M.A.C.B.; formal analysis, M.A.C.B., I.d.A.N., N.D.d.S.L. and D.F.P.; data curation, M.A.C.B.; writing—original draft preparation, M.A.C.B., I.d.A.N., N.D.d.S.L. and D.F.P.; writing—review and editing, M.A.C.B., I.d.A.N., N.D.d.S.L. and D.F.P.; supervision, I.d.A.N. All authors have read and agreed to the published version of the manuscript.

Funding

This research received no external funding.

Institutional Review Board Statement

Not applicable.

Informed Consent Statement

Not applicable.

Data Availability Statement

The data presented in this study are available upon request from the data curation.

Acknowledgments

We thank the Coordination of Superior Level Staff Improvement—CAPES and the National Council for Scientific and Technological Development for the scholarships.

Conflicts of Interest

The authors declare no conflict of interest.

References

  1. Gompertz, B. On the nature of the function expressive of the law of human mortality, and on a new method of determining the value of life contingencies. Phil. Trans. Roy. Soc. 1825, 115, 513–585. [Google Scholar]
  2. Verhulst, P.F. Notice sur la loi que la population suit dans son accroissement. Corresp. Math. Phys. 1838, 10, 113–126. [Google Scholar]
  3. Winsor, C.P. The Gompertz curve as a growth curve. Proc. Natl. Acad. Sci. USA 1932, 18, 1–8. [Google Scholar] [CrossRef] [PubMed] [Green Version]
  4. Von Bertalanffy, L. An outline of general system theory. Br. J. Philos. Sci. 1950, 1, 134–165. [Google Scholar] [CrossRef]
  5. Thornley, J.H.M.; France, J. Mathematical Models in Agriculture: Quantitative Methods for the Plant, Animal and Ecological Sciences, 2nd ed.; CABI Publishing: Wallingford, UK, 2007; p. 887. [Google Scholar]
  6. Selvaggi, M.; Laudadio, V.; Dario, C.; Tufarelli, V. Modelling growth curves in a nondescript Italian chicken breed: An opportunity to improve genetic and feeding strategies. J. Poult. Sci. 2015, 52, 0150048. [Google Scholar] [CrossRef] [Green Version]
  7. Ceron, M.S.; Oliveira, V.D.; Pieve, N.A.N.N.; Silva, N.C.D.; Rossi, C.A.R.; Fraga, B.N.; Kessler, A.D.M. Non-linear equations to determine the growth curve of immunocastrated pigs. Pesqui. Agropecu. Bras. 2020, 55, e01184. [Google Scholar] [CrossRef]
  8. Fitzhugh, H.A., Jr. Analysis of growth curves and strategies for altering their shape. J. Anim. Sci. 1976, 42, 1036–1051. [Google Scholar] [CrossRef] [Green Version]
  9. Pommerening, A.; Grabarnik, P. Principles of Relative Growth Analysis. In Individual-Based Methods in Forest Ecology and Management; Springer: Cham, The Netherlands, 2019. [Google Scholar] [CrossRef]
  10. Wilson, B.J. Growth curves: Their analysis and use. In Production; Boorman, K.N., Wilson, B.J., Eds.; British Poultry Science Ltd.: Edinburgh, UK, 1977; pp. 89–115. [Google Scholar]
  11. Şengül, T.; Kiraz, S. Non-Linear models for growth curves in Large White turkeys. Turkish J. Vet. Anim. Sci. 2005, 29, 331–337. Available online: https://dergipark.org.tr/en/pub/tbtkveterinary/issue/12545/151373 (accessed on 18 July 2021).
  12. Demmers, T.G.M.; Cao, Y.; Gauss, S.; Lowe, J.C.; Parsons, D.J.; Wathes, C.M. Neural predictive control of broiler chicken and pig growth. Biosyst. Eng. 2018, 173, 134–142. [Google Scholar] [CrossRef] [Green Version]
  13. Luo, J.; Lei, H.; Shen, L.; Yang, R.; Pu, Q.; Zhu, K.; Zhu, L. Estimation of growth curves and suitable slaughter weight of the Liangshan pig. Asian-Australas. J. Anim. Sci. 2015, 28, 1252. [Google Scholar] [CrossRef] [Green Version]
  14. Camp Montoro, J.; Manzanilla, E.G.; Solà-Oriol, D.; Muns, R.; Gasa, J.; Clear, O.; Calderón Díaz, J.A. Predicting productive performance in grow-finisher pigs using birth and weaning body weight. Animals 2020, 10, 1017. [Google Scholar] [CrossRef] [PubMed]
  15. Remus, A.; Hauschild, L.; Methot, S.; Pomar, C. Precision livestock farming: Real-time estimation of daily protein deposition in growing–finishing pigs. Animal 2020, 14 (Suppl. 2), s360–s370. [Google Scholar] [CrossRef] [PubMed]
  16. Siegel, P.B. Evolution of the modern broiler and feed efficiency. Annu. Rev. Anim. Biosci. 2014, 2, 375–385. [Google Scholar] [CrossRef] [PubMed]
  17. Carvalho, G.; Freitas, G.; Sousa, L.; Cassiano, R.; Garcia Neto, M.; Filardi, R. Programa prático de modelagem de curvas aplicado a Mazama gouazoubira. Arch. Vet. Sci. 2018, 23, 65–68. [Google Scholar] [CrossRef]
  18. Kirkpatrick, S.; Gelatti, C.D.; Vecchi, M.P. Optimization by simulated annealing. Science 1983, 220, 671–680. [Google Scholar] [CrossRef]
  19. Holland, H.J. Adaptation in Natural and Artificial Systems: An Introductory Analysis with Applications to Biology, Control, and Artificial Intelligence; MIT Press: Ann Arbor, MI, USA, 1975; p. 207. [Google Scholar]
  20. Haldurai, L.; Madhubala, T.; Rajalakshmi, R.A. Study on genetic algorithm and its applications. Int. J. Comput. Sci. Eng. 2016, 4, 139–143. Available online: https://www.ijcseonline.org/pdf_paper_view.php?paper_id=1092&22-IJCSE-01860-4.pdf (accessed on 30 May 2022).
  21. Rostagno, H.S.; Albino, L.F.T.; Donzele, J.L.; Gomes, P.C.; Oliveira, R.F.; Lopes, D.C.; Ferreira, A.S.; Barreto, S.L.T.; Euclides, R.F. Tabelas Brasileiras Para aves e Suínos: Composição de Alimentos e Exigências Nutricionais, 3rd ed.; UFV: Viçosa, Brasil, 2011; p. 252. [Google Scholar]
  22. Freitas, A.R.D. Curvas de crescimento na produção animal. Rev. Bras. Zootec. 2005, 34, 786–795. [Google Scholar] [CrossRef] [Green Version]
  23. Freitas, A.D.; Costa, C.D. Ajustamento de modelos não-lineares a dados de crescimento de suínos. Pesq. Agropec. Bras. 1983, 18, 1147–1154. Available online: https://www.alice.cnptia.embrapa.br/bitstream/doc/43218/1/15452682511SM.pdf (accessed on 15 May 2022).
  24. Linden, R. Algoritmos Genéticos— Uma Importante Ferramenta de Inteligência Computacional, 2nd ed.; Brasport: São Paulo, Brazil, 2008; p. 488. [Google Scholar]
  25. Goldberg, D.E. Genetic Algorithms in Search, Optimization, and Machine Learning; Addison-Wesley Pub. Inc.: Boston, MA, USA, 1989; p. 248. [Google Scholar]
  26. Mitchell, T.M. Machine Learning; McGraw-Hill: New York, NY, USA, 1997; p. 421. [Google Scholar]
  27. Benvenga, M.A.C.; de Alencar Nääs, I. Application of Hybrid Metaheuristic Optimization Algorithm (SAGAC) in Beef Cattle Logistics. In Advances in Production Management Systems. Artificial Intelligence for Sustainable and Resilient Production Systems; Dolgui, A., Bernard, A., Lemoine, D., von Cieminski, G., Romero, D., Eds.; In Proceedings of the APMS 2021 IFIP Advances in Information and Communication Technology, Nantes, France, 5–9 September 2021; Springer: Cham, The Netherlands, 2021; Volume 631. [Google Scholar] [CrossRef]
  28. Maache-Rezzoug, Z.; Pierre, G.; Nouviaire, A.; Maugard, T.; Rezzoug, S.A. Optimizing thermomechanical pretreatment conditions to enhance enzymatic hydrolysis of wheat straw by response surface methodology. Biomass Bioenerg. 2011, 35, 3129–3138. [Google Scholar] [CrossRef]
  29. Tsoularis, A.; Wallace, J. Analysis of logistic growth models. Math. Biosci. 2002, 179, 21–55. [Google Scholar] [CrossRef] [Green Version]
  30. Barbato, E.G. Genetic architecture of growth curve parameters in chickens. Theor. Appl. Genet. 1991, 83, 24–32. [Google Scholar] [CrossRef] [PubMed]
  31. Rizzi, C.; Contiero, B.; Cassandro, M. Growth patterns of Italian local chicken populations. Poult. Sci. 2013, 92, 2226–2235. [Google Scholar] [CrossRef] [PubMed]
  32. Brevik, E.; Lauen, A.Ø.; Rolke, M.C.; Fagerholt, K.; Hansen, J.R. Optimisation of the broiler production supply chain. Int. J. Prod. Res.. 2020, 58, 5218–5237. [Google Scholar] [CrossRef]
  33. Benvenga, M.A.C.; Nääs, I.A. Hybrid metaheuristic algorithm (SAGAC) used in optimization of vacuum cooling treatment of postharvest broccoli. Revista FSA 2021, 18, 160–172. [Google Scholar] [CrossRef]
  34. Benvenga, M.A.C.; Nääs, I.A. Optimization of hydrolysis of cassava starch for biofuel production using a Hybrid Metaheuristic Algorithm. Biomass Conv. Bioref. 2022, 12, 1–13. [Google Scholar] [CrossRef]
  35. Bean-Hodgins, L.; Mohammadigheisar, M.; Edwards, A.M.; Wang, C.; Barbut, S.; Kiarie, E.G. Comparative impact of conventional and alternative gut health management programs on growth performance and breast meat quality in broiler chickens raised in commercial and research settings. J. Appl. Poult. Res. 2022, 31, 100228. [Google Scholar] [CrossRef]
  36. Robertson, T.B. On the normal rate of growth of an individual, and its biochemical significance. Dev. Genes Evol. 1908, 25, 581–614. [Google Scholar] [CrossRef]
  37. Oviedo-Rondon, E.O. Model applications in poultry production and nutrition. In Nutritional Modelling for Pigs and Poultry; Sakomura, N.K., Gous, R.M., Kyriazakis, I., Hauschild, L., Eds.; CAB International: Wallingford, UK, 2015; pp. 125–140. [Google Scholar]
  38. Coffey, D.; Dawson, K.; Ferket, P.; Connolly, A. Review of the feed industry from a historical perspective and implications for its future. J. Appl. Anim. Nutr. 2016, 4, E3. [Google Scholar] [CrossRef]
  39. Lee, L.; Atkinson, D.; Hirst, A.G.; Cornell, S.J. A new framework for growth curve fitting based on the von Bertalanffy growth function. Sci. Rep. 2020, 10, 7953. [Google Scholar] [CrossRef]
  40. Piran, F.S.; Lacerda, D.P.; Camanho, A.S.; Silva, M.C.A. Internal benchmarking to assess the cost efficiency of a broiler production system combining data envelopment analysis and throughput accounting. Int. J. Prod. Econ. 2021, 238, 108173. [Google Scholar] [CrossRef]
Figure 1. Flowchart of the hybrid SAGAC algorithm.
Agriengineering 04 00073 g001
Figure 2. Flowchart of a Genetic Algorithm with the convergence acceleration mechanism.
Agriengineering 04 00073 g002
Figure 3. Descriptive analysis of experimental data of performance algorithms (SA, GA, and SAGAC) in growth curve optimization for broilers (a) and pigs (b).
Agriengineering 04 00073 g003
Figure 4. Example of the data convergence curves of determination coefficient models for optimization process (R²) for broilers (a) and pigs (b).
Agriengineering 04 00073 g004
Figure 5. Simulated curves of the models with errors between the database curves for broilers (a) and pigs (b).
Agriengineering 04 00073 g005
Figure 6. Descriptive analysis of experimental data from 300 assays of performance of SAGAC algorithm in process optimization for broilers (a) and pigs (b).
Agriengineering 04 00073 g006
Table 1. Database sample of age and pig live weight.
Age (Day)Average Weight (kg)
211055.9561.77
281128.0568.62
3511910.6275.56
4212613.6882.52
4913317.2589.46
5614021.3496.33
6314725.93103.08
7015430.99109.68
7716136.48116.09
8416842.37122.28
9117548.58128.25
9818255.07133.97
Table 2. Database of broilers’ historical growth, age, and weight.
ModelParameterValue Range
PigBroiler
MinMaxMinMax
Gompertzy1, kg1.74211.742146.000046.0000
L, g/g0.06000.12000.06000.1200
K, t−10.01540.01860.01530.0186
Logistic for pigA, kg114.8539194.1031--
K, t−10.01300.0220--
M, kg/kg4.92468.3226--
Logistic for broilerA, kg--2616.37273165.8110
L, g/g--0.11820.1430
K, t−1--24.454529.5900
Von BertalanffyA, kg253.1169427.76765652.49096839.5140
B, kg/kg0.00000.90000.79090.9570
K, t−10.00700.01000.02730.0330
Table 3. Range values of the function parameters for the studied models.
ModelParameterValue Range
PigBroiler
MinMaxMinMax
Gompertzy1, kg1.74211.742146.000046.0000
L, g/g0.06000.12000.06000.1200
K, t−10.01540.01860.01530.0186
Logistic for pigA, kg114.8539194.1031--
K, t−10.01300.0220--
M, kg/kg4.92468.3226--
Logistic for broilerA, kg--2616.37273165.8110
L, g/g--0.11820.1430
K, t−1--24.454529.5900
Von BertalanffyA, kg253.1169427.76765652.49096839.5140
B, kg/kg0.00000.90000.79090.9570
K, t−10.00700.01000.02730.0330
Table 4. Setup parameters of SAGAC algorithm.
Setup Parameters of SAGAC
SA Parameters
Initial Temperature100
TDS (Temperature Decay Scheme)1
AGAC Parameters
Population size400
Generations (Quantity)200
Elitism0.1
Mutation0.05
Quantity of attempts to generate children in the elite1
Table 5. Comparison of the obtained results for the three tested models for pigs.
SAGAC
ModelVon BertalanffyLogisticGompertz
ParameterA, kg259.524A, kg140.4539y₁, kg1.7421
b, kg/kg0.8277K, t⁻¹0.0220L, g/g0.0784
K, t⁻¹0.0078M, kg/kg8.3226K, t⁻¹0.0175
0.93890.97380.9595
Table 6. Comparison of the obtained results for the three tested models for the broilers.
SAGAC
ModelVon BertalanffyLogisticGompertz
ParameterA, kg5800.4909A, kg2884.3727y₁, kg46.0000
b, kg/kg0.9570L,(g D¹)0.1430L, g/g0.0904
K, t⁻¹0.0330K,(g D¹)29.5900K, t⁻¹0.0165
0.9997390.9999550.999998
Table 7. Performance of SAGAC in 300 trials for each model related to the dispersion obtained for each assay for all models.
MeasureCoefficient of Determination (R²)
BroilerPig
GompertzLogisticVon BertalanffyGompertzLogisticVon Bertalanffy
Mean0.9988720.9999570.9997800.9486740.9742650.903218
Median0.9992790.9999550.9997390.9507690.9742410.914902
Standard Deviation0.0011770.0000060.0000760.0088780.0004400.041319
Minimum0.9930100.9999550.9997390.9317080.9737870.731966
Maximum0.9999980.9999930.9999920.9599620.9749990.949889
Publisher’s Note: MDPI stays neutral with regard to jurisdictional claims in published maps and institutional affiliations.

