1. Introduction
Soil erosion is defined as a process by which soil particles are detached, transported, and deposited under the action of an erosive agent [
1,
2]. The detachment process refers to the dislodgment of vulnerable soil particles from the soil mass under the action of rainfall splash or scouring from overland flow [
3]. Detachment begins when there is sufficient energy exerted on soil aggregates at the surface to destroy the soil’s cohesive force, enabling the transport of soil particles [
4,
5]. Given that erosion can lead to a shift in soil texture, soil organic matter, and soil nutrients, resulting from loss of fines and organic matter which is detrimental to the soil structure, the soil water holding capacity, and crop productivity, considerable effort is being made to predict sediment detachment and transport rates [
1,
6].
Soil erosion has become a serious hindrance to the sustainability of agricultural production in China’s Loess Plateau region. This region is where the majority of China’s agricultural production occurs. Intensive tillage and long-term overuse of resources from traditional farming practices have left the soil surface structure loose and seriously eroded. The overland flow of water and soil loss from sloping fields have been identified as the main causes of erosion, deteriorating the productivity of these soils. This persistent erosion problem has led to barren land, ravines and gullies throughout this region [
7]. Thus, many studies are being conducted to explore the controlling factors affecting soil detachment and to develop soil erosion models for estimating soil losses in the region.
Cropland that is under intensive and frequent tillage, or that is bare and exposed to rainfall, is more susceptible to erosion than undisturbed soil [
8,
9]. Zhang et al. [
9] reported soil detachment rates from disturbed soils were up to 23 times that of natural undisturbed soil, indicating that the hydraulic characteristics are changed when soil is disturbed. However, over time, the process of soil restructuring occurs as the reorganization of the pores occurs. Panachuki et al. [
10] reported, after increasing applications of simulated rains, that there was a tendency for the soil under conventional tillage to consolidate. They suggested that this occurred because recently tilled soils undergo a process of reconsolidation over time, and this phenomenon is accelerated by soil wetting and drying. They also correlated this occurrence to soil aggregation. For example, shortly after tilling, they observed smaller soil aggregates (soil aggregate diameters) which were attributed to disaggregation as a result of tillage breaking the aggregates apart. After seven simulated rain events, there was a structural reorganization of the soil mass, resulting in increased soil aggregate size [
11]. Considering that wetting and drying cycles are natural processes that occur in soil, more research is needed to understand the influence that this process may have on soil erosion.
Stripping of the soil surface, resulting from rill erosion, has become an important issue studied in the Loess Plateau region. Rill erosion primarily occurs when a concentrated overland flow of water develops small well-defined channels [
11]. These channels act as sediment sources and transport passages for soil loss [
12]. Nearing et al. [
13,
14] conducted a series of field experiments evaluating the hydrodynamic characteristic of rill erosion from several soils as a function of hydraulic shear stress, stream power and hydraulic friction. Their results illustrated that rill erosion rates were better correlated to a power function of either shear stress or stream power. Lyle and Smerdon [
15] first used an experimental flume to simulate the relationship between soil erosion and shear stress from surface runoff. Since then, numerous researchers have used this approach [
16,
17,
18]. Zhang et al. [
19,
20] demonstrated that there is a functional relationship between the erosion rate, slope, flow rate and water depth. They [
19,
20] also suggested that the soil erosion rate increases with an increasing flow rate of runoff and slope and that the effect of flow rate on erosion is greater than that of the slope. These studies have led to a better understanding of the mechanisms influencing soil detachment from rill erosion. However, there has been limited research evaluating the influence of soil wetting and drying on soil erosion, especially on the Loess Plateau soils. This information is necessary for the better development of process-based erosion models. Therefore, the objective of this study was to determine the influence of soil wetting and drying on soil detachment. The resulting detachment data were then compared with predictions derived from empirical relationships.
2. Materials and Methods
This experiment was conducted using a Loess Plateau soil at the College of Nature Resources and Environment, Northwest A&F University, Yangling, Shaanxi, China. The soil used was collected from cropland topsoil (0–20 cm depth) in the Rougu Valley (34°16′56.24″ N, 108°4′27.95″ E), Yangling District of Shannxi Province, which had been previously managed under a corn-wheat double cropping system (raising two crops in succession per year on the same field). Following collection, the Loessial soil was passed through a 5 mm sieve after air-drying to facilitate the removal of straw and coarse particles and then thoroughly mixed. This soil, from the study site, was formed from loess parent material and is relatively deep, with a loam texture (USDA soil classification criteria). The soil was a loam (loess) composed of 28.9% sand, 45.4% silt, and 25.7% clay, with a median particle size of 13.3 μm and a specific surface area of 1.17 m2 g−1.
2.1. Experimental Setup and Treatments
To investigate the influence of wetting and drying cycles on soil detachment, the soils were saturated, simulating the soil water absorption process that occurs following a wetting by rainfall, and then dried, simulating the process of drying by solar radiation. The influence of the soil wetting and drying cycles was evaluated under controlled conditions using small steel boxes (0.30 × 0.30 × 0.25 m in dimensions) with several perforated holes in the bottom.
In order to achieve the objective of this study, six wetting and drying cycles (1–6 cycles) replicated in triplicates were evaluated. Each steel box was lined with cheesecloth and then the sieved air-dried soil was packed into the box to a uniform bulk density of 1.2 g cm−3, mimicking the field conditions from where the soil was collected. The boxes were wetted through capillary saturation from the bottom by placing boxes into a shallow water tank. Subsequently, the tank was filled slowly with tap water until the water level was 5 mm below the top of the steel boxes. This water level was maintained for 24 h to allow the soil samples to soak and reach saturation. After saturating the samples, the erosion boxes were removed from the tank and allowed to drain by gravity for a few minutes and were then subjected to drying. For each wetting and drying cycle, the samples in the erosion boxes were oven-dried at 105 °C from saturation to a constant weight of 15% dry basis moisture, weighing the boxes every 2 h. The 15% dry basis moisture content was based on the average annual soil moisture for farmland soil in the study area.
2.2. Measurement of Soil Detachment
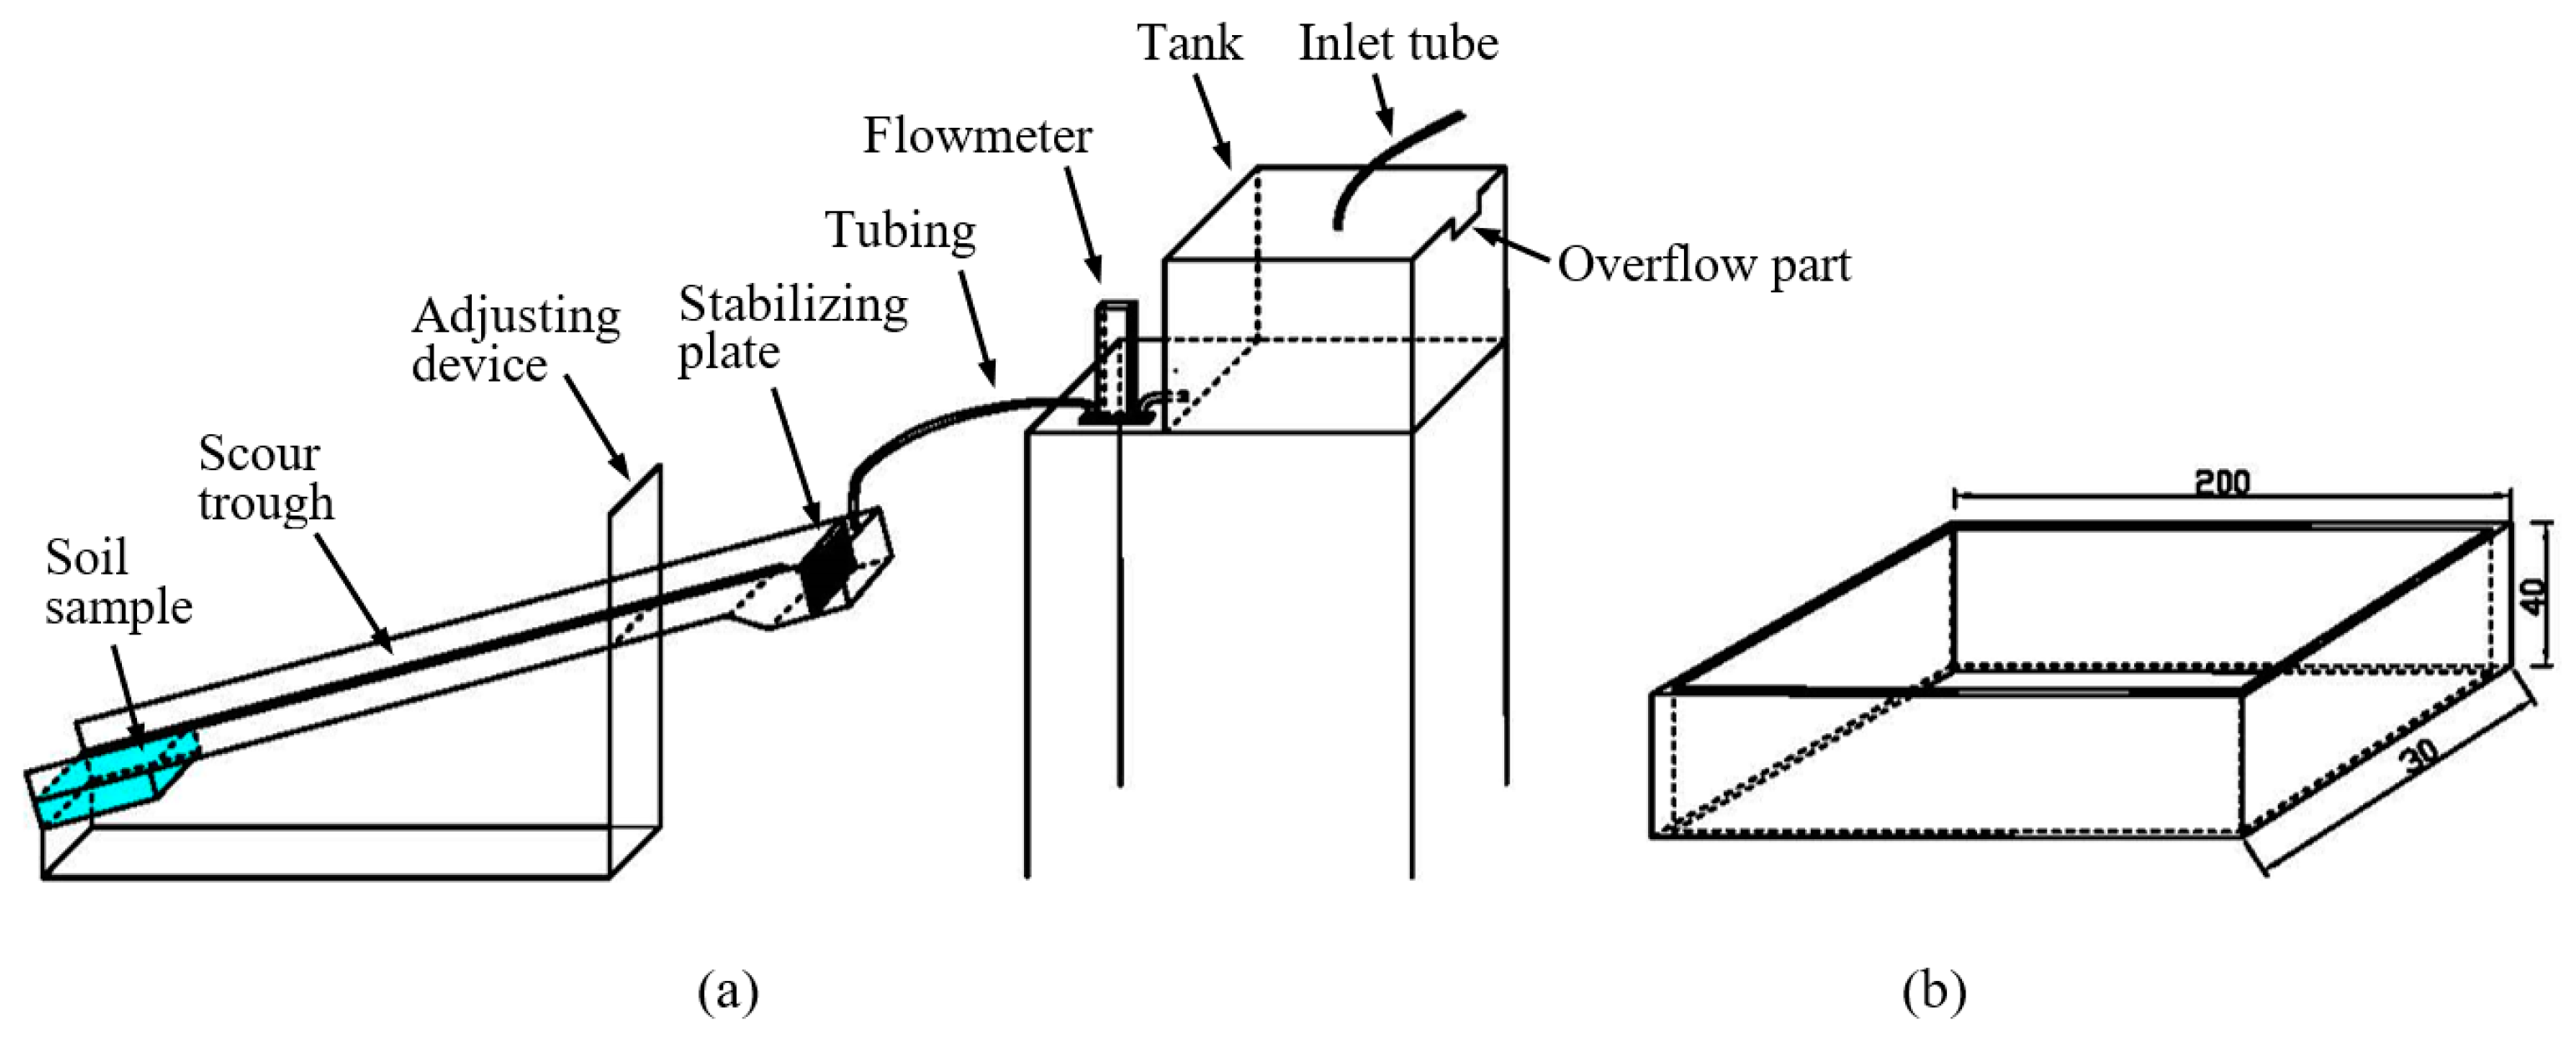
Soil detachment was determined in the laboratory under temperature-controlled conditions by eroding soil samples with tap water using an experimental flume apparatus. The flume apparatus’ main section was a scour trough with a slope length of 1 m and a width of 30 mm. The flume apparatus could be manually adjusted to the appropriate slope gradient. A soil chamber (200 mm slope length, 30 mm width, and 40 mm deep) was located on the downslope end of the flume apparatus for evaluating the soil detachment by overland flow. Prior to each erosion simulation, a subsample (200 mm slope length × 30 mm width × 40 mm depth) was taken from the steel soil erosion boxes described above using a rectangular cutting frame (
Figure 1) and placed in the soil chamber of the flume apparatus (
Figure 1) at the downslope end of the channel having a 17.6% slope. During laboratory simulations, water was delivered into the tank at the upper end of the flume by a pump. The flow rate was measured using a model LZB-4F variable area flowmeter (Changzhou Cheng Heng Instrument Co., Ltd. (Changzhou, Jiangsu, China)) with a 16–160 mL min
−1 specified flow rate range. The flow rate was adjusted using a valve. Each soil erosion test was conducted at a constant flow rate of 40 mL min
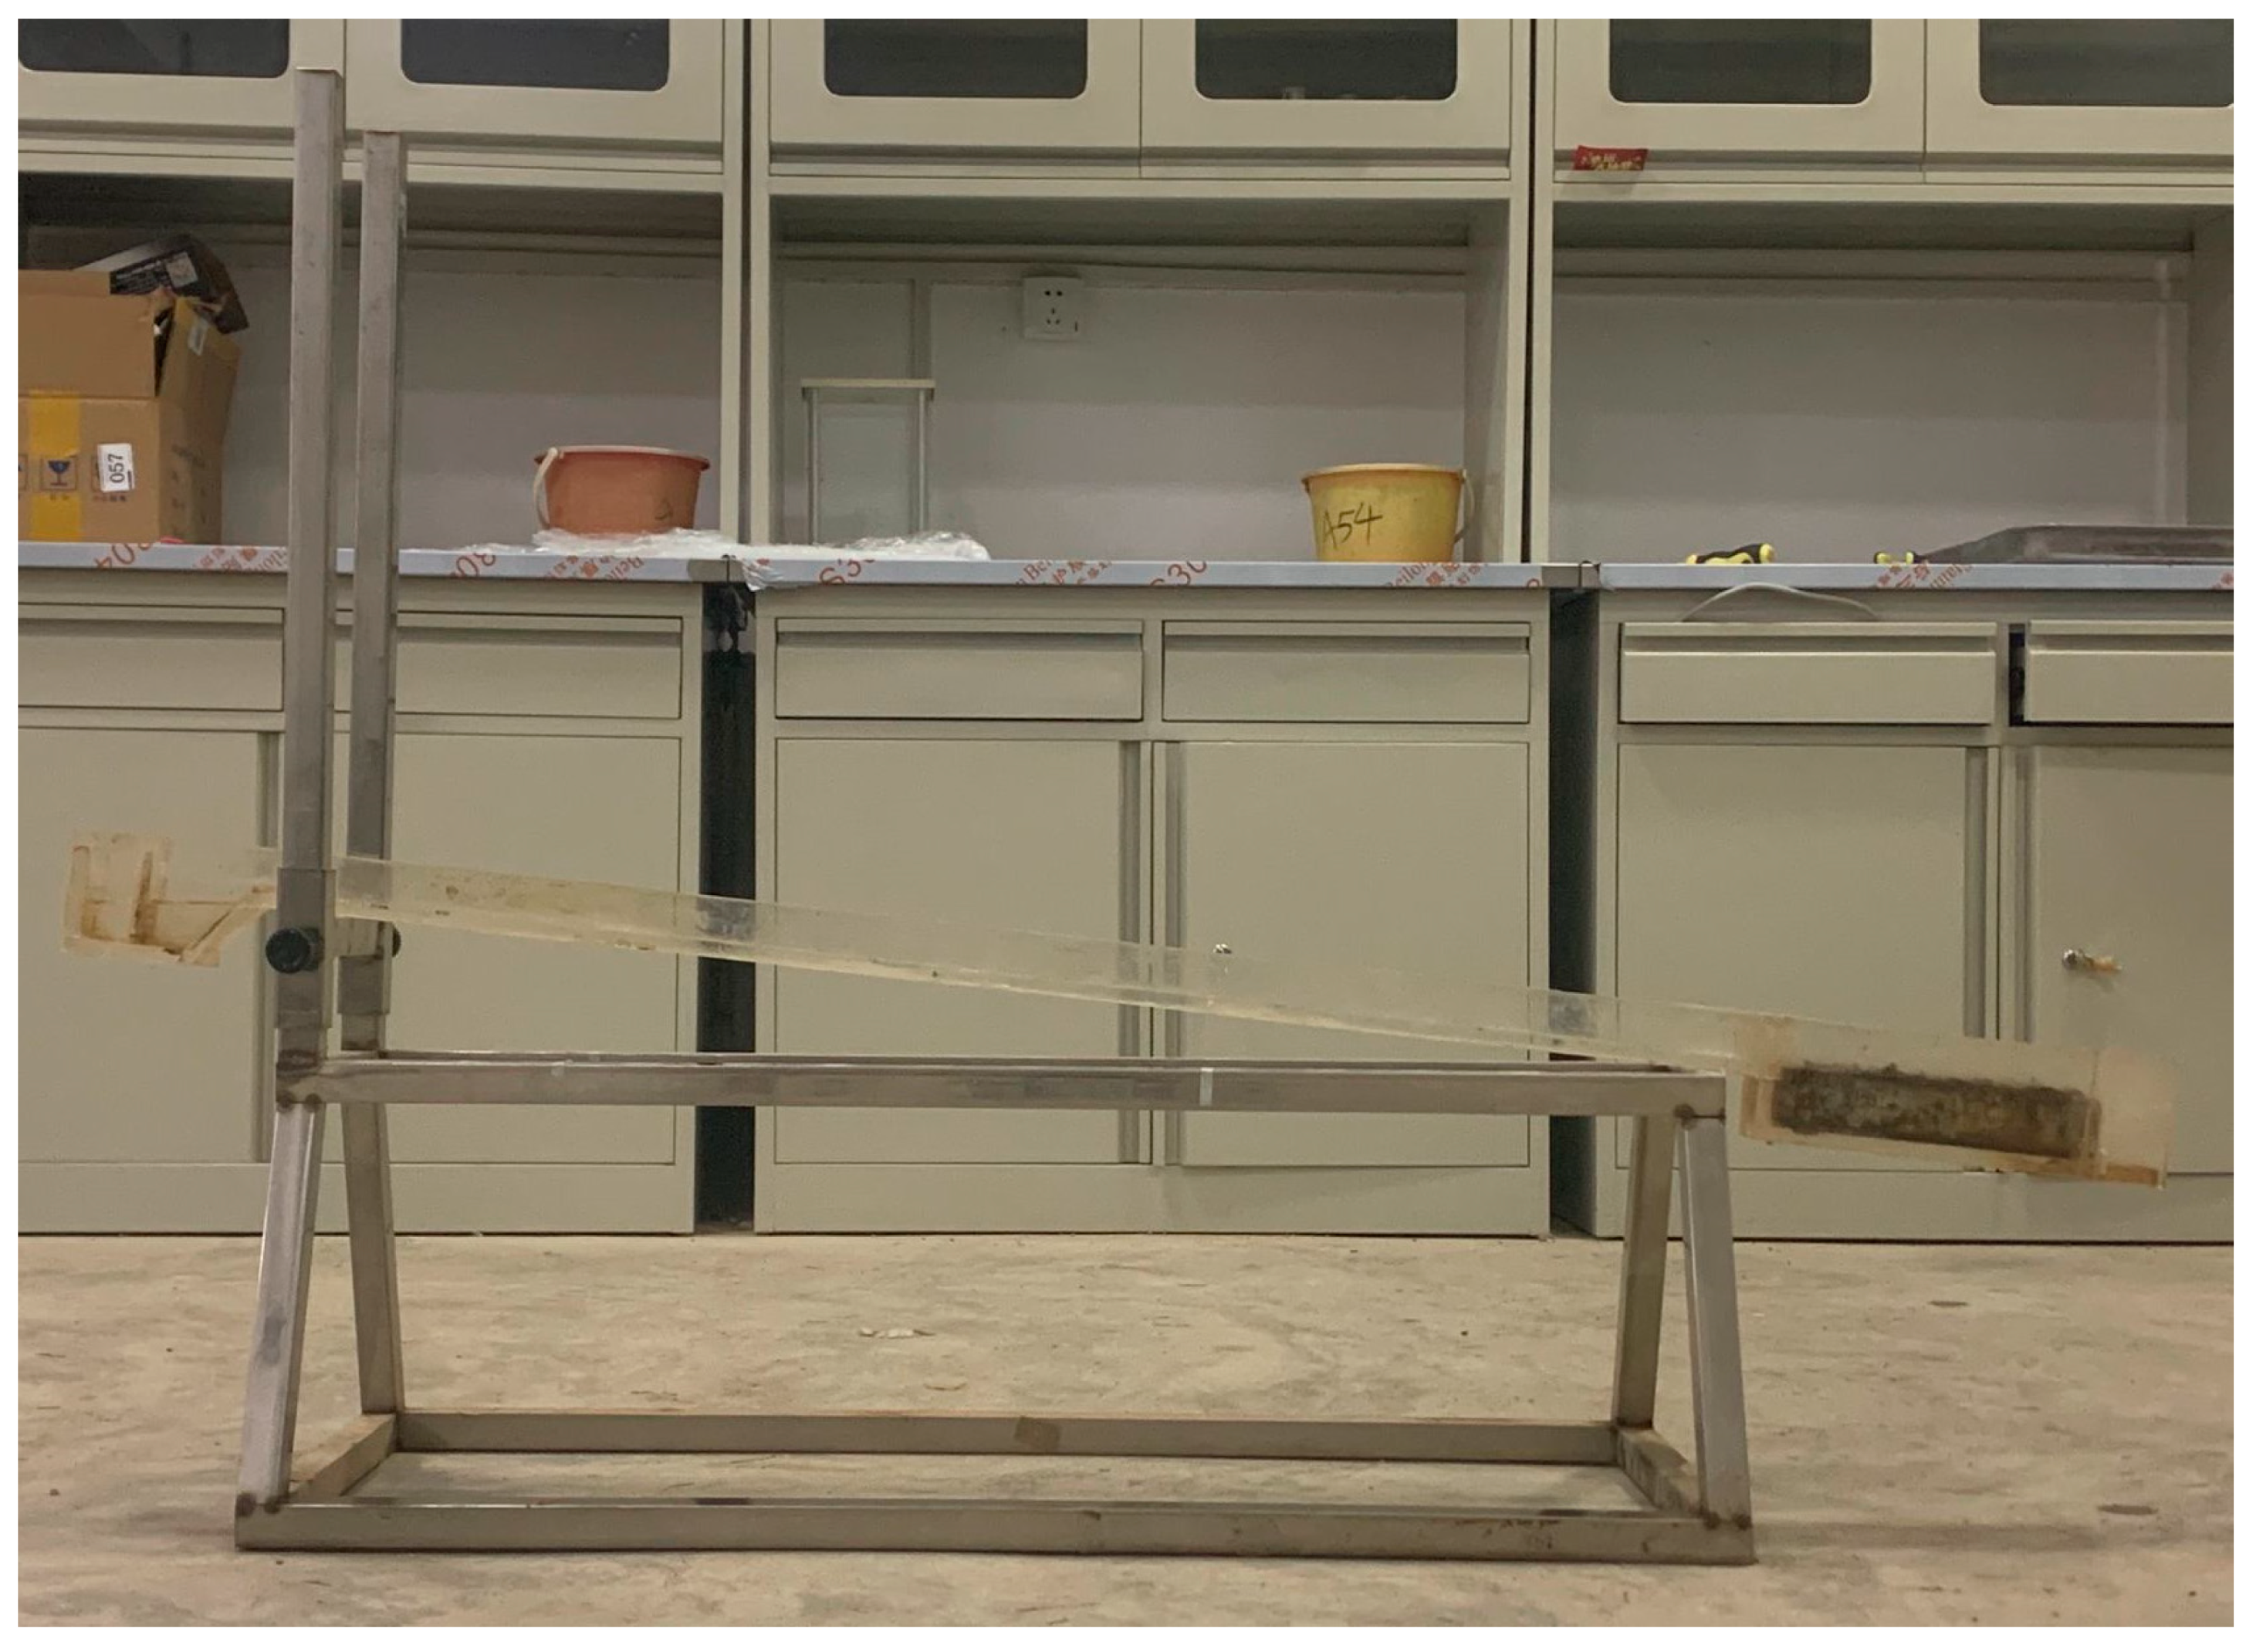
−1 and was continued until the top 1 cm was eroded away from soil in the soil chamber, or until 15 min had elapsed, whichever occurred first. Following the initiation of runoff, a separate subsample was taken every 30 s from the water outflowing at the base of the flume apparatus. A picture of this experimental setup is shown in
Figure 2.
2.3. Sample Analysis
Soil bulk density was determined from the soil in the soil erosion boxes for each wetting and drying cycle treatment using the steel cutting ring (cylinder of known volume) method. The bulk density was calculated as the ratio of oven-dried soil (105 °C for 24 h) mass to the cutting ring’s volume.
Mass detached soil collected from each 30 s interval was determined by filtering the runoff samples through filter paper and then drying the remaining particulate matter at 55 °C until a constant mass was achieved and then weighed. The detachment rate was calculated as the mass of eroded soil collected in each 30 s time interval.
2.4. Simulation of Soil Detachment using Richards Model
The Richards model is a growth process description equation and the basic form is:
where
K is the cumulative sediment loss value,
a is the initial sediment loss value,
b is the rate change, and
c is the allometric parameter.
Equation (1) can be rearranged as:
The Richards model can be described as a monotonically increasing function. As
x tends to infinity,
Y approaches
K. It is a four-parameter model which lends itself to easily describing measured data and increasing the prediction accuracy [
21,
22].
There are two maximum values for describing the Richards growth model rate of change [
23], and the two coordinates are:
where
H is given by:
Using the two values of H from Equation (4), in Equation (3), we get two values of . The smaller value denotes the inflection point, which is the cutoff point between the initial stage and the exponential phase. The larger value denotes the cutoff point between the exponential phase and stabilization phase.
Soil erosion can be affected by soil texture, and the cumulative loss of sediment during the erosive process can be described as a monotonically increasing function following an S-shaped curve response.
The Richards model is a four-parameter nonlinear model which describes the variation of soil detachment with time. The selection of initial values is important when the model parameters are fitted. According to characteristics of the Richards model, Y tends to reach its maximum value K when x → ∞. Therefore, a reasonable initial estimate K0 can be taken as the approximate maximum value of Y when x → ∞ in terms of the relationship between Y and x.
The equation is as follows:
Furthermore, the initial estimate value
c0 can be determined by using Equation (5). Equation (1) can be rearranged as:
Equation (7) is obtained by taking the natural logarithm of both sides of Equation (6):
The initial estimates of
ln(
α) and
b are
ln (
α0) and
b0, and can be determined by linear regression. Once the initial parameters
K,
α,
b and
c are determined, they are used as input for the SPSS v20.0 statistical program. SPSS was used to fit the Richards model for describing the soil erosion process using nonlinear regression according to procedures described by Christian et al. [
23] from the values obtained during the laboratory runoff experiment.
2.5. Data Processing
Statistical analysis for this study was performed using the SPSS 18.0 software (SPSS Inc., Chicago, IL, USA). An analysis of variance was conducted to examine the significant differences in bulk density and soil detachment. Multiple comparisons among treatments were separated with Duncan’s multiple range test and deemed significant using the 5% significance level. A correlation matrix of the Pearson correlation coefficient was used to determine the correlations between data from the Richards growth equation to that of the experimental data collected during this study.
3. Results and Discussion
3.1. Wetting and Drying Cycle Influence on Soil Bulk Density
Soil bulk density is an important indicator of soil physical conditions and is defined as the ratio between a dried mass of soil to its total volume [
24]. It is commonly used to help characterize soil structural quality. For example, soil bulk density can be useful in describing both the packing structure of a soil and its permeability [
25], whereby drainage characteristics can be inferred [
26].
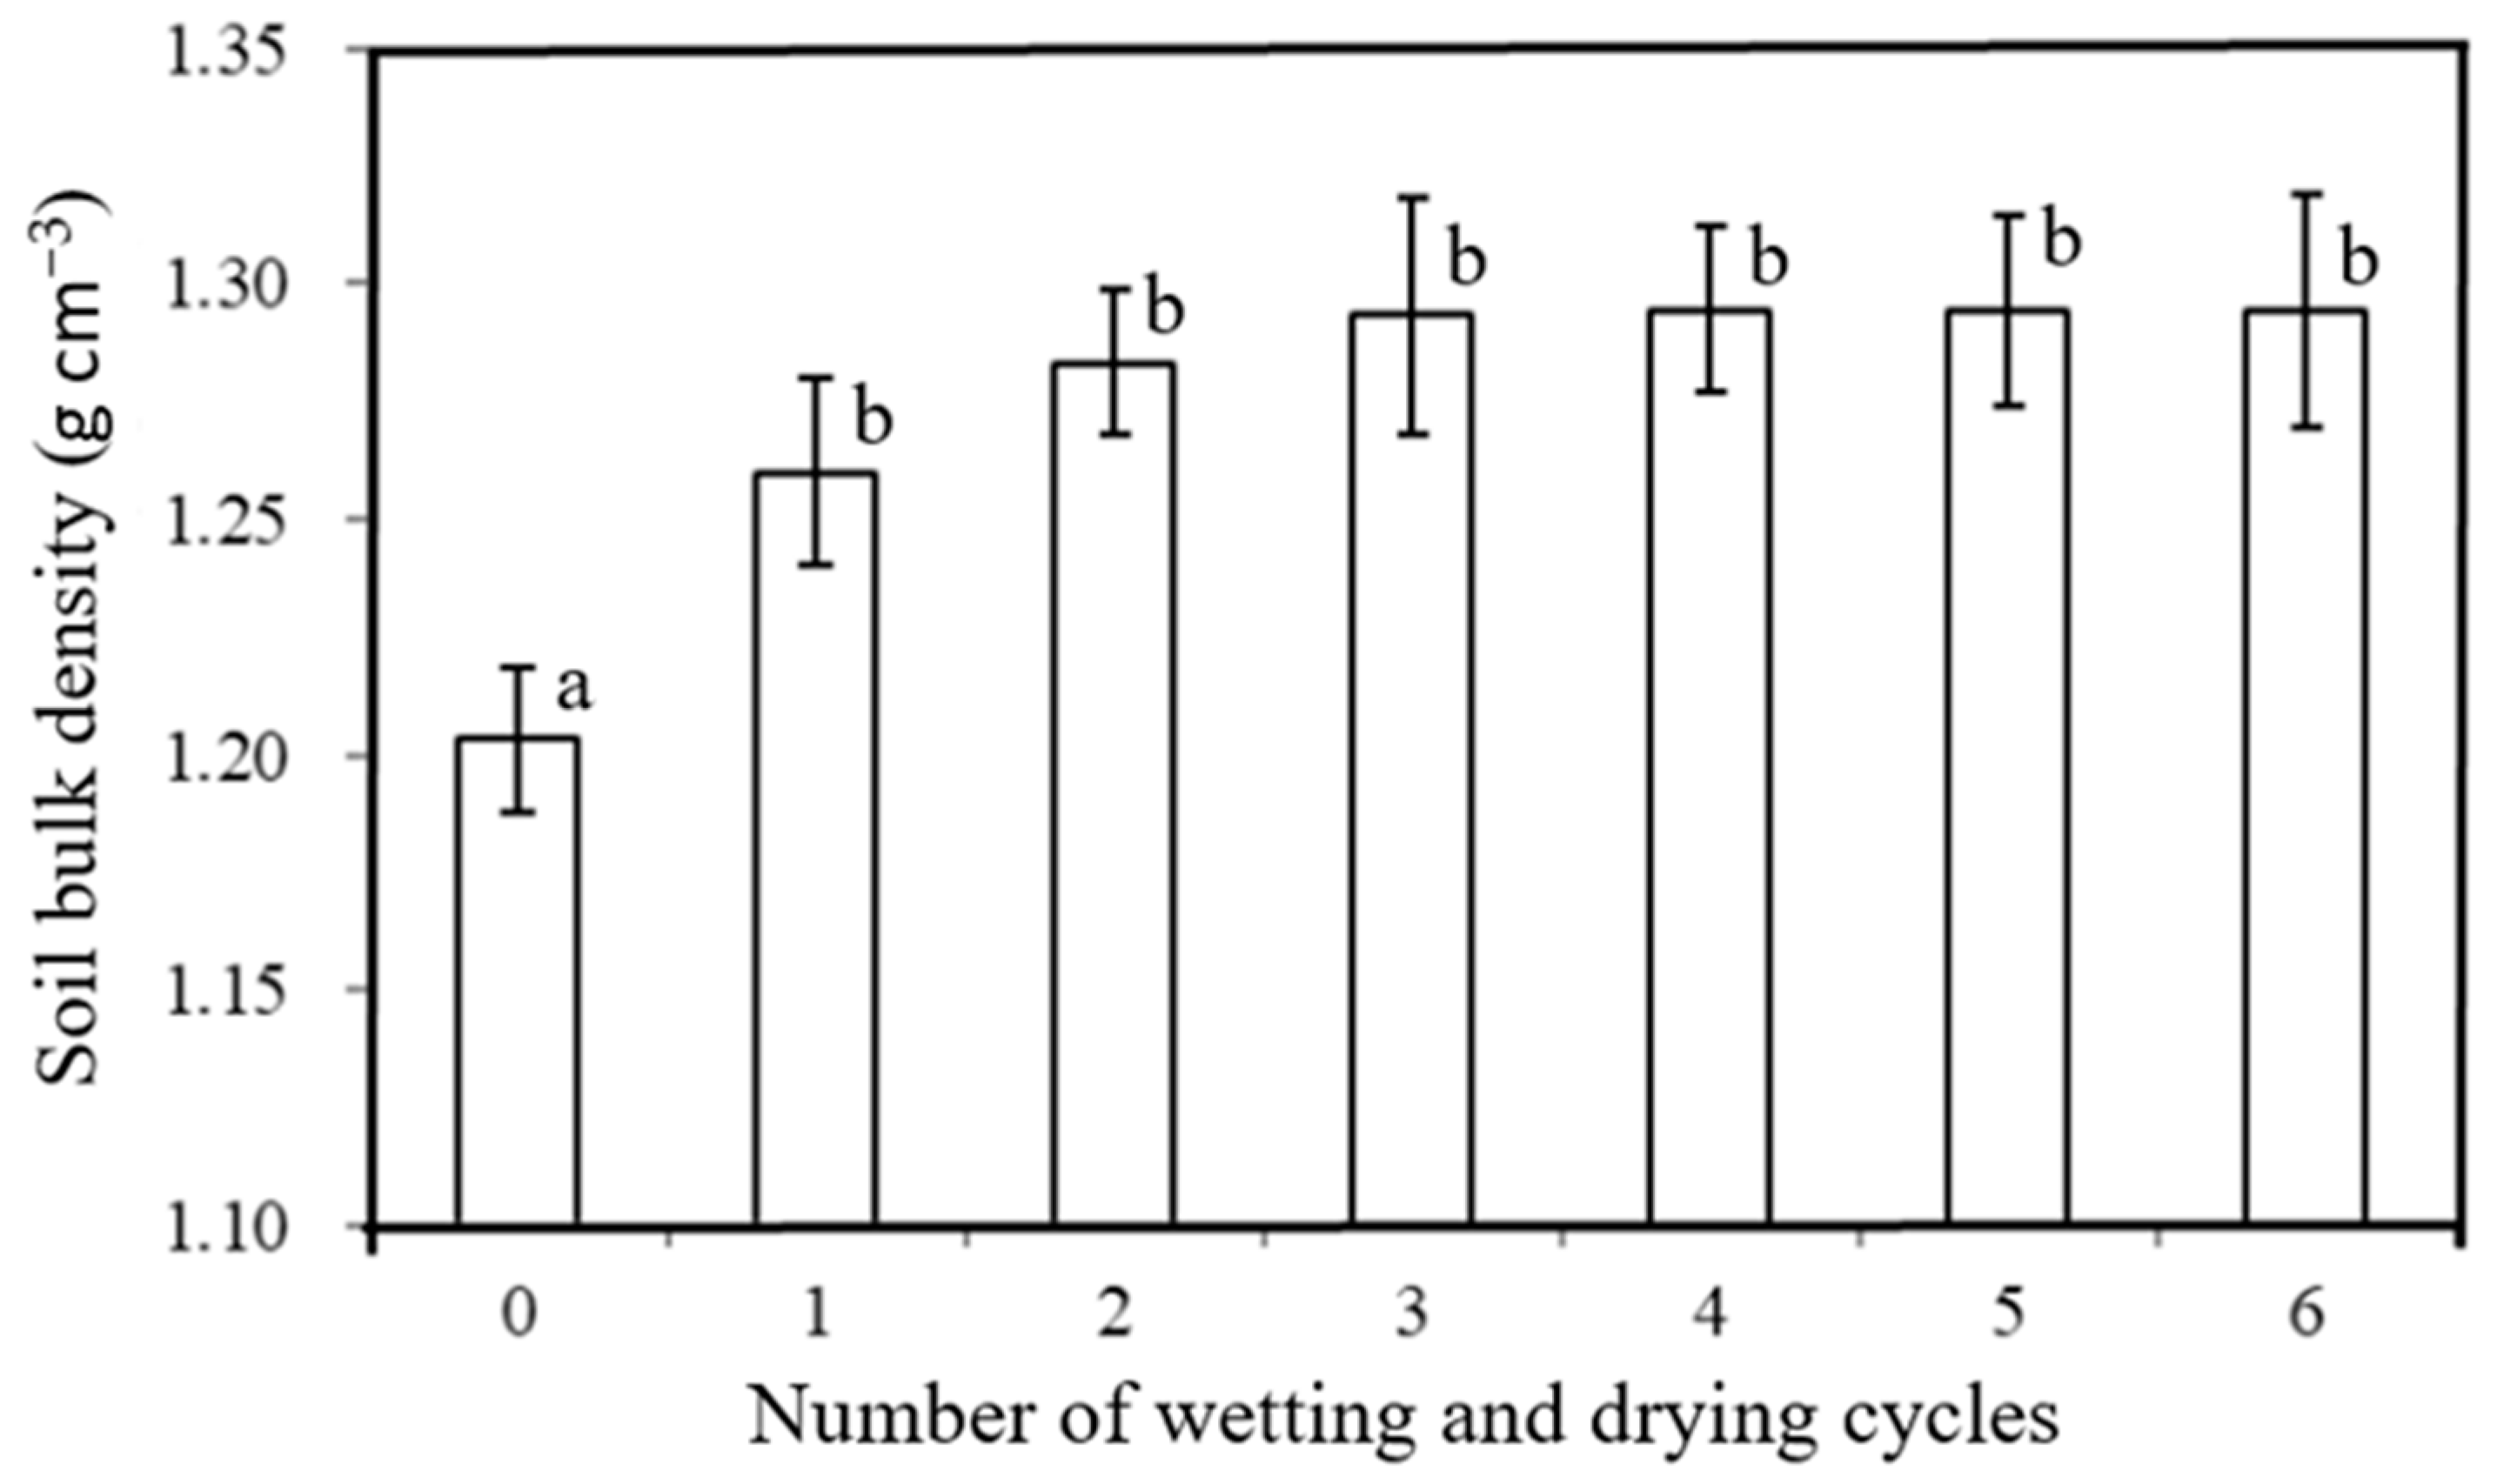
The influence of wetting and drying (0–6 cycles) on soil bulk density observed in this study is shown in
Figure 3. Following one wet-dry cycle, soil bulk density increased from 1.20 to 1.26 g cm
−3. After the sixth wet-dry cycle, soil bulk density reached 1.29 g cm
−3. Thus, the bulk density increase following the first wet-dry cycle was 67%, and the last five cycles accounted for 33%. These results suggest that the soil became more compacted following the wetting and drying cycles. Soil bulk density increases as the number of wetting and drying cycles progressed, which is most likely a result of the soil undergoing a process of reconsolidation. This is a result of disaggregation from the initially sieved soil undergoing structural reorganization. In other words, the loose aggregates formed a more coherent soil structure following the wetting and drying. During this process, mean soil pore space diameter decreases from the increasing density and reconsolidation occurs following wetting and drying, with reconsolidation being accelerated by wetting and drying. Our results also imply that the amount of soil reconsolidation per wet-dry cycle decreased as the number of cycles increased. The differences in bulk density between the wet-dry cycles 2–6 were considerably lower than that observed between the initially sieved soil and the second wet-dry cycle. Previous reports have shown that soil porosity increases, caused by tillage, and gradually decreases over time due to reconsolidation during wetting and drying cycles [
27,
28,
29]. It has also been reported that most of the reconsolidation occurs during the first wetting and drying cycle and progressively less occurs in the succeeding cycles [
30]. These reported occurrences are similar to our findings.
3.2. Wetting and Drying Cycles Influence on Soil Detachment
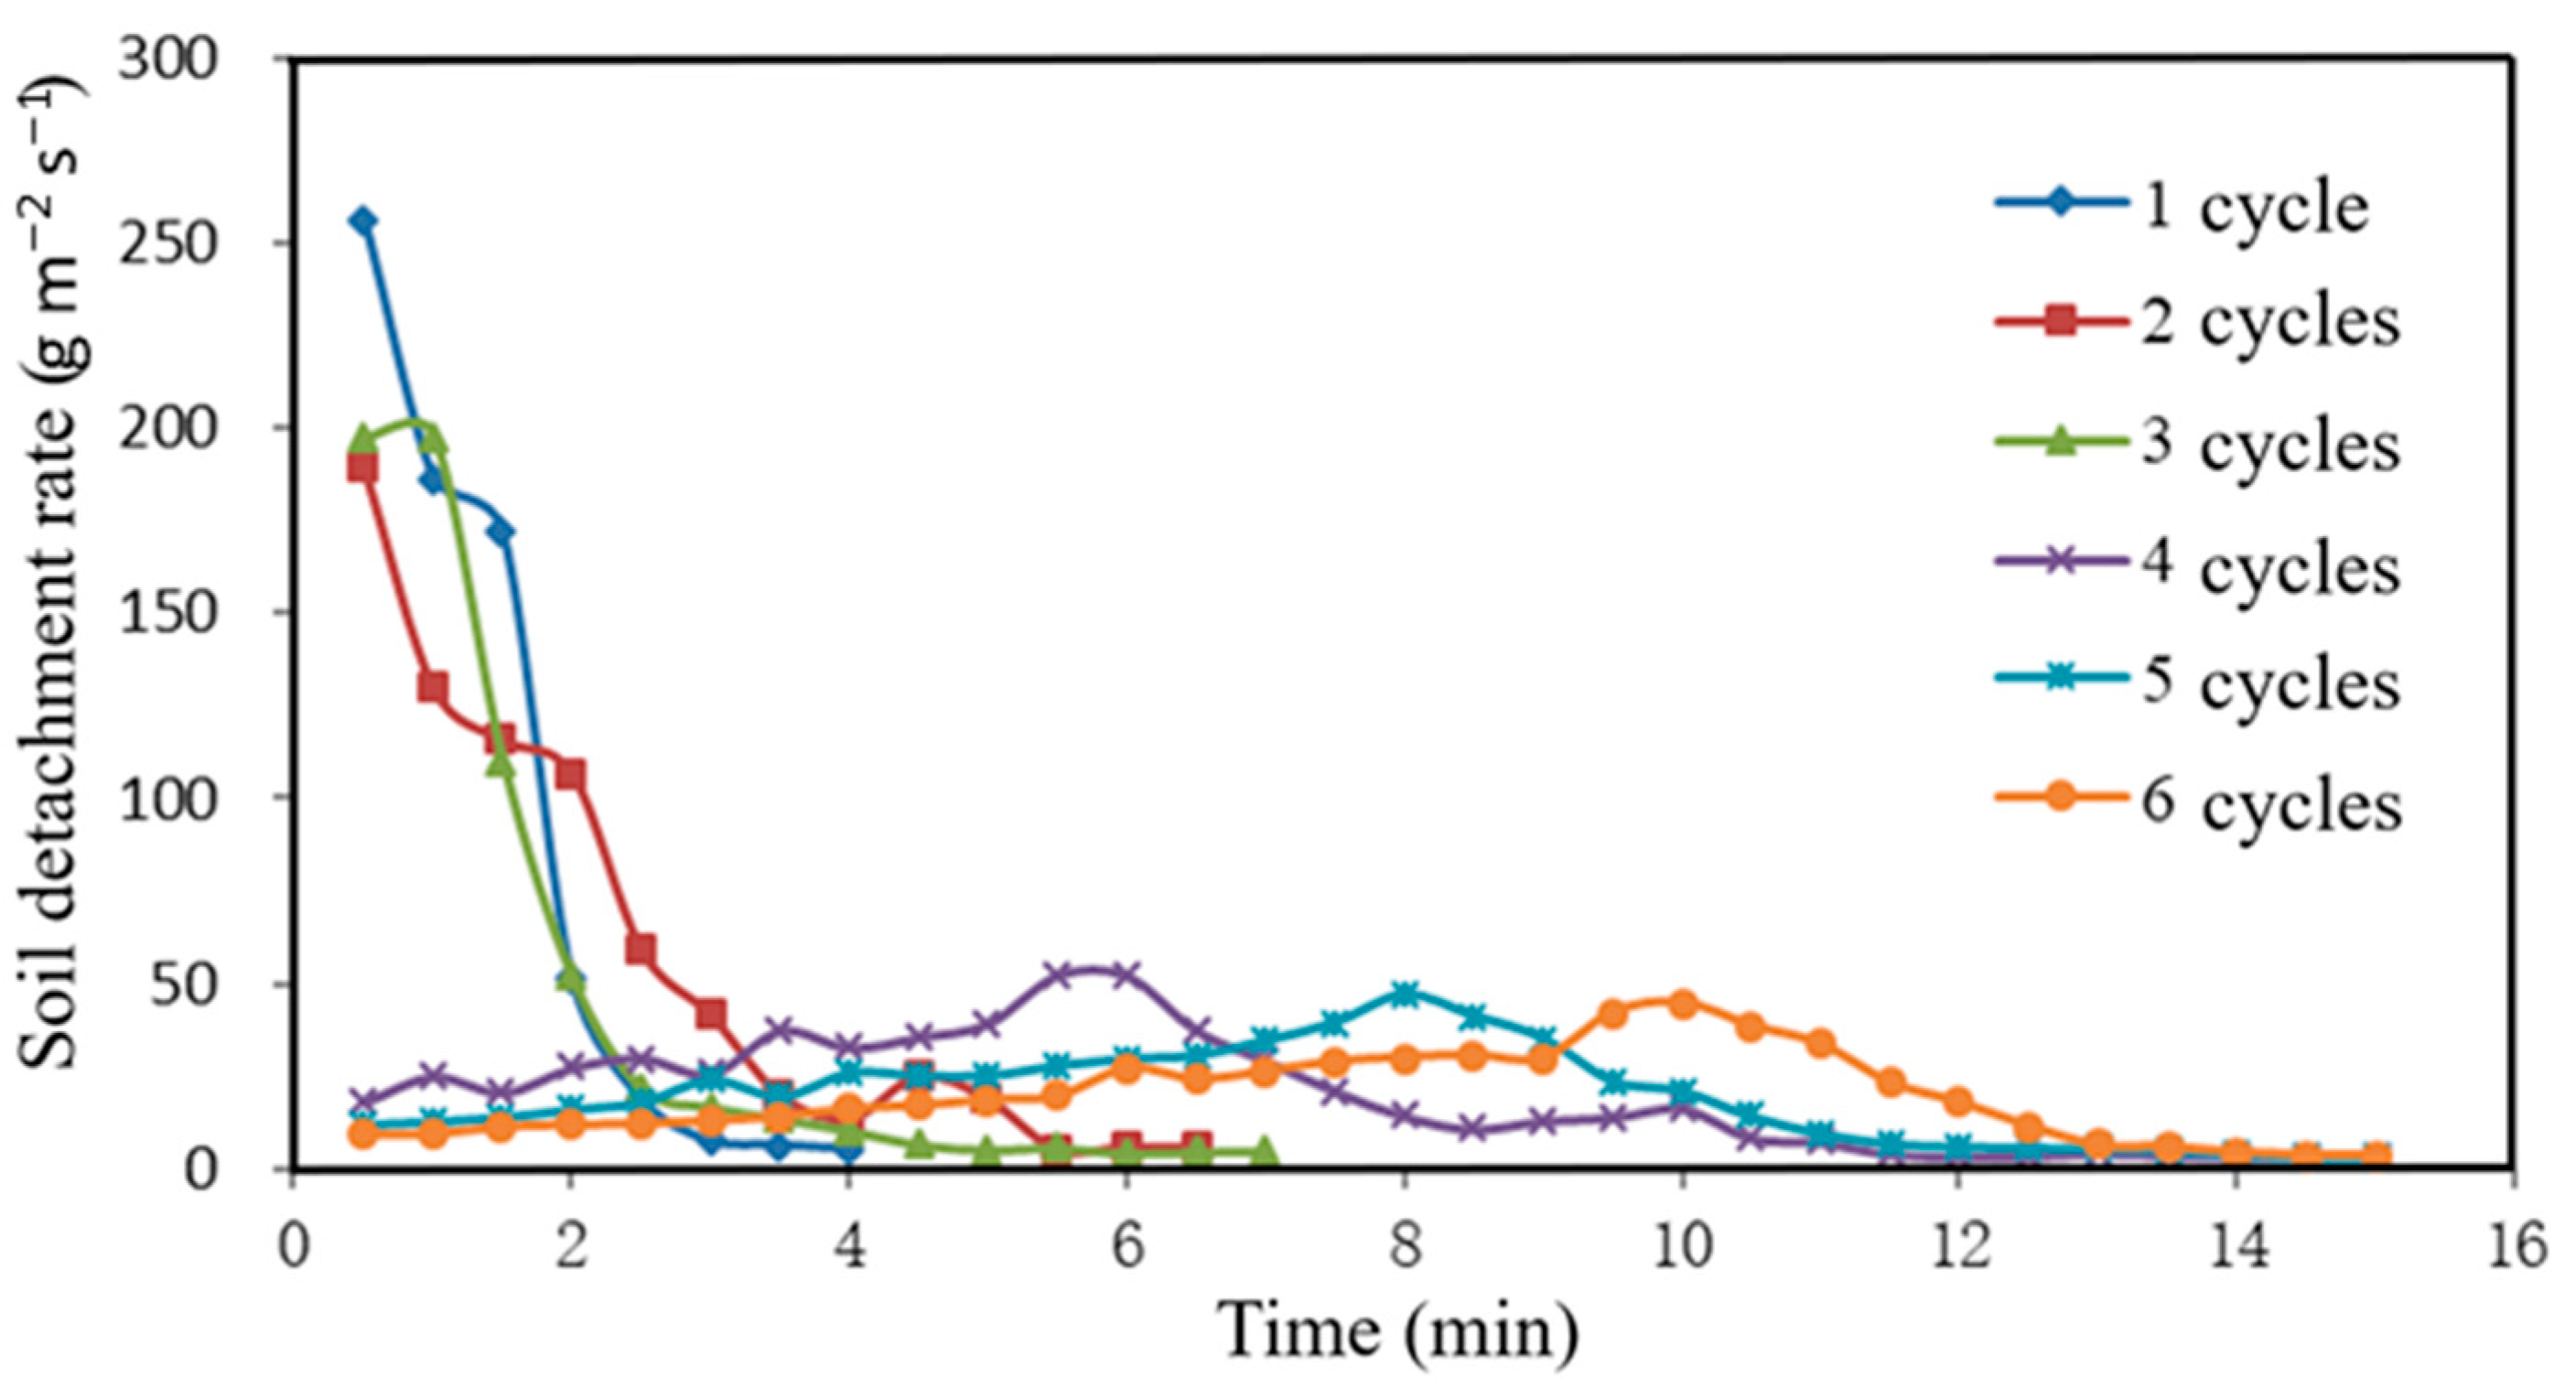
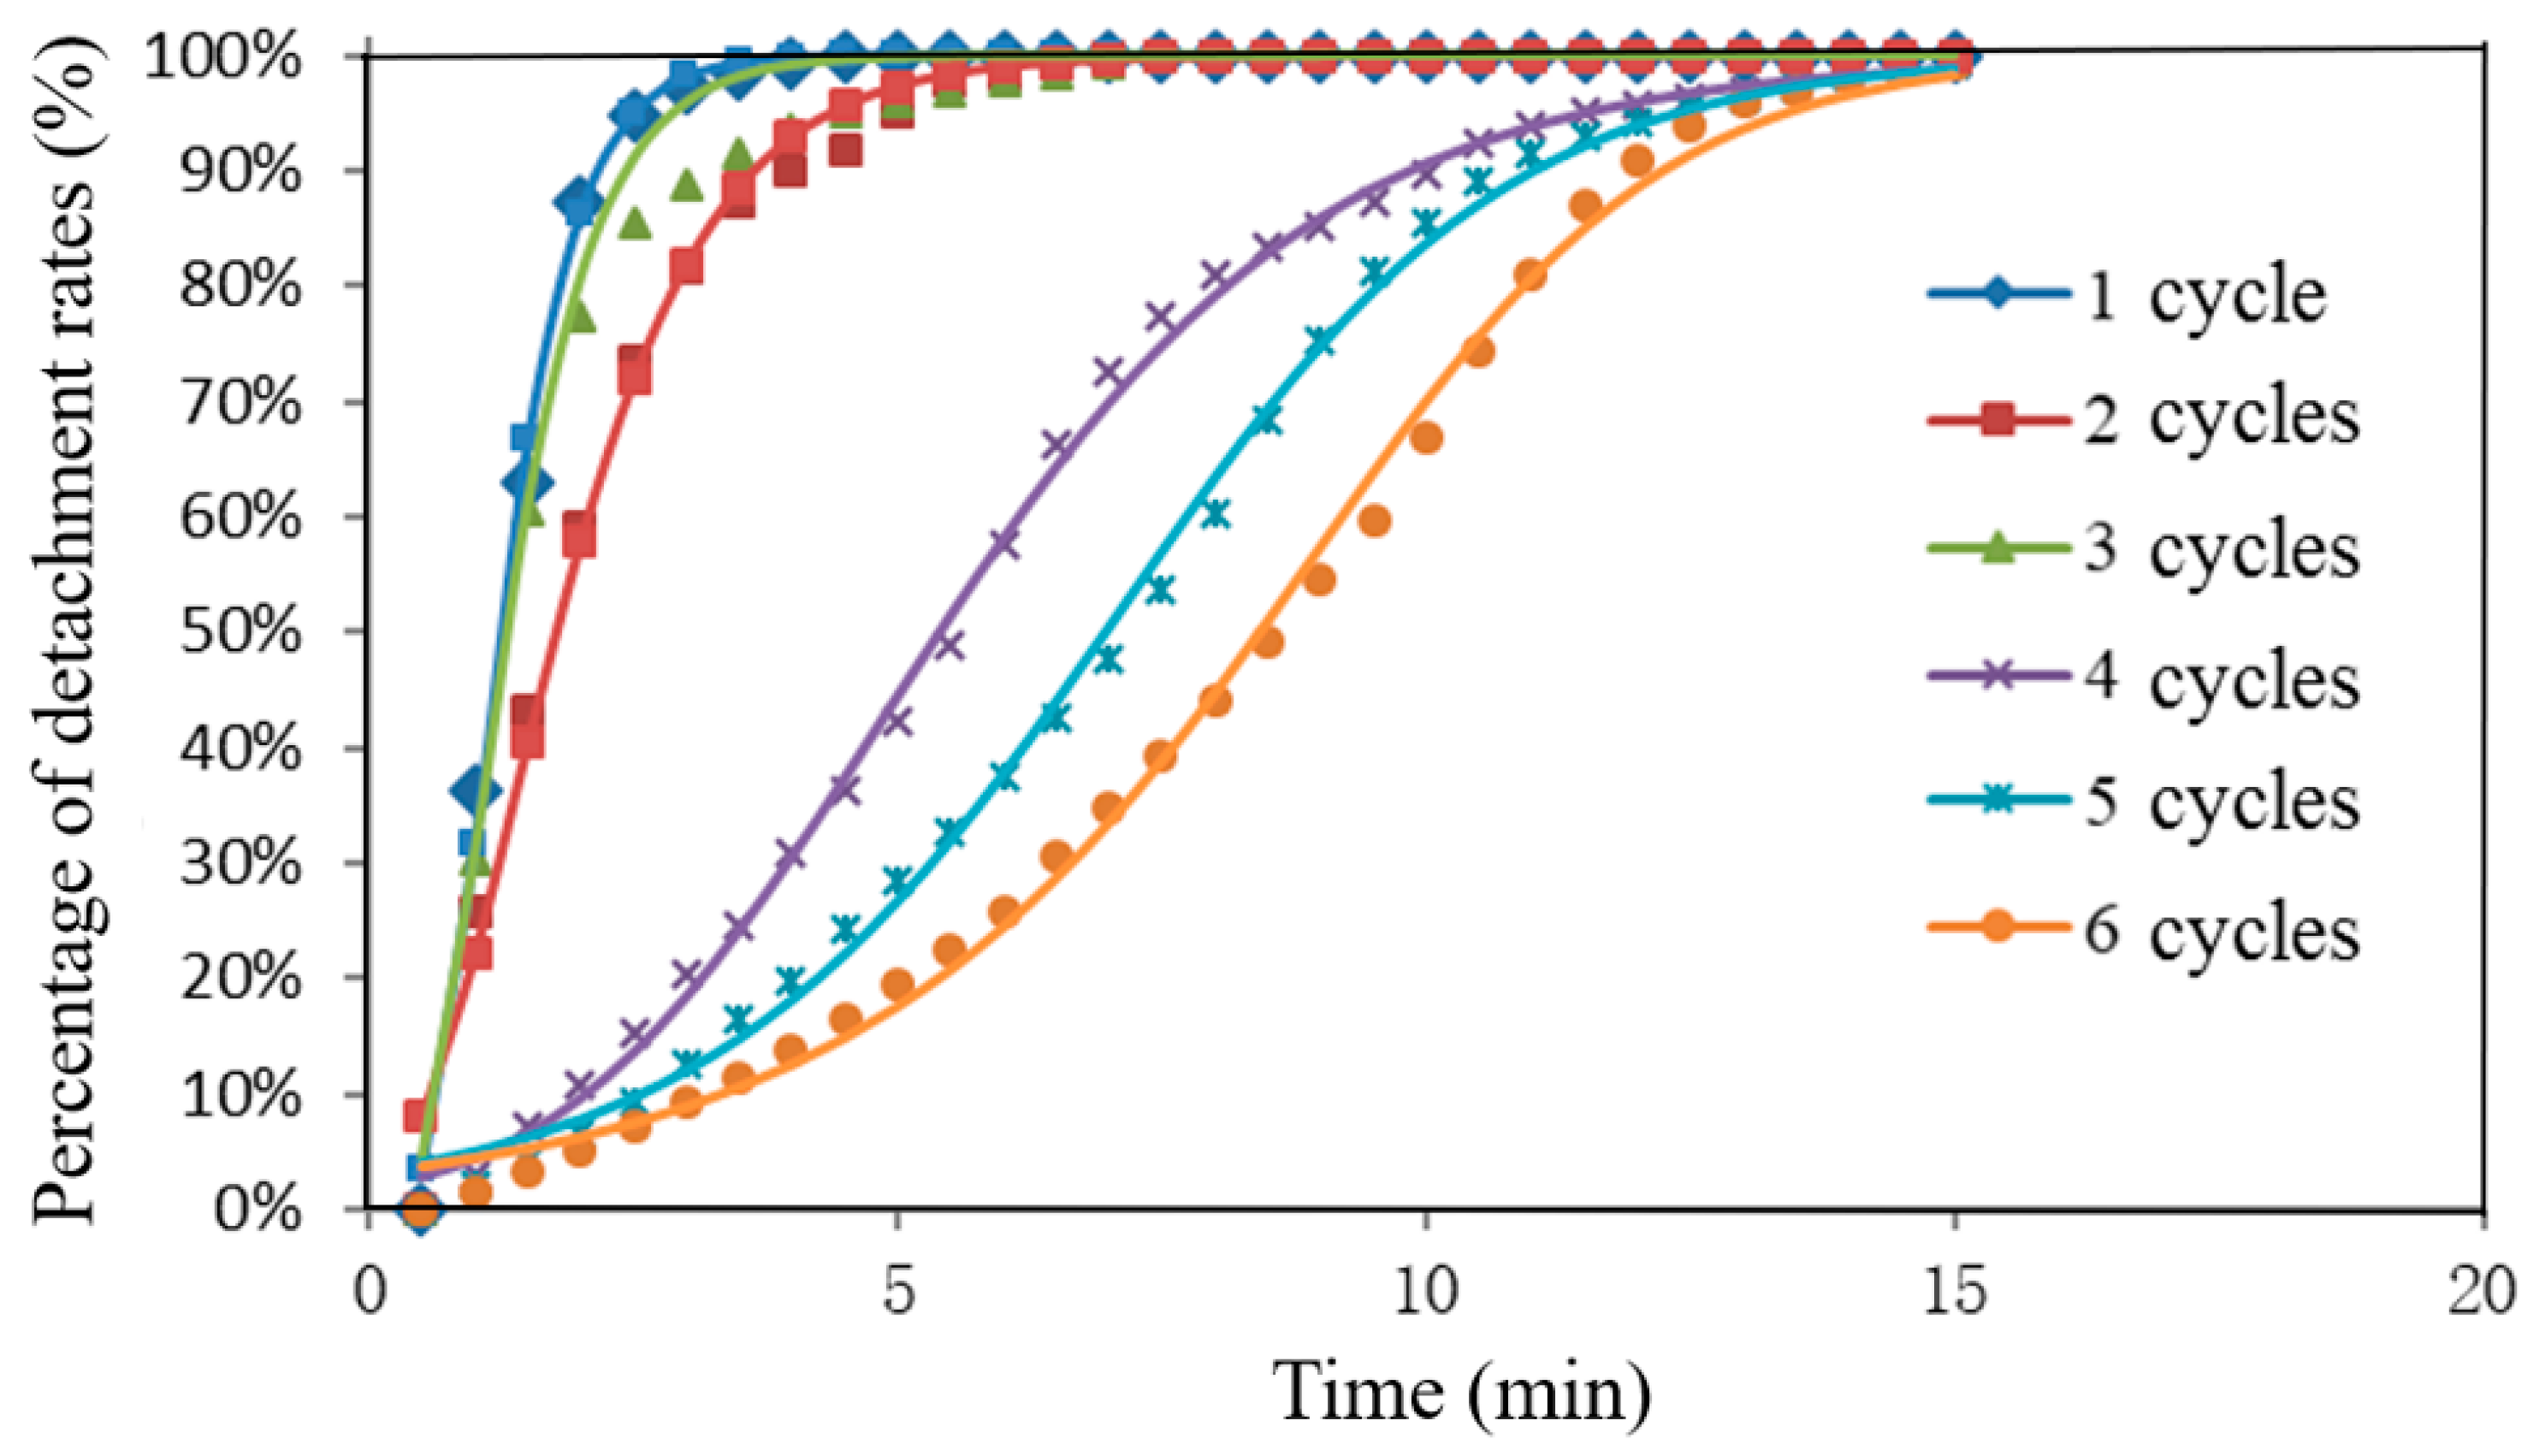
Figure 4 depicts the change in soil detachment lost over time to a runoff under the influence of wetting and drying. Each data point represents the mean of three replicates. Soils with two or fewer wetting and drying cycles exhibited a different soil detachment trend than soils with three or more wetting and drying cycles. For example, during the runoff experiment, soils with only one wetting dry cycle took only 4 min for it to reach the maximum 1 cm souring depth. Soils with two and three wetting and drying cycles took 6.5 and 7 min to reach the maximum 1 cm souring depth, respectively, while the soils subjected to four or more wetting and drying cycles did not reach the maximum 1 cm depth during the 15 min runoff experiment. In addition, approximately 127, 133 and 117 g of soil were detached for one, two, and three wetting cycles. When the number of wetting cycles was four or more, less than 108 g of soil was detached. These findings suggest that the erosivity of freshly tilled Loess Plateau soil decreases with increased wetting and drying.
Soil detachment rate is influenced by wetting and drying and time. For example, soils with only one wetting and drying cycle had the greater sediment loading losses, a detachment rate of 256 g m−2 s−1. Although sediment loading losses for the soil with two and three wetting and drying cycles were high at the 1 min time interval, the detachment rates for these soils were less than that observed for only one wetting and drying cycle. It is also important to note, however, that the temporal patterns of soil detachment for soil with greater than four wetting and drying cycles were different from those subjected to fewer than three wetting and drying cycles. For instance, for soils subjected to 4–6 wetting and drying cycles, the percent soil detachment was relatively low at the beginning of the runoff experiment and increased gradually until reaching a maximum and then decreased. On the other hand, soil detachment was maximum after runoff commenced (as observed at the 1 min time interval) and decreased rapidly thereafter.
Differences in soil detachment were most likely a result of increased soil reconsolidation, soil bulk density, and soil aggregation occurring with increasing wetting and drying cycles. The detachment rate as a function of wetting and drying decreased most after the first cycle. These results are consistent with the soil bulk density data observed in this study. Most of the loose particles from the disturbed soil used in this study settled into the soil mass following the wetting and drying cycle (denoted by increases in soil bulk density) increasing the soil’s resistance to detachment, thereby leading to a decrease in sediment loss. These findings are in accordance with others who have shown that erosion is increased after soil disturbance, as well as those who have also observed reductions in sediment loss following soil consolidation [
19,
31,
32].
3.3. Characteristics of Soil Detachment Process
The best empirical representation of the soil detachment data from this study can be described using the S-curve response. Soil detachment was modest at the beginning and then entered a period of rapidly increasing detachment until it reached a period of maximum loss. The S-curve response of this study is best described by fitting our data to one of the hyperbolastic growth models, such as the Logistic, Gompertz, Richards, Mitschelich or Bertalanffy theoretical growth equations. Of these, the Richards equation had the best fit. The Richards function was fitted to the detachment data using the Levenberg–Marquardt algorithm provided in the SPSS software package. The Richards equation gives physically sound values for the function parameters being evaluated. An illustration of the erosion process data being fitted to the Richards equation can be found in
Figure 5. In the present study, the model given by Equation (2) was fitted to the experimental data obtained from the soil detachment rates as affected by wetting and drying cycles observed during the laboratory runoff experiments. The curves obtained are illustrated in
Figure 5, with model fitting curves being depicted as a solid line. Model parameters from the Richards equation for
K (cumulative sediment loss value),
a (initial sediment loss value),
b (rate change), and
c (allometric parameter) and the residual are presented in
Table 1. These data were shown to be normally distributed. The fit of the modified Richards model to the wetting and drying cycles experimental data provided good performance, with an
R2 greater than 0.98.
The S-shaped growth curve can be generally described as having three phrases: the initial stage of growth (increases slowly); the intermediate stage of growth (accelerated or rapid increase where exponential growth occurs); and then the final phase of growth (negative acceleration occurs until reaching a zero growth rate). In our case, soil detachment was influenced by the overland flow of water in the flume apparatus. Detachment rates for soil subjected to 1–3 wetting and drying cycles increased exponentially first and then reached stabilization. For the detachment rates from soil subjected to 4–6 wetting and drying cycles in the first stage, sediment loss increased slowly (having some lag time). In the second phase, sediment loss began to occur more swiftly due to the loosening of weakly bound soil particles. In the final phase, after most loosened particles were lost to runoff, the detachment rate began to reduce.
As shown in the data in
Table 2, as the number of wetting and drying cycles increased, the time before soil detachment rates reached the exponential stage also increased. The data in
Table 2 further demonstrates that, as wetting and drying increased, the amount of sediment loss decreased, thus implying that the rate of soil detachment decreased and the soil’s ability to resist water erosion is enhanced with wetting and drying. These results show that the data obtained using the Richards growth equation is consistent with that observed from the runoff experiments using the experimental flume. Given that surface water runoff is a driving force of soil erosion and sediment transport, the data obtained from this study could be used to improve our understanding of how to minimize soil losses by better predicting the influence that soil wetting and drying have on soil detachment.

