1. Introduction
Horticultural products are exposed to mechanical load during postharvest handling and transportation; most studies in the field aim to prevent damage and preserve quality. Since fruits and vegetables have a typical viscoelastic behavior [
1], different modeling approaches are used in different important roles to explore the failure mechanism of crop materials. The results are usually based on the analysis of force–deformation graphs of the examined fruit samples, which are produced by testing machines that apply the required compressive load for the examination [
2,
3,
4]. The applied models are composed of elastic and viscous components; the simplest structure that can handle the creep and stress relaxation is a three-element body [
5]. The viscoelastic approach can describe the fruit material until complete failure occurs in the cellular system. When the mechanical force reaches the rupture point, the damage is irreversible [
6], ultimately resulting from the mentioned excessive impact loads due to excessive pressure on the surface [
7,
8,
9].
Because of the viscous elements, residual deformation is always emerging; after unloading, the deformation curve shows a hysteresis phenomenon.
From this characteristic, the dissipated energy can be determined. It recently was shown via a correlation analysis that the hysteresis parameters and viscoelastic properties are in a significant relationship, but not in the case of every investigated apple species. For example, Golden Delicious samples showed a higher correlation than Fuji and Red Delicious specimens [
10].
Impact damage and stress inside fruit tissue is often inspected with the commonly used finite element method (FEM), where the different fruit layers—each skin, cortex and core—can be investigated [
7,
11,
12]. Sometimes the compressive load itself is applied on precisely prepared samples that were cut from the fruit tissue. For instance, McLaughlin and Pitt [
13] and Celik [
14] used cylindrical specimens from inside apples and pears. Fenyvesi pointed out that the apple must be characterized as a structure (with skin, cortex, and core), and not as homogenous material [
15].
Besides the destructive modeling methods, the fruit behavior against repeated mechanical load is frequently observed with simulated vibration. Using non-destructive vibration tests, the stiffness factor or other mechanical parameters can be calculated from the frequency response of the crop [
16,
17]. The majority of researchers have performed truck transportation tests, in most cases using vibrating tables or shakers to simulate the transportation circumstances, where dangerous vibration frequencies and power spectral density (PSD) levels can be determined with accelerometers [
18,
19,
20,
21]. These parameters are very important for modeling studies, as well as for the fruit bin design. Fruit transportation papers have consistently demonstrated that the most dangerous frequencies can be located in the 5–10 Hz range [
18,
20]. However, in some cases, the peak PSD values are under 5 Hz [
19]. Different suspension systems of the trucks and the placing of the fruit bins also influence the highest acceleration values.
With the consideration of these frequency values, destructive analysis is essential for the exploration of the failure mechanism in fruits transported in piles after harvesting. In order to handle the variety of the outer mechanical circumstances, a custom-developed material testing device with different load setups and a control-loop system—based on viscoelastic equations—is presented in this paper.
2. Materials and Methods
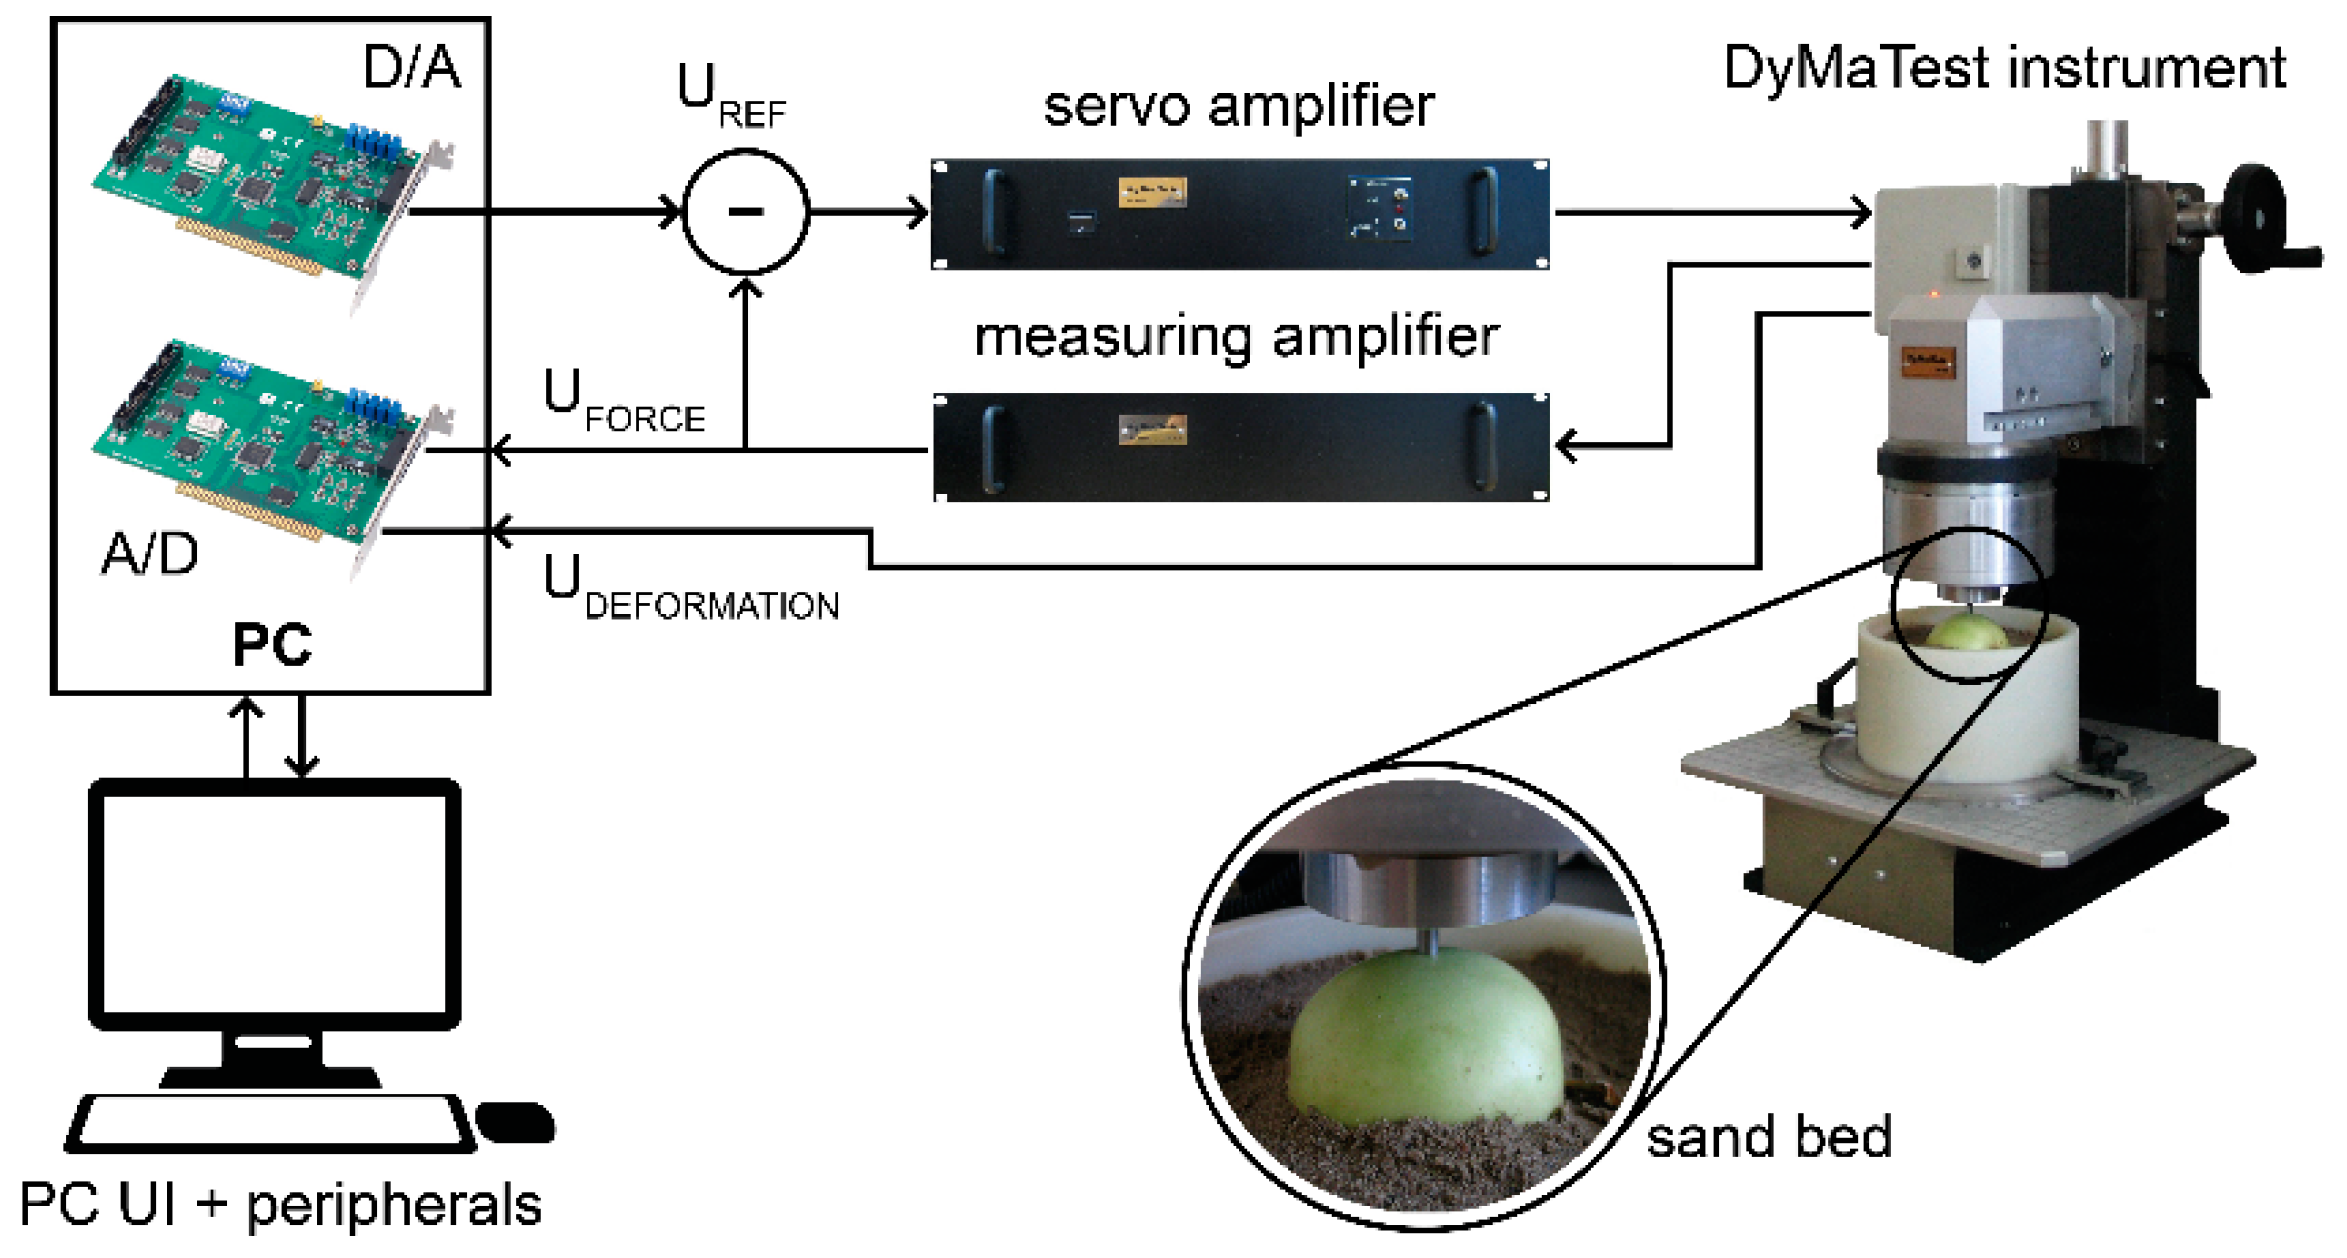
The measurements were performed with a custom-developed, computer-controlled, electronic compressive testing instrument called DyMaTest [
22]. With this device, the effects of static, dynamic, or cyclic loads on biological samples can be investigated. The sample is positioned in a sand bed, while the loading pin is responsible for applying the given load forces to the fruit surface. Besides the linear load forces, the DyMaTest instrument can produce cosinusoidal (Equation (1)), saw-tooth, and square signs in single or multiple sweep modes.
The force functions are generated by a servo system and can be set using PC software. The deformation (displacement of the measuring probe) is measured by a laser sensor, and the measurement results are collected and displayed by the computer. The measuring setup of the instrument is shown in
Figure 1.
The software-adjusted compressive load signal is produced with a PC D/A card (Uref) and, after the amplifying process, the analog electric signal is transformed into a dynamic effect by the electro-mechanical transducer. Using the uniquely designed special low-mass strain gauge force sensor and an OMRON ZX LT010 laser through-beam sensor with a ZX-LDA41-N amplifier unit, the force, deformation, and time data can be registered, and can be used for plotting the characteristics of the fruit. After the measuring card receives the measured data, they are converted to digital values.
The creeping response of the prepared sand is also inspected during controlled measurements with a solid ball bearing 32 mm in diameter. In addition, the sand is dried and filtered with a mesh layer-by-layer [
23], then it is compacted with a metal tamper 180 mm in diameter. The deformation graph did not show any creeping behavior in the measuring range of the photoelectric sensor.
For the frequency comparison, the cosinusoidal function was adjusted, which is defined with the following formula:
where F
m is the measured cosinusoidal load function and F
max is the amplitude of the force (N).
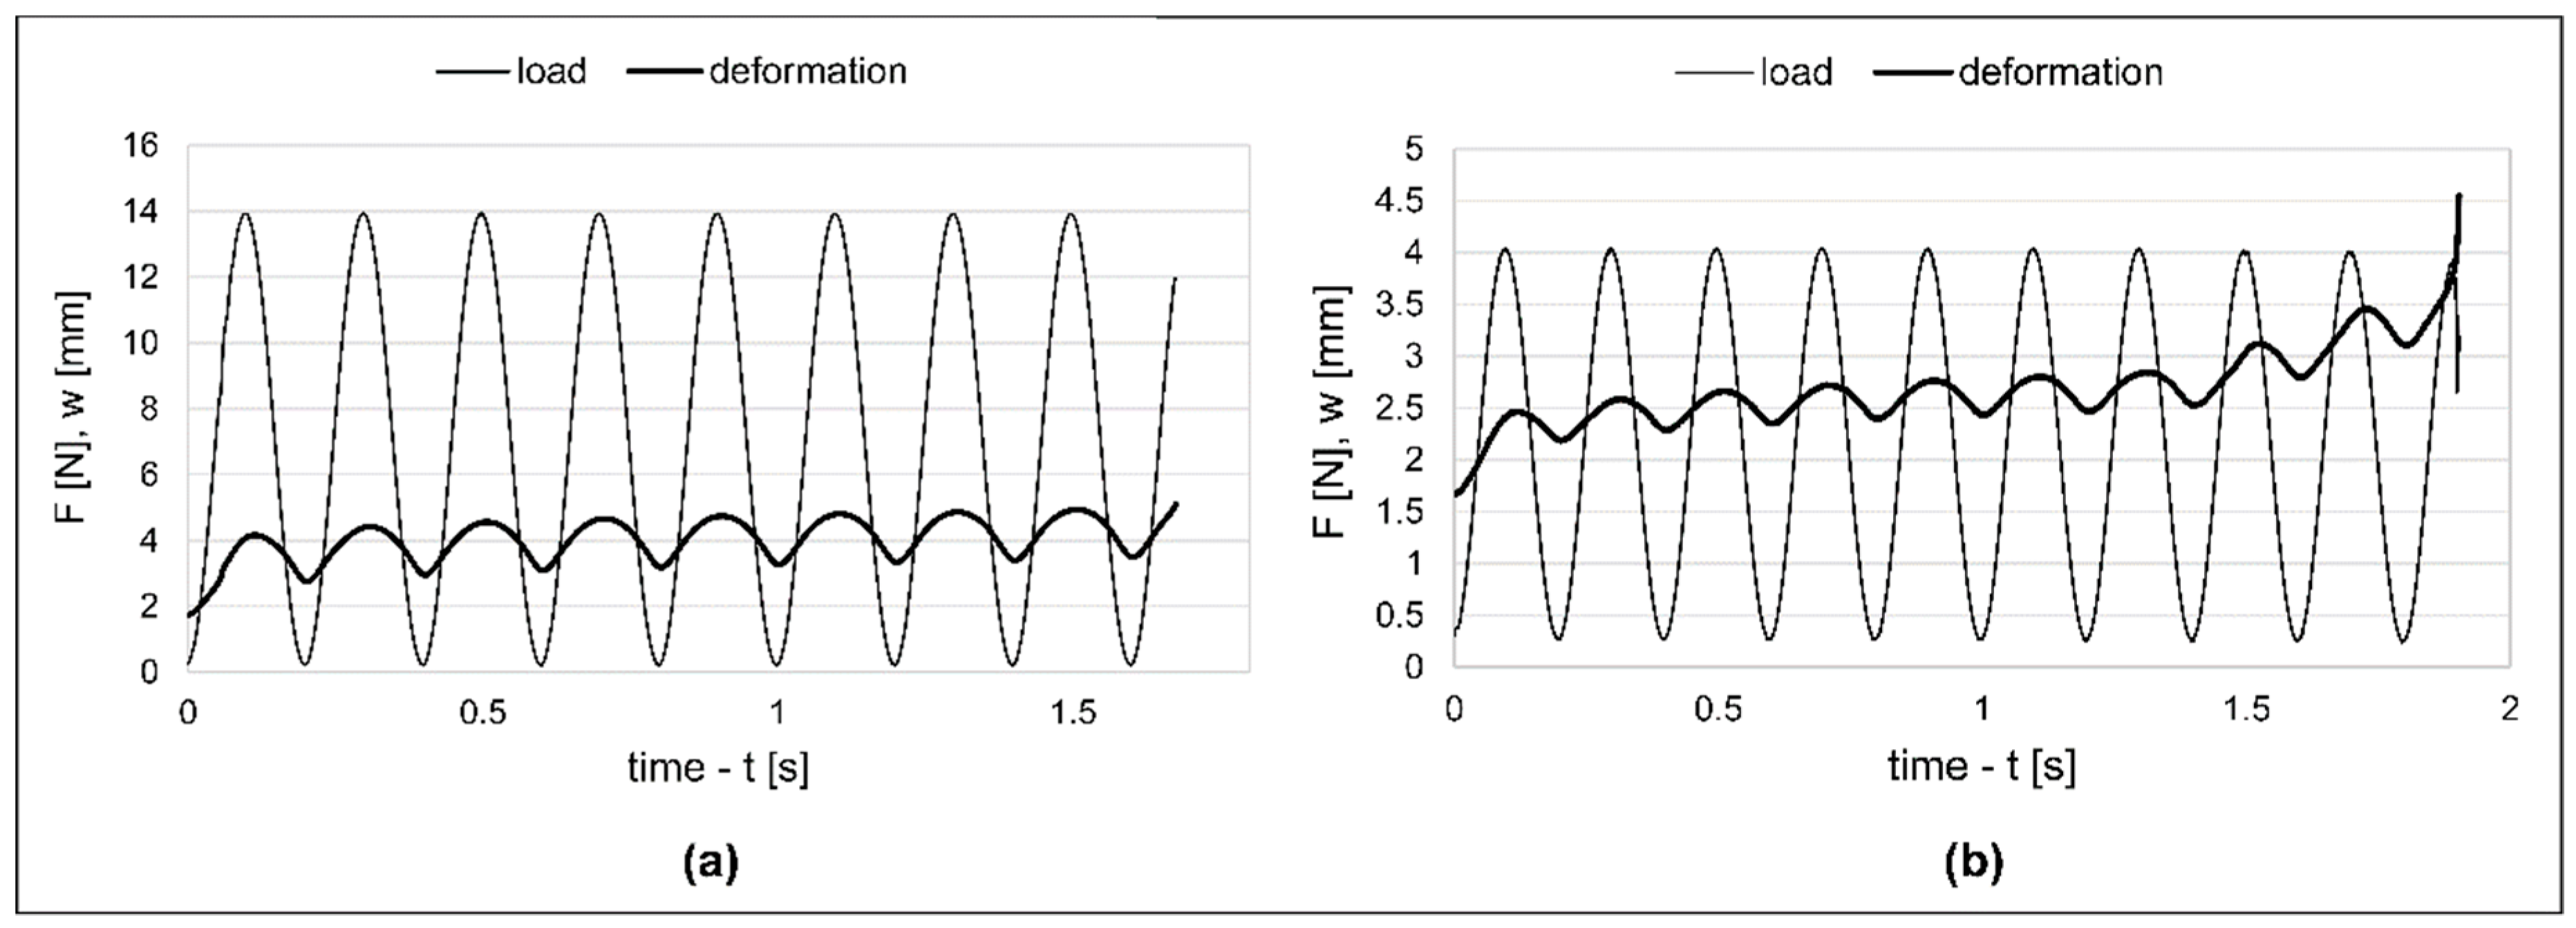
The deformation response of the fruit tissue is also periodic—a cyclic load with a constant amplitude causes non-constant deformation; its amplitude and mean values are time-dependent parameters. These graphs are represented in
Figure 2. The curves that envelope the maximum and minimum points of the deformation had a similar character to the creeping caused by a constant load; therefore, this phenomenon is called dynamic creeping [
15]. The creeping process ends at the rupture point, which can be defined with the time to failure, abbreviated as TTF [
24]. Until that point, the curve can be described as follows:
where w
m is the measured deformation function, w
max is the amplitude of the deformation (mm), j and k are the coefficients of the linear component of creeping (j denotes the slope and k is the y-intercept), and δ is the phase angle difference between force and deformation.
With the three-element Poynting–Thomson body, which is shown in
Figure 3, the creeping process can be characterized using the following formula:
where E
1 and E
2 are the elastic components (N mm
−1) and η is the viscous part of the model (Ns mm
−2).
With
and
the following form of the equation was used to construct a Simulink based control-loop system:
Besides the model output, the measured force and deformation data are also represented in the block diagram of the control system (
Figure 4). The periodic load (F
m) and its deformation response (w
m) are placed in 1-D lookup tables. Thus, the calculated deformation (w)—which is caused by the measured force input—and the actual deformation graph (w
m) can be compared.
With the system identification and a minimum search method, the three viscoelastic properties can be determined within the range of 0.967–0.998 for the coefficient of determination in relation to the compared deformation outputs. We evaluated the frequency dependence with analysis of variance (ANOVA).
The dominant and the most significant frequency range during transportation was applied to the cyclic load examinations; frequency values under 10 Hz were found to cause the most fruit damage, as the literature has reported [
18,
19,
20], so the selected range was given according to previous experience and the steps were divided for nearly identical intervals (2.5, 3.7, 5, 7.5, 10, and 11.6 Hz, respectively) set by practical options on the measuring device.
The samples were chosen from the same lot and cargo; the storage conditions were equivalent for all fruit specimens for both fruit types. The samples were stored in an ambient laboratory environment (~25 °C, with the relative humidity of ~60 RH%). The tests were performed within a week after harvest. The fruit samples parameters for apples were weight: ~160 g (±30 g), density: ~0.875 g cm−3 (±0.03 g cm−3). For pears they were weight ~210 g (±20 g), density: ~0.955 g cm−3 (±0.02 g cm−3). It is assumed that the apples and pears were in the same state of ripeness. The measurements were performed in a short period of time (less than 1 day), so degradation and further ripening could not occur during the investigations. For each of the six frequency setups, the tests were completed in numbers of 25 for both species (Golden Delicious apples and Packham pears).
Due to the different mechanical resistances of apples and pears, different magnitudes of load had to be applied. The differences originated from tissue parameters, ripeness, and storage conditions. For the Golden Delicious apples, forces under 14 N did not result in failure, but in the case of Packham pears this magnitude caused immediate disruption of the skin. Therefore, apple tests were performed with 14 N, but the pear test was completed with a 4 N magnitude of compressive load.
3. Results and Discussion
Table 1 shows the average viscoelastic parameters of the 25 samples in numerical form, which is elaborated on later this section.
It was found in the case of both specimens that the viscous parameters showed a much stronger frequency dependence than the elastic properties. While the E1 modulus had a slight fluctuation, E2—which was connected parallel with the viscous part—was more stable. As the creeping progressed, the residual deformation increased during each of the cycles, and this creep phenomenon led to fatigue failure. The growing tendency of this residual deformation was strongly connected to the viscous parameter; therefore, the E2 modulus has less of an impact on this process in the parallel part of the Poynting–Thomson body.
Figure 5 shows that the E
1 modulus was more significantly influenced by the applied frequency value in the case of the Packham pear samples. In the Golden Delicious apples, the elasticity changed slightly in higher frequencies, but in the Packham-related results, this change was more consistent and showed a significant growing tendency through the whole experimental range. According to Fenyvesi, apples loaded with higher speeds exhibit a more rigid behavior [
15]. This could be true for the repeated dynamic effects—in this case, the speed correlated to the frequency of load.
The tests performed in higher frequencies resulted in a decrease of elasticity, but the pear specimens have a more significant change, and a reverse tendency in the elastic response. In case of pears, the tissue is more softened in the environment of the rupture point. Some of our observation shows, that pears with more rigid structure are more susceptible to earlier failure time.
The frequency curve of the average viscous component (
Figure 6) in the case of the Golden Delicious samples was very similar to the frequency dependence of dynamic viscosity of Jonagold apples measured by Van Zeebroeck et al. [
25]. However, the pear texture showed a different characteristic in terms of elasticity. In frequencies above 7.5 Hz, the elasticity still showed an increasing tendency, but the viscous parameter also increased. After the biological yield and before the rupture point, the softened pear tissue bore both viscoelastic model qualities in a particular way. In this range, the softer skin and cortex is often capable of resisting more load cycles, despite the fact that we expected higher frequencies to result in shorter times to the damage point. Higher frequency values were not necessarily the most significant parameters from the aspect of usual damage.
Figure 5 and
Figure 6 indicate the standard deviation error bars of each measurement setup. The Golden Delicious and Packham error scales both showed the same tendency between the viscoelastic results; compared to the average values, the highest deviation was observed in the case of the η parameters, while the lowest were observed in the case of the E
1 modulus. The Packham specimens showed more significant deviation ranges than the Golden Delicious samples. Since 2.5 Hz resulted many immediate pear failures in the first few cycles, the most extended error scale appeared for this setup. The average Golden Delicious values were: E
1 = 10.386 ± 1.309 N mm
−1, E
2 = 2.117 ± 0.28 N mm
−1, η = 1.08 ± 0.296 Ns mm
−2. The results in the case of Packham samples were: E
1 = 8.531 ± 2.12 N mm
−1, E2 = 0.579 ± 0.154 N mm
−1, η = 0.54 ± 0.278 Ns mm
−2. The edge values were maintained at the same frequency trend as the mean viscoelastic parameters.
For the homogeneity of variance, the Levene test showed significance only for the η modulus of the Golden Delicious specimens.
Figure 5 does not indicate any visible tendency in the case of Golden Delicious apples, and ANOVA results confirmed that the elastic parameters (E
1 and E
2) were independent from the applied frequencies. However, the E1 modulus of pears showed significance, as well as the η value in both pome specimens.
The frequency graphs and the statistical results clearly demonstrated that the elastic quality influenced the frequency dependence only in the case of Packham pears during the failure tests. This behavior is important in the matter of damage resistance, when these fruits are exposed to a more frequent compressive load.


