Article

Influence of Storage Moisture and Temperature On Lignocellulosic Degradation

Agricultural and Biosystems Engineering Department, Iowa State University, Ames, IA 50011, USA
*
Author to whom correspondence should be addressed.
AgriEngineering 2019, 1(3), 332-342; https://doi.org/10.3390/agriengineering1030025
Submission received: 28 April 2019 / Revised: 23 June 2019 / Accepted: 12 July 2019 / Published: 15 July 2019

Abstract

:
Feedstock degradation is a major source of financial risk for cellulosic biorefineries. To assess the impact of the feedstock loss and quality during storage, this study explored interactions of moisture content and temperature on the degradation of biomass. Specifically, this study evaluated the dry matter loss and compositional change of corn stover during storage conditions common at industrial biomass storage facilities. This lab-scale study allowed for increased measurement precision associated with quantifying how biomass degradation changes the quality of stored biomass. Results of this work define stable biomass storage moisture content of less than 20% in which there is low risk for degradation over time. At moisture levels above 20%, biomass degradation will be prevalent with hemicellulose being the most degraded fraction of the feedstock. Additionally, results demonstrate that temperature has a minimal impact on biomass degradation in non-frozen storage conditions.

1. Introduction

The dynamics of densified biomass storage degradation, especially carbohydrate structure, are not well known. In freshly harvested lignocellulosic material, approximately 70% of the material is biodegradable [1]. Due to its structure, the remaining 30% composed of lignin, ash, and other components will not be readily consumed by environmental microbes. Microbial degradation that occurs is the breakdown and consumption of the sugar-based components of dry matter: cellulose and hemicellulose, which are the same components currently sought after for bioprocessing of renewable products [1].
Past studies have addressed storage losses by quantifying dry matter loss (DML) associated with protected, baled corn stover [2]. Results from dry matter loss studies on unprotected bales are highly variable, partially due to the difficulty in assessing material loss in bales that experience absorbance of moisture. Microorganisms require minimum thresholds of moisture and temperature to maintain and optimize metabolism; levels of these factors affect the rate of growth and substrate utilization [3]. The objective of this research is to identify dynamic trends in corn stover degradation and quantify the effects that moisture and temperature have on these trends in terms of dry matter loss and carbohydrate composition. This is accomplished by:
  • Preparing densified corn stover samples to degrade in moisture- and temperature-controlled environments.
  • Evaluating the dry matter and carbohydrate structure changes in each experimental unit.

2. Materials and Methods

2.1. Design of Experiment

The treatment factors for this controlled corn stover degradation experiment consisted of varying moisture contents, temperatures, and storage durations. Both temperature levels and material moisture content levels were chosen to represent values typically experienced in production field edge storage biomass stacks or those critical to microbial activity. Stover moisture levels of 0%, 10%, 15%, 20%, 30%, and 60% wet basis were selected. The levels of 15%, 20%, 30%, and 60% were selected to reflect final bale moistures common in corn stover harvest operations in the Midwest United States [4]. Moistures of 0% and 10% were included to evaluate moistures that are generally thought to be low enough to prevent microbial degradation [5]. Temperatures of −20 °C (−4 °F), 23 °C (73 °F), 45 °C (113 °F), and 60 °C (140 °F) were chosen based on bale heating curves common in corn stover storage and those critical ranges for bacterial growth. A −20 °C (−4 °F) cooler was used to simulate frozen material during the winter months. A temperature of 23 °C (73 °F) represents the lower temperature of mesophilic bacteria activity and simulates an average Iowa summer [3]. Temperatures of 45 °C (113 °F) and 60 °C (140 °F) are common temperatures seen in past research focused on the heating of high-moisture corn stover bales [6]. Experimental units were allowed to degrade for set durations. Most combinations of temperature and moisture content degraded for durations of 9, 18, and 27 days.
A full factorial experiment including five replications requires 360 experimental units. An initial test was implemented: testing moistures of 0% and 10% degrading at 60 °C (140 °F) for a storage duration of 27 days. Showing statistically no dry matter loss at the temperature and duration theoretically most at risk for degradation among the factors, it was concluded to be unnecessary to test those moistures at the remaining temperature and duration levels. The total experiment unit population was reduced to 250 (Table 1).
In addition to the experimental design previously described, after evaluating results from the 27-day durations, two moisture/temperature combinations were selected for a continuation test. Moistures of 30 and 60% were set up to degrade at 45 °C (113 °F) for a 54-day storage duration.

2.1.1. Sample Preparation

A single bale of non-degraded corn stover from Story County, Iowa, was sampled to provide material for this experiment. This provided material of the same partial size as shredded stover ahead of baling. To simulate dense, baled corn stover, 260 g (0.57 lbs) of dry stover was compacted into a 8 cm (3 in) diameter, 30 cm (12 in) long, clear tube with a hydraulic cylinder plunger (Figure 1). This reached an average dry density of 184 g/cm3 (11.5 lb/ft3), similar to the infield bale density [7]. A predetermined volume of water was added during the compaction process to reach specified moisture levels. After densification, tubes were capped and stored in a cooler at 5 °C (41 °F) to limit degradation until the material preparation process was finished for each round of tests (less than two days). As experimental units were positioned to start the test, holes were drilled into the capped ends to allow O2 and CO2 exchange to occur.

2.1.2. Controlled Environment Chambers Set Up

Thermo Scientific tabletop muffle furnaces provided a controlled environment for the experimental unit corn stover tubes to degrade. These furnaces are temperature controlled. To maintain moisture content within the experimental units, the relative humidity within the furnaces was brought up to and kept between 75% and 95% using a two-pan watering system (Figure 2). Water would naturally transfer through a tube filled with cotton cloth into the chamber through a 3 cm (1 in) hole and into a second pan. The inside pan was lined with a towel to increase surface area. Before the experiment was started, furnaces were run to reach the desired temperature and relative humidity. HOBO U23 Pro v2 Temperature/Relative Humidity Data Loggers were used to monitor the relative humidity (RH) until it reached a steady state humidity from 75% to 95%. The top pan was periodically refilled to maintain this environment. Depending on the treatment temperature, the top pan was refilled every three to four days once at equilibrium. Experimental units were also covered with a burlap sack to act as another means to hold in moisture. The environmental chambers themselves allowed limited air exchange through two 3 cm (1 in) holes filled with steel wool, providing oxygen and carbon dioxide flow throughout the environmental chamber, but limiting heat fluctuation. Each chamber housed five packed units of corn stover.

2.2. Assessment Parameters

2.2.1. Moisture Content

Experimental units were prepared to specific moisture contents with predetermined masses of dry stover and water. Final moisture contents were analyzed for whole experimental units post degradation using the ANSI/ASAE S358.3 standard for moisture measurements of forage material, modified slightly for corn stover. First, an initial wet weight was recorded and the sample was dried in a ventilated oven at 105 °C (221 °F) for 24 h. The resulting wet and dry weight of the sample was used to calculate the moisture content based on Equation (1).
M o i s t u r e   C o n t e n t w e t   b a s i s   ( % ) = ( W e t   w e i g h t - D r y   w e i g h t ) W e t   w e i g h t * 100  

2.2.2. Mass and Volume

A scale reading to the nearest 0.01 g was used to record all weights. During preparation, weights of the following were recorded separately for each experimental unit: empty clear tube (T), end caps (L1, L2), initial dry stover (Si), and initial water (Wi). The initial mass of each completed unit was also recorded (Ci). All tubes were 8 cm (3.0 in) in diameter and 30 cm (12 in) long, giving an initial and final volume (V) of 1400 cm3 (0.05 ft3).
At test completion, each experimental unit was weighed ahead of drying (Cf). The final mass of water (Wf) was determined for each unit using Equation (1).

2.2.3. Dry Matter Loss

The initial dry matter target for each experimental unit was estimated at 260 g (0.57 lbs), but the actual dry matter weight for each unique unit was determined using Equation (2). At the completion of the storage duration, the final moisture content, masses of the unit, tube, end caps, and final water were used to calculate the final dry matter (Equation (3)). Dry matter loss was calculated on a percent mass basis (Equation (4)).
D r y   M a t t e r i   ( g ) = ( C i - T - L 1 - L 2 - W i )
D r y   M a t t e r f   ( g ) =   ( C f - T - L 1 - L 2 - W f )
D r y   M a t t e r   L o s s   ( % ) = D r y   M a t t e r i - D r y   M a t t e r f D r y   M a t t e r i × 100

2.2.4. Density

Initial and final density were recorded on a dry mass basis. The mass of dry matter and set sample volume of 1400 cm3 (0.05 ft3) were used in Equation (5) to calculate both initial and final experimental unit densities.
S a m p l e   D e n s i t y   ( g c m 3 ) = S a m p l e   D r y   M a t t e r   ( g ) 1390   c m 3

2.2.5. Structural Carbohydrate Analysis

Wet chemistry typically used for forage quality analysis was performed by Midwest Laboratories, Inc. to evaluate the neutral detergent fiber (NDF) [8], acid detergent fiber (ADF) [9], and acid detergent (AD) lignin [10] composition of a subsample from each experimental unit. These residue test results were used to calculate the composition of structural carbohydrate components of hemicellulose, cellulose, and lignin. All material in this experiment was from a single bale. Twenty subsamples of the initial material were analyzed for NDF, ADF, and AD lignin to estimate the average initial carbohydrate concentration. Results from the forage quality tests prompted a detailed look at the influence of ash content on the methods for the NDF, ADF, and AD Lignin tests. A subset of experimental units were evaluated for total ash content and detergent insoluble ash content.

2.3. Statistical Analysis

Minitab 17 Statistical Software was used to interpret the results in this chapter. The Analysis of Variance (ANOVA) function was used to determine if means differed among treatment factors such as temperature, moisture, and storage duration. The null hypothesis tested: the mean values do not differ between treatments. At α value of 0.05 for a confidence interval of 95%, if a P-value less than 0.05 is obtained, there is enough evidence to reject the null hypothesis, indicating that at least one mean is statistically different. To further determine which treatments differed from one another, a Tukey’s test was performed. In the Tukey grouping, means that do not share a letter are significantly different. All ANOVA’s with over 2 levels were followed by a Tukey’s test and the Tukey’s test results are displayed in this writing.

3. Results and Discussion

3.1. Impact of Moisture on Dry Matter Loss

Excluding storage duration, moisture content was the greatest driver in dry matter loss in this experiment (Table 2). At a given sample moisture content and storage duration, there were minimal differences in dry matter loss for all warm storage temperatures. Temperatures of 23 °C, 45 °C, and 60 °C reported statistically similar dry matter losses with a general trend in increasing dry matter loss as the storage duration and initial moisture content increased.
Data from the three temperature levels above freezing: 23 °C (73 °F), 45 °C (113 °F), and 60 °C (140 °F), were aggregated to analyze the difference in average dry matter loss for the different moisture content levels (Table 3). Experimental units with starting moisture contents of 0%, 10%, 15% and 20% showed little to no dry matter loss within 27 days of storage, and those treatments ended with the originally scheduled longest storage duration: 27 days (Figure 3). The experimental units with 30% and 60% moisture content, after 27 days, measured statistically higher DML than the other four moisture levels. Although statistically different from the lower moistures, the loss was small relative to the amount of dry matter remaining. The tests for these two levels of moisture content were extended to a 54-day storage duration to better understand the trend in loss measured in degrading experimental units. The two combinations continued to show loss throughout the additional storage duration (Figure 3).
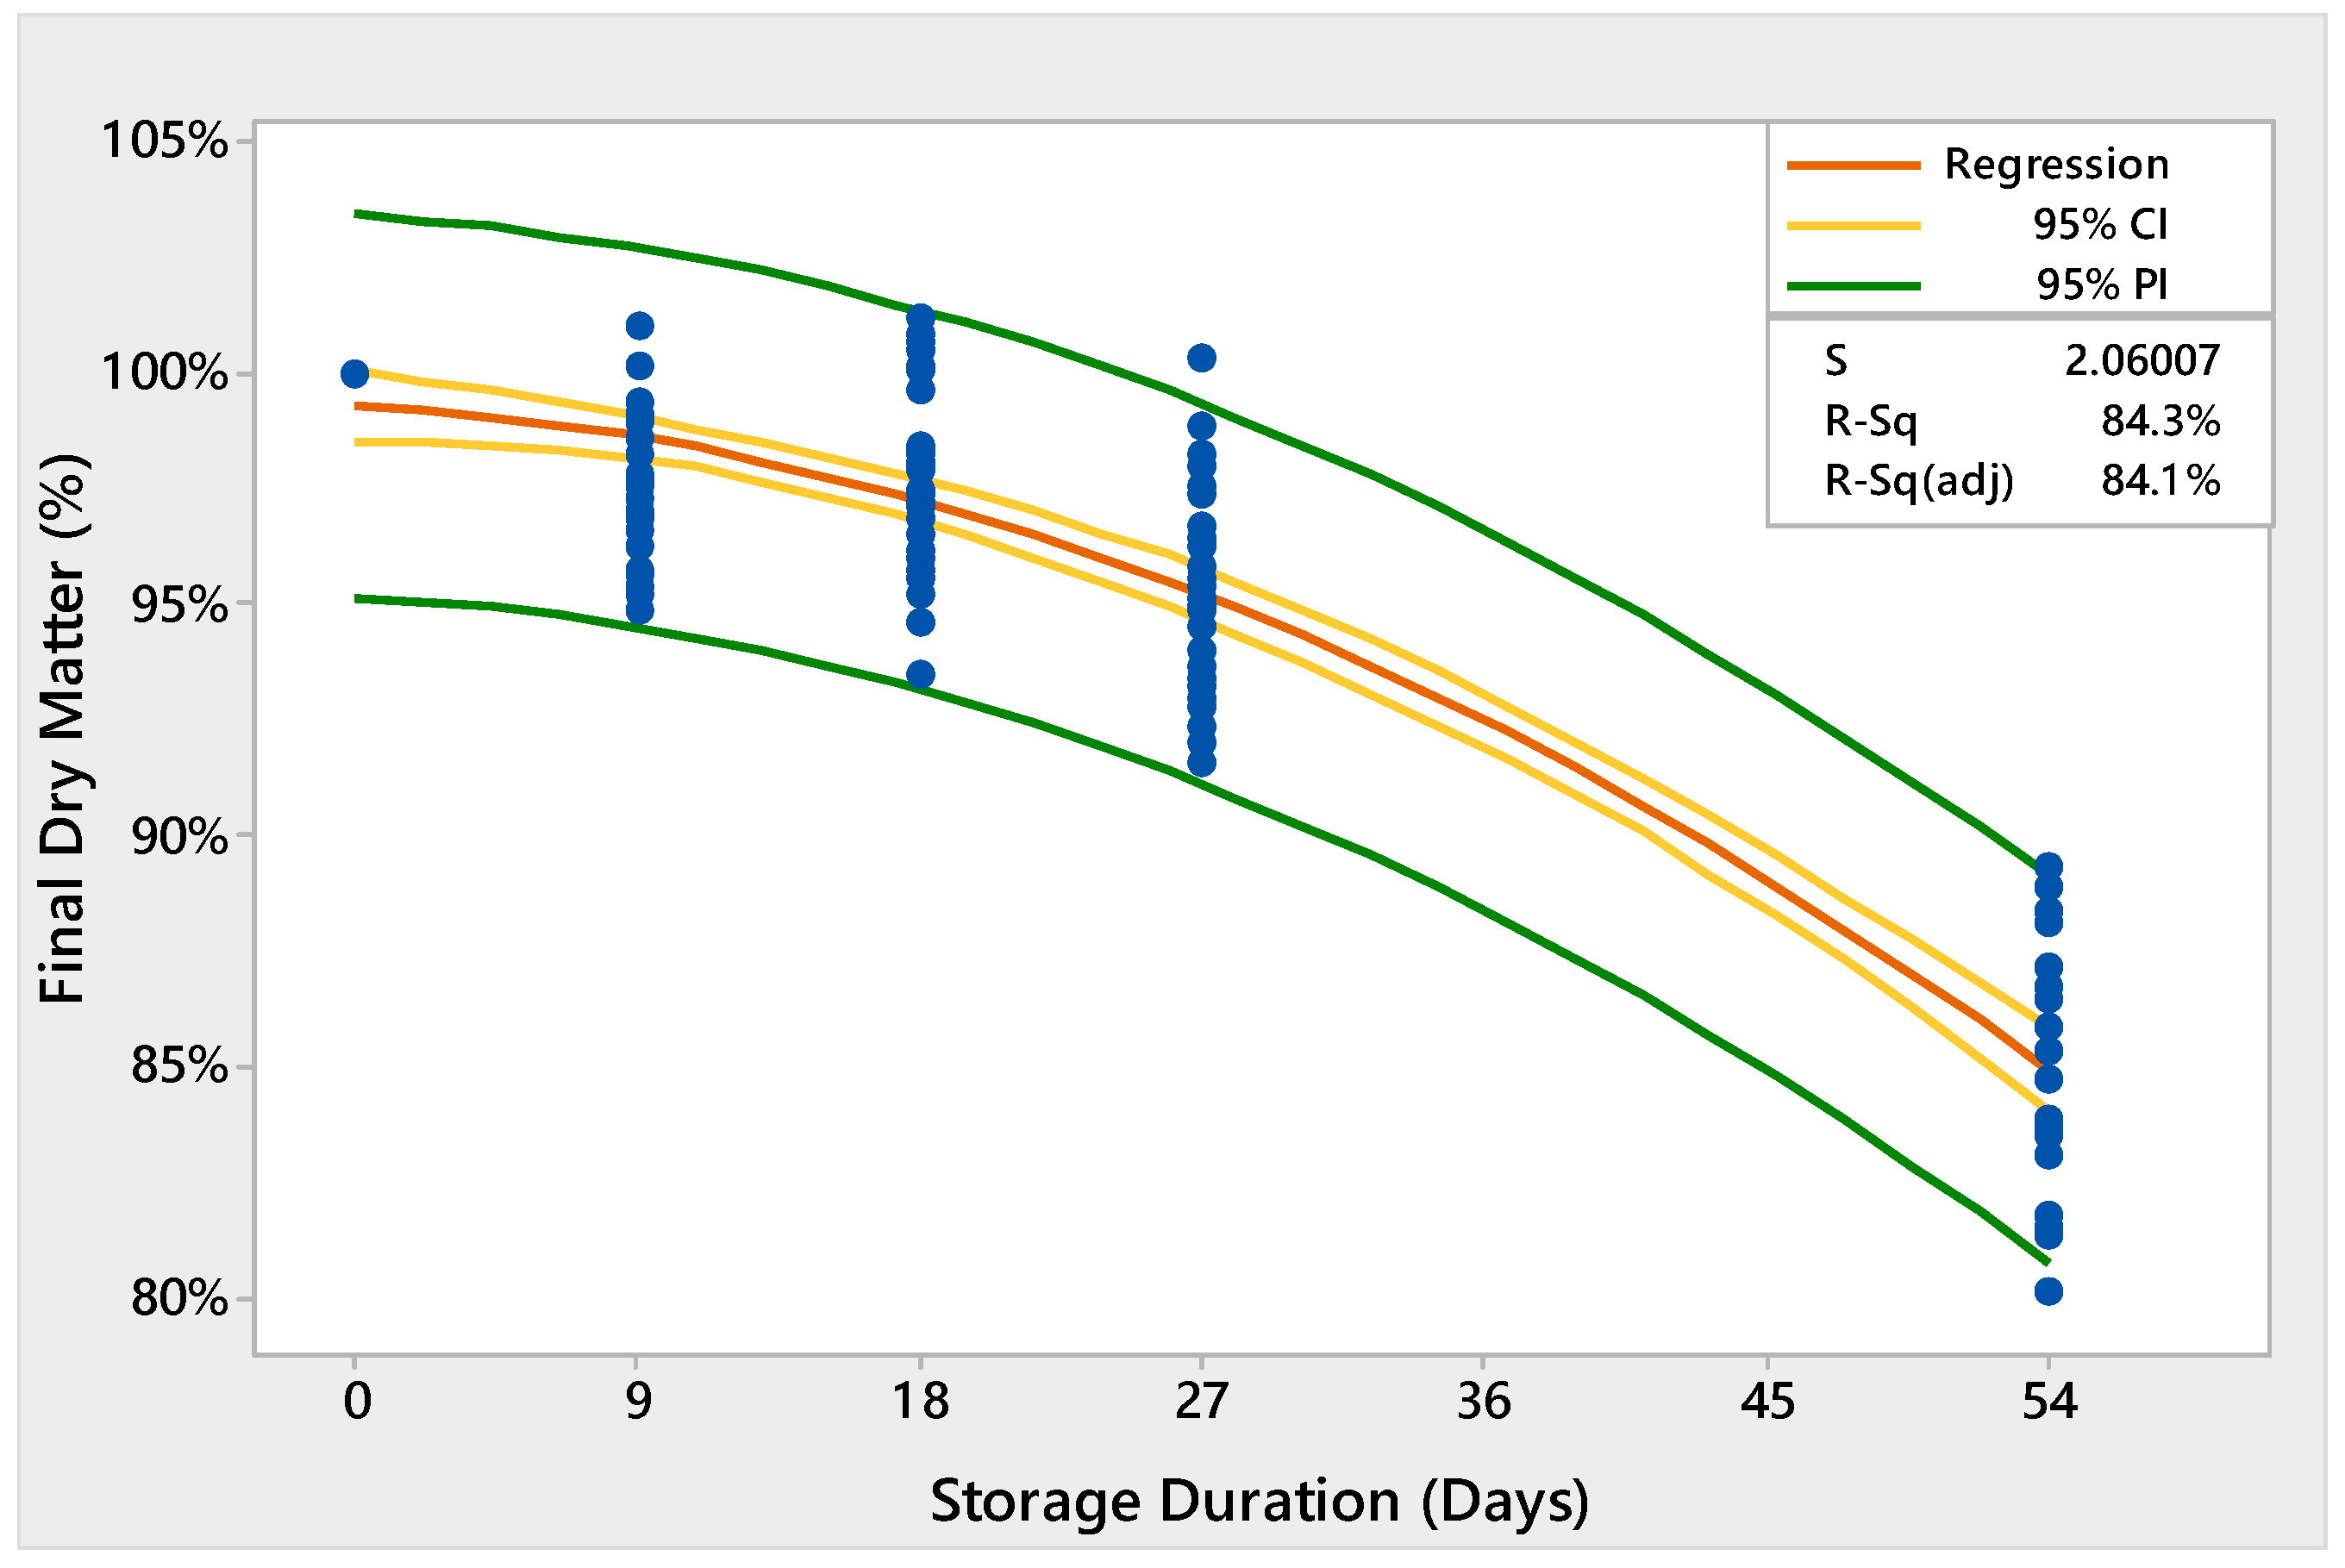
The losses from treatments in which degradation was observed (moisture contents of 30% and 60% at temperatures of 23, 45 and 60°C) did not follow a linear pattern. These moisture treatments, having nearly identical regression lines, were aggregated into a single category. There is a negative correlation between dry matter and time in this data set. The regression fits a quadratic model with an R2 value of 84.3% (Figure 4). The resulting regression equation is: % Dry Matter = 99.28 − 0.03402(x) − 0.004279(x)2 where x refers to days of storage. There were experimental units measuring over 100% dry matter; this is most likely due to measurement error during sample preparation, final dry matter analysis, or a combination of both.
It is impossible for degradation to continue with this model indefinitely. If extrapolated beyond 54 days with the current model, the remaining dry matter reaches zero and becomes negative in 126 days, approximately 4 months. The initial phase of dry matter loss is most critical for supply chain management due to its high cost and feedstock risk associated with degraded material quality. Realistically, dry matter cannot take on a negative value, and if it were to reach zero that would indicate that the remaining experimental unit is entirely water; all components of cellulose, hemicellulose, lignin, and ash have been degraded, or the unit is empty. The early stages of degradation mimic a quadratic model, but to forecast longer storage durations, the model should contain a minimum dry matter restriction. Under the notion of selective degradation, the combined initial concentrations of lignin and ash would be a logical minimum dry matter estimation.
In theory, the consumption of dry matter is most similar to substrate utilization in a microbial growth model. The concept of decomposing microorganisms consuming dry matter in biomass storage could utilize many of the same dependent rate equations (Table 4). Within this system, microorganisms are growing, enzymes are produced, carbohydrate components of lignocellulose are broken into simple sugar monomers, monomers are consumed by microorganisms, and carbon dioxide is produced. An additional rate equation could be created for the substrate level of dry matter.
Do note that each rate equation becomes extremely complex for degradation of field-stored biomass. In the case of corn stover, substrate uniformity cannot be assumed. Dry matter consists of multiple components, composed of differing monomer structures, some more biodegradable than others. There are relationships among the components that influence the rate of dry matter loss. To accurately model substrate loss it would require at least four individual rate equations. Secondly, the non-homogenous structure of corn stover causes variability within the initial substrate. Finally, material is exposed to various moisture and temperature conditions, and is susceptible to numerous microorganism communities. Unable to be controlled or assumed, these growth influencers, along with substrate concentration would need to be closely monitored to understand the growth rate at any given time. Given the results from this test and these various features of biomass degradation, the resulting kinetics could follow models such as a Monod, logistic, or logarithmic to describe the biodegradation [11]. In these types of models, substrate utilization starts slow, increases significantly, and then slows down, reaching a minimum value [11].

3.2. Effect of Temperature on DML

Decomposing microorganisms require a minimum temperature to maintain metabolic rates. If biomass is allowed to freeze, the material will not experience significant dry matter loss. There was no statistical difference measured in the average final dry matter for all moistures that were frozen for 9, 18, or 27 days (Table 5).
Frozen material aggregated together and averaged 101% final dry matter (Table 5). Realistically, dry matter cannot increase. This is most likely due to condensation/frost build up on the outside of containers as frozen experimental units hit humid air while taking a final sample weight. After the final weight was measured, units were allowed to thaw in a 5 °C (41 °F) cooler where outside condensation could evaporate. Once thawed, material was taken out of the tube container and whole container, lids, and material were put into a pan to measure the wet weight, then dried and measured for dry weight. The final weight of the unit was based off the slightly higher (due to condensation) frozen measurement, but the MC% was based off the thawed wet and dry weights. This could show a slight increase in dry matter for frozen treatments.
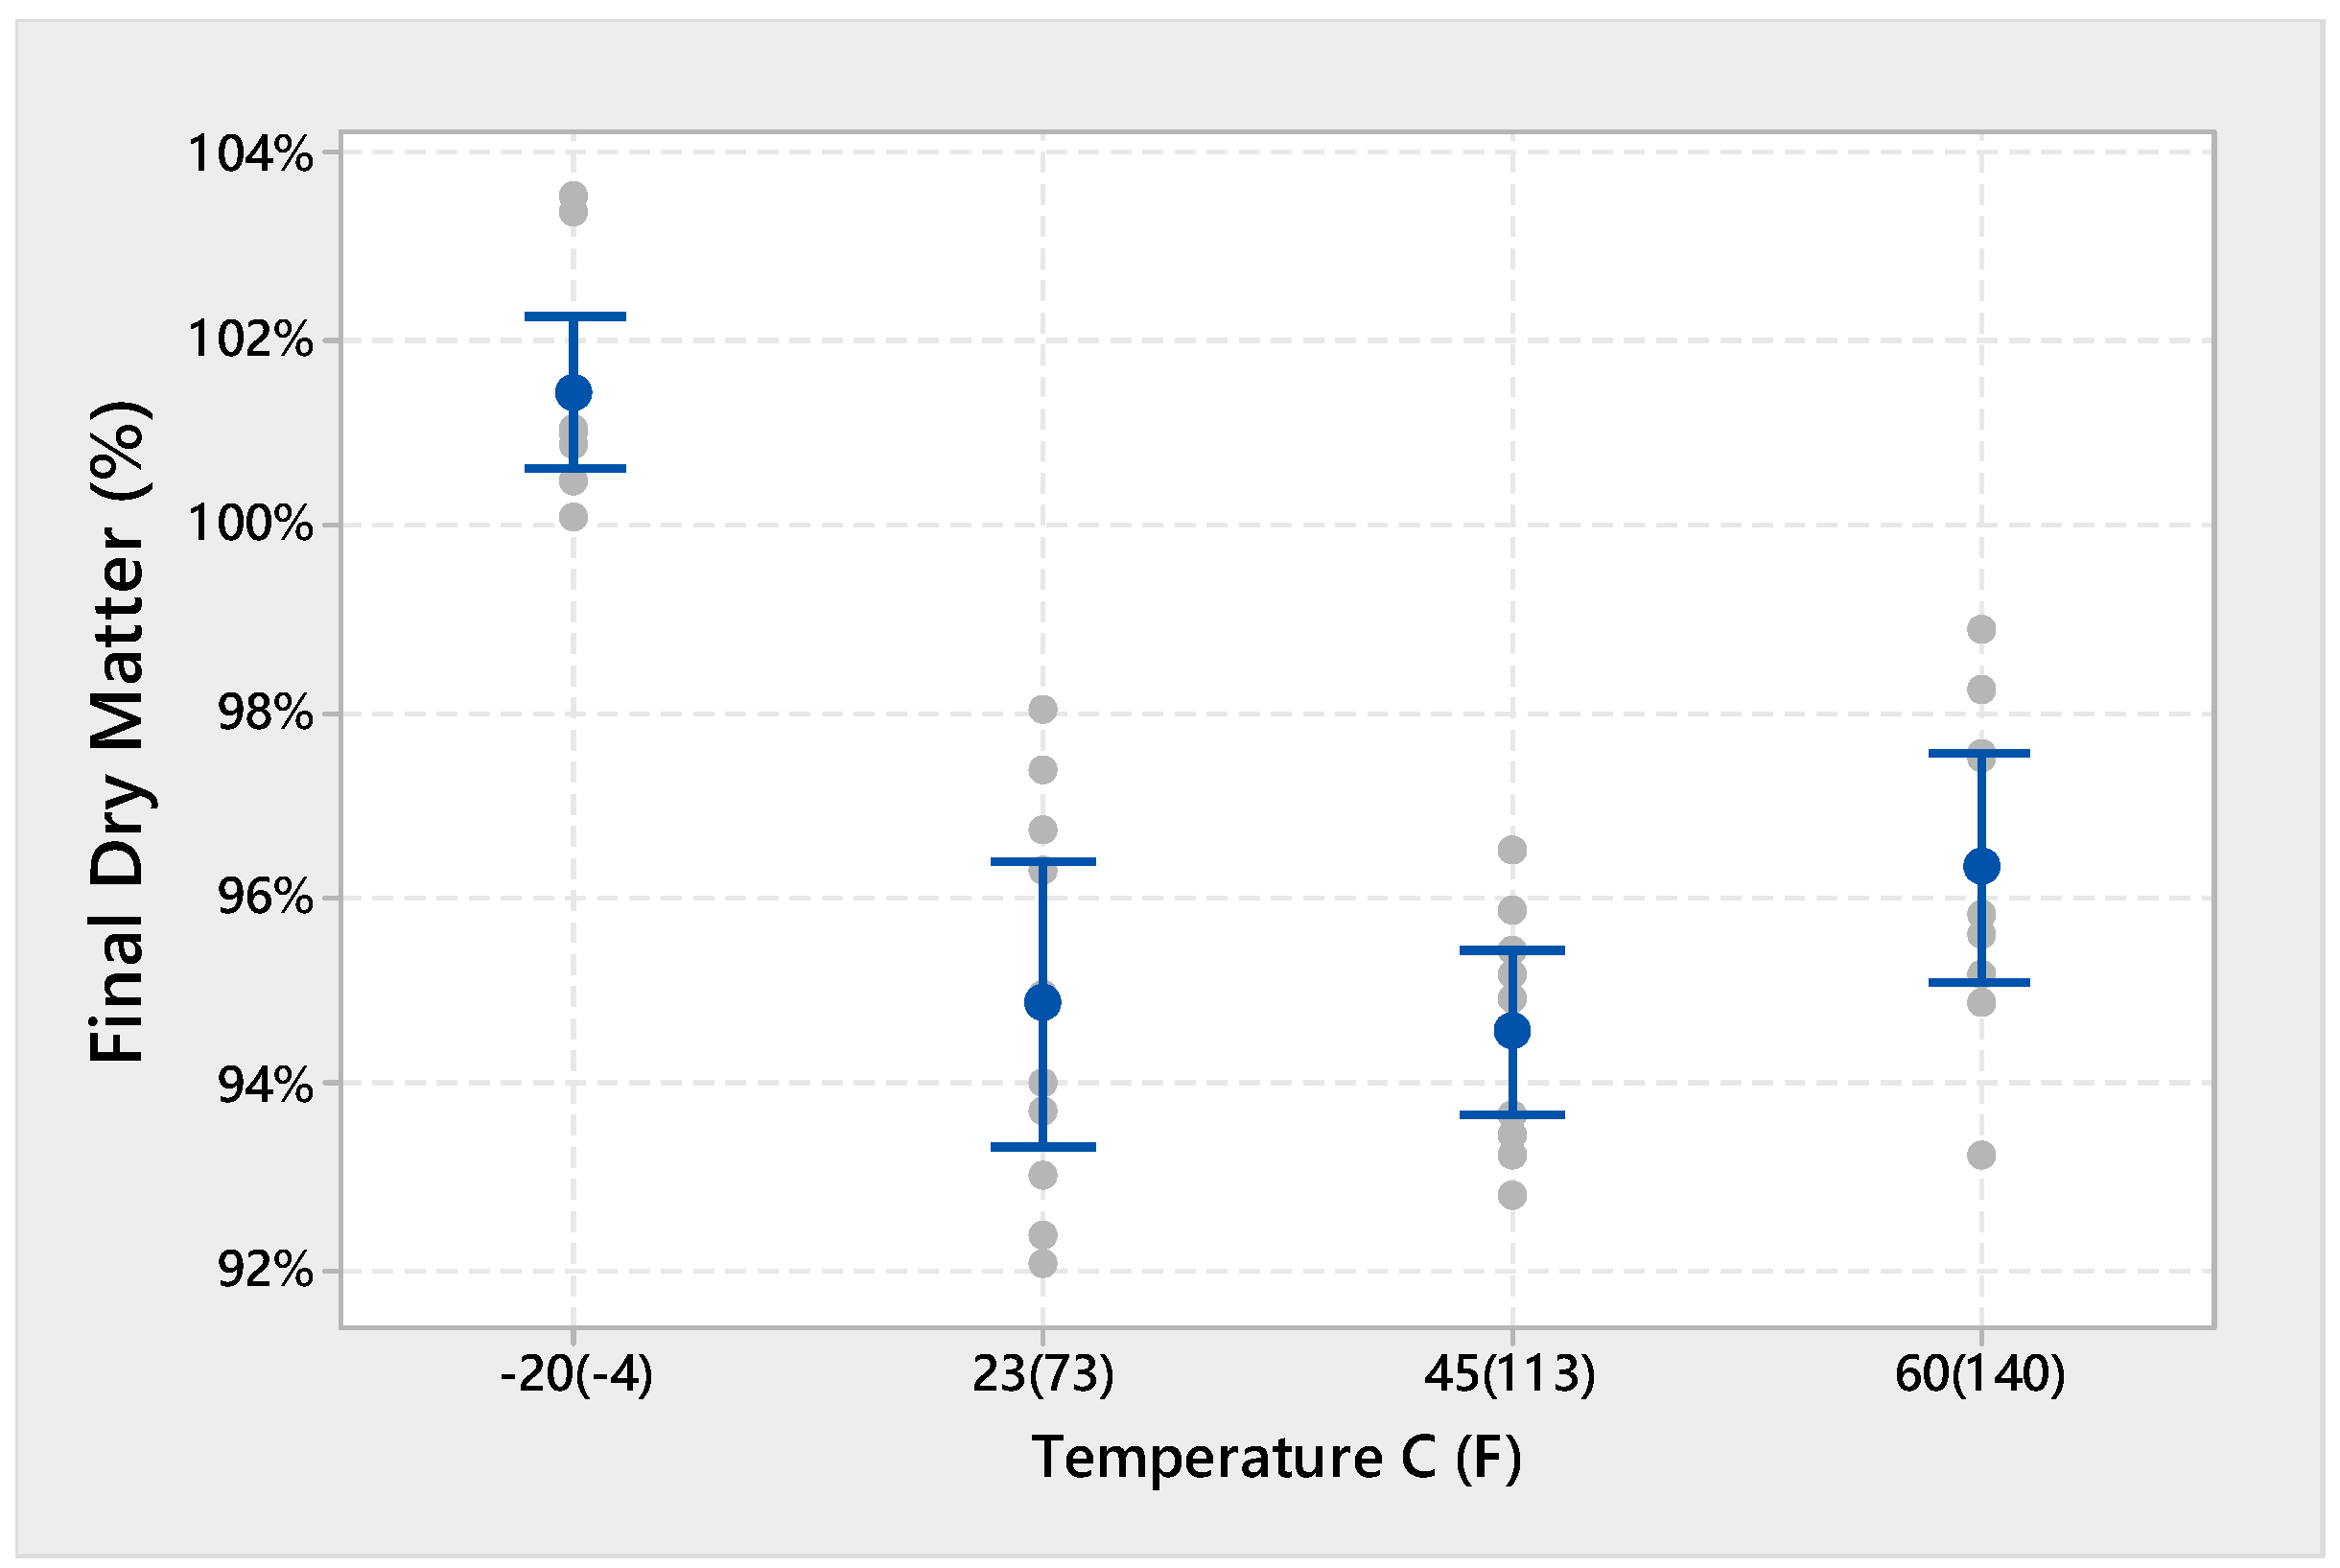
For experimental units with moisture levels promoting degradation (30% and 60%), temperature levels tested above freezing: 23 °C (73 °F), 45 °C (113 °F), and 60 °C (140 °F) did not show a statistical difference in mean final dry matter for the length of storage evaluated in this study, but were statistically lower than the frozen treatments (Table 6 and Figure 5).

3.3. Carbohydrate Analysis

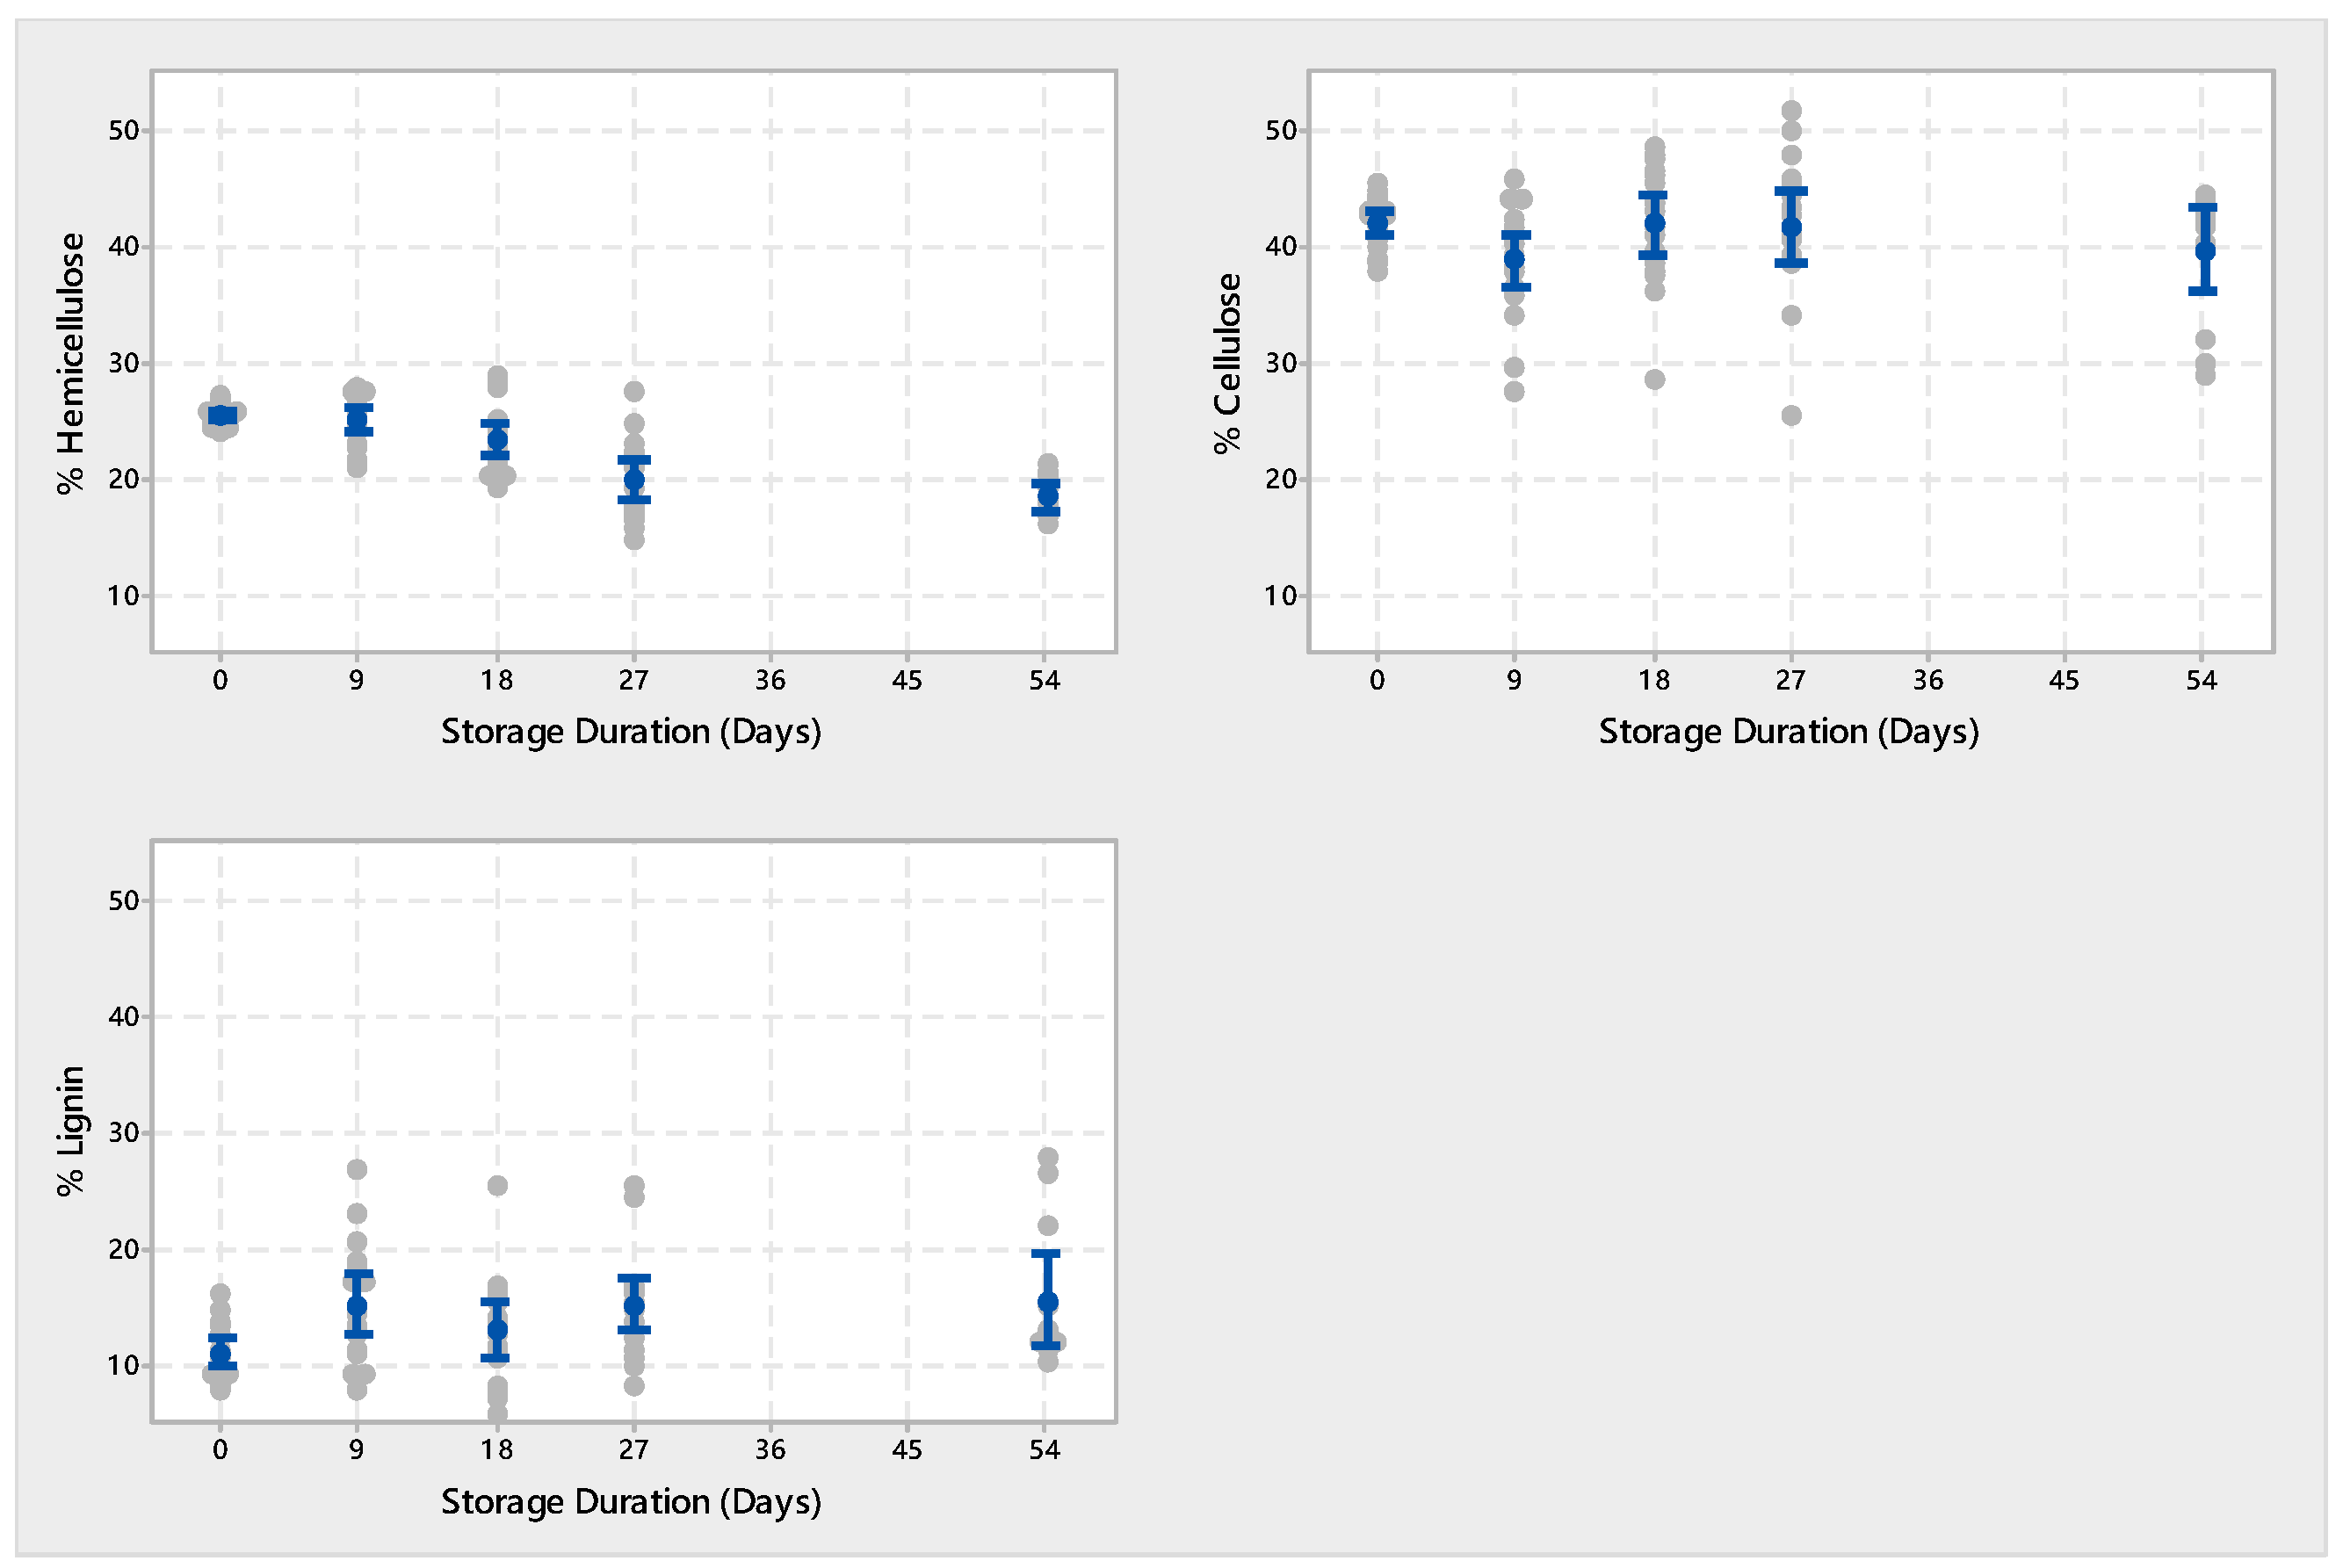
Experimental units, dried for dry matter loss analysis, were prepared and sent to an external analytical lab to be analyzed for final carbohydrate structure. Three tests: Neutral Detergent Fiber (NDF), Acid Detergent Fiber (ADF), and Acid Detergent (AD) Lignin were performed to quantify the remaining composition of cellulose, hemicellulose, and lignin. The percent composition of hemicellulose was the only component to correspond to the decreasing trend seen with the results of dry matter loss (Figure 6). Results presented are based on the mass of the degraded sample. Both the composition of cellulose and lignin had no significant change from day zero to day 54 of storage. (Table 7).
Cellulose and hemicellulose, both sugar-based molecules, are the components currently sought after for bioprocessing. To track those more valuable components, cellulose and hemicellulose are combined to represent the carbohydrate composition (% carbohydrate) within an experimental unit. The fact that these carbohydrates are targeted during dry matter loss creates a dually negative impact on the quality of the feedstock. Not only is there less feedstock to process after storage due to its dry matter loss, but the quality of this feedstock is less because the loss is primarily driven by carbohydrates. For a representative corn stover feedstock experiencing a 30% dry matter loss during storage its concentration of convertible biomass will drop from 70% initially to 57% due to composition changes during storage. The combination of mass loss and convertible sugar loss results in a net mass basis reduction of 42% of total convertible sugars post degradation. The sensitivity of carbohydrate loss during storage is a key driver to ensure that industrial biomass is stored in a dry and protected solution with minimal potential for moisture uptake from rainfall or surface water.

4. Conclusions

This experiment provided a controlled simulation of biomass degradation for baled corn stover; regulation of temperature and moisture content was enforced to evaluate trends of impact on decomposition. The influence of sustained moisture content has a threshold trend; the environment either has enough moisture for microbial degradation, or it does not. Biomass with moisture contents below 20% are stable and not fit for microbial consumption, regardless of environmental temperature. Biomass with moisture contents constantly above 20% degrade similarly to one another. Preferably biomass would not be put into long-term storage unless its moisture is below 20% moisture content. Environmental temperature impacted degradation in a similar threshold trend. Corn stover that is frozen does not experience dry matter loss. The moisture content of material does not influence degradation of frozen material; units with moisture contents of 15% and those with 60% measured zero dry matter loss. At environmental levels above freezing, material experiences degradation if adequate moisture is present. The influence of environmental temperature above freezing did not measure a distinct trend. Theoretically, the temperature of biomass will influence the microbial communities present. Thermophiles are more generally considered most efficient at decomposing lignocellulose, so an environment that supports their needs will measure higher rates of material losses. The storage durations tested may not have been long enough to see this impact. Longer duration replications of the tests are recommended to fully conclude the influence of temperature.
Biomass that experiences high levels of dry matter loss due to biodegradation will decrease in quality in terms of carbohydrate composition. Material will lose convertible components of hemicellulose and cellulose, concentrating the non-convertible components of lignin and ash. Consequently, this concentration of ash content, if not measured, decreases the accuracy of forage feed analysis in determining concentrations of structural components: cellulose, hemicellulose, and lignin. If omitted from the test method, high ash content will falsely inflate the concentration of cellulose, and inaccurately measure the impact of degradation on carbohydrate content. As ash content increases, the error in these methods increases in a linear fashion. Because degradation concentrates ash, these current methods should not be used to measure the dynamic carbohydrate trend in lignocellulosic degradation.

Author Contributions

Conceptualization, R.T., M.D. and K.W.; Methodology, R.T.; Validation, R.T. and M.D.; Formal analysis, R.T.; Data curation, R.T.; Writing—original draft preparation, R.T.; Writing—review and editing, M.D.; Visualization, R.T.; Supervision, K.W.; Project administration, K.W.; Funding acquisition, M.D.

Funding

This research was funded by E.I. du Pont de Nemours and Company.

Conflicts of Interest

The authors declare no conflict of interest.

References

  1. Shinners, K.J.; Boettcher, G.C.; Muck, R.E.; Weimer, P.J.; Casler, M.D. Harvest and Storage of Two Perennial Grasses as Biomass Feedstocks. Trans. ASABE 2010, 53, 359–370. [Google Scholar] [CrossRef]
  2. Shah, A.; Darr, M.; Webster, K.; Hoffman, C. Outdoor Storage Characteristics of Single-Pass Large Square Corn Stover Bales in Iowa. Energies 2011, 4, 1687–1695. [Google Scholar] [CrossRef] [Green Version]
  3. Todar, K. Today’s Online Textbook of Bacteriology. Available online: http://textbookofbacteriology.net/ (accessed on 12 December 2016).
  4. Darr, M.J.; Webster, K.; Bearden, R. Storage dynamics and lignocellulosic degradation in industrial biomass storage. In Proceedings of the 2018 ASABE Annual International Conference, Detroit, MI, USA, 30 July–1 August 2018. [Google Scholar]
  5. Brown, R.C.; Brown, T.R. Biorenewable Resources: Engineering New Products from Agriculture, 2nd ed.; Blackwell Publishing Co.: Ames, IA, USA, 2014. [Google Scholar]
  6. Darr, M.; Shah, A. Biomass Storage: An Update on Industrial Solutions for Baled Biomass Feedstock. Biofuels 2012, 3, 321–332. [Google Scholar] [CrossRef]
  7. Shah, A.; Darr, M. A Techno-economic Analysis of the Corn Stover Feedstock Supply System for Cellulosic Biorefineries. Biofuels Bioprod. Biorefining 2016, 10, 542–559. [Google Scholar] [CrossRef]
  8. ANKOM Technology. Neutral Detergent Fiber in Feeds: Filter Bag Technique (for A200 and A200I); ADF Method, Method 6; ANKOM Technology: Macedon, NY, USA, 2017. [Google Scholar]
  9. ANKOM Technology. Acid Detergent Fiber in Feeds: Filter Bag Technique (for A200 and A200I); ADF Method, Method 5; ANKOM Technology: Macedon, NY, USA, 2017. [Google Scholar]
  10. AOAC Official Method 973.18. Fiber (Acid Detergent) and Lignin in Animal Feed. In Official Methods of Analysis of AOAC International, 16th ed.; AOAC International: Arlington, VA, USA, 1997; pp. 28–29.
  11. Okpokwasili, G.; Nweke, C. Microbial Growth and Substrate Utilization Kinetics. Afr. J. Biotechnol. 2005, 5, 305–317. [Google Scholar]
Figure 1. (a)Hydraulic press and (b) resultant tubes of densified corn stover.
Agriengineering 01 00025 g001
Figure 2. Environmental chamber configuration. (a) dual watering pan system for maintaining internal chamber humidity; (b) burlap sack used to cover test samples and slow air and moisture transfer within the chamber.
Agriengineering 01 00025 g002
Figure 3. Influence of biomass moisture content and storage duration on final dry matter. Combined temperatures of 23, 45 and 60 °C.
Agriengineering 01 00025 g003
Figure 4. Trend of final dry matter with storage duration. Combined 30% and 60% moisture content levels. The R2 off 84.3% value indicates how well the data fits the quadratic regression.
Agriengineering 01 00025 g004
Figure 5. The effect of temperature on final dry matter. Combined 30% and 60% moisture content levels at 27 days of storage. Bars indicate 95% confidence intervals.
Agriengineering 01 00025 g005
Figure 6. Influence of storage duration on the final composition of hemicellulose, cellulose, and lignin. Combined 30% and 60% moisture content levels. Bars indicate 95% confidence intervals.
Agriengineering 01 00025 g006
Table 1. Summary table of treatment factors, matrix values indicate replications.
Treatment FactorTemperature °C (°F)
−20 (−4)23 (73)45 (113)60 (140)
Moisture Content %0 5
10 5
15555 555 555-555
20555 555 555-555
30555 555 55510555
60555 555 55510555
Storage Duration (Days)9182754918275491827549182754
Table 2. Tukey’s test results for mean dry matter loss based on storage temperature and moisture content for various storage durations.
Temperature (°C)9-Day Storage Duration
15% Moisture20% Moisture30% Moisture60% Moisture
Mean DML (%)Tukey Grouping *Mean DML (%)Tukey Grouping *Mean DML (%)Tukey Grouping *Mean DML (%)Tukey Grouping *
−200.1A0.1A0.1A−0.1A
231.9B2.4B2.9B3.2B
452.8B2.7B3.0B1.7B
602.3B2.2B2.0B2.3B
18-Day Storage Duration
Temperature (°C)15% Moisture20% Moisture30% Moisture60% Moisture
Mean DML (%)Tukey Grouping *Mean DML (%)Tukey Grouping *Mean DML (%)Tukey Grouping *Mean DML (%)Tukey Grouping *
−20−0.9A−0.9A−1.2A−1.6A
23−0.3A1.1B5.3B2.3B
450.5A1.8B4.0B1.7B
60−0.5A0.9B 1.6B
27-Day Storage Duration
Temperature (°C)15% Moisture20% Moisture30% Moisture60% Moisture
Mean DML (%)Tukey Grouping *Mean DML (%)Tukey Grouping *Mean DML (%)Tukey Grouping *Mean DML (%)Tukey Grouping *
−20−1.6A−1.7A−0.9A−1.6A
230.3A1.7B4.1B6.3B
450.6A1.2B5.3B6.2B
600.4A0.9B2.5B4.8B
* Means that do not share a letter are significantly different at α value of 0.05.
Table 3. Tukey’s test results for mean dry matter loss based on moisture content for various storage durations. Combined temperatures of 23, 45 and 60 °C.
Initial MC (%)9-Day Storage Duration18-Day Storage Duration 27-Day Storage Duration
NDry Matter Loss (%)Tukey Grouping *NDry Matter Loss (%)Tukey Grouping *NDry Matter Loss (%)Tukey Grouping *
MeanStDevMeanStDevMeanStDev
0 51.10.7A
1050.10.5A
1592.30.8A15−0.21.0A 150.50.9A
2092.40.7A151.11.3AB151.21.1A
3092.60.8A152.52.6 B153.82.2 B
6092.01.6A151.51.6AB155.81.5 C
* Means that do not share a letter are significantly different at α value of 0.05.
Table 4. Relating Simultaneous Saccharification/Fermentation (SSF) rate equations to biomass degradation.
Rate EquationSSF ReactionDegradation Reaction
dX/dtMicrobesMicrobes
dG/dtGlucoseSimple sugars
dS/dtStarchCellulose, hemicellulose, Lignin
dEnz/dtEnzymeEnzyme
dE/dtEthanolCarbon dioxide
dDM/dtNADry Matter
Table 5. Tukey’s test results for mean final dry matter for −20 °C temperature level. Combined 9, 18, and 27 storage days.
Moisture (%)NFinal Dry Matter (%)Tukey Grouping *
MeanStDev
15151011.0A
20151011.0A
30151001.1A
60151021.1A
* Means that do not share a letter are significantly different at α value of 0.05.
Table 6. Tukey’s test results for mean final dry matter based on temperature level. 27-day storage duration. Combined 30% and 60% moisture levels.
Temperature °C (°F)NFinal Dry Matter (%)Tukey Grouping *
MeanStDev
−20 (−4)101011.1A
2310962.1 B
4510951.2 B
6010951.7 B
* Means that do not share a letter are significantly different at α value of 0.05.
Table 7. Tukey’s test results for final composition from day 0 to day 54 of storage.
Storage Duration (Days)Hemicellulose (%)Cellulose (%)Lignin (%)Dry Matter (%)
NMeanTukey Grouping *NMeanTukey Grouping *NMeanTukey Grouping *NMeanTukey Grouping *
02025.4A 2041.9A2011.0A20100.0A
541218.3 B1239.5A1215.4A2082.1 B
* Means that do not share a letter are significantly different.

