Highlights
What are the main findings?
- Rapid, unregulated construction in a Rio de Janeiro favela has significantly altered local airflow and surface energy balance, exacerbating the urban heat island (UHI) effect.
- Microclimatic simulations consistently recorded elevated temperatures, with the most pronounced impacts in densely built zones.
What is the implication of the main findings?
- Similar microclimatic effects are likely in informal settlements globally, making this a key issue for sustainable development in Latin America, Asia, and Africa.
- These results highlight an urgent need for public policies that curb unregulated vertical expansion and implement mitigating strategies, such as creating green spaces, improving natural ventilation, and promoting more suitable building materials.
Abstract
Rio de Janeiro’s favelas house over 20% of the city’s population in just 5% of its territory, with Rio das Pedras emerging as a critical case study: ranking as Brazil’s fifth most populous favela and its most vertically intensified. This study quantifies how uncontrolled vertical growth in informal settlements disrupts microclimate dynamics, directly impacting thermal comfort. Using high-resolution geospatial analytics, we integrated digital surface models (DSMs) derived from LiDAR and photogrammetric data (2013, 2019, and 2024) with microclimatic simulations to assess urban morphology changes and their thermal effects. A spatiotemporal cadastral analysis tracked vertical expansion (new floors) and demolition patterns, while ENVI-met simulations mapped air temperature anomalies across decadal scenarios. Results reveal two key findings: (1) rapid, unregulated construction has significantly altered local airflow and surface energy balance, exacerbating the urban heat island (UHI) effect; (2) microclimatic simulations consistently recorded elevated temperatures, with the most pronounced impacts in densely built zones. These findings underscore the need for public policies to mitigate such negative effects observed in informal settlement areas.
1. Introduction
The phenomenon of urbanization has been occurring at an accelerated pace, with more than half of the world’s population now living in urban areas, a percentage that may exceed 60% by 2030 []. As the Global South becomes more and more urbanized, infrastructure inequality also increases, and greenspace is lost [,]. Such growth brings with it an increase in impervious surfaces, such as concrete and asphalt, to the detriment of permeable and vegetated areas, leading to a rise in surfaces with low albedo [,,,]. This means greater absorption of solar radiation and a reduction in the shading of open spaces. These transformations are closely linked to the effects of Urban Heat Islands (UHIs), a phenomenon in which urban areas exhibit significantly higher temperatures than their rural surroundings [,,].
Global climate change has contributed to aggravating the effects of UHIs, since the increase in the planet’s average temperature intensifies thermal extremes in cities [,,]. Studies indicate that cities such as Medellín, São Paulo, and record air temperature increases in UHI regions ranging between 5 °C and 7 °C, directly impacting energy consumption, air quality, and population well-being []. The occurrence of UHIs directly affects people’s health, worsening heat stress, which increases the incidence of myocardial infarction, stroke, sunstroke, heat exhaustion, and mortality during heat waves [,]. In tropical regions, where climatic conditions are naturally hot and humid, there is an urgent need to develop mitigation measures against UHI effects [,,].
The study of these phenomena has been expanded through the use of microclimatic simulation tools, such as the ENVI-met software 5.7, which allows modeling the interaction between buildings, soil, and vegetation []. However, most research using this tool has been developed for temperate climates, with a significant shortage of studies focusing on tropical regions [,]. This gap is even more pronounced for informal settlements within these tropical cities []. Slums and favelas, with their unique urban morphology—defined by high density, informal materials, and organic layouts—are critically under-researched. The inherent difficulties of conducting on-site measurements, due to safety and structural instability, make computational simulations essential for studying their microclimates [,].
In Brazil, few studies tackle the formation of Urban Heat Islands (UHIs) in favelas. As defined by the Brazilian Institute of Geography and Statistics, favelas and poor communities are territories that lack assistance and rights, including—but not limited to—sanitation, legal titles, property rights and infrastructure, often located in areas with restricted occupation, such as environmental risk sites [], and have seen continuous, unregulated growth over recent decades. In Rio de Janeiro, these communities are home to a substantial part of the city’s population; the 2022 census recorded 1.3 million people living in 813 favelas, constituting 21.73% of the city’s total []. Given such intense and dense development, the novel concept of thermal justice provides a crucial framework for understanding their microclimatic conditions []. Analyzing their microclimate is essential not only to address issues of urban comfort but also to identify thermal patterns that could become more prevalent across the entire city.
This article takes the Rio das Pedras favela in Rio de Janeiro as its study area: an environment where a tropical climate intersects with unregulated urban development. This study therefore aims to gather results from microclimate simulations for Rio das Pedras using the ENVI-met software [], while establishing a protocol for geospatial data input and preprocessing to produce precise microclimate-relevant maps. The site was selected due to its notable vertical growth [], maximizing its potential for environmental planning simulations. Additionally, abundant geospatial data, including vector bases, digital surface models, and precise orthophotos, were available, ensuring optimal conditions for the experiment.
The study verified urban morphological changes in Rio das Pedras—particularly verticalization—and assessed their influence on the local microclimate, confirming the occurrence of microclimatic changes and identifying key elements contributing to temperature variations. Three temporal scenarios (2013, 2019, and 2024) were defined, with morphological data specific to each period while climatic data remained constant. To this end, Digital Surface Models were generated for all three years and converted into precise cartographic datasets, which supported the development of distinct 3D microclimatic simulation models, thereby enabling a comprehensive assessment of morphological and microclimatic changes over time.
This article aims to contribute to the debate on climate-resilient urban planning, evaluating the impact of unregulated urban growth and studying strategies to mitigate the negative impacts of UHIs in tropical climate regions. By integrating microclimatic simulations with analyses of urban morphology, it is expected to provide support for policies that promote improved habitability in cities facing microclimatic changes.
2. Materials and Methods
2.1. Spatial Domain
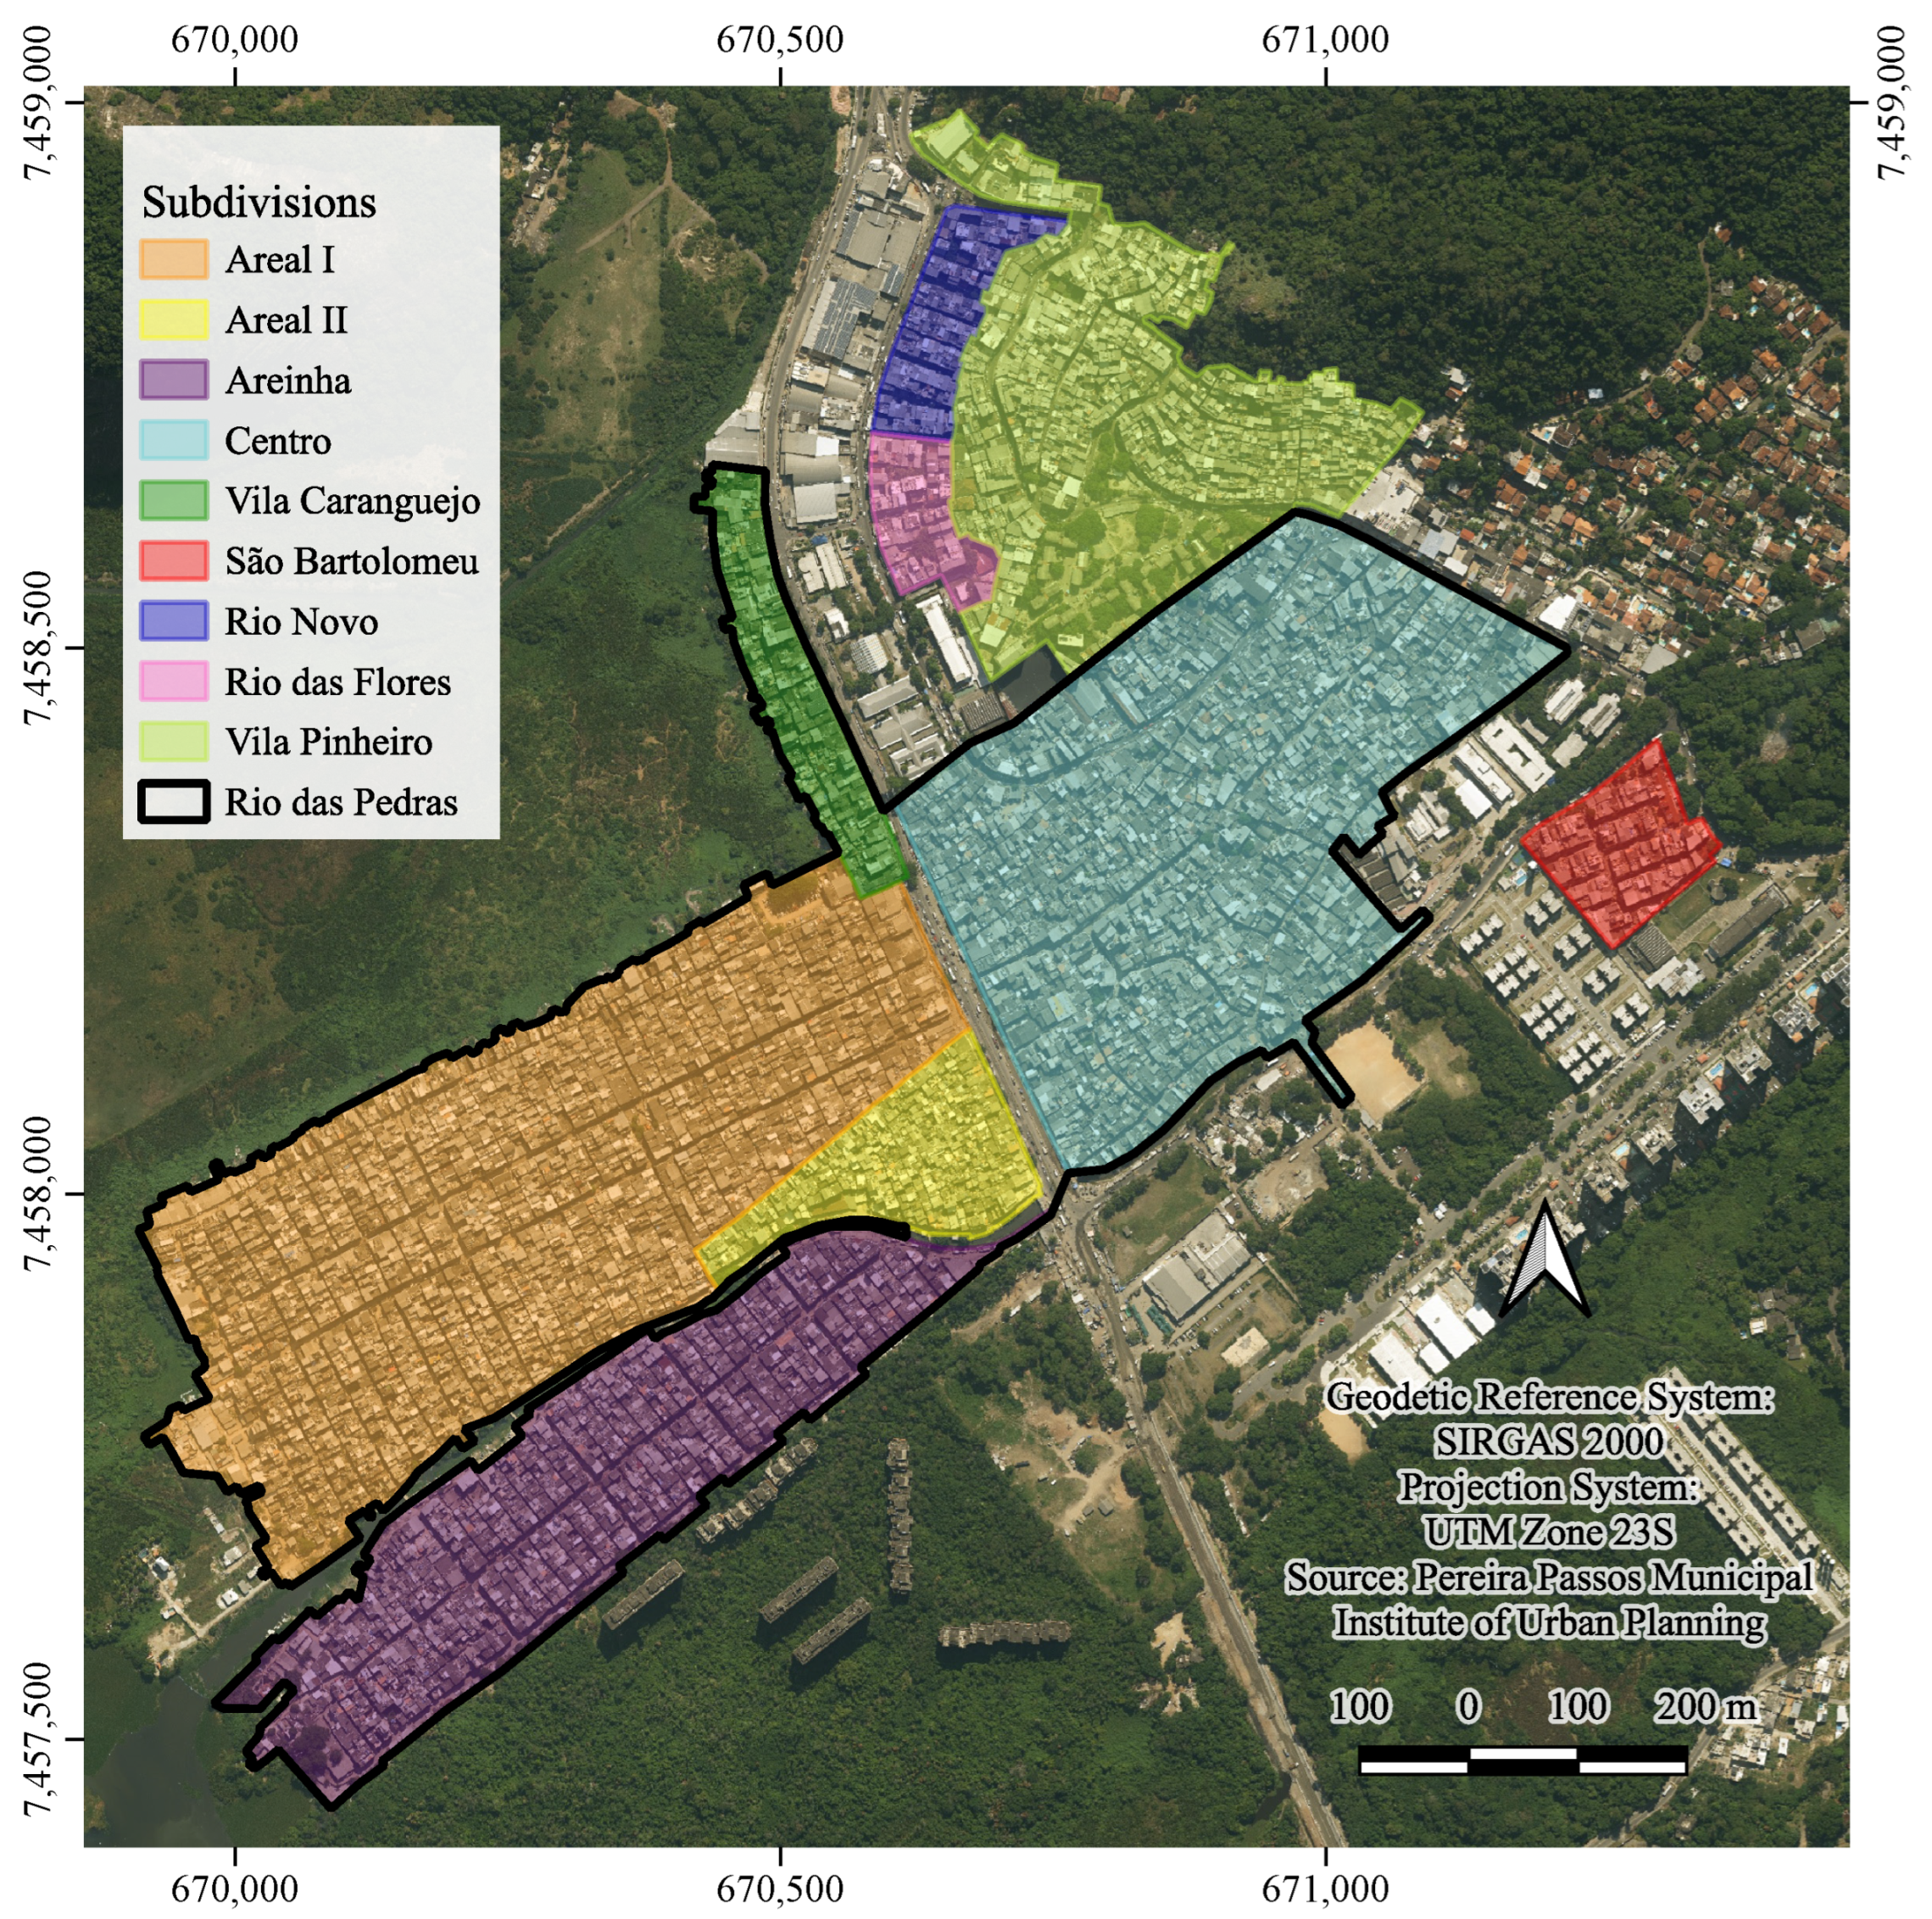
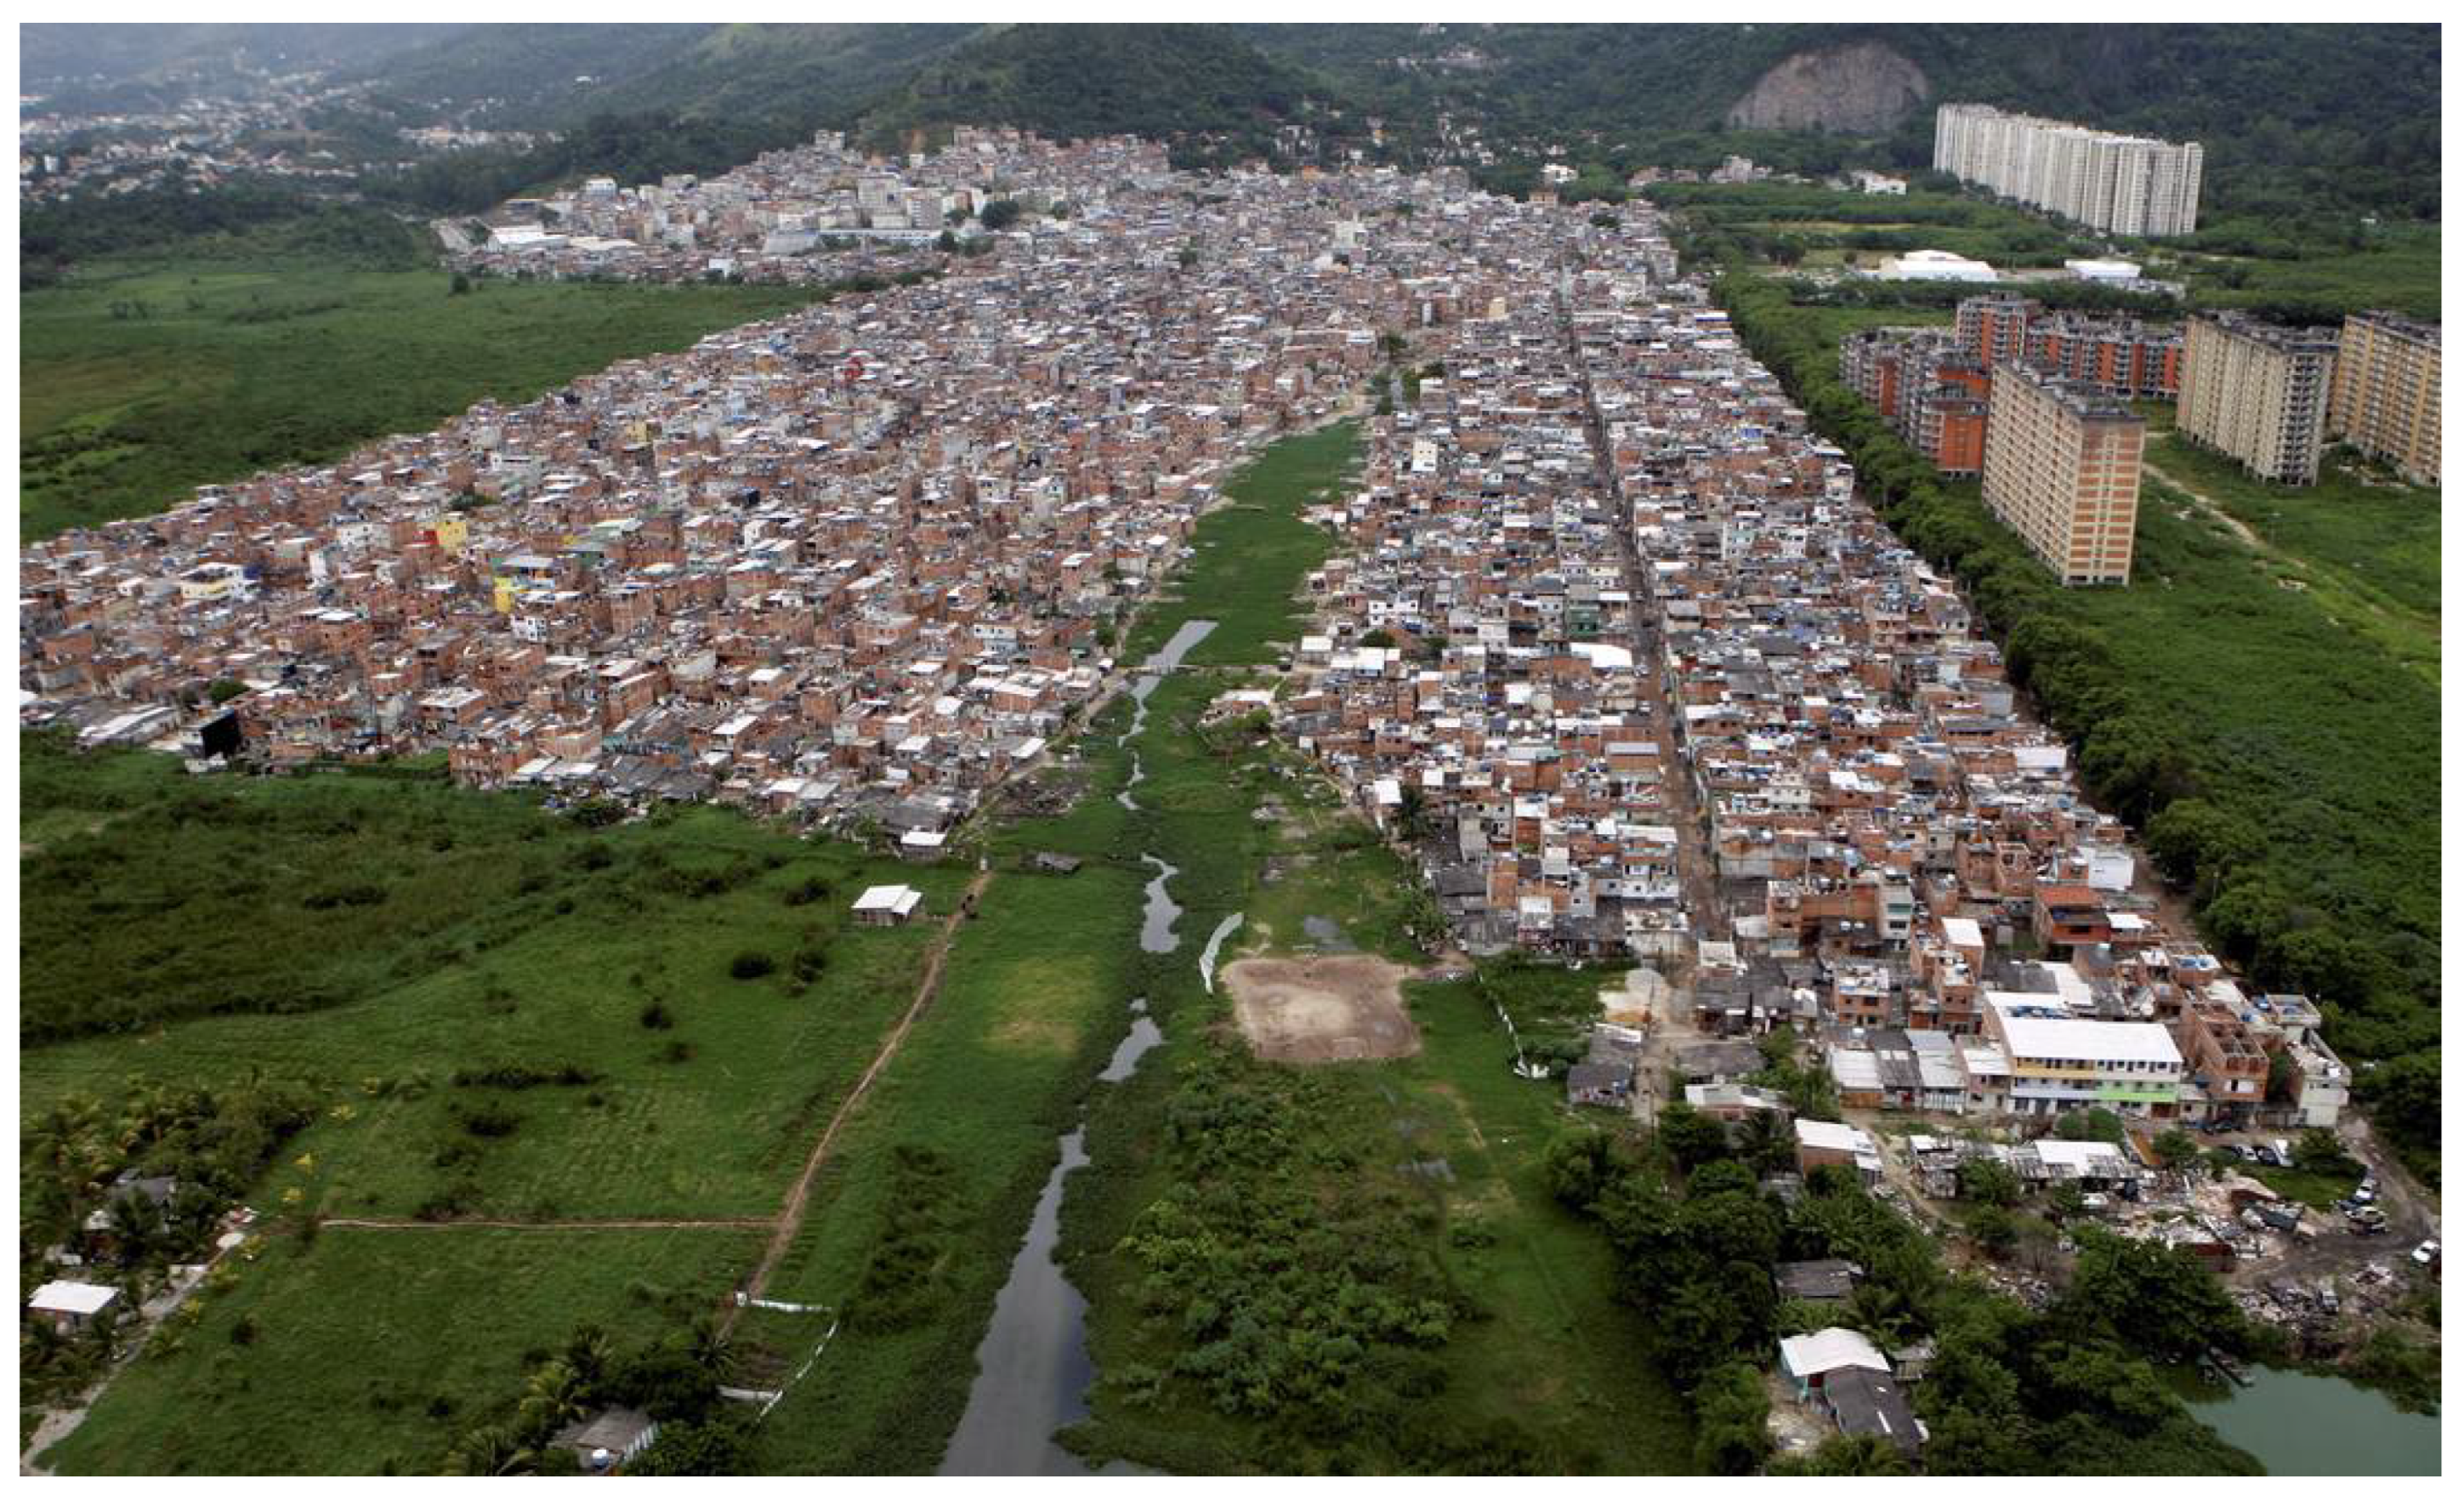
Rio das Pedras, located in the vicinity of Jacarepaguá and Itanhangá, borders Lagoa da Tijuca in Rio’s West Zone (Figure 1). Named after the river that originates in the Tijuca Forest and crosses the favela, its first occupation occurred in 1951, with sparse habitation until the mid-1960s due to swampy terrain that residents filled to enable construction [,].
Figure 1.
Rio das Pedras favela (source: []).
The favela expanded rapidly in the late 1960s and 1970s due to migration from the Brazilian Northeast linked to Barra da Tijuca’s development. In 1964 and 1966, residents faced eviction, but the land was classified as an Area of Special Social Interest (AEIS—Área de Especial Interesse Social) for a farming colony integrated with the Jacarepaguá biological reserve, aiding 96 families [,]. Favela removal policies spurred further growth as displaced populations sought refuge there, aided by new roads in the 1970s.
During Governor Leonel Brizola’s term (1983–1986), hydraulic landfills resettled families displaced by 1984 floods. By 1985, 2800 families lived there, prompting urbanization and land regularization; CEHab-RJ issued 130 property titles []. In 1991, about 6000 residents occupied 15 deteriorating buildings of the abandoned Delfin Residential Complex on mangrove land. Many relocated to flood-prone areas Areal II and Areinha, while the complex remains abandoned [,]. From 1998, laws designated the area as AEIS to support low-income housing [,].
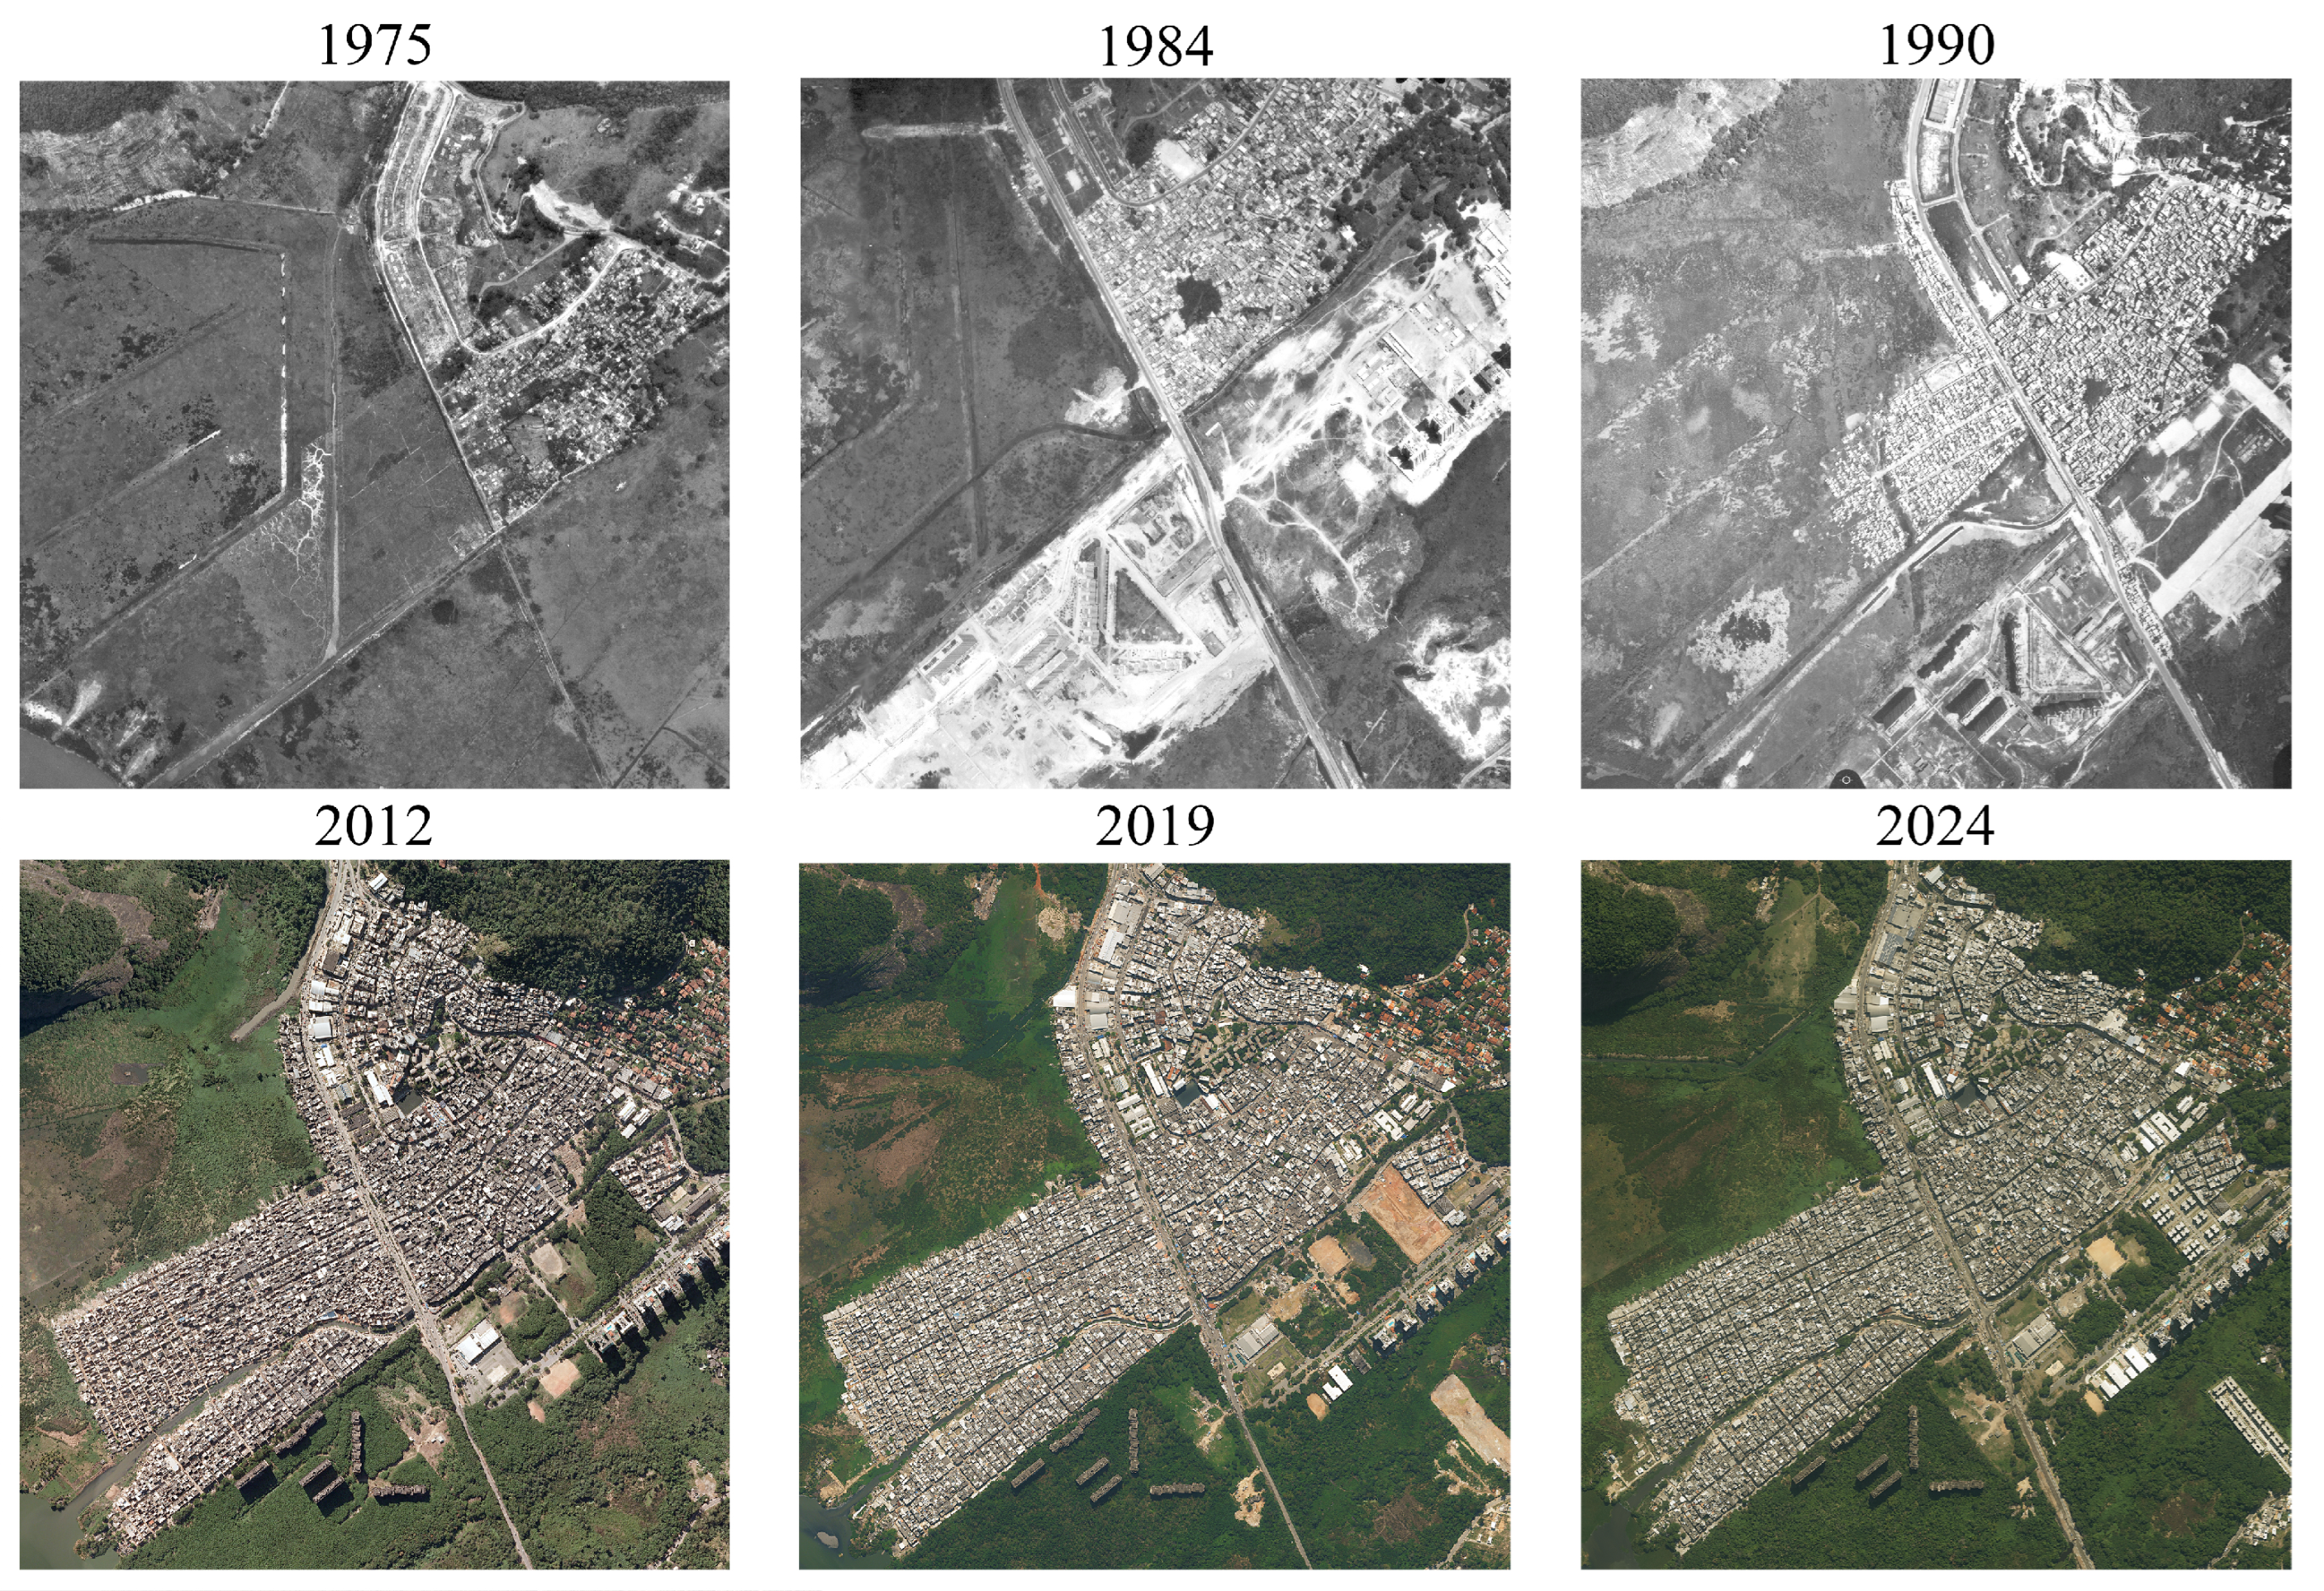
Classified as a large, complex, partially urbanized settlement, Rio das Pedras is among Brazil’s five largest favelas, with 55,653 residents (Figure 2), though local associations estimate up to 140,000 [,]. Its area is only 0.586 km2, reflecting extreme density [,]. It ranks second nationally in permanent residences (23,846), leading in combined “apartments” and “rooming house” units, indicating notable vertical growth. Spatial expansion peaked between 1975 and 1999 (Figure 3), with horizontal growth stabilizing below 2% since 1999, despite rising population and households [].
Figure 2.
Outer and inner boundaries of the Rio das Pedras favela, showing local subdivisions and adjacent, smaller slums (which are not within the bold black boundary).
Figure 3.
Horizontal expansion of the Rio das Pedras region (source: Pereira Passos Municipal Institute of Urban Planning).
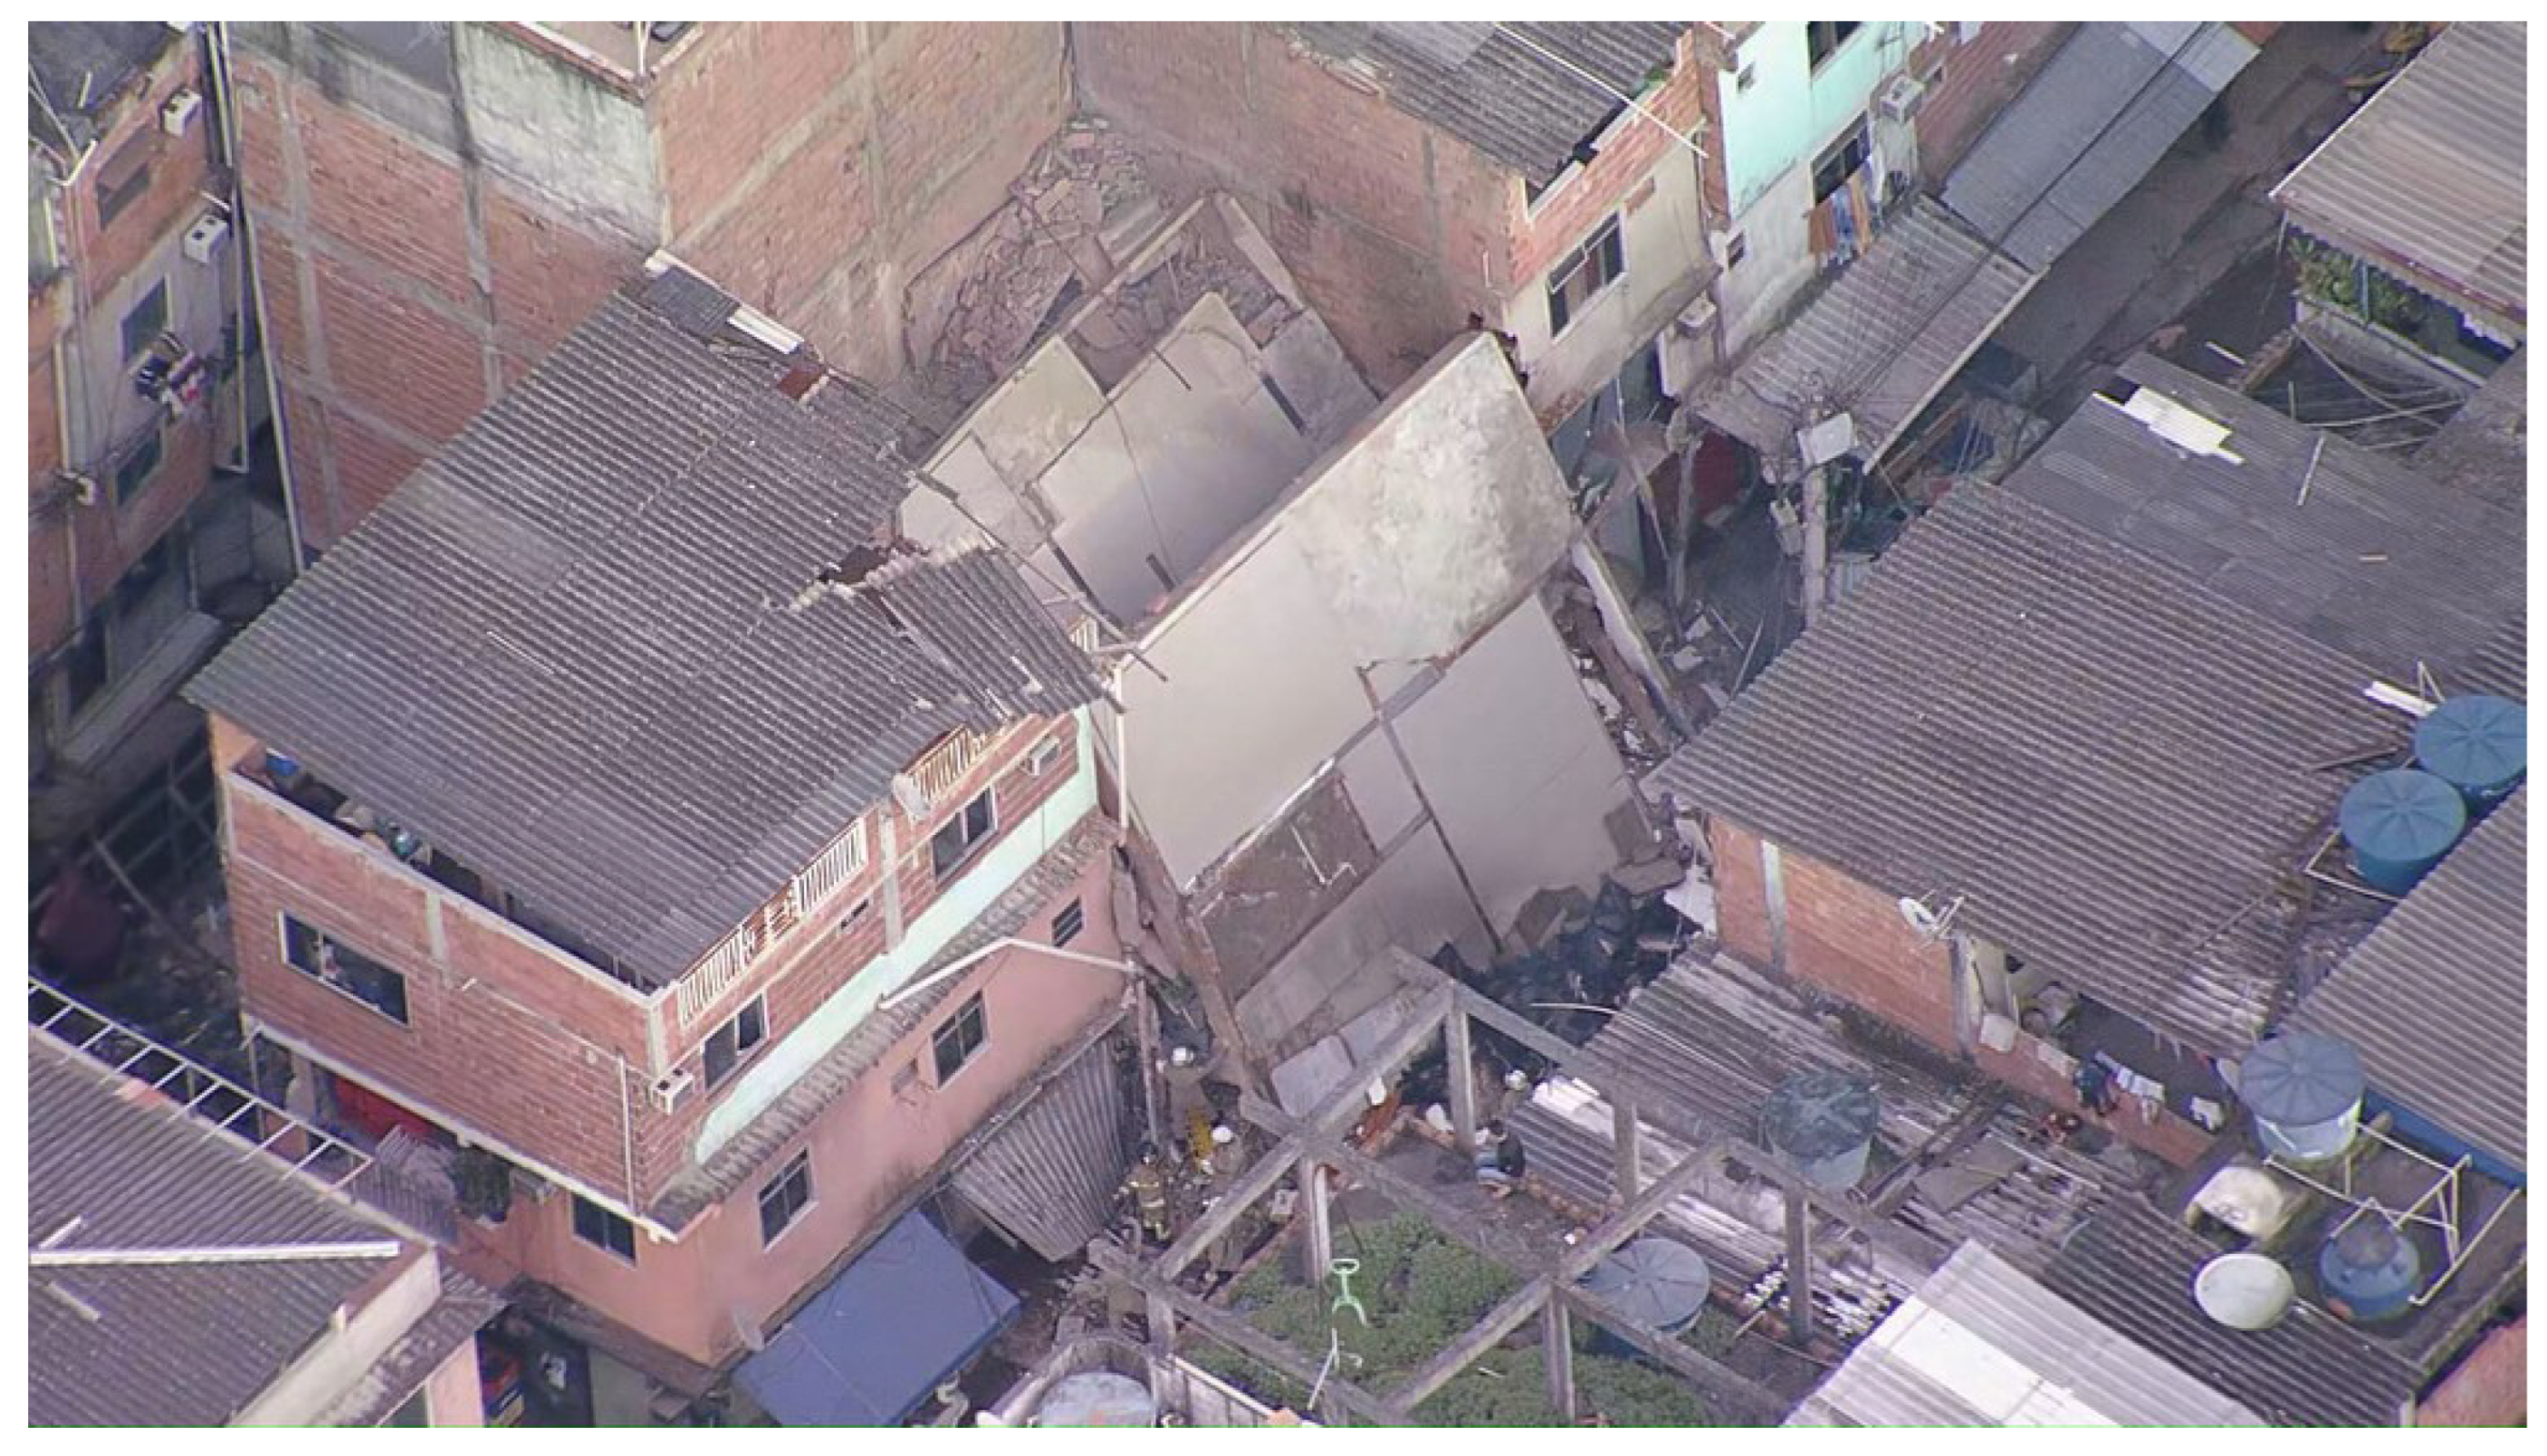
Rapid, unplanned population growth has driven vertical construction, replacing horizontal expansion. This trend is worsened by militia control—Rio das Pedras hosts Rio’s oldest militia—profiting from illegal real estate []. However, precarious construction on unstable, reclaimed land has caused numerous disasters: the 2012 demolition of four buildings in Areinha due to ground subsidence []; a 2016 sinkhole causing outages and evacuations in Areal I []; the 2021 collapse of a four-story building in Areinha, killing two (Figure 4); and a 2023 collapse in the central area, fortunately without fatalities []. Additionally, in 2019, two five-story buildings collapsed in nearby Muzema after heavy rains, killing 24 []. These disasters share a common cause: construction on unstable peat and mangrove soils prone to subsidence and flooding [,].
Figure 4.
Example of a building collapse (source: []).
Accelerated urban growth in Rio das Pedras, combined with global climate change, has caused various socio-environmental problems, negatively impacting urban life quality. These changes affect air quality and the urban microclimate. In areas with reduced ventilation and altered land cover, heat accumulates, contributing to the formation of urban heat islands, which raise local temperatures and create discomfort []. This increase is worsened by urban projects that hinder ventilation and expand sunlight absorption and reflection, modifying the microclimate and intensifying perceived heat.
2.2. Materials
To use an adequate geographic base, the present work was developed using, as primary materials, data from three aerophotogrammetric and LiDAR (Light Detection and Ranging) flights conducted over the city of Rio de Janeiro, according to contracts signed between the City of Rio de Janeiro, through the Pereira Passos Municipal Urban Planning Institute (IPP—Instituto Municipal de Urbanismo Pereira Passos), and the company TOPOCART Topografia, Engenharia e Aerolevantamentos S/S Ltda. These flights are as ollows:
2.2.1. 2013 Aerophotogrammetric and LiDAR Aerial Surveys
These surveys were conducted between May and June 2013. The aerophotogrammetric flight was performed at a reference scale of 1:8000, to produce cartographic bases at a scale of 1:2000 (urban area/low-income communities) through digital aerophotogrammetric restitution and the generation of orthophotos at a scale of 1:10,000, aiming to update the cartographic base, with a longitudinal overlap of 80% and a lateral overlap of 40%. A Carajá aircraft was used, registration PT-VDT, model 280c manufactured by Embraer in 1987, equipped with two turboprop engines of 550 SHP each, an average cruising speed of 370 km/h, and equipped with an autopilot, GNSS satellite tracker, navigation radar, and a flight autonomy of 4 h.
For capturing the photographs, the large-format aerophotogrammetric camera Vexcel Microsoft Ultracam-X was used, with an image acquisition frame of 14,430 × 9420 pixels, composed of 13 Charge-Coupled Devices (CCDs) with a pixel resolution of 7.2 µm and 216 MP, enabling the capture of aerial images with a real resolution of up to 2 cm. The final delivery of the images was provided as a single pan-sharpened RGB (red, green, blue—3 bands) file [], with an geometric resolution of approximately 10 cm and a radiometric resolution of 12 bits per RGB band [].
For laser scanning, the Seneca III aircraft was used, registration PT-VLG, model 810d manufactured by Embraer, specially adapted with a LiDAR system and equipped with an autopilot, GNSS (Global Navigation Satellite System) satellite tracker, navigation radar, and a flight autonomy of 4 h. The laser survey, with a spatial resolution of 2 points/m2 and a 20% overlap between flight strips, was conducted with the Laser ALS60 sensor, manufactured by Leica Geosystems (Heerbrugg, Switzerland). This sensor operates at a frequency of up to 200 kHz, meaning it can emit up to 200,000 pulses per second. It has a maximum FOV (field of view) angle of 75°, the ability to record up to 4 returns per emitted pulse, an 8-bit distinction of the return signal intensity for each return, and a maximum operating altitude of 5000 m. It is accompanied by a recording unit with a capacity of 500 GB, equivalent to 18 h of operation at the sensor’s maximum frequency []. The analysis of multiple returns is useful for determining the height of objects above the imaged surface, as well as classifying objects based on the return signal intensity [].
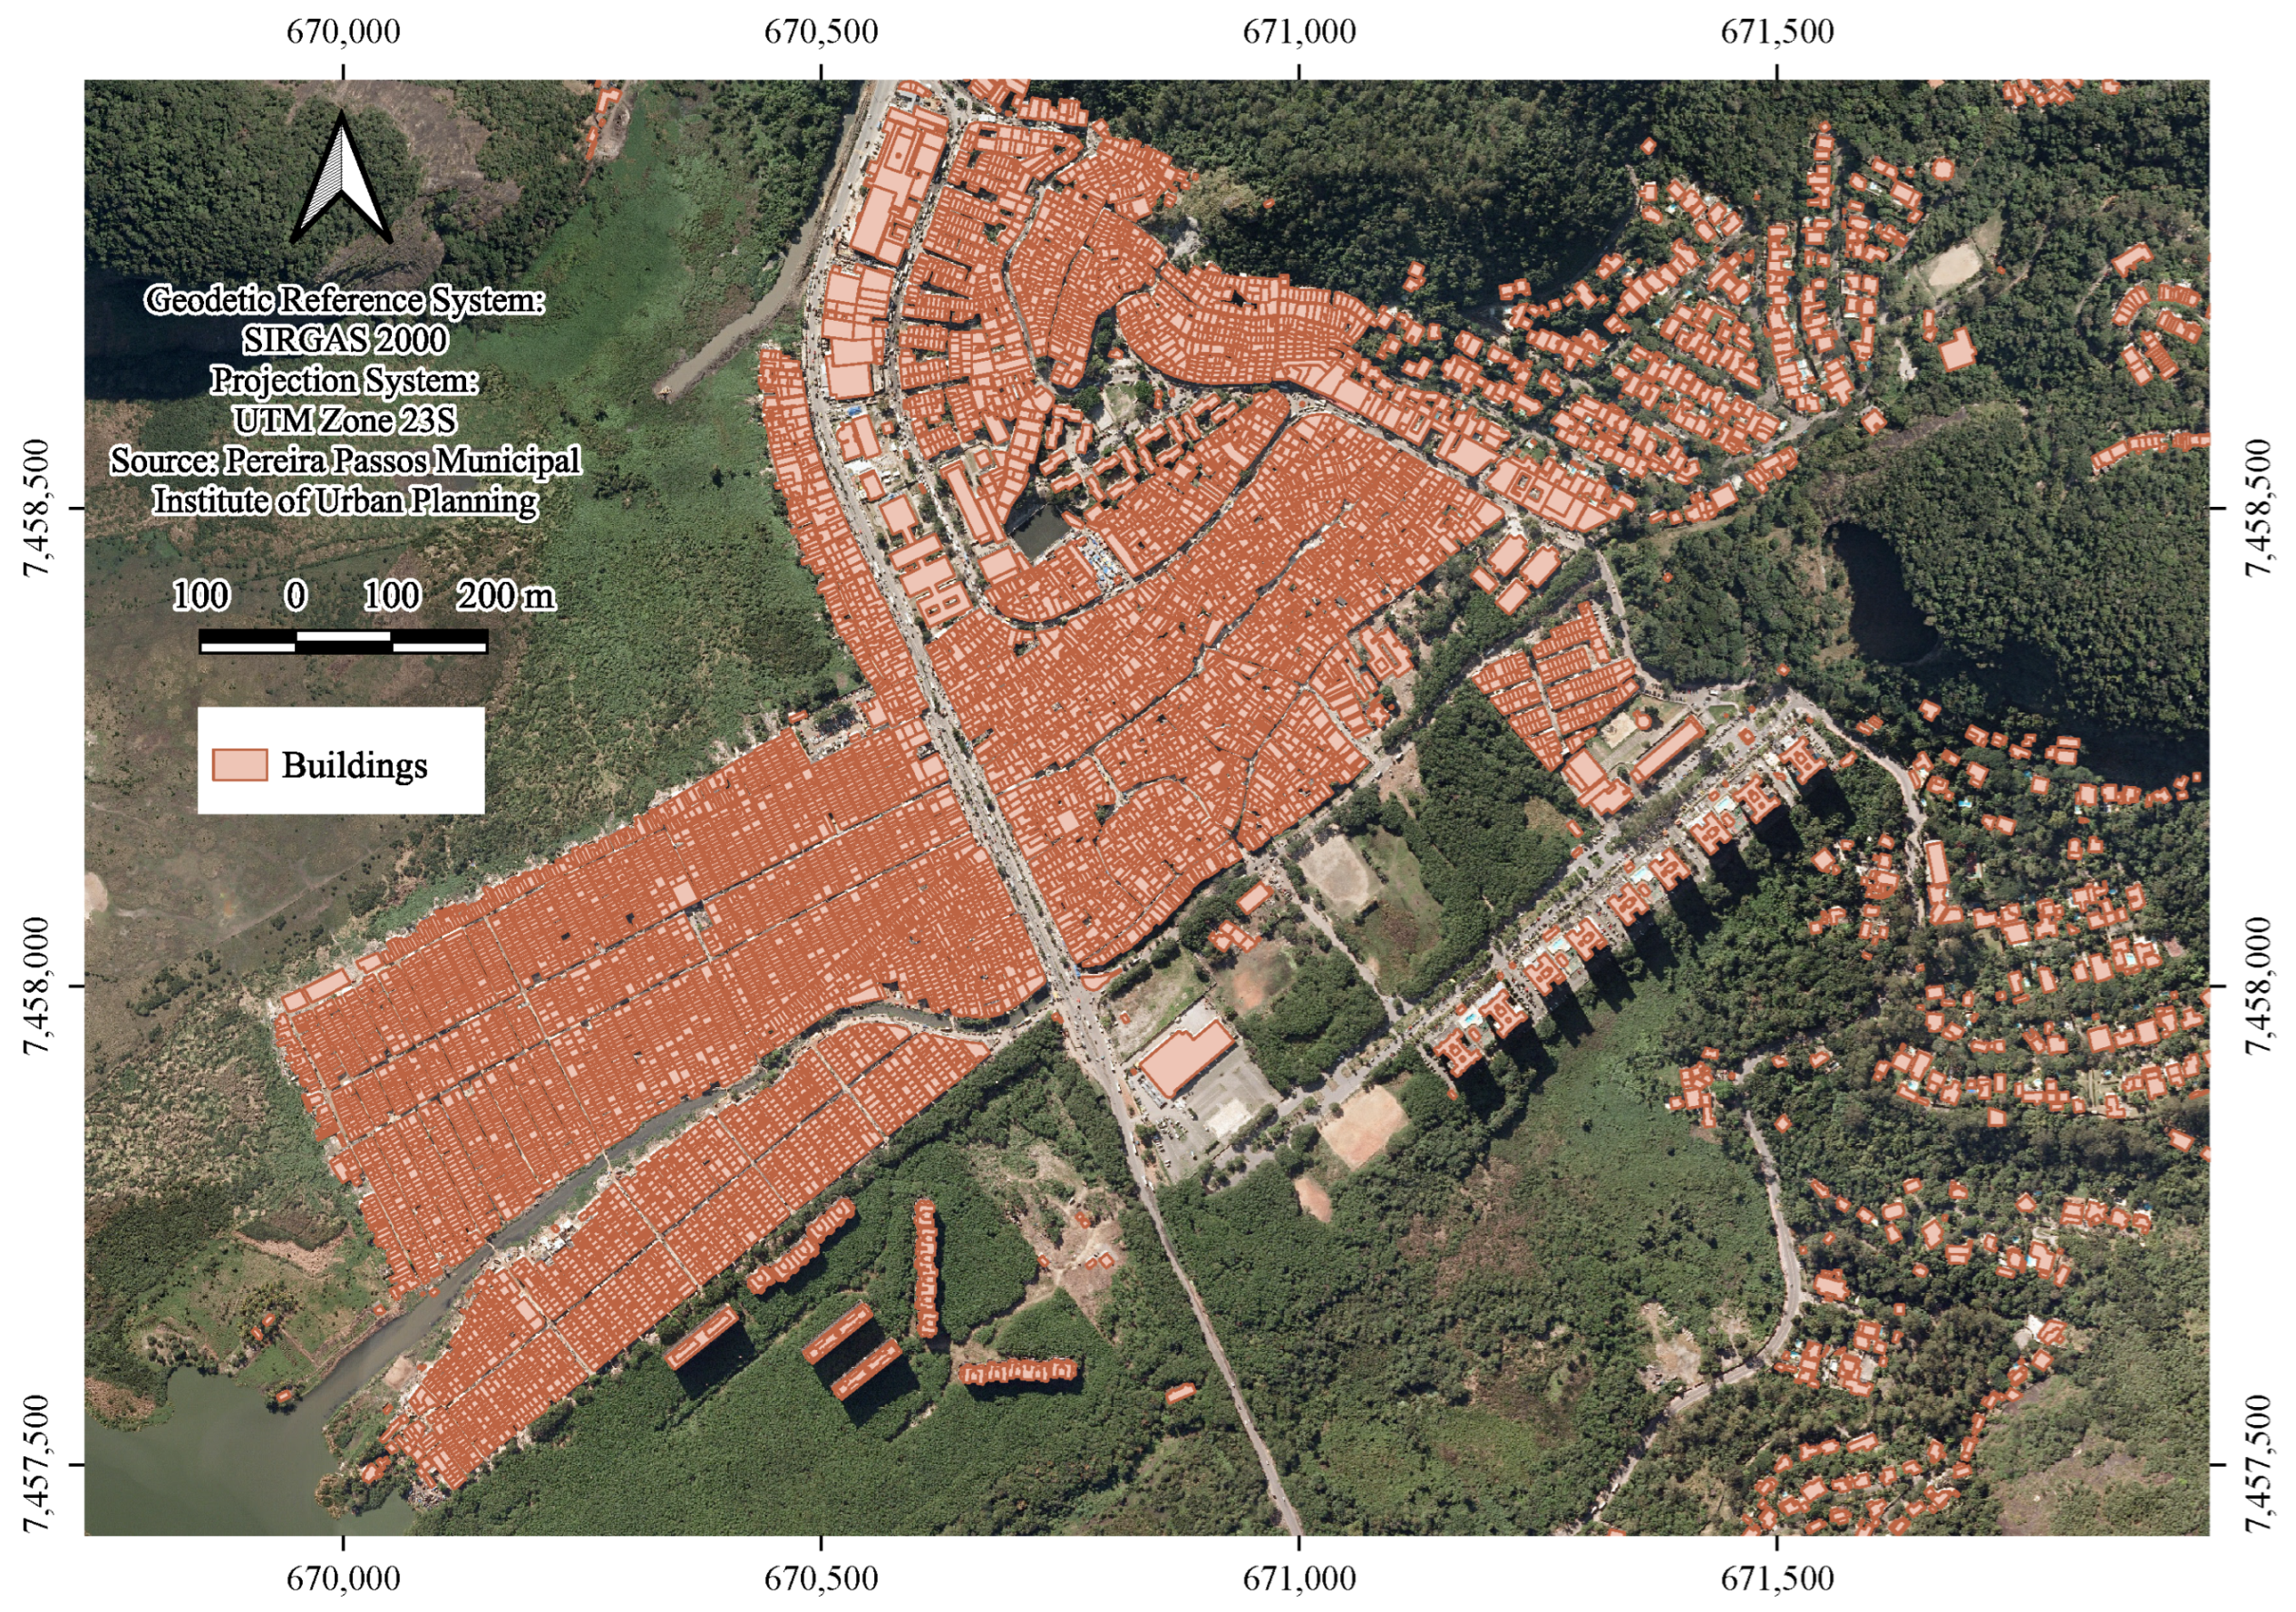
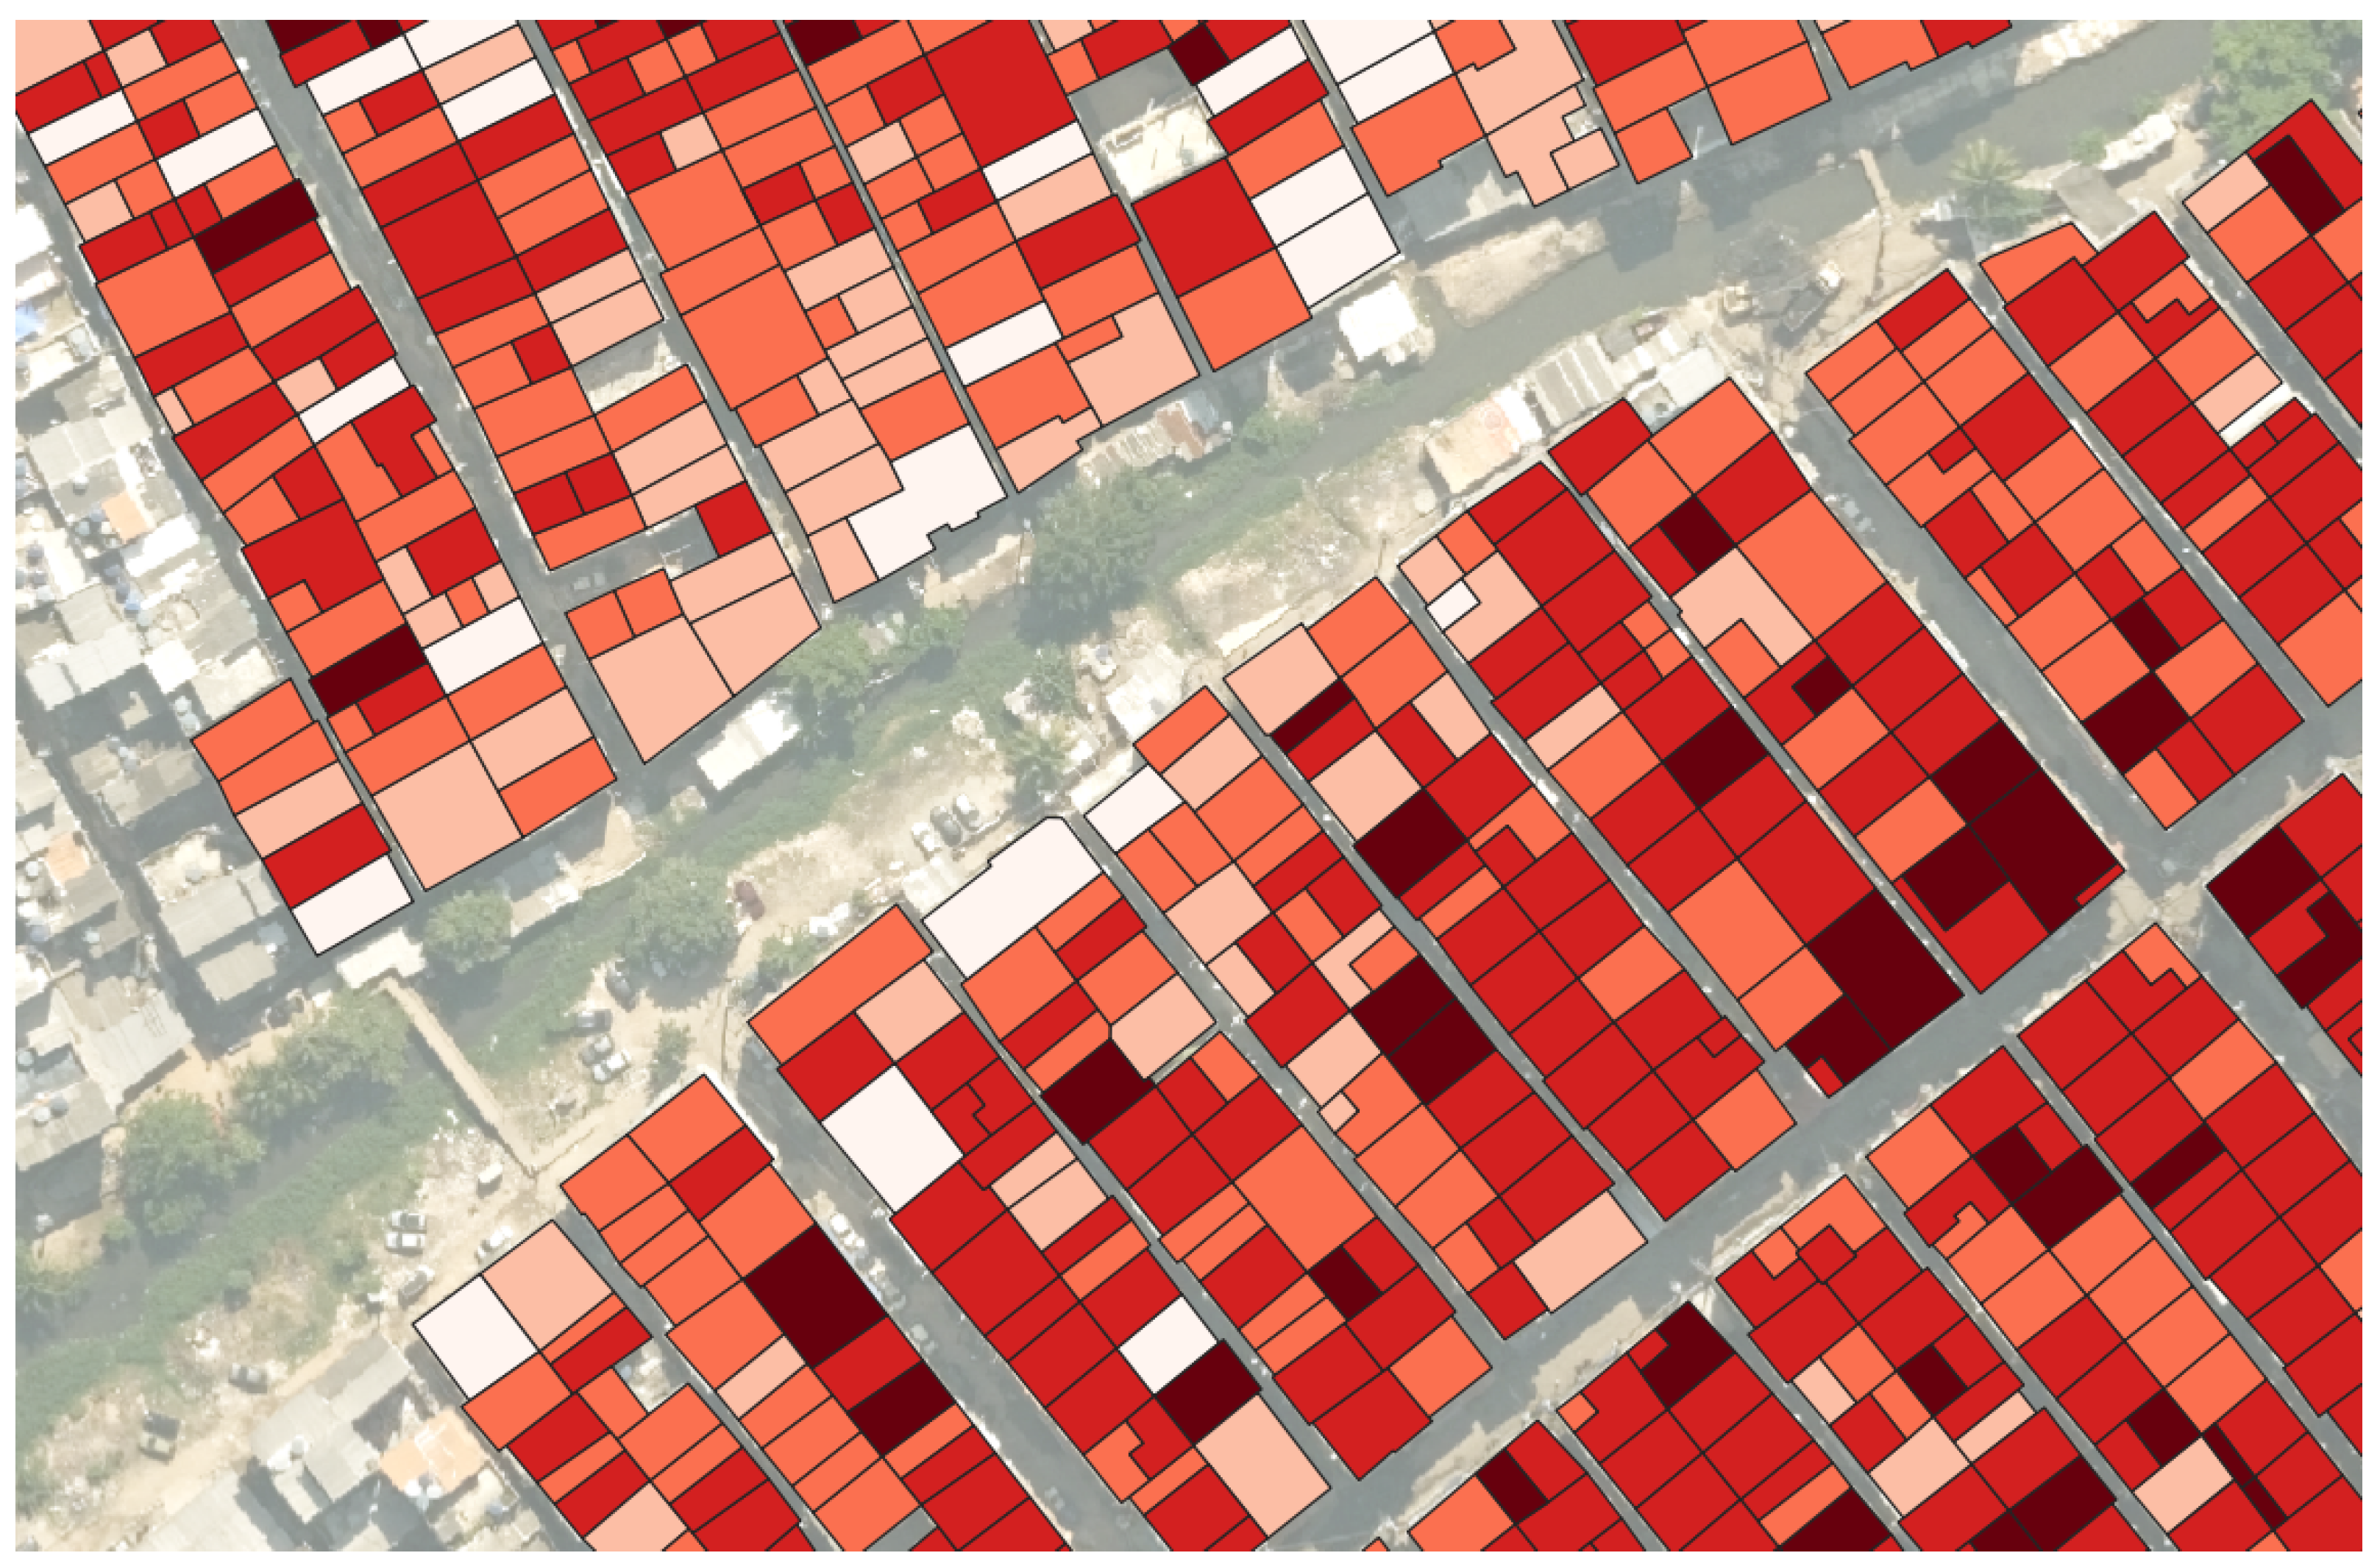
This study utilized the following vector-based geospatial data from the 2013 survey of Rio de Janeiro: building footprints—with altimetry (Figure 5) and hydrographic features, both derived from digital photogrammetric restitution at a 1:2000 scale. Additionally, orthoimages supported the vectorization of trees and vegetation, while a laser-scanned Digital Terrain Model (DTM) was incorporated to construct a 3D simulation model integrating buildings, vegetation, and rivers.
Figure 5.
Example of building footprints.
2.2.2. 2019 Aerophotogrammetric and LiDAR Aerial Surveys
These surveys were conducted between September and October 2019, to perform aerophotogrammetric mapping at a scale of 1:5000 for the municipality of Rio de Janeiro through a mosaic of true orthoimages (i.e., without parallax []), and digital elevation models and digital terrain models obtained by laser scanning. The aerophotogrammetric flight was conducted with a minimum longitudinal overlap of 80% (maximum tolerance of 3%) and a minimum lateral overlap of 60% (maximum tolerance of 3%), at altitudes allowing photographs with a minimum Ground Sample Distance (GSD) of 15 cm. The Carajá aircraft, registration PV-VDT, mentioned earlier, was used.
For capturing the photographs, the large-format aerial camera Vexcel Microsoft Ultracam-Eagle Prime was used, with an image acquisition frame of 23,010 × 14,790 pixels (340 MP), composed of 13 CCDs with a pixel resolution of 5.2 µm, enabling the capture of aerial images with a real resolution of up to 2 cm. This camera’s sensors capture images in 5 bands (PAN, R, G, B, and NIR) at 14 bits, allowing processing in panchromatic, color, and near-infrared. Its Forward Motion Compensation (FMC). is performed entirely electronically through the Time Delayed Integration (TDI) device.
For laser profiling, two aircraft were used: the Seneca II, registration PT-EUR, model 810c manufactured by Embraer, with an average cruising speed of 290 km/h, equipped with an autopilot, GNSS satellite tracker, navigation radar, and a flight autonomy of 4.1 h; and the rotary-wing aircraft (helicopter) Robinson 44 Raven 2, registration PR-CCK, with an average cruising speed of 215 km/h. The laser survey, with a spatial resolution of 8 points/m2 and a 20% overlap between flight strips, was conducted with the Laser Trimble Harrier 68i sensor, manufactured by Trimble Germany GmbH (Raunheim, Germany). This sensor operates at a frequency of up to 400 kHz, with a maximum FOV angle of 60°, the ability to record up to 4 returns per emitted pulse, an 8-bit distinction of the return signal intensity for each return, and a maximum operating altitude of 1600 m. It is accompanied by a recording unit with a capacity of 500 GB, equivalent to 10 h of operation at the sensor’s maximum frequency [].
The study utilized orthoimagery, Digital Terrain Model (DTM), and Digital Surface Model (DSM) data from the 2019 Rio de Janeiro survey to update the existing vector database for microclimate simulation purposes. This update primarily enhanced the model’s building height attributes, among other features.
2.2.3. 2024 Aerophotogrammetric and LiDAR Aerial Surveys
These surveys were conducted in March 2024, to perform aerophotogrammetric mapping at a scale of 1:5000 for the municipality of Rio de Janeiro through a mosaic of true orthoimages, and digital elevation models and digital terrain models obtained by laser scanning. The aerophotogrammetric flight was conducted with a minimum longitudinal overlap of 80% (maximum tolerance of 3%) and a minimum lateral overlap of 60% (maximum tolerance of 3%), at altitudes allowing photographs with a minimum GSD of 15 cm. The same Carajá aircraft, registration PV-VDT, mentioned earlier, was used.
For capturing the photographs, the large-format aerial camera Ultracam Osprey 4.1 (Vexcel Imaging, Graz, Austria) was used, with an image acquisition frame of 20,544 × 14,016 pixels (100 MP), arranged by Complementary Metal Oxide Semiconductor (CMOS) sensors with a geometric resolution of 3.76 µm, enabling the capture of aerial images with a real resolution of up to 2 cm. This camera’s sensors capture images in 4 bands (R, G, B, and NIR) at 14 bits, allowing processing in color and infrared []. The motion compensation system is performed entirely electronically through the TDI device.
Laser scanning was conducted simultaneously with the aerophotogrammetric survey, using the same aircraft. For this, the Galaxy Prime+ sensor was used, which operates at a frequency of up to 1000 kHz (1,000,000 pulses per second), with a maximum FOV angle of 60°, the ability to record up to 8 returns per emitted pulse, a 12-bit distinction of the return signal intensity for each return, and a maximum operating altitude of 6000 m. It is accompanied by a recording unit with a capacity of 2 TB, equivalent to 20 h of operation at the sensor’s maximum frequency [].
The 2024 aerial survey data, including orthoimagery, DTM, and DSM, were similarly used to update the vector databases for microclimate simulations. This update refined the model’s features, with particular focus on detecting building height changes.
2.2.4. Positional Accuracy of Vector Features
The geographic data from the 2013 survey meets Class A standards at 1:2000 scale according to the Cartographic Accuracy Standard for Digital Cartographic Products (PEC-PCD—Padrão de Exatidão Cartográfica de Produtos Cartográficos Digitais), with at least 90% of points achieving a Mean Square Error (MSE) of 34 cm in planimetry and 17 cm in altimetry. In contrast, the 2019 and 2024 orthoimagery and surface models conform to Class B standards at the same scale, with corresponding MSE values of 85 cm in planimetry and 34 cm in altimetry. Consequently, all vectorized or updated data derived from these geodatabases inherit these slightly reduced accuracy standards, while the overall accuracy remains acceptable, potential (albeit rare) systematic errors merit consideration—particularly in cases where opposing building displacements of 85 cm could create cartographic representations of alleys appearing 170 cm narrower than reality, an inaccuracy that could ultimately influence microclimate simulation results, but which is entirely derived from the limitations of the data used.
2.2.5. Meteorological Data
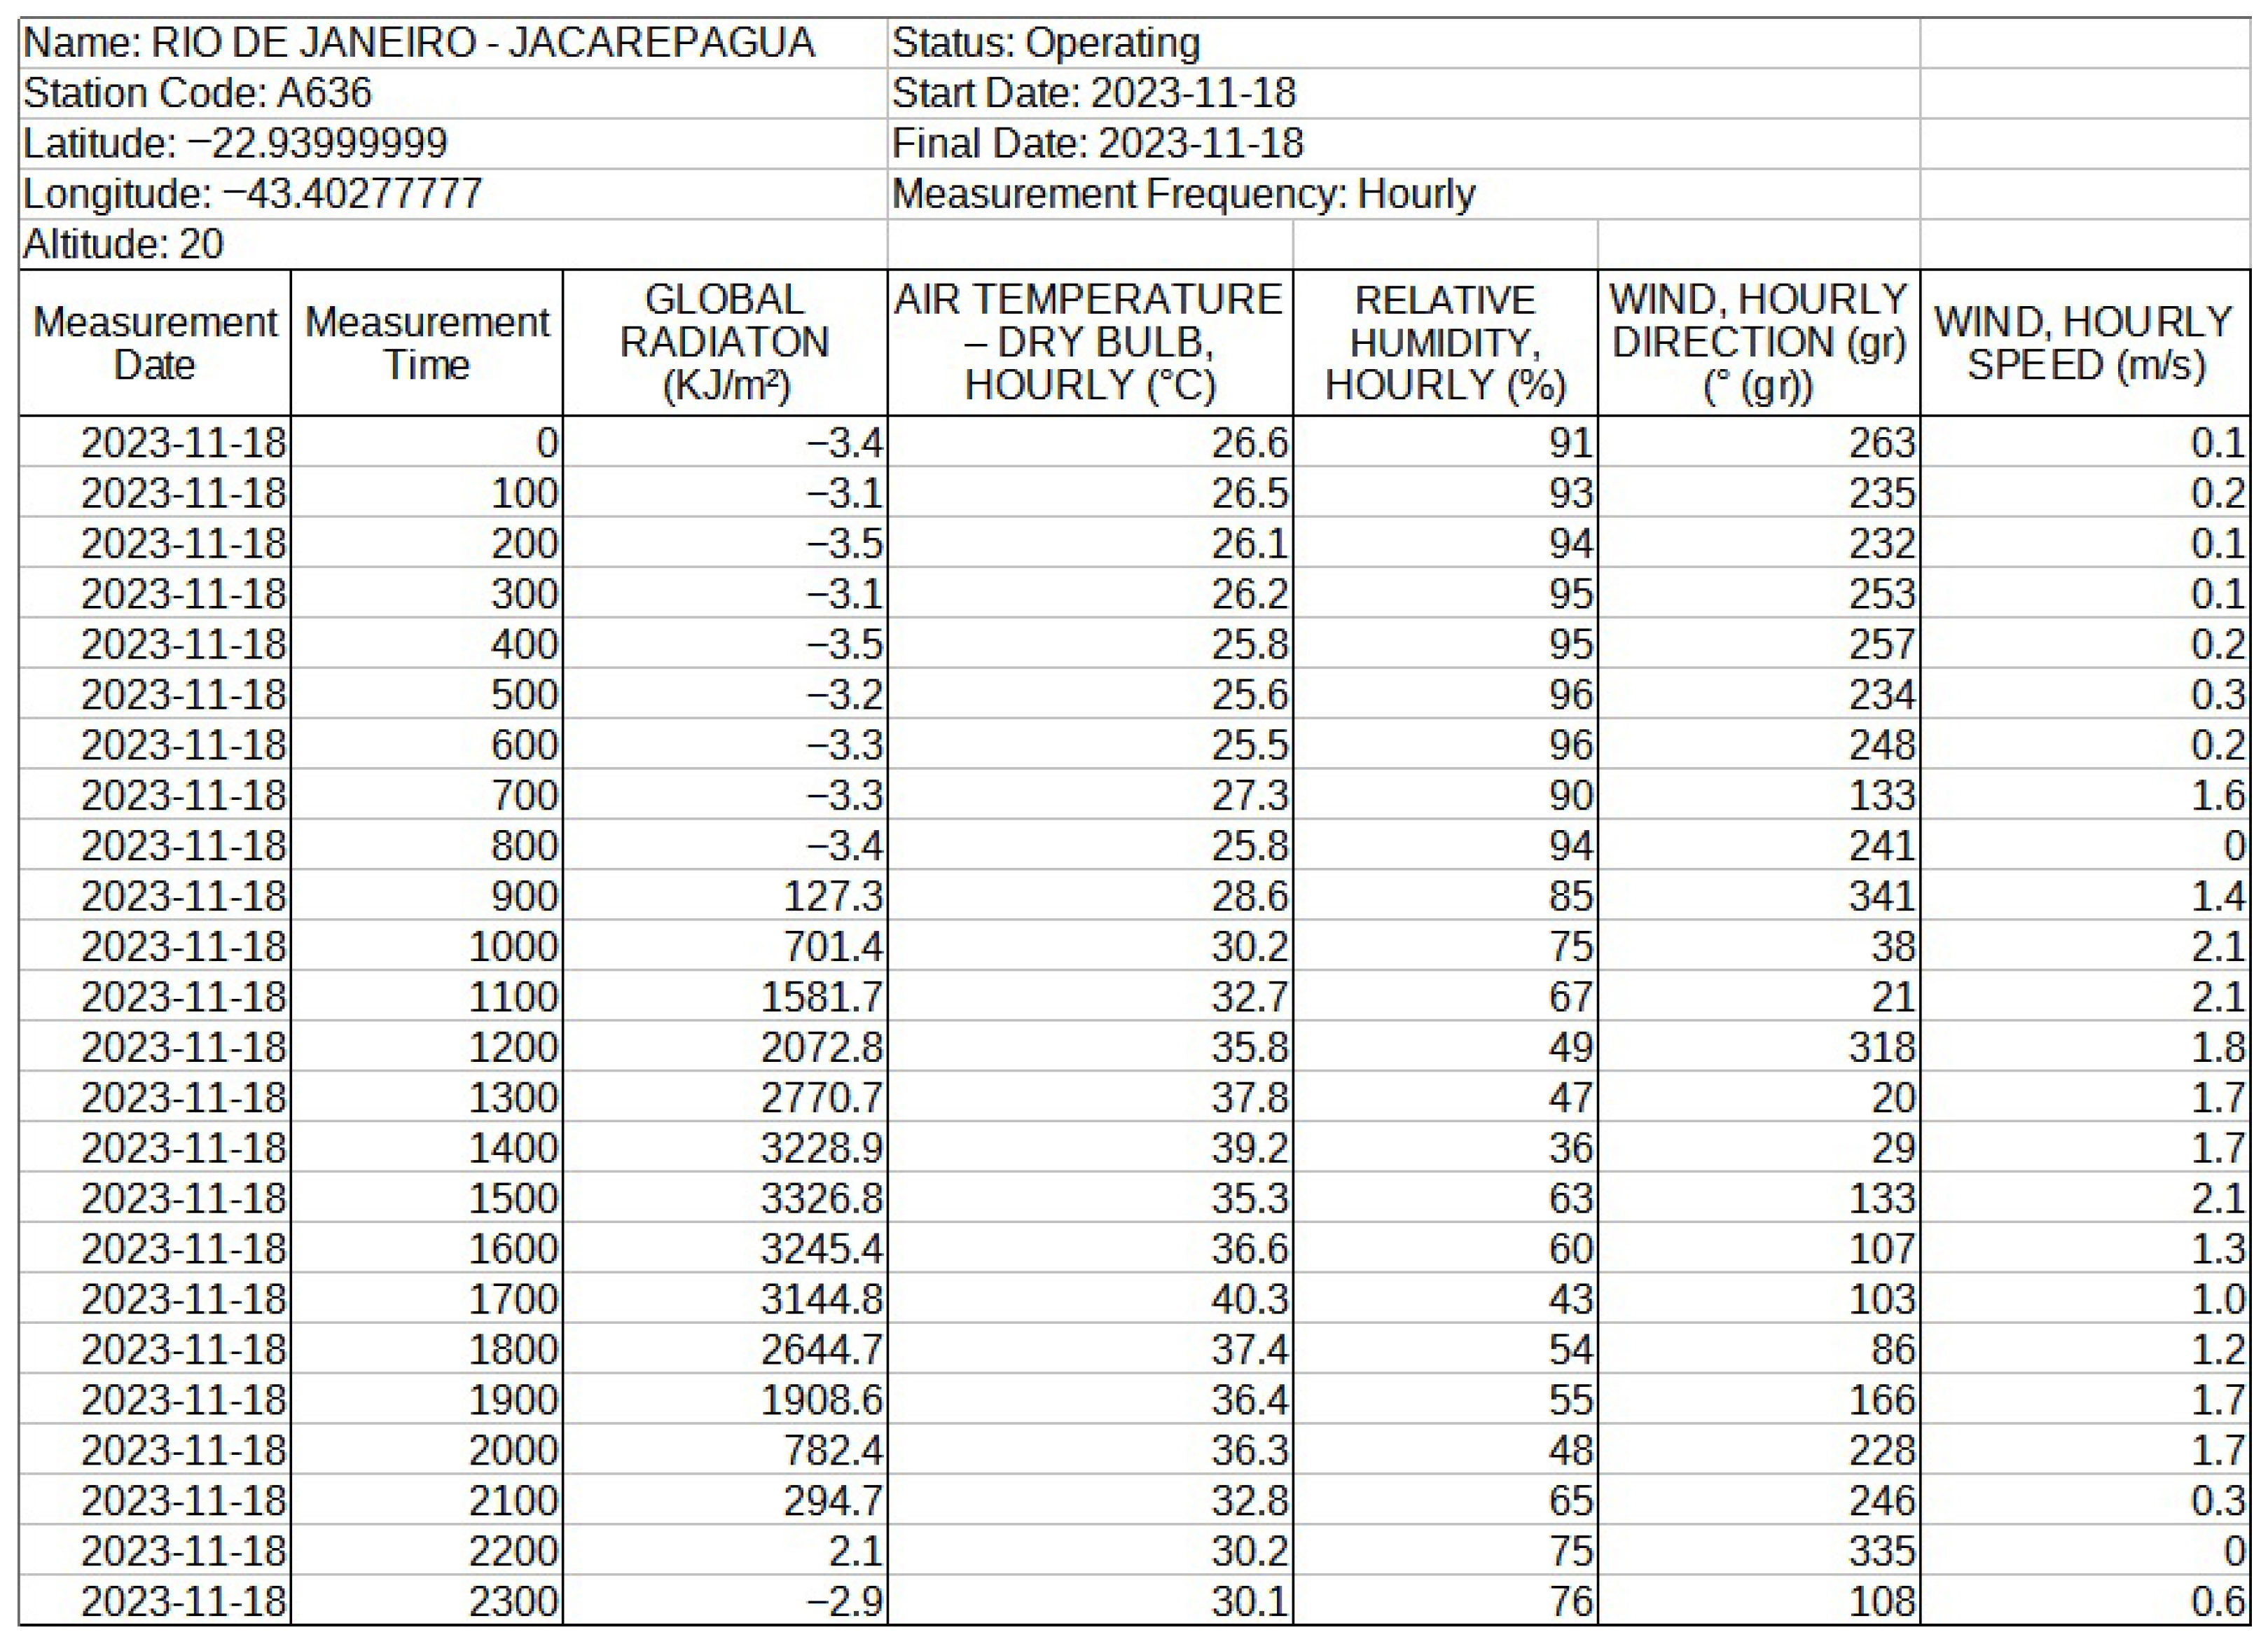
Alphanumeric meteorological data containing date, time, air temperature, relative humidity, wind direction and speed, and solar radiation, obtained from the Meteorological Database of the National Institute of Meteorology (INMET—Instituto Nacional de Meteorologia), an agency of the Ministry of Agriculture and Livestock responsible for promoting and coordinating activities for the production of timely and relevant meteorological information aimed at risk mitigation and the sustainable development of the agricultural sector, in addition to monitoring and forecasting weather and climate []. The meteorological data were sourced from the “Rio de Janeiro—Jacarepaguá (A636)” station, located approximately 7.9 km from the centroid of the Rio das Pedras favela. This was the closest INMET station to the study area, providing up-to-date hourly measurements (Figure 6). It was established on 8 September 2017, and is at a latitude of 22°56′24″ S, a longitude of 43°24′10″ E, and an altitude of approximately 20 m.
Figure 6.
Screenshot of INMET’s hourly meteorological data spreadsheet for Jacarepaguá (A636).
2.2.6. Software Used
For updating vector databases, both QGIS 3.4 Bratislava and ArcGIS Pro 3.3 software were utilized. QGIS is a free, open-source Geographic Information System (GIS) distributed under the GNU General Public License (GPL), permitting unrestricted use, modification, and distribution. The software enables viewing, editing, analysis, and management of geographic data. This study employed version 3.34, the latest stable release at the time of research []. In contrast, ArcGIS Pro is proprietary software developed by Esri—Environmental Systems Research Institute, Inc. (Redlands, CA, USA), requiring paid licensing either individually or through the ArcGIS platform subscription []. ArcGIS Pro 3.4 was used in this research to generate building models for the three analyzed periods, as well as to compute the differences between these models.
Microclimatic simulations were conducted using ENVI-met 5.6.1, a scientifically validated [,] three-dimensional microclimate modeling system developed by ENVI-met GmbH (Essen, Germany). This software analyzes sustainable urban environments by simulating interactions between four core systems: soil, vegetation, atmosphere, and buildings, with all data incorporated through input files []. ENVI-met’s distinctive approach treats the urban environment as an integrated system, modeling complex processes like airflow and solar radiation holistically. The platform maintains a relational database of material properties (including thickness, roughness, and thermal conductivity), with each material assigned a unique six-digit alphanumeric identifier [].
The research employed QGIS’s “Geodata to ENVI-met” plugin, which facilitates seamless integration between both platforms. This tool enables complete simulation workflow management within QGIS, including data preparation, execution, and results evaluation. Specifically, the plugin converts GIS data into ENVI-met input files, generates model configuration files, and imports simulation results back into QGIS for visualization and analysis.
2.3. Methodology
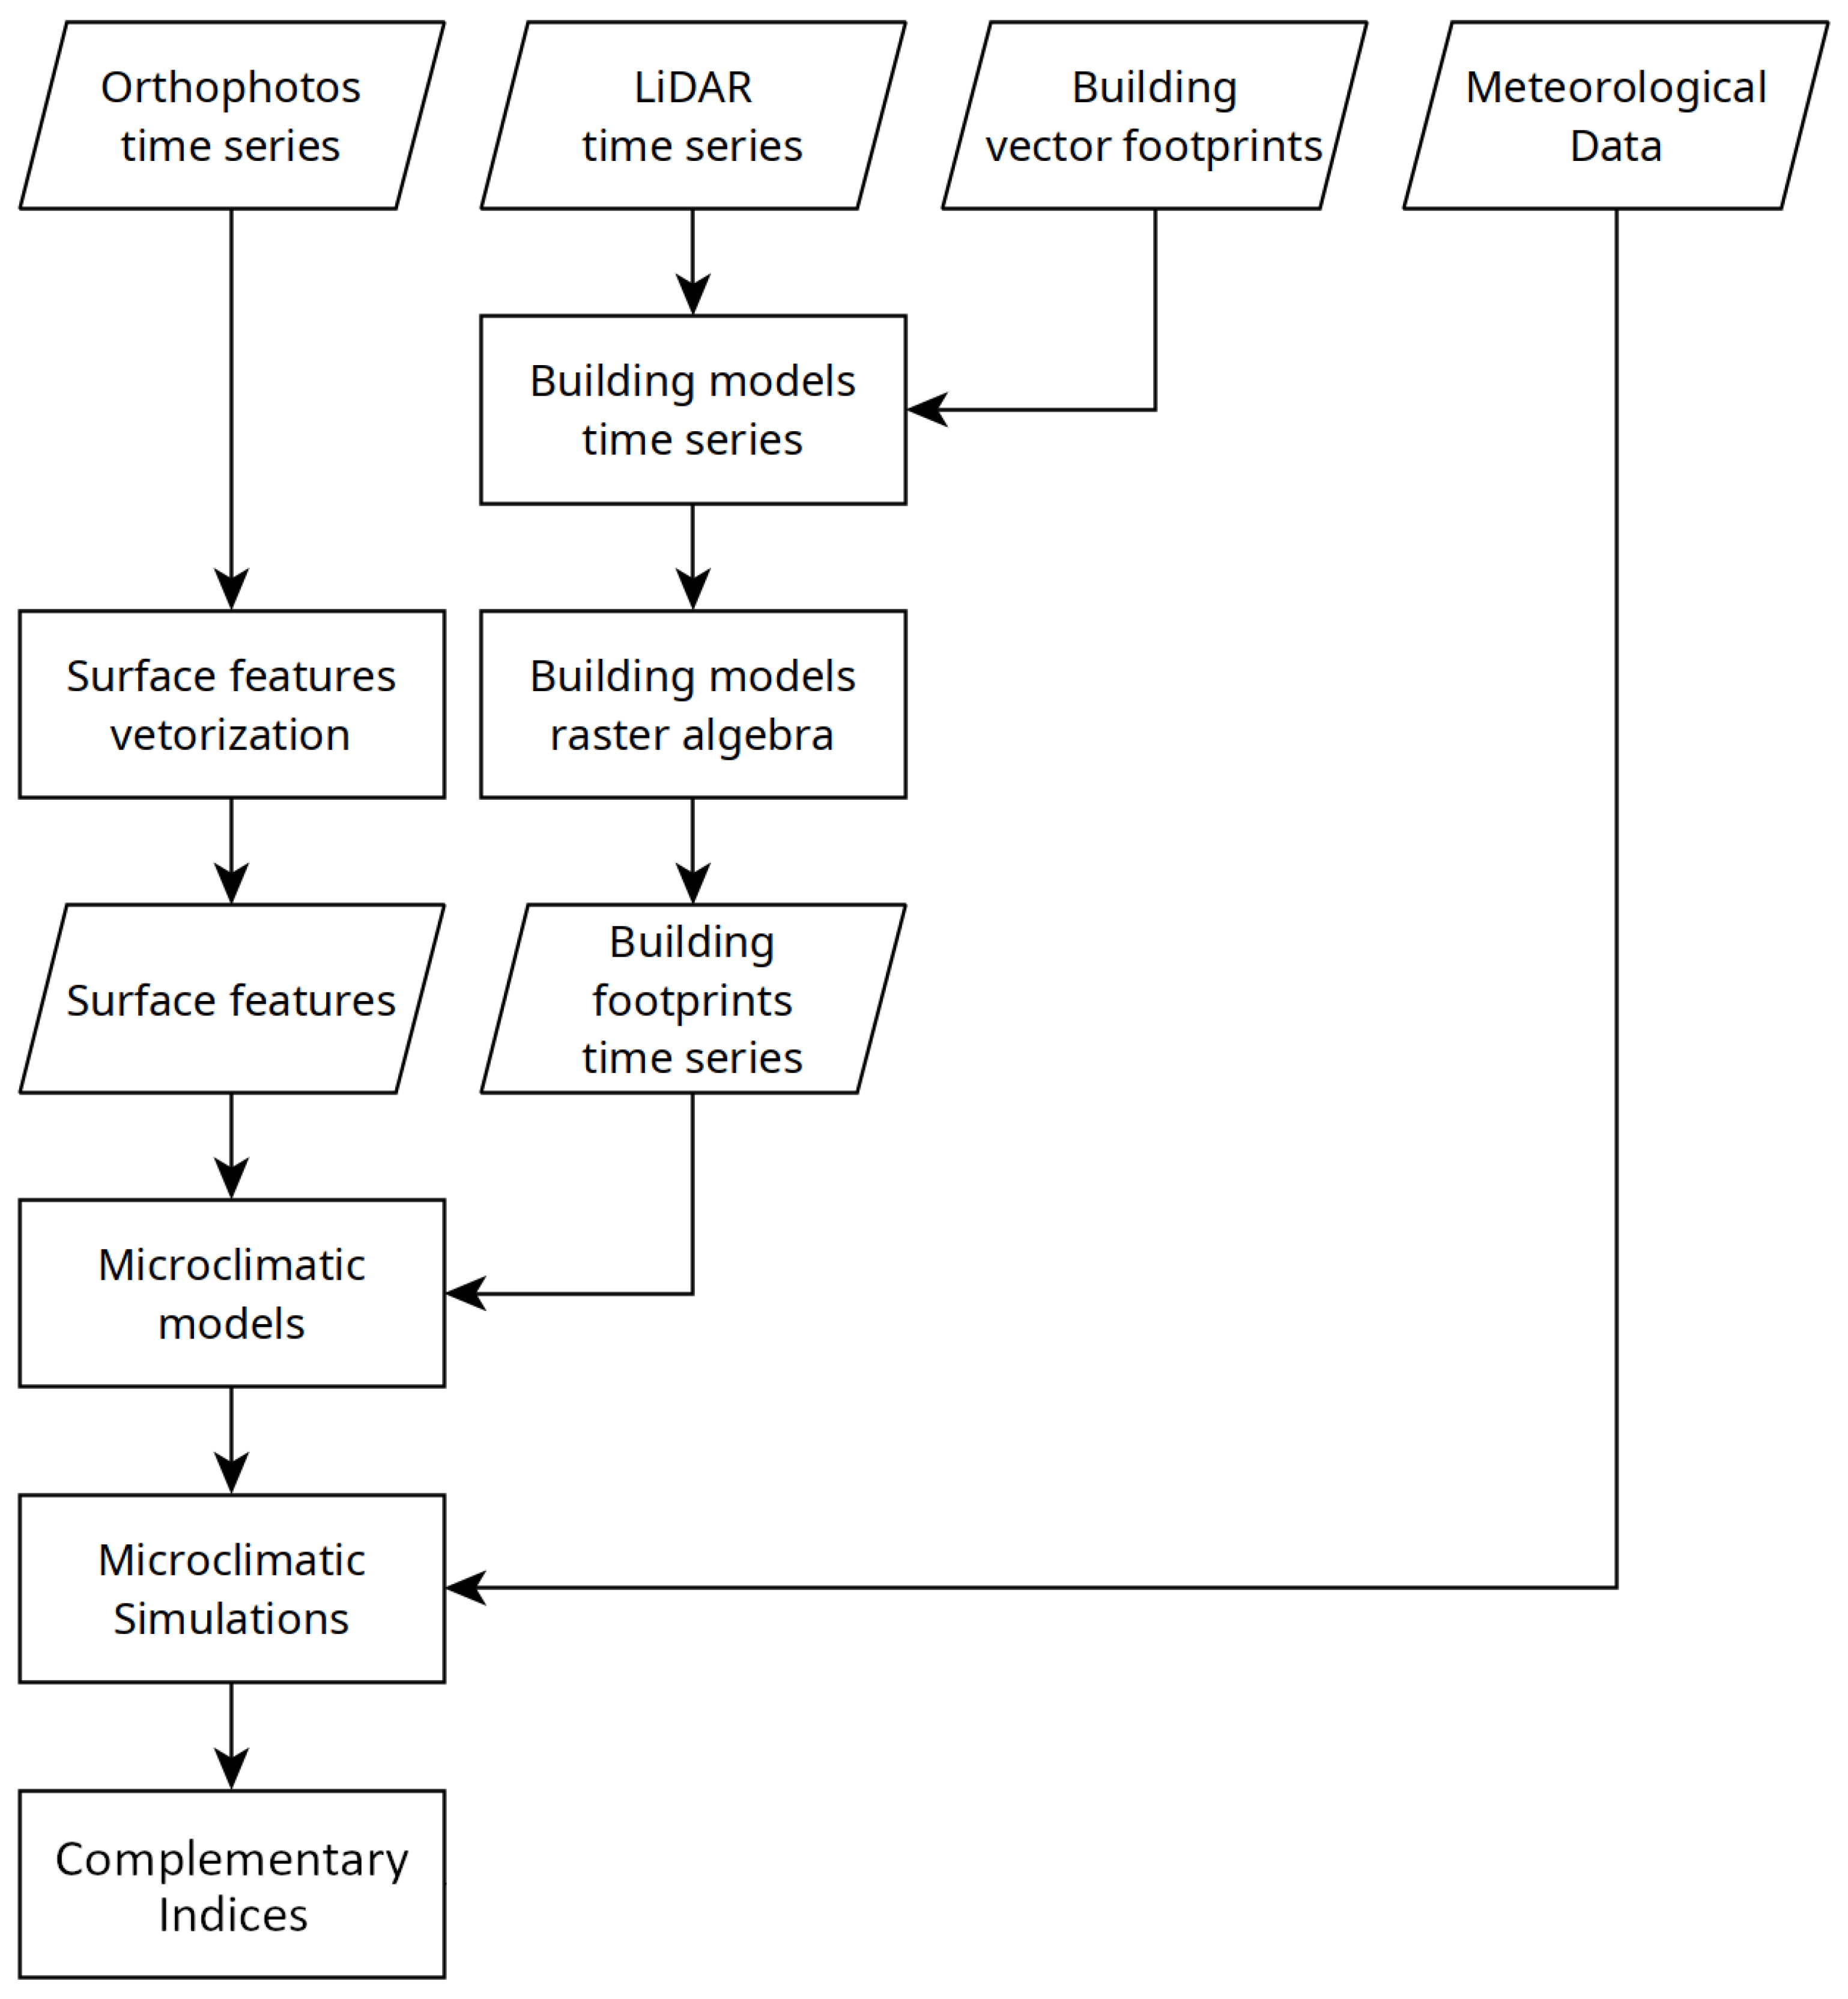
According to the objective of this work (evaluation of the influence of urban morphology on the microclimate of favelas with strong vertical growth), INMET’s climatic data from a fixed date were used for all scenarios. In contrast, morphological data, obtained from the aerophotogrammetric and LiDAR aerial surveys, referring to three distinct periods were employed: 2013, 2019, and 2024, corresponding to the most recent mappings conducted in the city of Rio de Janeiro, aiming to analyze the evolution of the most recent construction dynamics. The date chosen for the input climatic data were 18 November 2023, as it was the hottest day recorded in the city of Rio de Janeiro until the end of 2024, with the aim of verifying the impact of morphology under conditions of extreme heat and thermal discomfort. The methodology followed a systematic approach in the temporal analysis of the vertical growth of the study area (Figure 7), involving the following steps:
Figure 7.
Data used and methodological processing steps for the microclimatic simulations.
2.3.1. Study Area
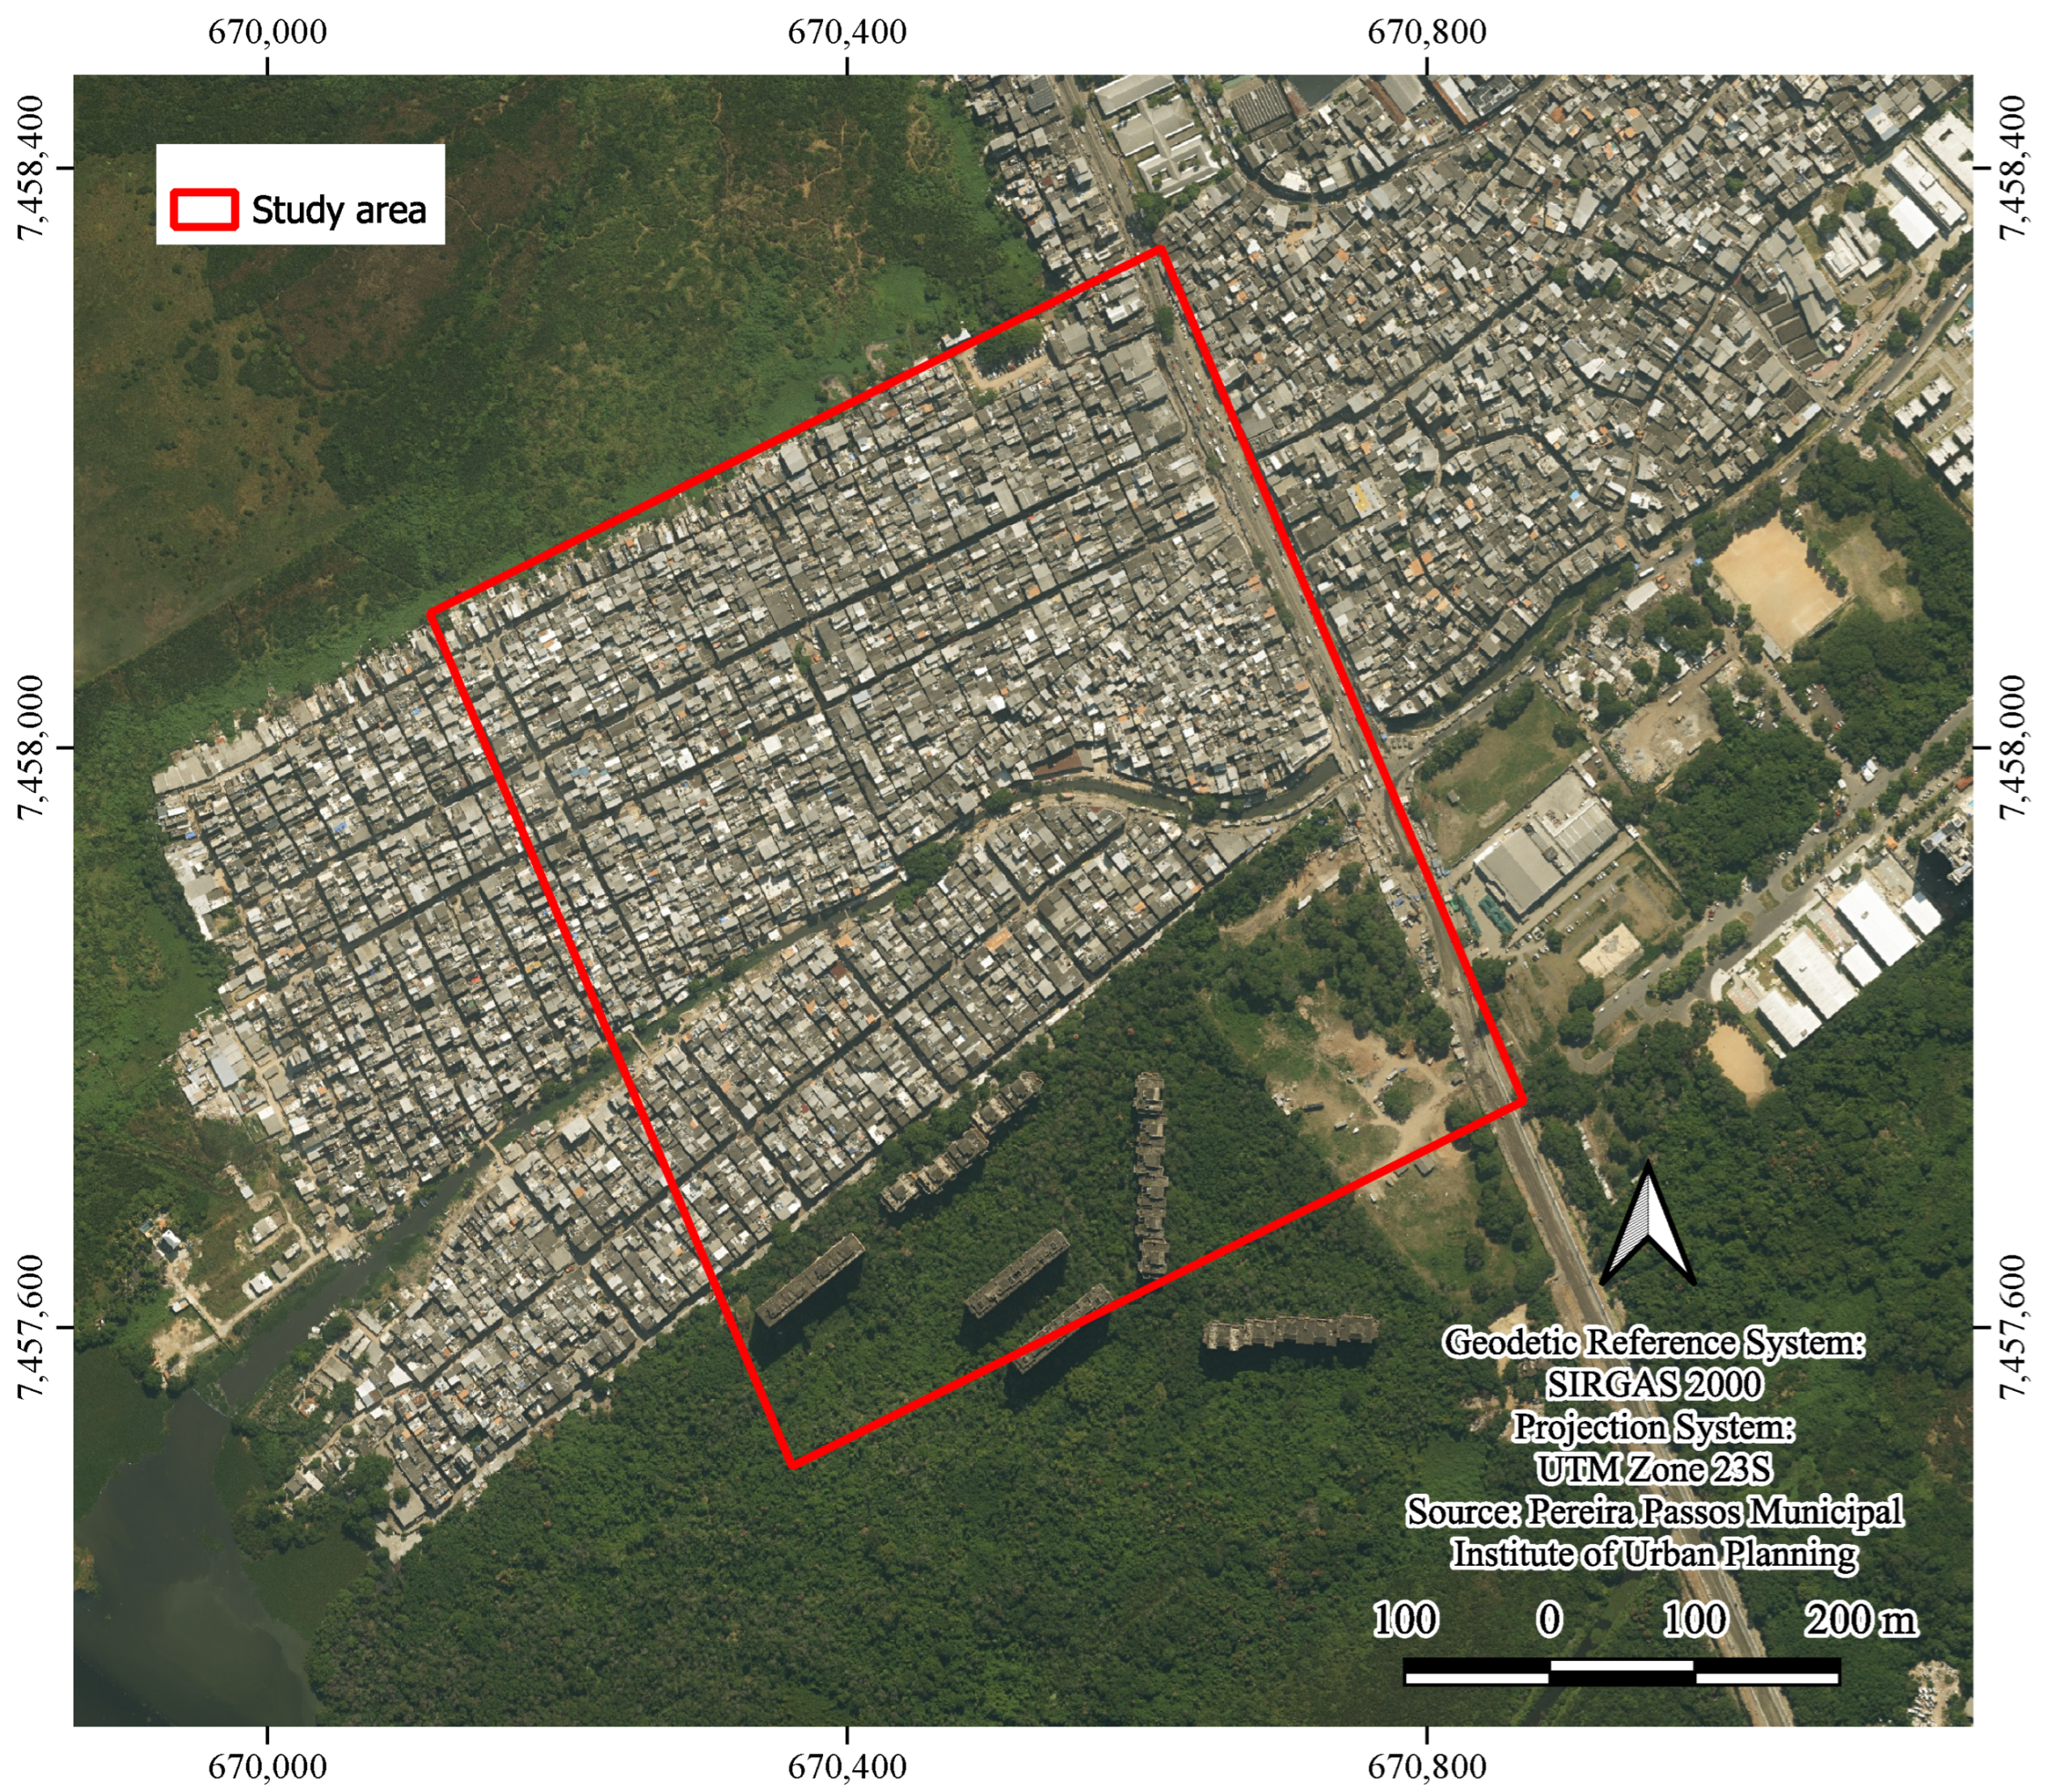
ENVI-met requires significant computational capacity to execute microclimatic simulations, as it analyzes different factors in an integrated manner []. The simulations were run on a Windows 11 PRO with an Intel Core i9-14900 processor with 24 cores up to 5.6 GHz, 64 GB of DDR5 5200MHz memory, and an NVIDIA RTX 4060 8 GB graphics card. Due to computational limitations, it was necessary to delimit the study area to a region of approximately 564 m × 639 m (Figure 8). The delimited area covers the entire Areal II locality, as well as part of Areal I and Areinha (see Figure 3 for reference), and its selection was based on being the region identified as the most delicate in the favela, where the highest number of ground sinkings and building collapses were reported. Additionally, the region borders the abandoned area of the Delfin Imobiliária Residential Complex, making the delimitation interesting due to the possibility of presenting a gradient in results between the favela and the vegetated area of the derelict condominium.
Figure 8.
Study area.
2.3.2. Generation of Building Models for 2013, 2019, and 2024
For 2013, the synthetic model combined: (1) a LiDAR-derived Digital Terrain Model with 2 points/m2 spatial resolution; and (2) building polygons with z-values representing roof altitudes. The resulting composite raster integrated building elevations from the restituted polygons with ground elevations from the DTM (Figure 9). Note that this product differs from a true Digital Surface Model, as it excludes non-building surface features, but serves as a baseline for comparing subsequent LiDAR surveys with photogrammetrically derived data.
Figure 9.
Generation of the 2013 synthetic elevation model.
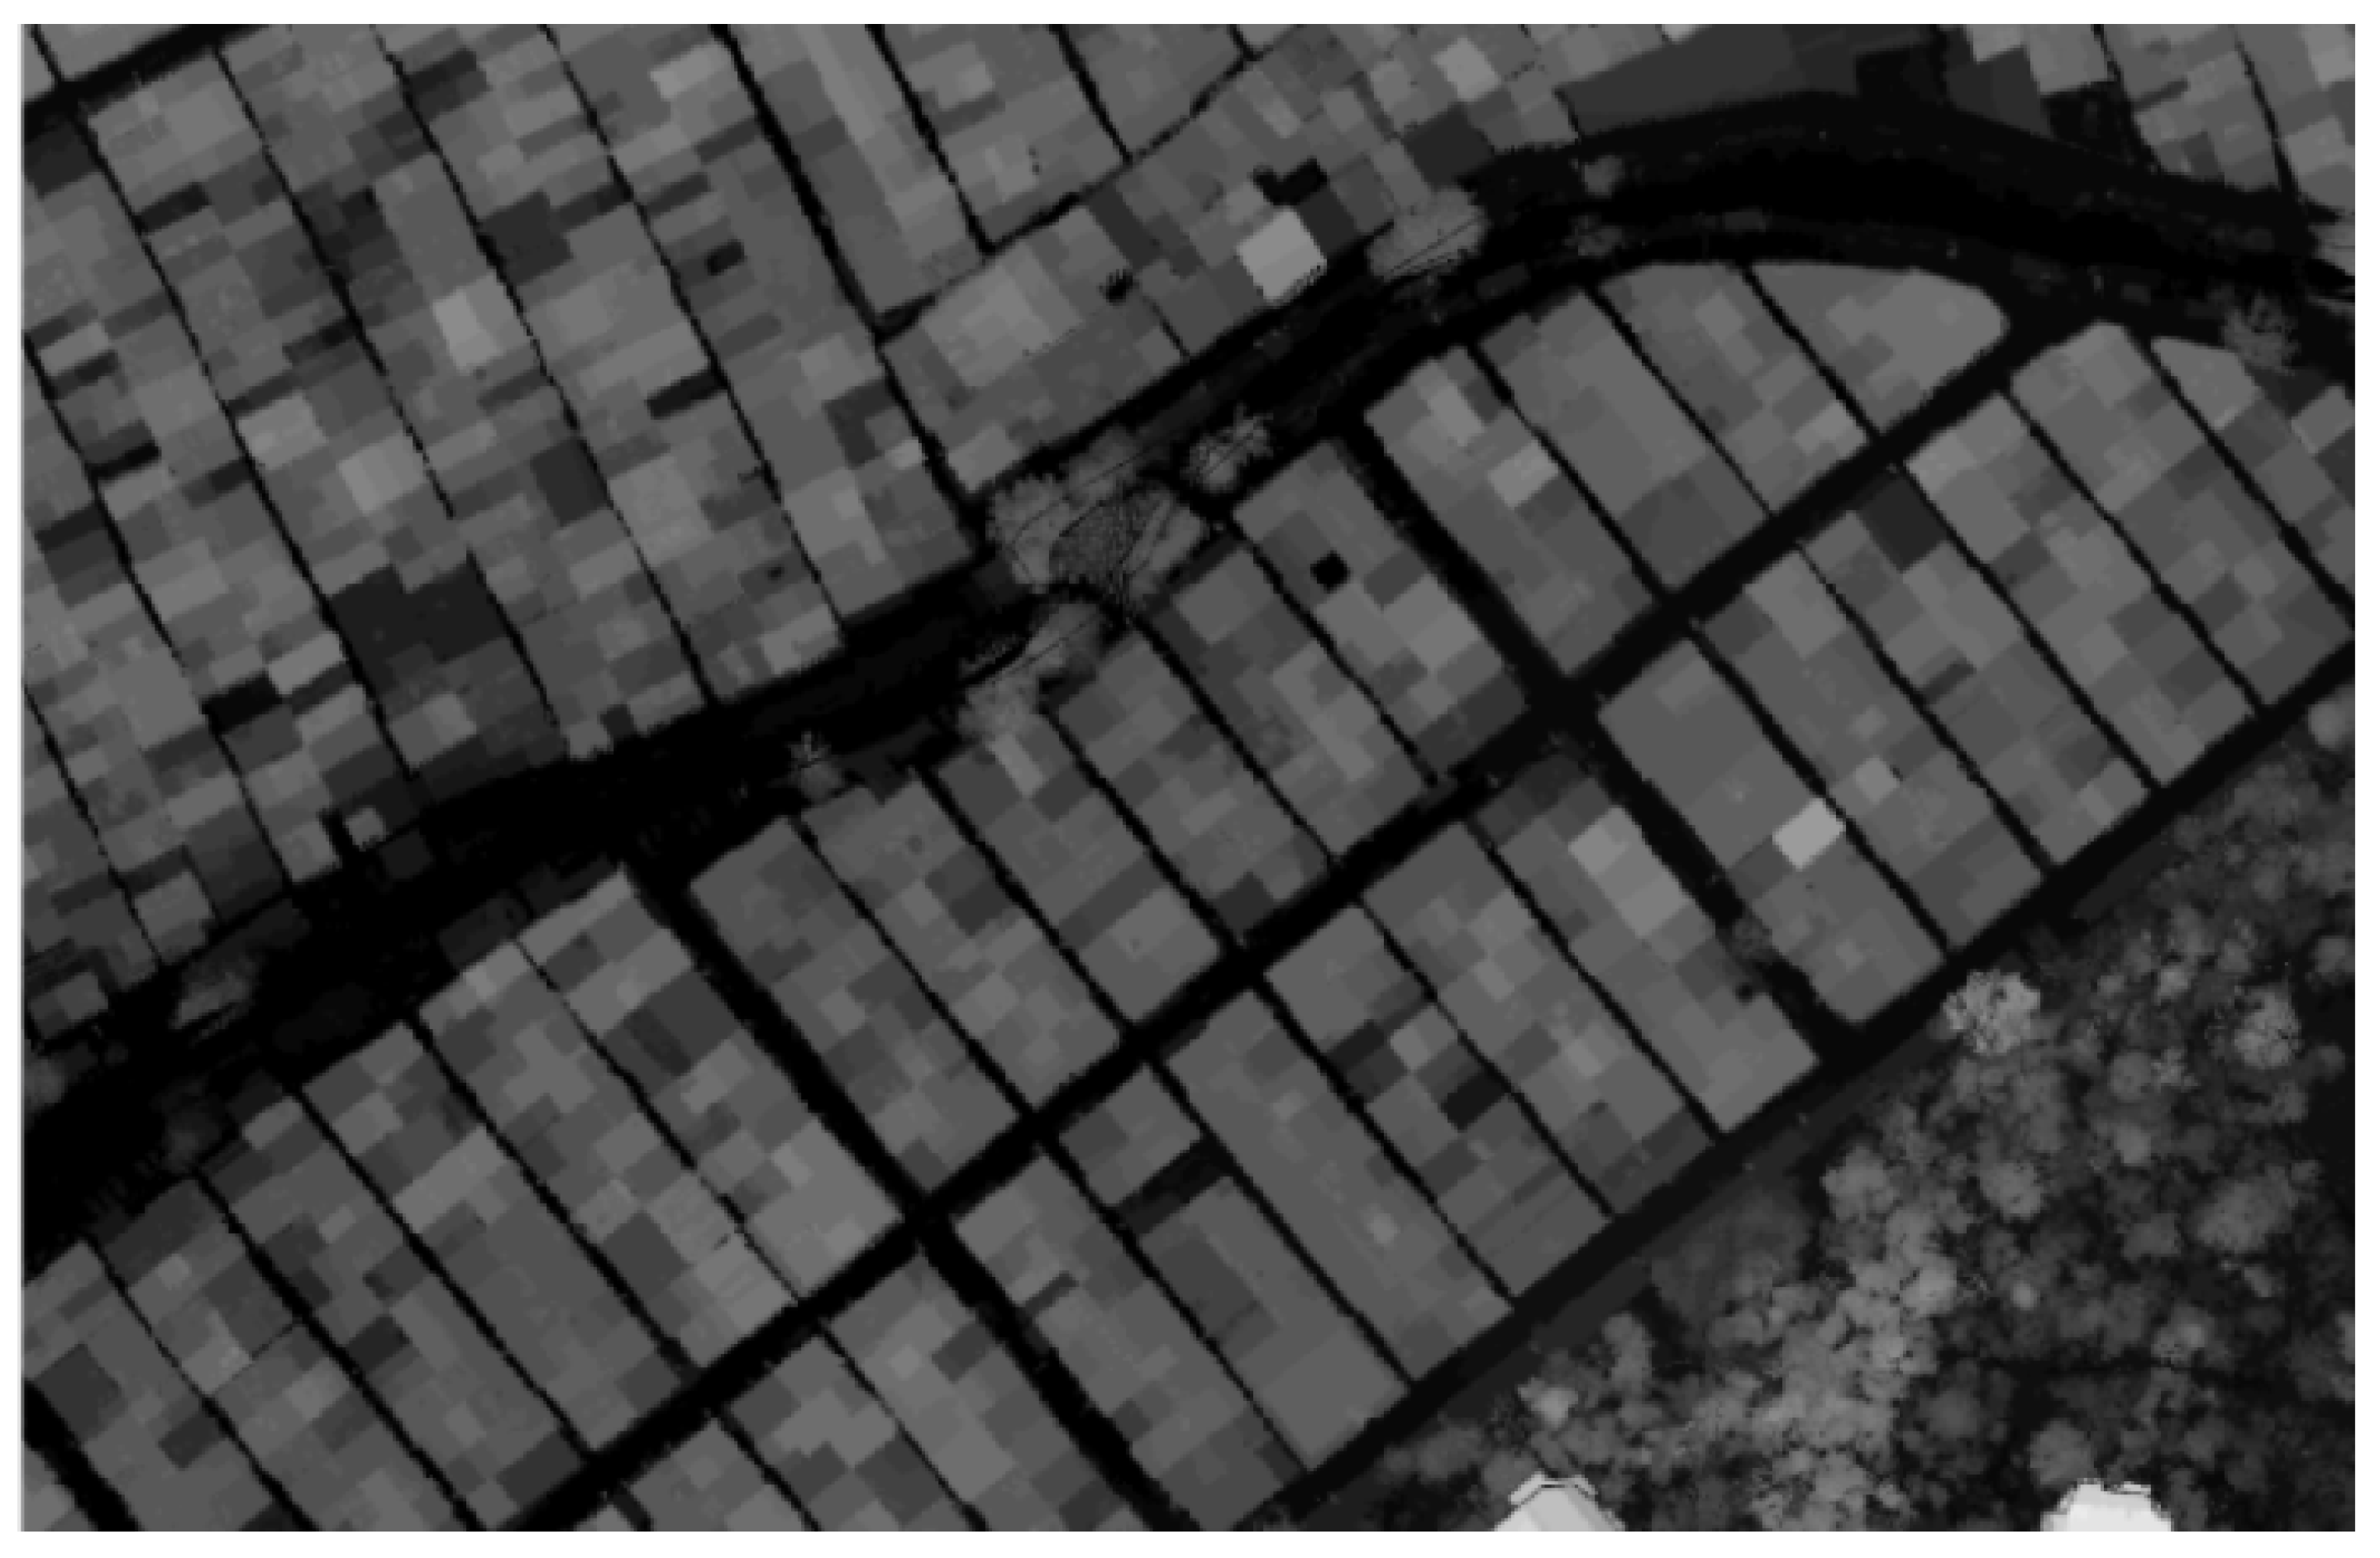
For 2019 and 2024, raster files were extracted from LAS point clouds using ArcGIS Pro’s “LAS Dataset to Raster” tool, which automatically determines spatial resolution based on point spacing. This produced two Digital Surface Models (DSMs)—one per survey year—resampled to 0.5 m resolution for computational efficiency (Figure 10).
Figure 10.
Example of Digital Surface Model adopted for 2019 (the 2024 model has a similar look and feel).
2.3.3. Model Subtraction
Subsequently, an operation called “raster algebra” was performed, subtracting pixel by pixel between the Digital Surface Models, using ArcGIS’ “Raster Calculator” tool. First, the 2019 DSM was subtracted by the 2013 synthetic model, and then the 2024 DSM was subtracted by the 2019 DSM. This model subtraction aims to identify and quantify the vertical changes in constructions between the defined periods.
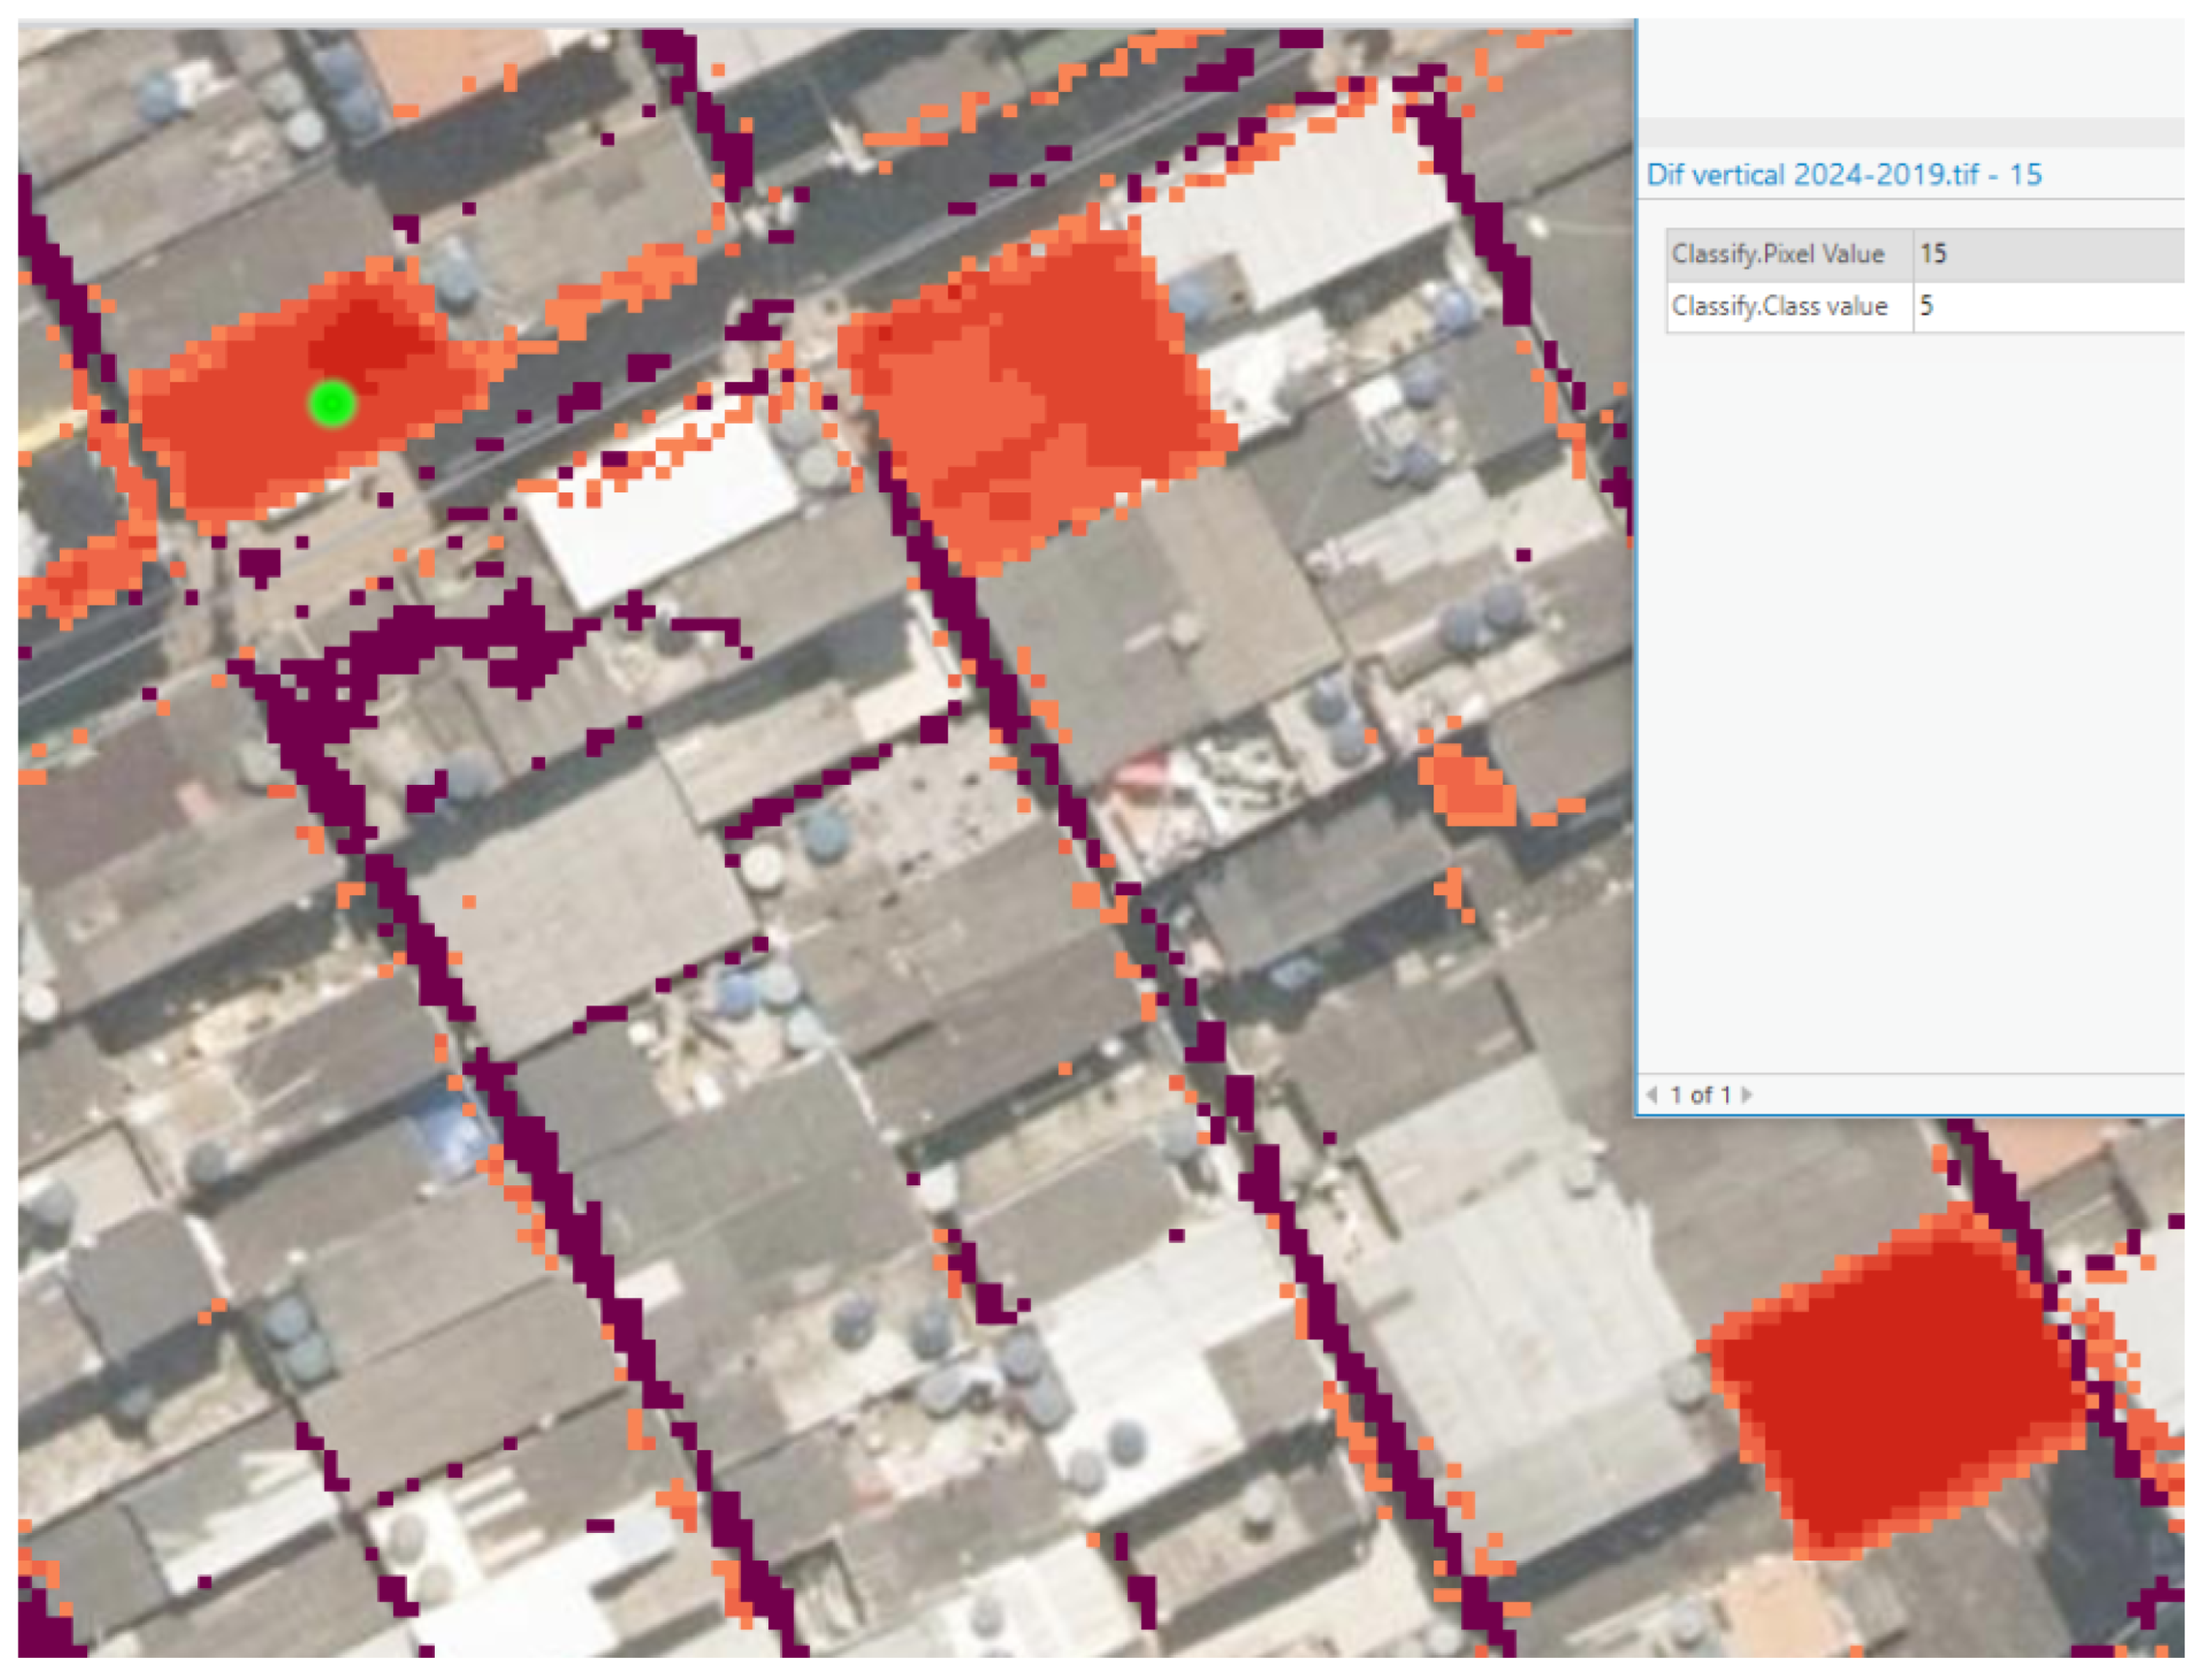
To simplify the data output, these subtracted values were rounded to integers, and the final raster presents values referring to vertical variation. In the representation of Figure 11, values between −2 and 2 m were discarded, as they do not constitute sufficient variation to justify the addition or reduction in a floor. The others, represented over the orthoimage, allow identifying which building had changes in its verticality. As an example, a building with a positive difference of 15 m was selected (i.e., between 2019 and 2024, there was an increase in height of about 15 m—evidencing a small building with 5 floors.
Figure 11.
Vertical difference between the 2024 and 2019 models.
Using the “Zonal Statistics” tool from ArcGIS Pro, a summary by mode (the value that repeats most often in the dataset) was performed on the raster of vertical difference between 2019 and 2013, referring to each building polygon from the 2013 restitution. Thus, the most common pixel value (already discretized) within that polygon was chosen—representing, more clearly, the predominant vertical variation. The “TOPO” attribute value for 2019 resulted from the 2013 values, added to this vertical variation, to obtain the new height values for each building. For buildings without vertical variation, the difference should be close to zero (and discretized to zero). For significant vertical variations, values close to 3 m per floor, positive, can be considered. For demolitions, a negative result occurs. Additionally, new buildings, identified by positive results in previously empty areas (without polygons), were also added manually to the base through the QGIS vectorization tool (“Add polygon” tool). Table 1 shows how the relationship between height differences and the number of added floors between models was defined.
Table 1.
Relationship between height differences and the addition of floors.
Subsequently, the features corresponding to the surfaces of the study area were vectorized, namely: soil types, hydrography, and vegetation. The surface features were kept constant in all three models, given their little or no variation. Thus, the cartographic base of buildings was updated for the year 2019. This procedure was repeated using the raster of vertical difference between 2024 and 2019, along with the building base generated for 2019, to obtain the features referring to buildings in the year 2024.
2.3.4. Generation of Microclimate Models
With the morphological and climatic data in hand, the microclimate models were generated. The atmospheric model is responsible for calculating air temperature, relative humidity, and air movement, considering the presence of obstacles such as buildings and vegetation. The surface model, in turn, calculates the emitted longwave radiation and the reflection of shortwave radiation from different surfaces, using initially defined surface temperature values and calculated in the simulation process. The soil model calculates the temperature and hydrodynamic processes occurring in the soil, integrating natural and artificial surfaces, in addition to considering the presence of water bodies and their interactions with the surrounding environment [].
The model requires the definition of resolution, based on cell dimensions, in addition to height (number of cells on the Z-axis). After that, the layers that will represent the area delimitation, buildings, surfaces, and vegetation are defined, as well as the base and top altitude values of the buildings and the materials that compose the elements. Finally, the layer referring to the Digital Terrain Model (Digital Elevation Model) is chosen, which band contains its altitude values, and which interpolation method will be used in the model. Each model generates a file with the INX extension. Table 2 shows the parameter choices for the three generated models.
Table 2.
Parameters used to create the microclimate models.
2.3.5. Generation of Microclimatic Simulations
To generate a microclimatic simulation in ENVI-met, it is necessary to define the start date and total duration of the simulation and load the INX file of the model. In the meteorological settings, the climatic data from INMET were used, where it is necessary to define the maximum and minimum air temperatures and relative humidities, as well as the time of day when these values occur, so that the software performs linear interpolation to define the temperature and relative humidity values for the rest of the day. Additionally, the values of specific humidity at 2500 m, wind speed and direction, surface roughness, and cloud cover must be included.
The ENVI-met simulation results presented here are for midnight. This time was chosen for two reasons. First, it standardizes the comparison, as the measured temperature data from the Jacarepaguá station was available at hourly intervals, including midnight. Second, analyzing conditions at midnight highlights the persistence of the Urban Heat Island (UHI) effect, demonstrating that it remains significant even when air temperatures are typically at their coolest.
This procedure to generate the microclimatic simulations was repeated for the three previously generated models, keeping the values defined in Table 3 constant.
Table 3.
Parameters used to create the microclimate simulations.
2.3.6. Complementary Indices
Complementary indices, such as PET (Physiological Equivalent Temperature), PMV (Predicted Mean Vote), and UTCI (Universal Thermal Climate Index), are used as references in thermal comfort studies and as essential tools for the analysis and planning of built environments.
PET was developed based on the human body’s energy balance model and considers essential climatic variables, such as air temperature, relative humidity, wind speed, and mean radiant temperature []. These factors are integrated to represent the thermal conditions perceived by individuals in open spaces, translating these variables into an equivalent temperature scale, generally in degrees Celsius, which facilitates interpretation and practical application. PET is often used with other thermal comfort indices, such as PMV, for more comprehensive analyses of the interactions between climatic variables and human physiological responses [].
For this study, the definitions of the PET and PMV scales were adopted as proposed by [], and UTCI was adopted based on the criteria of the ISB Commission 6 []. Table 4 outlines the respective thermal comfort scales along with the thermal sensation and degree of thermal stress for each range.
Table 4.
Thermal comfort indices, sensitivity level, and degree of thermal stress.
3. Results
3.1. Update of the Cartographic Base and Vertical Growth
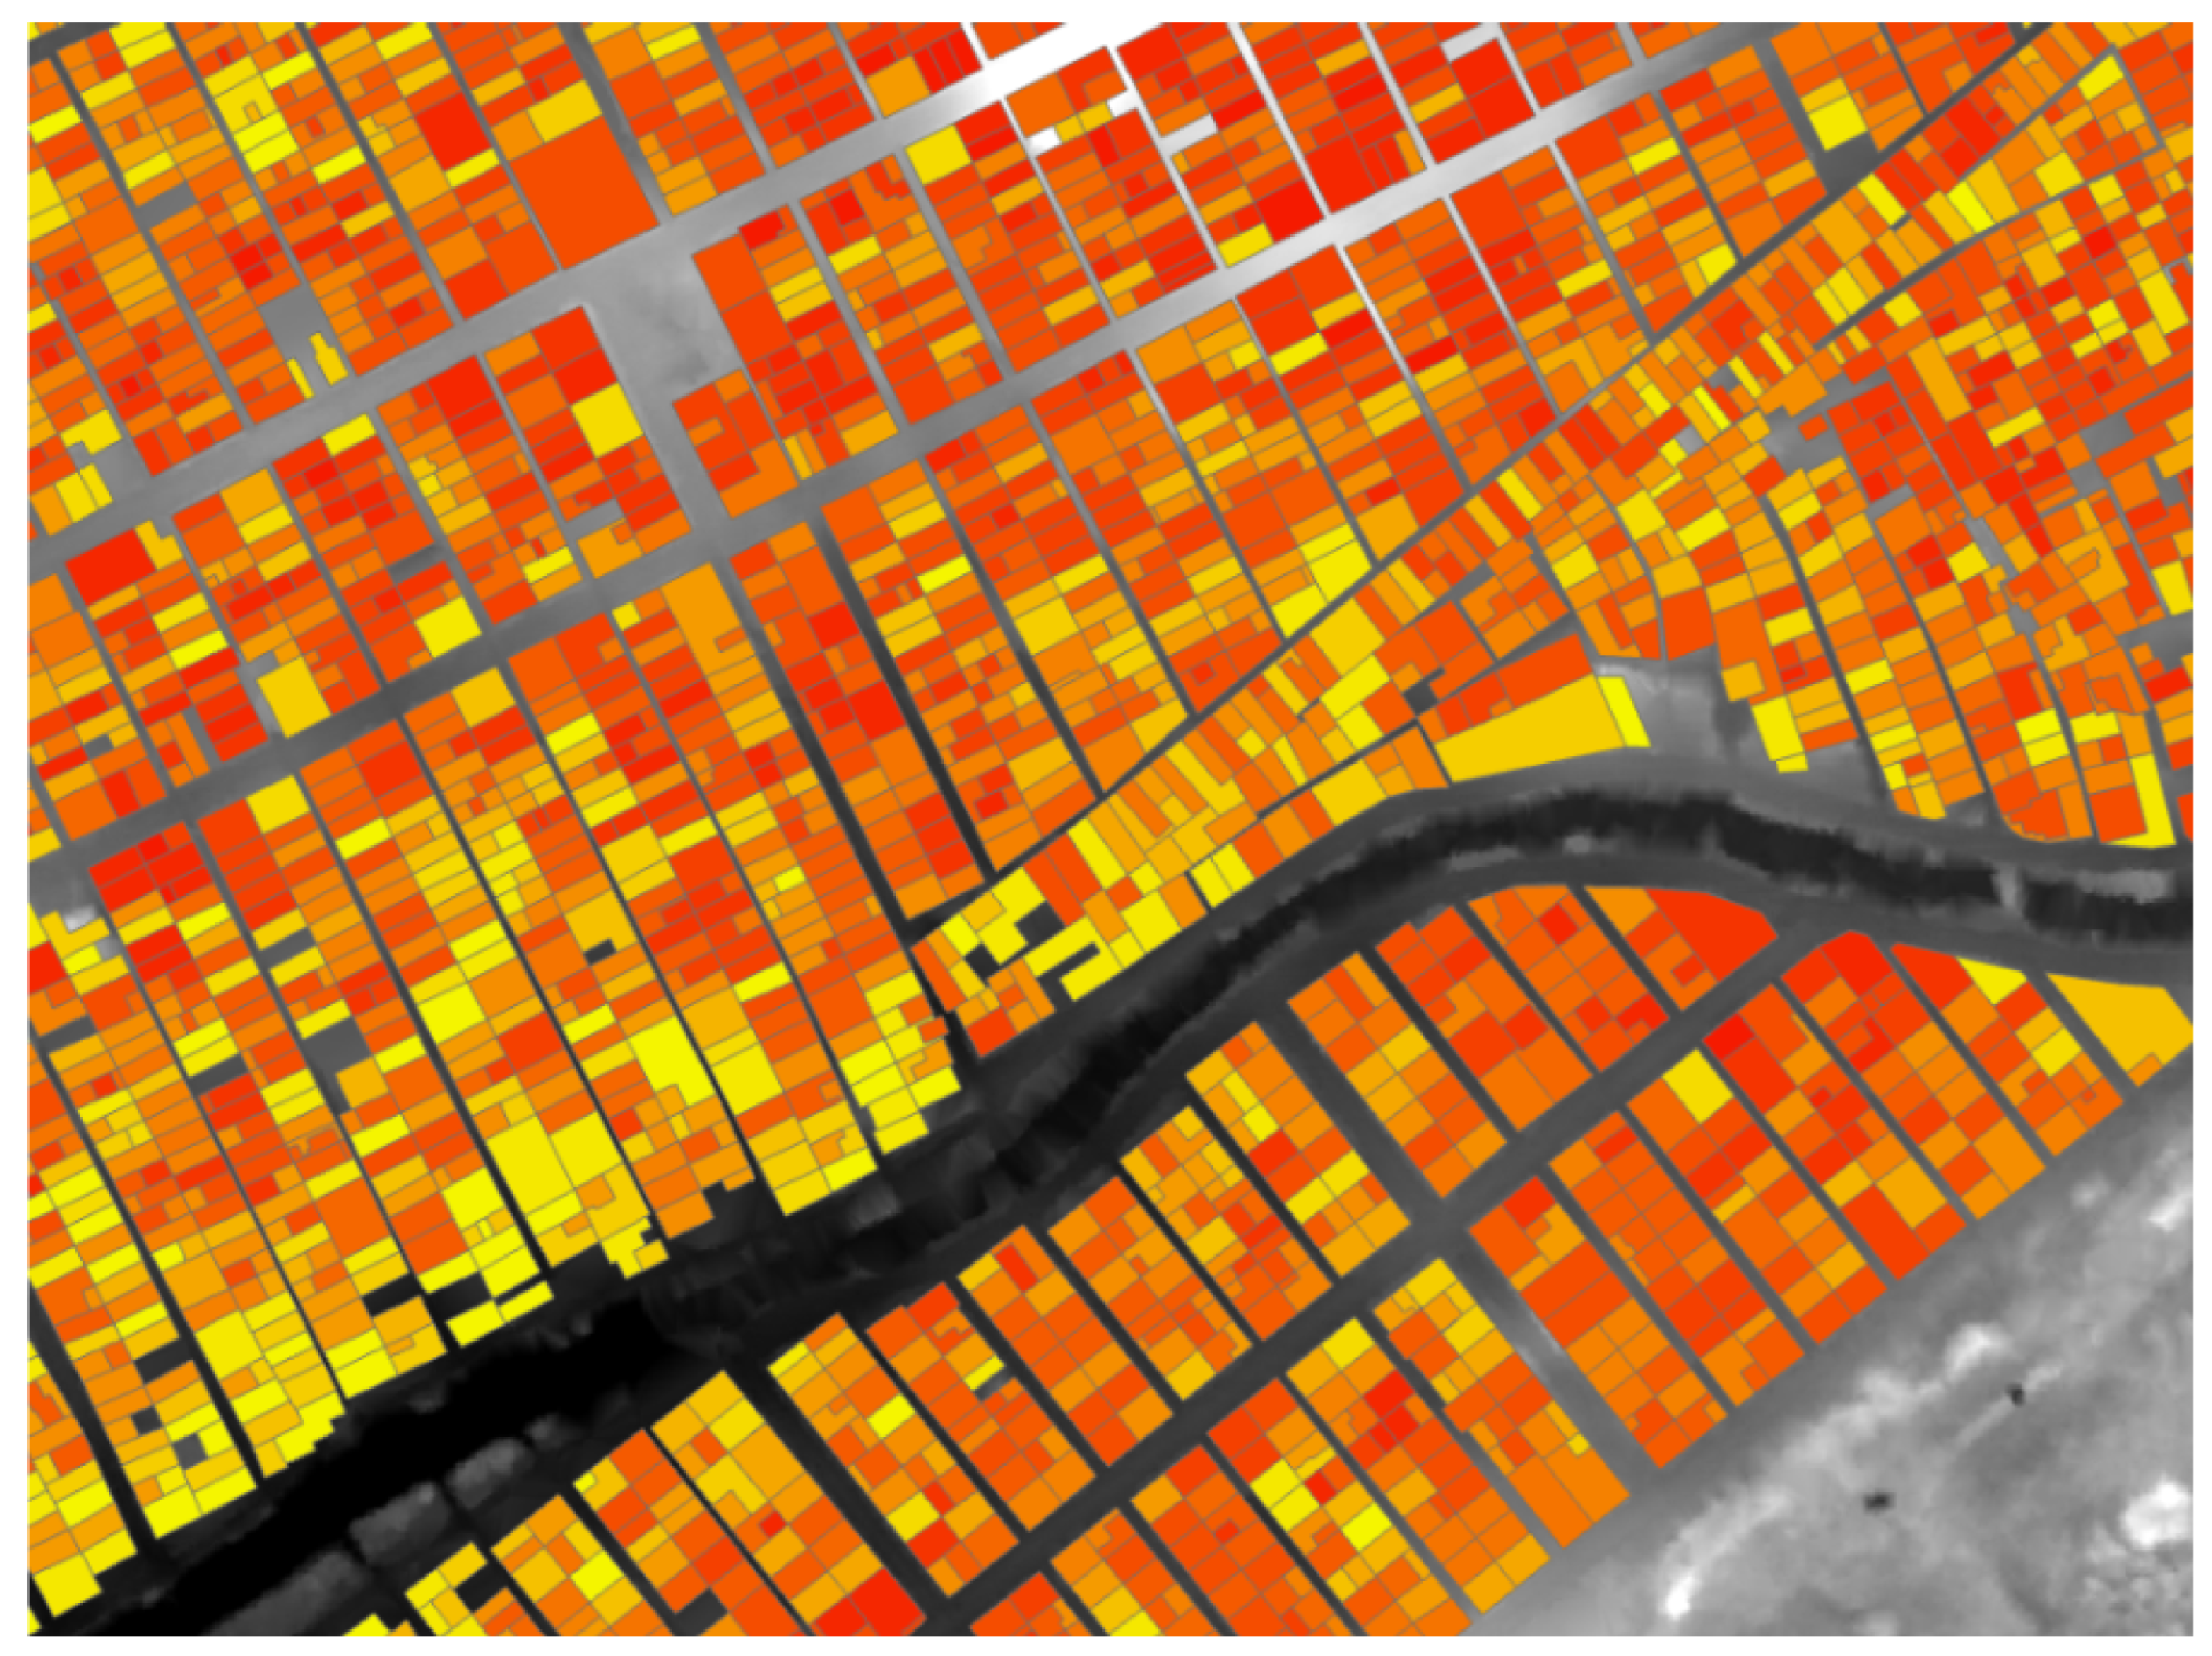
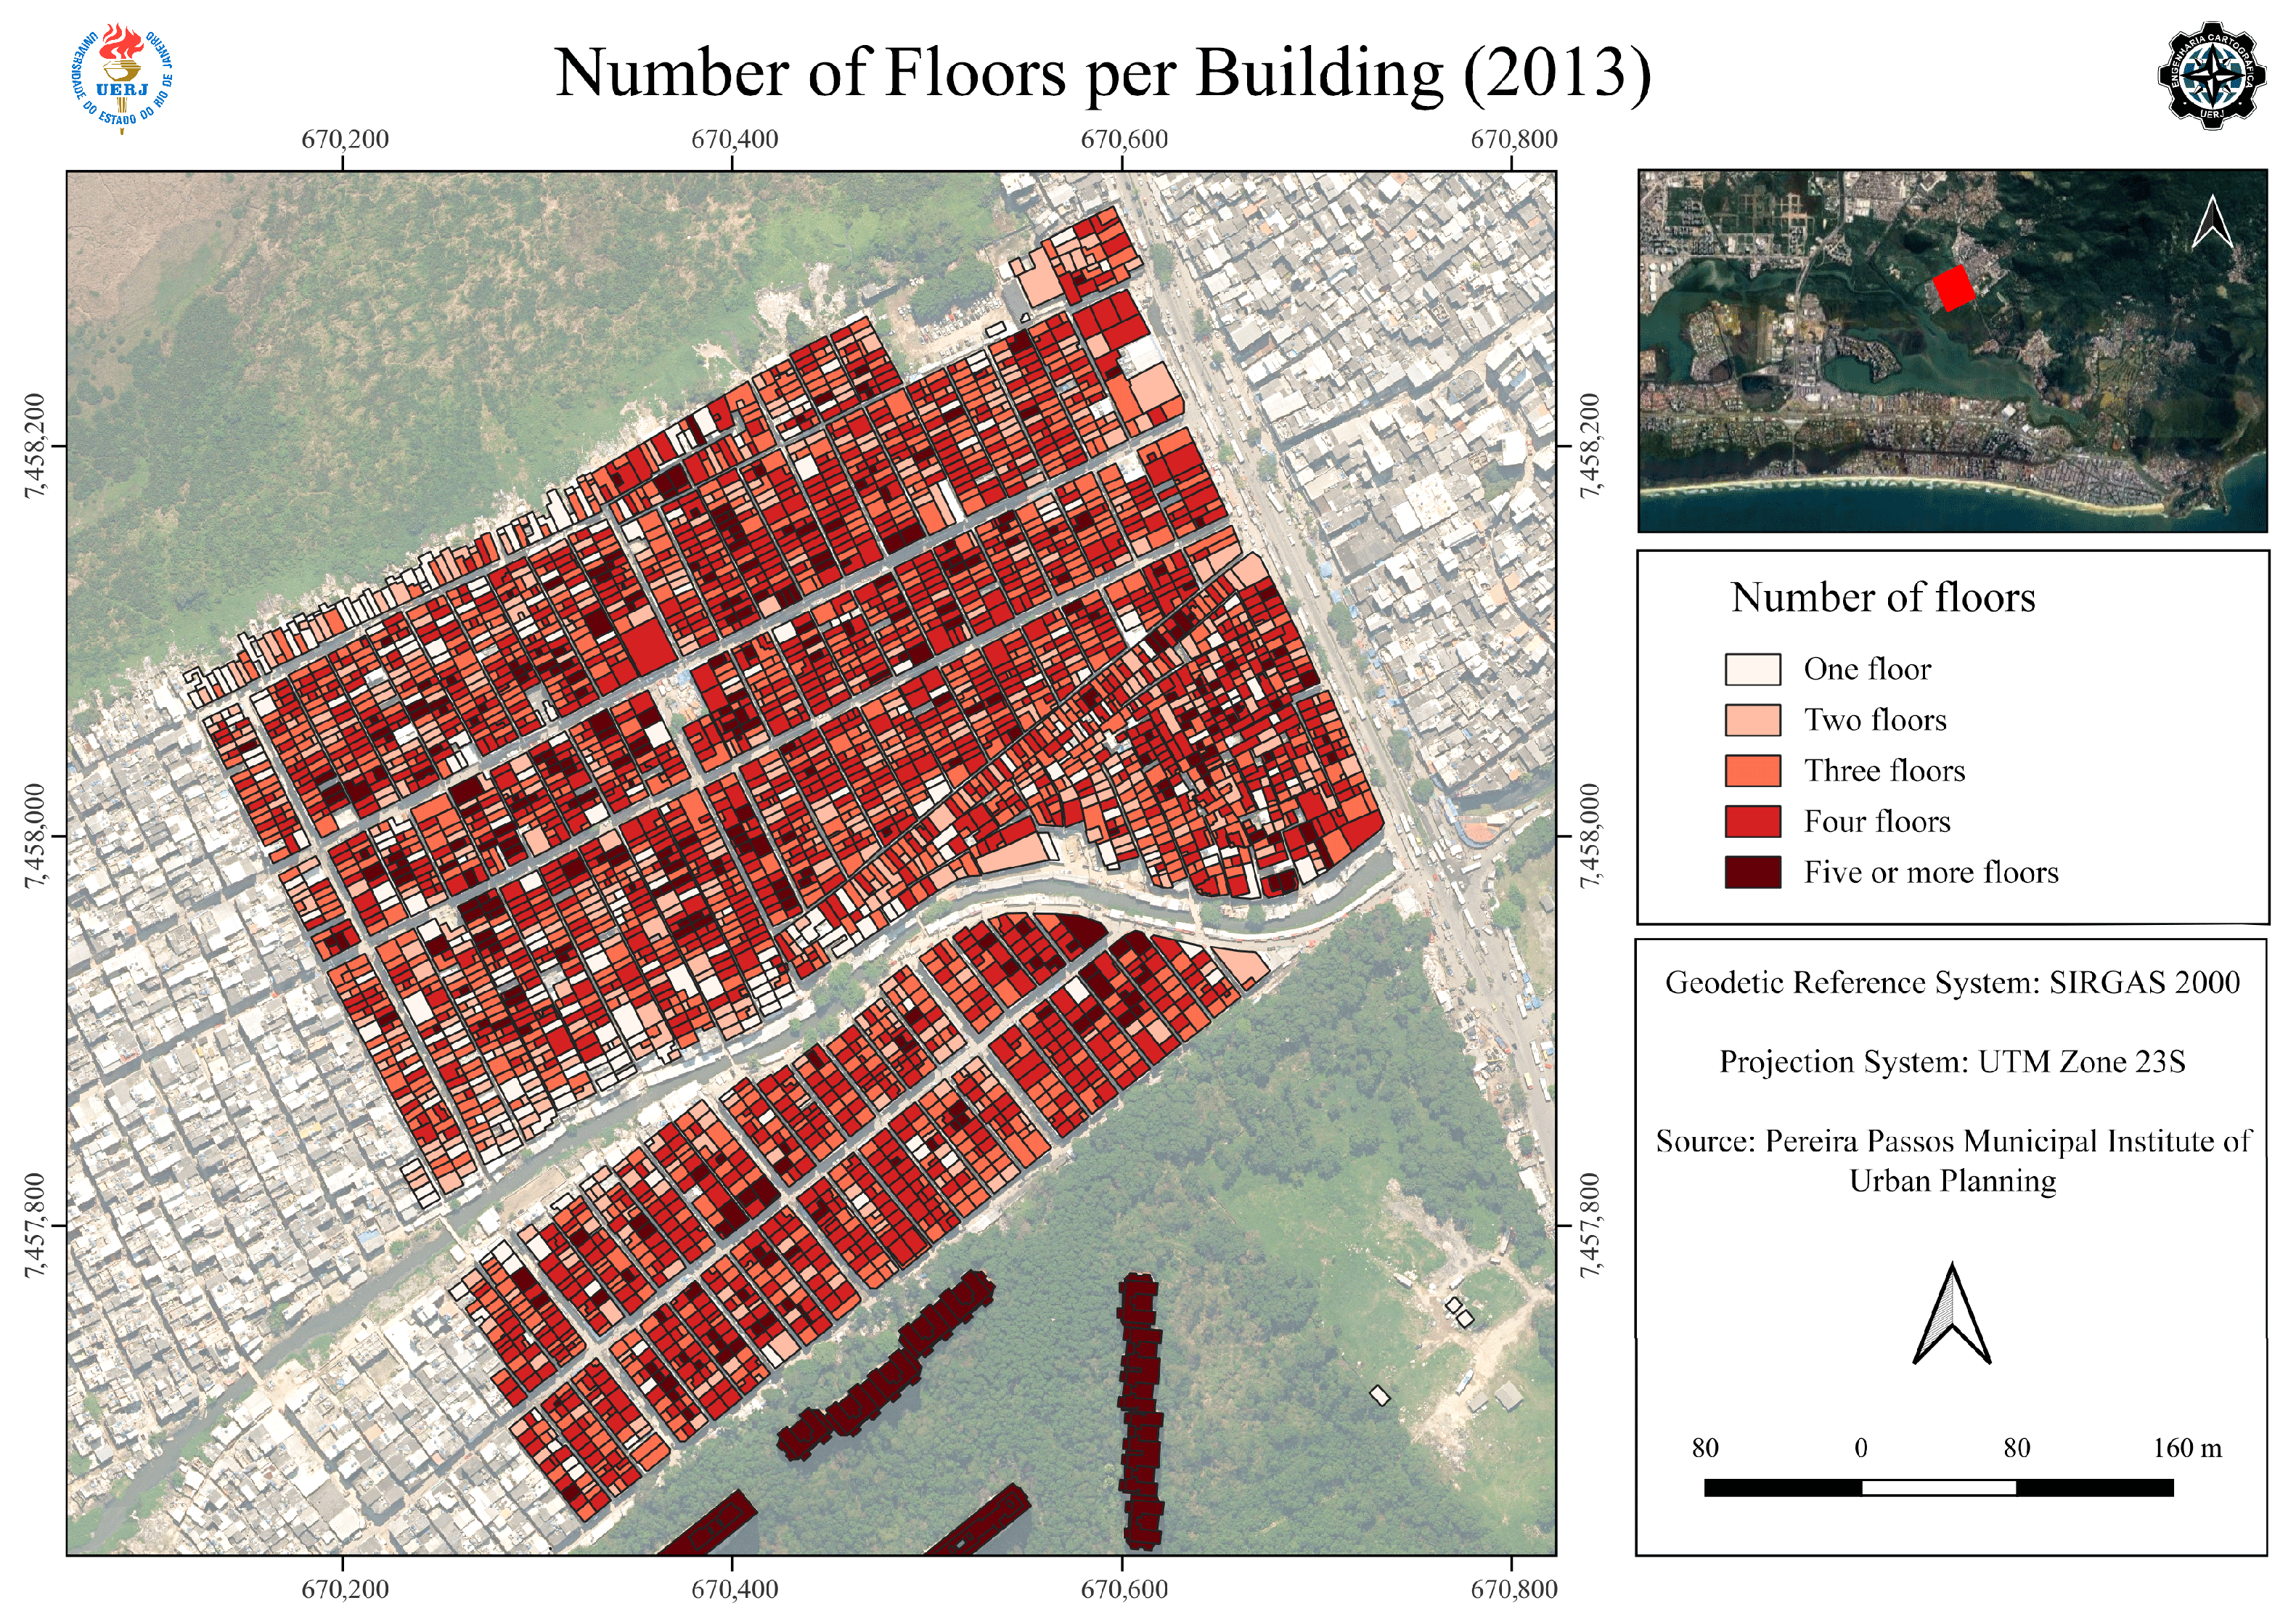
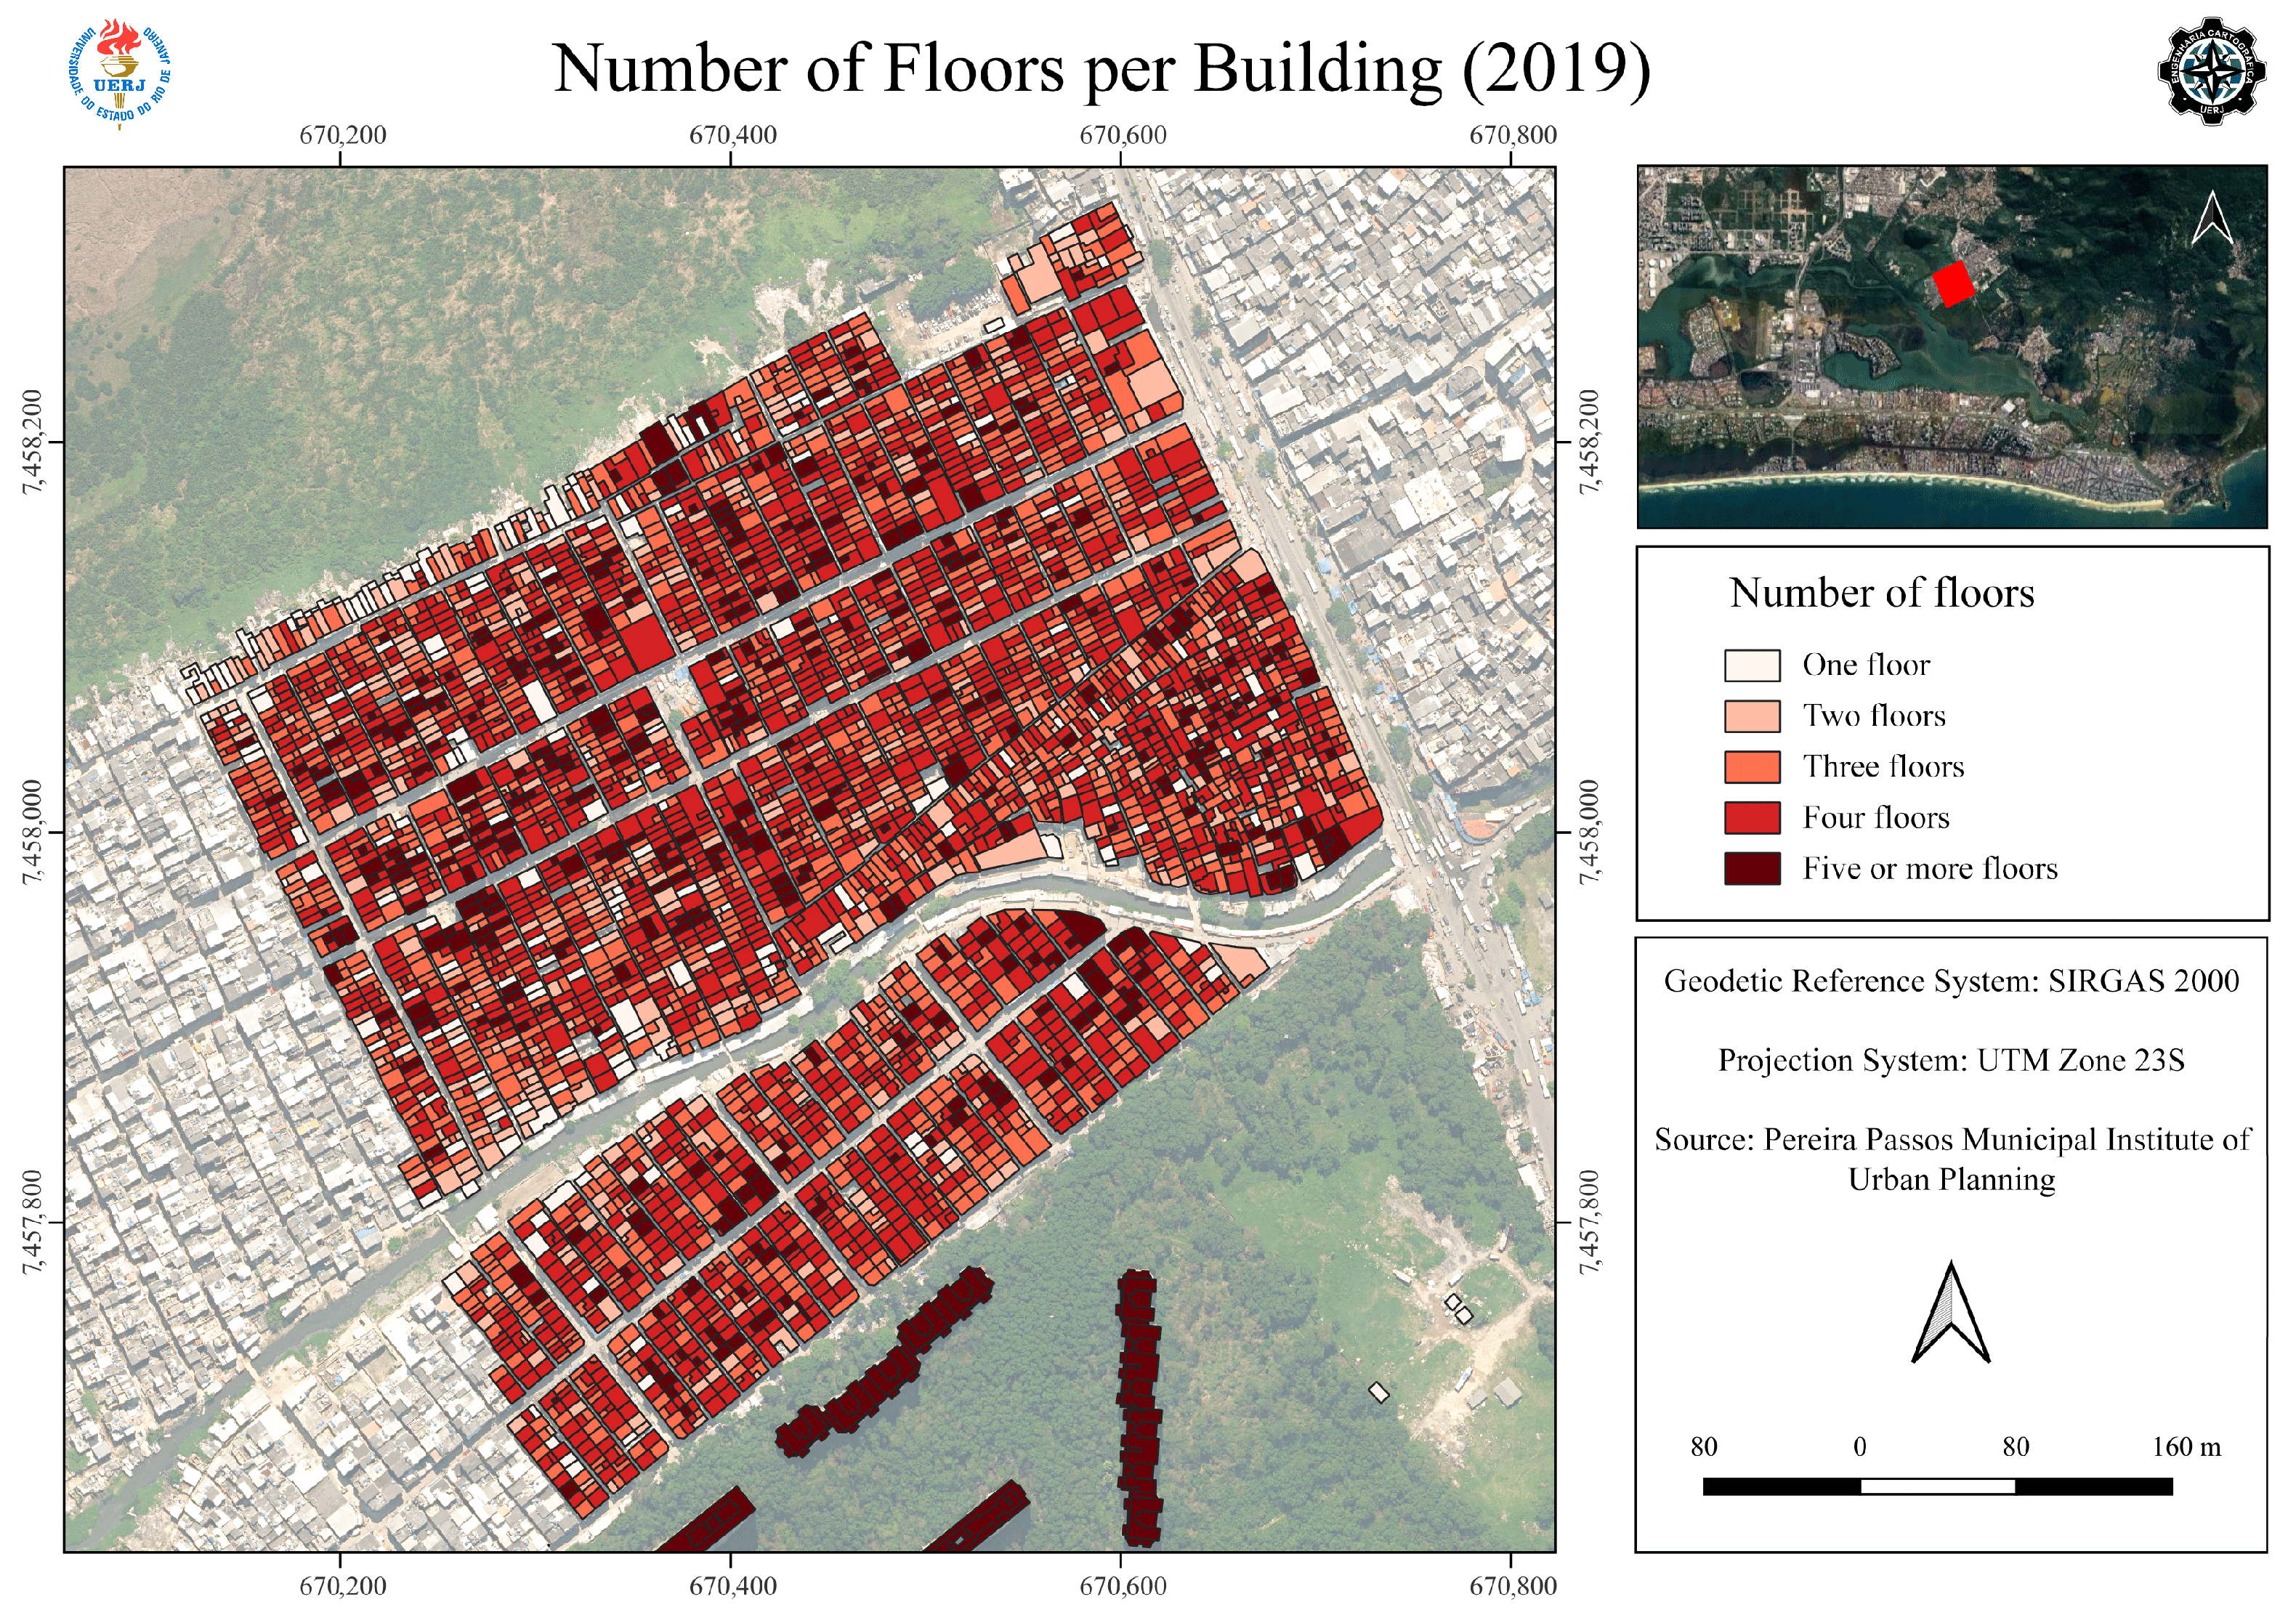
Figure 12, Figure 13 and Figure 14 present the results related to the update of the building cartographic base in the study area. This includes the clipping used for 2013 and the subsequent updates for the years 2019 and 2024, which were essential for the creation of the microclimate models.
Figure 12.
Cartographic base from 2013, depicting each building using a color scale corresponding to the number of floors determined through photogrammetric restitution.
Figure 13.
Cartographic base from 2019, representing each building using a color scale corresponding to the number of floors derived from zonal statistics applied to the digital surface model.
Figure 14.
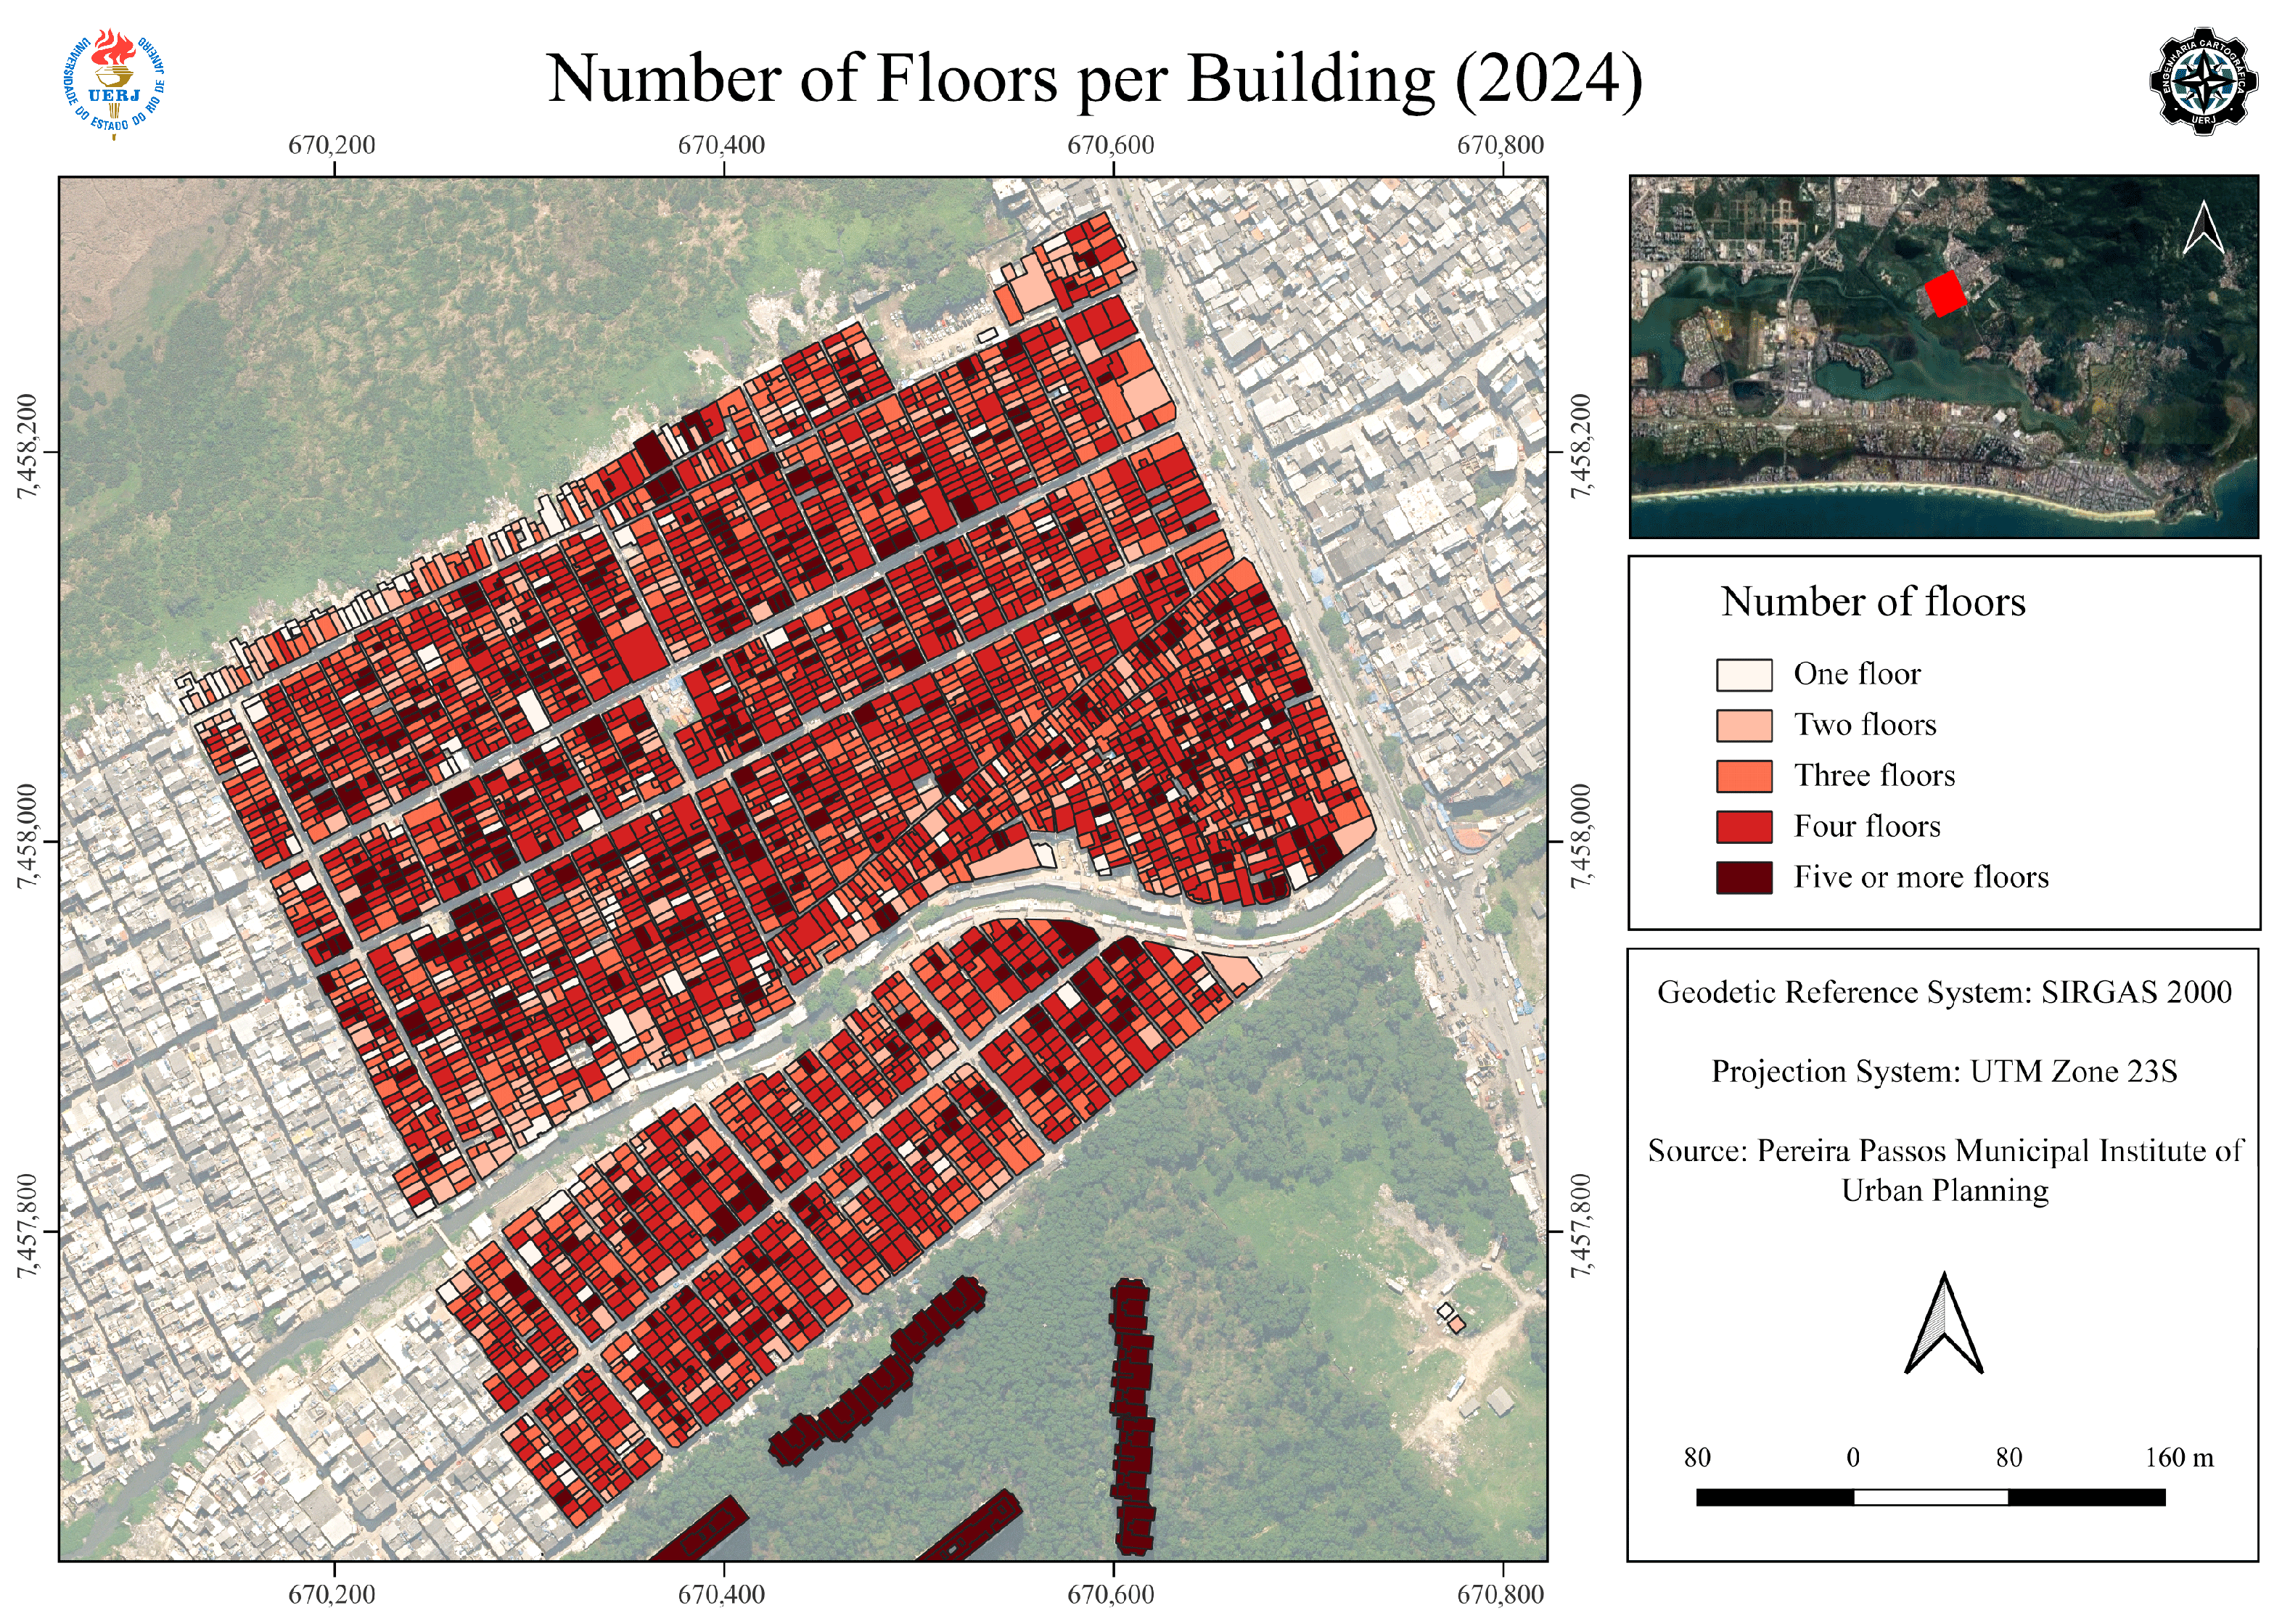
Cartographic base from 2024, representing each building using a color scale corresponding to the number of floors derived from zonal statistics applied to the digital surface model.
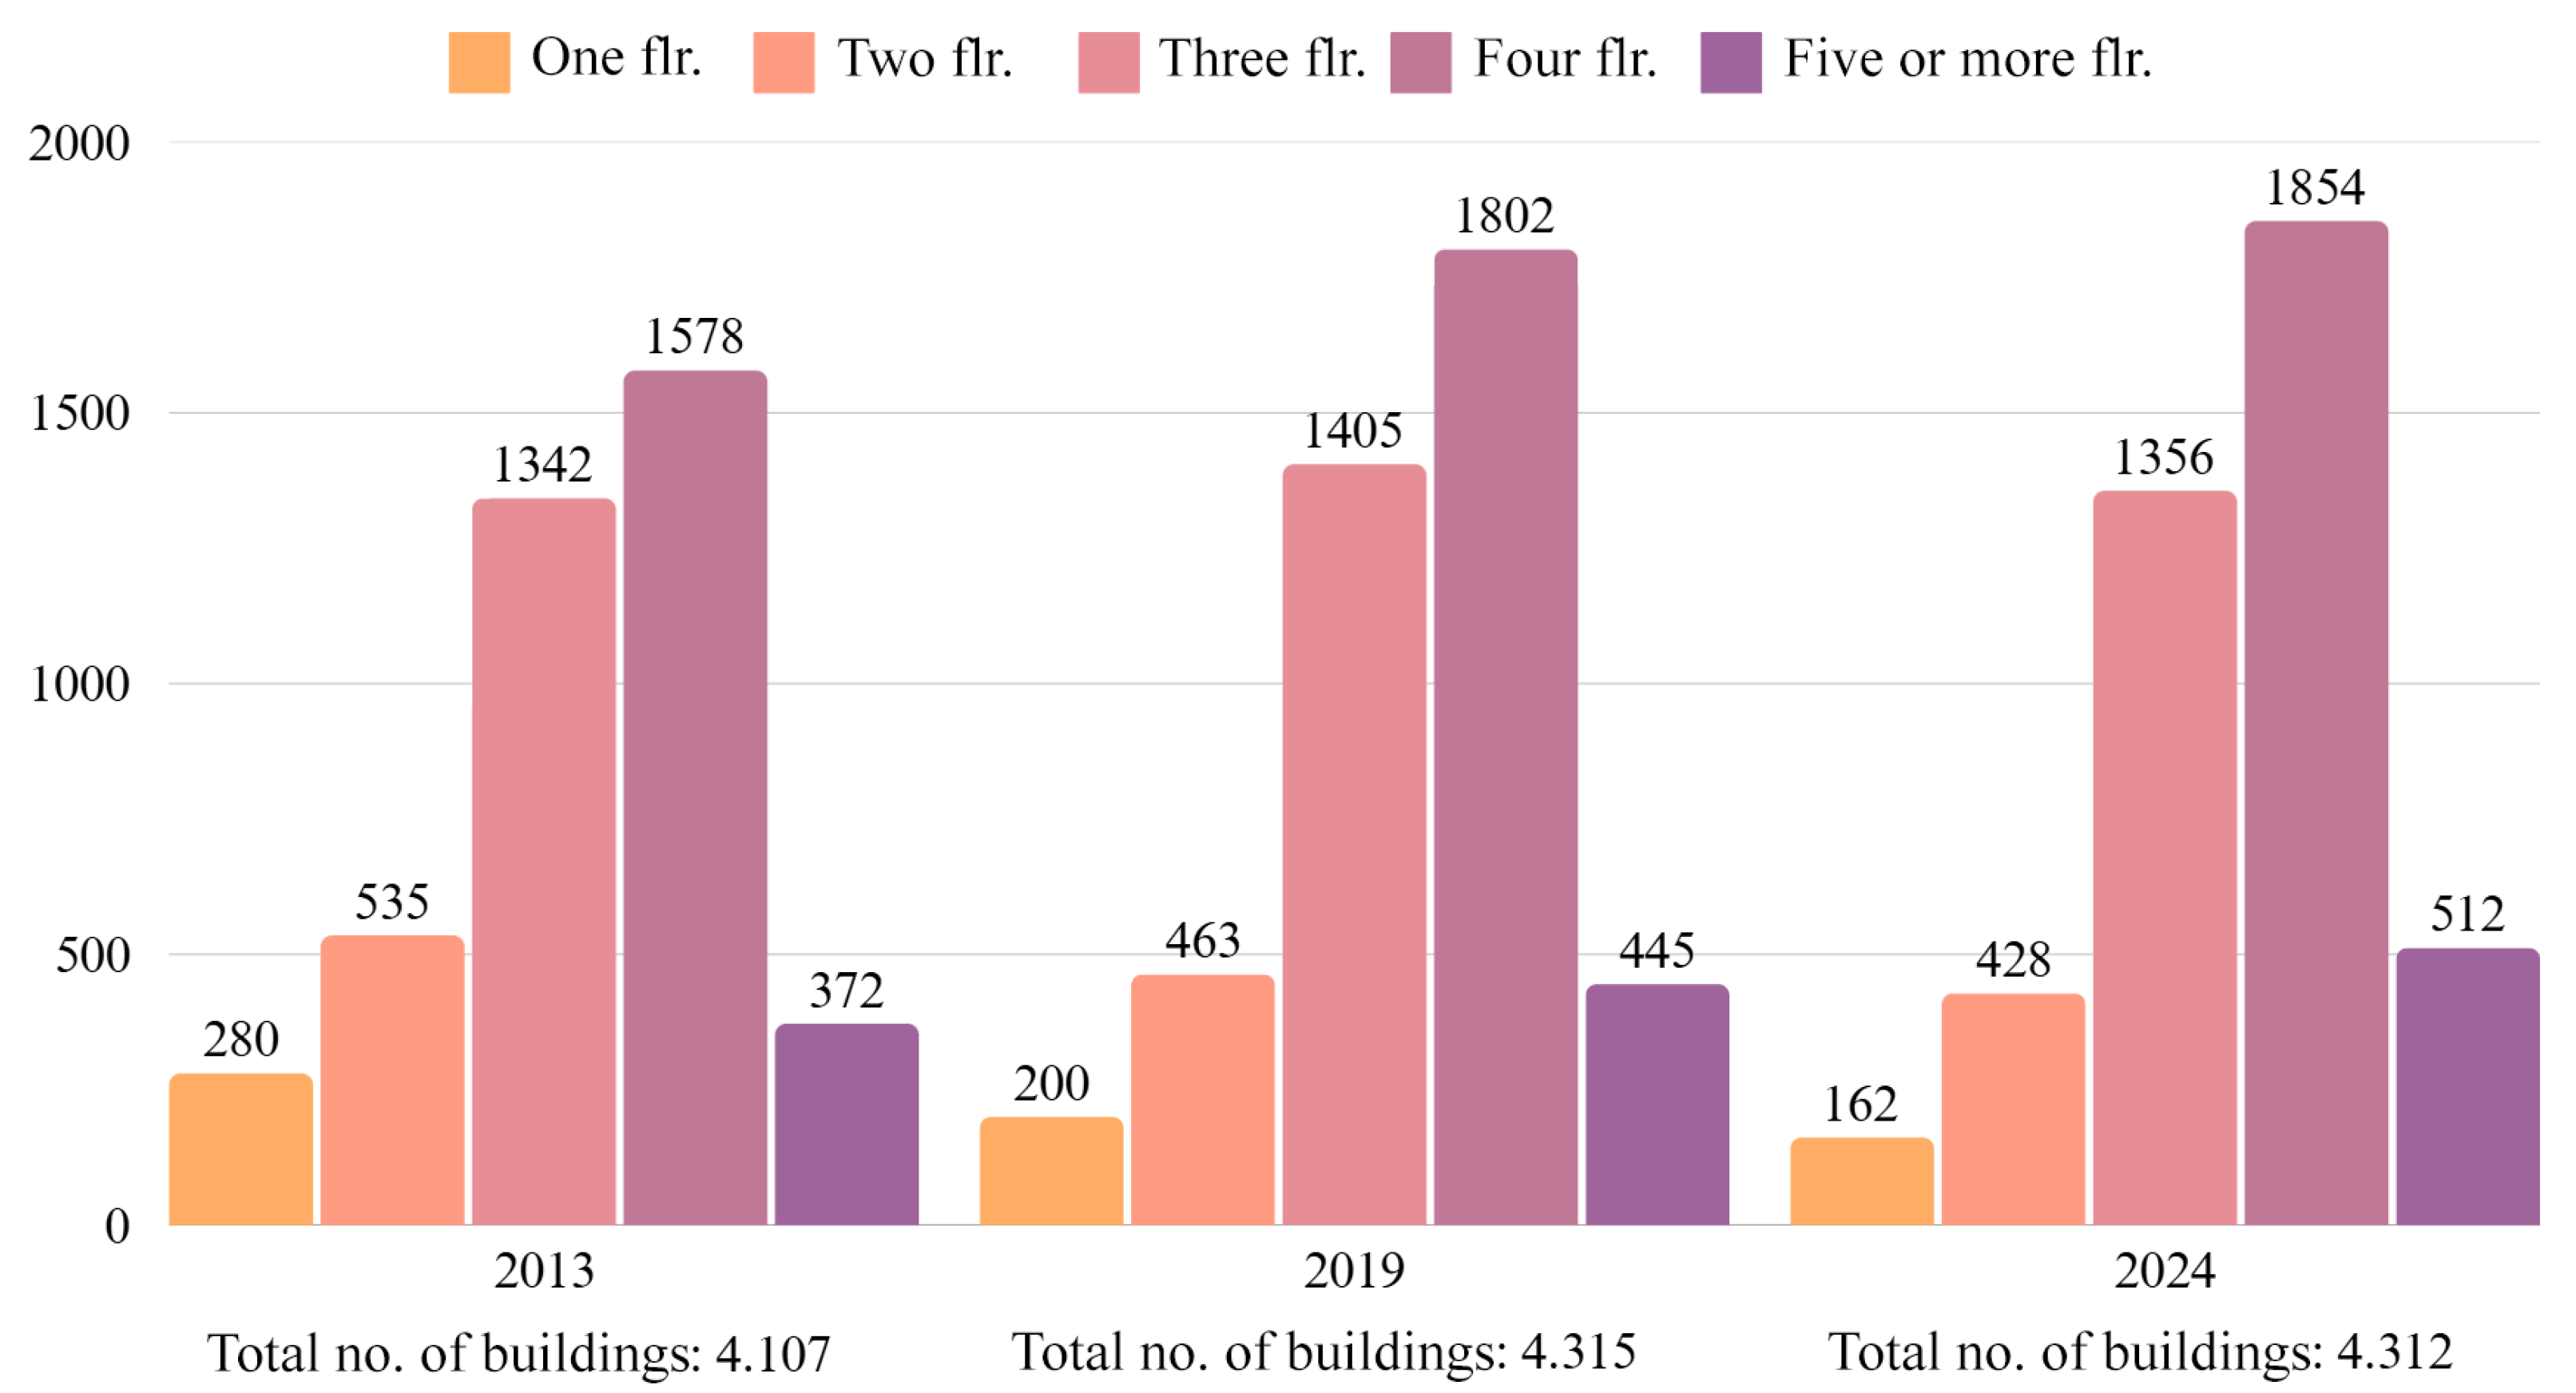
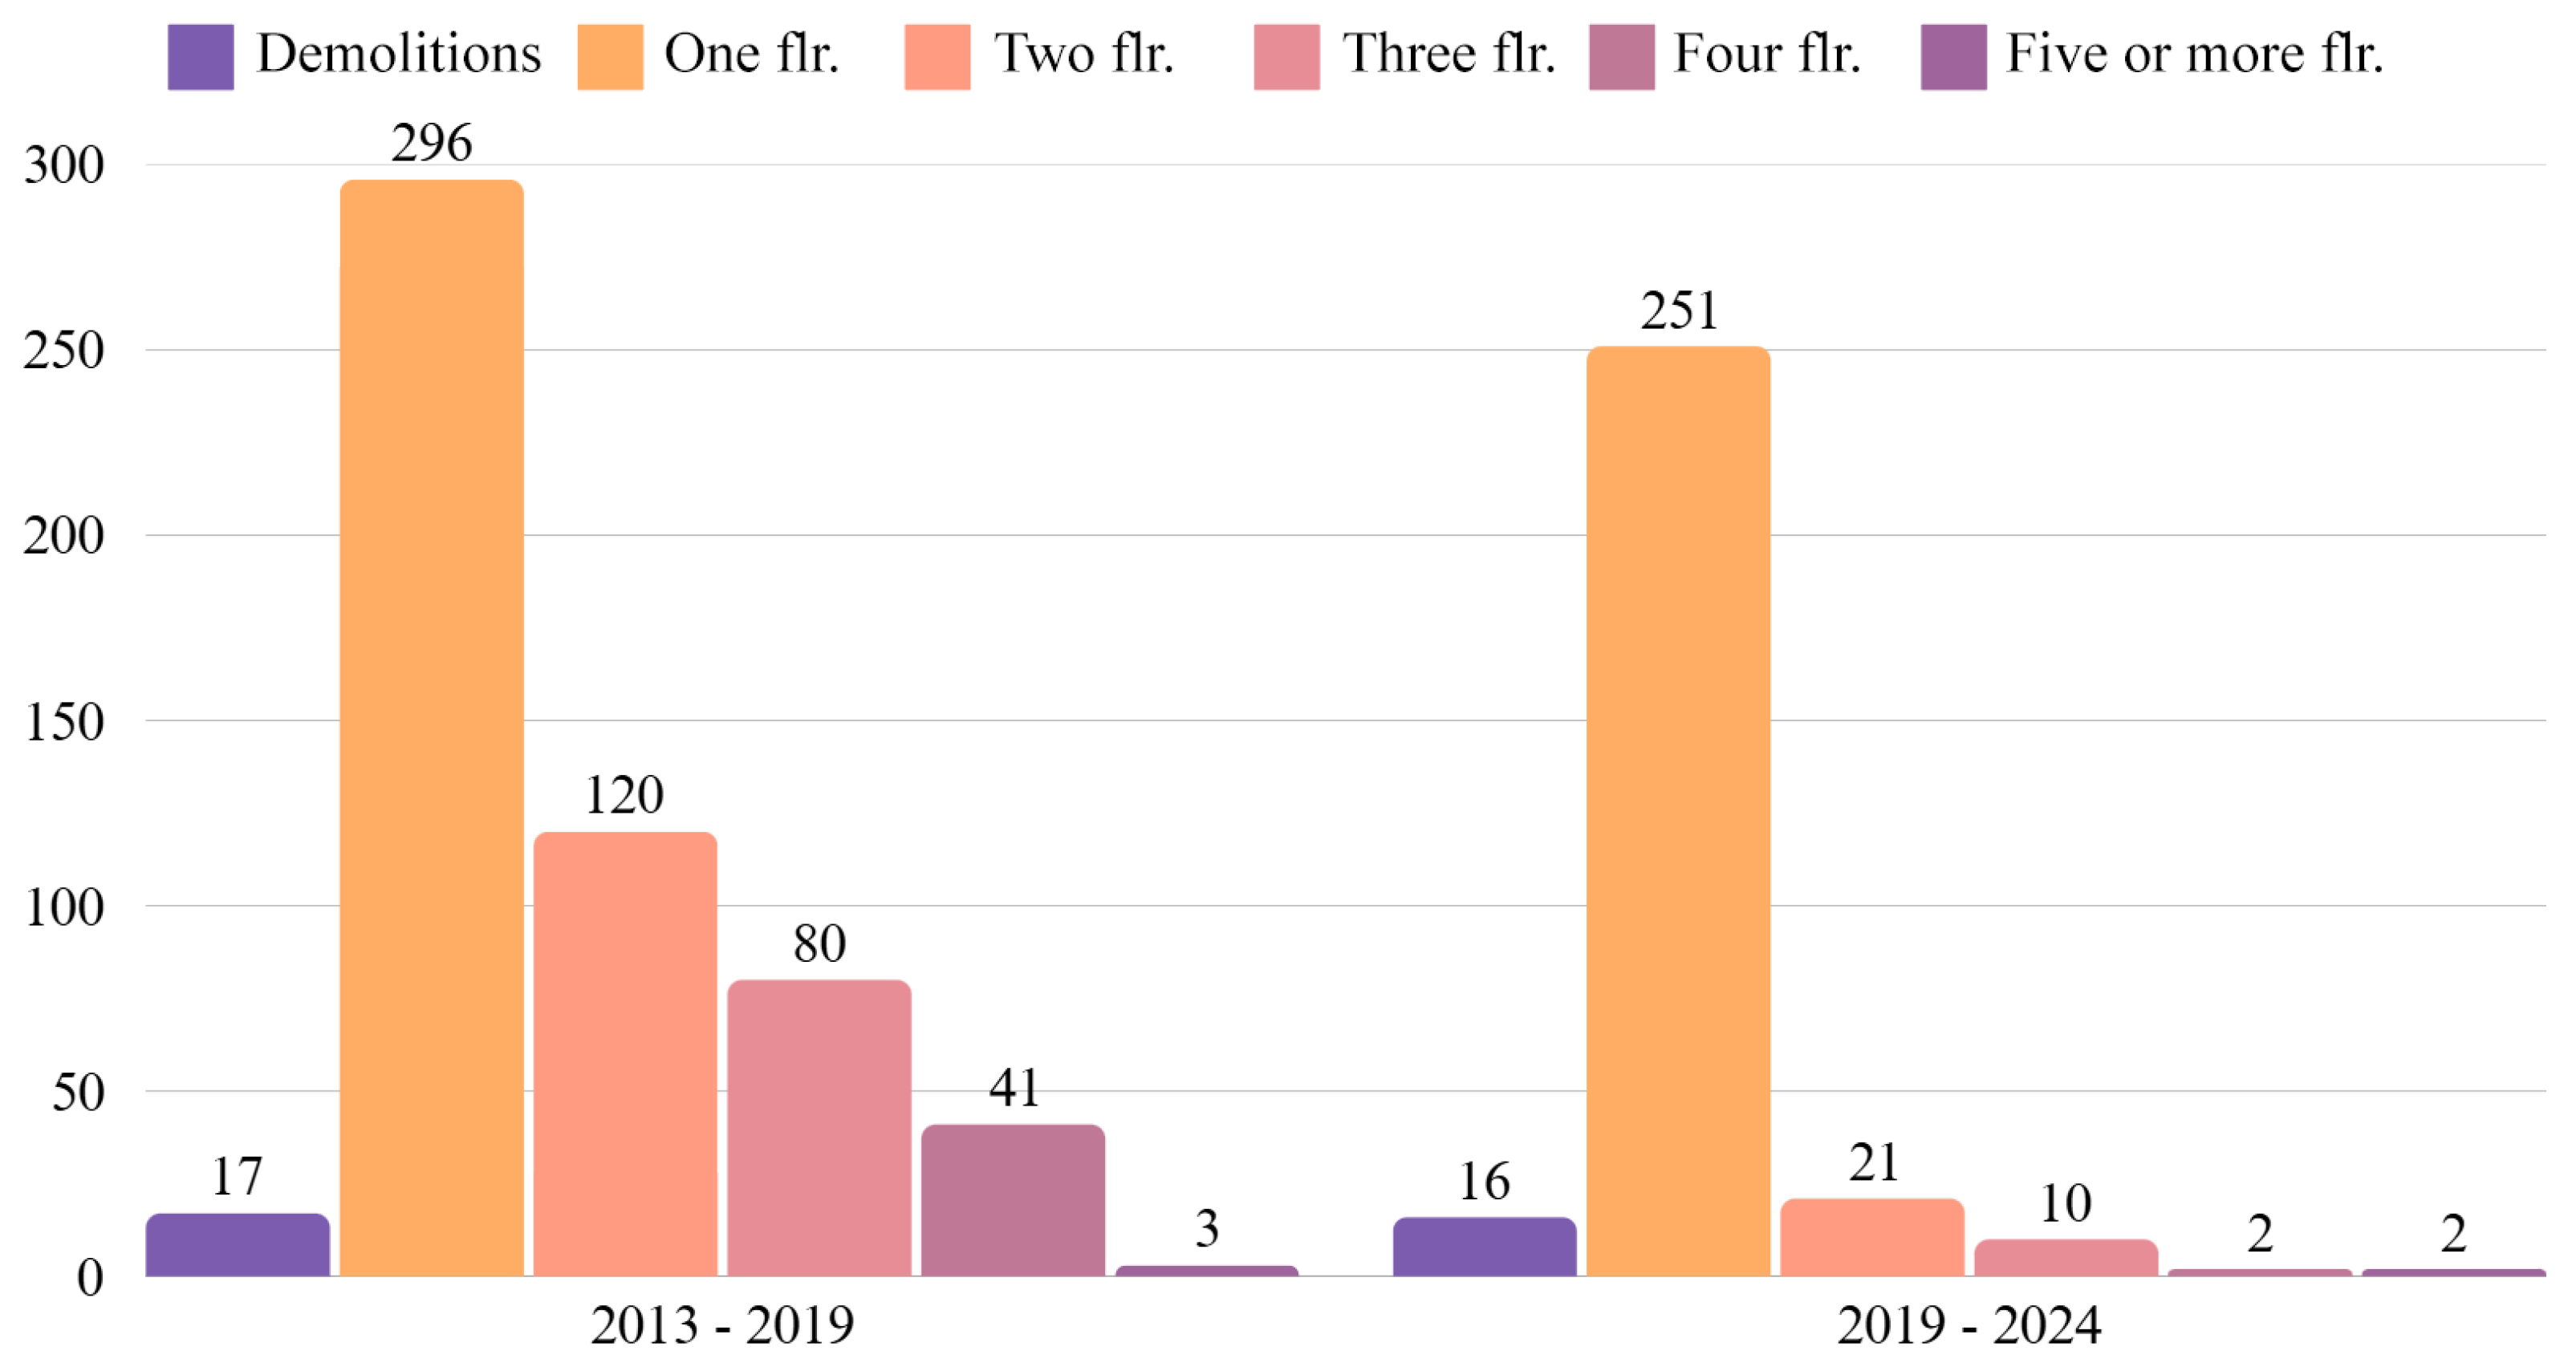
The data are categorized by the number of floors per building, with the values detailed in Figure 15. The analysis shows a clear increase in the number of buildings between 2013 and 2019. This was follows: by a slight decrease in the total number of structures between 2019 and 2024.
Figure 15.
Number of floors per cartographic base.
However, this net decrease is compensated for by significant changes in the building stock. The period saw the construction of new, taller buildings and alterations to existing ones, where parts of structures had additions built in different forms. This resulted in many buildings now having two or more distinct height values.
It is observed that there was greater land occupation between 2013 and 2019, though still limited, as the area was already densely developed horizontally by 2013. Between 2019 and 2024, there was virtually no change in terms of horizontal expansion, but vertically, the favela grew considerably. This can be explained by the merging of smaller structures—such as houses—into larger buildings, transforming several polygons into one and resulting in fewer polygons overall, without reducing horizontal land coverage.
The growth rate of built-up area is significant. According to Figure 15, there was a 42.14% reduction in single-story buildings and a 27.34% increase in buildings with five or more floors. These two comparisons alone already demonstrate the marked verticalization of the region over the past ten years.
The methodology deliberately disregarded buildings less than 3 m in height. Consequently, the most precarious structures located along the riverbanks—mainly shacks, some with heights under 2 m—were not classified (Figure 16). Therefore, while the resulting data may appear to show that the riverbanks are completely clear, the actual wind “corridor” was, in fact, a few meters narrower than the models indicate.
Figure 16.
Unclassified buildings along the riverbanks.
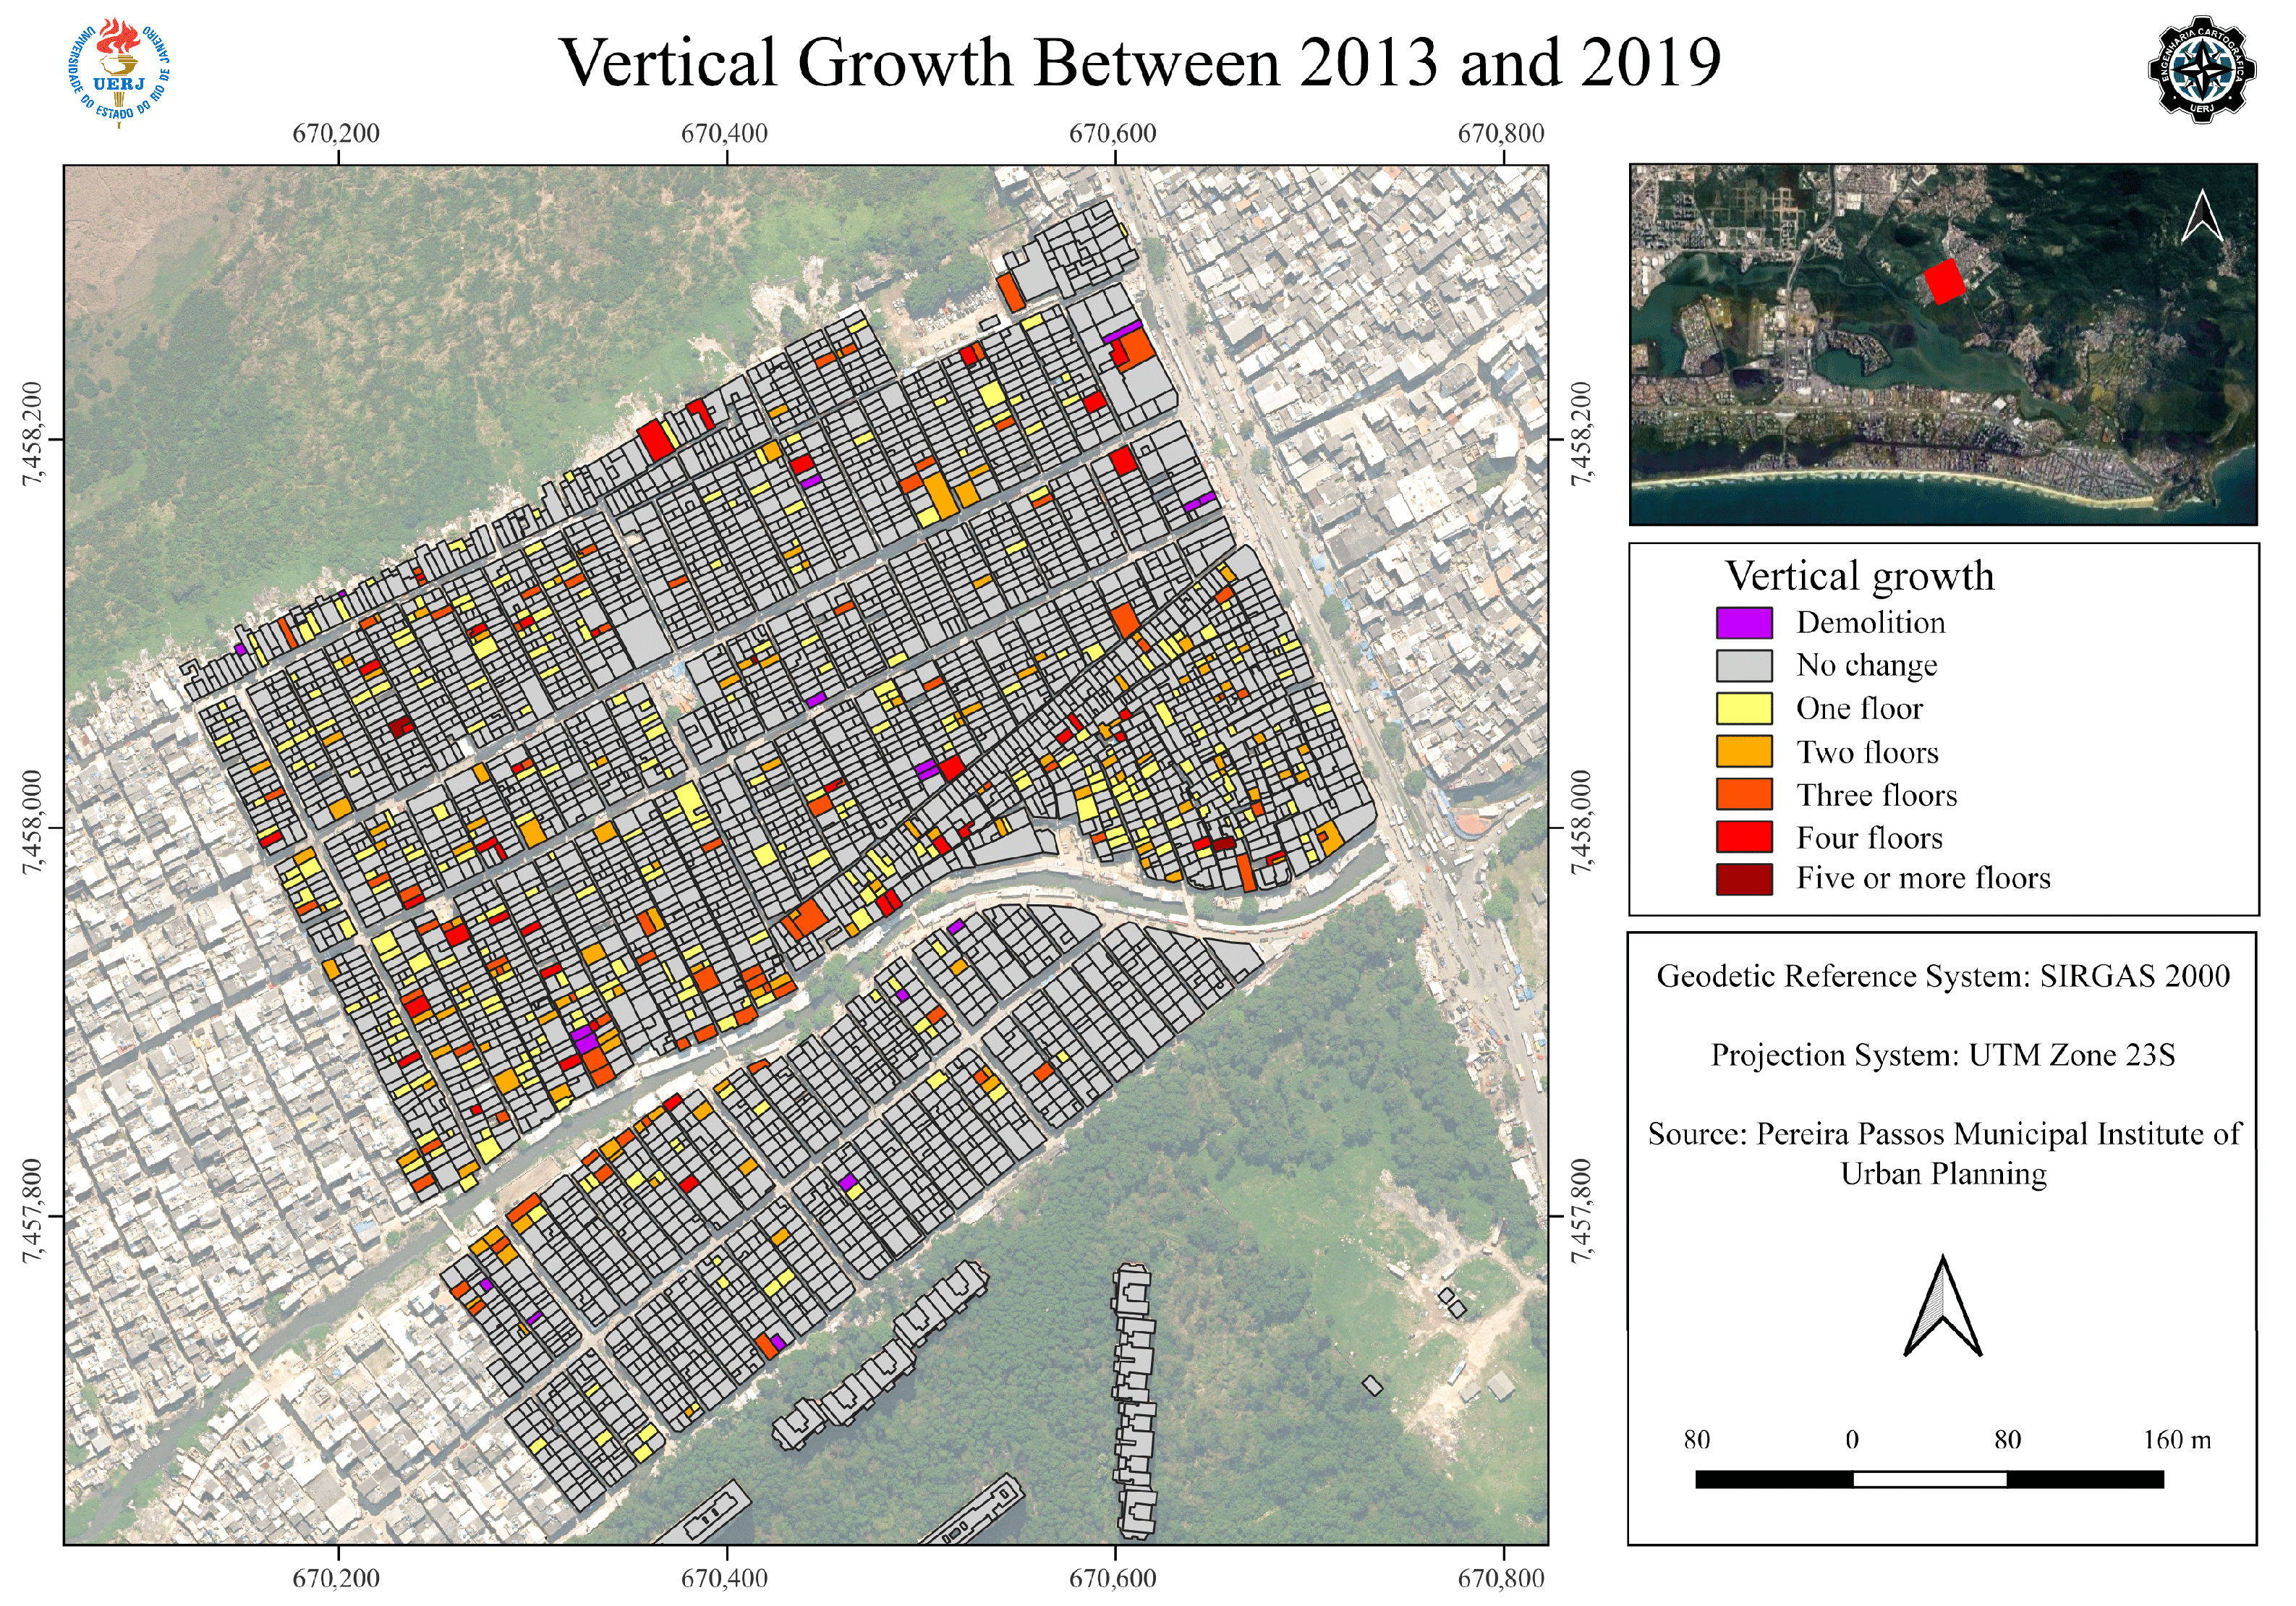
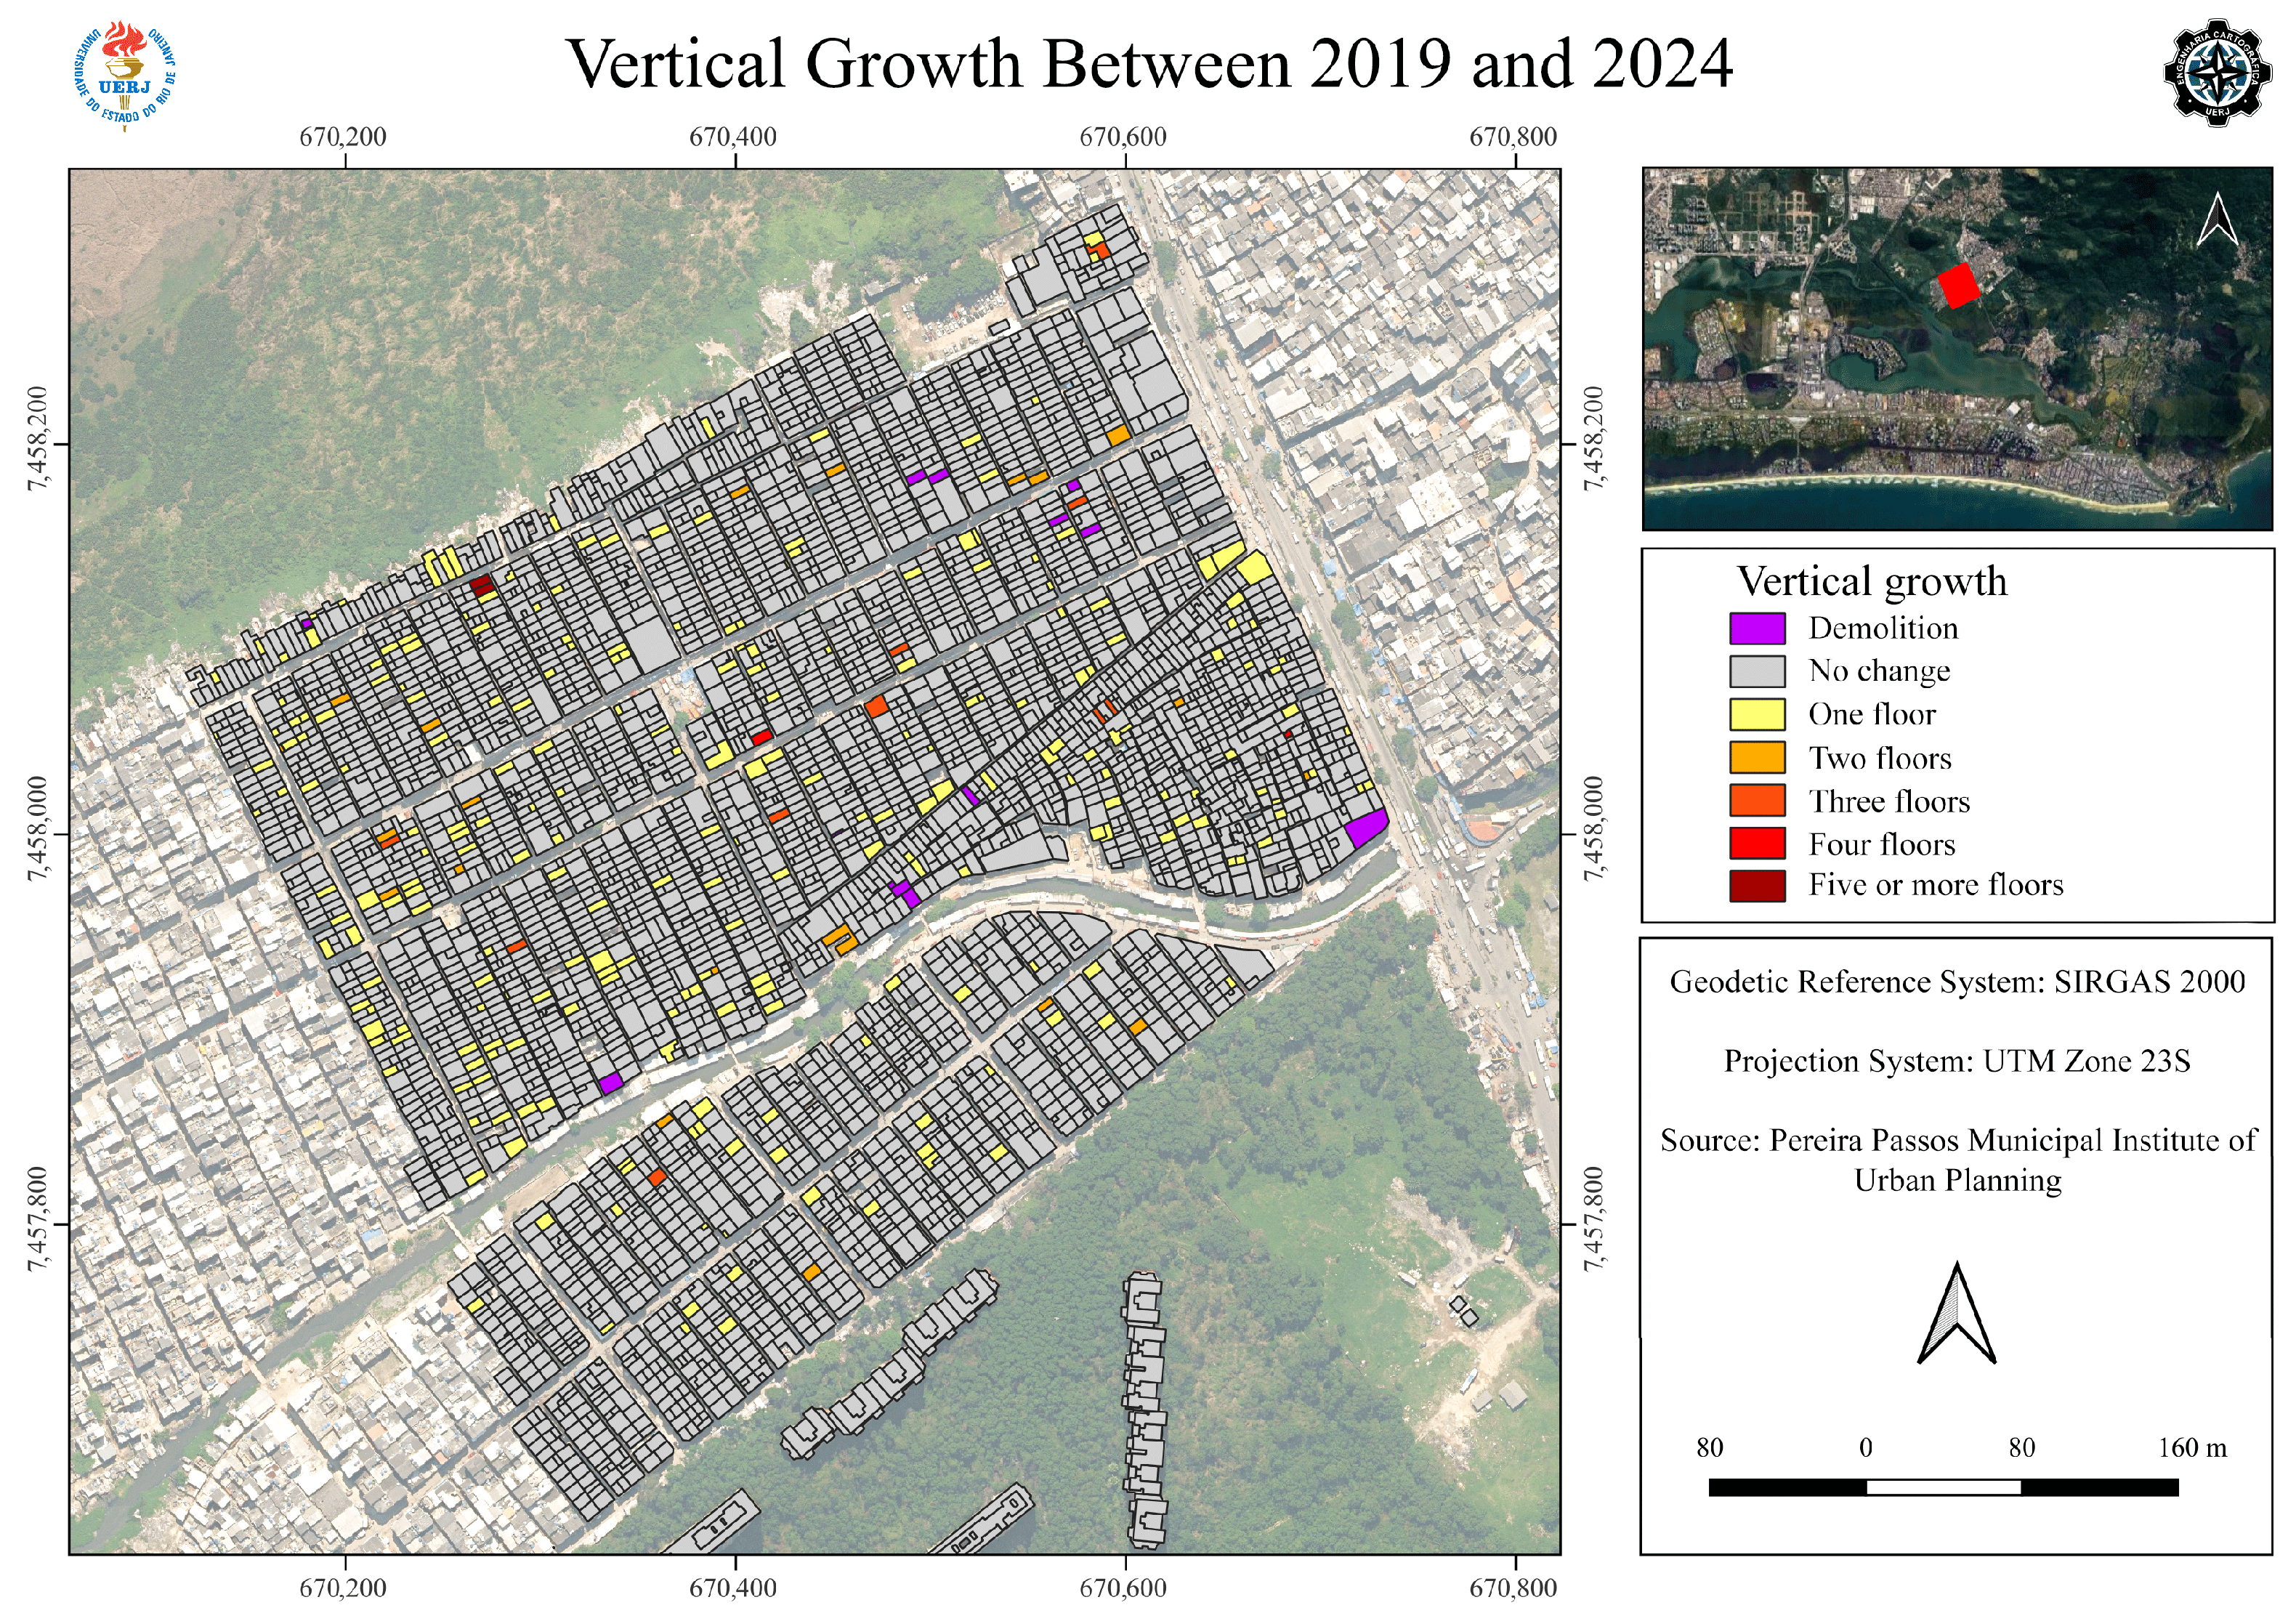
Figure 17 and Figure 18 show the growth in buildings over time, highlighting where the main territorial changes occurred. Figure 19 presents the numerical increase in floors between periods, indicating changes in the area’s verticalization. In the first interval (2013–2019), a significant number of buildings received one to four additional floors, notably 296 buildings with one additional floor and 120 with two floors.
Figure 17.
Vertical growth between 2013 and 2019. Buildings shown in grey maintained their original height, while those in other colors experienced height changes, as indicated in the map legend.
Figure 18.
Vertical growth between 2019 and 2024. Buildings shown in grey maintained their original height, while those in other colors experienced height changes, as indicated in the map legend.
Figure 19.
Increase in number of floors between periods.
In the second period (2019–2024), there was a sharp decline in vertical growth, with only 21 buildings gaining two floors, 10 gaining three, and only two gaining four. The number of demolitions remained stable, as did the number of buildings with one added floor and those unchanged, suggesting saturation or a slowdown in the verticalization process. This may be due to the Brazilian economic crisis that worsened after 2017 and continued to impact the construction sector, especially until 2023, as well as the effects of the COVID-19 pandemic from 2020 to 2022 [,].
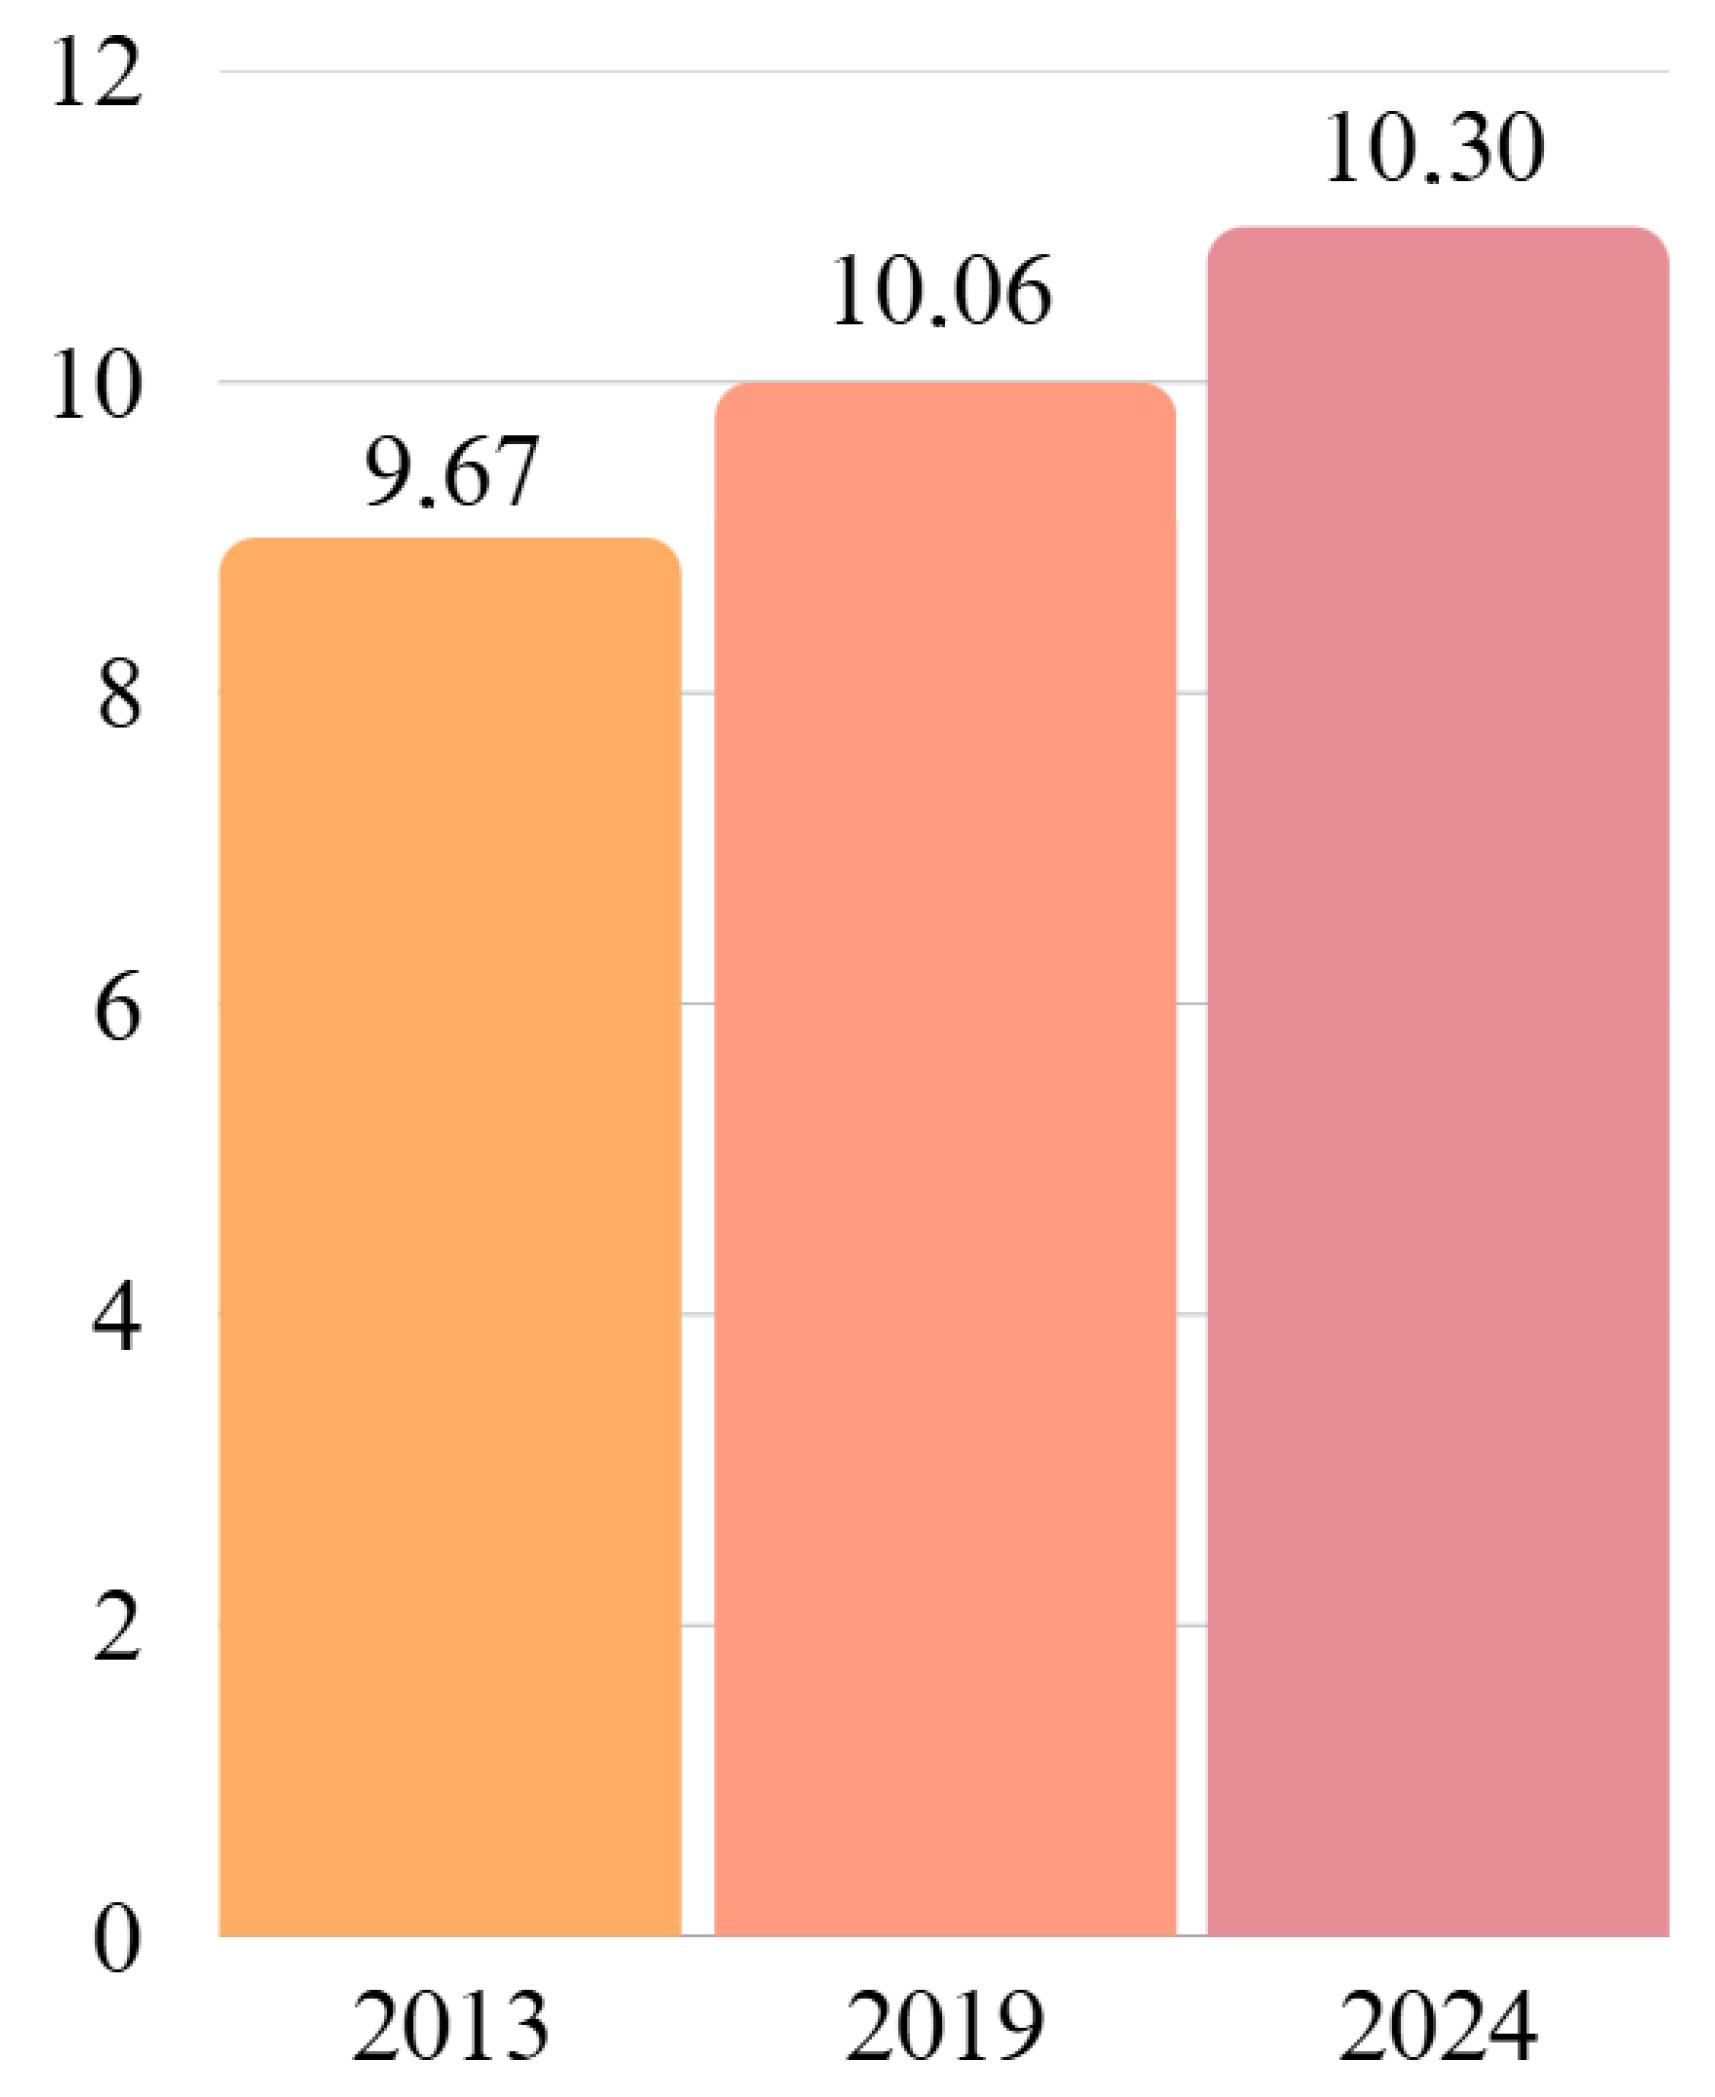
In addition, the average building heights were calculated for the three time periods (Figure 20). The average height in 2013 was 9.67 m; in 2019 it was 10.06 m; and in 2024, it reached 10.30 m. These values indicate that the study area experienced an average height increase of approximately 0.63 m over eleven years.
Figure 20.
Average building height, in meters, by period.
Figure 17 shows that vertical changes were more concentrated on the “edges” of the territory, though still fairly spread out, especially along the northern margin of the region. A comparison of Figure 17 and Figure 18 reveals that most demolitions occurred in recent years (after 2019), which may indicate even greater verticalization in the coming years, as plots of land may be cleared for new construction.
3.2. Microclimatic Simulations
Figure 21 presents a graphical representation of the components of the microclimate models generated, which were used as the basis for the microclimatic simulations. The models included buildings and vegetation as elements, along with sand, water, and cement as terrain components. The major critical differences between models refer to the Z-value of buildings, which shows the major change between the three time periods refer to verticalization.
Figure 21.
Microclimate models.
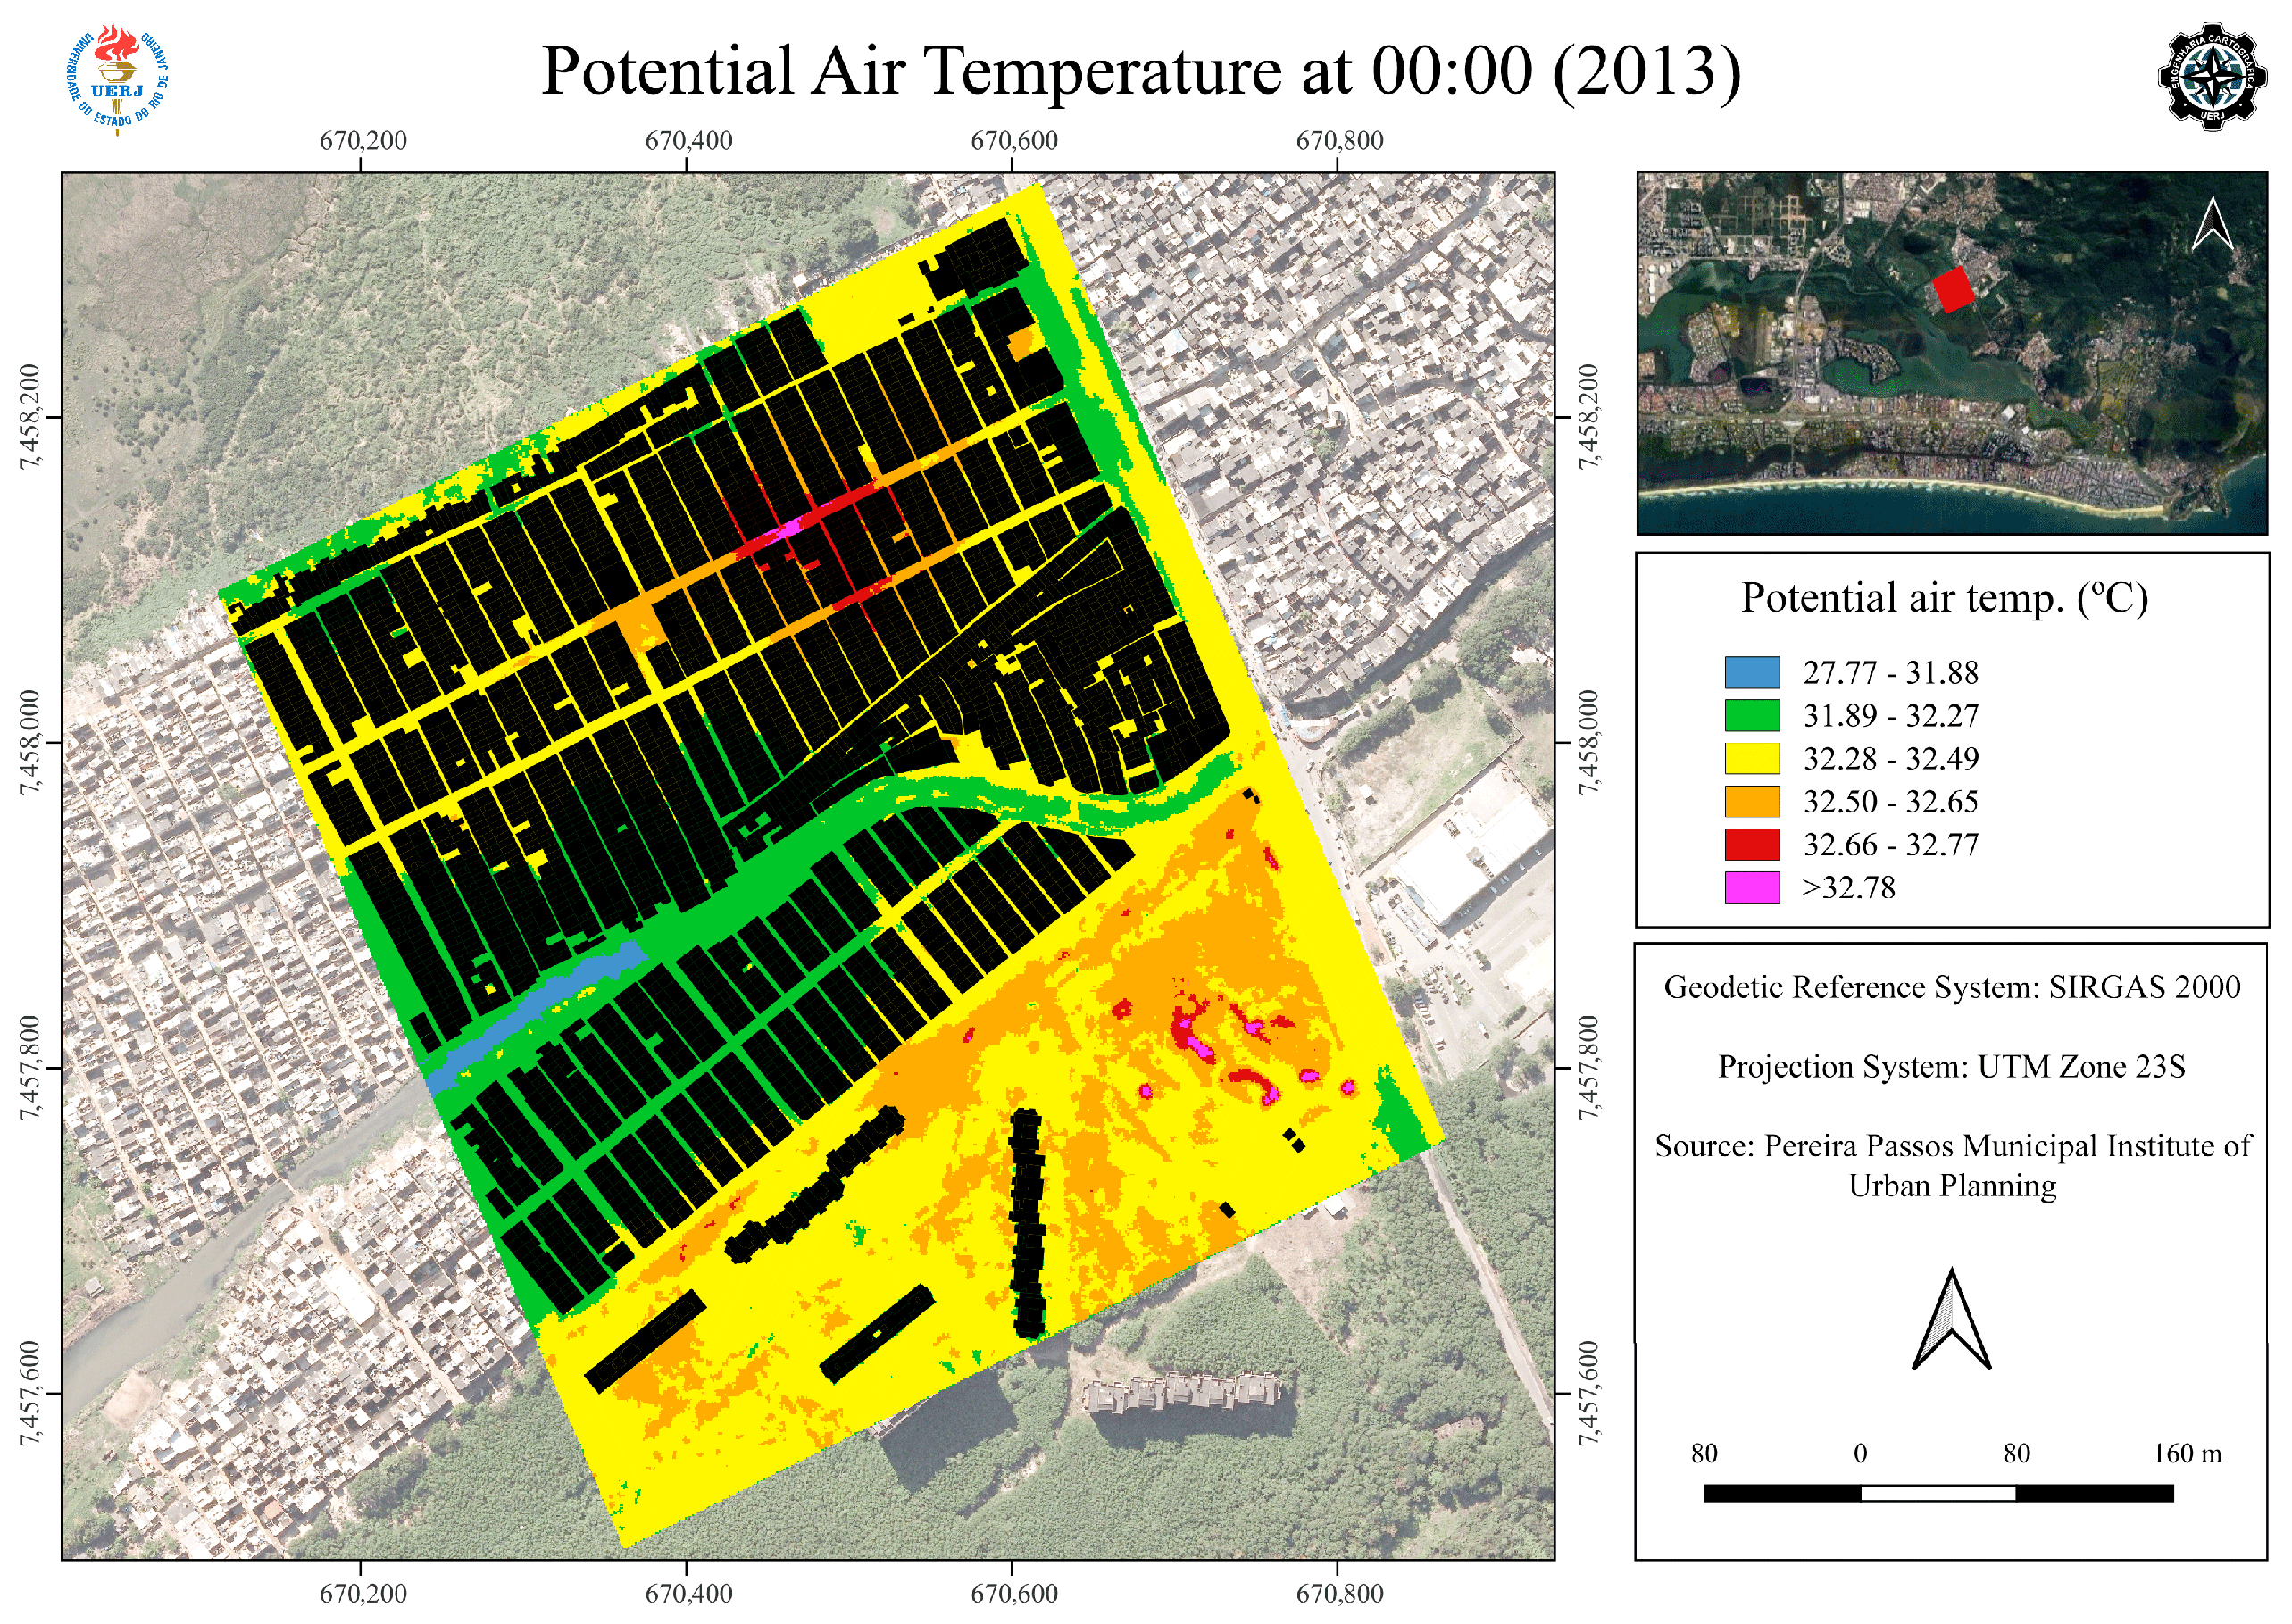
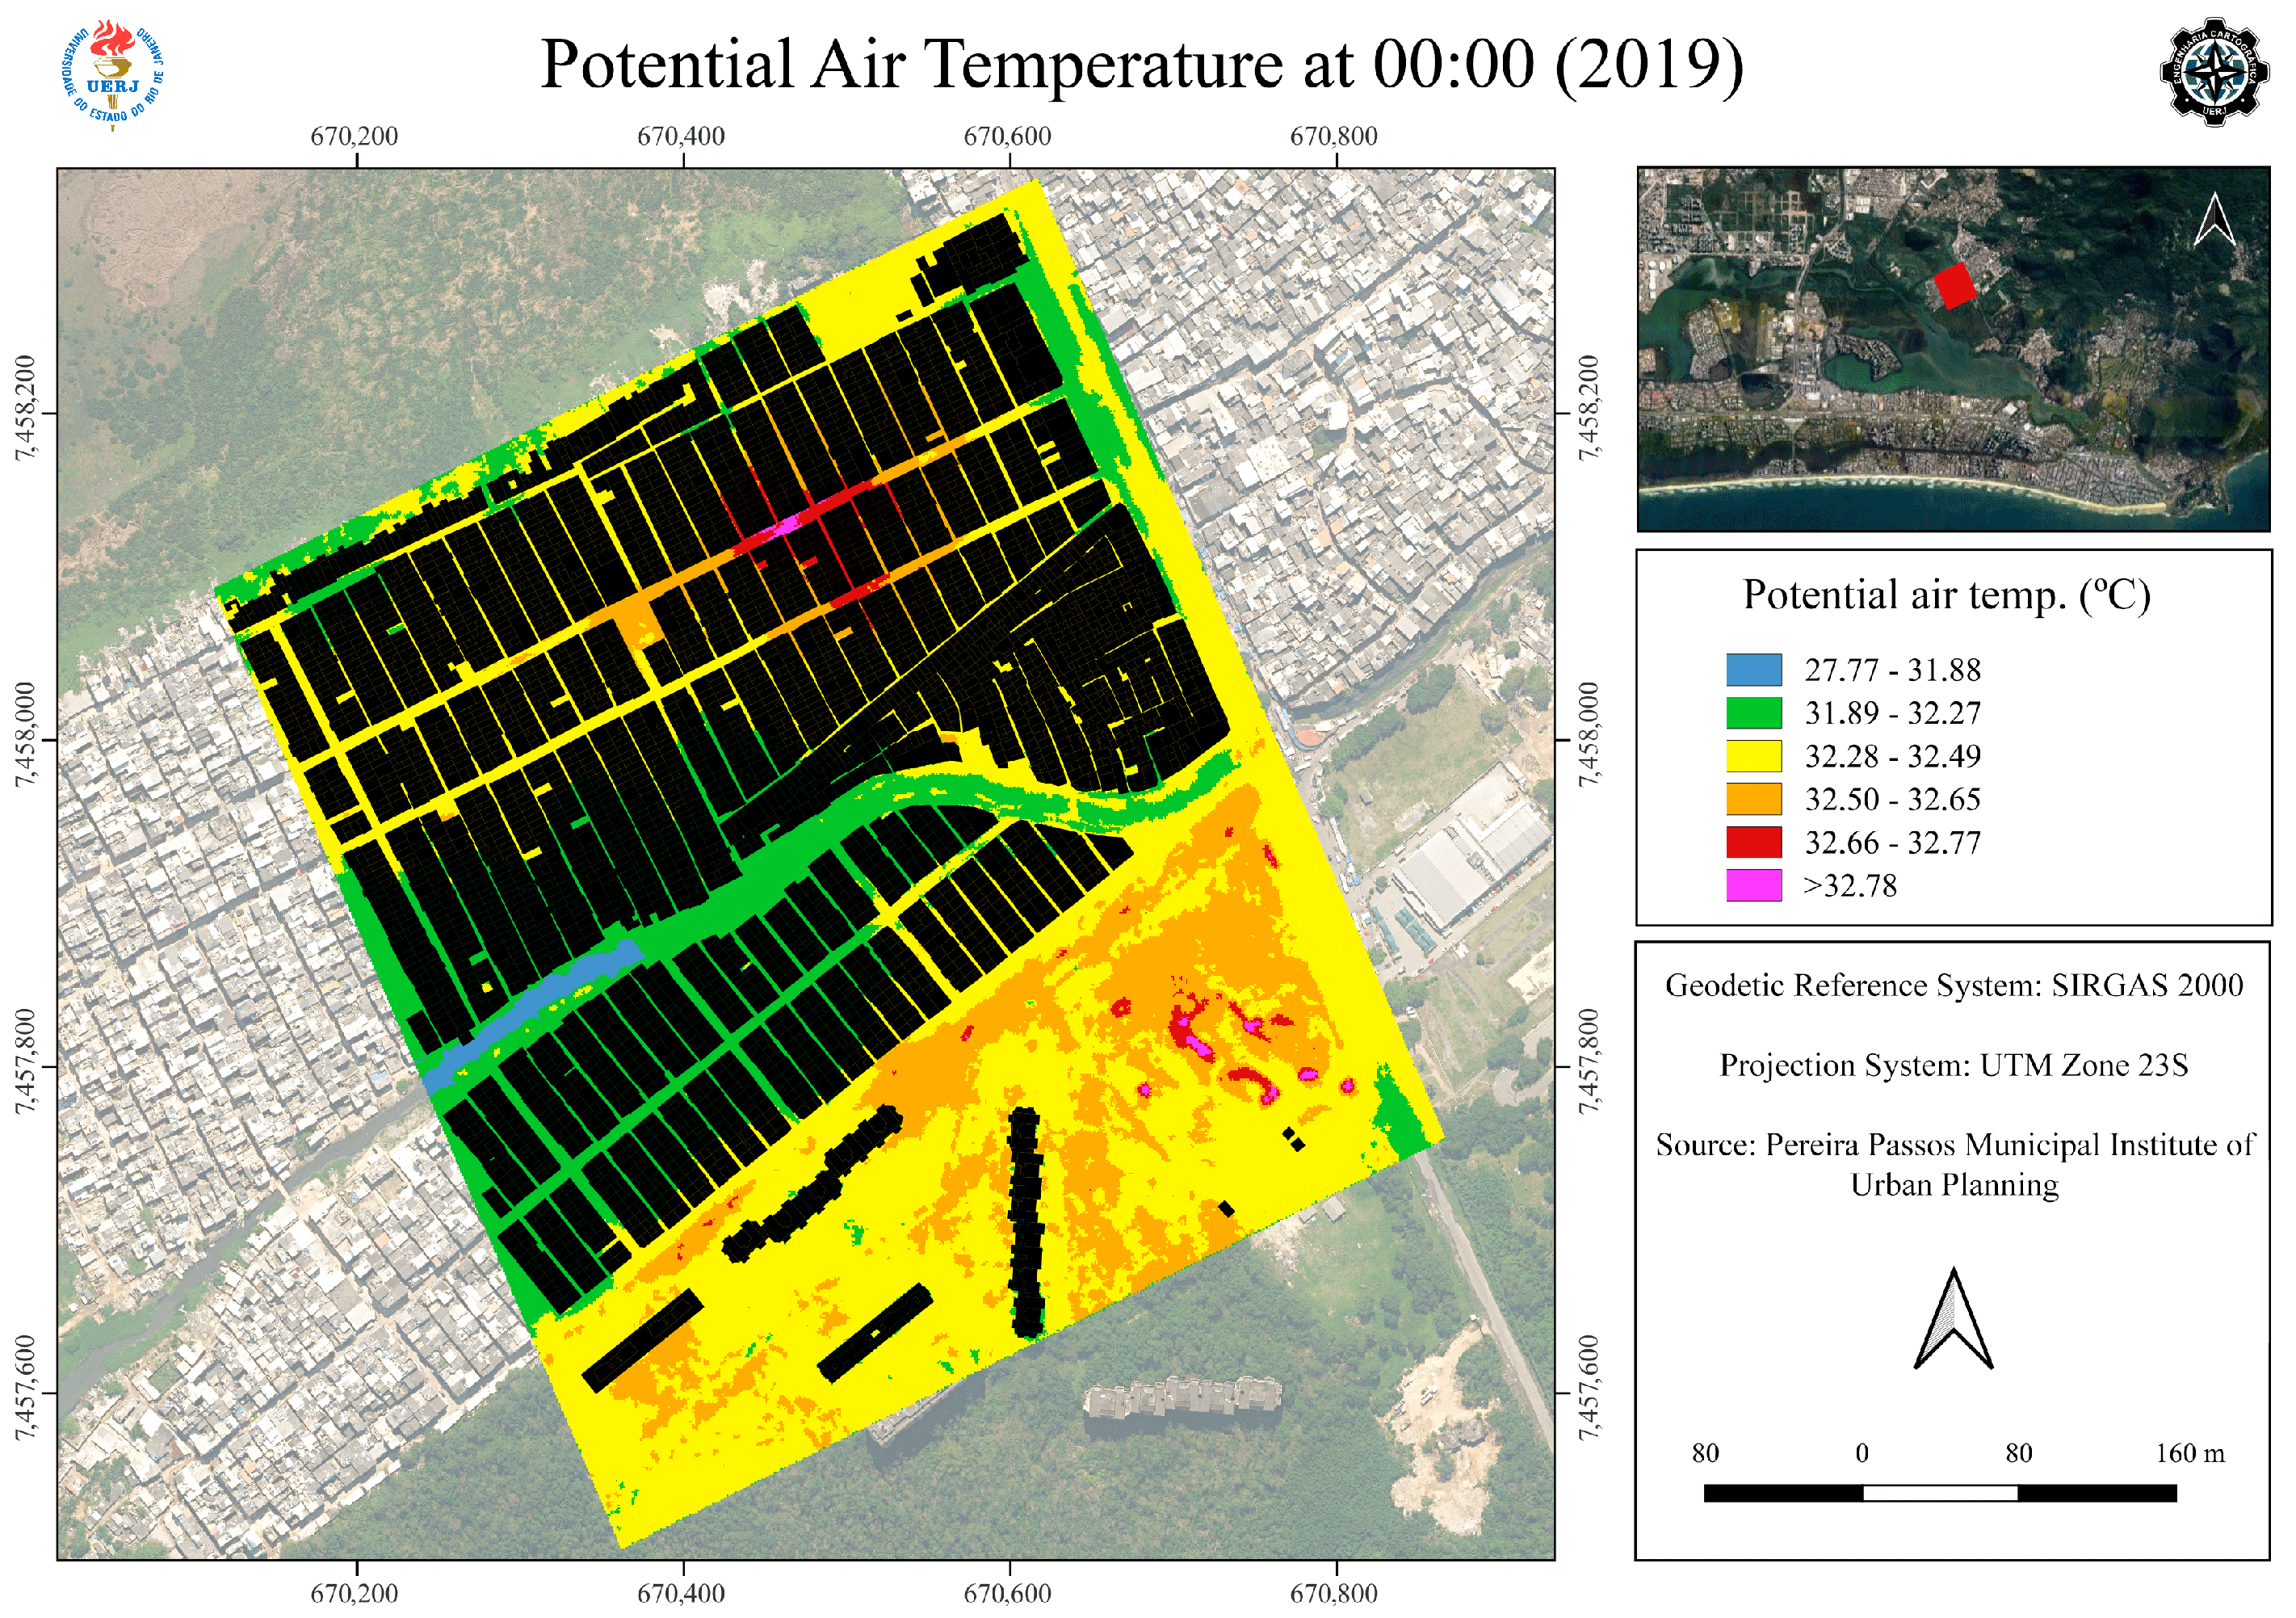
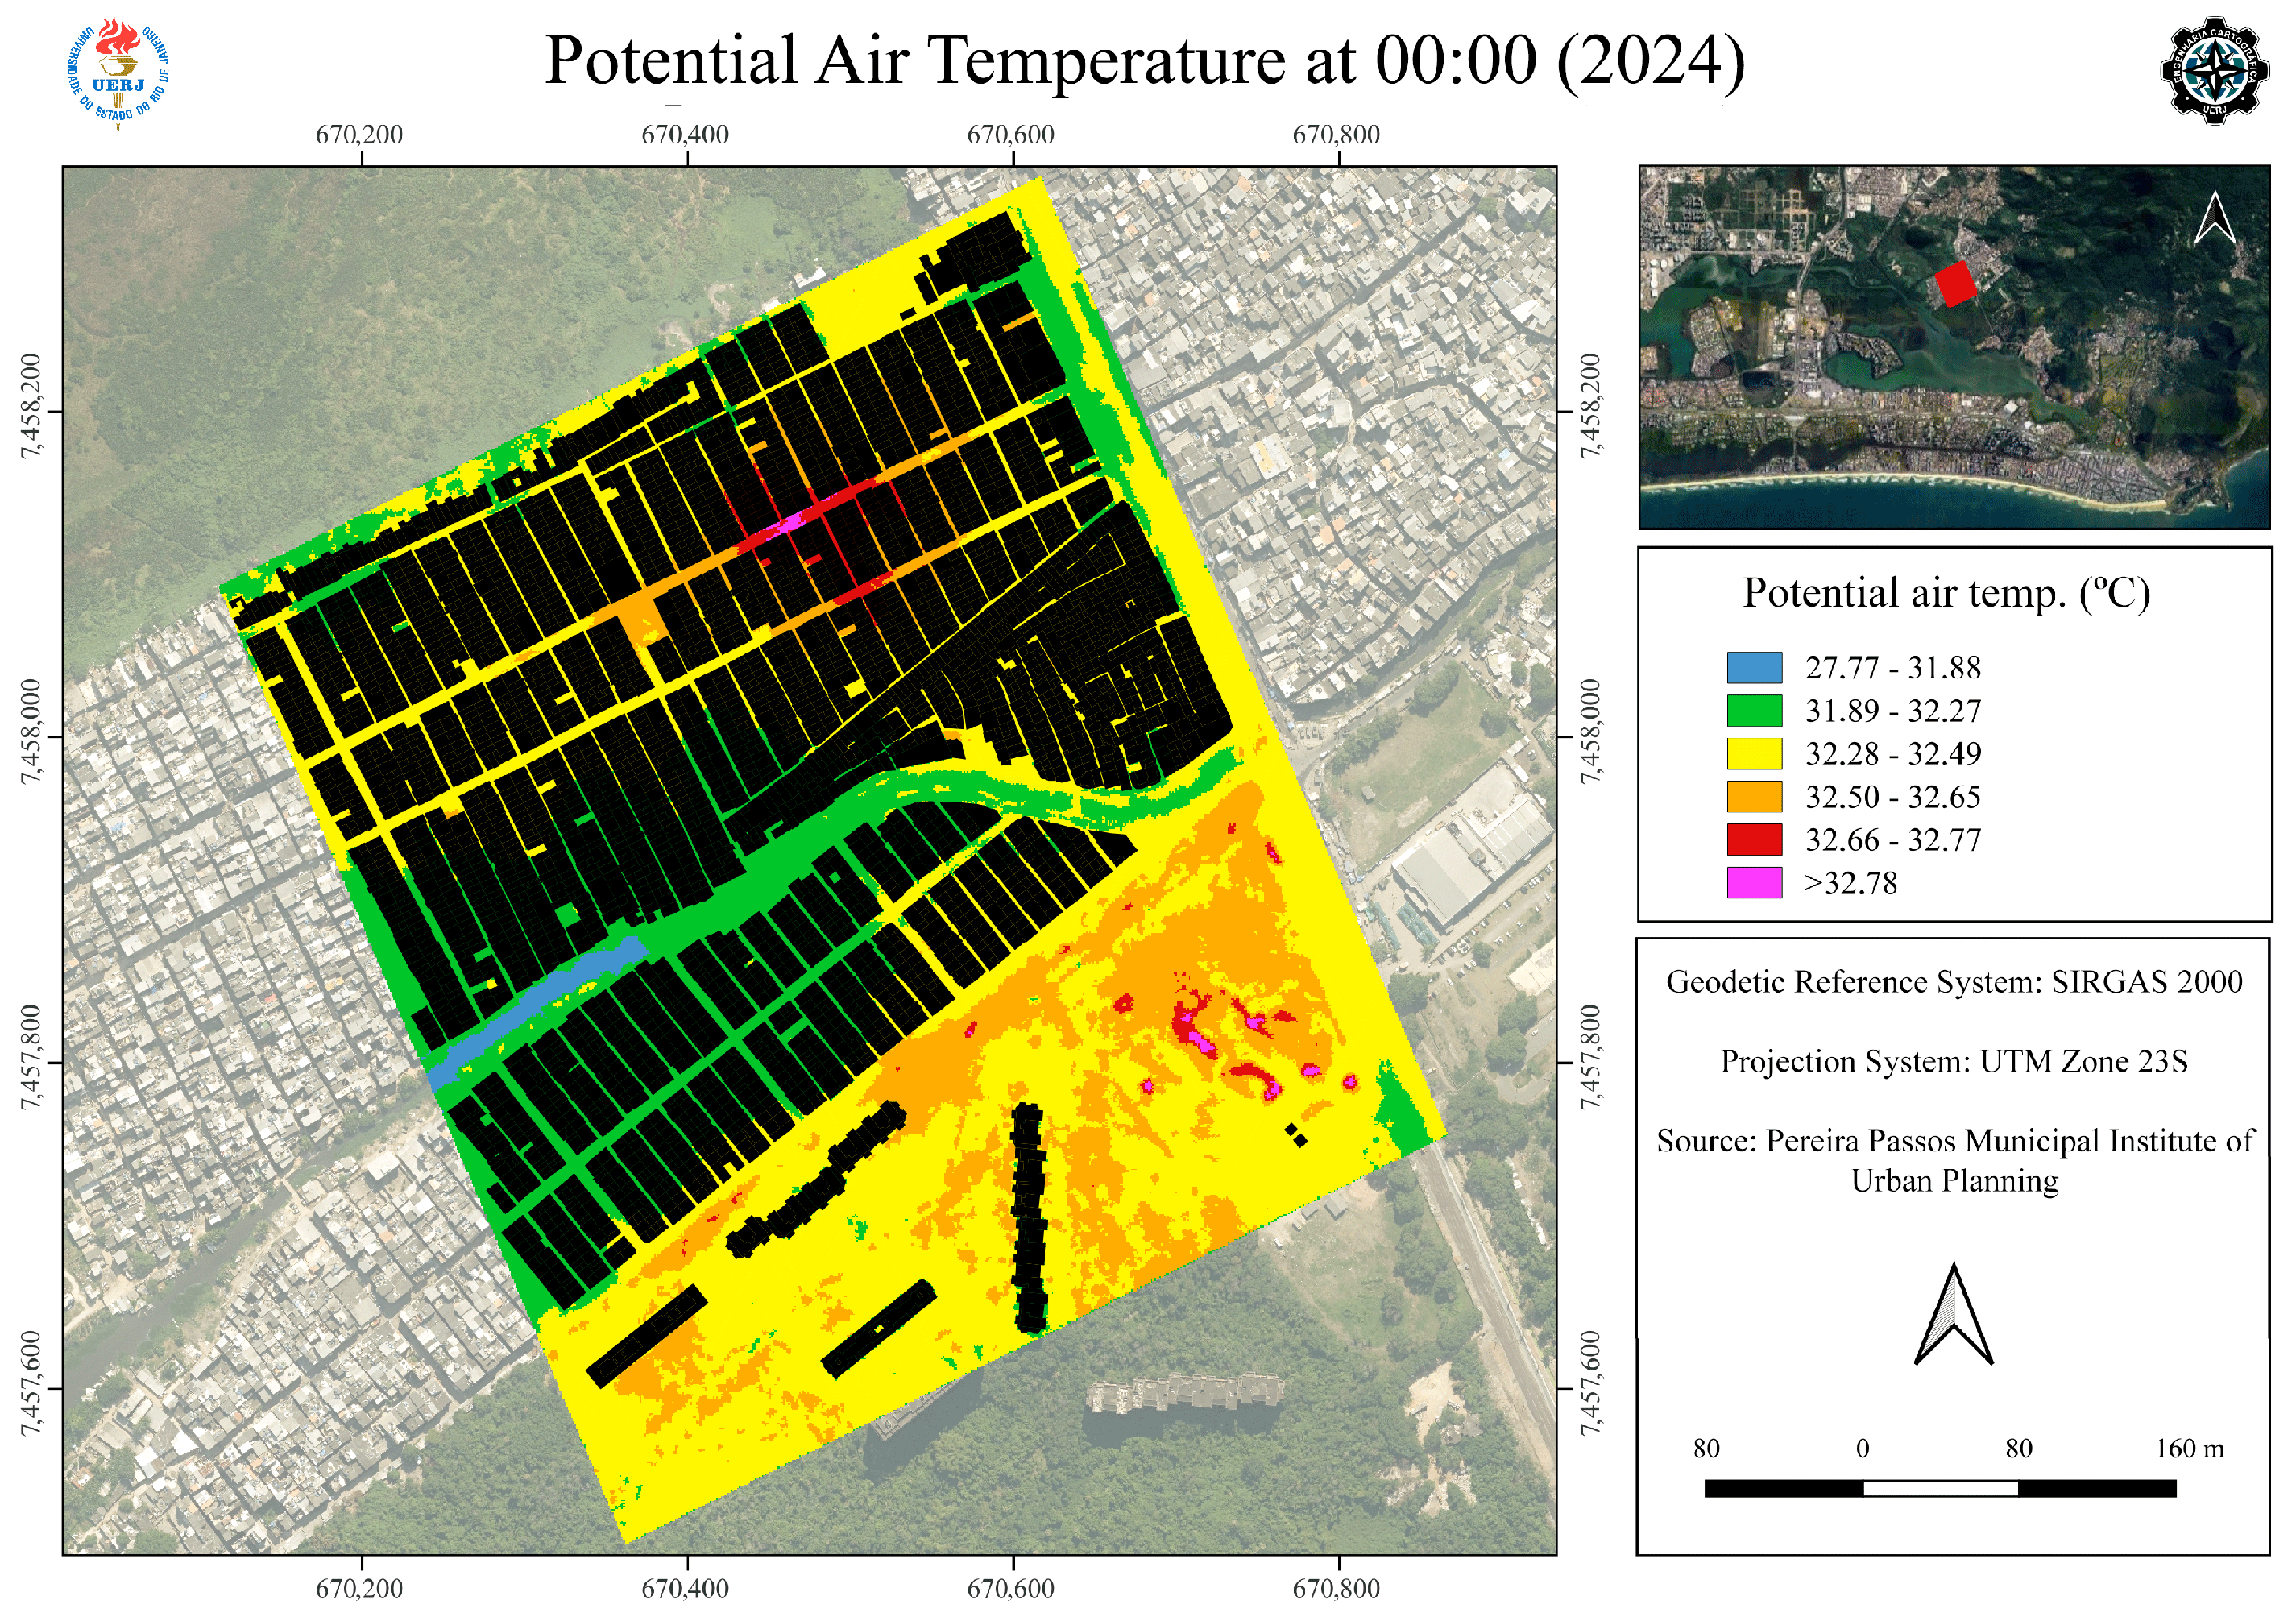
The results of the microclimatic simulations, focusing on the potential air temperatures observed during the three periods, at midnight are found in Figure 22, Figure 23 and Figure 24. The models showed consistent spatial air temperature patterns throughout the years, with a notable persistence of heat islands for hours after sunset. This behavior may be associated with heat retention by construction materials, which release heat slowly over time, as well as a lack of green areas and sufficient spacing between buildings, contributing to the formation of urban heat islands []. Overall, the three simulations consistently show a notably intense heat island in the northern part of the study area, with lower temperatures along the riverbank but not in the open area near the abandoned Delfim buildings.
Figure 22.
Potential air temperature for 2013.
Figure 23.
Potential air temperature for 2019.
Figure 24.
Potential air temperature for 2024.
While microclimate involves many elements (wind, humidity, solar radiation), this study uses potential air temperature at 1.5 m—a height relevant to most people—as a sensitive and socially understandable indicator of microclimatic change, despite the broader influence of other climatic elements. This height also circumvents several problems recently identified with rooftop-level strategies [], while producing results that demonstrate greater consistency in validation by different researchers.
3.3. Building Elevations and Potential Air Temperatures
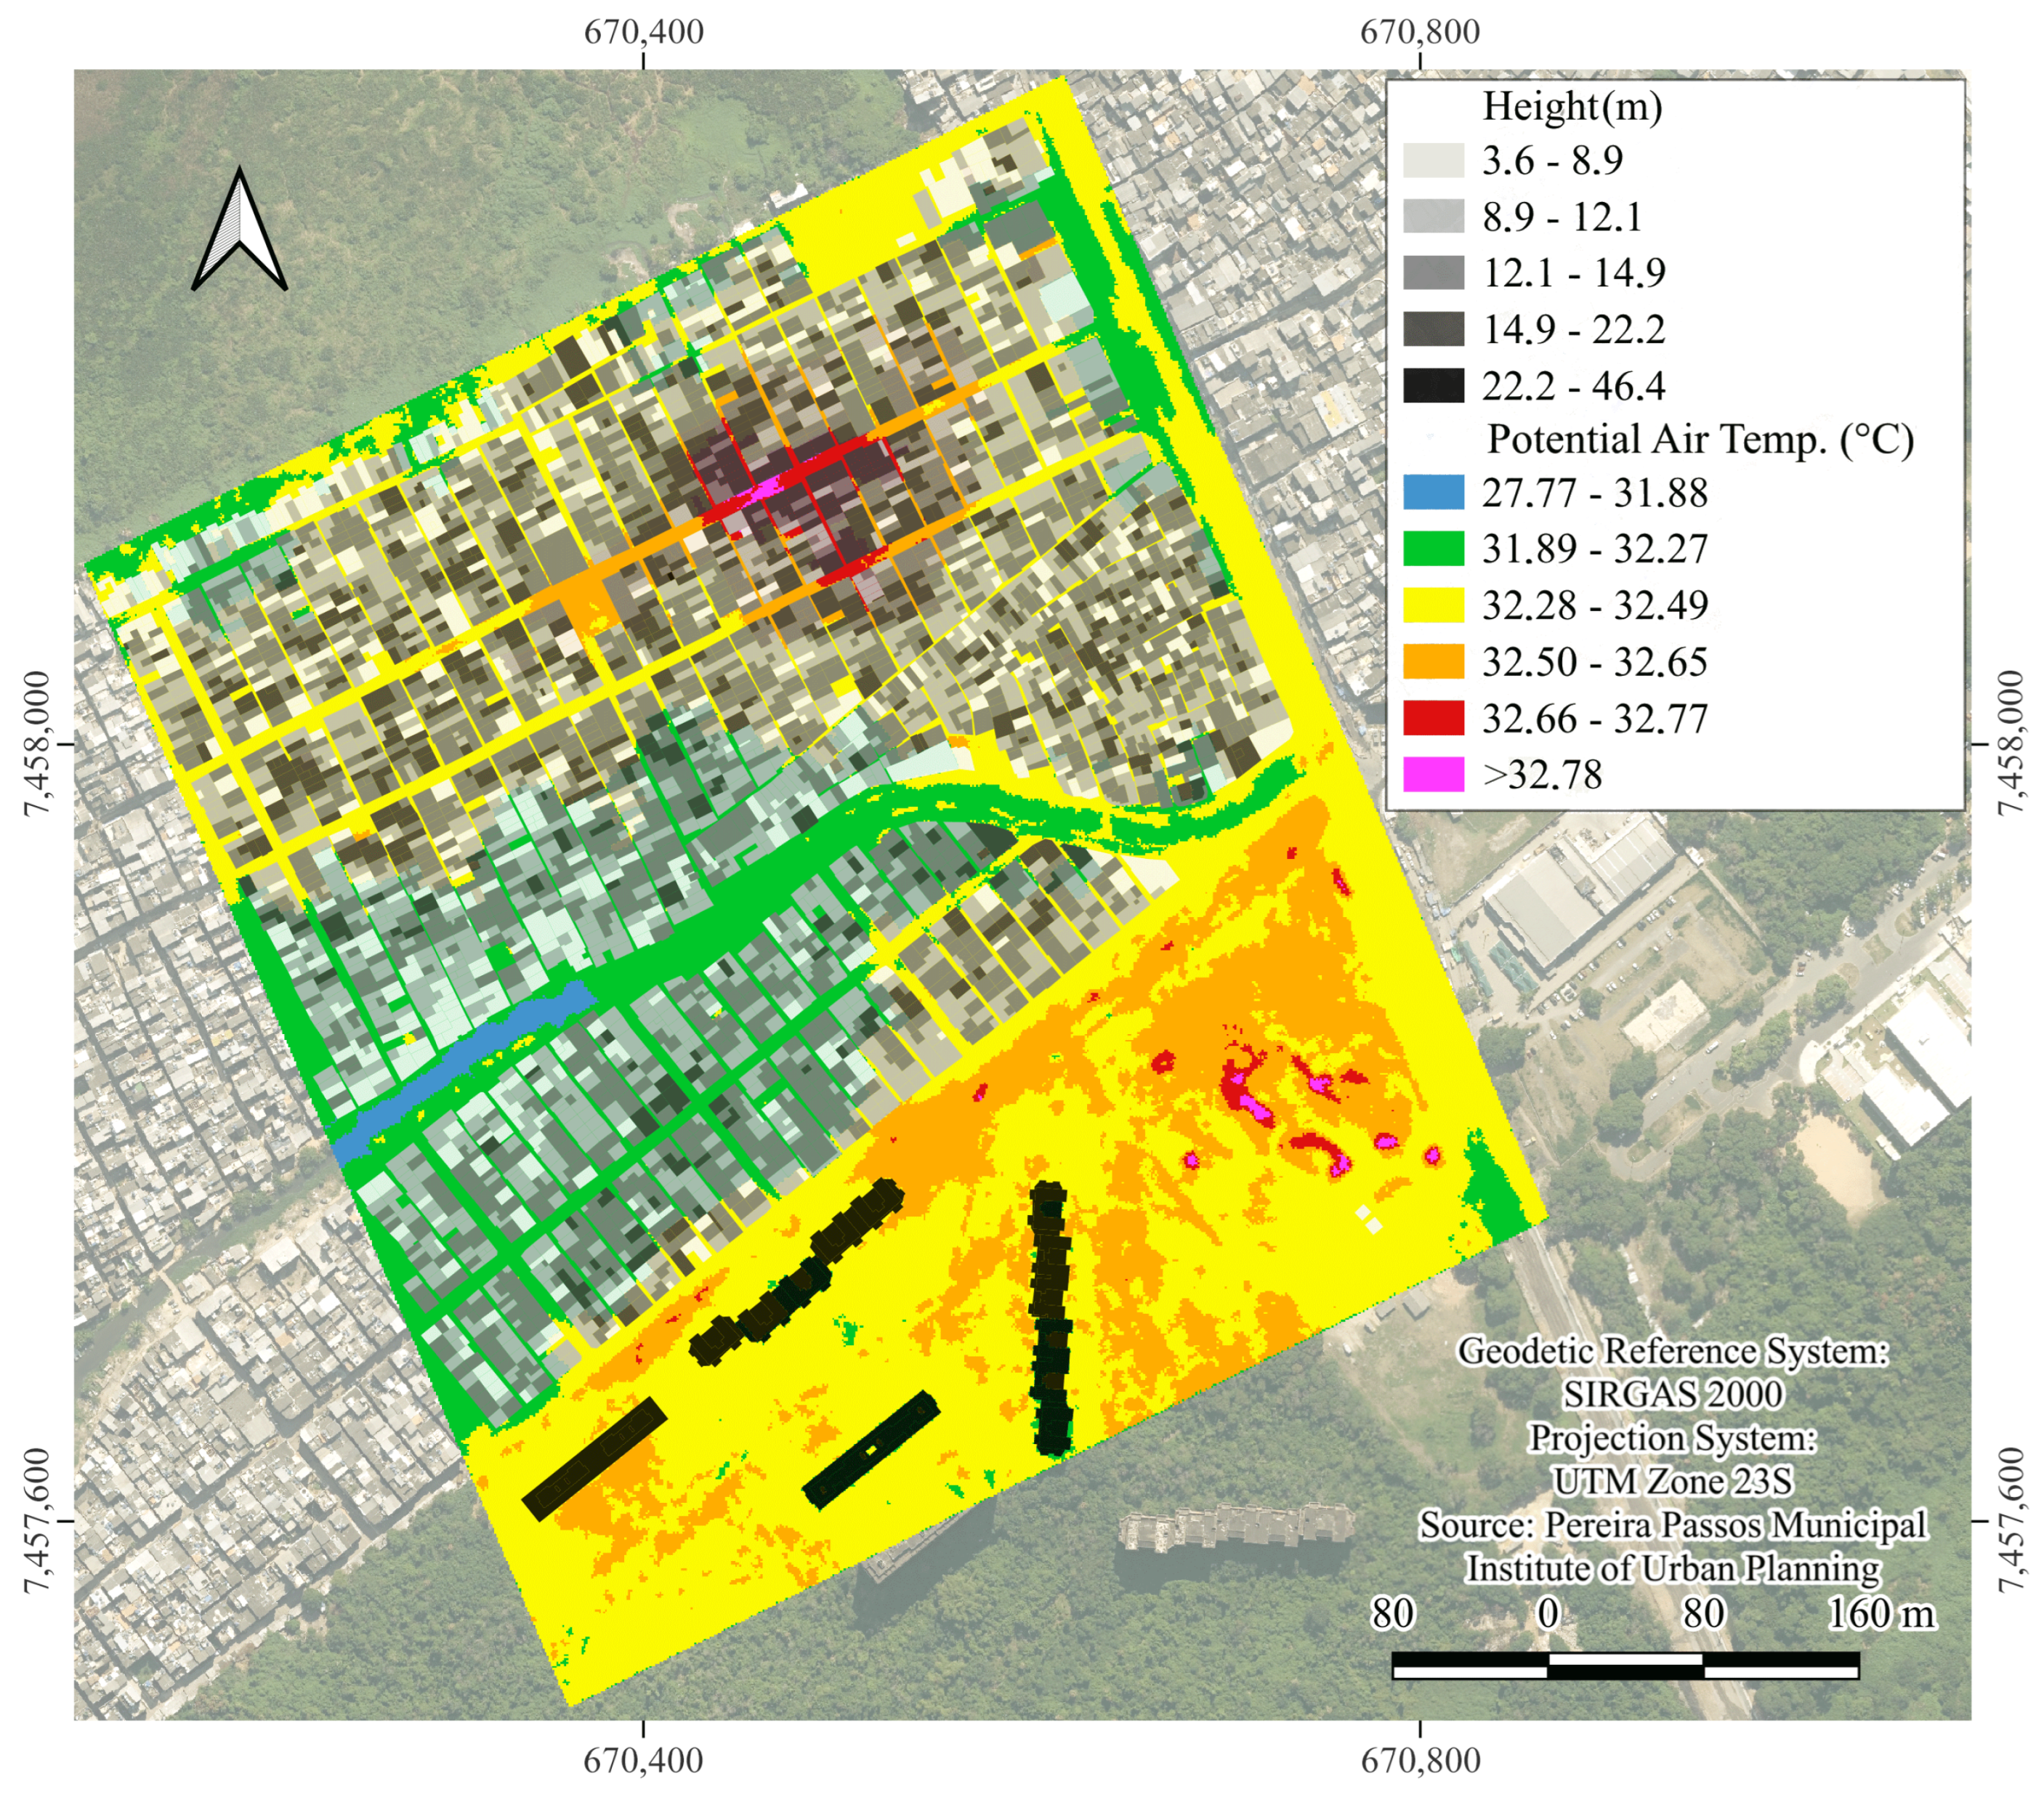
Figure 25 presents a composite map correlating building heights with the simulated potential air temperature for 2024, where building elevation is indicated by darker shades of gray. The map reveals a distinct and intense heat island, with temperatures exceeding 32.78 °C, situated in an area characterized by a high density of the tallest buildings. This contrasts with other parts of the favela, where both the potential air temperature and average building height are lower.
Figure 25.
Relationship between potential air temperature and height, using the potential air temperature simulation for 2024.
This pattern underscores the significant influence of urban morphology on local climate []. A visual correlation stems: the peak maximum air temperature (indicated in red/pink) coincides precisely with the region of highest elevation and the most concentrated cluster of tall buildings. Conversely, the minimum air temperature (shown in blue) is located in the topographically lowest area, corresponding to the deepest part of the stream, where natural features likely promote cooling.
Furthermore, the consistency across all three temporal simulations is notable; each shows a marked heat island effect concentrated in the same central spot. This persistent hotspot is encircled by the favela’s tallest structures and is situated considerably far from the moderating influences of the riverbank and its sparse vegetation. The thermal gradient across the study area is substantial, with a difference of nearly five degrees Celsius between the coolest and hottest regions, highlighting the extreme microclimatic variability generated by the urban form.
3.4. Simulated Microclimate Evolution over Three Time Periods
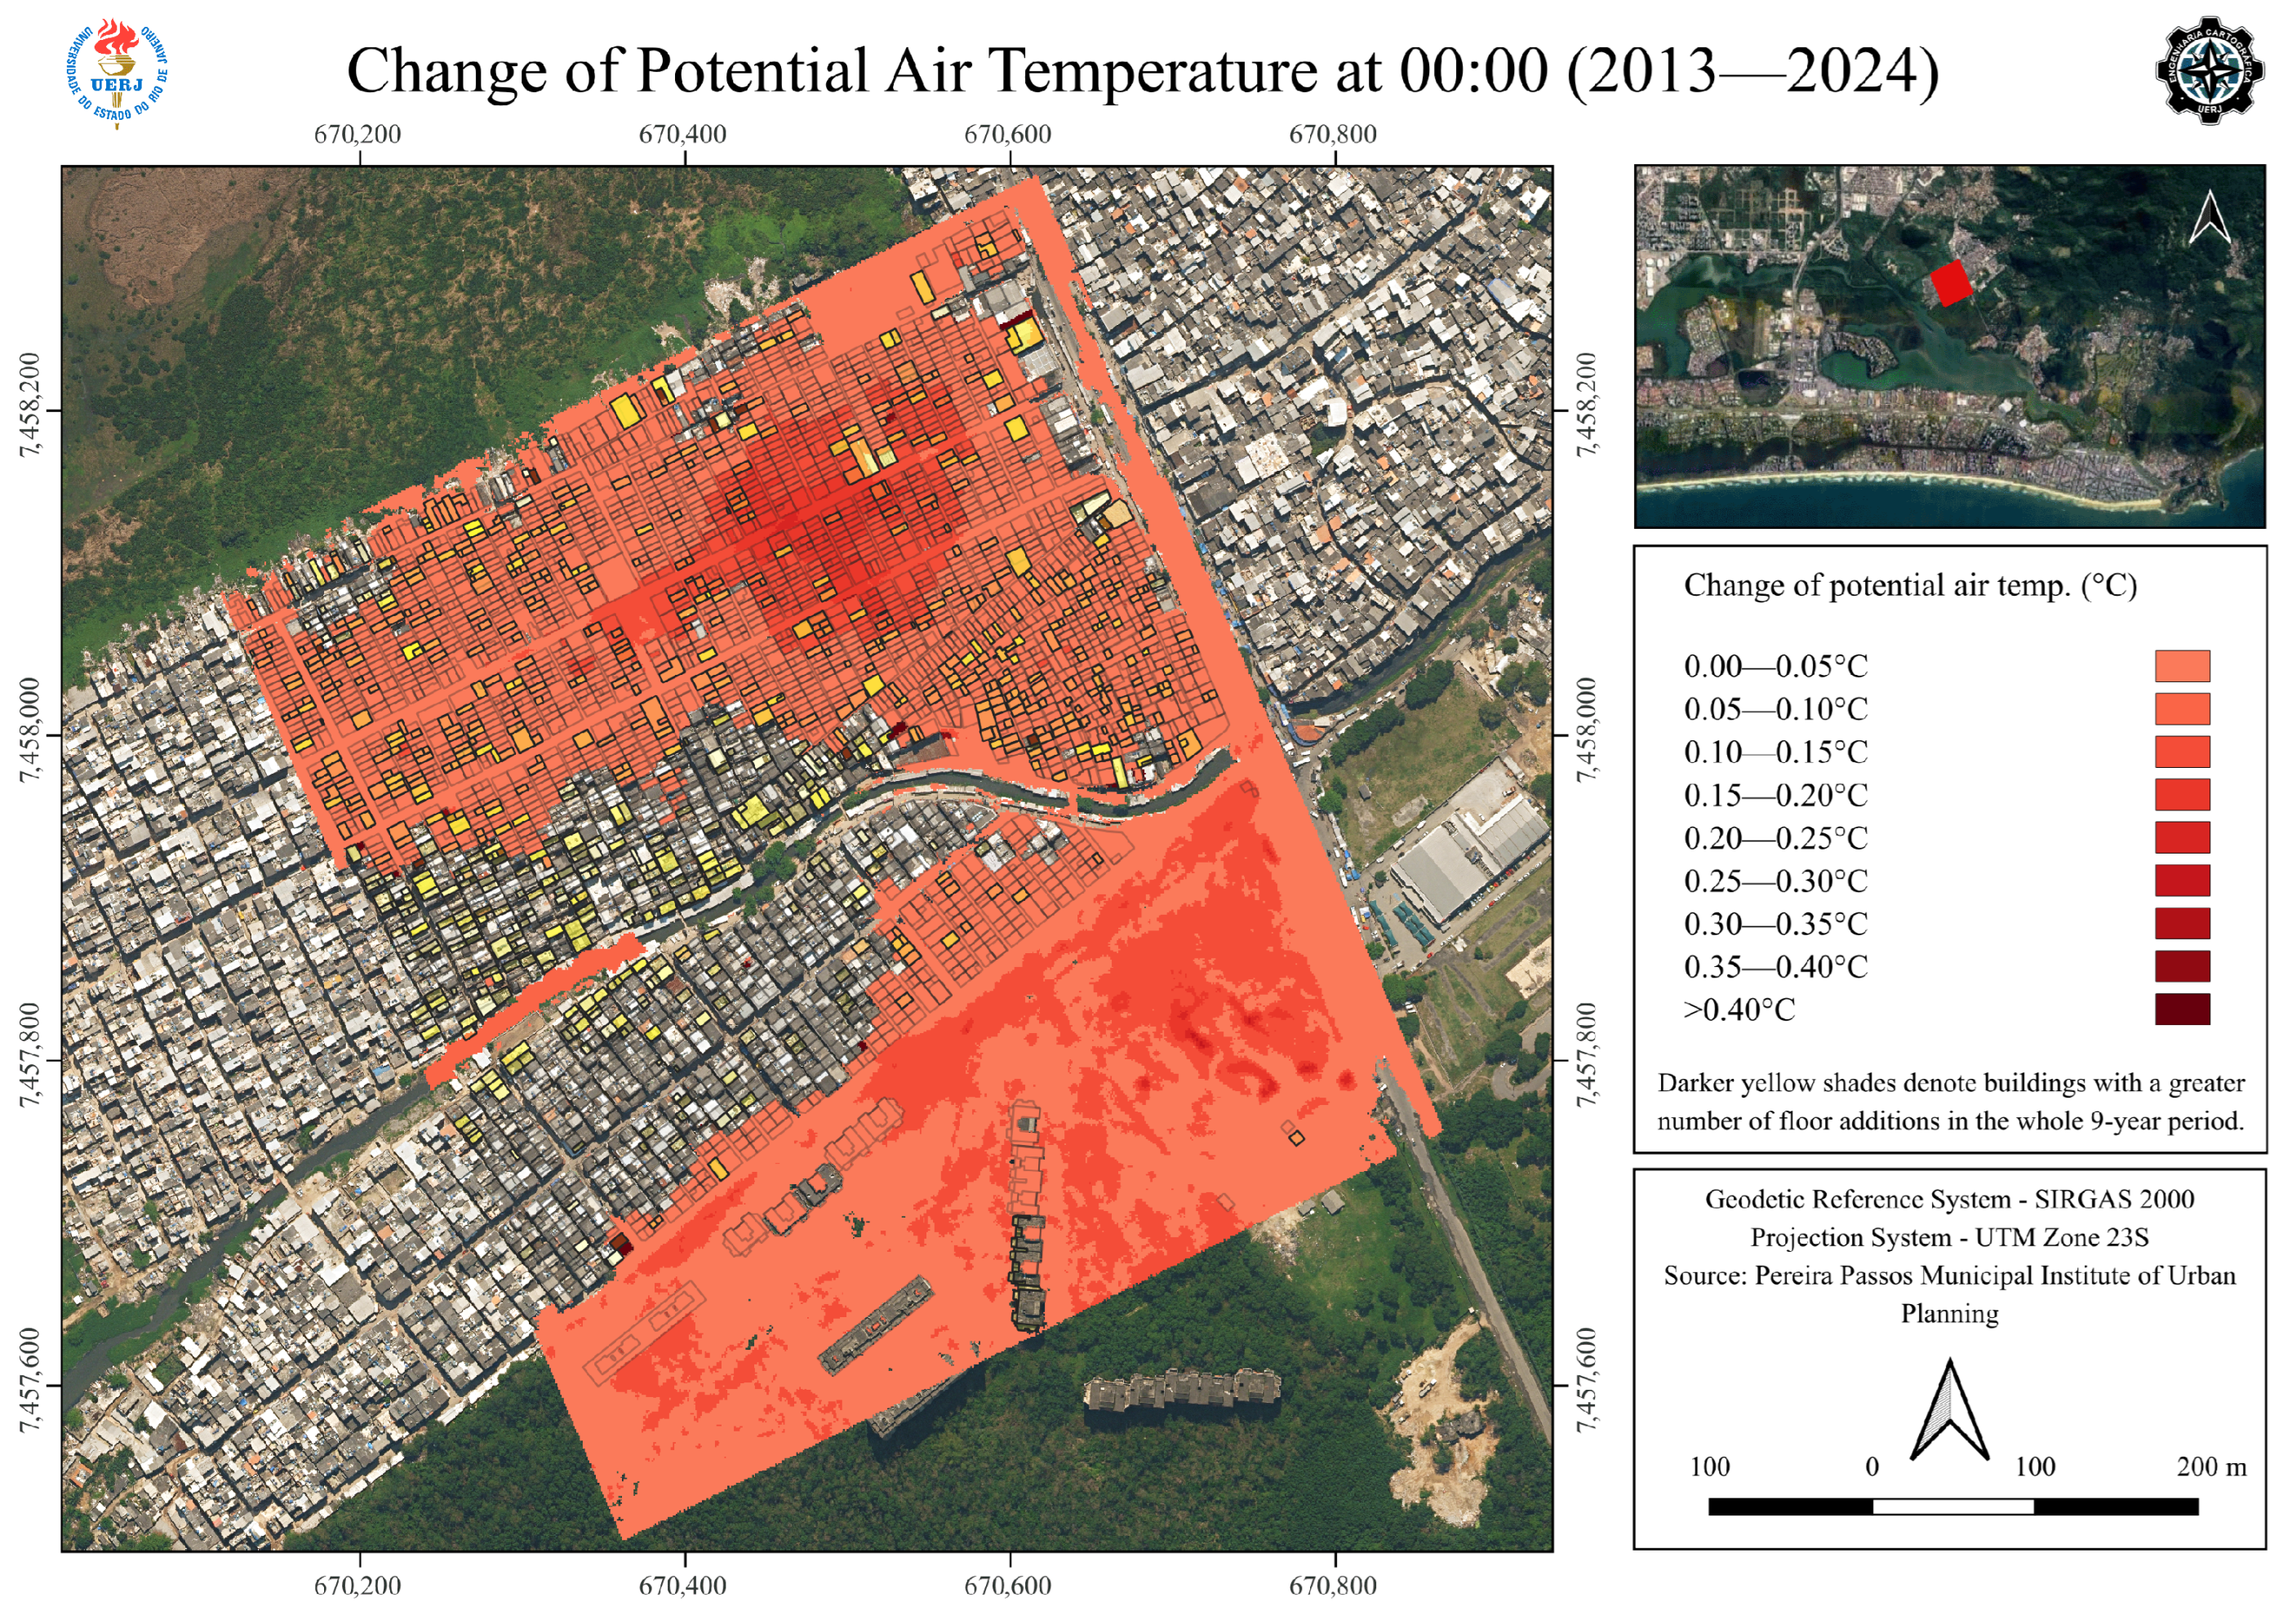
A preliminary visual inspection of the three simulations reveals a strong similarity, primarily due to their agreement on the location of the main urban heat island and a consistent overall temperature range. This suggests the foundational urban morphology [] has remained the dominant microclimatic force over the entire period. However, a focused contrast between the years uncovers a critical trend: from 2013 to 2024, the change is characterized by a unilateral warming. Specifically, across the whole interval (i.e., between 2013 and 2024), analysis shows isolated pockets where air temperatures increased at an average rate of up to 0.46 °C, with no observable areas exhibiting a decrease. As seen in Figure 26, these small, yet noticeable changes, cover most of the study area.
Figure 26.
Change in potential air temperature between 2013 and 2024.
This pattern of monotonic intensification suggests a correlation with urban development data. These warming pockets consistently align with areas that underwent vertical building expansion (represented in yellow), indicating that localized densification (even from just a few buildings) is a primary driver of microclimatic warming in this environment, layering additional heat onto the existing stable framework. The riverbank (particularly along its wid est section) was the only area where variations in building height did not increase air temperature. However, a small strip of the western riverbank constituted an exception, showing a temperature increase. This specific area has experienced particularly intense construction.
3.5. Complementary Indices for the Simulation Date
Table 5 presents the minimum and maximum values for the summer day used in the ENVI-met simulation (18 November 2023), including air temperature (Ta), mean radiant temperature (MRT), surface temperature (Ts), wind speed (V), and relative humidity (RH). Table 6 shows the calculated PET, PMV, and UTCI values.
Table 5.
Data collected on 18 November 2023.
Table 6.
Calculated results of PMV, PET, and UTCI.
It can be observed that the region experiences significant thermal stress even during periods with lower air temperatures, due to very high solar radiation (MRT > Ta), which indicates moderate to strong heat discomfort. Furthermore, the thermal stress intensifies during the afternoon hours.
4. Discussion
4.1. Simulation Results
This study aimed to analyze part of the Rio das Pedras favela across three distinct periods (2013, 2019, and 2024), using digital surface models and microclimatic simulations to investigate urban morphological changes in Rio das Pedras, with a focus on its verticalization. The goal was to assess the occurrence of microclimatic alterations and identify which elements might influence the local air temperature. The results clearly indicate the intense construction dynamics in Rio das Pedras in recent years, as demonstrated by the increase in the number of floors in hundreds of buildings and by the rise in the average building height across the different periods.
The region experiences significant thermal stress, which lingers during the afternoon hours, as evidenced by indices such as PET, PMV, and UTCI. The significant thermal discomfort recorded during the early morning, driven by high mean radiant temperatures, highlights the dominant role of solar radiation and stored heat in the urban fabric.
Following the simulations, it was found that there were no drastic changes in the distribution of the heat island across the three periods, mostly due to the fact that the slum was already heavily populated in 2013. However, persistently high air temperatures were observed at midnight, several hours after sunset. The limited nighttime cooling can be attributed to the materials used in building construction and ground cover. This scenario, characterized by poor heat dissipation and limited airflow, reinforces the formation of urban heat islands, resulting in higher energy consumption due to the continuous use of air conditioning. It was also found that the riverbank showed considerably lower potential air temperatures, which can be explained by the formation of a wider corridor but should also be taken with care, as further explained in the next section.
The Delfim abandoned buildings present somewhat high potential air temperatures despite not being located in a densely populated area. This can be explained by two key factors: their structural characteristics and their immediate environment. The abandoned concrete skeleton structures retain and redistribute stored heat, a phenomenon intensified by their height. Furthermore, the building layout hinders wind circulation, which reduces heat dissipation and results in elevated air temperatures that persist even at night. Compounding this effect is the nature of the surrounding vegetation, which is composed mostly of grass and features large pockets of exposed rock and sand. This landscape provides little mitigation against solar gain and contributes to the overall heat accumulation in the area.
Another important trend is the steady rise in potential air temperature over the 11-year period. Although minimal, this increase is significant considering that global warming of 1.5 °C above pre-industrial levels occurred over two centuries []. An increase of a few tenths of a degree Celsius over eleven years is therefore an alarming finding.
Finally, the reliance on simulation in this study necessitates a discussion of its empirical validation, while in situ measurements remain the essential standard for verifying microclimatic models [], they are often unfeasible in dense, informal settlements due to significant security risks and complex topography that hinder extensive field campaigns. This simulation-based approach therefore presents a distinct set of limitations and advantages. Its primary limitation is that it does not directly utilize a network of local in situ measurements; instead, it models the spatial distribution of air temperature based on an ensemble of topographic features, simulated materials and data from a meteorological station, among other variables. However, this very limitation reveals its core advantage: the methodology provides a viable and valuable alternative for estimating temperature variations with a reasonable degree of accuracy [] in areas that are otherwise inaccessible, enabling critical research in logistically challenging environments.
4.2. Adaptability of the Methodology Employed
ENVI-met has demonstrated considerable effectiveness as a predictive tool [,,]. However, it is important to note that the model is not entirely grid-independent, and its calculations may be less accurate in certain scenarios—such as assessing rooftop-level mitigation strategies []. Despite these limitations, its findings remain reliable when applied at the urban street level, where it consistently reveals a clear correlation between high-density vertical development and localized air temperature increases.
Also, it is worth noting that although ENVI-met is suitable for tropical regions, it uses European parameters where water bodies have a significant cooling effect. ENVI-met models water based on the characteristics of temperate climates, where it exhibits a more pronounced cooling effect []. In tropical regions; however, water bodies can potentially form heat islands due to high evaporation rates. Nevertheless, ENVI-met’s overall performance is appropriate for most urban studies [].
Furthermore, there is also a need to refine the models and microclimatic simulations by incorporating features not included in this study, such as hourly simulations, point vectors for trees and pollution sources, and optional software modules, to determine whether more accurate results can be achieved.
It is also important to acknowledge the simplifications inherent in the simulation. A primary limitation was the homogenization of building materials, where all façades were modeled as brick and all roofs as light concrete, while these are common materials in favelas, the real-world environment features a diverse array of heat-retaining and radiating materials, many of which may have thermal properties different from the modeled ones. Consequently, while the simulation successfully replicated the urban morphology, such as the dense building arrangement and narrow alleyways that restrict ventilation, it could not fully capture the complex thermal dynamics introduced by material heterogeneity. Neither the simulation considered the presence of urban pollution, which can entrap heat even more intensely [] A further significant simplification was the exclusion of air conditioning systems. Their pervasive use of is known to reject waste heat, inadvertently intensifying the local heat island effect [] and contributing to a cycle of escalating energy consumption and ambient heat. The absence of this anthropogenic heat source in the model likely results in an underestimation of actual night-time temperatures.
A major consideration for interpreting these findings involves contextualizing the case of Rio das Pedras within the broader landscape of Rio’s favelas. Unlike the archetype of informal settlements sprawling across steep hillslopes, Rio das Pedras is situated on relatively flat terrain. This key morphometric difference means that future simulations in other poor communities must incorporate more varied and complex relief patterns to model airflow. Furthermore, the study area’s extreme built density resulted in a near-total absence of vegetation, a factor not representative of all informal settlements. There are favelas which contain pockets of trees and secondary growth, thus introducing additional variables such as shading and evapotranspiration into the microclimatic model. These specific characteristics—the flat topography and lack of greenery—do not invalidate the methodological framework developed here. Rather than that, they pose specific concerns that, while not fully addressed by this single case study, are essential for a comprehensive understanding of their microclimates.
Finally, this study relied on high-resolution data, including LiDAR, aerial imagery, and accurate building footprints, which were essential for developing a realistic microclimatic model. The success of such simulations is contingent upon the availability of precise spatial data, seasonal surveys, and local climatic information to perform the necessary iterations. Nevertheless, the methodological framework is adaptable. For other cities in the Global South facing similar challenges but lacking high-resolution data, collaborative initiatives offer a viable alternative. Participatory geospatial databases, such as OpenStreetMap for building footprints, and freely available global Digital Elevation Models (DEMs) can provide the fundamental spatial data required. When combined with long-term temperature records from local weather facilities, these resources make the reproduction of this study feasible, even if at a coarser resolution, while the model’s performance is optimal with high-accuracy inputs, the methodology itself can be successfully applied using open-source data, thereby enhancing its accessibility and potential for broader application.
4.3. Mitigation Strategies
While this article has aimed to develop methodologies for estimating microclimatic changes in dense, unregulated urban environments, it is equally critical to consider potential mitigation strategies. Such strategies are essential for enhancing urban comfort and supporting the sustainable reurbanization of deprived areas, moving beyond the simplistic and disruptive approach of displacing long-established populations. Urban configuration and building typology influence the microclimate, potentially creating or preventing heat islands []. Consequently, urban form directly impacts local energy consumption, connected to population and building density. The proportion of open to built-up areas, vegetation presence, solar orientation of streets, building heights and setbacks, street dimensions, and construction materials all influence urban quality and activities like mobility and land use distribution [,]. Building typology significantly affects natural lighting and ventilation, contributing to rational electricity use. Buildings are major contributors to urban energy consumption, but well-designed typologies can reduce this impact through bioclimatic principles. From a bioclimatic perspective, compact cities in humid tropical regions promote heat island formation, raising electricity consumption, excessive air conditioning use, and pollution []. Favelas often exhibit such problems due to high density and unplanned growth, intensified in areas with significant verticalization, as seen in Rio das Pedras.
The urban fabric of Rio das Pedras, characterized by its intense verticalization and dense layout, exemplifies the challenges endemic to informal settlements. Here, the combination of inadequate planning and high population density significantly intensifies microclimatic effects, creating a feedback loop that worsens thermal discomfort. As observed, localized air temperature increases were associated with areas of significant vertical expansion. This correlation suggests that continued vertical growth across the favela could catalyze the formation of new urban heat islands (UHIs), further degrading urban comfort. Consequently, effective mitigation strategies must prioritize curbing informal vertical expansion as a critical measure to prevent the emergence of new UHIs.
To mitigate these effects, urban planning strategies that can be adopted include the use of surfaces with reflective materials (high albedo) and increasing vegetation cover [,]. Urban vegetation shows great effectiveness in reducing air temperatures through processes of shading, evapotranspiration, and interception of solar radiation, potentially lowering local air temperature by up to 5 °C []. Therefore, interventions such as the creation of green areas, improved natural ventilation, use of more suitable building materials, and implementation of urban policies that promote more sustainable and balanced development would be necessary [,,,,,,], with consistent indications that a combination of cool pavements and extra trees may yield a drop of a couple degrees Celsius []. These measures could enhance not only the microclimate but also residents’ quality of life.
One intervention with immediate impact is the increase in urban vegetation (usually absent from slums, but very useful in reducing UHI effects in tropical climates) [], where intense solar radiation and high air humidity aggravate thermal discomfort [,]. The effectiveness of vegetation is maximized by using trees with dense canopies [] and a high Leaf Area Index (LAI), making it a viable solution to improve thermal comfort on a microscale. Complete shading of outdoor areas combined with evapotranspiration can reduce mean radiant temperature by up to 32 °C []. Ref. [] found canopy density as a critical factor for the effectiveness of tree planting, as overlapping tree crowns create continuous shaded zones, lowering air temperature by up to 2.8 °C. Conversely, sparse arrangements contribute less, especially during times of peak solar radiation.
In addition to tree planting, other forms of vegetation, such as green roofs and green walls, also help mitigate heat stress [,,,]. Combining these strategies with tree planting has shown a significant reduction in temperature in Colombo, Sri Lanka, approaching 2 °C during peak hours []. The benefits of tree planting are notable; however, for analyses and results that are more faithful to reality, it is essential to calibrate models with on-site data, ensuring the accuracy of ENVI-met simulations. This approach efficiently supports the development of urban solutions, in addition to incorporating parameters such as crown geometry and canopy leaf density in the tree models used [].
Other strategies can be employed to mitigate UHI effects, such as the use of high-albedo materials (cool roofs and pavements) []. However, Ref. [] emphasize that such a strategy is less effective in tropical climates than in temperate ones. This is due to differences in urbanization between these locations, since tropical cities are often situated in developing countries, with fewer surfaces suitable for replacement with cool materials, resulting in smaller temperature reductions in simulations. Urban ventilation is also a strategy to be considered, as it helps dissipate heat. Tropical cities, especially inland ones, tend to have lower wind speeds, which may be further influenced by local urban morphology []. The orientation of buildings and streets can improve airflow, but the low wind speeds typical of these regions limit its impact [].
4.4. Participatory Planning and Slum Interventions
Rethinking the favela requires dialog with its residents. In this regard, the City Statute, established by Federal Law No. 10257/2001, represents a fundamental legal milestone for promoting dignified conditions in favelas by establishing guidelines for sustainable urban development and the social function of property. Through instruments such as the Master Plan, land regularization, and democratic management, the Statute seeks to ensure the right to housing, basic sanitation, and access to quality urban infrastructure, especially in historically neglected areas [].
According to the Statute, urban policy aims to organize the full development of the social functions of the city and urban property by guaranteeing the right to sustainable cities—that is, the right to urban land, housing, environmental sanitation, urban infrastructure, transportation and public services, employment, and leisure for present and future generations—as well as democratic management through the participation of the population and representative associations of various community segments in the formulation, implementation, and monitoring of urban development plans, programs, and projects. However, the effective implementation of these guidelines still faces challenges, such as lack of resources and the need for greater popular participation.
The integration of Geographic Information Systems (GIS) with microclimate modeling presents a transformative opportunity for data-driven urban planning []. This is critically needed in informal settlements, where traditional management strategies—such as large-scale evictions and standardized high-rise projects—often ignore socio-spatial dynamics and localized microclimates, exacerbating urban heat and displacing communities. Since any modification to the urban fabric can significantly alter microclimates and induce environmental discomfort, computational simulations are essential. They allow planners to evaluate changes proactively and select optimal interventions that promote thermal comfort and livability [,].
Based on such simulations, participatory GIS (PGIS) methodologies can enable precision interventions that balance upgrading efforts with community preservation. This is critically relevant in Rio das Pedras, where a severe urban heat island has already been identified, with additional hotspots likely if current urban patterns persist. These patterns are characterized by narrow alleyways, scarce vegetation, and the widespread use of heat-retentive materials like brick and concrete. Here, microclimate simulation tools combined with participatory mapping can empower community-led mitigation strategies—such as strategic vegetation planting, creating ventilation pathways, or selective building upgrades. This approach not only respects local socio-cultural networks but also enhances climatic resilience, offering a sustainable alternative to the demolition paradigm.
This integrated methodology is fundamentally aligned with the principles of environmental justice [], which advocates that all communities, regardless of socioeconomic status, have the right to a healthy environment. This framework recognizes that environmental harms, such as resource scarcity and ecosystem destabilization, disproportionately affect marginalized groups, reflecting deeper political and economic asymmetries []. In favelas, this historical neglect manifests as a lack of infrastructure, extreme heat, and vulnerability to disasters [].
Therefore, advancing environmental justice in these contexts requires policies that actively address these socio-environmental inequities, providing social cohesion and climate resilience []. It means securing basic rights like clean air, safe housing, and green spaces [,], while ensuring community participation in decision-making. In this pursuit, microclimate modeling and selective urban planning are key. By objectively identifying high-heat zones and optimizing green space distribution, these data-driven tools help prioritize interventions where they are needed most. This turns the principle of environmental justice into tangible action, guiding low-impact upgrades that improve livability and resilience without displacing the very communities they are designed to serve.
4.5. Summary of Possible Future Interventions
As a final summary, Table 7 lists the main mitigation strategies discussed herein. It also incorporates planning strategies previously discussed.
Table 7.
Comparison of mitigation and planning strategies and their effects on microclimate phenomena.
5. Conclusions
The findings of this study highlight the profound microclimatic consequences of unregulated vertical growth in Rio das Pedras, where rapid urbanization has intensified the urban heat island effect and worsened thermal discomfort for residents. The persistent high air temperatures, even after sunset, underscore the compounding effects of dense construction, heat-retentive materials, and restricted airflow: a scenario common in many informal settlements.
Microclimatic simulations revealed a rise up greater than 0.4 °C in a decade. between 2013 and 2024. This, coupled with the persistence of heat islands signals a critical threshold: the favela’s existing density had already locked in adverse thermal conditions. Consequently, any further vertical expansion is likely to intensify heat, particularly in the favela’s currently cooler areas where buildings are lower. The study further emphasizes the limitations of current modeling, underscoring the need to integrate more granular data—such as localized vegetation and pollution variables—to refine predictive accuracy.
The research underscores the urgency of rethinking urban upgrading strategies in favelas, moving beyond top-down redevelopment toward participatory, climate-sensitive solutions. Brazil provides a legal framework, through its City Statute, for such an approach, advocating for sustainable urban policies that prioritize resident well-being and environmental justice. However, translating these principles into action demands innovative tools like participatory GIS and microclimate modeling, which can identify localized heat mitigation strategies—such as strategic greening or improved ventilation—while preserving community cohesion.
Effective improvement of livability in poor Global South settlements requires proper participatory planning, through which local governments can implement a balanced mix of policies. Microclimatic simulations help identify areas where UHIs are most severe, guiding targeted urban interventions. When these strategies are combined with simulation technologies, urban spaces can be transformed into more resilient and habitable environments. Such investments not only enhance public health and reduce energy consumption, but also strengthen long-term sustainability. Ultimately, only through integrated efforts can cities break the cycle of climatic and social vulnerability in informal settlements, fostering cooler neighborhoods and more equitable futures.
Author Contributions
Conceptualization, J.G.M.F., G.S.B. and L.C.T.C.; methodology, G.S.B. and L.C.T.C.; software, J.G.M.F., L.F.d.A.F. and L.C.T.C.; validation, J.G.M.F., L.F.d.A.F. and L.C.T.C.; formal analysis, J.G.M.F. and L.C.T.C.; investigation, J.G.M.F., G.S.B. and L.C.T.C.; resources, L.F.d.A.F. and L.C.T.C.; data curation, L.F.d.A.F. and L.C.T.C.; writing—original draft preparation, L.C.T.C.; writing—review and editing, J.G.M.F., L.F.d.A.F. and G.S.B.; visualization, J.G.M.F.; supervision, L.C.T.C.; project administration, L.C.T.C.; funding acquisition, L.C.T.C. All authors have read and agreed to the published version of the manuscript.
Funding
This research was funded by Programa Prodocência—Universidade do Estado do Rio de Janeiro.
Data Availability Statement
Data regarding this study is available upon request.
Acknowledgments
The authors extend their sincere thanks to the Pereira Passos Municipal Institute of Urban Planning for providing the geospatial databases used for this study, especially to Felipe Cerbella Mandarino and Leandro Gomes Souza. The authors also thank ENVI-met GmbH for providing an educational license of its microclimate simulation software at a considerably lower cost.
Conflicts of Interest
The authors declare no conflicts of interest.
Abbreviations
The following abbreviations are used in this manuscript:
| AEIS | Área de Especial Interesse Social |
| (Area of Special Social Interest) | |
| CCD | Charge-Coupled Device |
| DEM | Digital Elevation Model |
| DSM | Digital Surface Model |
| DTM | Digital Terrain Model |
| FMC | Forward Motion Compensation |
| FOV | Field of view |
| GNSS | Global Navigation Satellite System |
| INMET | Instituto Nacional de Meteorologia |
| (National Institute of Meteorology) | |
| IPP | Instituto Municipal de Urbanismo Pereira Passos |
| (Pereira Passos Municipal Urban Planning Institute) | |
| LiDAR | Light Detection and Ranging |
| MRT | Mean Radiant Temperature |
| MSE | Mean-Square Error |
| NIR | Near-Infrared |
| PAN | Panchromatic |
| PEC-PCD | Padrão de Exatidão Cartográfica de Produtos Cartográficos Digitais |
| (Cartographic Accuracy Standard for Digital Cartographic Products) | |
| PET | Physiological Equivalent Temperature |
| PMV | Predicted Mean Vote |
| RGB | Red, Green, Blue (3 bands) |
| TDI | Time Delayed Integration |
| UHI | Urban Heat Island |
| UTCI | Universal Thermal Climate Index |
References
- United Nations. 68% of the World Population Projected to Live in Urban Areas by 2050, Says UN. 2025. Available online: https://www.un.org/tr/desa/68-world-population-projected-live-urban-areas-2050-says-un (accessed on 2 October 2025).
- Pandey, B.; Brelsford, C.; Seto, K.C. Infrastructure inequality is a characteristic of urbanization. Proc. Natl. Acad. Sci. USA 2022, 119, e2119890119. [Google Scholar] [CrossRef] [PubMed]
- Wu, S.; Chen, B.; Webster, C.; Xu, B.; Gong, P. Improved human greenspace exposure equality during 21st century urbanization. Nat. Commun. 2023, 14, 6460. [Google Scholar] [CrossRef]
- Taha, H.; Sailor, D.; Akbari, H. High-Albedo Materials for Reducing Building Cooling Energy Use; LBNL Report LBL-31721; Lawrence Berkeley National Laboratory: Berkeley, CA, USA, 1992. [Google Scholar]
- Yuan, F.; Bauer, M.E. Comparison of impervious surface area and normalized difference vegetation index as indicators of surface urban heat island effects in Landsat imagery. Remote Sens. Environ. 2007, 106, 375–386. [Google Scholar] [CrossRef]
- Taha, H. Urban climates and heat islands: Albedo, evapotranspiration, and anthropogenic heat. Energy Build. 1997, 25, 99–103. [Google Scholar] [CrossRef]
- Wang, H.; Yang, Y.; Liu, S.; Xue, H.; Xu, T.; He, W.; Jiang, R. Unveiling the Coupling Coordination and Interaction Mechanism between the Local Heat Island Effect and Urban Resilience in China. Sustainability 2024, 16, 2306. [Google Scholar] [CrossRef]
- Herath, H.M.; Halwaturab, R.U.; Jayasinghe, G.Y. Evaluation of green infrastructure effects on tropical Sri Lankan urban context as an urban heat island adaptation strategy. Urban For. Urban Green. 2018, 29, 212–222. [Google Scholar] [CrossRef]
- Ghaffarianhoseini, A.; Berardi, U.; Ghaffarianhoseini, A.; Al-Obaidi, K.M. Analyzing the thermal comfort conditions of outdoor spaces in a university campus in Kuala Lumpur, Malaysia. Sci. Total Environ. 2019, 666, 1327–1345. [Google Scholar] [CrossRef]
- Chatterjee, S.; Khan, A.; Dinda, A.; Mithun, S.K.; Khatun, R.; Akbari, H.; Kusaka, H.; Mitra, C.; Bhatti, S.S.; Doan, Q.V.; et al. Simulating micro-scale thermal interactions in different building environments for mitigating urban heat islands. Sci. Total Environ. 2019, 663, 610–631. [Google Scholar] [CrossRef] [PubMed]
- Shinzato, P.; Simon, H.; Duarte, D.H.S.; Bruse, M. Calibration process and parametrization of tropical plants using ENVI-met V4—São Paulo case study. Archit. Sci. Rev. 2019, 62, 112–125. [Google Scholar] [CrossRef]
- Rocha, E.; Paiva, A.L.; Drach, P.R.C.; Barbosa, G.S. Microclimatic strategies for “Vila Residencial da UFRJ”: Mitigating the effects of high temperatures. IOP Conf. Ser. Earth Environ. Sci. 2020, 503, 012043. [Google Scholar] [CrossRef]
- Silva, E.N.d.; Ribeiro, H. Temperature modifications in shantytown environments and thermal discomfort. Rev. Saude Publica 2006, 40, 663–670. [Google Scholar] [CrossRef]
- Sharmin, T.; Steemers, K.; Matzarakis, A. Microclimatic modelling in assessing the impact of urban geometry on urban thermal environment. Sustain. Cities Soc. 2017, 34, 293–308. [Google Scholar] [CrossRef]
- Nader, G. Esfera microclimática: Ventilação, conforto e moradia. IPT Tecnol. Inf. 2019, 2, 6–14. [Google Scholar]
- Instituto Brasileiro de Geografia e Estatística (IBGE). Favelas and Poor Urban Communities: IBGE Changes Name of Subnormal Agglomerates. Agência de Notícias IBGE. 2023. Available online: https://agenciadenoticias.ibge.gov.br/en/agencia-news/2184-news-agency/news/38973-favelas-and-poor-urban-communities-ibge-changes-name-of-subnormal-agglomerates (accessed on 15 October 2024).
- Censo Demográfico 2022: Favelas e Comunidades Urbanas: Resultados do Universo; Instituto Brasileiro de Geografia e Estatística: Rio de Janeiro, Brazil, 2024.
- Mazzone, A.; Cian, E.D.; de Paula, E.; Ferreira, A.; Khosla, R. Understanding thermal justice and systemic cooling poverty from the margins: Intersectional perspectives from Rio de Janeiro. Local Environ. 2024, 29, 1026–1043. [Google Scholar] [CrossRef]
- Tsoka, S.; Tsikaloudaki, A.; Theodosiou, T. Analyzing the ENVI-met microclimate model’s performance and assessing cool materials and urban vegetation applications—A review. Sustain. Cities Soc. 2018, 43, 55–76. [Google Scholar] [CrossRef]
- SABREN—Sistema de Assentamentos de Baixa Renda. 2024. Available online: https://sabren-pcrj.hub.arcgis.com/ (accessed on 2 October 2025).
- Mendes, I.C.R. Programa Favela-Bairro: Uma Inovação Estratégica? Master’s Thesis, Universidade de São Paulo, São Paulo, Brazil, 2006. [Google Scholar]
- Diário do Rio. Prédio Desaba em Rio das Pedras na Noite Desta Terça-Feira. 2023. Available online: https://diariodorio.com/predio-desaba-em-rio-das-pedras-na-noite-desta-terca-feira/ (accessed on 2 October 2024).
- Pereira, Y.M. Rio das Pedras: O Acesso à Energia Ontem e Hoje; Technical report; Pontifícia Universidade Católica do Rio de Janeiro (PUC-Rio): Rio de Janeiro, Brazil, 2017. [Google Scholar]
- O Globo. Imagens de Satélite Mostram Expansão ao Longo dos Anos em Rio das Pedras, Onde Prédio Desabou; Compare. 2021. Available online: https://oglobo.globo.com/rio/imagens-de-satelite-mostram-expansao-ao-longo-dos-anos-em-rio-das-pedras-onde-predio-desabou-compare-25047009 (accessed on 2 October 2024).
- Fonseca, M.S.; Freitas, M.J. POUSO Rio das Pedras: Diagnóstico Urbanístico e Ambiental; Technical report; Secretaria Municipal de Urbanismo (SMU): Rio de Janeiro, Brazil, 2013. Available online: https://www.rio.rj.gov.br/dlstatic/10112/5333332/4139326/26RiodasPedrasSMUCGPIS102014.pdf (accessed on 2 October 2024).
- Bienenstein, G.; de Sousa, D.M.M.; Bienenstein, R. Urbanização de Rio das Pedras: Por que uma Operação Urbana Consorciada? NEPHU—Núcleo de Estudos e Pesquisas Urbanas: Rio de Janeiro, Brazil, 2018. [Google Scholar]
- CNN Brasil. Desabamentos de Prédios em Rio das Pedras e na Muzema têm Semelhanças. 2021. Available online: https://www.cnnbrasil.com.br/nacional/desabamentos-de-predios-em-rio-das-pedras-e-na-muzema-tem-semelhancas/ (accessed on 2 October 2024).
- G1. Moradores de Prédios em Rio das Pedras Sofrem Pela Perda das Casas. 2012. Available online: https://g1.globo.com/rio-de-janeiro/noticia/2012/08/moradores-de-predios-em-rio-das-pedras-sofrem-pela-perda-das-casas.html (accessed on 2 October 2024).
- Extra. Rua Que Sofre Com Afundamento do Solo em Rio das Pedras Teve Rede Elétrica Desligada. 2016. Available online: https://extra.globo.com/noticias/rio/rua-que-sofre-com-afundamento-do-solo-em-rio-das-pedras-teve-rede-eletrica-desligada-18607556.html (accessed on 2 October 2024).
- G1. Morre a 24ª Vítima do Desabamento na Muzema. 2019. Available online: https://g1.globo.com/rj/rio-de-janeiro/noticia/2019/04/22/morre-a-24a-vitima-do-desabamento-na-muzema.ghtml (accessed on 2 October 2024).
- O Globo. Prefeitura vai Remover e Reassentar Três Mil Famílias de Rio das Pedras. 2010. Available online: https://oglobo.globo.com/rio/prefeitura-vai-remover-reassentar-tres-mil-familias-de-rio-das-pedras-2928322 (accessed on 2 October 2024).
- RioOnWatch. Em Terceira Maior Favela do Brasil, Rio das Pedras, Oscilações da Maré e Mudanças Climáticas Aumentam Alagamentos de Esgoto. 2024. Available online: https://rioonwatch.org.br/?p=70798 (accessed on 2 October 2024).
- UOL. Prédio Desaba em Rio das Pedras, Zona Oeste do Rio; Criança e Pai Morrem. 2021. Available online: https://noticias.uol.com.br/cotidiano/ultimas-noticias/2021/06/03/rj-predio-desaba-na-comunidade-do-rio-das-pedras.htm (accessed on 2 October 2024).
- Machado, E.P.; Barbosa, G.S.; Vazquez, E.G.; Drach, P.R.C. Evaluation of the impacts of urban form on the microclimate of neighbourhoodsin Rio de Janeiro, Brazil. PARC Pesq. Arquit. Constr. 2022, 13, e022017. [Google Scholar] [CrossRef]
- Moreira, M.A. Fundamentos do Sensoriamento Remoto e Metodologias de Aplicação; UFV: Viçosa, Brazil, 2007. [Google Scholar]
- Topocart Aerolevantamentos. Relatório de Execução de Bases Cartográficas na Escala 1:2000 (área Urbana/Comunidade de Baixa Renda) Por Restituição Aerofotogrametrica Digital e Geração de Ortofotos na Escala 1/10.000, Visando a Atualização da Base Cartográfica; Technical report; Topocart: Brasília, Brazil, 2013. [Google Scholar]
- Wolf, P.R.; Dewitt, B.A.; Wilkinson, B.E. Elements of Photogrammetry with Applications in GIS, 4th ed.; McGraw-Hill Education: New York, NY, USA, 2014. [Google Scholar]
- Coelho, L.; Brito, J.N. Fotogrametria Digital; EDUERJ: Rio de Janeiro, Brazil, 2007. [Google Scholar]
- Topocart Aerolevantamentos. Relatório de Mapeamento Aerofotogramétrico na Escala 1:5000 do Município do Rio de Janeiro Por Mosaicos de Ortoimagens Digitais Coloridas Obtidas por Plataforma Aérea e Ortorretificadas de Acordo Com Elevações (“True Ortho”); Modelo Digital de Elevações e Modelo Digital do Terreno Por Perfilamento a Laser; Technical report; Topocart: Brasília, Brazil, 2019. [Google Scholar]
- Vexcel Imaging. UltraCam Osprey 4.1. 2024. Available online: https://www.vexcel-imaging.com/brochures/UC_Osprey_4.1_en.pdf (accessed on 2 October 2024).
- Topocart Aerolevantamentos. Relatório de Mapeamento Aerofotogramétrico do Município do Rio de Janeiro por Mosaico de Ortoimagens Multiespectrais, Ortorretificadas Com Correção de Paralaxe (“True Ortho”) e Geração de Modelos Digitais de Elevações e de Terreno Por Perfilamento a Laser (LiDAR); Technical report; Topocart: Brasília, Brazil, 2024. [Google Scholar]
- Instituto Nacional de Meteorologia. Sobre o INMET. 2024. Available online: https://portal.inmet.gov.br/sobre (accessed on 2 October 2024).
- QGIS. Documentation for QGIS 3.40. 2024. Available online: https://docs.qgis.org/3.40/en/docs/index.html (accessed on 21 December 2024).
- ESRI. Release notes for ArcGIS Pro 3.3. 2024. Available online: https://pro.arcgis.com/en/pro-app/3.3/get-started/release-notes.htm (accessed on 20 December 2024).
- Bruse, M. ENVI-met 3.0: Updated Model Overview. University of Bochum. 2004. Available online: www.envi-met.com (accessed on 2 October 2024).
- Acero, J.A.; Arrizabalaga, J. Evaluating the performance of ENVI-met model in diurnal cycles for different meteorological conditions. Theor. Appl. Climatol. 2018, 131, 455–469. [Google Scholar] [CrossRef]
- Barbosa, G.S.; Drach, P.R.C.; Corbella, O.D. Intraurban Temperature Variations: Urban Morphologies of the Densification Process of Copacabana Neighborhood, Brazil. Climate 2019, 7, 65. [Google Scholar] [CrossRef]
- ENVI-met GmbH. Software—ENVI-met. 2024. Available online: https://envi-met.com/microclimate-simulation-software/ (accessed on 2 October 2024).
- Matzarakis, A.; Mayer, H. Another Kind of Environmental Stress: Thermal Stress; WHO Collaborating Centre for Air Quality Management and Air Pollution Control: Berlin, Germany, 1996; Volume 18, pp. 7–10. [Google Scholar]
- Höppe, P. The physiological equivalent temperature—A universal index for the biometeorological assessment of the thermal environment. Int. J. Biometeorol. 1999, 43, 71–75. [Google Scholar] [CrossRef]
- Fiala, D.; Havenith, G.; Bröde, P.; Kampmann, B.; Jendritzky, G. UTCI-Fiala multi-node model of human heat transfer and temperature regulation. Int. J. Biometeorol. 2012, 56, 429–441. [Google Scholar] [CrossRef]
- Matzarakis, A.; Rutz, F.; Mayer, H. Modelling the thermal bioclimate in urban areas with the RayMan Model. In Proceedings of the International Conference on Passive and Low Energy Architecture, Geneva, Switzerland, 6–8 September 2006; Volume 23, pp. 449–453. [Google Scholar]
- Angelo, J.R.; Leandro, B.B.d.S.; Périssé, A.R.S. Monitoramento da COVID-19 nas favelas cariocas: Vigilância de base territorial e produção compartilhada de conhecimento. Saúde Debate 2021, 45, 123–141. [Google Scholar] [CrossRef]
- Neves, P.d.N.; Silva, J.R.d. Efeitos econômicos da pandemia da COVID-19 na construção civil brasileira: Um estudo de 2020 a 2021 (Economic Effects of the COVID-19 Pandemic in Brazilian Civil Construction: A Study from 2020 to 2021). Cult. Identidade Região 2021, 13. [Google Scholar] [CrossRef]
- Crank, P.J.; Sailor, D.J.; Ban-Weiss, G.; Taleghani, M. Evaluating the ENVI-met microscale model for suitability in analysis of targeted urban heat mitigation strategies. Urban Clim. 2018, 26, 188–197. [Google Scholar] [CrossRef]
- Yuan, B.; Zhou, L.; Hu, F.; Wei, C. Effects of 2D/3D urban morphology on land surface temperature: Contribution, response, and interaction. Urban Clim. 2024, 53. [Google Scholar] [CrossRef]
- IPCC. Global Warming of 1.5 °C. An IPCC Special Report on the Impacts of Global Warming of 1.5 °C Above Pre-Industrial Levels and Related Global Greenhouse Gas Emission Pathways, in the Context of Strengthening the Global Response to the Threat of Climate Change, Sustainable Development, and Efforts to Eradicate Poverty; Technical report; Intergovernmental Panel on Climate Change: Geneva, Switzerland, 2018. [Google Scholar]
- Wang, Y.; Zhou, D.; Wang, Y.; Fang, Y.; Yuan, Y.; Lv, L. Comparative study of urban residential design and microclimate characteristics based on ENVI-met simulation. Indoor Built Environ. 2019, 28, 1200–1216. [Google Scholar] [CrossRef]
- Fiorillo, E.; Brilli, L.; Carotenuto, F.; Cremonini, L.; Gioli, B.; Giordano, T.; Nardino, M. Diurnal Outdoor Thermal Comfort Mapping through Envi-Met Simulations, Remotely Sensed and In Situ Measurements. Atmosphere 2023, 14, 641. [Google Scholar] [CrossRef]
- Behzad, Z.; Guilandoust, A. Enhancing outdoor thermal comfort in a historic site in a hot dry climate (Case study: Naghsh-e-Jahan Square, Isfahan). Sustain. Cities Soc. 2024, 102, 105209. [Google Scholar] [CrossRef]
- Kammuang-Lue, N.; Sakulchangsatjatai, P.; Sangnum, P.; Terdtoon, P. Influences of population, building, and traffic densities on urban heat island intensity in Chiang Mai City, Thailand. Therm. Sci. 2015, 19, 445–455. [Google Scholar] [CrossRef]
- Wen, Y.; Lian, Z. Influence of air conditioners utilization on urban thermal environment. Appl. Therm. Eng. 2009, 29, 670–675. [Google Scholar] [CrossRef]
- Rossi, G.; Barbosa, G.; ARAGÃO, T. Sustainable neighborhoods and social housing urban projects: A comparison between Brazilian and European practices. In Proceedings of the IFME World Congress on Municipal Engineering, Helsinki, Finland, 4–10 June 2012. [Google Scholar]
- Barbosa, G.S.; Rossi, A.M.G.; Drach, P.R.C. Análise de Projeto Urbano a partir de parâmetros urbanos sustentáveis: Alteração morfológica de Copacabana e algumas de suas consequências climáticas (1930–1950–2010). Urbe. Rev. Bras. Gestão Urbana 2014, 6, 275–287. [Google Scholar] [CrossRef]
- Corbella, O.; Yannas, S. Em Busca de uma Arquitetura Sustentável para os Trópicos, 2nd ed.; Revan: Rio de Janeiro, Brazil, 2003. [Google Scholar]
- Santamouris, M. Cooling the cities—A review of reflective and green roof mitigation technologies to fight heat island and improve comfort in urban environments. Sol. Energy 2014, 103, 682–703. [Google Scholar] [CrossRef]
- Carfan, A.C.; Galvani, E.; Nery, J.T. Study of thermal comfort in the City of São Paulo using ENVI-met model. Investig. Geogr. 2012, 78, 34–47. [Google Scholar]
- Arcidiacono, A.; Ronchi, S. Ecosystem services and nature-based solutions: A project of urban resilience for Rocinha. Territorio 2019, 90, 94–99. [Google Scholar] [CrossRef]
- Ashinze, U.K.; Edeigba, B.A.; Umoh, A.A.; Biu, P.W.; Daraojimba, A.I. Urban green infrastructure and its role in sustainable cities: A comprehensive review. World J. Adv. Res. Rev. 2024, 21, 928–936. [Google Scholar] [CrossRef]
- Jang, S.; Bae, J.; Kim, Y.J. Street-level urban heat island mitigation: Assessing the cooling effect of green infrastructure using urban IoT sensor big data. Sustain. Cities Soc. 2024, 100, 105007. [Google Scholar] [CrossRef]
- Liu, Z.; Cheng, W.; Jim, C.; Morakinyo, T.E.; Shi, Y.; Ng, E. Heat mitigation benefits of urban green and blue infrastructures: A systematic review of modeling techniques, validation and scenario simulation in ENVI-met V4. Build. Environ. 2021, 200, 107939. [Google Scholar] [CrossRef]
- Yilmaz, S.; Mutlu, E.; Yilmaz, H. Alternative scenarios for ecological urbanizations using ENVI-met model. Environ. Sci. Pollut. Res. 2018, 25, 26307–26321. [Google Scholar] [CrossRef]
- Berry, R.; Livesley, S.J.; Aye, L. Tree canopy shade impacts on solar irradiance received by building walls and their surface temperature. Build. Environ. 2013, 69, 91–100. [Google Scholar] [CrossRef]
- Ojha, S.; Mukherjee, M.; Raje, A. Quantifying the potential of evidence-based planting-pattern for reducing the outdoor thermal stress from a bio-meteorological perspective in tropical conditions of Indian cities. Int. J. Biometeorol. 2024, 69, 245–260. [Google Scholar] [CrossRef] [PubMed]
- LEI Nº 10.257, DE 10 DE JULHO DE 2001. Regulamenta os Arts. 182 e 183 da Constituição Federal, Estabelece Diretrizes Gerais da Política Urbana e dá Outras Providências. 2001. Available online: https://www.planalto.gov.br/ccivil_03/leis/leis_2001/l10257.htm (accessed on 2 October 2024).
- Chatzinikolaou, E.; Chalkias, C.; Dimopoulou, E. Urban microclimate improvement using ENVI-met climate model. Int. Arch. Photogramm. Remote Sens. Spat. Inf. Sci. 2018, XLII-4, 69–76. [Google Scholar] [CrossRef]
- Barbosa, L.M.; Walker, G. Epistemic injustice, risk mapping and climatic events: Analysing epistemic resistance in the context of favela removal in Rio de Janeiro. Geogr. Helv. 2020, 75, 381–391. [Google Scholar] [CrossRef]
- Ioris, A.A.R. O que é justiça ambiental. Ambiente Soc. 2009, 12, 389–392. [Google Scholar] [CrossRef]
- Pizarro, E.P.; Soares Gonçalves, J.C. Everyday house: Redesigning the informal housing in subtropical climates, the case of Paraisópolis favela in Sao Paulo. In Proceedings of the PLEA 2018—Smart and Healthy within the Two-Degree Limit: Proceedings of the 34th International Conference on Passive and Low Energy Architecture, Hong Kong, China, 10–12 December 2018; School of Architecture, The Chinese University of Hong Kong: Hong Kong, China, 2018; Volume 2, pp. 574–579. [Google Scholar]
- Libertun de Duren, N.R.; Rivas, R.O.; Perlman, J. Environmental and Social Sustainability of Urban Upgrading Programs: Lessons from Rio. Cities 2021, 119, 103416. [Google Scholar] [CrossRef]
Disclaimer/Publisher’s Note: The statements, opinions and data contained in all publications are solely those of the individual author(s) and contributor(s) and not of MDPI and/or the editor(s). MDPI and/or the editor(s) disclaim responsibility for any injury to people or property resulting from any ideas, methods, instructions or products referred to in the content. |
© 2025 by the authors. Licensee MDPI, Basel, Switzerland. This article is an open access article distributed under the terms and conditions of the Creative Commons Attribution (CC BY) license (https://creativecommons.org/licenses/by/4.0/).