Article

Identification of Barriers and Drivers of Multifactor Flows in Smart Urban–Rural Networks: An Integrated Geospatial Analytics Framework

1
College of Environmental and Resource Sciences, Zhejiang University, Hangzhou 310058, China
2
The Rural Development Academy, Zhejiang University, Hangzhou 310058, China
3
State Key Laboratory of Soil Pollution Control and Safety, Zhejiang University, Hangzhou 310058, China
4
Territorial Consolidation Center in Zhejiang Province, Department of Natural Resources of Zhejiang Province, Hangzhou 310007, China
5
Department of Land Management, School of Public Affairs, Zhejiang University, Hangzhou 310058, China
6
School of Public Affairs, Zhejiang Gongshang University, Hangzhou 310018, China
*
Author to whom correspondence should be addressed.
Smart Cities 2025, 8(5), 162; https://doi.org/10.3390/smartcities8050162
Submission received: 4 August 2025 / Revised: 18 September 2025 / Accepted: 28 September 2025 / Published: 30 September 2025

Abstract

Highlights

  • What are the main findings?
  • Urban–rural factor flows in Huzhou exhibit a heterogeneous core–periphery structure, spatially modulated by metropolitan spillovers from Hangzhou and Suzhou.
  • Key nodes can simultaneously act as facilitators and obstacles to different flows, revealing a complex, non-binary pattern of integration and barriers.
  • What is the implication of the main finding?
  • Effective regional governance requires factor-specific and node-sensitive strategies.
  • The integrated geospatial analytic framework offers a replicable tool for flow–barrier synergy diagnostics in small and medium-sized cities.

Abstract

Against a global backdrop of industrialization and urbanization, precise measurement of multifactor flows and systematic identification of barriers and drivers are critical for optimizing resource allocation in smart regional development. This study develops an integrated geospatial analytic framework that incorporates mobile signaling data and POI data to quantify the intensity, barriers, and driving mechanisms of urban–rural factor flows in Huzhou City at the township scale. Key findings reveal the following. (1) Urban–rural factor flows exhibit significant spatial polarization, with less than 20% of connections accounting for the majority of flow intensity. The structure shows clear core–periphery differentiation, further shaped by inner heterogeneity and metropolitan spillovers. (2) Barriers demonstrate complex and uneven spatial distributions, with 45.37% of the integrated flow intervals experiencing impediments. Critically, some nodes act as both facilitators and obstacles, depending on the flow type and direction, revealing a metamodern tension between promotion and impairment. (3) Economic vitality plays a crucial role in driving urban–rural factor flow, with different factors having complex, often synergistic or nonlinear effects on both single and integrated flows. The study advances the theoretical understanding of heterogeneous spatial structures in urban–rural systems and provides a replicable analytical framework for diagnosing factor flows in small and medium-sized cities. These insights form a critical basis for designing targeted and adaptive regional governance strategies.

1. Introduction

Against the backdrop of global industrialization and urbanization, urban–rural relations manifest as universal developmental challenges worldwide, evidenced by a rural decline in developed nations and pervasive “over-urbanization” in developing contexts. Concurrently, intensified global competition, sustainability imperatives, and the Information and Communication Technology (ICT) revolution have reshaped contemporary development paradigms. Urban–rural factor flow—defined as the bidirectional movement and optimal allocation of population, goods, capital, and technology—serves as the core engine for integrated development and dismantling dual socioeconomic structures [1,2]. China’s reform era has transformed its urban–rural dynamics, yet stark imbalances endure: a per capita GDP exceeding USD 12,600 and 66% urbanization coexist with a 2.39 urban–rural income disparity [3]. While accelerated factor flows under new urbanization and rural revitalization strategies indicate progress, towns and medium/small cities confront dual pressures from metropolitan “siphoning effects” exacerbating resource leakage and administrative–digital divides impeding mobility efficiency [4,5]. The CPC’s Third Plenary Session (20th Central Committee) therefore made a major strategic plan to improve the system and mechanism for the integrated development of urban and rural areas, asserting that ‘it is necessary to coordinate the new type of industrialization, the new type of urbanization and the comprehensive revitalization of the countryside to comprehensively improve the level of integration of urban and rural planning, construction and governance, to promote the equal exchange of urban and rural factors and the two-way flow of urban and rural elements, to narrow the gap between urban and rural areas, and to promote the common prosperity of urban and rural areas’ [6]. This strategic imperative elevates the identification of flow barriers and drivers beyond a theoretical necessity to an urgent practical mandate—one that is critical for optimizing resource allocation and advancing high-quality integration in the smart city era.
The theoretical foundation of urban–rural multifactor flows is rooted in the classical framework of urban–rural relations and factor flows and has expanded with the evolution of globalization and information technology [7,8,9]. While these classical models have laid a solid groundwork for understanding urban–rural factor flows, most are built on specific—and at times opposing—epistemological assumptions. In early studies, the Lewis dual economy model proposed a ‘one-way flow’ mechanism for the transfer of surplus rural labor to the urban industrial sector [10], serving as an early prototype of urban–rural factor flow. However, it conceptualized such flows as part of a linear, unidirectional process of modernization, reflecting a macro-narrative of structural modernism. The Todaro model emphasized that labor mobility is driven by expected income differences between urban and rural areas, providing a scientific explanation of urban–rural factor flows from the perspective of ‘economic rationality’ [11], yet it remained confined to economic determinism. The Desakota model challenged the rigid urban–rural dichotomy by focusing on the characteristics of factor flows in Asia’s urban–rural transition zones, revealing the spatial heterogeneity of urban–rural interactions [12]. Nevertheless, its spatial perspective remained relatively static. In contrast, the concept of ‘flow space’ transcends geographical boundaries, incorporates capital, information, and technology into the factor flow analytical framework, and better explains the linkages of intraregional development [13]. It highlights the disembedding and reconfiguring nature of factor flows under the conditions of a network society, demonstrating an epistemological shift toward a postmodern geography. These theoretical divisions reflect the tension between modernism and postmodernism [14]. However, the complexity of contemporary urban–rural integration calls for moving beyond such either/or dualisms. Just as the metamodern turn in contemporary scientific and geographical thought suggests [15], there is a need to achieve a dialectical synthesis on the basis of previous differentiated theories, thereby advancing urban–rural research toward a more open, flexible, and responsive direction.
Current research on urban–rural factor flows has focused mainly on its theoretical frameworks, research methodologies, roles and effects, and other directions. In terms of theoretical frameworks, factor flows have gradually emerged as an important theoretical paradigm in the study of urban–rural relations. Since the late 20th century, a theoretical system centered on urban–rural interactions, linkages, and multifactor flows has progressively taken shape [16]. The research perspective has further shifted from a static urban–rural dichotomy toward a dynamic, integrated analysis of urban and rural areas as a whole [17,18,19], delving into the complex influences of geographic, social, and other factors on urban–rural interactions [20]. Frameworks such as ‘flow space’ [13], the ‘regional development network model’ [21], and the ‘new mobility paradigm’ [22] have become vital for analyzing urban–rural interactions and spatial transformations [23,24,25]. These approaches have helped clarify the bidirectional circulation and complex driving mechanisms of urban–rural flows [26,27], while also expanding the types of mobile factors, their interactions, and structural relationships [28,29,30], enriching the conceptual development of multifactor flows. In terms of research methodologies, relevant studies have shifted from static description to dynamic measurement and from a single data source to multisource integration. Early studies relied mainly on cross-sectional statistics and social survey data to reveal the macro laws of factor flows by constructing static equilibrium models or conducting econometric regression analyses [11,31], making it difficult to capture the spatial and temporal dynamics and heterogeneity of factor flows. Given the complexity and mobility characteristics of urban–rural relations, current research has significantly improved the precision and depth of analysis of urban–rural factor flows through the fusion of multisource data [32,33] and by using factor flow measures [34,35,36], social network feature analysis [37,38,39], and multimodel influencing factor analysis [40]. In terms of effects, scholars have revealed the complex mechanism of the action of urban–rural factor flows from the spatial, social, and ecological perspectives. From the spatial perspective, in recent years, with the rise of spatial justice theory, some scholars have begun to re-examine the fairness and justice of urban–rural factor flows from the perspective of the distribution of spatial rights [41,42,43]. Others argue that the flow of factors between urban and rural areas improves land use efficiency, matches factor allocation with urban and rural demands, and helps optimize the spatial layout of urban and rural regions [44]. From the social perspective, scholars believe that reasonably controlling urban–rural factor flows and improving urban–rural resource allocation will facilitate urban–rural economic integration and development, narrow the regional income gap, and lead to a new situation of urban–rural interaction [45]. From the ecological perspective, scholars believe that rational urban–rural factor flows are conducive to regulating ecological pressure [46] and enhancing ecological resilience [47], as well as cross-regional cooperation in ecological protection [48,49], which can significantly enhance the sustainability of the ecosystem.
However, current research on urban–rural factor flows focuses mostly on intraregional factor flows in medium-sized and large regions, and quantitative analyses of multiple factor flows between urban and rural regions from a nuanced perspective are lacking. At the same time, some studies have focused on the single perspective of the barriers or the drivers of factor flow [38,50,51], with few exploring the impact mechanisms of urban–rural factor flows from an integrated barrier-and-driver perspective. Given the emerging metamodern turn in geographical research, there is a pressing need to adopt more nuanced approaches to urban–rural integration and to synthesize barrier-and-driver analyses at refined spatial scales. To address these gaps, this study developed an Integrated Geospatial Analysis Framework to investigate the intensity, barriers, and driving factors of urban–rural flows in Huzhou, China. It specifically aimed to answer the following questions. (1) How can we accurately measure the intensity of multifactor flows between urban and rural units? (2) What is the spatial pattern of flow barriers and how do they interact with flow intensity? (3) What are the key drivers influencing these flows, and how do their effects vary across different flow types?

2. Methods

2.1. Study Area

Huzhou City is located in northern Zhejiang Province, at the junction of Jiangsu, Anhui, and Zhejiang Provinces, serving as a pivotal node within the Yangtze River Delta and the Hangzhou metropolitan area (Figure 1). The city covers an administrative area of 5820 km2 and governs 72 townships, characterized by the topographically diverse Hangjiahu Plain, where the western highlands transition to the eastern lowlands. As a national pilot zone for integrated urban–rural development, Huzhou demonstrates highly synergistic characteristics across the three dimensions of urban–rural factor flows. In terms of human flow, the permanent resident population reached 3.465 million by 2024, with an urbanization rate of 68.8%. Surface passenger transport volumes reached 4.057 million trips, and passenger turnover amounted to 870 million passenger-kilometers, reflecting continuously enhanced urban–rural commuting connectivity. In terms of goods flow, the annual freight volume reached 250 million tons, and express delivery business volumes exceeded 830 million parcels, indicating significantly improved operational efficiency in the urban–rural logistics network. In terms of funds flow, the balance of domestic and foreign currency loans reached CNY 1.2 trillion, investment in high-tech industries grew by 14.3%, and the value-added of the core digital economy sector reached CNY 26.28 billion, demonstrating accelerated capital allocation toward productivity-enhancing sectors. Leveraging Internet of Things (IoT) infrastructure and data-driven governance, Huzhou continuously optimizes resource allocation efficiency. This unique socioeconomic and geospatial positioning makes its 72 townships an ideal laboratory for developing and validating the fine-scale geospatial analytics of factor flow dynamics.
In this study, the urban–rural division follows the common administrative classification in China and aligns with previous relevant studies [52], where subdistricts are treated as urban areas, while towns and townships are classified as rural areas. This distinction is made by considering that subdistricts typically represent built-up, densely populated urban cores with predominantly non-agricultural economic activities, whereas towns and townships encompass more extensive territories with significant agricultural land, lower population density, and distinct rural socioeconomic characteristics. This approach aligns with established practices in regional studies and ensures consistency in analyzing factor flows between functionally differentiated spatial units.

2.2. Research Framework

In response to the scientific questions addressed by this study, the following hypotheses are proposed. (1) Urban–rural factor flows are not uniformly distributed spatially but may exhibit specific spatial patterns. (2) Significant barriers to urban–rural factor flows exist in reality, and there are complex hierarchical relationships between barrier levels and flow intensity. (3) Economic vitality serves as a core driver of urban–rural factor flows, with multiple driving factors exhibiting complex interactions rather than simple linear relationships.
To test these hypotheses, this study takes Huzhou, an important city in eastern China, as an example to analyze the meaning of urban–rural factor flows at the township scale; establish a multi-dimensional urban–rural factor flow measurement system based on human flow, goods flow, and funds flow to quantitatively measure the current situation of urban–rural factor flows in the region; explore the barriers to urban–rural factor flows through factor flow simulation based on an improved gravitational model and a method of identifying barriers to factor flow; and explore the impact mechanism of barriers through the R language-based GeoDetector. The overall framework of the article is shown in Figure 2.

2.3. Data and Processing

(1) Cell phone signaling data. Cell phone signaling data were sourced from the Urban and Rural Development Research Team at the Zhejiang Mobile Big Data Center. Using the team’s subscriber permanent residence and population flow identification models, this study analyzed cell phone positioning tracking data from 2020. This analysis identified origin and destination points as well as the volume of population flows within the study area, providing foundational data for understanding human mobility within urban and rural factor flows.
(2) Network open-source data. Network open-source data included point of interest (POI) data obtained via the Gaode Map open platform’s web service API (https://lbs.amap.com/) (accessed on 1 December 2024). The Scrapy framework in Python 3.9 was employed to collect POI data across various categories within the geographic boundaries of Huzhou City. POI categories such as logistics facilities, banks, businesses, medical institutions, and tourist attractions were selected on the basis of the research requirements and were converted into shapefile vector files for further analysis using the ArcGIS platform. Road network data were sourced from OpenStreetMap (https://www.openstreetmap.org/) (accessed on 1 December 2024), which provided vector data for roads at all hierarchical levels.
(3) Additional data. Additional datasets encompassing socioeconomic indicators such as financial income and administrative areas were extracted from the Huzhou City Statistical Yearbook available on the official website of the Huzhou City Bureau of Statistics (https://tjj.huzhou.gov.cn/) (accessed on 2 December 2024). Remote sensing imagery was sourced from the Geospatial Data Cloud (https://www.gscloud.cn/) (accessed on 2 December 2024), while foundational geographic data, including administrative boundaries at all levels nationwide, were obtained from the National Center for Basic Geographic Information (https://www.ngcc.cn/) (accessed on 2 December 2024). National Polar-orbiting Partnership/Visible infrared Imaging Radiometer Suite (NPP/VIIRS) nighttime light data were obtained from the NOAA Comprehensive Large Array-Data Stewardship System (CLASS) website (https://www.noaa.gov/) (accessed on 2 December 2024). The data were processed to calculate the average nighttime light intensity at the township and street levels using zonal statistics based on administrative boundary data.

2.4. Theoretical Framework of Urban–Rural Factor Flows

The report of the 20th CPC National Congress clearly stated that ‘insisting on the integrated development of urban and rural areas is a key path to constructing a new development pattern, promoting high-quality development, and fostering common prosperity in the new era’. The Third Plenary Session of the 20th CPC Central Committee further set the task of ‘perfecting the institutional mechanism for the integrated development of urban and rural areas’, stressing that ‘the integrated development of urban and rural areas is the core requirement of Chinese-style modernization’. Against this backdrop, the promotion of smooth two-way factor flows between urban and rural areas is particularly important for narrowing the urban–rural gap and accelerating urban–rural integrated development.
The essence of urban–rural integrated development lies in building a harmonious urban–rural relationship, which is reflected in a number of dimensions, including urban–rural social integration, urban–rural market integration, and urban–rural resource integration [53]. First, in terms of urban–rural social integration, the free movement of labor has not only changed the distribution pattern of urban and rural populations but also promoted cultural exchanges and mutual understanding between urban and rural areas, effectively narrowed the income gap between urban and rural areas, and thus optimized the urban–rural social structure, laying a solid foundation for urban–rural social integration [54]. Second, in terms of urban–rural market integration, the smooth circulation of commodities between urban and rural areas has helped improve the market division of the labor system, keep the supply chain continuously connected, and realize the complementary advantages of urban and rural industries, thus enhancing the interaction and integration of urban and rural markets and promoting the overall prosperity of these markets [55]. Third, with respect to the integration of urban and rural resources, the flow of capital across urban and rural areas provides a strong impetus for infrastructure construction, improves the investment environment in urban and rural areas, promotes the dissemination and application of advanced knowledge and technology, realizes the optimal allocation of urban and rural resources, and accelerates the process of urban–rural resource integration [56].
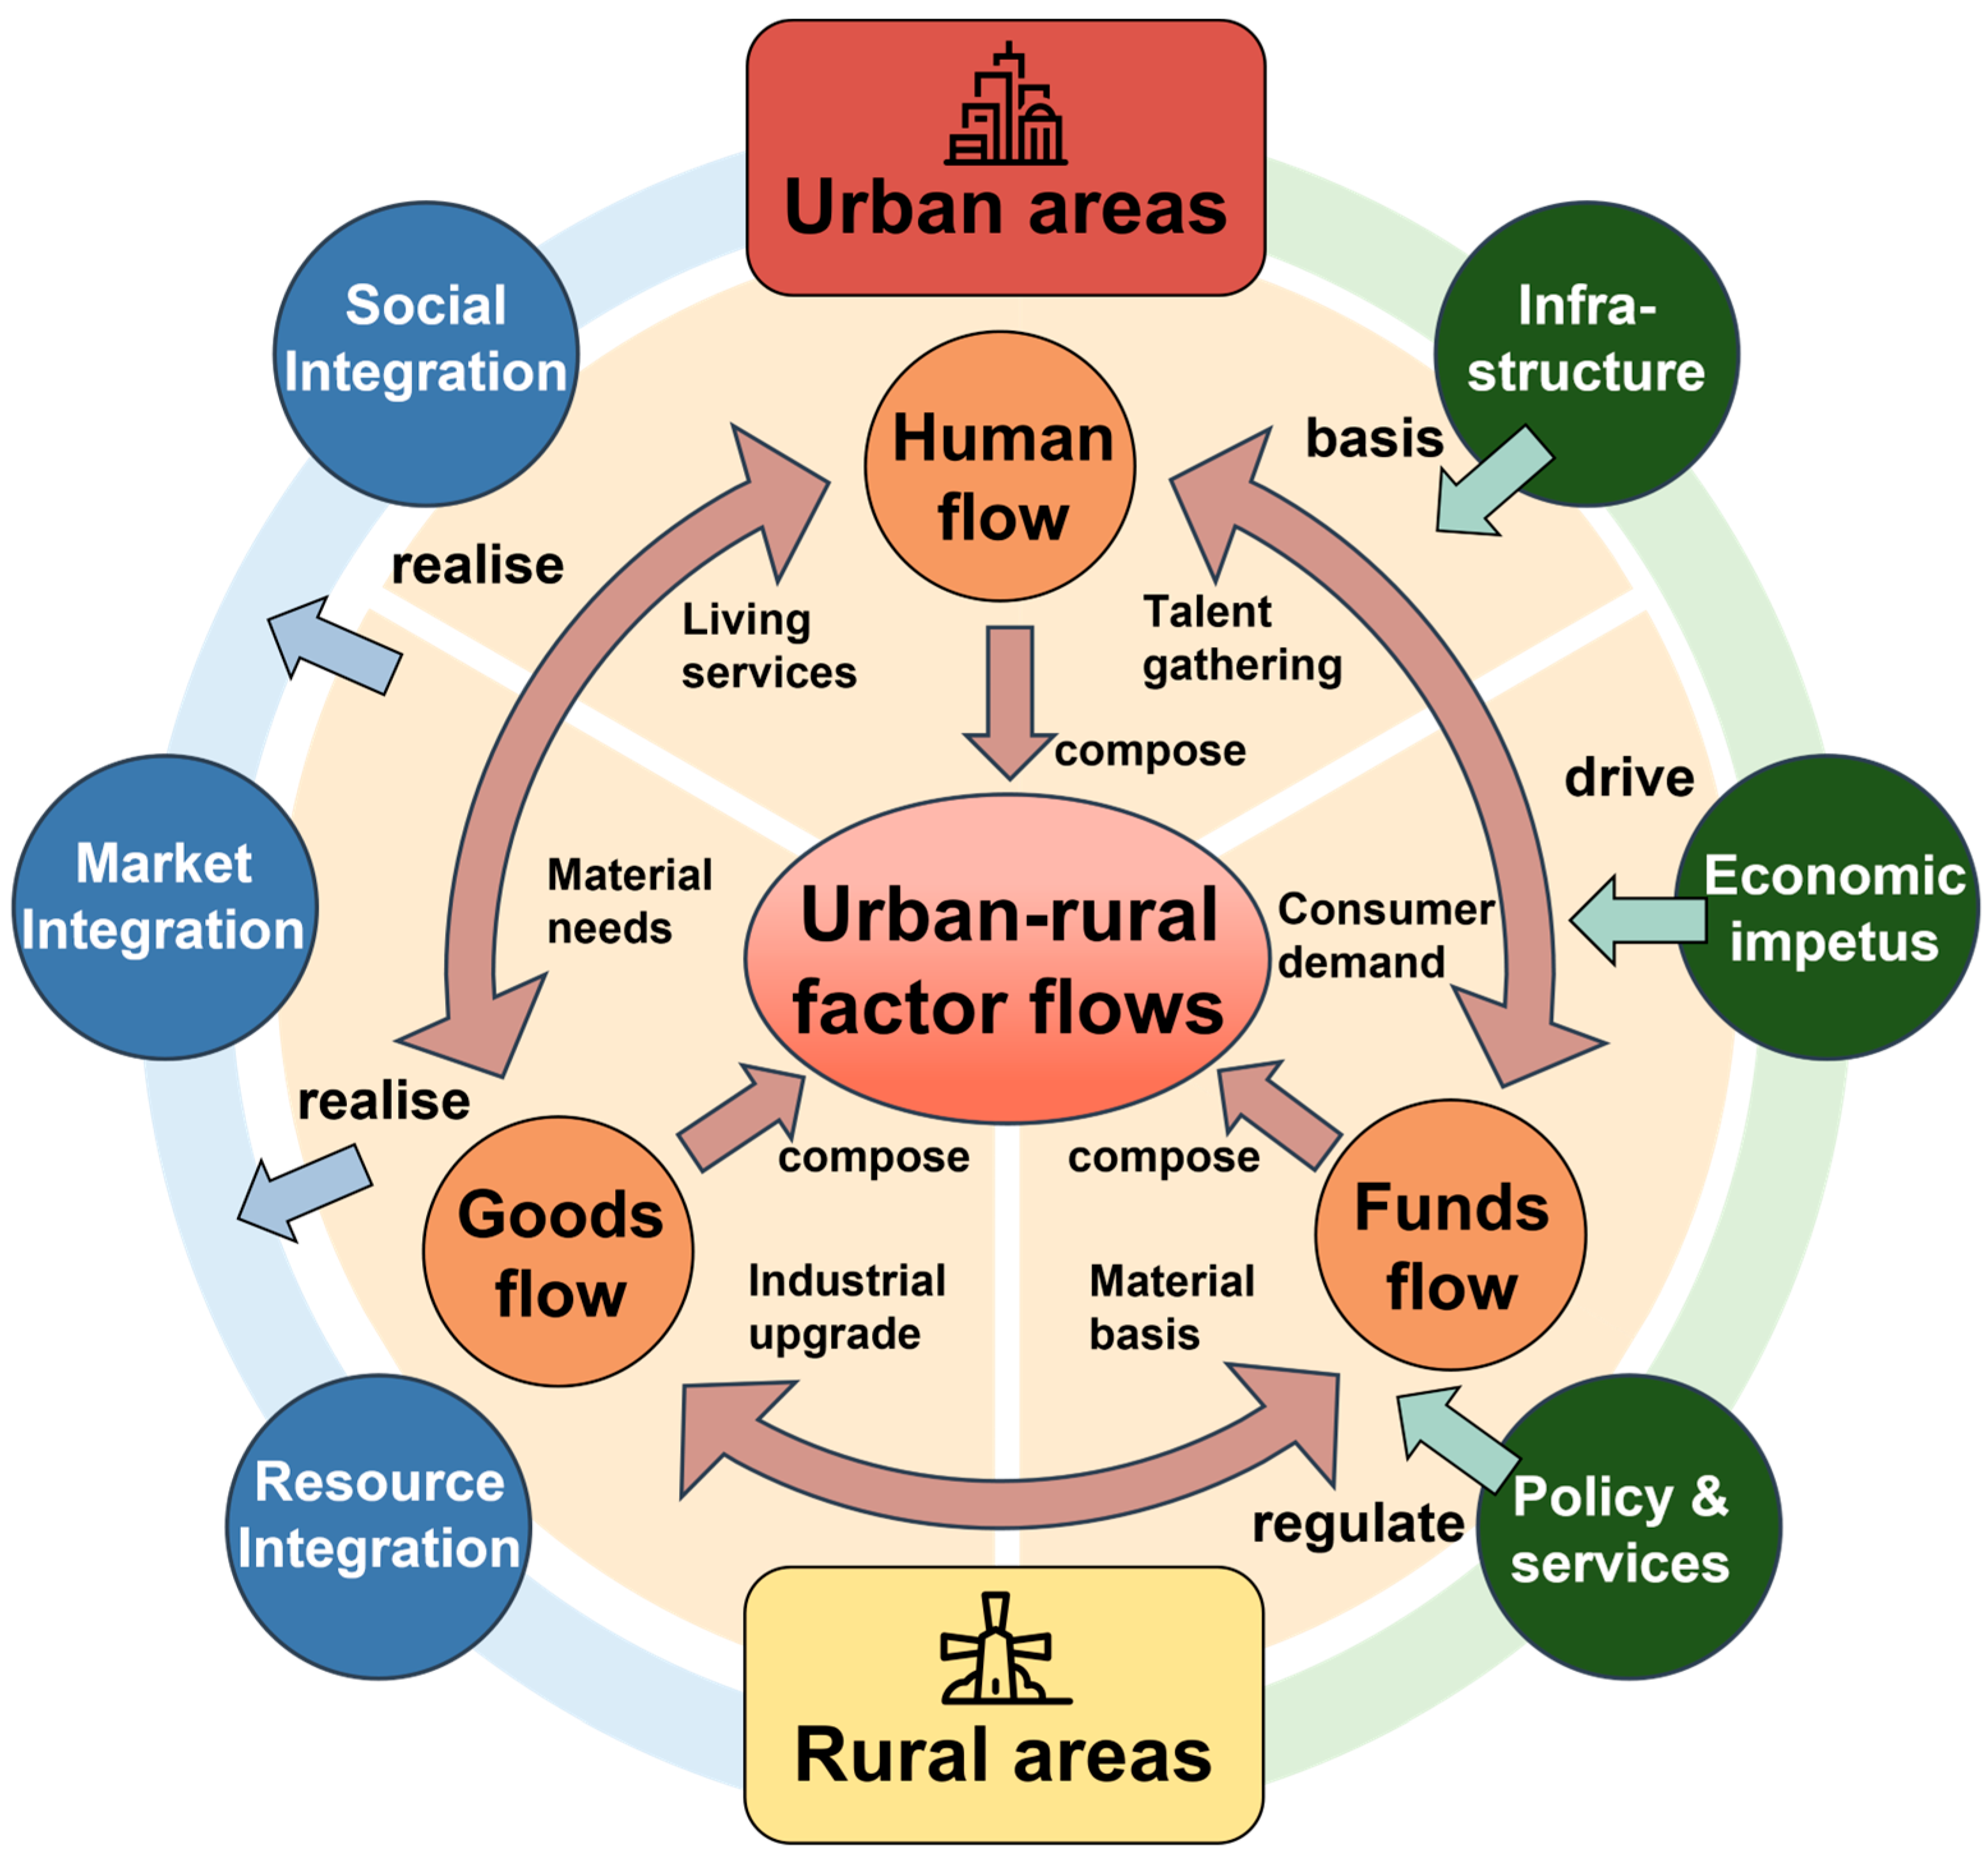
Multidimensional integrated urban–rural development is linked to the depth of the urban–rural factor flows of labor, commodities, and capital, which can be quantitatively characterized in terms of three aspects: human flow, goods flow, and funds flow. Human flow refers to the spatial migration and mobility of urban and rural residents, reflecting the allocation of labor resources between urban and rural areas, mostly in the form of farmers traveling to the cities to work, and talent returning to their hometowns to start their own businesses. It is driven mostly by the regional economy and policies and is affected by the distribution of public service resources such as health care, living, and education. Goods flow is the process of transporting and exchanging physical goods such as commodities and raw materials between urban and rural areas, reflecting industrial linkages and supply chain efficiency, and it exhibits strong facility dependence, which is closely related to the conditions of infrastructure, such as transport facilities and commercial outlets. Funds flow covers capital transfers, investment, and consumption payments between urban and rural areas, and it is highly market-oriented and highly relevant for urban and rural industrial development. Together, the three flows constitute an organic system of urban–rural factor flows that are linked to each other: Human flow spurs consumption demand and material demand, driving goods flow and funds flow; funds flow fuels talent concentration and industrial upgrading, promoting human flow and goods flow; and goods flow supports the lives of the population and economic activities and is an important foundation for human flow and funds flow.
Urban–rural factor flows are important channels for the integration and development of urban and rural society, markets, and resources and it is affected by a combination of factors. This study understands the factors influencing urban–rural factor flows based on three dimensions: the foundation, dynamics, and regulation. First, infrastructure conditions constitute the physical foundation of factor flows, which directly determines the feasibility and efficiency of mobility. Second, economic dynamics form the intrinsic driving force of factor agglomeration and diffusion through employment opportunities and market size. Third, institutional and service factors act as moderating variables that optimize the mobility path by eliminating policy barriers or improving service quality (Figure 3).

2.5. Measurement of Urban–Rural Factor Flows

The urban–rural factor flows examined in this study refer to the spatial redistribution of various factors between urban and rural areas within the study region. According to the research framework, three single-factor flows—human flow, goods flow, and funds flow—are selected to characterize the overall factor flow. In accordance with the urban–rural classification adopted in this study, factor flows between subdistricts and towns/townships are analyzed. For comparative purposes, all measurements are normalized. The specific measurement methods are as follows.
(1) Human flow: On the basis of cell phone signaling data, this study calculates the number of people visiting one study unit and whose usual place of residence is another study unit in 2020 as the intensity of foot traffic between the two study units. The formula is as follows
H F i j = D 365 N
where H F i j represents the intensity of foot traffic between the areas of township i and subdistrict, D represents the date from 1 January 2020 to 31 December 2020, and N represents the total number of people from permanent residence i visiting j or from permanent residence j visiting i .
(2) Goods flow: The measurement of goods flow between study areas is grounded in Taylor’s [57] interlocking network model, which posits that the spatial organization of advanced producer service firms reflects and facilitates inter-city flows. We extend this theoretical framework to the logistics sector, arguing that courier companies function as key agents in organizing goods flows, and their physical networks—composed of hierarchically structured facilities—serve as a robust proxy for the intensity of material exchange. The distribution and hierarchy of logistics facilities (e.g., distribution centers, transfer hubs, local outlets) directly shape the volume and direction of freight movements. Therefore, the service value of a courier company within a given research unit, derived from the level and presence of its facilities, captures its capacity to generate and attract goods flows. On the basis of logistics courier POI data from the Gaode map, we applied this chain structure model to measure inter-regional logistics’ intensity. The POIs of 11 courier companies, such as Shunfeng and Jingdong, were collected in a categorized manner, the value of the courier service of the company was obtained in each research unit according to the different levels of the courier service sites, and the logistics intensity was calculated as follows
O F i j , x = O F i x × O F j x
O F i j = x O F i j , x
where O F i x and O F j x are the service values of courier x in township i and subdistrict j , respectively; O F i j , x represents the logistics intensity of courier x between township i and subdistrict j ; and O F i j represents the logistics intensity between township i and subdistrict j .
(3) Funds flow: Similarly, the intensity of funds flow is measured by adapting Taylor’s model to the banking sector. Banks and other financial institutions act as critical organizers of capital mobility, and their branch networks—representing access points for financial transactions, credit allocation, and capital transfer—serve as a valid indicator of funds flow potential. The hierarchical level of a banking office (e.g., head office, branch, sub-branch) reflects its authority and capacity to manage and transfer capital, thereby shaping the spatial structure of financial interactions. On the basis of POI data on bank sites in the Gaode map, we collected information from 24 banks, such as the BOC and ICBC, and classified them into five hierarchical levels: head office, branch, sub-branch, 24-h self-service bank, and ATM—to obtain the value of the bank’s money service in each study unit and to calculate the intensity of funds flow as follows
F F i j , x = F F i x × F F j x
F F i j = x F F i j , x
where F F i x and F F j x are the service values of bank x in township i and subdistrict j , respectively; F F i j , x represents the intensity of the funds flow from bank x between township i and subdistrict j ; and F F i j represents the intensity of the funds flow between township i and subdistrict j .
(4) Integrated flow: Based on the abovementioned calculations of human flow, goods flow and funds flow, the integrated factor flows among the study units are obtained as follows
T F i j = α H F i j × β O F i j × γ F F i j
where T F i j represents the intensity of the integrated factor flows between township i and subdistrict j , H F i j represents the intensity of the human flow between township i and subdistrict j , O F i j represents the intensity of the goods flow between township i and subdistrict j , F F i j represents the intensity of the funds flow between township i and subdistrict j , and α, β, and γ are all one-third.

2.6. Detection of Barriers to Urban–Rural Factor Flows

The study uses an improved gravity model to simulate the theoretical values of the urban–rural factor flows in the study area, and it compares the simulated values with the measured values to identify the regional factor flow barriers. The identification process is as follows.
(1) Simulated factor flow: An improved gravity model is based on the modification and proposal of the law of gravity, which considers that the intensity of the connection between geographic units is directly proportional to the scale of the two and inversely proportional to the distance between the two, which is a better reflection of the geospatial connection of the region. The model has been widely used in geography-related studies [58]. On the basis of the formula of gravity, this article takes the socioeconomic scale of the research unit as the ‘mass’ and the distance between the geographic centers of urban and rural units as the ‘distance’ in the model, and it simulates and calculates urban–rural factor flows under the theoretical situation
T F i j = P i × E i × P j × E j D i j
where T F i j represents the simulated intensity of factor flows between township i and subdistrict j ; P i and P j represent the resident population in township i and subdistrict j , respectively; E i and E j represent the general public budget revenues of township i and subdistrict j , respectively; and D i j represents the geographic centroid spacing between township i and subdistrict j .
(2) Factor flow barriers: Based on the abovementioned human flow, goods flow, funds flow and integrated flow measurements and factor flow simulations, the differences between the measurements and simulations are calculated to characterize the factor flow barriers that may exist in the actual situation
O i j = T F i j T F i j
where O i j represents the urban–rural factor flow barrier index between township i and subdistrict j , T F i j represents the measured factor flow intensity between township i and subdistrict j , and T F i j represents the simulated factor flow intensity between township i and subdistrict j (both T F i j and T F i j are normalized to eliminate the difference in magnitude). When O i j is greater than 0, the relationship between township i and subdistrict j exerts a facilitating influence on urban–rural factor flows, whereas when O i j is less than 0, the relationship between township i and subdistrict j exerts a hindering influence on urban–rural factor flows. The larger the absolute value of O i j , the stronger the influence.

2.7. Identification of Driving Factors

In this study, driving factors were selected on the basis of three dimensions, namely the foundation, dynamics, and regulation, to explore the significance of these factors. Additionally, the interactions between them were identified with Geographical Detector. The specific methods are as follows.
(1) Selection of driving factors: On the basis of the three dimensions of the foundation, dynamics and regulation (Table 1), this study explores the influence of various factors on the factor flows in urban–rural areas. The selection of driving factors considers their foundational role in shaping the mobility environment, the dynamics involved in their impact, and the regulatory constraints that they impose. Through summarizing the findings from the literature on the impact mechanisms of factor flow, eight key driving factors were selected: Administrative divisions; the number of companies; scenic spots; medical facilities; transport mileage; science, education, and culture; shopping services; and living services.
(2) Geographical Detector: Geographical Detector (GeoDetector) is a method for detecting spatial heterogeneity via statistical and spatial analyses to explore the underlying factors that influence geographic phenomena or spatial distributions [59]. It quantifies the ability of different factors to explain spatial geographic phenomena and reveals which factors play a dominant role in spatial differentiation. This study uses the factor detector and interaction detector modules to explore the mechanisms influencing the regional urban–rural factor flows via the following formula
q = 1 h = 1 H n h · σ h 2 n · σ 2
where q represents the explanatory power of a factor for the spatial distribution of the target variable. The larger the value of q , the stronger the explanatory power of the factor for the spatial distribution. H is the number of subgroups of the spatial units, nh is the number of samples in the hth group, σ h2 is the variance of the hth group, n is the total number of samples (total number of spatial cells), and σ2 is the variance of the overall sample.

3. Results

3.1. Patterns of Urban–Rural Factor Flows

3.1.1. Single Factor Flow

Through use of the measurement methods above for determining the intensity of the human, goods, and funds flows between 28 streets and 44 townships in Huzhou City, a total of 1232 combinations of flows were obtained. These combinations were classified into four levels—high, medium-high, medium-low and low—using the natural breakpoint method in ArcGIS (Figure 4).
In the flow combination statistics, all three types of factor flows are characterized by the fact that the number of flow combinations of medium-low and low grades is much larger than that of medium-high and high grades. Specifically, the number of medium-high and high-grade flow combinations of human, goods, and funds flows is 126, 227, and 104, respectively, accounting for a ratio of less than 20%, which may be attributed to the existence of many underdeveloped street and township combinations.
Spatially, each type of flow demonstrates distinct geographical patterns and a pronounced concentration around the core urban and rural nodes. Human flow is most intense in the central area of Huzhou, with Dipu Street serving as the predominant urban node, involved in 19.34% of all human flows. Si’an Town functioned as the principal rural node, accounting for 9.53% of total human movements. The strongest connection is observed between Dipu Street and Si’an Township. Goods flow is heavily concentrated in the central and eastern regions, where Zhili Town emerges as the dominant hub, responsible for 16.61% of goods movements. Kangqian Street accounts for 10.15% of goods flow and constitutes a major urban distribution point. Funds flow is primarily channeled through the eastern and southwestern zones, with Longxi Street and Lijiaxiang Town acting as core financial nodes, commanding 14.90% and 8.00% of the total capital transfers. This pronounced spatial polarization, where a minority of nodes command the majority of flows, strongly aligns with the core–periphery structure predicted by classical regional development theories.

3.1.2. Integrated Flow

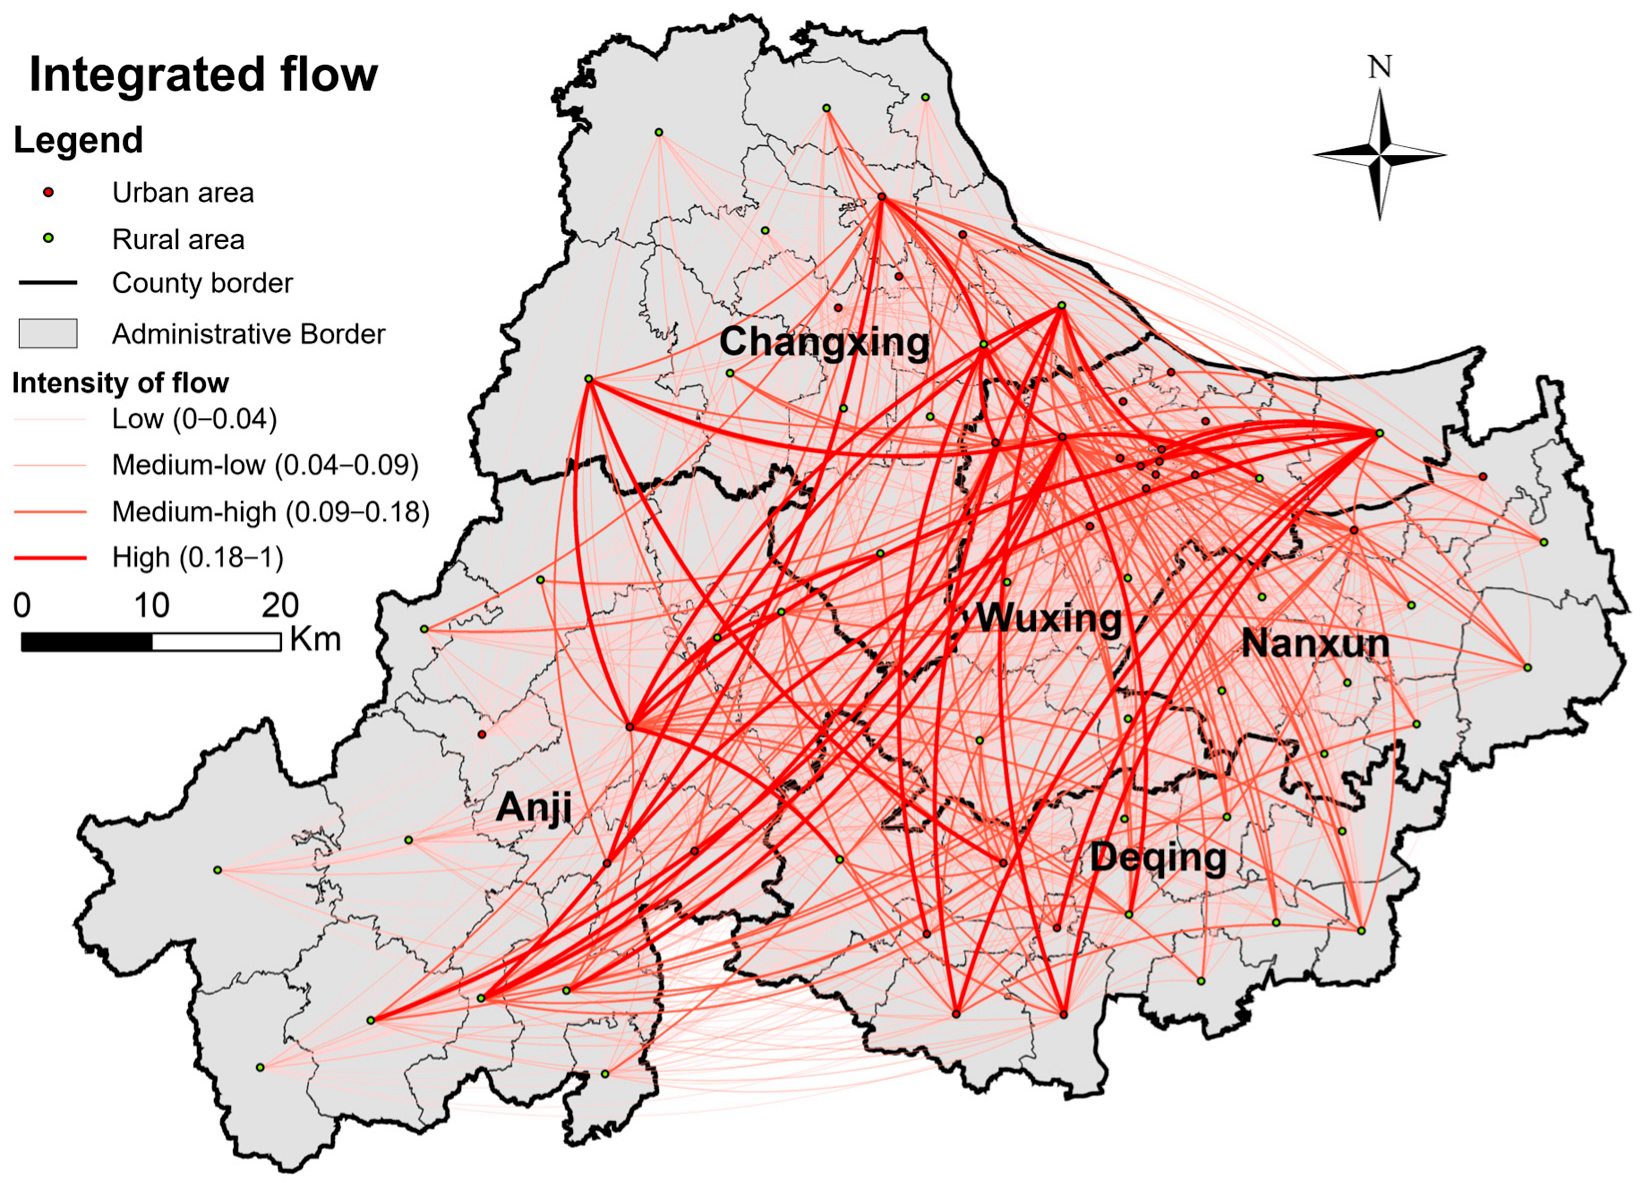
The synthesis of all three flows into an integrated metric further accentuates the spatial disparity in urban–rural connectivity. Only 12.09% of the node pairs demonstrate high or medium-high integrated flow intensity. The most robust integrative corridors are identified as Dipu Street–Zhili Town, Dipu Street–Si’an Town, and Maoyang Street–Zhili Town. Lower-ranked mobility intervals account for the overall majority, mostly consisting of two-by-two connections of less developed streets and towns.
Geographically, these high-integration corridors cluster predominantly along the southern and northeastern peripheries of Huzhou, adjacent to Hangzhou and Suzhou, which provides empirical evidence for exogenous growth pole effects and spillover dynamics (Figure 5). Within this network, Longxi Street is identified as the most influential urban node, involved in 10.65% of integrated flows. On the rural side, Zhili Town forms the most significant node, accounting for approximately 6.31% of all integrated flow activity.

3.2. The Barriers to Urban–Rural Factor Flows

3.2.1. Simulated Flow

The simulated flows, generated using a gravity model based on population size, eco-nomic scale, and geographical distance, also exhibit a pattern of significant spatial concentration. Among them, there are significantly fewer strong flow interval combinations than weak flow intervals, and there are 18 and 65 high and medium-high flow combinations, respectively, accounting for a total of 6.74% of the total, mainly for the core node-related intervals in the urban–rural node network. The strongest simulated flows are located in the eastern and southern parts of the city, with key corridors including Xiaoyuan Street–Zhili Town and Lingfeng Street–Baliandian Town.
According to Figure 6, there is a certain similarity between the integrated and simulated flows in the high- and low-value flow intervals, which indicates that the measurement method and simulation method can better reflect the urban and rural factor flows in Huzhou City to a certain extent. However, there is a difference between the integrated and simulated flows in some intervals, which indicates that there is a deviation between the measured and theoretical values, which may be due to the barriers of urban and rural factor flows discussed below.

3.2.2. The Barriers to Single-Factor Flows

Based on the measurements of human, goods, and funds flows and the theoretical factor flow simulation, the measured and theoretical values of single-factor flows in Huzhou City were obtained. Additionally, based on the theoretical and factual gaps, the degrees of promotion and impairment of single-factor flows were obtained and classified into three grades, namely, high, medium and low, through the natural breakpoint method (Table 2).
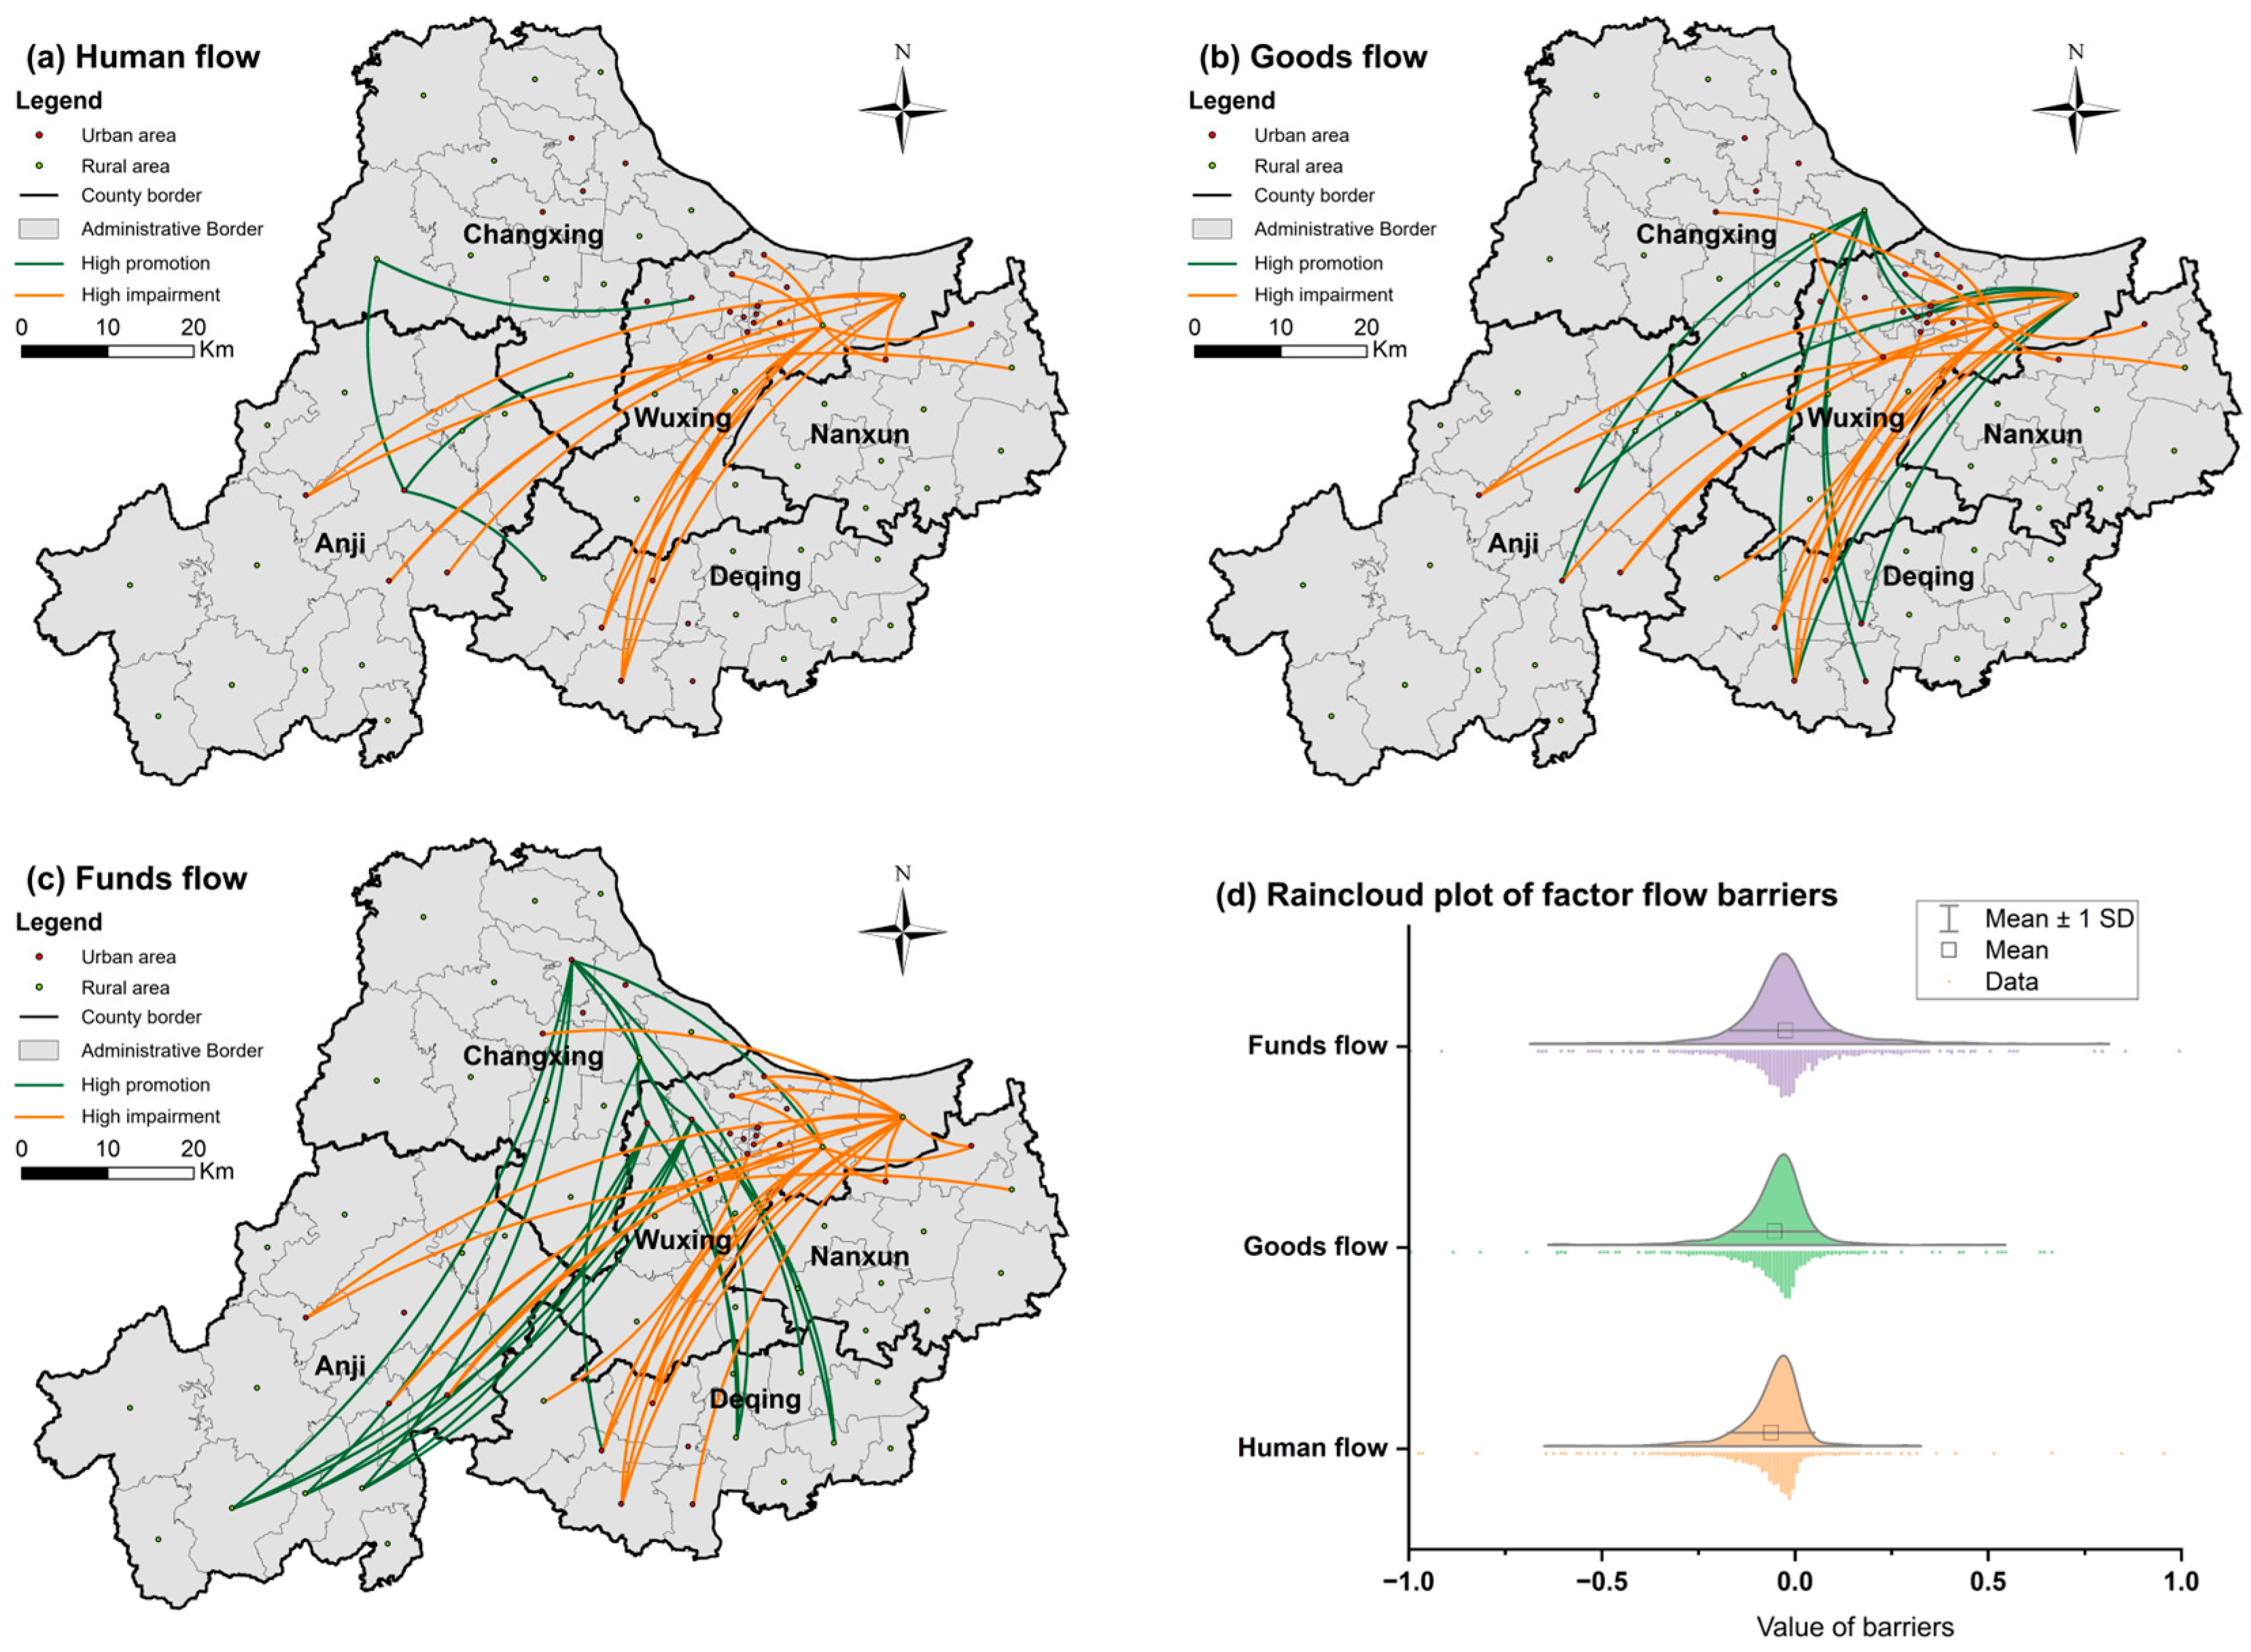
In terms of the values, overall, among all factor flow interval combinations in the study area, there are significantly more interval combinations with mobility barriers than with mobility promotion, with a total of 141 combinations of human flow, 216 combinations of goods flow, and 386 combinations of funds flow with factor flow facilitation, accounting for 11.44%, 17.53%, and 31.33% of the total, respectively. According to the raincloud plot in Figure 7, all three single-factor flow scenarios in the study area have the highest probability of being classified in terms of low to medium barriers, and more than half of the intervals have a weaker urban–rural single-factor flow measure than the overall urban–rural factor flow intensity of the interval in the simulation scenario, which means that the single-factor flows in most of the study area are not optimal.
The spatial distribution of flow barriers and facilitators in Huzhou vary significantly by factor type. Facilitated human flow corridors are concentrated in central urban areas, particularly around Dipu Street and its connections to Si’an, Moganshan, and Heping Towns. In contrast, obstructed human flow is most evident in northeastern–southern–central zones, notably along corridors linked to Xiaoyuan Street and Bailidian Town. Key facilitating urban nodes include Dui Pu Street, Longxi Street, and Fuxi Street, while obstacles are frequently associated with Wuyang Street and Jiuguan Street. Goods flow facilitation predominates along southern–northern axes, especially around Wuyang Street’s and Dipu Street’s connections to Hongqiao and Zhili Towns. Impediments cluster in eastern–southwestern regions, particularly near Lingshong Street and Xiaoyuan Street. Funds flow is most facilitated in northern–southwestern and southeastern corridors connected to Longxi, Longshan, and Yangjiabu Streets, while barriers concentrate in eastern–central southern areas, especially those linked to Wuyang Street and Zhili Township.

3.2.3. The Barriers to Integrated Factor Flows

The comprehensive urban–rural flows obtained from the previous measurements are compared with the simulated flows in Huzhou City, the comprehensive barriers to urban–rural factor flows in Huzhou City are identified on the basis of the real impacts reflected by the differences between the measured and simulated values, and both the flow promotion and flow impairment intervals are classified into high, medium, and low levels through the natural breakpoint method (Figure 8).
Overall, 54.63% of the urban–rural node pairs exhibit facilitated flows, while the other 459 intervals experience impediments, which means that the real environment in most regions of Huzhou City positively promotes urban–rural factor flows, whereas nearly half of the regions also have non-negligible obstacles to factor flows.
Among the comprehensive promotion intervals, there are a total of 494, 143, and 36 low, medium, and high promotion intervals, accounting for 73.40%, 21.25%, and 5.35% of the total, respectively. The most strongly facilitated corridors include Dipu Street–Si’an Town, Dipu Street–Zhili Town, and Longxi Street–Shangshu Township. At the node level, Longxi Street and Hongqiao Township stand out as critical facilitators, associated with 11 and 6 highly promoted corridors, respectively. Spatially, high-level facilitation is concentrated along the northeastern and southern edges of the city, with limited occurrence in the western and central areas.
Among the comprehensive barrier intervals, there are a total of 431, 112, and 16 low, medium, and high barrier intervals, accounting for 77.10%, 20.04%, and 2.86% of the total, respectively. The most severely impeded corridors are Lingfeng Street–Balidian Town, Xiaoyuan Street–Zhili Town, and Jiuguan Street–Balidian Town. Notably, Balidian Town serves as a recurrent barrier node, linked to nine high-level obstacle corridors, whereas no urban node exhibits a comparable concentration of strong impediments. Geographically, the barriers cluster predominantly in eastern Huzhou, particularly within a northeast–south–central zone.

3.3. Factors Influencing Urban–Rural Factor Flows in Huzhou City

We explored the impact mechanism of urban–rural factor flows in Huzhou City with GeoDetector. In this study, the dependent variable y is the intensity of single-factor or integrated urban–rural factor flows, and the dependent variable x represents the nine previously mentioned items of administrative boundaries, companies, scenic spots, medical facilities, transportation mileage, educational facilities, shopping facilities, living services, and economic vitality.

3.3.1. Impact Mechanisms of Single-Factor Flows

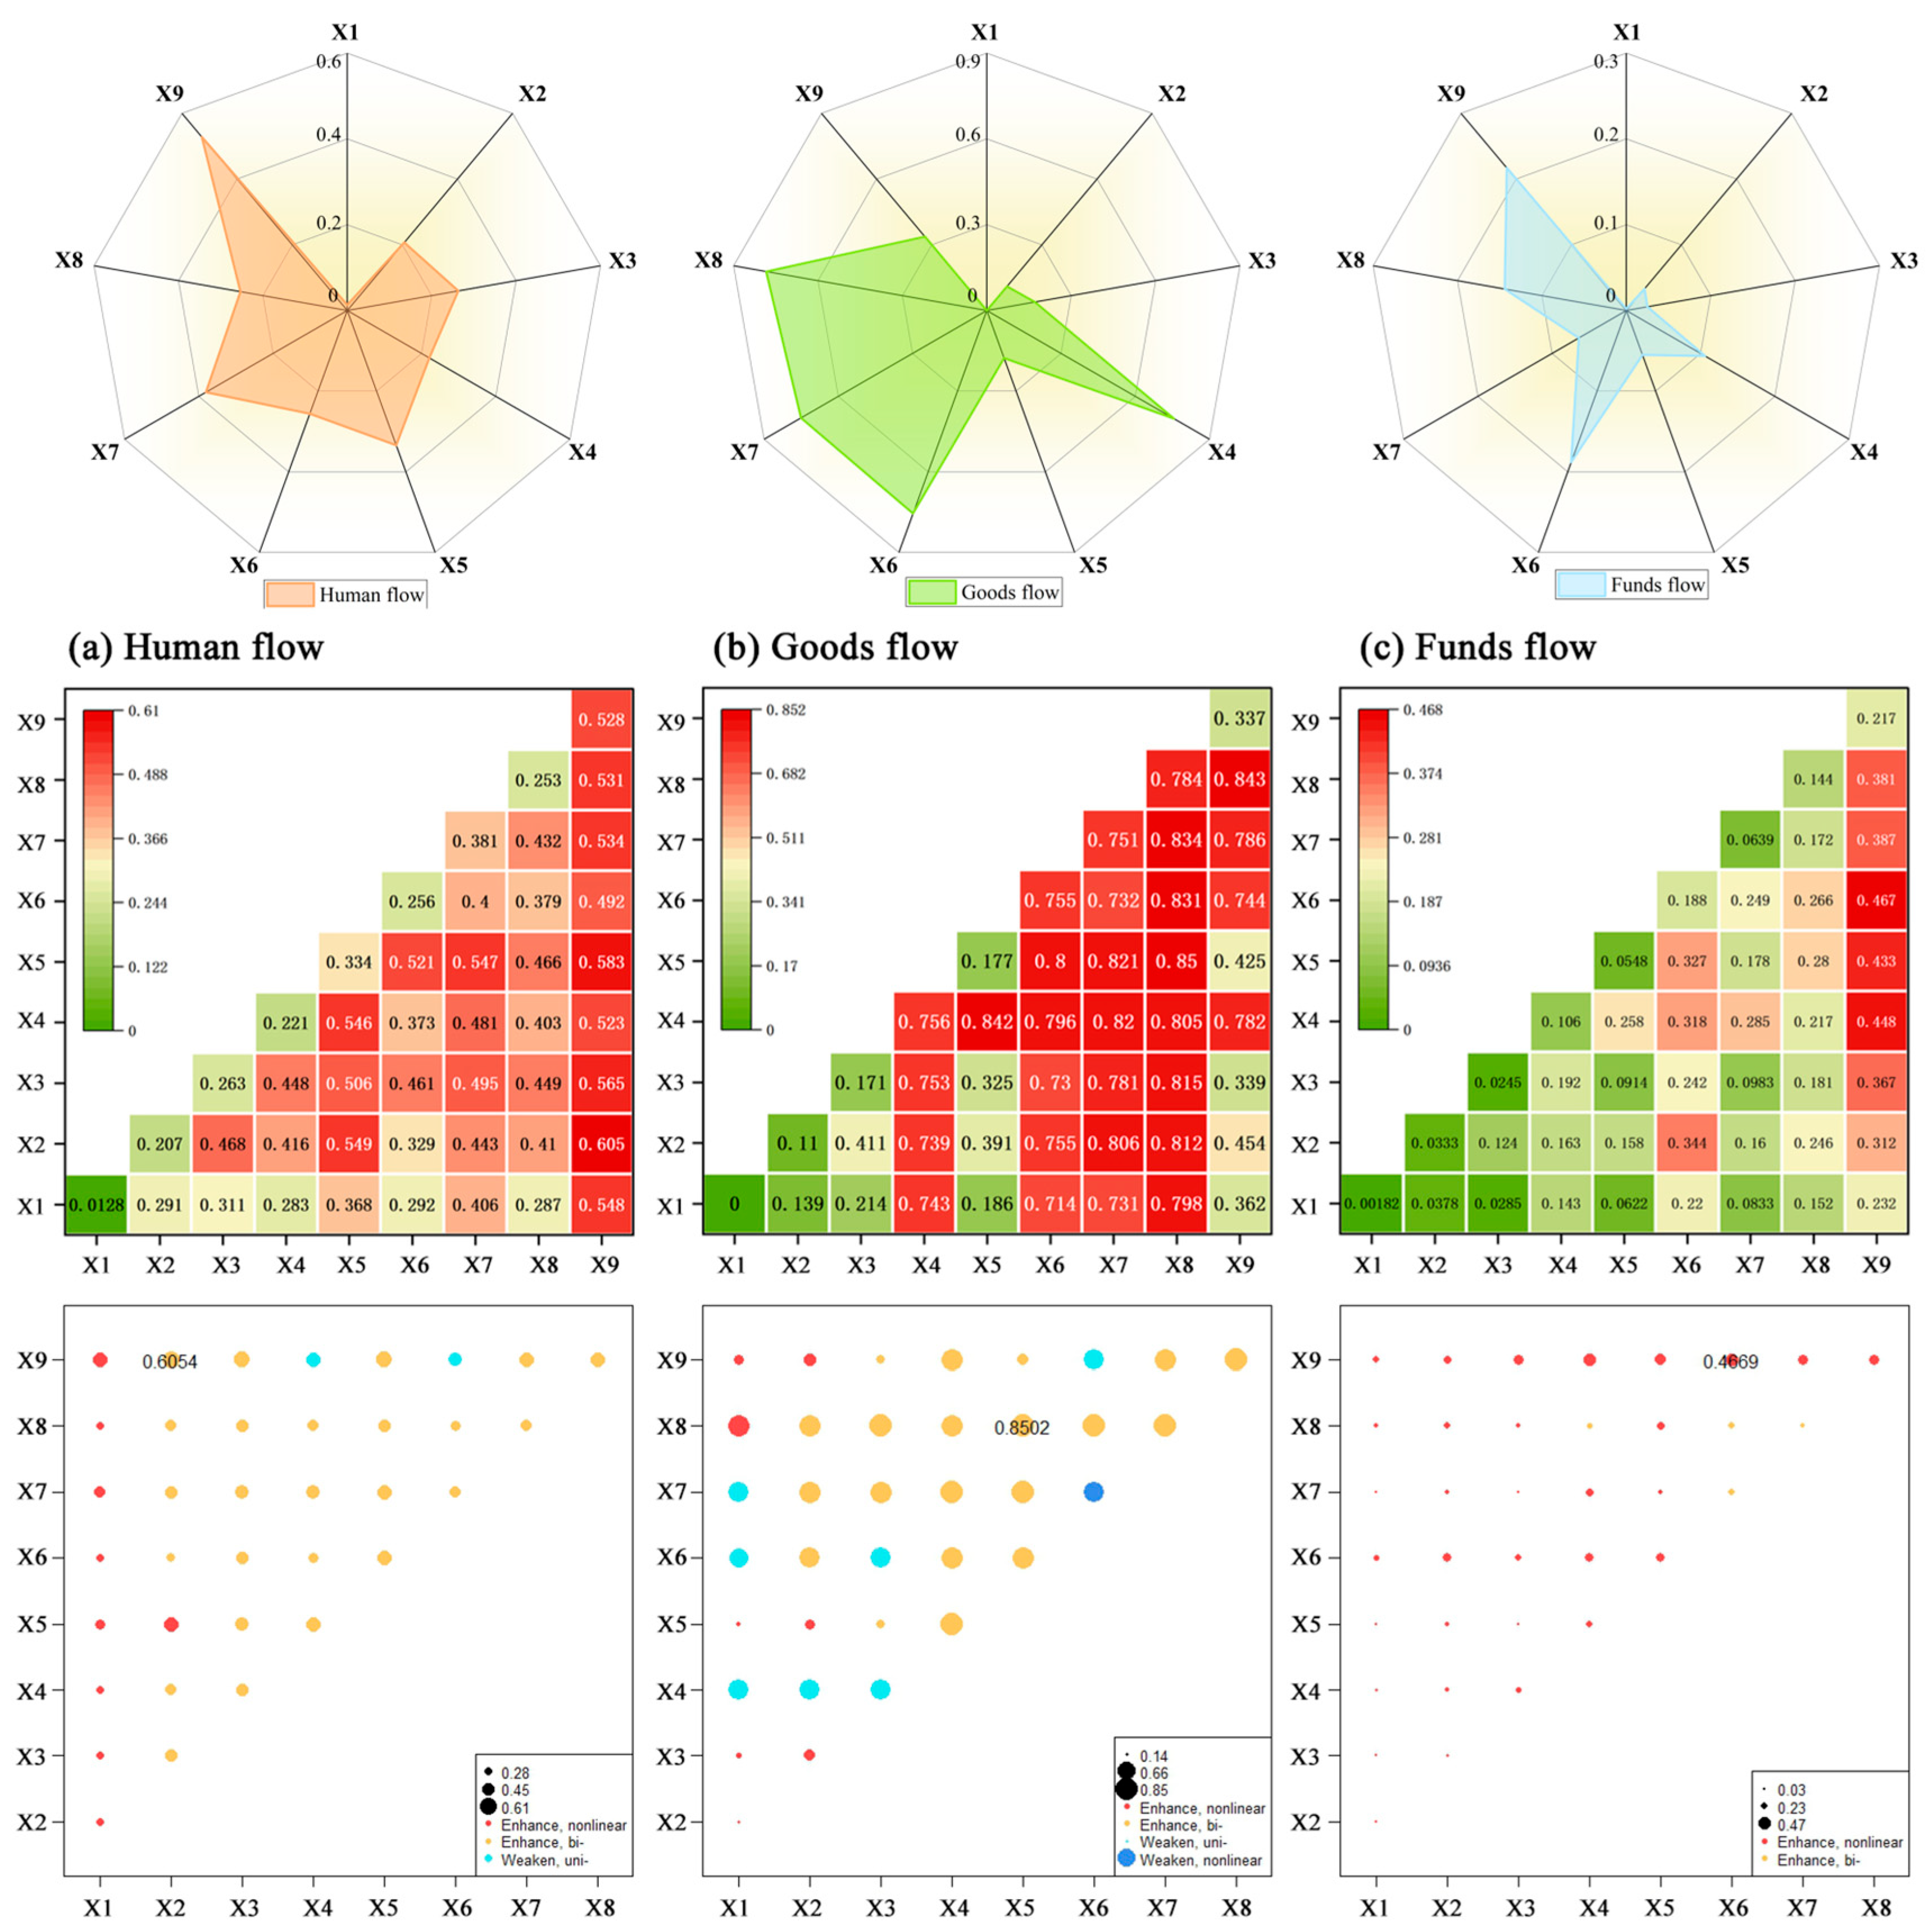
With respect to the single-factor impact mechanism, there is a significant difference in the explanatory power of different factors for the spatial distributions of human flow, goods flow, and funds flow (Table 3).
In terms of human flow, economic vitality has the strongest explanatory power for the spatial differentiation of population flow, indicating that the economic scale of the study area in response to economic vitality is a key factor driving population flow. Educational facilities and companies also have high explanatory power, reflecting the important influence of educational resources and employment opportunities on population flow. Scenic spots and medical facilities have a more significant effect on population mobility, indicating that tourism resources and medical facilities play a role in population mobility.
In terms of goods flow, living services and shopping services play a dominant role in the spatial distribution of goods flow, suggesting that living services and commercial activities are the main driving force of goods flow. Medical facilities and scenic spots also have high explanatory power, indicating that medical resources and tourism resources have a significant effect on the distribution of goods flow. Transport mileage and educational facilities have some influence on goods flow but are relatively low, indicating that in conditions where transport facilities are already basically complete, living services and shopping services, which have a demand for goods flow, are the main drivers of goods flow. Living services and shopping services will have greater impacts.
In terms of funds flow, the relatively high explanatory power of economic vitality and shopping services for explaining the spatial divergence of funds flow suggests that economic activities and business prosperity are important drivers of funds flow. The lower explanatory power of the other factors suggests that funds flow may be influenced by a combination of more complex factors (e.g., policies, financial networks). In addition, in none of the three single-factor flows did the presence or absence of the same administrative division have a significant effect on factor flows.
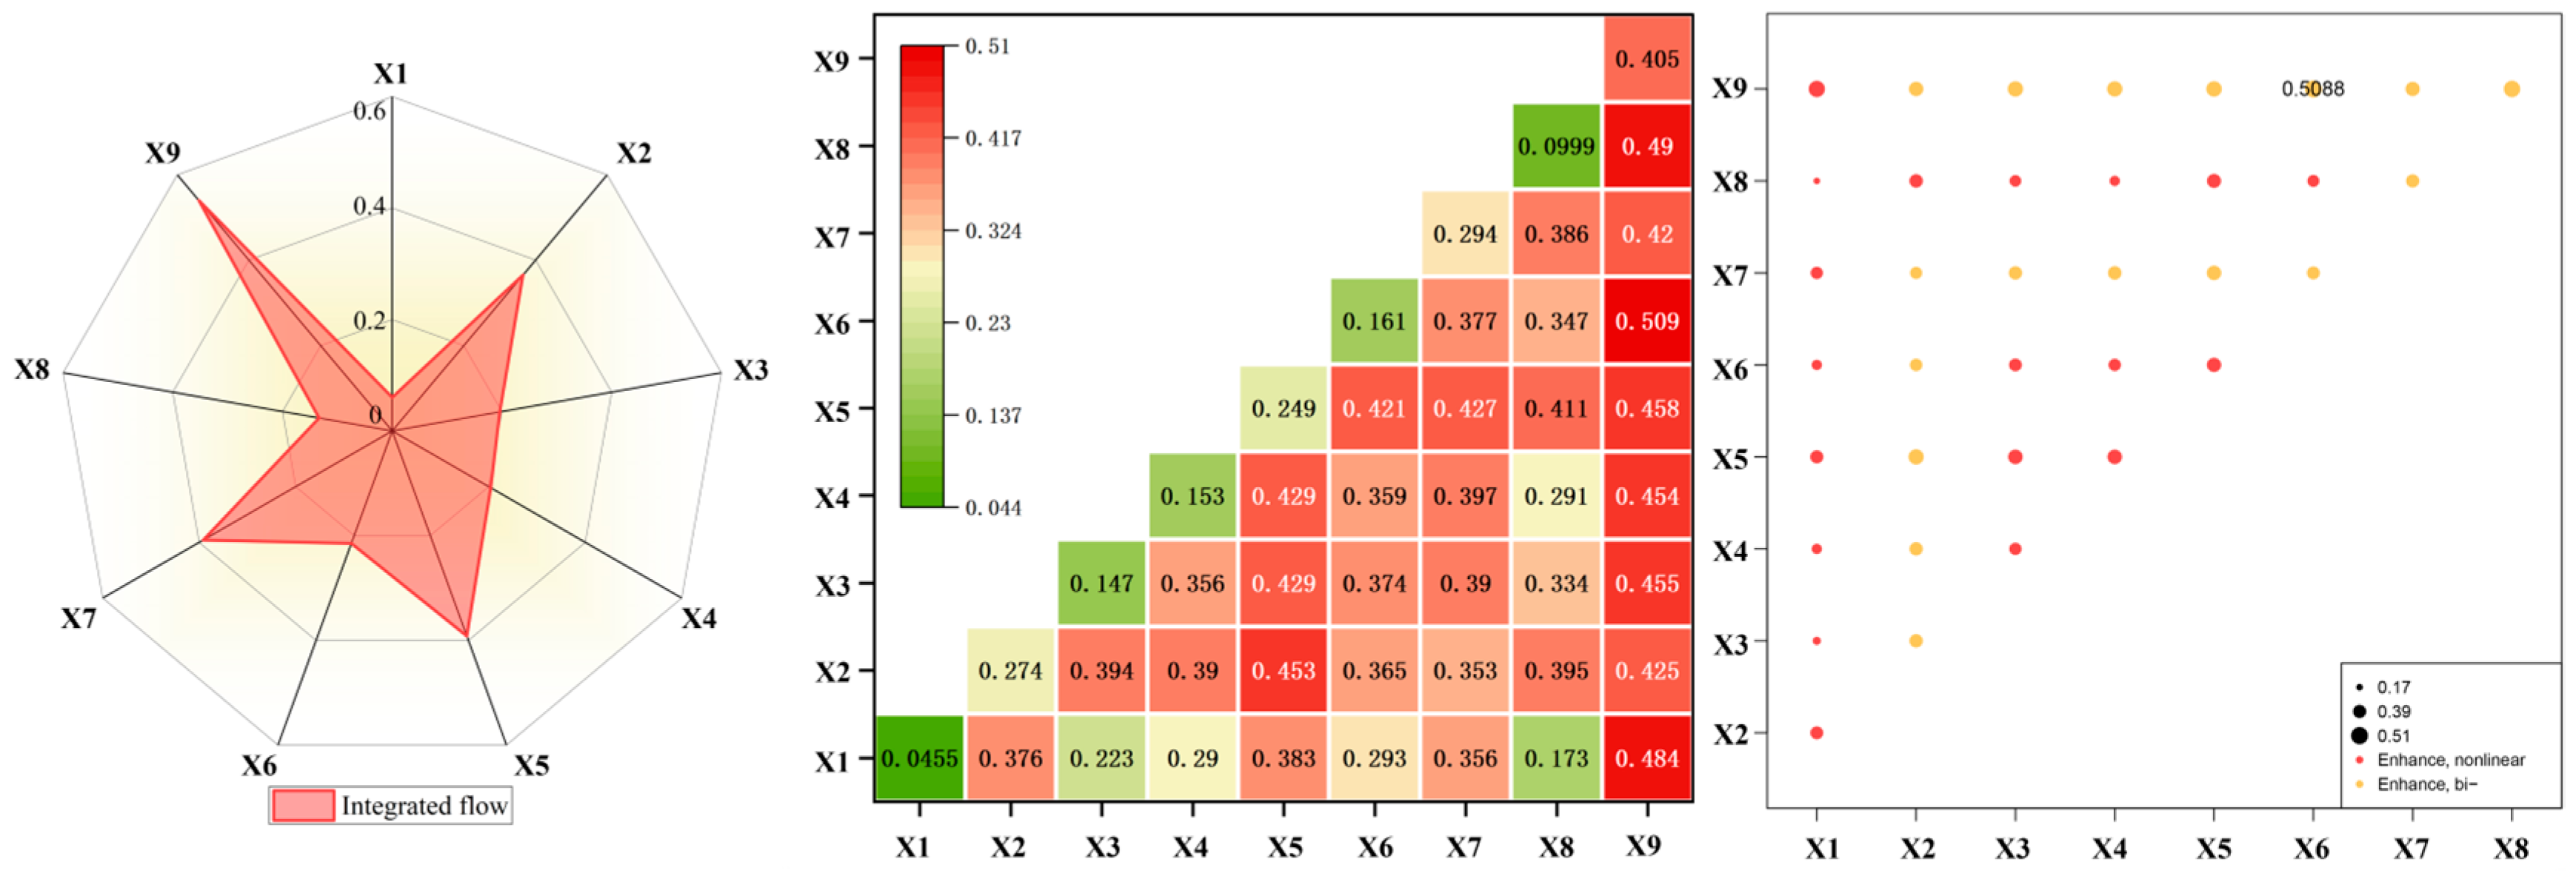
Factor interaction detection revealed widespread nonlinear enhancement effects between variables (Figure 9). Over 70% of the factor pairs for human flow and nearly 90% of those for funds flow exhibited synergistic effects. The strongest interactions were between companies and economic vitality for human flow, and between educational facilities and economic vitality for funds flow. These results indicate that the drivers of factor flows are highly interdependent, with combined effects significantly exceeding the influence of any single factor.

3.3.2. Impact Mechanisms of Integrated Factor Flows

The results of the single-factor impact analysis of GeoDetector for urban–rural integrated factor flows reveal that different factors have significantly different explanatory powers for integrated flow (Table 4). First, economic vitality has the strongest explanatory power for integrated flow, suggesting that economic activity is the key factor driving integrated flow. The high explanatory power of economic vitality, which usually reflects economic vitality and population concentration, suggests that economically active areas are significantly attractive to factor flows. Second, educational facilities and shopping services also have high explanatory power, suggesting that educational resources and business services have a significant effect on integrated factor flows. Educational facilities may influence integrated factor flows by attracting talent and knowledge flows, while shopping services influence factor flows through economic activities. Third, the high explanatory power of companies for integrated factor flows suggests that the distribution of firms has a significant effect on the spatial differentiation of factor flows. Firm agglomeration usually results in employment opportunities and economic activities, thus facilitating factor flows. In addition, the low explanatory power of administrative divisions for integrated factor flows suggests that differences in administrative divisions play a lesser role in influencing integrated factor flows (Figure 10).
The results of factor interaction testing show that different factor combinations have significant synergistic or nonlinear enhancement effects on urban and rural factor flows, with 52.79% of the factor interactions showing nonlinear enhancement and the remaining 47.22% of the factor interactions showing bifactorial enhancement, of which the educational facility factor and the economic vitality factor show the strongest bifactorial enhancement. Moreover, the factor interactions related to the economic vitality factor all show nonlinear enhancement, and all of them have a significant influence on the dependent variable.

4. Discussion

Urban–rural integrated development is a core mechanism for achieving coordinated regional development and sustainable economic growth, and two-way urban–rural factor flows and optimal allocation are of great theoretical and practical importance for narrowing the urban–rural gap and promoting social equity and efficiency [60,61]. By measuring the intensity of urban–rural factor flows in Huzhou City, identifying the obstacles to mobility, and investigating the driving mechanisms, this study provides an important basis for understanding the complex characteristics of urban–rural factor flows in small and medium-sized regions in economically developed areas of China. It also provides more examples for the formulation of strategies related to urban–rural integrated development.

4.1. Heterogeneous Core–Periphery Structures of Urban–Rural Factor Flows

The measurement study of urban–rural factor flows in Huzhou City revealed that the high-intensity flows of regional factors are highly concentrated in a few core nodes, revealing a significant ‘core–periphery’ spatial differentiation pattern, which is corroborated by the findings of previous studies [62]. However, our findings critically extend this model by revealing its internal heterogeneity and modification by exogenous forces. While canonical theory posits a simple binary between a single core and a passive periphery, our study demonstrates that the reality in Huzhou is more complex and factor-specific.
The core–periphery structure manifests through distinctly different spatial logics for each factor flow. Human flow exhibits a classic gravitational pull towards the central urban core, dominated by Dipu Street and Longxi Street, which concentrate high-quality employment, education, and medical services. This aligns with theories of agglomeration economies but also highlights the persistent primacy of administrative and service centers in guiding population movements [63]. In contrast, goods flow is oriented around logistical efficiency and market demand, forming a polycentric cluster in the central and eastern regions, with Zhili Town as a dominant specialized hub. This pattern reflects the influence of production networks and supply chain geography, suggesting that the ‘core’ for goods is defined by functional specialization rather than administrative centrality [64]. Most revealing is the behavior of funds flow, which, while partially following economic vitality, displays a more dispersed and volatile pattern influenced by policy incentives and external investment. This underscores the speculative and institutionally channeled nature of capital, which operates under a different spatial logic than either people or goods, resonating with theories of financialized urbanism [65].
Furthermore, the concentration of high-intensity nodes on Huzhou’s southern and northeastern fringes—proximate to Hangzhou and Suzhou—indicates that the core–periphery dynamics are not solely internally generated. These areas function as relay points or gateway zones that capture spillovers from larger metropolitan economies [66,67], creating a pattern of active edges and a stagnant interior. This finding suggests that Huzhou’s spatial structure is not a closed system but is embedded within and shaped by multi-scalar forces of the Yangtze River Delta’s integration.

4.2. The Complex Interplay of Urban–Rural Factor Flows and Barriers

The analysis of the barriers to urban–rural factor flows in Huzhou reveals a landscape characterized by coexistence and tension between facilitation and impediment. This aligns with a metamodern understanding of spatial processes, which emphasizes the simultaneous presence of seemingly contradictory elements [14,15]. Our findings indicate that factor flows are shaped by an ongoing oscillation between flow and obstruction rather than a linear progression toward integration.
First, the spatial distribution of facilitating and hindering effects shows significant heterogeneity, consistent with existing studies [68,69]. Regions with strong factor flows, particularly in the northeastern and southwestern corridors benefiting from proximity to Hangzhou and Suzhou, nonetheless contain localized barriers. This suggests that advantage and constraint coexist in a dynamic balance.
Second, the study reveals that individual nodes and their associated intervals often serve paradoxical roles, which has also been addressed in some studies [38]. Although certain intervals exhibit strong flow facilitation, they may still face some factor flow barriers that impede the optimal allocation of diversified resources. For example, the town of Bailidian is simultaneously a node of several high-impediment intervals and high-facilitation intervals. This indicates that urban–rural interaction is characterized by what may be termed functional oscillation: Whether a node facilitates or impedes flows depends on the specific pathway and factor type considered. Such a phenomenon challenges categorical interpretations and calls for a more relational and context-sensitive approach to planning.

4.3. Multifactor Synergistic Effects and Key Drivers of Urban–Rural Factor Flows

Analysis using Geodetector reveals that the drivers of urban–rural factor flows in Huzhou are not only multifaceted but also interact in complex, nonlinear ways. While economic vitality confirms its role as a primary driver—exerting significant influence on human, goods, funds, and integrated flows—this finding, consistent with the existing literature [70], only partially captures the systemic nature of these mobility mechanisms. More notably, this study helps specify how different factors operate with varying intensity across flow types [71,72,73,74]: Human flow responds strongly to educational resources, goods flow to commercial infra-structure, and funds flow to integrated business environments, pointing to the factor-specific institutional and geographic embeddedness of mobility drivers.
Crucially, the interaction effects among the factors reveal a pattern of synergistic amplification that exceeds the sum of the individual influences [75]. The nonlinear enhancement observed between economic vitality and companies, educational facilities and economic vitality, and transport mileage and living services—among others—indicates that urban–rural connectivity is not driven by isolated policies or investments but by configurations of enabling conditions. These synergies align with complexity-theoretic approaches in spatial development that emphasize crossover effects and system-level interventions.

4.4. Policy Implications

The complex, factor-specific, and often contradictory patterns of urban–rural flows observed in Huzhou suggest a critical need to move beyond conventional integration policies. Instead, we argue for a more nuanced approach that embraces differentiated governance, adaptive planning, and synergistic intervention design.
(1) Policy should prioritize differentiated spatial strategies that reflect the distinct logics of human, goods, and funds flows. The identified heterogeneity in core–periphery structures necessitates moving beyond uniform regional development approaches. Interventions targeting human flows should intensify public service provision and transit connectivity in central urban nodes such as Dipu Street to leverage agglomeration effects. For goods flows, investment should focus on specialized logistical hubs like Zhili Town, enhancing market infrastructure and multimodal transport to support functional network integration. Policies influencing funds flows must extend beyond economic vitality to include stabilizing financial regulation, encouraging external investment linkages, and building institutional capacity in gateway zones, particularly those interfacing with major metropolitan regions such as Hangzhou and Suzhou.
(2) Planning frameworks must adopt adaptive and relational governance to address the simultaneous presence of facilitation and barriers. The coexistence of high-intensity flows and significant impediments—even within single nodes—calls for context-sensitive and dynamic policy approaches. Rather than categorizing areas as either promoted or impeded, planning should recognize that nodes such as Bailidian Town serve divergent roles across different flow types and pathways. Governance should embrace continuous monitoring and flexible interventions that can respond to these oscillating roles, integrating digital platforms and real-time data to enable responsive and precise policy adjustments tailored to specific node–factor interactions.
(3) Policy interventions should leverage detected synergistic effects between factors through integrated policy packages rather than isolated measures. The nonlinear amplification effects observed between economic vitality and companies, transport and living services, or education and investment indicate that maximizing flow efficiency requires combinatory approaches. Governments should develop multisectoral initiatives—such as coupling economic development with educational upgrading or logistics modernization with business environment reforms—that explicitly harness these synergies. Additionally, establishing interdepartmental policy-testing mechanisms and employing computational simulations to model factor interactions prior to intervention may help optimize the design of such synergistic policy bundles and avoid unintended consequences.

5. Conclusions

Against the dual challenges of metropolitan siphoning effects and endogenous deficiencies [76,77], this study pioneers an integrated geospatial analytics framework to decode multifactor flow dynamics. Leveraging mobile signaling big data and POI datasets, we quantify Huzhou’s flow patterns of human, goods, and funds at the township scale; simulate optimal flows via an enhanced gravity model with impedance diagnostics; and identify barriers through measured–simulated value deviations. Spatial statistical analysis using GeoDetector further reveals nonlinear driving mechanisms. The findings of this study are as follows. (1) Urban–rural factor flows exhibit pronounced spatial polarization, with less than 20% of connections accounting for the majority of flow intensity. The observed core–periphery structure is fundamentally heterogeneous—varying by factor type—and exogenously modulated, with fringe zones serving as active intermediaries for metropolitan spillovers rather than passive peripheries. (2) Barriers to factor flows show complex spatial patterns, with 45.37% of integrated flow intervals experiencing impediments. Notably, certain nodes simultaneously function as facilitators and obstacles, depending on the flow type and direction, revealing a metamodern tension between flow promotion and impairment that cannot be captured through binary classifications. (3) While economic vitality confirms its role as a central driver, factor interactions exhibit strong nonlinear synergies—particularly between economic activity and educational resources, transport infrastructure, and commercial services—suggesting that urban–rural connectivity depends on configurational conditions rather than isolated factors.
This study offers both theoretical and methodological innovations. Theoretically, it challenges static core–periphery models by revealing heterogeneous, factor-specific spatial structures modulated by external metropolitan spillovers—advancing relational perspectives in evolutionary economic geography [78,79]. It further introduces a metamodern lens to spatial analysis, capturing the simultaneous presence of facilitation and barriers within single nodes [15]. Methodologically, we propose an integrated analytical framework that simultaneously quantifies urban–rural factor flow intensity, diagnoses spatial barriers, and identifies driving mechanisms, enabling high-resolution and replicable analysis in small and medium-sized cities. Regarding limitations, cross-sectional data constraints preclude an analysis of temporal evolution. Future work should incorporate longitudinal and real-time IoT data to capture flows’ evolution. Additionally, further comparative research across different city regions would also help generalize the observed patterns and mechanisms.

Author Contributions

Conceptualization, J.Z., C.Y., X.C., Y.C. and C.Z.; Methodology, J.Z., C.Y., X.C., Y.C., C.Z. and M.G.; Software, C.Y.; Validation, C.Y. and F.R.; Formal analysis, C.Y. and M.G.; Investigation, Y.C.; Resources, X.C. and C.Z.; Data curation, C.Y., Y.C. and M.G.; Writing—original draft, J.Z., C.Y., Y.C. and M.G.; Writing—review & editing, J.Z., C.Y., X.C., Y.C., C.Z., F.R. and M.G.; Visualization, F.R.; Supervision, J.Z., X.C., C.Z. and M.G.; Project administration, X.C.; Funding acquisition, J.Z. All authors have read and agreed to the published version of the manuscript.

Funding

This research was funded by Zhejiang Provincial Sannong-Jiufang Science and Technology Collaboration Initiative, grant number 2025SNJF012.

Data Availability Statement

The authors do not have permission to share data.

Conflicts of Interest

The authors declare no conflicts of interest.

References

  1. Niu, B.; Ge, D.Z.; Sun, J.W.; Sun, D.Q.; Ma, Y.Y.; Ni, Y.L.; Lu, Y.Q. Multi-scales urban-rural integrated development and land-use transition: The story of China. Habitat Int. 2023, 132, 102744. [Google Scholar] [CrossRef]
  2. Zhang, C.; Fan, Y.P.; Fang, C.L. Orderly and synergistic development of urban-rural integration based on evolutionary game model: A case study in the Jiangxi Province, China. Land Use Policy 2024, 146, 107331. [Google Scholar] [CrossRef]
  3. Chen, X.; Wu, R. How can rural industrial revitalization and rural education level reduce the urban–rural income gap? Financ. Res. Lett. 2025, 73, 106592. [Google Scholar] [CrossRef]
  4. Li, Y.X.; Liao, C.C.; Li, X.M.; Guo, R.Z. Understanding regional structure through spatial networks: A simulation optimization framework for exploring balanced development. Habitat Int. 2024, 152, 103155. [Google Scholar] [CrossRef]
  5. Liu, Y.; Li, Y. Revitalize the world’s countryside. Nature 2017, 548, 275–277. [Google Scholar] [CrossRef]
  6. Xinhua News Agency. Communique of the Third Plenary Session of the 20th Central Committee of the Communist Party of China. Available online: https://www.gov.cn/yaowen/liebiao/202407/content_6963409.htm (accessed on 18 July 2024).
  7. Lynch, K. Rural-Urban Interaction in the Developing World; Taylor & Francis: Abingdon, UK, 2004. [Google Scholar]
  8. Tacoli, C. The links between urban and rural development. Environ. Urban. 2003, 15, 3–12. [Google Scholar] [CrossRef]
  9. Tacoli, C. Rural-urban interactions: A guide to the literature. Environ. Urban. 1998, 10, 147–166. [Google Scholar] [CrossRef]
  10. Lewis, A. Economic Development with Unlimited Supplies of Labour. Manch. Sch. Econ. Soc. Stud. 1954, 22, 139–191. [Google Scholar]
  11. Todaro, M.P. A Model of Labor Migration and Urban Unemployment in Less Developed Countries. Am. Econ. Rev. 1969, 59, 138–148. [Google Scholar]
  12. Mcgee, T.G. Chapter 1 The Emergence of Desakota Regions in Asia: Expanding a Hypothesis. In The Extended Metropolis; Norton, G., Bruce, K., McGee, T.G., Eds.; University of Hawaii Press: Honolulu, HI, USA, 1991; pp. 1–26. [Google Scholar]
  13. Castells, M. The Space of Flows. In The Rise of the Network Society; Blackwell Publisher: Cambridge, MA, USA, 1996; pp. 407–459. [Google Scholar]
  14. Pipere, A.; Martinsone, K. Shaping an Image of Science in the 21st Century: The Perspective of Metamodernism. Societies 2023, 13, 254. [Google Scholar] [CrossRef]
  15. Matlovic, R.; Matlovicová, K. The Metamodern Shift in Geographical Thought: Oscillatory Ontology and Epistemology, Post-Disciplinary and Post-Paradigmatic Perspectives. Folia Geogr. 2025, 67, 22–69. [Google Scholar]
  16. Unwin, T. Urban-Rural Interaction in Developing Countries: A Theoretical Perspective. In The Geography of Urban-Rural Interaction in Developing Countries; Routledge: Abingdon, UK, 2017; pp. 11–32. [Google Scholar]
  17. Lagakos, D. Urban-Rural Gaps in the Developing World: Does Internal Migration Offer Opportunities? J. Econ. Perspect. 2020, 34, 174–192. [Google Scholar] [CrossRef]
  18. Cattaneo, A.; Nelson, A.; McMenomy, T. Global mapping of urban-rural catchment areas reveals unequal access to services. Proc. Natl. Acad. Sci. USA 2021, 118, e2011990118. [Google Scholar] [CrossRef]
  19. Pan, W.; Wang, J.; Li, Y.R.; Chen, S.T.; Lu, Z. Spatial pattern of urban-rural integration in China and the impact of geography. Geogr. Sustain. 2023, 4, 404–413. [Google Scholar] [CrossRef]
  20. Temenos, C. Minor theory and relational urbanism. Environ. Plan. D Soc. Space 2017, 35, 579–583. [Google Scholar] [CrossRef]
  21. Douglass, M. A Regional Network Strategy for Reciprocal Rural-Urban Linkages: An Agenda for Policy Research with Reference to Indonesia. Third World Plan. Rev. 1998, 20, 1–33. [Google Scholar] [CrossRef]
  22. Sheller, M.; Urry, J. The new mobilities paradigm. Environ. Plan. A Econ. Space 2006, 38, 207–226. [Google Scholar] [CrossRef]
  23. Sandow, E. Commuting behaviour in sparsely populated areas: Evidence from northern Sweden. J. Transp. Geogr. 2008, 16, 14–27. [Google Scholar] [CrossRef]
  24. Pan, M.; Li, W.; Wang, C. From roads to roofs: How urban and rural mobility influence building energy consumption. Energy Res. Soc. Sci. 2024, 118, 103800. [Google Scholar] [CrossRef]
  25. Cheng, M.; Yin, Z.; Westlund, H. Counterurbanization in China? A case study of counties in Huang-Huai-Hai area from the perspective of urban-rural relations. J. Rural Stud. 2024, 110, 103386. [Google Scholar] [CrossRef]
  26. Castillo, G.; Brereton, D. The country and the city: Mobility dynamics in mining regions. Extr. Ind. Soc. Int. J. 2018, 5, 307–316. [Google Scholar] [CrossRef]
  27. Delmotte, C.; Davidsen, C.; Piccoli, E. Multi-directional migration, land ownership and livelihood strategies in the Peruvian Andes: Conceptualising urban-rural return flows during the COVID-19 pandemic. J. Ethn. Migr. Stud. 2025, 51, 1–19. [Google Scholar] [CrossRef]
  28. Morrill, R.; Cromartie, J.; Hart, G. Metropolitan, urban, and rural commuting areas: Toward a better depiction of the United States settlement system. Urban Geogr. 1999, 20, 727–748. [Google Scholar] [CrossRef]
  29. Serlenga, L.; Shin, Y. Gravity models of interprovincial migration flows in Canada with hierarchical multifactor structure. Empir. Econ. 2021, 60, 365–390. [Google Scholar] [CrossRef]
  30. Shen, C.; Zhang, X.Y.; Li, X. Revisiting the regional sustainable development from the perspective of multi-system factor flows-Evidence in the Yangtze River Delta of China. Heliyon 2023, 9, e18893. [Google Scholar] [CrossRef] [PubMed]
  31. Itoh, R. Dynamic control of rural–urban migration. J. Urban Econ. 2009, 66, 196–202. [Google Scholar] [CrossRef]
  32. Kang, Y.H.; Gao, S.; Liang, Y.L.; Li, M.X.; Rao, J.M.; Kruse, J. Multiscale dynamic human mobility flow dataset in the US during the COVID-19 epidemic. Sci. Data 2020, 7, 390. [Google Scholar] [CrossRef]
  33. Zhang, J.; Yuan, X.D.; Tan, X.P.; Zhang, X. Delineation of the Urban-Rural Boundary through Data Fusion: Applications to Improve Urban and Rural Environments and Promote Intensive and Healthy Urban Development. Int. J. Environ. Res. Public Health 2021, 18, 7180. [Google Scholar] [CrossRef] [PubMed]
  34. Zhang, J.; Li, L.; Zhu, C.; Hao, Q.; Chen, X.; Yu, Z.; Gan, M.; Li, W. Investigating the Spatial Heterogeneity and Influencing Factors of Urban Multi-Dimensional Network Using Multi-Source Big Data in Hangzhou Metropolitan Circle, Eastern China. Land 2023, 12, 1808. [Google Scholar] [CrossRef]
  35. Wang, Y. Analysis on the evolution of spatial relationship between population and economy in the Beijing-Tianjin-Hebei and Shandong region of China. Sustain. Cities Soc. 2022, 83, 103948. [Google Scholar] [CrossRef]
  36. Zheng, X.; Yu, H.; Yang, L. Factor Mobility, Industrial Transfer and Industrial Carbon Emission: A Spatial Matching Perspective. Front. Environ. Sci. 2022, 10, 822811. [Google Scholar] [CrossRef]
  37. Zhang, J.; Hao, Q.; Chen, X.; Zhu, C.; Zhang, L.; Hong, M.; Wu, J.; Gan, M. Exploring Spatial Network Structure of the Metropolitan Circle Based on Multi-Source Big Data: A Case Study of Hangzhou Metropolitan Circle. Remote Sens. 2022, 14, 5266. [Google Scholar] [CrossRef]
  38. Zhang, Y.; Chen, Y.; Wang, X.; Gong, J.; Ji, M.; Zhao, J. Level measurement and influencing factors of the obstacle to factor flow in the Chengdu-Chongqing Economic Circle. J. Nat. Resour. 2024, 39, 897–911. [Google Scholar] [CrossRef]
  39. Du, W.; Zhang, Q.; Chen, Y.; Ye, Z. An urban short-term traffic flow prediction model based on wavelet neural network with improved whale optimization algorithm. Sustain. Cities Soc. 2021, 69, 102858. [Google Scholar] [CrossRef]
  40. Zhou, D.; Qi, J.; Zhong, W.; Wang, J. Urban and rural integration development in urban agglomerations: Measurement and evaluation, obstacle factors and driving factors. Geogr. Res. 2023, 42, 2914–2939. [Google Scholar] [CrossRef]
  41. Yenneti, K.; Day, R.; Golubchikov, O. Spatial justice and the land politics of renewables: Dispossessing vulnerable communities through solar energy mega-projects. Geoforum 2016, 76, 90–99. [Google Scholar] [CrossRef]
  42. Zhou, M.; Lyu, H.Y. Intensifying separation or collaborative prosperity? The impact of The Belt and Road Initiative on China’s urban-rural integration development from a spatial justice lens. Habitat Int. 2025, 156, 103249. [Google Scholar] [CrossRef]
  43. Wei, S.Y.; Huang, J.; Zhang, Z.L. The Impact of Land Development Rights Transfer on Urban-Rural Spatial Justice: A Case Study of Chongqing’s Land Quota Trading. Land 2025, 14, 174. [Google Scholar] [CrossRef]
  44. Bittner, C.; Sofer, M. Land use changes in the rural–urban fringe: An Israeli case study. Land Use Policy 2013, 33, 11–19. [Google Scholar] [CrossRef]
  45. Haller, A. The “sowing of concrete”: Peri-urban smallholder perceptions of rural–urban land change in the Central Peruvian Andes. Land Use Policy 2014, 38, 239–247. [Google Scholar] [CrossRef]
  46. Scoones, I. Livelihoods perspectives and rural development. J. Peasant Stud. 2009, 36, 171–196. [Google Scholar] [CrossRef]
  47. Taylor, J.E.; Martin, P.L. Human Capital: Migration and Rural Population Change. Handb. Agric. Econ. 2001, 1, 457–511. [Google Scholar]
  48. Zhuo, C.; Xie, Y.; Mao, Y.; Chen, P.; Li, Y. Can cross-regional environmental protection promote urban green development: Zero-sum game or win-win choice? Energy Econ. 2022, 106, 105803. [Google Scholar] [CrossRef]
  49. Peng, S.; Liang, S.; Dai, T.; Peng, H. Exploring the Mechanisms of Regional Environmental Collaborative Legislation in China: Policy Effectiveness, Practical Challenges, and Policy Suggestions. Sustainability 2024, 16, 3959. [Google Scholar] [CrossRef]
  50. Ma, L.; Liu, S.; Fang, F.; Che, X.; Chen, M. Evaluation of urban-rural difference and integration based on quality of life. Sustain. Cities Soc. 2020, 54, 101877. [Google Scholar] [CrossRef]
  51. Sun, S.; Zhang, N.-N.; Liu, J.-B. Study on the Rural Revitalization and Urban-Rural Integration Efficiency in Anhui Province Based on Game Cross-Efficiency DEA Model. Comput. Intell. Neurosci. 2022, 2022, 7373435. [Google Scholar] [CrossRef] [PubMed]
  52. Yuan, Z.; Ge, D.; Sun, P.; Tang, S.; Li, Y. Measurement and optimization paths of regional attraction under the background of population shrinkage:Taking the townships of Jiangsu Province as an example. Prog. Geogr. 2024, 43, 1074–1087. [Google Scholar] [CrossRef]
  53. Zhao, W.Y.; Pan, W.; Li, Y.R. Urban-rural integration within the county territory: Theoretical connotation and research progress. Geogr. Res. 2023, 42, 1445–1464. [Google Scholar] [CrossRef]
  54. Ding, L.; Wang, Y.H.; Zhang, X.C.; Zhang, J.S. The Latest Progress in Social Space Research and Its Implications for Urban and Rural Planning Study in China. Urban Plan. Int. 2025, 1–14. [Google Scholar] [CrossRef]
  55. Jin, W.C.; Wang, X.; He, A.H. Promoting Integrated Urban-rural Development: Experiences, Challenges, and Responses. Issues Agric. Econ. 2025, 02, 4–14. [Google Scholar] [CrossRef]
  56. Yang, J.; Ge, D.Z.; Sun, P.; Yuan, Z.Y. The mechanism of urban-rural integrated development based on the “population-land-capital” factor flow:A case study of Jiangxi Province. Resour. Sci. 2025, 47, 110–124. [Google Scholar] [CrossRef]
  57. Taylor, P.J.; Evans, D.M.; Pain, K. Application of the interlocking network model to mega-city-regions: Measuring polycentricity within and beyond city-regions. Reg. Stud. 2008, 42, 1079–1093. [Google Scholar] [CrossRef]
  58. Shahriar, S.; Qian, L.; Kea, S. Determinants of Exports in China’s Meat Industry: A Gravity Model Analysis. Emerg. Mark. Financ. Trade 2019, 55, 2544–2565. [Google Scholar] [CrossRef]
  59. Wang, J.; Xu, C. Geodetector: Principle and prospective. Acta Geogr. Sin. 2017, 72, 116–134. [Google Scholar] [CrossRef]
  60. Zhang, J.; Guan, C.Y.; Zhang, L.; Yu, Z.L.; Ye, C.X.; Zhu, C.M.; Li, S.N.; Wang, K.; Gan, M.Y. Spatial identification and evaluation of rural vitality from a function-element-flow perspective: Evidence of Lin’an district in Hangzhou, China. J. Geogr. Sci. 2024, 34, 1228–1250. [Google Scholar] [CrossRef]
  61. Zhang, X.W.; Fang, C.L.; Ma, H.T.; Hu, X.Q. How does digital economy affect urban-rural integration? An empirical study from China. Habitat Int. 2024, 154, 103229. [Google Scholar] [CrossRef]
  62. Tian, S.Z.; Jiang, J.L.; Li, H.; Li, X.M.; Yang, J.; Fang, C.L. Flow space reveals the urban network structure and development mode of cities in Liaoning, China. Humanit. Soc. Sci. Commun. 2023, 10, 257. [Google Scholar] [CrossRef]
  63. Zhou, Y.; Zheng, W.; Wang, X. Economic efficiency of the Wuhan metropolitan area under the interaction of urban hierarchy and population flow. Prog. Geogr. 2025, 44, 64–76. [Google Scholar]
  64. Wang, X.M.; Ding, Z.W. Analysis of network patterns and its influencing factors in Chengdu-Chongqing urban agglomeration based on multi-flow. Heliyon 2024, 10, e30375. [Google Scholar] [CrossRef] [PubMed]
  65. Xu, Z.M.; Lin, G.C.S. Financializing Shanghai: Entrepreneurial Urban Governance and the Changing Mechanisms of Urban Redevelopment under State-Led Financialized Urbanism. J. Plan. Educ. Res. 2025, 0739456X241306767. [Google Scholar] [CrossRef]
  66. Sun, X.Q.; Xiang, P.C.; Dong, N.D.; Sui, H.J.; Bo, Z. Can transportation networks contribute to the sustainable development of urban agglomeration spatial structures? Sustain. Cities Soc. 2024, 117, 105983. [Google Scholar] [CrossRef]
  67. Xu, J.; Qiu, Y.D.; Rahman, M.K.; Bhuiyan, M.A.; Hasan, T. The Regional Economic Spatial Spillover Effect of China and ASEAN. J. Ind. Compet. Trade 2025, 25, 1–19. [Google Scholar] [CrossRef]
  68. Yuan, T.; Xiang, Y.J.; Xiong, L.X. Driving forces and obstacles analysis of urban high-quality development in Chengdu. Sci. Rep. 2024, 14, 24530. [Google Scholar] [CrossRef]
  69. Li, X.M.; Gao, M.K.; Li, H.; Hou, X.Y.; Tian, S.Z.; Yang, J.; Zhang, X.H. Spatio-temporal evolution and obstacle diagnosis of human settlements based on the “production-living-ecological” functions. Sci. Rep. 2024, 14, 31022. [Google Scholar] [CrossRef]
  70. Zheng, L.; Liu, Y. Digital economy, agricultural loans, and urban–rural income gap. Financ. Res. Lett. 2025, 77, 107034. [Google Scholar] [CrossRef]
  71. Qian, X.; Wang, Y.; Zhang, G. The spatial correlation network of capital flows in China: Evidence from China’s High-Value Payment System. China Econ. Rev. 2018, 50, 175–186. [Google Scholar] [CrossRef]
  72. Yuan, Q.; Wang, J. Goods movement, road safety, and spatial inequity: Evaluating freight-related crashes in low-income or minority neighborhoods. J. Transp. Geogr. 2021, 96, 103186. [Google Scholar] [CrossRef]
  73. Zhang, W.; Chong, Z.; Li, X.; Nie, G. Spatial patterns and determinant factors of population flow networks in China: Analysis on Tencent Location Big Data. Cities 2020, 99, 102640. [Google Scholar] [CrossRef]
  74. Zhao, P.; Xintao, L.; Wenzhong, S.; Tao, J.; Wengen, L.; Chen, M. An empirical study on the intra-urban goods movement patterns using logistics big data. Int. J. Geogr. Inf. Sci. 2020, 34, 1089–1116. [Google Scholar] [CrossRef]
  75. Cui, X.; Shi, Y.; Ma, H.; Miao, Y. Research progress and prospects of coordinated development of the Guangdong-Hong Kong-Macao Greater Bay Area. Geogr. Geo-Inf. Sci. 2025, 41, 97–107. [Google Scholar]
  76. Kourtidou, K.; Frangopoulos, Y.; Salepaki, A.; Kourkouridis, D. Digital Inequality and Smart Inclusion: A Socio-Spatial Perspective from the Region of Xanthi, Greece. Smart Cities 2025, 8, 123. [Google Scholar] [CrossRef]
  77. Xu, N.; Zhang, X.; Wang, P. Public Vitality-Driven Optimization of Urban Public Space Networks—A Case Study from Nanjing, China. Smart Cities 2025, 8, 18. [Google Scholar] [CrossRef]
  78. Ming, Y.J.; Liu, Y.; Li, Y.P.; Yue, W.Z. Core-periphery disparity in community vitality in Chongqing, China: Nonlinear explanation based on mobile phone data and multi-scale factors. Appl. Geogr. 2024, 164, 103222. [Google Scholar] [CrossRef]
  79. Fang, X.Q.; Su, D.; Wu, Q.; Wang, J.Y.; Zhang, Y.J.; Li, G.Y.; Cao, Y. Dynamic changes in urban land spatial inequality under the core-periphery structure in urban agglomerations. J. Geogr. Sci. 2023, 33, 760–778. [Google Scholar] [CrossRef]
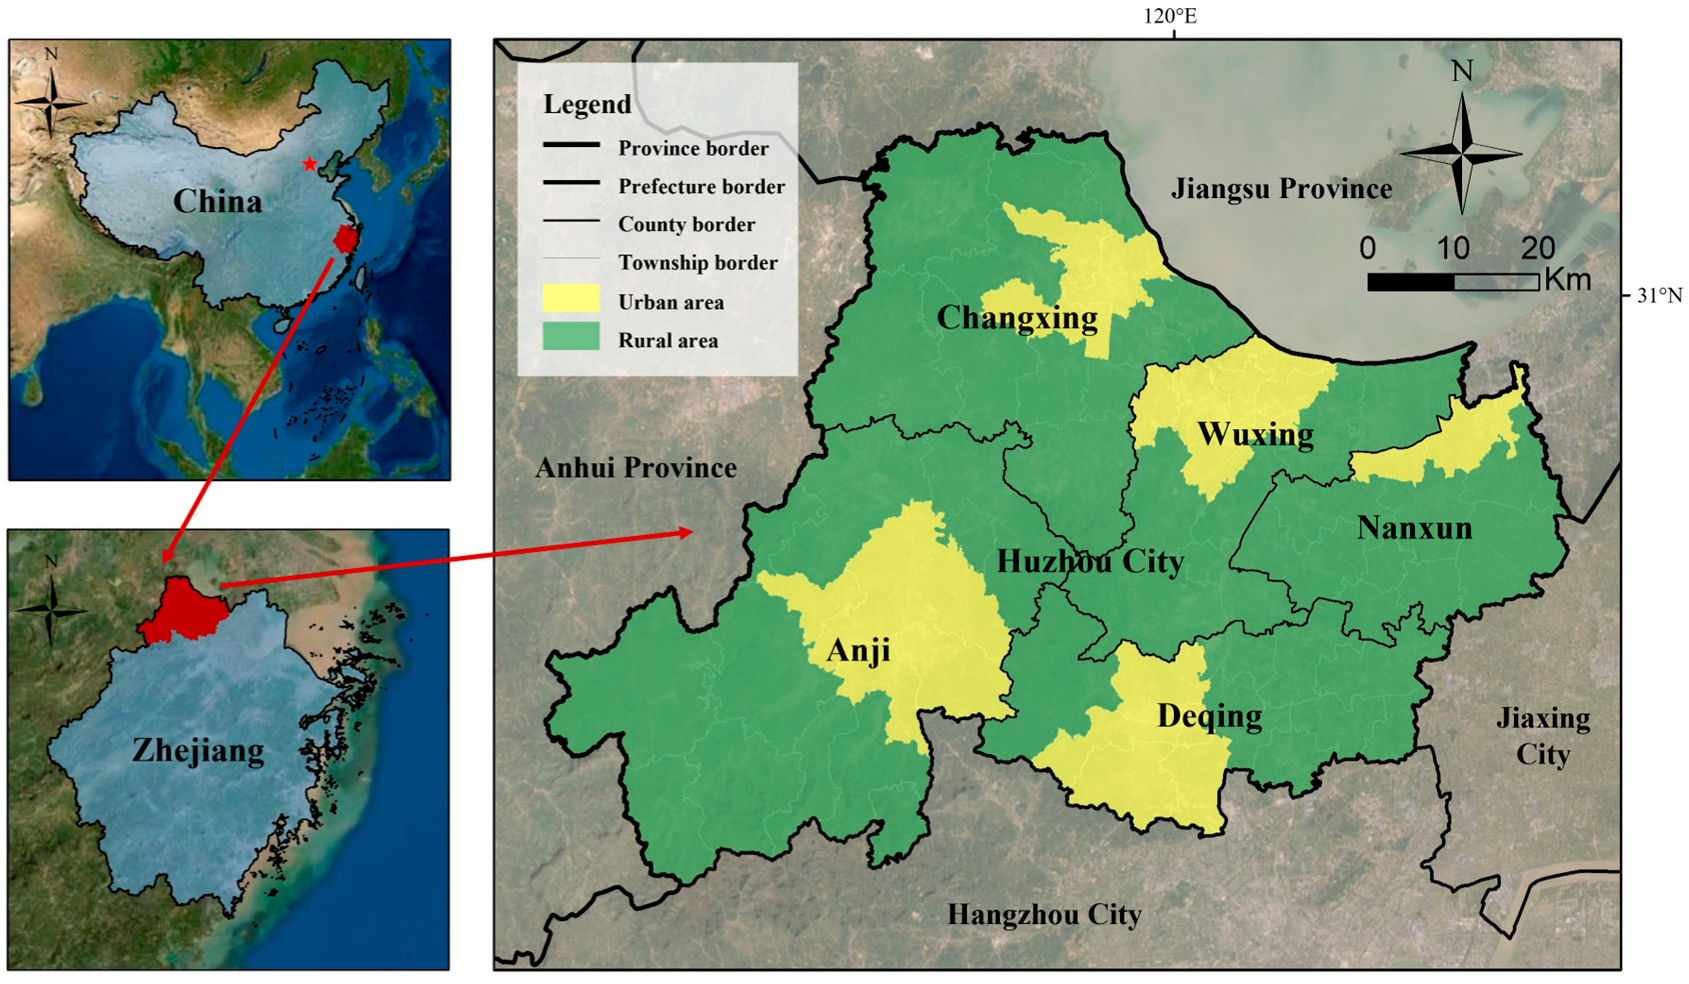
Figure 1. Geographical location of Huzhou City, Zhejiang Province, China.
Smartcities 08 00162 g001
Figure 2. Research framework.
Smartcities 08 00162 g002
Figure 3. The meaning, role, and drivers of urban–rural factor flow.
Smartcities 08 00162 g003
Figure 4. The intensity of urban–rural human, goods, and funds flows in Huzhou City.
Smartcities 08 00162 g004
Figure 5. The intensity of the urban–rural integrated flow in Huzhou City.
Smartcities 08 00162 g005
Figure 6. The intensity of the urban–rural simulated flow in Huzhou City.
Smartcities 08 00162 g006
Figure 7. The intensity of single-factor promotion and impairment in Huzhou City.
Smartcities 08 00162 g007
Figure 8. The intensity of comprehensive urban–rural promotion and impairment in Huzhou City.
Smartcities 08 00162 g008
Figure 9. Interactive influence results of single-factor flows.
Smartcities 08 00162 g009
Figure 10. Interactive influence results of the urban–rural integrated flow.
Smartcities 08 00162 g010
Table 1. Driving factors of urban–rural factor flow.
Factor CodeDriving FactorsExplanation
X1Administrative divisionsWhether township i and subdistrict j are in the same county
X2CompaniesSum of the number of firms in the area of township i and subdistrict j
X3Scenic spotsSum of the number of scenic spots in the area of township i and subdistrict j
X4Medical facilitiesSum of the number of medical facilities in the area of township i and subdistrict j
X5Transport mileageSum of road and railway mileage in the area of township i and subdistrict j
X6Educational facilitiesSum of the number of educational facilities in the area of township i and subdistrict j
X7Shopping servicesSum of the number of shopping service facilities in the area of township i and subdistrict j
X8Living servicesSum of the number of living services facilities in the area of township i and subdistrict j
X9Economic vitalitySum of the night light index in the area of township i and subdistrict j
Table 2. Level of the barriers to single-factor flows.
LevelsHuman FlowGoods FlowFunds Flow
High promotion0.41~10.27~10.37~1
Medium promotion0.13~0.410.08~0.270.13~0.37
Low promotion0~0.130~0.080~0.13
Low impairment−0.12~0−0.11~0−0.11~0
Medium impairment−0.42~−0.12−0.38~−0.11−0.37~−0.11
High impairment−1~−0.42−1~−0.38−1~−0.37
Table 3. Detected driving factors of single-factor flows.
Driving FactorHuman FlowGoods FlowFunds Flow
X10.013 ***0.0000.002 ***
X20.207 ***0.110 ***0.033 ***
X30.263 ***0.171 ***0.025 ***
X40.221 ***0.756 ***0.106 ***
X50.334 ***0.177 ***0.055 ***
X60.256 ***0.755 ***0.188 ***
X70.381 ***0.751 ***0.064 ***
X80.253 ***0.784 ***0.144 ***
X90.528 ***0.337 ***0.217 ***
Note: ***: p < 0.001, where p represents the level of significance.
Table 4. Detected driving factors of urban–rural integrated flow.
Driving FactorLevel of Impact
X10.045 ***
X20.274 ***
X30.147 ***
X40.153 ***
X50.294 ***
X60.161 ***
X70.294 ***
X80.100 ***
X90.405 ***
Note: ***: p < 0.001, where p represents the level of significance.
Disclaimer/Publisher’s Note: The statements, opinions and data contained in all publications are solely those of the individual author(s) and contributor(s) and not of MDPI and/or the editor(s). MDPI and/or the editor(s) disclaim responsibility for any injury to people or property resulting from any ideas, methods, instructions or products referred to in the content.