Highlights
What are the main findings?
- A two-stage stochastic MILP framework is proposed, integrating distributed energy resources (DERs), microgrids, and remotely controlled switches to optimize real-time operation and enhance resilience in distribution systems.
- The first stage focuses on economic day-ahead scheduling of DERs, load management, and network reconfiguration based on real-time market data. The second stage re-optimizes operations under specific disruption scenarios, leveraging DER dispatch, microgrid formation, and prioritized load shedding to maximize system resilience.
What is the implication of the main finding?
- The proposed method allows distribution system operators (DSOs) to account for uncertainties in renewable generation, market prices, and component vulnerabilities, resulting in reduced load curtailment, improved voltage stability, and faster post-event recovery during extreme weather conditions.
- This framework contributes to developing smart, climate-resilient urban infrastructure by supporting the coordinated operation of decentralized energy resources and enabling adaptive, cost-effective grid management under stress conditions.
Abstract
Climate change has emerged as a significant driver of the increasing frequency and severity of power outages. Rising global temperatures place additional stress on electrical grids that must meet substantial electricity demands, while extreme weather events such as hurricanes, floods, heatwaves, and wildfires frequently damage vulnerable electrical infrastructure. Ensuring the resilient operation of distribution systems under these conditions poses a major challenge. This paper presents a comprehensive two-stage techno-economic strategy to enhance the resilience of modern distribution systems. The approach optimizes the scheduling of distributed energy resources—including distributed generation (DG), wind turbines (WTs), battery energy storage systems (BESSs), and electric vehicle (EV) charging stations—along with the strategic placement of remotely controlled switches. Key objectives include preventing damage propagation through the isolation of affected areas, maintaining power supply via islanding, and implementing prioritized load shedding during emergencies. Since improving resilience incurs additional costs, it is essential to strike a balance between resilience and economic factors. The performance of our two-stage multi-objective mixed-integer linear programming approach, which accounts for uncertainties in vulnerability modeling based on thresholds for line damage, market prices, and renewable energy sources, was evaluated using the IEEE 33-bus test system. The results demonstrated the effectiveness of the proposed methodology, highlighting its ability to improve resilience by enhancing system robustness, enabling faster recovery, and optimizing operational costs in response to high-impact low-probability (HILP) natural events.
1. Introduction
The increasing frequency and severity of extreme weather events compared to in the past because of climate change are further emphasizing the importance of power and energy system preparedness for HILP weather events such as hurricanes, blizzards, floods, heat waves, and wildfires, which could cause major power outages [1]. The vulnerability of electrical network components such as pylons, overhead lines, and transformers to HILP events can result in severe damage to a network, unexpected power outages, cascading failures, and blackouts, leading to significant societal and economic problems [2]. The planning and operation of distribution networks are mainly optimized for normal weather conditions, so they are not prepared to handle rare extreme weather events. Although this may be economically appropriate in the short term, it can expose networks to catastrophic failures that are more costly in the long term. Additionally, increasing energy consumption and peak demands for summer heatwaves and winter extreme cold introduce operational risks by overloading network components. Therefore, a paradigm shift is required in power system study practices to protect the network against such HILP events and conditions [1]. Due to the wide geographical area of the distribution network, it is more vulnerable to natural disasters; on the other hand, it is more closely related to customers, so the resilience study of this section of power systems against large-scale disturbances caused by extreme weather events is of great importance [3]. Various resilience enhancement strategies can be categorized into short-term operation and long-term planning measures and mindful decision-making by the system planner, and the operator is necessary to prioritize them; thus, resilience study and evaluation are the basis of the implementation of enhancement measures. A number of the existing studies have concentrated on planning measures and hardening aspects, but it should be noted that an effective planning enhancement strategy in a specific HILP event may have a negative impact in another event. For example, resilience enhancement against windstorms using underground cables may cause longer restoration time in cases of floods or earthquakes. On the other hand, operational measures such as defensive islanding and microgrid formation [4,5], network reconfiguration [6,7], energy storage systems and mobile emergency resources [8,9,10], and load-based approaches [11,12] are used to restore distribution networks quickly after an HILP event. Operational resilience provides immediate solutions and enables distribution system operators (DSOs) to take effective operative actions within minutes of disruption to reduce restoration time and decrease the impact of adverse events on the network. A modern distribution network for making automated decisions needs fast sensing, immediate and predictive analytics, and real-time modeling because with an approaching HILP event (e.g., flood or hurricane), it is necessary to obtain instant information about the possible impacts of the event on the network so that accurate decisions are made on preventive/proactive measures [13]. The penetration of distributed energy resources (DERs) and the expansion of smart automation devices, such as digital protective appliances, automatic and remote control switches, and advanced metering infrastructures can modernize the grid and change the face of passive distribution systems to active distribution systems [7]. DERs can supply critical loads locally and continue power supply to local customers after an HILP weather event by microgrids (MGs). Remote control switches (RCSs) increase the restoration ability of a distribution network by network reconfiguration to reroute power flow to other sections [14], mobile emergency generators (MEGs), as flexible resources in an emergency, help the distribution system resilience enhancement with their mobility [15], and from the perspective of load, load shedding or shiftable loads are other effective approaches that can be used for resilience enhancement [2]. Generally, operation-based strategies can be categorized into preventive and corrective measures based on time. Preventive measures appropriately mitigate disruptions’ impact on the system by DERs and optimally schedule MGs to supply local demand. The proper perception of system characteristics and prediction of HILP events based on previous experiences have a substantial role in implementing such measures [16]. Corrective measures, complementarily to preventive measures, are used to restore the distribution system’s normal operation during major disruptions and guarantee a specific level of service with proper corrective actions such as prioritized load shedding which is essential in enhancing power system resiliency [17,18]. This research contributes to the advancement of ’Smart grids’ within smart cities by investigating and developing operational resilience strategies for power distribution networks against climate change-driven extreme weather. It focuses on leveraging ‘smart infrastructures’ through DER integration, real-time modeling, and network reconfiguration for proactive and reactive mitigation, ensuring continuous power supply. Ultimately, it aims to minimize disruptions and enhance smart city functionality by enhancing critical infrastructure resilience through effective preventive and corrective measures for rapid restoration and minimizing societal impacts.
1.1. Literature Review
The resilience of power distribution systems with DER integration under the increasing impact of extreme weather events has been extensively studied in recent years. Ref. [19] provides a thorough review of restoration techniques with a high penetration of renewable energy sources while controlling the uncertainty associated with renewable energy through robust optimization frameworks and stochastic analysis. In addition to vulnerability analysis and fragility curves, dynamic thermal rating and deep learning-based methods in distribution networks were carried out in [20] for distribution system resilience assessment. In [21], a comprehensive classification of fragility curves and their application in estimating the failure probability of the network components during extreme weather events are highlighted. Ref. [22] outlines quantitative resilience metrics, suggests using technologies to fortify infrastructure, and examines mobile energy storage, automated switching technologies, and microgrids as resilience enhancement strategies. The transition to holistic vulnerability assessment frameworks is highlighted in the above-mentioned works for the resilience study of active distribution networks. The comprehensive literature on distribution system resilience was reviewed in [23,24]. Microgrids (MGs), as a preliminary and fundamental part of modern distribution networks, are small-scale electrical systems connected to a distribution system at the low-voltage or medium-voltage level, integrating dispatchable and non-dispatchable DERs such as distributed generators (DGs), renewable energy sources (RESs), energy storage systems (ESSs), and flexible loads with demand response and can be operated in stand-alone or grid-connected modes. With these capabilities, MGs have shown great potential to enhance system resilience [25]. In recent years, there has been increasing attention and emphasis on unprecedented opportunities for DERs and MGs in the distribution system resilience literature. In [7], local DERs are proposed to maximize the load restoration with a two-level intentional islanding method for a reconfigurable distribution system. Ref. [26] implemented the geographical expansion of consumers with distinct priorities and the radial structure of the distribution network that made its resilience enhancement more influenced by smart technologies. Also, a defender–attacker–defender mixed-integer optimization problem comprising infrastructure reinforcement, disturbance, and reconfiguration programs, then optimal DG allocation, was used to improve the resilience of distribution systems. Ref. [27] proposes post-extreme-event restoration to evaluate the expected energy not served (EENS) and minimize the unserved loads, especially critical loads (CLs), considering reconfiguration and DER scheduling. Ref. [28] presents a dynamic programming (DP)-based resilience improvement method considering dynamic reconfiguration and islanding after fault scenario generation based on the vulnerability analysis of network components and meteorological predictions against typhoons as an extreme weather event to make a trade-off between minimizing total power not supplied and the number of switching operations over the whole event duration. In [4], the authors assess the economic impacts of natural disasters on a system with power outage evaluation by utilizing PV and BESSs as DERs and adopting the MG formation approach. In [5], a linearized mathematical programming-based MG formation method using remote control switches (RCSs) is presented to maximize the restored load in MGs. In [29], a two-stage outage management problem based on the scheduling of DERs in MGs and power transfer control in tie lines is presented to improve resilience. In [12], short-term distribution system resiliency scheduling from the economic viewpoint utilizing DERs and automatic switches is investigated to minimize operational cost and energy-not-supplied penalty costs and, on the other hand, maximize the benefits of energy resources owners. Ref. [8] presents a post-disaster recovery measure scheme for power system resiliency enhancement by mobile power sources (MPSs), network reconfiguration, and repair crew coordination. Ref. [10] proposes a two-stage recovery strategy that dispatches MPSs and multiple MG formations to maximize the critical load restoration. Ref. [30] suggests a two-stage optimization scheme utilizing MPSs for dynamic MG formation by re-routing them to minimize expected load shedding caused by HILP events with a progressive hedging (PH) algorithm. Finally, the concept of distribution network resiliency and its aspects is addressed in [31], and the authors propose a two-stage mixed-integer linear programming framework to assess active distribution system resiliency using optimal dynamic MG formation and considering ESSs, DGs, and demand-side management programs based on stochastic programming employing related uncertainties of renewable energy resources. A literature survey is presented in Table 1 and compared with the proposed method.

Table 1.
Literature review and comparison with proposed method.
As illustrated in Figure 1, the traditional and centralized hierarchical philosophy of power systems as passive networks is experiencing an unprecedented shift to a decentralized and active paradigm by integrating networked MGs and other local energy supply resources, which can provide cost reduction, resilience enhancement, and security improvement benefits. In this regard, and considering all the above-mentioned papers, there is a necessity to propose a comprehensive framework for the resilience enhancement of the modern distribution system involving economic and technical aspects, active distribution system technologies, and HILP weather event conditions that this paper deals with.
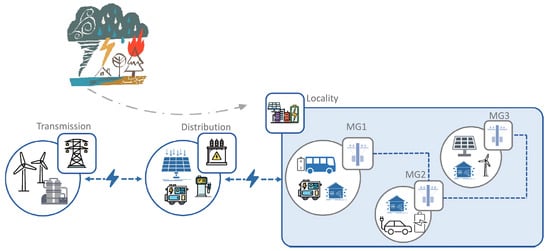
Figure 1.
Modern distribution system resilience study.
1.2. Contribution
There is a gap in the literature regarding an efficient framework to consider proactive and corrective operational resiliency enhancement measures simultaneously with optimizing operating costs; also, most previous resiliency studies use simple resiliency metrics for evaluations of weather-oriented HILP events and distribution networks. Uncertainties that cannot be predicted accurately or controlled by the operator include two major types: the first is typical operational uncertainties in RES generation, load demand, and real-time market price caused by forecast errors, and the second is contingency-based uncertainties related to power outages and fault clearing time. These uncertainties result in serious challenges to a distribution network because it should satisfy variable demand with intermittent local resources for an unknown duration. MGs aim to supply consumers for as long as possible through the optimal scheduling of local resources after the unscheduled islanding of the distribution system caused by a major contingency like an HILP weather event. This paper proposes a comprehensive two-stage stochastic mixed-integer linear programming (MILP) framework to investigate network behavior in undesirable HILP weather conditions and demonstrates how the optimal utilization of ESSs and electric vehicle parking lots (EVPs) along with renewable and dispatchable DERs, RCSs, and prioritized flexible loads can improve the economic operation and resilience enhancement of distribution networks. The proposed method assumes that all DER units are not owned by the network; thus, they will participate in the scheduling based on real-time market information, particularly in islanding mode. In addition, to make the assessments comparable in various operating conditions, proposed resilience metrics are normalized and can generally be used for different HILP events, just with minor revisions. The key contributions of this paper can be summarized as follows:
- Utilizing the maximum generation potential of renewable and dispatchable DERs involving independent power producers through topology change.
- Proposing a general vulnerability model for network components and considering a priority for load shedding after an extreme weather event.
- Proposing a general model and metrics that can be used for various types of natural disasters.
The specific contributions of our two-stage framework in detail are as follows:
- 1.
- Stage 1 (Economic Scheduling):
- The day-ahead scheduling of DERs, network reconfiguration with remotely controlled switches, and energy exchange with an upstream network based on real-time market price.
- Objective: Minimizing operational costs under normal conditions, considering uncertainties.
- 2.
- Stage 2 (Resilience Enhancement):
- Re-optimizes system operation under HILP event scenarios, considering actual disruptions (e.g., damaged lines, outages).
- Objective: maximizing resilience with network reconfiguration to minimize load curtailment and accelerate recovery, including DER redispatch, microgrid formation, and load prioritization.
The remainder of this paper is organized as follows: Section 2 describes the methodology of the proposed resilience assessment framework, including metrics, the techno-economic objective function, and the two-stage stochastic optimization model, in detail. Section 3 presents numerical simulations consisting of assumptions, the uncertainty modeling of extreme weather events, various scenarios generated employing the Monte Carlo simulation approach, case studies for modern distribution system resilience enhancement, and a discussion of numerical results. Finally, Section 4 provides the Conclusions.
2. Resilience Assessment Framework
2.1. Quantification of Resilience Concept
The resilience concept is introduced to examine the survivability of the power system under catastrophe and evaluate the effectiveness of countermeasures. Increasing HILP event-related power outages in recent years have driven many organizations to realize the necessity of power system resilience against such events. The US Federal Energy Regulatory Commission (FERC) [50] defines resilience as ‘the ability to withstand and reduce the magnitude and/or duration of disruptive events, which includes the capability to anticipate, absorb, adapt to, and/or rapidly recover from such an event’. Also, the C4.47 CIGRE working group add other dimensions to the resilience definition such as anticipation, preparation, absorption, the sustainment of critically operated systems, swift recovery, adaptation, and the implementation of the learned lessons from previous events [51]. The National Infrastructure Advisory Council (NIAC) [52] collects robustness, resourcefulness, rapidity, and adaptability as four attributes of a resilient system. Obviously, proper metrics and modeling approaches as key elements of this study must be correctly developed and adopted to represent the various dimensions of resilience for the quantitative assessment of power system resilience against HILP events [53]. System performance is defined as the temporal variation in a system characteristic in the context of an extreme event. It can be represented by technical metrics or various load-based indices that the operator can prioritize based on the operational strategies and objectives. Following an event, as illustrated in Figure 2, the parameter R is considered the system performance metric; thus, the system experiences states including the resilient pre-event state , event progress , the degraded post-event state , the recovery state , the post-recovery state , and infrastructure recovery . As the recovery state starts at , the system operator schedules resources and forms multiple MGs. To assess the level of network resilience, a resilience objective function is first developed considering the key characteristics underlined through standard resilience definitions.
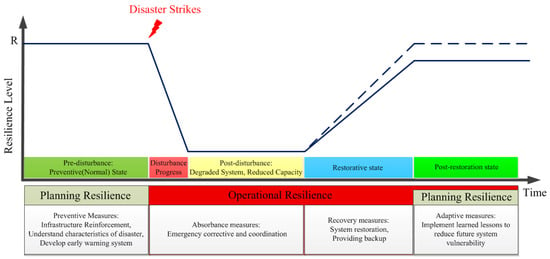
Figure 2.
System performance curve and resilience level transition.
The timely awareness capability of the modern distribution system related to an approaching HILP event is a vital parameter in the immediate implementation of preventive or corrective measures, so it can be introduced as the first resilience assessment metric. In the degradation state, in which the system performance is downgraded, corrective and restorative operation measures help to recover the vulnerability level of the network; thus, the ability of the network to withstand the HILP event can be evaluated with the normalized degradation index (DI), which provides a quick perception of the encountered event impact on system performance at a glance and has an amount equal to 0 or 1 for a fully resistant system or a weak system with a complete loss of functionality, respectively. It is proposed as
Restoration measures are executed after the system enters the degradation state to recover it immediately to an acceptable level of performance using backup generation and storage systems, etc. The restoration index (RI) is proposed as a normalized metric to evaluate the efficiency of the system restoration and indicate the speed of the recovery after the event occurrence and is 1 or 0 for a network with a full restoration capacity or a failed-to-recover network, respectively.
Additionally, the lost load (LL) and voltage deviation (VD) indices are technical network assessment metrics that are considered in the proposed resilience-based objective function and are equal to 0 for a sufficiently resilient network. They are presented in (3) and (4), respectively.
The complete restoration of the network depends on infrastructure recovery according to the severity of the HILP event and the repair crew’s availability. However, similar metrics can be defined to assess infrastructure recovery, but these are out of our study framework. A sensitivity analysis was performed by varying the weights of the resilience metrics in the following configurations:
In Table 2 case A, the RI was prioritized, which meant that restoration actions were more aggressive, with faster load recovery but slightly higher cost. In case B, LL was prioritized, and load curtailment was minimized at the expense of voltage deviations and delayed restoration. In case C, VD was prioritized, and voltage regulation was improved, especially during islanded operation, but other values increased slightly. It is worth mentioning that across all cases, the resilience objective value changed by less than , and cost deviations remained below , confirming the robustness of the model.

Table 2.
A sensitivity analysis of resilience objective function metric weightings.
2.2. The Mathematical Formulation of the Problem
One of the major challenges in resilience studies is increasing costs with resilience enhancement against weather-related HILP events, so the main purpose of the proposed framework is acquiring a techno-economic trade-off and optimizing operation costs along with previously discussed resilience indices. Also, the proposed method considers real-time market price, renewable DER generation, and event occurrence time and duration uncertainties. A two-stage stochastic programming problem was developed. The first stage models the optimal scheduling of a resilient distribution network while the second stage represents the real-time operation of the network under extreme weather events. In the first stage, as a normal operation state, the DSO should obtain optimal power exchange between the distribution network and the main upstream grid based on the day-ahead market characteristics. Real-time operation costs depend on different stochastic parameters that should be generated based on the uncertainty of various scenarios. Then, in the second stage for HILP event occurrence conditions, the network must be disconnected from the main grid to prevent global collapse, i.e., the DSO implements the islanding mode for resilient network operation and local independent and network-owned resources must supply prioritized loads. In this regard, DERs power generation, the ownership status of DGs, load demand, demand-side reserves, and power transfer with the upstream main grid are decision variables of the first stage. Decision variables of the second stage can be generally categorized into three groups: (a) the real-time generation of DERs and the status of reserves are the first ones which are named pre-scheduled variables; (b) another group are network-related variables that express the islanding mode of the distribution network and real-time operation of MGs; (c) the third group consists of auxiliary variables that link two previous groups of variables. The main purpose of network operation is to supply the demand while satisfying technical constraints and pursuing an economic objective (e.g., supply cost minimization) as below:
Cost minimization () and resilience enhancement () are two major opposite objective functions that ought to be optimized simultaneously and are shown in (6) and (7), respectively.
Normalized metrics, consisting of timely awareness capability, the degradation index, the restoration index, voltage deviation, and the lost load index, quantify the system resilience level during and after HILP events as follows:
In (8), () is the optimal value of () when () is ignored. and are weight coefficients that balance the importance of the economic and resilience metrics, respectively. This multi-objective optimization, along with the vulnerability modeling and fragility curves, bring a more accurate resilience assessment, enabling a better understanding of the system status under HILP events.
In this problem, cost has two subcategories including normal operation (9) and critical event condition (10) costs. The first one consists of power exchange contracts with the upstream network and net revenue of energy selling, and the second one consists of power exchange contracts with the main grid, load shedding and a reserve deployment, and the operation cost of DGs with different ownership. On the other hand, the resiliency enhancement objective function refers to timely awareness capability and withstanding and restoration ability, along with lost load and voltage deviation, which are considered technical features.
This problem should be solved with three categories of constraints related to normal operation, critical conditions of HILP event occurrence, and linking constraints between them. Power balance in each period, power exchange limitation with the main grid, characteristics of DERs, load demand, and reserve status are normal operation constraints. Accordingly, in normal operation, the connectivity state of the distribution network to the upstream network is indicated by a binary variable, load shedding must not exceed the total load, and a confidence interval upper/lower for wind generation forecasts is considered. Limitations and the state of charge (SOC) of BESSs and EVPs are taken into account in each period of time. The simultaneous charging and discharging of the storage units are not allowed and for increasing computation speed, the constraints on EV battery charging/discharging in parking lots are linearized. The constraints related to the second stage of the proposed problem are MGs operating constraints such as power balance and AC power flow, voltage magnitude upper/lower limits, the generation limits of DERs, line limits, load shedding range, and power exchange limits upstream. An auxiliary parameter indicates the status of connectivity at PCC that is 1 for connecting; otherwise, it is 0. With AC power flow, the resilient operation of the MG in critical conditions is guaranteed. Also, power injection in two directions and the thermal limitation of lines are considered. In addition, a binary parameter is defined to represent the islanding mode. The real-time scheduling of EVPs and BESSs is similar to normal operation except that their participation depends on the designed scenarios and they have a high potential to reduce load curtailments and enhance resilience since they can be employed as redundant resources to improve the restoration. The last group of constraints are those that relate the first-stage to the second-stage constraints and represent the impact of real-time scenarios on operation scheduling [54].
It should be noted the ZIP model is used for load modeling in the proposed resilience-oriented framework [55].
2.2.1. Components Vulnerability
Regardless of the event type, when an HILP weather event occurs, component damage scenarios should be extracted. The nature and intensity of the incident, geographical location, and the type and age of the components are specification factors of damage level. The fragility curves (FCs) are an essential part of the distribution network resilience assessments and, conceptually, are functions that describe the vulnerability of network assets and their failure probability over the full range of catastrophes to which a system might be exposed because extreme weather events may affect the network in several ways throughout the same event e.g., high windstorms combined with flooding or falling trees. In this regard, to identify the impact of vulnerability on resilience evaluation during HILP events, the vulnerability threshold method is used to extract the damage scenarios based on the failure probability of distribution overhead lines. The distribution network consists of components such as poles, conductors, transformers, etc., but the poles and conductors are the most vulnerable elements in HILP weather events. Therefore, in practice, an overhead line is considered out of service when the failure probability is over the predetermined threshold value. A generic fragility curve provided by the fragility function is illustrated in Figure 3. The failure probability of components for fragility analysis is derived mainly from fragility curves or random-based outage approaches. A typical fragility function through analytical processes is proposed by the Federal Emergency Management Agency (FEMA) [56], as follows in (12):
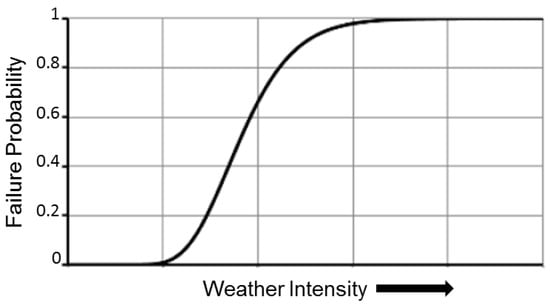
Figure 3.
A typical fragility curve illustrating the failure probability of a component as a function of the weather intensity.
Suppose that the function is simplified to the probability of failure (). In that case, it can be denoted that the resultant cumulative probability distribution function follows a typical sigmoid function illustrated in (13) and is known as the fragility curve of system components. This model is usually applicable within the probability range of critical condition () and component failure (). Outside this range, the for W < can be regarded as either zero (0) or set to a very low number, whereas for W > , = 1.
where and are the probability of failure and the spectral acceleration median value at which the component reaches the threshold of the damage state, ds; and are the standard values; is the probability of failure at the weather intensity w; and A and B are constant distribution parameters [57]. The failure of a line occurs due to either a tower collapse or wire breakage and is computed through Equation (14). Hence, if the cascading failure is neglected, the probability of the failure of the ij line at each time t is the following:
where and are the probability of failure of the ijth corridor because of the pole and wire breakdown, respectively. Moreover, and T stand for the set of lines in the under-investigation test system and the period of the simulation, respectively. The probability that a line fails because of a pylon breakage is given by (15) if all poles are exposed to the same conditions, and therefore, the same fragility curve suffices to model the vulnerability.
By utilizing the equations above, a threshold value needs to be set to obtain the vulnerable lines. Establishing the value of this threshold is certainly a trade-off between a conservative scenario with a low value causing a large number of affected lines and large values leading to a lower number of damaged lines.
2.2.2. Load Priority
Distribution network resilience demonstrates the supply and recovery capability of the critical loads. Loads in the network, according to their priorities, can be classified into several levels and graded by coefficients. The importance and priority of loads are determined based on various factors such as strategy, security, and social role, the type of consumer, and interrupted load economic impact. Therefore, hospitals, fire stations, water pumping, etc., as critical facilities, have high priority. Moreover, depending on network operation policies, residential, industrial, and commercial customers may be categorized as second and third priorities.
2.2.3. An Overview of the Proposed Resilience-Oriented Framework
The framework of the proposed resiliency-oriented scheduling method is illustrated in Figure 4. At the beginning, previously discussed uncertainties such as stochastic processes are modeled and a set of scenarios depicting potential outcomes during the 24 h network scheduling timeframe is generated. Then, in order to make the stochastic linear programming (SLP) problem, tractable scenarios are reduced using the k-means clustering method. Finally, solving the proposed model enables the DSO to optimally schedule DERs, demand-side reserves, and power transactions with the main grid while ensuring the resiliency of the network.
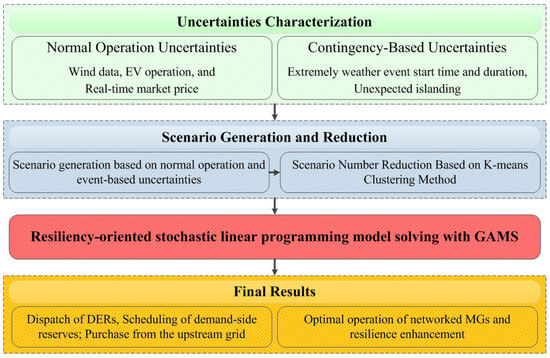
Figure 4.
Framework for resiliency-oriented distribution system scheduling.
3. Numerical Simulations
3.1. Assumptions and Case Studies
The modified IEEE 33-bus test system which involves a set of DERs including DGs and WTs, BESSs, and EVPs that are allocated optimally was selected to examine the effectiveness of the presented resilience enhancement method [14]. Also, this system contains three remote control tie switches that enable the DSO to implement reconfiguration operations and the MG islanding mode. The related single-line diagram of the test system is illustrated in Figure 5.
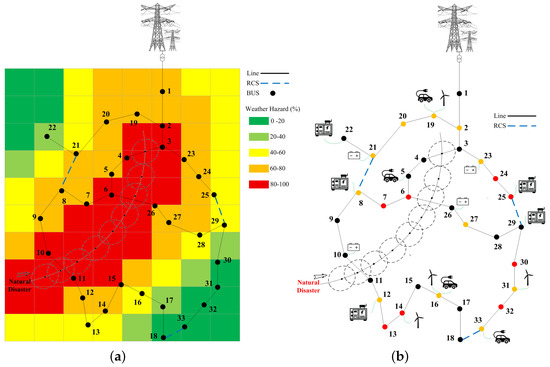
Figure 5.
Single-line diagram of simulated distribution system. (a) HILP weather event path and network vulnerability. (b) Optimal DER placement.
The model could be developed to consider the impact of multiple simultaneous weather conditions (e.g., wind and rain). Therefore, a multidimensional fragility curve is required to map the magnitude of the relevant weather parameters (for instance, wind speed and rain intensity) onto the failure probability of the components.
Table 3 and Table 4 show the associated data and technical characteristics of the installed conventional DGs and BESSs, respectively. The charge/discharge efficiency of the BESSs was assumed to be 0.9. The deterministic and stochastic parameters of the parking lots are shown in Table 5 and Table 6, respectively. The stochastic parameters of EVPs were obtained from their associated Truncated Gaussian probability distribution (TGD) function [55].

Table 3.
Technical characteristics of installed DGs.

Table 4.
Technical characteristics of installed BESSs.

Table 5.
Technical characteristics of installed EVPs.

Table 6.
Stochastic parameters of EVPs.
Four wind turbines (WTs) were installed optimally at buses 14, 16, 19, and 31 with a total capacity of 4 MW according to [23]. Figure 6 illustrates that the WTs’ variable power generation was a function of random wind speed. Since the distribution network had a small geographical area, the same wind speed could be applied to all WTs.
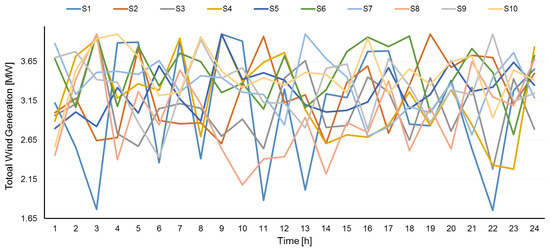
Figure 6.
Total wind generation in simulated scenarios.
Statistical analysis of data from ISO New England [58] was conducted to consider a realistic load profile and energy price; therefore, the corresponding load demand profile in Figure 7 and the real-time market price for different scenarios in Figure 8 are illustrated.
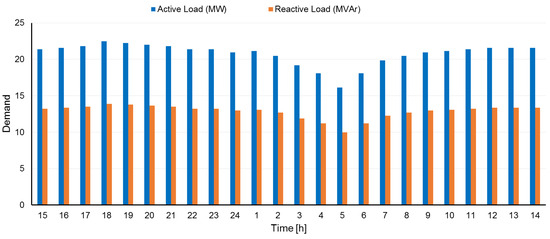
Figure 7.
Total load demand.
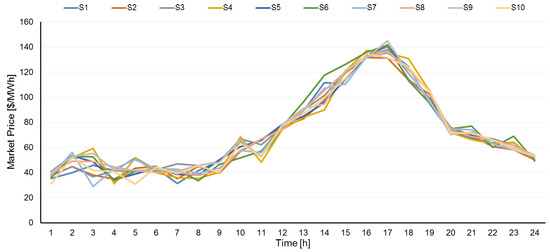
Figure 8.
Real-time market price.
Table 7 represents the start and duration of the weather-related HILP event, which was obtained from statistical analysis of weather forecasts. They can be used as stochastic parameters of network islanding by a DSO and help to approximately predict islanding start and duration [3].

Table 7.
Probability distribution of islanding parameters.
To achieve an optimal hourly solution in day-ahead market participation, the operator considers the wholesale market information in grid-connected operation with the upstream network for 24 h scheduling. One-hour time steps are sufficient for the optimization of the islanded operation, although smaller time steps can bring more details. Based on EVP availability, the start hour of the scheduling horizon is assumed to be 15:00. Choosing 19:00 to 7:00 as after-working hours is a reasonable consideration for a residential charging pattern and this charging period can provide efficient load shifting.
Based on Table 8, following the HILP event, we assume that lines 3–4, 6–26, and 10–11 for the %20 vulnerability threshold [42] are out of service, and line limits have been decreased. In this condition, the DSO tries to minimize load curtailment by prioritized load shedding, DERs, BESSs, and EVPs management, and reconfiguration. In this study, as illustrated in Table 9 to represent the impact of load priorities in distribution network resilience assessment weight coefficients are assigned to each load level of buses. On the other hand, when a line is overloaded, inevitably, load shedding must be performed by the network operator to keep supplying critical loads as much as possible.

Table 8.
Number of damaged lines for different thresholds in IEEE 33-bus test system.

Table 9.
Test system load priority.
The Monte Carlo simulation (MCS) process can be applied to generate scenarios related to HILP events, each involving the following:
- Time of occurrence.
- Intensity level.
- Duration.
Each scenario consists of a unique combination of these variables, sampled from empirical or assumed distributions based on historical event data (e.g., hurricane databases, flood profiles). In the proposed framework, uncertainties are modeled based on the stochastic method, and 100 scenarios are created in the first step; subsequently, scenario reduction to 10 is implemented using the K-means clustering method [59]. The proposed framework achieves a balance between model accuracy and computational efficiency by utilizing Monte Carlo simulation for stochastic scenario generation and then employing k-means clustering generated scenarios which are reduced while preserving statistical characteristics. This two-step process significantly improves the tractability and scalability of the stochastic MILP model; thus, the model remains computationally feasible for real-time or day-ahead scheduling applications, while still accurately capturing uncertainties. It is worth mentioning that the implementation of probability distributions, and then the generation and reduction of the scenarios, are executed in MATLAB. In order for the modernization of the distribution network to be comparable in resilience enhancement, two cases are implemented based on the ownership of DERs and considering the previously mentioned capabilities. First, independent DERs do not share their power in the market, and second, independent DERs participate in the market according to real-time information for resilience improvement. Finally, it is worth mentioning CPLEX solver of GAMS software is used to solve the proposed SLP model to find the global optimum operating point.
3.2. Numerical Results and Discussion
In order to evaluate the effectiveness of the introduced framework and SLP method for modern distribution network resiliency enhancement, two case studies are considered:
- Case I: the optimal resiliency-economic scheduling of the islanded network for an approaching HILP weather event, when independent DERs do not participate during the scheduling horizon.
- Case II: the optimal resiliency-economic scheduling of the islanded network for an approaching HILP weather event considering load prioritizing, when all resources participate during the scheduling horizon.
In the proposed model, DERs participate in day-ahead and real-time scheduling by submitting generation/consumption bids in response to market prices. Independent DER participation is modeled via market-responsive dispatch, subject to profitability and technical limits. The scheduling respects DERs’ economic incentives without assuming full utility control. As the proposed resiliency evaluation and enhancement problem consists of two contradictory objective functions from resiliency and economic perspectives, all the non-dominant sets of solutions can be represented by a Pareto front assigning various values to W1 and W2 that reflect different trade-offs between cost and resilience; then, a classification of them based on the operation priorities of the system operator is required to determine the final best solution. In this paper, after creating the Pareto front, as in Figure 9, the optimum compromise solution was selected to analyze the results and assess the proposed method. The decision maker can choose the preferred most appropriate compromise solution by considering certain limits on the objective functions.
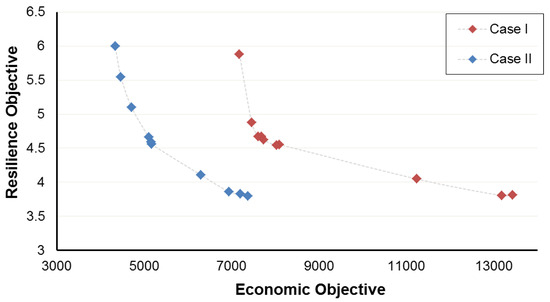
Figure 9.
Pareto front of resilience–economic objective functions.
Following the extreme weather event, we assumed lines 3–4, 6–26, and 10–11 were disconnected based on the %20 vulnerability threshold; then, the network switched to islanding mode, and consequently, the limits of some lines decreased. Figure 10 and Figure 11 illustrate the incurred load-shedding cost after the event and the total revenue earned by the network operator, respectively. Slight reducing revenue in case II was the cost of network resiliency improvement that was spent to buy energy, but by the proposed resiliency improvement strategy, the load-shedding cost was notably decreased.
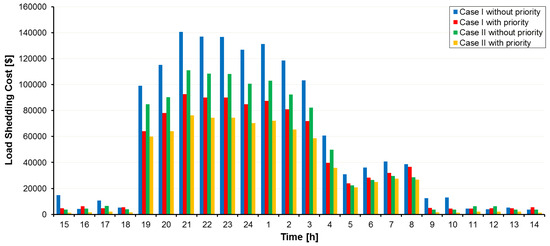
Figure 10.
The hourly lost load cost of the network in the operation scheduling horizon.
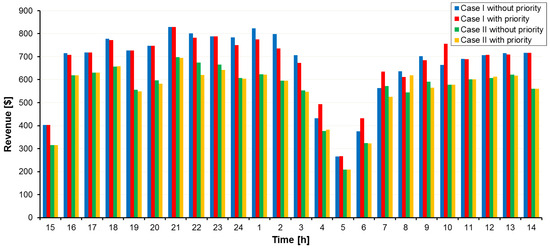
Figure 11.
The hourly revenue of the network in the operation scheduling horizon.
A comparison between the net revenue and lost load cost for case studies shows that the net revenue of the DSO descended by %21 during the scheduling horizon because of purchasing energy from independent DERs, but the lost load cost decreased significantly by approximately %45, especially when the HILP event occurrence was predicted, i.e., 19.00 to 8.00. This means that the DSO achieved a resiliency improvement by spending less. Following an HILP event, the power output of resources and load curtailment are affected because damaged parts of the network are separated to prevent blackouts. Although this condition can lead to line limit reduction and power transmission limits, loads can be supplied as much as possible according to priority levels with reconfiguration using remote control switches and local DERs; therefore, the availability of independent units in the second case leads to more flexibility of network than in case I. During HILP weather events due to power transfer limits of lines, the power generation of units decreases. The injected power of the network during the 24 h scheduling horizon is shown in Figure 12. The reason for the status improvement in case II compared to case I is that all generation units are participating and the network is almost independent from transmission line limits to supply loads. On the other hand, storage utilities performance optimization reduces operation costs along with improving resilience. BESS and EVP units tend to charge at low energy prices and discharge at high prices. So, resilience-oriented distribution system scheduling can greatly enhance resiliency by harnessing the capabilities of BESS and EVP participation by spending less money.
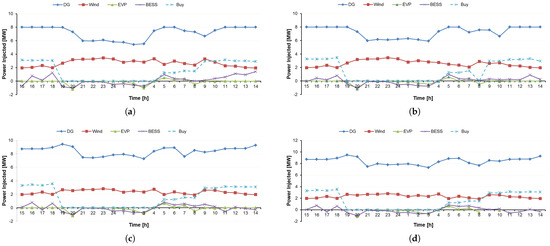
Figure 12.
Injected power to the network in each case study: (a) Case I without priority. (b) Case I with priority. (c) Case II without priority. (d) Case II with priority.
Four suggested metrics of the distribution system resiliency evaluation were obtained and compared, as shown in Figure 13. As an example, the efficiency curve for one of the scenarios in the Pareto optimal front from the viewpoint of resilience analysis is illustrated in Figure 14.
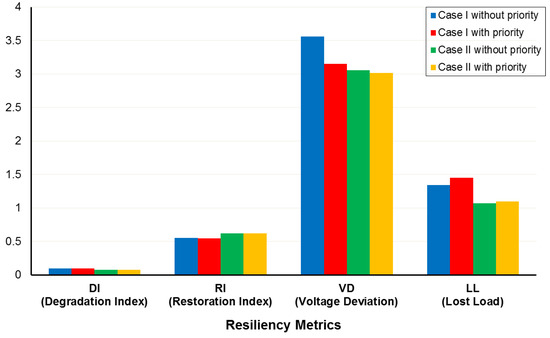
Figure 13.
A comparison of the resiliency metrics in different conditions.
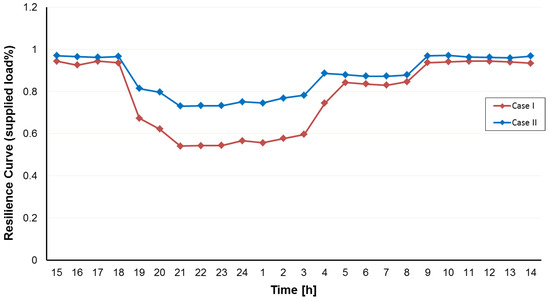
Figure 14.
Network performance curve.
It should be noted when the distribution network is connected to the main grid, due to energy purchasing from DERs at a lower cost than from the upstream network, the operation costs reduced in case II compared to case I. The operation cost of the network without resiliency improvement is USD 5764 and USD 4376.3 for case I and case II, respectively. As depicted in Figure 15, the proposed resiliency-oriented approach optimizes cost and resiliency in all case studies and it is obvious that considering resilience objective function in the scheduling leads to a rise in operation costs. Results show that operation costs increase in case I and case II with and without considering load priority equal to USD 5832, USD 2176.4, USD 4804.7, and USD 2175.5, respectively, but the resiliency of the distribution network enhances significantly against HILP weather events, specifically those damaging overhead lines, like hurricanes.
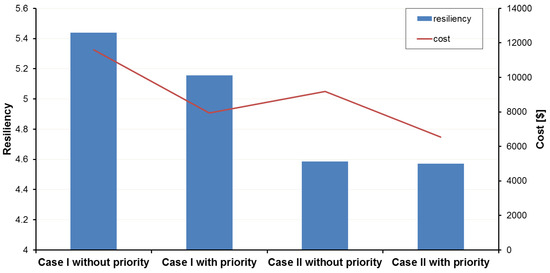
Figure 15.
An overview of the resilience and operation cost analysis.
In an overview, the results of the proposed resilience–economic SLP model are represented in Table 10 and can be summarized as follows:

Table 10.
Resiliency metric evaluation for the proposed method.
- Case II with priority has the lowest load loss and restoration time, representing the effective combination of DER and optimal switch operation; in contrast, scenario case I, which lacks proactive scheduling, results in the maximum resilience degradation.
- The solutions of the Pareto front offer the best trade-off between cost and resilience gain based on the DSO priorities in operating the network.
- The scheduling of different ownerships of DERs reduces restoration delays compared to the base case.
- Prioritized load restoration is successfully implemented
4. Conclusions
In this paper, a novel two-stage resilience–economic operation scheduling of a modern distribution system consisting of various types of DERs and remote control switches with load priority and vulnerability modeling of line damage is presented to enhance the resilience of the network against climate change-induced HILP weather events. The vulnerable lines are identified based on the weather-dependent failure probabilities acquired from the fragility curves. The key capability of the discussed method is achieving a compromise from economic and resilience perspectives in the distribution network operation scheduling. The efficacy of the suggested approach is analyzed with the modified IEEE 33-bus system and case studies that indicate the impacts of different ownerships of DERs, load prioritizing, and reconfiguration in resilience enhancement. The results show that including the resilience function in the network operation scheduling leads to an increase in operating costs but the load-shedding cost is significantly decreased and the resilience of the network against HILP weather events is enhanced. The operation cost increases by 37%, and revenue decreases by 21%; in contrast, load-shedding cost decreases by almost 45% using load priority, and resiliency improves more than fourfold utilizing the proposed resiliency-oriented approach. The simulation results clearly validate that the proposed two-stage stochastic framework improves resilience via reduced load shedding and faster recovery by using the combination of DERs and RCSs that empower both proactive and corrective resilience although offer a justifiable increment in costs that depends on DSO operation priorities. The integrated approach enables the DSO to manage climate risks while balancing resilience and cost within real-world operational constraints and strategic clarity. Also, it provides the transformation of passive distribution systems into active and adaptive networks that are capable of operating autonomously and recovering quickly from climate-induced extreme events.
Author Contributions
Conceptualization, H.S. and A.Y.; Methodology, K.M. and A.Y.; Software, K.M. and A.Y.; Validation, H.S., A.Y. and P.S.; Formal analysis, K.M.; Investigation, K.M. and A.Y.; Writing—original draft, K.M. and A.Y.; Writing—review and editing, H.S., A.Y. and P.S.; Visualization, K.M.; Supervision, H.S., A.Y. and P.S.; Project administration, H.S.; Funding acquisition, P.S. All authors have read and agreed to the published version of the manuscript.
Funding
This research received no external funding.
Informed Consent Statement
Informed consent was obtained from all subjects involved in this study.
Data Availability Statement
The dataset is available on request from the authors.
Acknowledgments
The work of Pierluigi Siano was supported in part by the Ministry of Research, Innovation and Digitalization under Project PNRR-C9-I8-760090/23.05.2023 CF30/14.11.2022.
Conflicts of Interest
The authors declare no conflicts of interest.
References
- Daeli, A.; Mohagheghi, S. Power Grid Infrastructural Resilience against Extreme Events. Energies 2022, 16, 64. [Google Scholar] [CrossRef]
- Wang, C.; Ju, P.; Wu, F.; Pan, X.; Wang, Z. A systematic review on power system resilience from the perspective of generation, network, and load. Renew. Sustain. Energy Rev. 2022, 167, 112567. [Google Scholar] [CrossRef]
- Younesi, A.; Shayeghi, H.; Siano, P.; Safari, A. A multi-objective resilience-economic stochastic scheduling method for microgrid. Int. J. Electr. Power Energy Syst. 2021, 131, 106974. [Google Scholar] [CrossRef]
- Galvan, E.; Mandal, P.; Sang, Y. Networked microgrids with roof-top solar PV and battery energy storage to improve distribution grids resilience to natural disasters. Int. J. Electr. Power Energy Syst. 2020, 123, 106239. [Google Scholar] [CrossRef]
- Zhu, J.; Yuan, Y.; Wang, W. An exact microgrid formation model for load restoration in resilient distribution system. Int. J. Electr. Power Energy Syst. 2020, 116, 105568. [Google Scholar] [CrossRef]
- Zare-Bahramabadi, M.; Abbaspour, A.; Fotuhi-Firuzabad, M.; Moeini-Aghtaie, M. Resilience-based framework for switch placement problem in power distribution systems. IET Gener. Transm. Distrib. 2018, 12, 1223–1230. [Google Scholar] [CrossRef]
- Oboudi, M.H.; Mohammadi, M.; Rastegar, M. Resilience-oriented intentional islanding of reconfigurable distribution power systems. J. Mod. Power Syst. Clean Energy 2019, 7, 741–752. [Google Scholar] [CrossRef]
- Lei, S.; Chen, C.; Li, Y.; Hou, Y. Resilient Disaster Recovery Logistics of Distribution Systems: Co-Optimize Service Restoration With Repair Crew and Mobile Power Source Dispatch. IEEE Trans. Smart Grid 2019, 10, 6187–6202. [Google Scholar] [CrossRef]
- Wang, Y.; Rousis, A.O.; Strbac, G. Resilience-driven optimal sizing and pre-positioning of mobile energy storage systems in decentralized networked microgrids. Appl. Energy 2022, 305, 117921. [Google Scholar] [CrossRef]
- Sedgh, S.A.; Doostizadeh, M.; Aminifar, F.; Shahidehpour, M. Resilient-enhancing critical load restoration using mobile power sources with incomplete information. Sustain. Energy Grids Netw. 2021, 26, 100418. [Google Scholar] [CrossRef]
- Amraee, T.; Saberi, H. Controlled islanding using transmission switching and load shedding for enhancing power grid resilience. Int. J. Electr. Power Energy Syst. 2017, 91, 135–143. [Google Scholar] [CrossRef]
- Ashrafi, R.; Amirahmadi, M.; Tolou-Askari, M.; Ghods, V. Multi-objective resilience enhancement program in smart grids during extreme weather conditions. Int. J. Electr. Power Energy Syst. 2021, 129, 106824. [Google Scholar] [CrossRef]
- Vugrin, E.; Castillo, A.; Silva-Monroy, C. Resilience Metrics for the Electric Power System: A Performance-Based Approach; Sandia National Lab.: Albuquerque, NM, USA, 2017. [Google Scholar] [CrossRef]
- Amirioun, M.; Aminifar, F.; Lesani, H.; Shahidehpour, M. Metrics and quantitative framework for assessing microgrid resilience against windstorms. Int. J. Electr. Power Energy Syst. 2019, 104, 716–723. [Google Scholar] [CrossRef]
- Bhusal, N.; Abdelmalak, M.; Kamruzzaman, M.; Benidris, M. Power System Resilience: Current Practices, Challenges, and Future Directions. IEEE Access 2020, 8, 18064–18086. [Google Scholar] [CrossRef]
- Mohammadian, M.; Aminifar, F.; Amjady, N.; Shahidehpour, M. Data-Driven Classifier for Extreme Outage Prediction Based on Bayes Decision Theory. IEEE Trans. Power Syst. 2021, 36, 4906–4914. [Google Scholar] [CrossRef]
- Sedzro, K.S.A.; Shi, X.; Lamadrid, A.J.; Zuluaga, L.F. A Heuristic Approach to the Post-Disturbance and Stochastic Pre-Disturbance Microgrid Formation Problem. IEEE Trans. Smart Grid 2019, 10, 5574–5586. [Google Scholar] [CrossRef]
- Li, Z.; Shahidehpour, M.; Aminifar, F.; Alabdulwahab, A.; Al-Turki, Y. Networked Microgrids for Enhancing the Power System Resilience. Proc. IEEE 2017, 105, 1289–1310. [Google Scholar] [CrossRef]
- Liang, K.; Wang, H.; Pozo, D.; Terzija, V. Power system restoration with large renewable Penetration: State-of-the-Art and future trends. Int. J. Electr. Power Energy Syst. 2024, 155, 109494. [Google Scholar] [CrossRef]
- Yang, L.; Teh, J. Review on vulnerability analysis of power distribution network. Electr. Power Syst. Res. 2023, 224, 109741. [Google Scholar] [CrossRef]
- Serrano-Fontova, A.; Li, H.; Liao, Z.; Jamieson, M.R.; Serrano, R.; Parisio, A.; Panteli, M. A comprehensive review and comparison of the fragility curves used for resilience assessments in power systems. IEEE Access 2023, 11, 108050–108067. [Google Scholar] [CrossRef]
- Dwivedi, D.; Mitikiri, S.B.; Babu, K.V.S.M.; Yemula, P.K.; Srinivas, V.L.; Chakraborty, P.; Pal, M. Technological advancements and innovations in enhancing resilience of electrical distribution systems. Int. J. Crit. Infrastruct. Prot. 2024, 46, 100696. [Google Scholar] [CrossRef]
- Younesi, A.; Shayeghi, H.; Wang, Z.; Siano, P.; Mehrizi-Sani, A.; Safari, A. Trends in modern power systems resilience: State-of-the-art review. Renew. Sustain. Energy Rev. 2022, 162, 112397. [Google Scholar] [CrossRef]
- Shi, Q.; Liu, W.; Zeng, B.; Hui, H.; Li, F. Enhancing distribution system resilience against extreme weather events: Concept review, algorithm summary, and future vision. Int. J. Electr. Power Energy Syst. 2022, 138, 107860. [Google Scholar] [CrossRef]
- Hamidieh, M.; Ghassemi, M. Microgrids and Resilience: A Review. IEEE Access 2022, 10, 106059–106080. [Google Scholar] [CrossRef]
- Baghbanzadeh, D.; Salehi, J.; Gazijahani, F.S.; Shafie-khah, M.; Catalão, J.P. Resilience improvement of multi-microgrid distribution networks using distributed generation. Sustain. Energy Grids Netw. 2021, 27, 100503. [Google Scholar] [CrossRef]
- Shi, Q.; Li, F.; Olama, M.; Dong, J.; Xue, Y.; Starke, M.; Feng, W.; Winstead, C.; Kuruganti, T. Post-extreme-event restoration using linear topological constraints and DER scheduling to enhance distribution system resilience. Int. J. Electr. Power Energy Syst. 2021, 131, 107029. [Google Scholar] [CrossRef]
- Xu, J.; Zhang, T.; Du, Y.; Zhang, W.; Yang, T.; Qiu, J. Islanding and dynamic reconfiguration for resilience enhancement of active distribution systems. Electr. Power Syst. Res. 2020, 189, 106749. [Google Scholar] [CrossRef]
- Farzin, H.; Fotuhi-Firuzabad, M.; Moeini-Aghtaie, M. Enhancing Power System Resilience Through Hierarchical Outage Management in Multi-Microgrids. IEEE Trans. Smart Grid 2016, 7, 2869–2879. [Google Scholar] [CrossRef]
- Kim, J.; Dvorkin, Y. Enhancing Distribution System Resilience with Mobile Energy Storage and Microgrids. IEEE Trans. Smart Grid 2019, 10, 4996–5006. [Google Scholar] [CrossRef]
- Mousavizadeh, S.; Haghifam, M.R.; Shariatkhah, M.H. A linear two-stage method for resiliency analysis in distribution systems considering renewable energy and demand response resources. Appl. Energy 2018, 211, 443–460. [Google Scholar] [CrossRef]
- Zhang, G.; Zhang, F.; Zhang, X.; Wu, Q.; Meng, K. A multi-disaster-scenario distributionally robust planning model for enhancing the resilience of distribution systems. Int. J. Electr. Power Energy Syst. 2020, 122, 106161. [Google Scholar] [CrossRef]
- Wang, X.; Li, Z.; Shahidehpour, M.; Jiang, C. Robust Line Hardening Strategies for Improving the Resilience of Distribution Systems with Variable Renewable Resources. IEEE Trans. Sustain. Energy 2019, 10, 386–395. [Google Scholar] [CrossRef]
- Behzadi, S.; Bagheri, A.; Rabiee, A. Resilience-Oriented Operation of Micro-Grids in both Grid-Connected and Isolated Conditions within Sustainable Active Distribution Networks. J. Oper. Autom. Power Eng. 2024, 13, 38–51. [Google Scholar] [CrossRef]
- Ma, S.; Su, L.; Wang, Z.; Qiu, F.; Guo, G. Resilience Enhancement of Distribution Grids Against Extreme Weather Events. IEEE Trans. Power Syst. 2018, 33, 4842–4853. [Google Scholar] [CrossRef]
- Ghasemi, M.; Kazemi, A.; Bompard, E.; Aminifar, F. A two-stage resilience improvement planning for power distribution systems against hurricanes. Int. J. Electr. Power Energy Syst. 2021, 132, 107214. [Google Scholar] [CrossRef]
- Najafi, J.; Peiravi, A.; Anvari-Moghaddam, A. Enhancing Integrated Power and Water Distribution Networks Seismic Resilience Leveraging Microgrids. Sustainability 2020, 12, 2167. [Google Scholar] [CrossRef]
- Lin, Y.; Bie, Z. Tri-level optimal hardening plan for a resilient distribution system considering reconfiguration and DG islanding. Appl. Energy 2018, 210, 1266–1279. [Google Scholar] [CrossRef]
- Salimi, M.; Nasr, M.A.; Hosseinian, S.H.; Gharehpetian, G.B.; Shahidehpour, M. Information Gap Decision Theory-Based Active Distribution System Planning for Resilience Enhancement. IEEE Trans. Smart Grid 2020, 11, 4390–4402. [Google Scholar] [CrossRef]
- Shi, Q.; Li, F.; Kuruganti, T.; Olama, M.M.; Dong, J.; Wang, X.; Winstead, C. Resilience-Oriented DG Siting and Sizing Considering Stochastic Scenario Reduction. IEEE Trans. Power Syst. 2021, 36, 3715–3727. [Google Scholar] [CrossRef]
- Ma, S.; Li, S.; Wang, Z.; Qiu, F. Resilience-Oriented Design of Distribution Systems. IEEE Trans. Power Syst. 2019, 34, 2880–2891. [Google Scholar] [CrossRef]
- Ghasemi, M.; Kazemi, A.; Gilani, M.A.; Shafie-Khah, M. A Stochastic Planning Model for Improving Resilience of Distribution System Considering Master-Slave Distributed Generators and Network Reconfiguration. IEEE Access 2021, 9, 78859–78872. [Google Scholar] [CrossRef]
- Ebadat-Parast, M.; Nazari, M.H.; Hosseinian, S.H. Distribution system resilience enhancement through resilience-oriented optimal scheduling of multi-microgrids considering normal and emergency conditions interlink utilizing multi-objective programming. Sustain. Cities Soc. 2022, 76, 103467. [Google Scholar] [CrossRef]
- Farzin, H.; Fotuhi-Firuzabad, M.; Moeini-Aghtaie, M. A Stochastic Multi-Objective Framework for Optimal Scheduling of Energy Storage Systems in Microgrids. IEEE Trans. Smart Grid 2017, 8, 117–127. [Google Scholar] [CrossRef]
- Wang, Y.; Rousis, A.O.; Strbac, G. Resilience-Driven Modeling, Operation and Assessment for a Hybrid AC/DC Microgrid. IEEE Access 2020, 8, 139756–139770. [Google Scholar] [CrossRef]
- Mohiti, M.; Monsef, H.; Anvari-Moghaddam, A.; Lesani, H. Two-Stage Robust Optimization for Resilient Operation of Microgrids Considering Hierarchical Frequency Control Structure. IEEE Trans. Ind. Electron. 2020, 67, 9439–9449. [Google Scholar] [CrossRef]
- Farzin, H.; Fotuhi-Firuzabad, M.; Moeini-Aghtaie, M. Stochastic Energy Management of Microgrids During Unscheduled Islanding Period. IEEE Trans. Ind. Inform. 2017, 13, 1079–1087. [Google Scholar] [CrossRef]
- Wang, Y.; Rousis, A.O.; Strbac, G. A resilience enhancement strategy for networked microgrids incorporating electricity and transport and utilizing a stochastic hierarchical control approach. Sustain. Energy Grids Netw. 2021, 26, 100464. [Google Scholar] [CrossRef]
- Parast, M.E.; Nazari, M.H.; Hosseinian, S.H. Resilience Improvement of Distribution Networks Using a Two-Stage Stochastic Multi-Objective Programming via Microgrids Optimal Performance. IEEE Access 2021, 9, 102930–102952. [Google Scholar] [CrossRef]
- Mcintyre, K.; LaFleur, C.; Chatterjee, N.; Powelson, R.; Glick, R. Grid Resilience in Regional Transmission Organizations and Independent System Operators; United Stated of America Federal Energy Regulatory Commission: Washington, DC, USA, 2018. [Google Scholar]
- Cigre, W. C4. 47 Definition for Power System Resilience; CIGRE: Paris, France, 2022; Volume 16. [Google Scholar]
- Yuan, H.; Zhang, W.; Zhu, J.; Bagtzoglou, A.C. Resilience Assessment of Overhead Power Distribution Systems under Strong Winds for Hardening Prioritization. ASCE-ASME J. Risk Uncertain. Eng. Syst. Part A Civ. Eng. 2018, 4, 04018037. [Google Scholar] [CrossRef]
- Liu, X.; Shahidehpour, M.; Li, Z.; Liu, X.; Cao, Y.; Bie, Z. Microgrids for Enhancing the Power Grid Resilience in Extreme Conditions. IEEE Trans. Smart Grid 2016, 8, 589–597. [Google Scholar] [CrossRef]
- Gholami, A.; Shekari, T.; Aminifar, F.; Shahidehpour, M. Microgrid Scheduling With Uncertainty: The Quest for Resilience. IEEE Trans. Smart Grid 2016, 7, 2849–2858. [Google Scholar] [CrossRef]
- Gholami, A.; Aminifar, F. A hierarchical response-based approach to the load restoration problem. IEEE Trans. Smart Grid 2015, 8, 1700–1709. [Google Scholar] [CrossRef]
- FEMA. Hazus Earthquake Model Technical Manual; FEMA: Washington, DC, USA, 2020. [Google Scholar]
- Mujjuni, F.; Betts, T.R.; Blanchard, R.E. Evaluation of power systems resilience to extreme weather events: A review of methods and assumptions. IEEE Access 2023, 11, 87279–87296. [Google Scholar] [CrossRef]
- ISO New England. 2025. Available online: https://www.iso-ne.com/ (accessed on 20 April 2025).
- Likas, A.; Vlassis, N.; Verbeek, J.J. The global k-means clustering algorithm. Pattern Recognit. 2003, 36, 451–461. [Google Scholar] [CrossRef]
Disclaimer/Publisher’s Note: The statements, opinions and data contained in all publications are solely those of the individual author(s) and contributor(s) and not of MDPI and/or the editor(s). MDPI and/or the editor(s) disclaim responsibility for any injury to people or property resulting from any ideas, methods, instructions or products referred to in the content. |
© 2025 by the authors. Licensee MDPI, Basel, Switzerland. This article is an open access article distributed under the terms and conditions of the Creative Commons Attribution (CC BY) license (https://creativecommons.org/licenses/by/4.0/).