1. Introduction
The effective coordination of EMSs is critical for ensuring timely responses to various emergencies, from diseases to traffic accidents and cardiorespiratory arrests [
1]. This emergency variety implies that EMS systems must usually coordinate first responders, crisis management at regulatory centers, pre-hospital and emergency services, transport modalities, hospital care, educational programs, and surveillance processes [
2]. The primary objective of EMSs is to rapidly stabilize patients and ensure their safe transfer to appropriate healthcare facilities for further treatment [
3].
The economic implications of inefficient EMS systems are substantial, with cardiovascular diseases incurring costs exceeding 900 billion euros annually worldwide [
4]. At the same time, populations are pyramidally inverted, and concerns arise regarding the financial sustainability of these systems, potentially leading to tax increases. Additionally, these systems need to deal with cardiovascular emergencies [
4,
5], in which a critical factor is response time, given the narrow window (4 min) for averting irreversible neurological damage [
5]. EMS systems must also deal with road accidents, whose casualties impose a substantial economic burden on most nations, equivalent to 3% of their GDP [
4,
6]. Moreover, different media highlight prevalent issues within the current EMS, underscoring significant deficiencies in emergency response. This situation contributes to an elevated mortality rate, deteriorates the quality of life for individuals, and escalates healthcare system costs [
7].
EMS management encompasses a multifaceted series of stages, from forecasting demand requirements, deciding the number of vehicles, locating/relocating emergency vehicles, and choosing an ambulance dispatching policy [
3]. The design and operation of EMS systems are influenced by various factors, including geographic coverage, population density, resource availability, and the varying levels of the healthcare infrastructure [
3]. These systems must be meticulously designed to optimize response times, ensure equitable access to care, and maintain a high standard of medical service. The complexity of these tasks is further compounded by the need to operate within budgetary constraints and to adapt to the evolving healthcare needs of diverse populations [
8].
EMS systems face particularly acute challenges in developing countries, primarily due to limited funding and resource constraints [
9,
10]. These financial limitations often lead to an inadequate infrastructure, insufficient ambulance coverage, and a shortage of trained personnel, all of which directly impact the quality of service [
11]. The disparities in healthcare access and outcomes are further exacerbated in rural and underserved areas, where the lack of funding results in delayed response times and poor patient outcomes [
11]. The limited availability of resources makes it challenging to implement advanced technologies, such as Geographic Information Systems (GISs) and hypercube queuing models, which are critical for optimizing EMS operations [
9,
10,
11].
Corruption is another significant challenge that hampers the effectiveness of EMS funding in many developing nations. Misallocation of funds, lack of transparency, and inefficiencies in resource management undermine the potential for EMS systems to function effectively [
12]. In such environments, the importance of public–private alliances cannot be overstated. By fostering collaborations between the government and private entities, it becomes possible to pool resources, share expertise, and implement best practices that enhance the quality and equity of EMS services [
13]. These partnerships are also instrumental in reducing corruption, as private sector involvement often brings increased accountability, transparency, and efficiency in the management of funds [
14,
15,
16].
Economic Value Added (EVA) becomes a crucial metric in this context, mainly when private entities are involved in solving public problems [
17,
18]. EVA measures the value created beyond the operational costs, ensuring that investments in EMSs generate positive returns for society [
17]. In low- and middle-income countries (LMICs), where public resources are often stretched thin, leveraging private investment through EVA-focused initiatives can help ensure that EMS systems are not only sustainable but also deliver high-quality services to all segments of the population [
18,
19]. By aligning the interests of both public and private stakeholders, EVA can drive improvements in EMS efficiency, reduce costs, and enhance patient outcomes, ultimately contributing to the broader goal of improving public health [
18,
19].
Additionally, EMS systems globally have undergone significant transformations driven by technological advancements, changes in healthcare policy, and the growing demand for efficient and effective emergency care. Geographic Information Systems (GISs) have become indispensable in EMS planning, enabling precise mapping and analysis of service areas, identification of optimal ambulance station locations, and real-time tracking of emergency vehicles [
20]. The adoption of hypercube queuing models has further enhanced the ability to predict and manage the dynamic nature of emergency service demand, allowing for more efficient resource allocation at a strategic level [
21].
Moreover, the strategic design of EMS systems is increasingly incorporating multicriteria decision-making (MCDM) tools to address the complex trade-offs between competing objectives, such as minimizing response times, maximizing coverage, optimizing resource utilization, and enhancing equity and quality of service [
22,
23,
24,
25]. These tools allow for a more comprehensive and nuanced approach to decision-making, ensuring that EMS systems are not only efficient but also equitable, providing all individuals—regardless of socio-economic status or geographic location—with access to high-quality emergency care [
22,
23,
24].
Given the profound implications for both individual health outcomes and broader economic impacts, the rapid response of ambulances and the efficiency of EMS systems are crucial. Effective EMSs can significantly increase the chances of survival and reduce the likelihood of long-term disabilities, making it an essential component of healthcare systems worldwide [
26]. This paper contributes to the strategic design of emergency medical services (EMSs) by integrating advanced analytical models, decision-support tools, and public–private partnerships to enhance both efficiency and equity. It aims to reconcile critical service quality indicators—such as response times, coverage, and equity—with financial sustainability metrics, particularly Economic Value Added (EVA). By employing methodologies such as the Hypercube Queuing Model (HQM), Geographic Information Systems (GISs), and EVA analysis, this study develops a strategic framework for EMS design in low- and middle-income countries (LMICs), aiming to achieve efficiency and sustainability in these contexts.
While a direct comparative baseline measurement was not conducted, historical EMS data from Barranquilla are used to simulate and evaluate optimized scenarios. This approach systematically assesses trade-offs between funding constraints in LMICs and optimal system performance, ensuring long-term sustainability and service quality. Rather than establishing a baseline comparison, this study focuses on designing a sustainable EMS system that enhances operational efficiency and equitable healthcare access.
This paper is organized as follows:
Section 1 presents an introduction to the general situation,
Section 2 presents the literature review,
Section 3 describes the methodology,
Section 4 presents the analysis of results, and finally,
Section 5 presents the conclusions of this research.
2. Literature Review
Considering that this research aims to propose an approach to tackle the problem of designing sustainable EMS systems in low- and middle-income countries, many disciplines have to be considered in the process. Therefore, the following literature review includes theories in decision-making, EMS optimization objectives, finance, and hypercube queuing models to determine the most recent contributions of these fields in the strategic design of EMS systems. These contributions will mainly focus on the problem of designing an EMS system in low- and middle-income countries that are facing trade-offs, considering the lack of resources in the public sector and the need to provide the population with a good quality of service to improve the outcome and efficiency of the healthcare system. In this sense, public–private partnerships play a crucial role in the design of these systems.
2.1. Queuing Models in EMS Design
The Hypercube Queuing Model (HQM) represents a foundational approach to studying spatial queuing systems for emergency medical services (EMSs). The HQM utilizes a continuous-time Markov process to model a geographic region divided into multiple areas where emergency calls and ambulances are distributed. In this model, ambulances can be stationary or mobile, with mobile locations referring to non-stationary ambulances even when idle. When all ambulances are busy, incoming emergency calls can be either queued or considered lost to be managed by an alternative system. Each state in the HQM is represented as a binary sequence, where each position indicates the status of an ambulance: 0 for idle and 1 for busy. For systems with more than three ambulances, the transition graph forms a hypercube, and state transitions follow an exponential distribution based on the arrival and service rates of emergency calls. The model primarily considers single-dispatch scenarios, where state transitions only occur between directly connected states on the hypercube [
27,
28].
According to Iannoni and Morabito [
28], different subsequent research enhanced and expanded the HQM framework by incorporating new features into the model. For example, allowing the dispatch of several ambulances to incidents requiring additional resources. Jarvis [
29] made another enhancement by incorporating multiple patient types and developing a stable, fast-converging approximation procedure to compute steady-state probabilities, where service times depend on the ambulance and the kind of patient. Another contribution of hypercube models applied to EMSs is the introduction of patient prioritization into the HQM [
30]. Additionally, Souza et al. [
30] found that the gap between the HQM and simulation results was only 1%. The HQM has been widely used to assist in ambulance location decisions and response strategies. Some of these applications can be found in [
21,
24].
According to Larson [
27], the hypercube state probabilities are defined by the set of flow-balancing equations built around the hypercube states. These systems states are represented with a binary notation in which each bit represents an ambulance; the value zero means that the server is idle, and if the bit takes the value one, it represents that the server is busy. This notation indicates that the state when ambulances (servers) 1 and 2 are busy and server 3 is idle is represented as {0 1 1} [
31].
Obtaining the steady-state probabilities from balance equations for each state is computationally feasible and relatively fast for small-sized problems. These steady-state probabilities are necessary to obtain the utilization factors for each server n (). However, as the problem size grows exponentially, with (N representing the number of ambulances), the computational and storage requirements become prohibitive. For example, with three ambulances, the system requires calculating eight steady-state probabilities for a zero-capacity waiting line and nine for an infinite-capacity waiting line. When N = 20, the number of states escalates to 1,048,576, necessitating the resolution of a system with an equivalent number of equations. This demands immense computational resources and storage, as the corresponding matrix would exceed 1099 trillion cells, requiring over 1 TB of storage. These challenges grow exponentially with an increasing number of ambulances.
To address this issue, Larson [
27] developed an approximation algorithm that calculates the utilization factor (
) for each server
n rather than determining the steady-state probabilities. This approach drastically reduces the problem size; for 20 ambulances, only 20 equations are required instead of 1,048,576.
This approximation makes this approach more suitable for large-scale problems. Additionally, approximate hypercube queuing models (AHQMs) demonstrate significant advancements in EMS system optimization. In this sense, Ghobadi et al. [
21] summarized key aspects of the HQM and AHQM, discussing potential extensions. Souza et al. [
30] and Iannoni et al. [
32] extended the HQM to prioritize patients based on urgency, improving service quality for high-priority cases. Morabito et al. [
33] highlighted the importance of incorporating ambulance-specific service times for accurate performance measures, and Budge et al. [
34] quantified differences between iterative approximations and simulations for depot-based ambulance systems.
On the other hand, Atkinson et al. [
35] introduced heuristics to estimate loss probabilities and ambulance utilization along highways, further developed by Iannoni et al. [
36], for Brazilian EMS systems. Geroliminis et al. [
37] proposed a two-step districting approach for server location problems, which was applied to Athens’ public transportation repair network. Boyacı and Geroliminis [
38] introduced the 3
N HQM to classify server states and reduce computational complexity. Similarly, Blank [
39] improved computational efficiency by aggregating demand areas, achieving near-optimal solutions with genetic algorithms. Yoon et al. [
40] demonstrated that ambulance splits improve service times by dedicating vehicles to life-threatening conditions.
Despite the significant body of research on the Hypercube Queuing Model (HQM) and its approximate variations, gaps remain in addressing critical aspects of optimizing emergency medical services (EMSs). While much of the literature has focused on maximizing coverage, minimizing response times, and managing multiple dispatch scenarios, there has been limited exploration of integrating economic objectives, such as Economic Value Added (EVA), within the HQM framework. This is particularly important in low- and middle-income countries where public–private partnerships are increasingly leveraged to implement social programs due to constrained government resources. Our study aims to fill this gap by proposing a novel integration of the AHP and CoCoSo methods to support decision makers in EMS configuration, a combination not previously applied in the context of the HQM or its approximations. By incorporating economic objectives alongside traditional service quality and equity measures, our approach offers a more comprehensive EMS optimization tool that addresses operational efficiency and financial sustainability.
2.2. Optimization Objectives in EMS Design
Determining ambulance numbers and locations is a problem that many authors have widely addressed. Different techniques have been used to tackle these problems [
4]. These techniques cover metaheuristics, simulation, queuing, stochastic, and exact models. Nevertheless, in our case, we are required not to review the methods used but to review the objectives.
In the literature, various optimization objectives have been employed within different approaches to configure emergency medical services (EMSs). The most frequently cited objective is maximizing coverage, along with derivative objectives such as maximizing survival rates, minimizing the fraction of late arrivals, and optimizing the number of survivors [
4]. However, the service performance measurement is contingent upon the value of the service standard. The coverage indicator may suggest excellent system performance if decision makers set a considerable time limit as the service standard. Yet, this does not necessarily reflect optimal response times [
4].
Overall, the majority of objective functions aim to improve patient outcomes. Recent studies have introduced alternative objectives, such as survival functions and envy [
4]. Response time is another common objective, which evaluates the duration from the moment a call is received until the ambulance arrives at the emergency site [
4].
Nickel et al. [
41] approached the problem by aiming to minimize expected costs, primarily focusing on the fixed costs associated with ambulance bases while ensuring a specified service level. Several studies have also approached EMS optimization as a multi-objective problem by integrating multiple objectives. These studies employed various methods to weigh different objective functions, such as the GINI coefficient, survival rates, uncovered demand, penalties, relocation costs, and system preparedness [
4].
It is essential to point out that the GINI coefficient, widely used in economics to measure income inequality, is also applied in emergency medical services (EMSs) to assess equity in service delivery. It is calculated as twice the area between the Lorenz curve, which represents the cumulative proportion of service response times or coverage relative to the cumulative population share, and the line of equality, symbolizing perfect equity. In EMSs, a lower GINI coefficient indicates a more equitable distribution of resources, ensuring that all regions or population groups receive comparable response times and coverage, thereby improving system fairness and accessibility. When addressing strategic and tactical EMS decisions, many authors have incorporated it as an indicator of equity and fairness in service. Applications of this metric can be found in [
24,
42].
Reconciling economic and quality objectives in EMS models often involves maximizing coverage and minimizing response times, both of which aim to enhance the quality of service. While some studies have included objectives that attempt to capture equity, to our knowledge, no previous research has integrated an economic objective such as Economic Value Added (EVA). This is particularly relevant in low- and middle-income countries, where public–private partnerships (PPPs) frequently serve as a viable alternative for implementing social programs due to limited government resources. An economic objective like EVA is essential for ensuring that EMS configurations are efficient, equitable, and financially sustainable, particularly in environments where public funding alone is insufficient to meet social needs.
2.3. Economic Value Added and Public–Private Partnerships in EMS Design
Economic Value Added (EVA) has emerged as a critical performance metric, particularly in the context of public–private partnerships (PPPs) in low- and middle-income countries (LMICs). As governments in these countries grapple with budget deficits and growing debt, they increasingly turn to PPPs to leverage private sector resources, capabilities, and innovations in delivering social goods [
43]. PPPs provide a framework for collaboration between governments and private entities to deliver public services efficiently, with shared competencies and resources [
44]. Within these hybrid organizations, EVA is a valuable tool to assess the financial health and sustainability of the partnership. EVA measures the net operating profit after tax, less the cost of capital, effectively quantifying the economic value generated beyond the required return on investment [
45]. This metric aligns the objectives of public and private partners by ensuring that investments generate returns above their cost, thus safeguarding the financial stability and long-term viability of PPP projects. EVA can be calculated as follows:
where
corresponds to the Net Operating Profits After Taxes;
corresponds to the Net Operating Assets;
corresponds to the Weighted Average Cost of Capital.
And
can be calculated as follows:
where
corresponds to the Fixed Operating Assets;
corresponds to the Net Operating Working Capital.
According to Du et al. [
46], the importance of EVA in comparison with the generally accepted accounting principles remains in the fact that EVA shows, in a better way, the relationship between productivity and the financial well-being of the company.
The application of EVA within PPPs addresses several challenges. In environments characterized by scarce resources and significant social needs, such as those found in LMICs, the effectiveness of PPPs is closely tied to their ability to optimize resource allocation and maintain financial discipline [
44]. EVA enables decision makers to evaluate whether public–private projects meet their intended financial and social outcomes, ensuring that resources are used efficiently and that public services are delivered at optimal cost. The use of EVA can help mitigate risks associated with project financing, such as overinvestment in unproductive assets or excessive borrowing, which have historically undermined PPP performance [
45,
46]. By incentivizing public and private managers to focus on value creation, EVA enhances the potential for PPPs to fulfill their dual mandate of improving public service delivery while ensuring financial sustainability.
Despite the recognized benefits, the integration of EVA into the performance evaluation framework of PPPs remains limited, particularly in the strategic design of emergency medical service (EMS) systems. In the context of EMS systems, especially in LMICs with limited public resources, including EVA as an optimization criterion is imperative. It allows for a more strategic allocation of public and private resources, ensuring that all parties are incentivized to maintain the system’s financial health while achieving social objectives. Considering the severe budgetary constraints in LMICs, integrating EVA into EMS design provides a structured approach to evaluate and enhance the economic viability of these critical public services, making the case for its broader application in public–private partnerships in these settings.
To date, EVA has not been used strategically for designing EMS systems. However, given the lack of resources in LMICs, it is crucial to include EVA in the process to ensure financial sustainability and efficiency. Leveraging PPPs to support EMS systems can bridge resource gaps and maintain service continuity, ensuring that emergency services remain responsive, equitable, and financially sound. In this context, EVA will provide a robust framework for evaluating the cost-effectiveness and sustainability of EMS configurations, facilitating informed decision-making and promoting a more resilient healthcare infrastructure.
2.4. Multicriteria Approaches
2.4.1. Analytic Hierarchy Process (AHP)
Thomas Saaty developed the AHP to address complex multi-criteria decision problems by classifying alternatives and selecting the best one when the decision maker has multiple objectives or criteria. [
47]. This methodology allows users to assess the relative weight of multiple criteria or multiple options against given criteria in an intuitive manner [
48,
49]. If quantitative ratings are unavailable, decision makers or evaluators can still recognize whether one criterion is more important than another. The process is based on peer comparisons by a team of experts. Saaty established a consistent way to convert such pairwise comparisons (X is more important than Y) into a set of numbers representing the relative priority of each of the criteria [
50]. The applications of the AHP are broad and include almost every field in decision-making problems.
Addressing EMS design and strategic planning involves different conflicting criteria, such as economics, logistics, and health. In this sense, multicriteria decision-making tools such as the AHP have helped weigh criteria in different problems within healthcare and emergency management problems. For example, multi-criteria decision-making (MCDM) was integrated with the Geographic Information System (GIS) to solve the emergency logistics center (ELC) site selection problem [
51]. This helped to handle logistical disruptions and shortages of supplies when addressing public health events and natural disasters [
51]. MCDM has also been helpful when locating Emergency Shelters [
52]. Its main contribution lies in the weighting process of various criteria, including proximity to the fault, fire stations, hospitals, main roads, and the area of the Emergency Shelters [
52].
In the case of supplier selection and evaluation in EMS systems, MCDM has helped weigh the different criteria to select the most suitable ambulance provider [
53]. Similarly, MCDM was also used to tackle the problem of selecting the best emergency medical suppliers [
54], considering the bidirectional influence relation of the criteria, consensus, and psychological decision-making factors. According to Liu et al. [
54], it provides good aid in emergency decision-making and allows ranking results under different risk attenuation factors to be obtained. MCDM tools proved their benefits in Wuhan in the context of COVID-19, illustrating their practicability and usefulness [
54].
On the other hand, emergency medical services are critical in treating injuries after destructive earthquakes, and emergency medical evacuation is very time sensitive. Considering this vital need, Liu [
55] presented a comprehensive framework for selecting locations for Emergency Medical Service Facilities (EMSFs) in post-earthquake scenarios. The framework uses the Analytic Hierarchy Process (AHP) to determine the criteria weights and applies the TOPSIS method to rank potential EMSF sites based on suitability. The proposed approach is validated using data from Wenchuan, China, showing improved performance in facility capacity, hazard avoidance, and medical evacuation efficiency compared to existing methods.
Similarly, Wang and Liu [
56] propose a hybrid fuzzy method combining a fuzzy Analytic Hierarchy Process (AHP) and a 2-tuple fuzzy linguistic approach to evaluate emergency departments’ emergency response capacity (ERC) or alternatives. The method addresses the challenges of time pressure, lack of experience, and data limitations by allowing experts to assess qualitative criteria using linguistic variables. The evaluation is conducted in three stages: developing a hierarchical evaluation index system, using a fuzzy AHP for pairwise comparisons to determine the weights of criteria and sub-criteria, and applying the 2-tuple linguistic weighted average operator (LWAO) to compute the overall emergency response capacity (OERC). The validity of this approach is demonstrated by comparing the ERC of three emergency alternatives, highlighting its effectiveness in handling qualitative expert evaluations in emergency management. Finally, Xu et al. [
57] proposed a scientific criteria system for assessing the emergency response capability of urban emergency shelters at a smaller scale, utilizing the Analytical Hierarchy Process (AHP) and multisource data. The framework evaluated shelters across six critical perspectives: site safety, spatial accessibility, demand matching, shelter facilities, operation, administration and maintenance (OA&M), and public awareness. The approach was validated through the GIS analysis of the Yuandadu Park Emergency Shelter in Beijing, demonstrating its effectiveness in identifying the strengths and weaknesses of individual shelters. The study emphasized that this comprehensive evaluation system can help decision makers enhance emergency preparedness and response in urban areas.
2.4.2. Combined Compromise Solution (CoCoSo)
The Combined Compromise Solution (CoCoSo) methodology is a multi-criteria decision-making (MCDM) approach used to evaluate and rank alternatives based on multiple criteria. Developed by Yazdani and Amiri [
58], CoCoSo combines aspects of compromise programming and simple additive weighting to produce a robust decision-making framework. The methodology is beneficial when decision makers must consider various conflicting criteria to reach a consensus.
Among MCDM tools, CoCoSo usually acts as a ranking tool for the available alternatives in the decision-making process. It requires the assignation of criteria weights in a previous step. In this sense, it is similar to tools such as TOPSIS, VIKOR, and PROMETHEE. Nevertheless, CoCoSo possesses the merits of reliability and stability of decision-making results [
59]. Though having these characteristics, CoCoSo implementation in the fields of healthcare and social sciences is still limited. Among the most relevant applications of CoCoSo in healthcare and social science, it is worth highlighting that Torkayesh et al. [
60] used CoCoSo to evaluate social sustainability performance in seven developed countries. In their study, Torkayesh et al. [
60] considered fourteen criteria that have noticeable roles in social sustainability. They integrated CoCoSo with tools such as CRITIC and Shannon’s Entropy to successfully remove the biasedness and subjectivity of experts’ opinions that can happen using other weighting methods [
60].
Additionally, in the field of risk evaluation, due to the increase of complexities and uncertainties in practical occupational health and safety risk assessment (OHSRA) problems, experts’ risk assessment information is often qualitative description and cannot be adequately described by standard generalized fuzzy methods. Therefore, Chen et al. [
59] integrated the Fermatean fuzzy linguistic sets (FFLSs) and CoCoSo approach to successfully depict the subjective risk evaluations of experts more precisely and obtain a reliable and stable risk ranking result of occupational hazards for enhancing worker safety. On the other hand, Torkayesh et al. [
61] proposed the integration of Best Worst Multicriteria (BWMs), Level-Based Weight Assessment (LBWA), and CoCoSo to investigate the performance of healthcare sectors in Eastern European countries.
In this sense, it is relevant to point out that the integration of the AHP and CoCoSo represents a novel methodological approach that, to our knowledge, has not been previously employed to assist decision makers in the EMS configuration process. This unique combination offers a robust framework for evaluating multiple criteria and optimizing resource allocation, filling a significant gap in the existing literature and providing an innovative tool for enhancing the strategic design of emergency medical services.
This literature review (
Table 1) highlights several gaps that this study seeks to address. One key gap is the lack of integration between Hypercube Queueing Models (HQMs) and Economic Value Added (EVA) for assessing the financial sustainability of EMS systems, which this study directly incorporates into strategic planning. Additionally, while previous research has explored service quality metrics and financial sustainability separately, few studies have explicitly analyzed the trade-offs between these two critical factors in EMS design. Our approach bridges this gap by introducing a multi-criteria decision-making framework that balances response times, equity, and financial performance. Moreover, the literature underscores the need for scalable and adaptable EMS models capable of adjusting to varying resource constraints. To address this, we evaluate our methodology under two distinct demand scenarios, demonstrating its applicability across different operational conditions. By integrating these components, this study provides a comprehensive decision-support tool that enhances EMS system design in resource-constrained environments.
3. Methodology
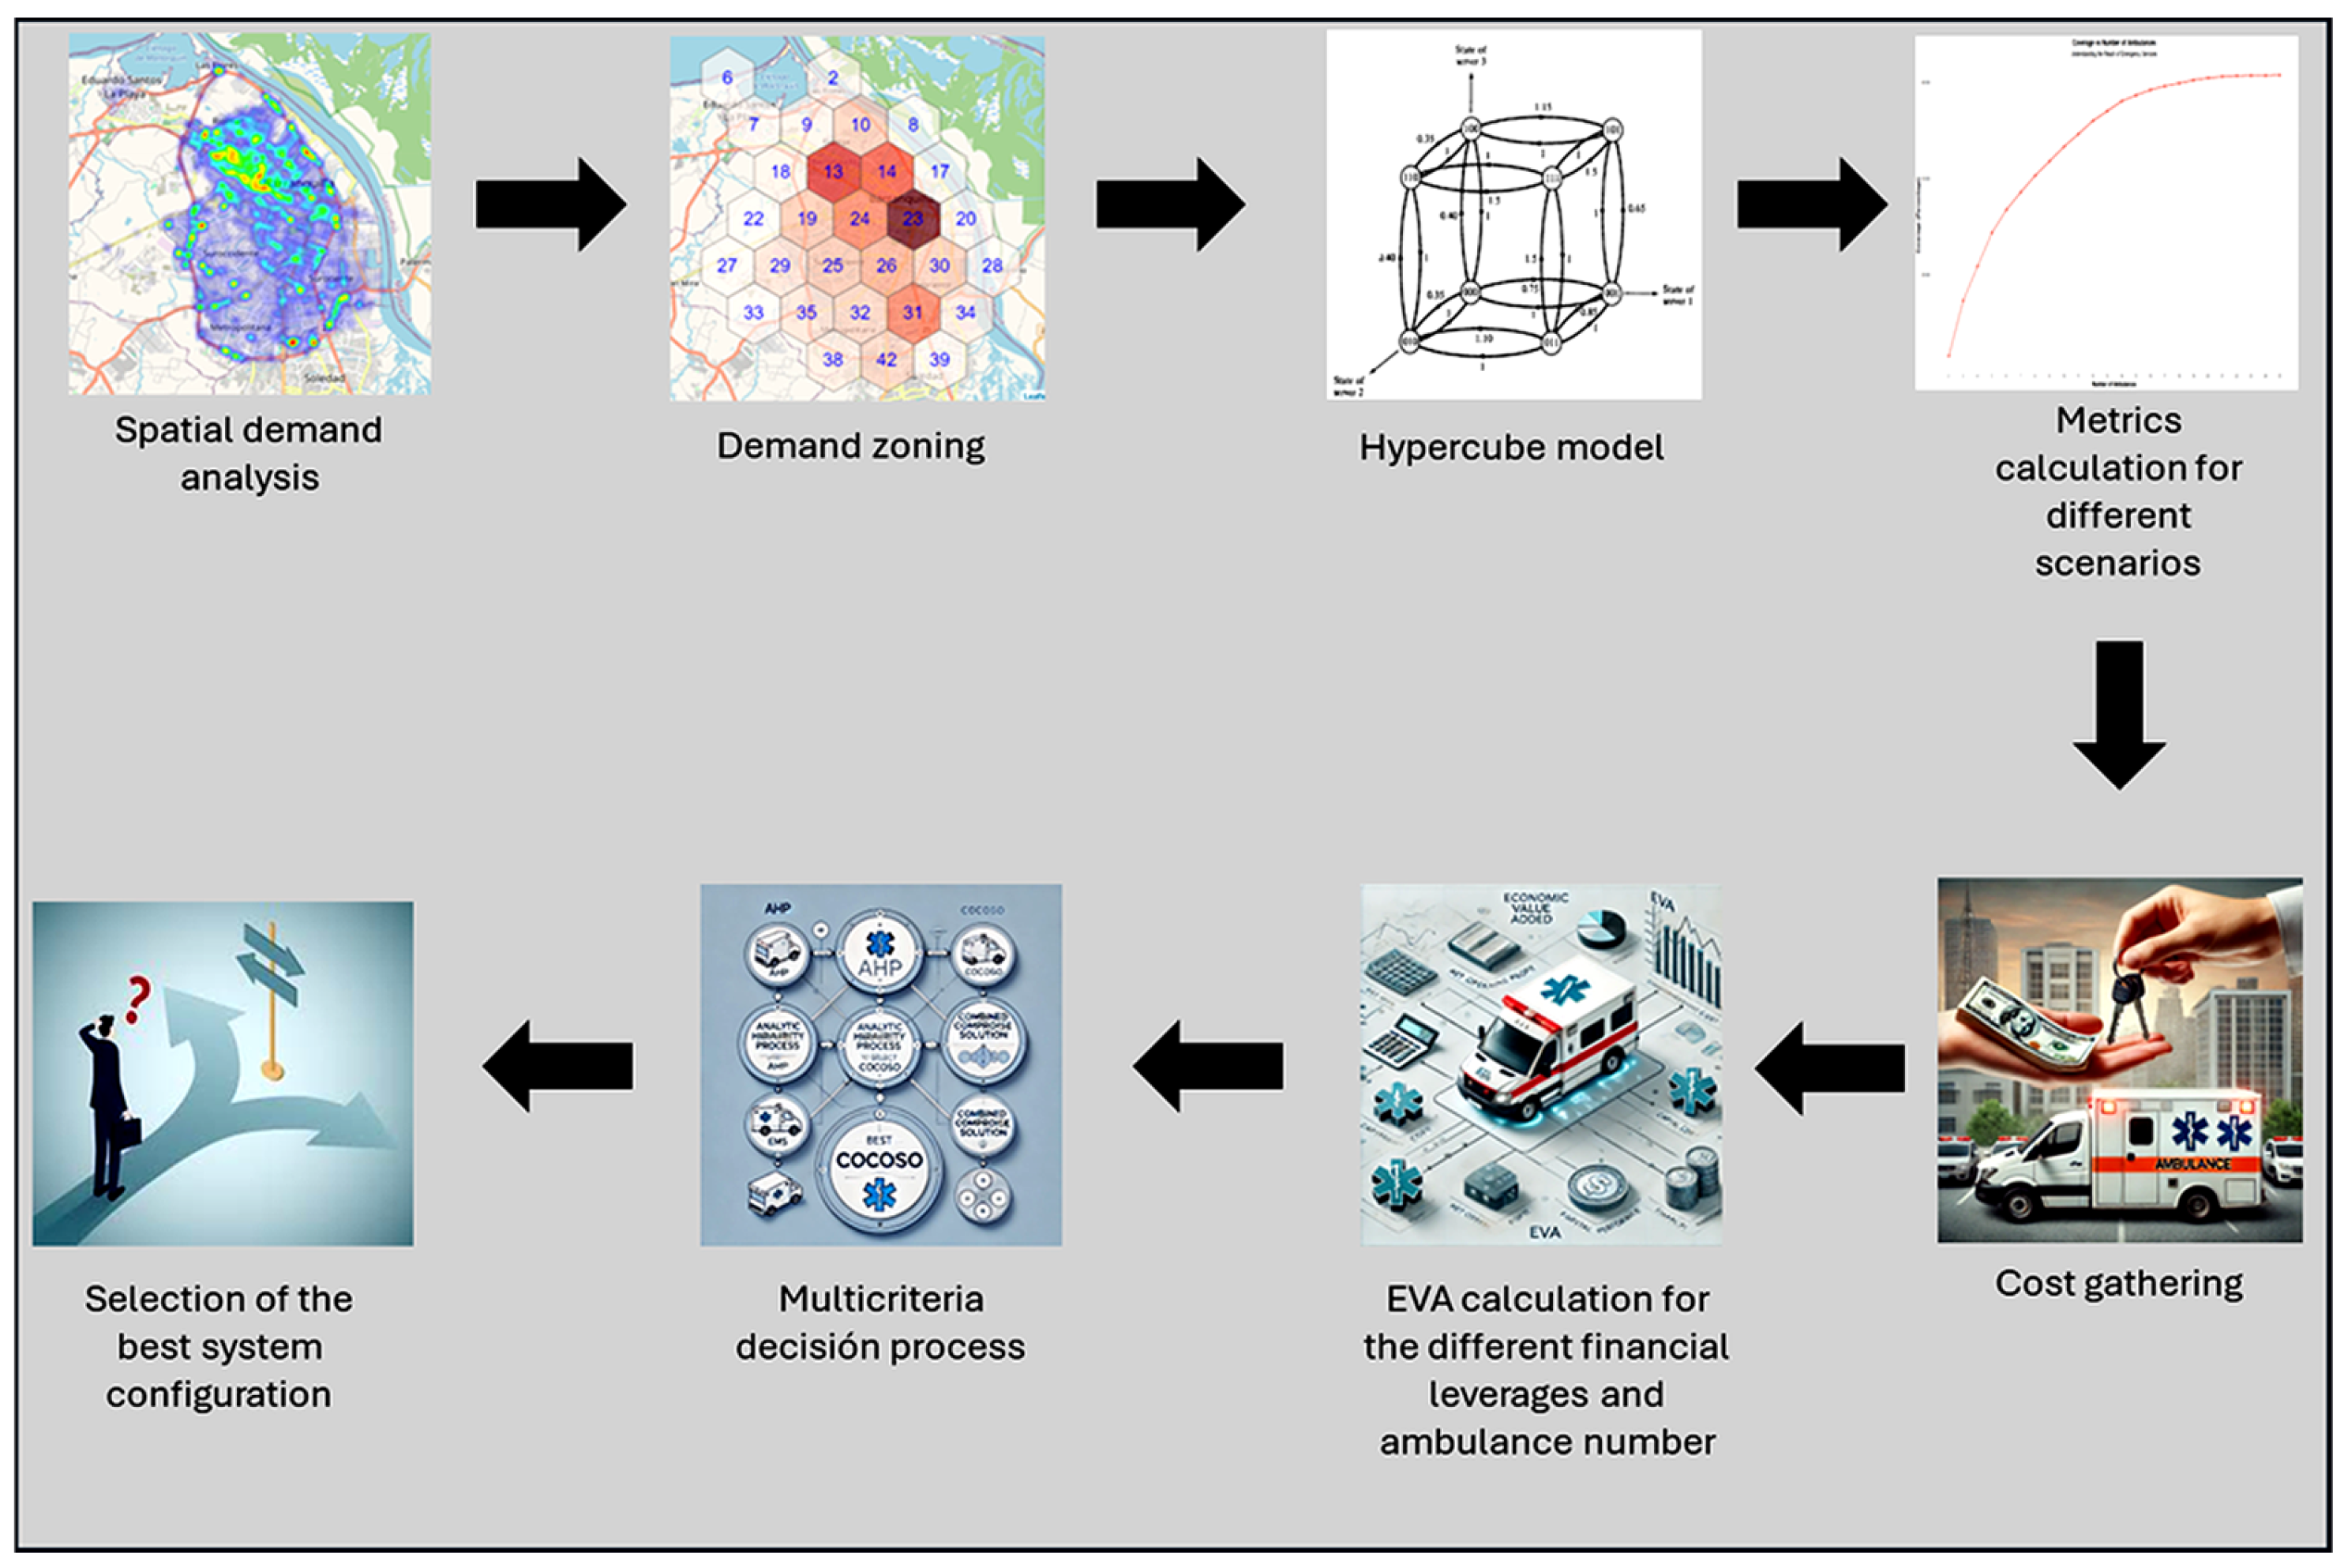
The methodology follows a structured, step-by-step approach to designing an EMS system, emphasizing practical application rather than strictly validating a predefined baseline hypothesis. This approach ensures that modeling, and multi-criteria decision analysis (MCDA) are directly integrated into EMS system development, enhancing decision-making effectiveness.
It is important to note that this study focuses on designing an EMS system specifically for traffic accident emergencies in Barranquilla, Colombia. The proposed methodology is structured into a series of sequential steps, as depicted in
Figure 1, each of which is described in detail in the following sections.
3.1. Statistical Analysis
The first step in designing the medical emergency system for the care of victims of traffic accidents in the city of Barranquilla, Colombia, is the statistical analysis and the analysis of the spatial distribution of emergency calls in the city of Barranquilla. This analysis is vital to determine the demand for zoning and the number of calls per hour in each zone.
3.2. Hypercube Queuing Model
The second step of the methodology is constructing a hypercube queuing model to estimate the steady-state probabilities of the different states to estimate the busyness fraction of each ambulance. These calculations will allow us to estimate the response time, coverage, GINI index, and waiting times for the different calls. The construction of this hypercube model required, in the first place, demand zoning. Zoning was made, considering the distance that could be traveled, so the maximum response time within an area is 7 min. This zoning made it possible to obtain the honeycomb distribution. The demand within each of these areas was identified in such a way that the process of evaluating the viability of the system will be carried out in an iterative way in which more numbers of ambulances are progressively considered, seeing their impact on the different metrics of both quality of service and financial performance.
This iterative process first considered acquiring a single ambulance to cover the entire city even if the response times were high, placing it in the zone of highest demand and prioritizing calls from this first node. The second ambulance will be assigned to the second zone in the number of calls. New steady-state probabilities will be calculated, and the values of the different performance measures will be updated. This iterative process will repeat until each zone has an ambulance assigned to it.
With the results of the hypercube models run in each scenario, curves were built for the indicators of response time, waiting time in case all servers were occupied, number of calls in queue, coverage, GINI index (to measure equity in service based on response times) are as similar as possible to each of the calls). These curves will allow us to identify how the performance of each of these indicators varies as the number of available ambulances varies.
In each iteration, the hypercube queuing model was constructed in two ways. The first way assumed a zero-capacity waiting line, and the second assumed an infinity-capacity waiting line, leading to different solutions. Coverage was set considering a 15 min response time. In the first case, the response time calculation will only include travel times, considering that when a call arrives in the system and all servers are busy, this call will be lost because there is a zero-capacity waiting line. In the second case, response times will also include waiting time in the queue for its calculation. Expected response times for each node require estimating the utilization factor for each ambulance. This calculation will be obtained using both cases’ corresponding hypercube queuing model. Implementing the hypercube queuing model involves the construction of a transition matrix that considers lambda and mu values in
Table 2 and listed priorities in
Table 3. The priorities in
Table 3 were determined based on the closest server criterion. The closest servers to the demand node will be ranked higher in the prioritization process.
Once the transition matrix is constructed, steady-state probabilities are obtained following the process described by Chiyoshi et al. [
31]. Solving the system of equations yields steady-state probabilities. These probabilities can be used to obtain busyness and idle fractions for each server and the rest of the metrics (response time, coverage, and GINI index). Nevertheless, considering the size of the problem, the AHQM is more suitable to address this problem, as mentioned in the literature review, to estimate busyness and idle fractions for each server.
The algorithm to be used to obtain the approximate server’s utilization factors was the one described by Larson [
62] and requires the following steps:
- a.
Calculation of the general utilization factor with the expression
- b.
Determine the accepted error () for the convergence test.
- c.
Set s = 0.
- d.
Calculate a first estimation of
for each server with the following expression:
- e.
s s + 1.
- f.
For all servers, compute and use it to compute .
- g.
Normalize the values of so that .
- h.
Calculate for each server n.
- i.
Make the following test
- j.
If the test is TRUE go to step e, else the algorithm terminates.
In this algorithm, the values of
for each server
n are calculated with the following relation:
where
is estimated with the following relation:
where
corresponds to the system’s overall demand rate;
represents the saturation probability of the system (all servers busy);
N is the total number of servers in the system.
The calculation of
will be estimated using the relation for an
M/M/k queuing model. In our case,
k will be represented by
N.
The value of
in Equation (1) is estimated with the following expression:
where
corresponds to the demand rate of node a.
sets represent the set containing the demand nodes (a) in which server is the first priority, the second priority, and so on to be priority to be dispatched to the node;
correspond to the utilization factor of servers with higher priority to be dispatched to that node
a. These values correspond to the estimation of utilization factor for each one of the rest of servers in each iteration. For example, if we are working with 3 demand zones and 3 servers, we are going to be estimating
,
and
in each iteration until the algorithm converges. To calculate
, it would be necessary to determine
sets. According to
Table 3, these sets will have the following elements:
After identifying
sets, it is possible to calculate
according to Equation (4):
corresponds to a correction factor depending on the number of servers in the system
N, the overall utilization factor
, and the priority of the server for an atom
a. This correction factor is only required when server
n is not the first priority [
30]
The calculation of this correction factor can be made with the following expression:
Once the convergence is reached, the corresponding utilization factors can be used as to obtain the values of and . These expressions represent the dispatch frequency of server n to demand zone a (denoted by ) is defined as the fraction of calls associated with the dispatch of server n to demand zone a. A non-zero capacity waiting line has two components. The first is associated with unqueued calls (denoted by ), and the second is associated with queued calls (denoted by ).
Once these values are obtained, the mean response time (
) of the system can be calculated according to the following expression:
and
where
is the mean travel time of a call that incurs some waiting time in the queue, and
represents the travel time from node
n to node
a.
The previous expression calculates the frequency at which Ambulance
n is dispatched to Atom
a without waiting in the queue, this means that Ambulance
n is the first priority to serve Atom
a. Similarly, the frequency at which Ambulance 2 is serving Atom a is:
when calls from Atom
a wait in the queue, the frequency in which server one will serve it can be calculated with the following expression:
These values can also be used to obtain the system response time, response times to each node, and other performance measures like coverage and GINI.
3.3. EVA Calculation
In the next step, the costs associated with the operation of ambulances and services were reviewed by the different actors of the system. In this regard, it is essential to highlight that the following costs were considered:
- ○
Costs of personnel;
- ○
Ambulance acquisition cost;
- ○
Ambulance equipment cost;
- ○
Ambulance certification cost;
- ○
Ambulance maintenance cost;
- ○
Ambulance medical equipment maintenance cost;
- ○
Ambulance medical supplies cost;
- ○
Ambulance operational supplies cost (gasoline);
- ○
Cost/Value of facilities required to preserve or store ambulances when not in operation. The administrative headquarters of the ambulance service provider are located in these facilities. These facilities are also helpful in storing medical supplies for ambulances and disinfecting ambulances in case of contamination;
- ○
Administrative costs of ambulance service provider;
- ○
Administrative costs of the Ambulance Management Office of the City Mayor’s Office;
- ○
Injured person transportation fee according to the Presidential bill “Manual Tarifario SOAT” [
63].
Once the relevant data regarding demand, the value assigned to each service provided, and the system’s operating costs have been collected, a comprehensive analysis is conducted to identify the optimal system configuration. This approach ensures the delivery of high-quality service indicators while considering the public–private partnership’s financial performance. Doing so safeguards the partnership’s sustainability and the long-term provision of quality services.
Knowing the number of calls that could be handled by the available servers within the pre-set response threshold value in each scenario is the calculation of the private partner EVA in each of them. EVA calculation will be carried out considering different levels of financial leverage, considering that the main asset object of this leverage will be the ambulances. The leverage level was considered in EVA calculation modifying the ambulances, the ambulances owned by the company, and the ambulances owned by the city but leased to the private partner. For example, in a scenario where there are five ambulances, EVA will be calculated considering that the company owns the five ambulances, then four owned and one leased, and so on until reaching zero owned and five leased. Equation (14) shows how EVA will be calculated in each scenario.
where
represents the covered demand in each scenario;
represents the estimated operational cost in each scenario;
represents the number of ambulances available in the system in each scenario;
represents the administration costs;
represents the amount paid per leased ambulance;
represents the number of leased ambulances;
represents the national tax rate;
represents the acquisition cost per owned ambulance;
represents the mean inventory including supplies;
represents other assets different to ambulances such as facilities and other equipment;
represent the weighted average capital cost.
3.4. Multicriteria Decision-Making
Finally, taking into account that system performance metrics have been obtained in different scenarios, we will proceed to build the multi-criteria decision-making (MCDM) model that allows the best configuration of the system in such a way as to guarantee its financial viability (long-term sustainability) and an adequate level of quality of service. The decision problem is described in
Figure 2. From this figure, we generated different scenarios or system configurations varying the number of ambulances, their locations.
Based on prioritized demand coverage and financial leverage through leased ambulances, these system configurations yield different values in the objectives or criteria that are considered in this decision problem. In the case of Coverage and EVA, these criteria are in the category of the higher, the better, and the other two criteria, Mean Response Time and GINI, are in the category of the lower, the better. Considering that we want to configure the system in the best way involving these criteria, it is necessary in the first place to weigh the criteria. The criteria will be weighted using a fuzzy AHP. Once these weights are calculated, the alternatives will be ranked using CoCoSo to select the best among them.
The first step within MCDM is to determine the importance of each criterion (indicator) in the decision. This goal will be achieved by implementing a fuzzy (AHP).
- ○
Construct a set of pairwise comparison matrices for criteria.
- ○
Perform calculations to find the importance of the weight of each criterion:
- ○
Calculate the maximum eigenvalue, consistency index, consistency ratio (
CR), and normalized values for the criteria and alternatives to ensure that the calculated weights derived from the pairwise comparison matrix are acceptable. Obtaining
CR involves the prior calculation of the maximum eigenvalue (
λmax) by applying
where
CV represents the consistency values for the factors and is defined as
On the other hand, the matrix C denotes an n-dimensional column vector that represents the total weighted values for the importance of the criteria. Then, the
CR (Consistency Ratio) is calculated using the
RI (random consistency index, depending on the size of the problem) [
64]. If the
CR < 0.10, the matrix is considered consistent, and the derived weights are reliable for decision-making.
When the AHP is applied in group decision-making processes, two different approaches are used, including the aggregation of individual judgments and the aggregation of individual priorities [
65].
One of the significant advantages of using the AHP technique is that it allows qualitative aspects to be included in the analysis, which are generally not analyzed due to the complexity of their measurement, although in most cases, these are of great relevance [
66].
In the case of this research, a reduced Saaty scale was used, as can be seen in
Table 4. The comparison is made in pairs due to the functioning of the human brain, which is designed to choose between two alternatives [
67].
Once criteria/indicator weights are obtained, CoCoSo will be implemented to rank the different configurations and, in doing so, determine the best system configuration according to the CoCoSo score and some system performance requirements.
In this next step , , , , and are extracted after implementing the hypercube model from the run scenarios, considering the different ambulance numbers. So, for each objective/criterion, the maximum and minimum values are determined.
After determining maximum and minimum values, the normalized values for each metric in each scenario (
s) can be obtained as follows:
where
,
,
, and
correspond to the values of these metrics in each scenario (different number of ambulances). The scenario for EVA will be considered when all ambulances are leased because this curve gives the best EVA values. Then, the values for each of the additive (
) and multiplicative (
) components of the CoCoSo are obtained for each scenario (
s) with the following equations:
By having the values of
and
for each scenario (
s), it is possible to calculate the value of the aggregation component
of CoCoSo for each scenario (
s) can be obtained as shown:
In this equation,
and
can be calculated as shown:
where
TS represents the total scenario number. Consequently, the value
is calculated for each scenario to calculate a relative score for each scenario in the ranking process.
Finally, the value
is calculated to obtain the weighted compromise between the sum-based score and the product-based score for each scenario. In this process, we used α = 0.5 to represent that both components are equally important, ensuring a balanced compromise between the two aggregation approaches.
The CoCoSo components (
,
,
) are consequently integrated according to the following formulation to obtain the final CoCoSo score:
Having the for each scenario, the rank will be organized in descending order of the CoCoSo score. The best alternative (scenario) will be the one with the best CoCoSo score.
In conclusion, the proposed methodology offers a comprehensive and systematic approach to designing an efficient and sustainable medical emergency system tailored for traffic accident victims in Barranquilla. By integrating spatial analysis, cost evaluations, hypercube queuing models, Economic Value Added (EVA) calculations, and multi-criteria decision-making techniques such as AHP and CoCoSo, the methodology not only ensures the financial viability of the public–private partnership but also guarantees high-quality service. This framework provides valuable insights for policymakers and stakeholders, emphasizing the critical balance between operational efficiency, financial health, and equitable service delivery in emergency medical systems.
4. Results and Discussion
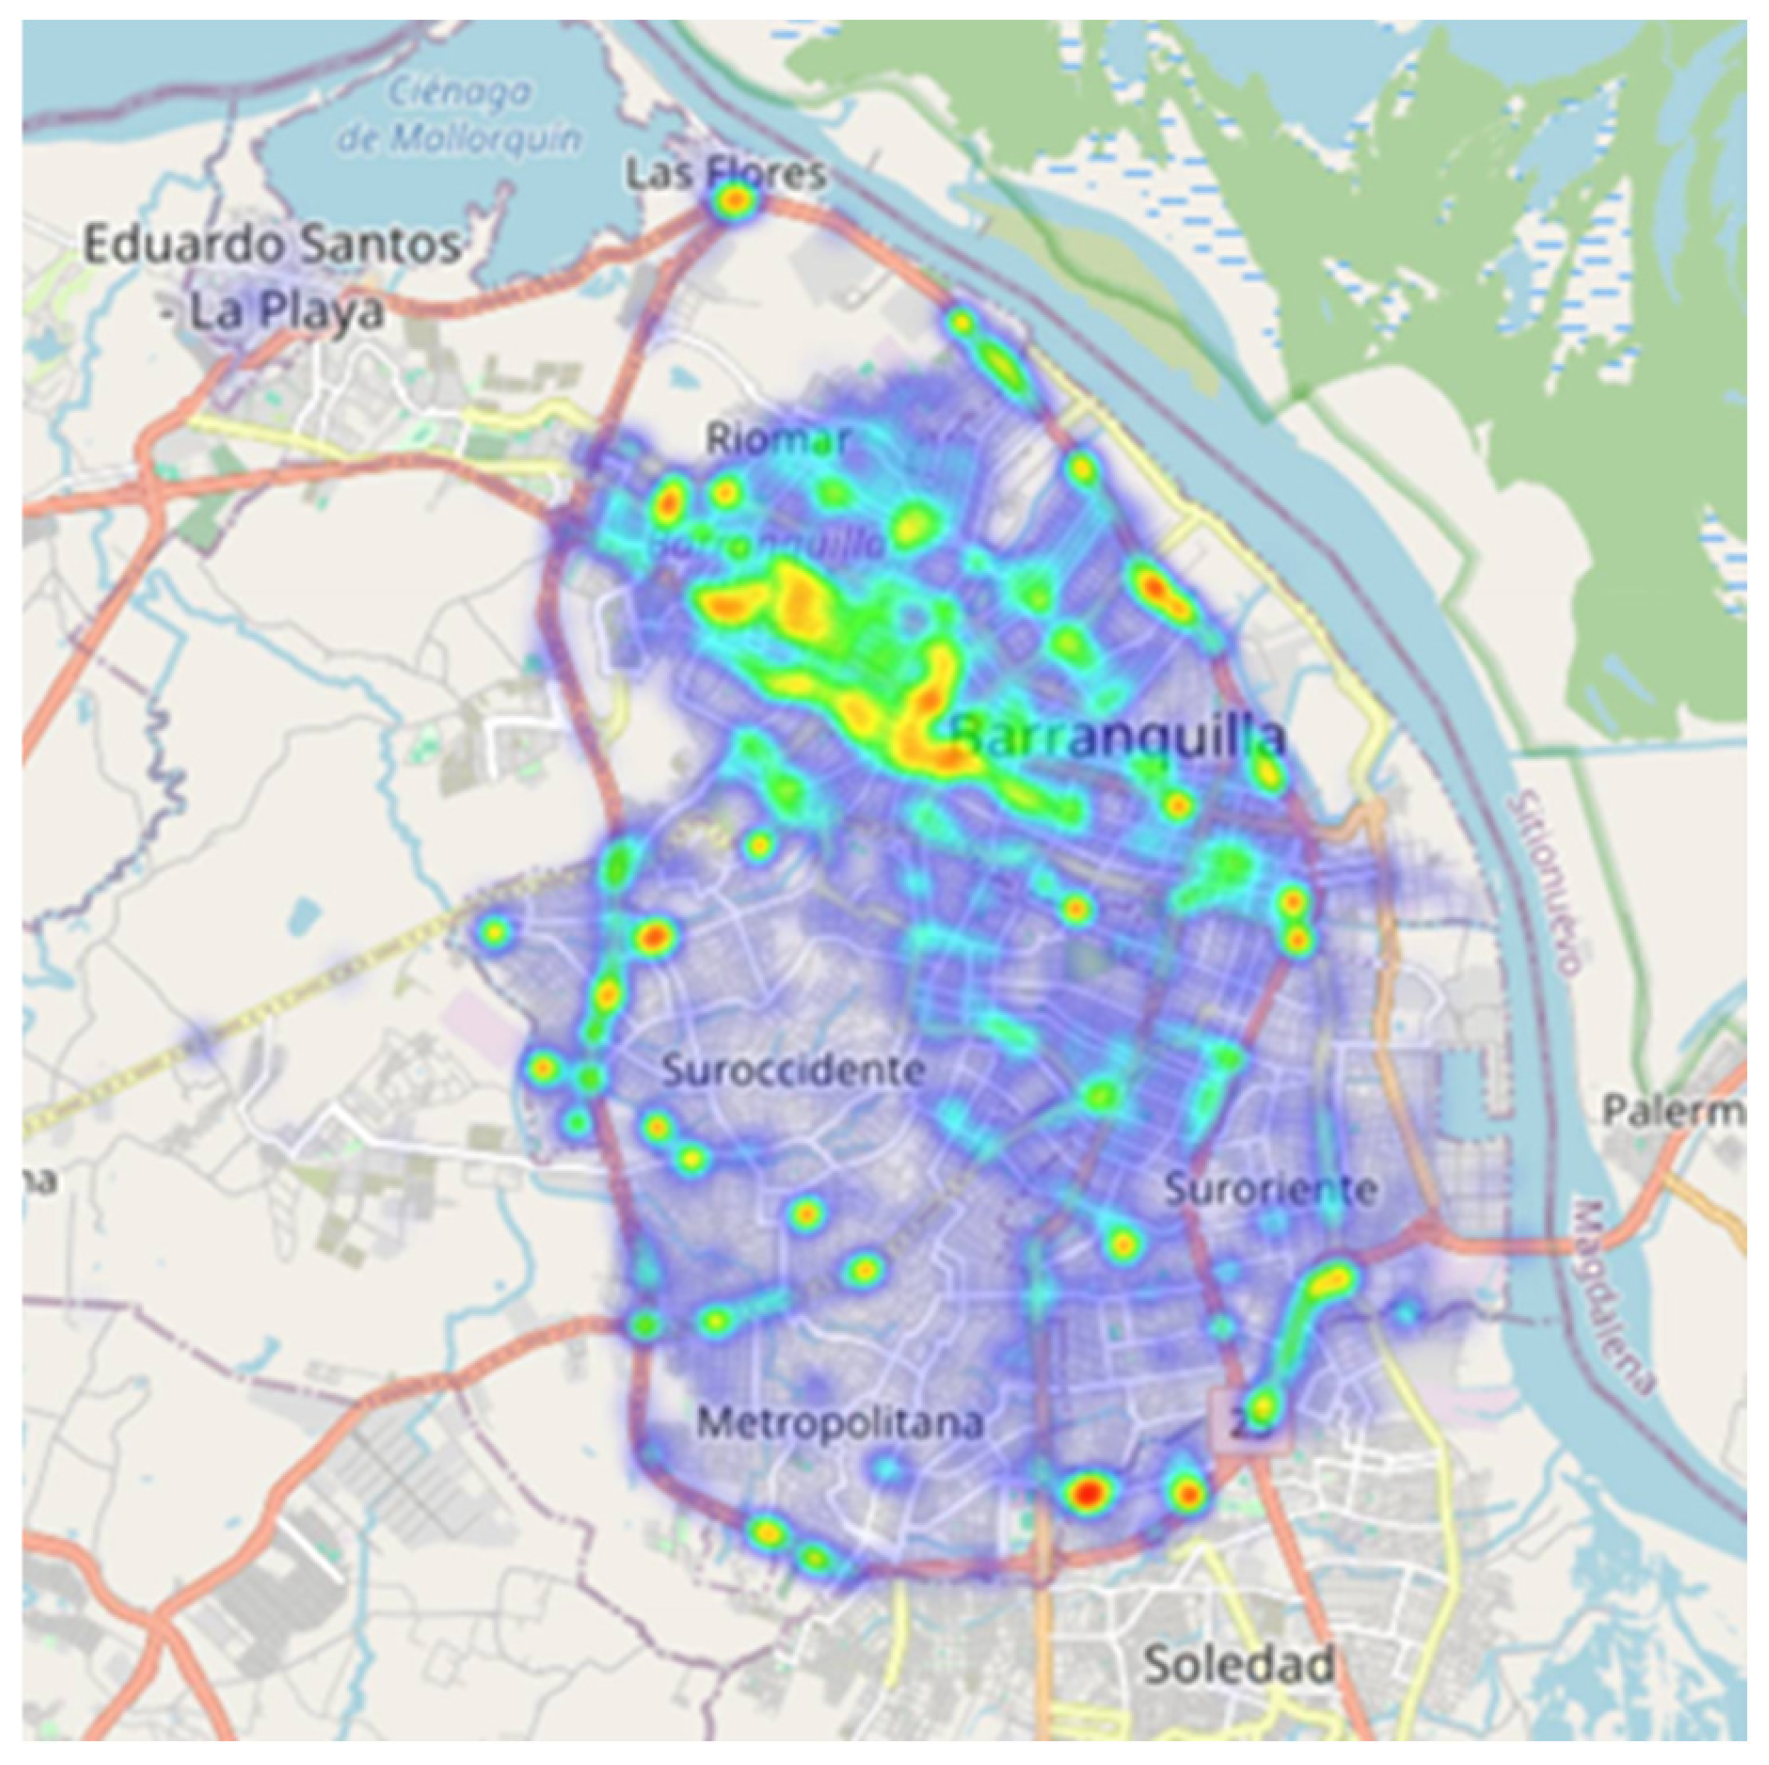
In the first place, data exploration was performed. This exploration was necessary for the initial understanding of the process. The first data exploration tool was a heatmap using the whole data series.
Figure 3 shows the heatmap corresponding to the EMS traffic accident calls during the full-time series in Barranquilla. It is essential to point out that this study delves into the city’s accident rate areas using a database spanning accident reports from 2015 to May 2022. The current decision-making processes lack the systematic rigor required for efficient ambulance location. Barranquilla lies in the Atlántico region’s northeastern corner, on the Magdalena River’s western bank, 7.5 km from its mouth at the Caribbean Sea. It has an area of 154 km
2. The city’s population is 1,274,250, making it the fourth most populated city in the country [
5].
This initial data exploration allowed us to determine the honeycomb distribution of demand (See
Figure 4), considering that the maximum response time within the demand zone is 7 min if ambulances are located in the center of the demand hexagon. Having configured these demand nodes, it was possible to determine call arrival rates
for each demand zone. The corresponding arrival rates can be found in
Table 2. To perform a sensitivity analysis, this table also shows the demand values for an additional demand level, assuming the current demand is increased (lambda increased). The table also contains the ambulance’s service rate (µ) in each demand zone.
The second step in the process is cost gathering. The costs listed in the methodology and the fee established by the presidential office to pay for this service were gathered. According to Manual Tarifario, SOAT is 667.800 COP (Colombian peso) [
63]. This amount is equivalent to US 160.
The next step in the process is implementing the hypercube queuing model to evaluate response time, coverage, and GINI metrics. In this sense, the model was implemented with two configurations; the first configuration assumes zero capacity waiting line, and demand that cannot be served will be lost. In the second configuration, an infinite-capacity waiting line is allowed. In both cases, people must wait for at most 15 min for the ambulance. In both cases, it is necessary to determine a priority table that considers the distance between the different demand zones. The list of priority ambulances to dispatch to each one of the demand zones can be found in
Table 3.
As it was mentioned before, the calculation of steady-state probabilities is computationally expensive and forced us to work with the AHQM proposed by Larson [
62].
This approach led us to similar results in the values of utilization factors for each server in the different scenarios. For example,
Table 5 shows utilization factors for heuristic and exact approaches.
It can be observed that the results are very similar to the approaches, validating the results obtained with the heuristic approach. The convergence threshold () was set to 0.0005 in the process. The heuristic approach was used in the regular and increased demand scenarios. These utilization factors were then used to calculate metrics such as mean response time, coverage, GINI, queue length, and waiting time in the queue. Then, the coverage value was used to calculate EVA.
From
Figure 5, it can be inferred that the behavior of the GINI coefficient obtains its lowest values when the number of ambulances is high. Nevertheless, this does not imply that the response time is increasing or decreasing; this only means that the response to the different calls is similar with low and high ambulance numbers. This could happen considering that the coverage condition limits the areas where the ambulance will be dispatched when having a small number of ambulances. Incorporating new regions in the process makes the response times vary a little more between the different calls, considering that a call that could be lost in a scenario with a small number of ambulances, now that more ambulances are available, will be served but maybe by an ambulance that is farther away, slightly increasing response time. When ambulances reach a specific value, there are a lot of ambulances in the system. Almost all points are reachable within the response threshold, and therefore, the GINI index reduces. On the other hand, coverage increases when the number of ambulances increases (See
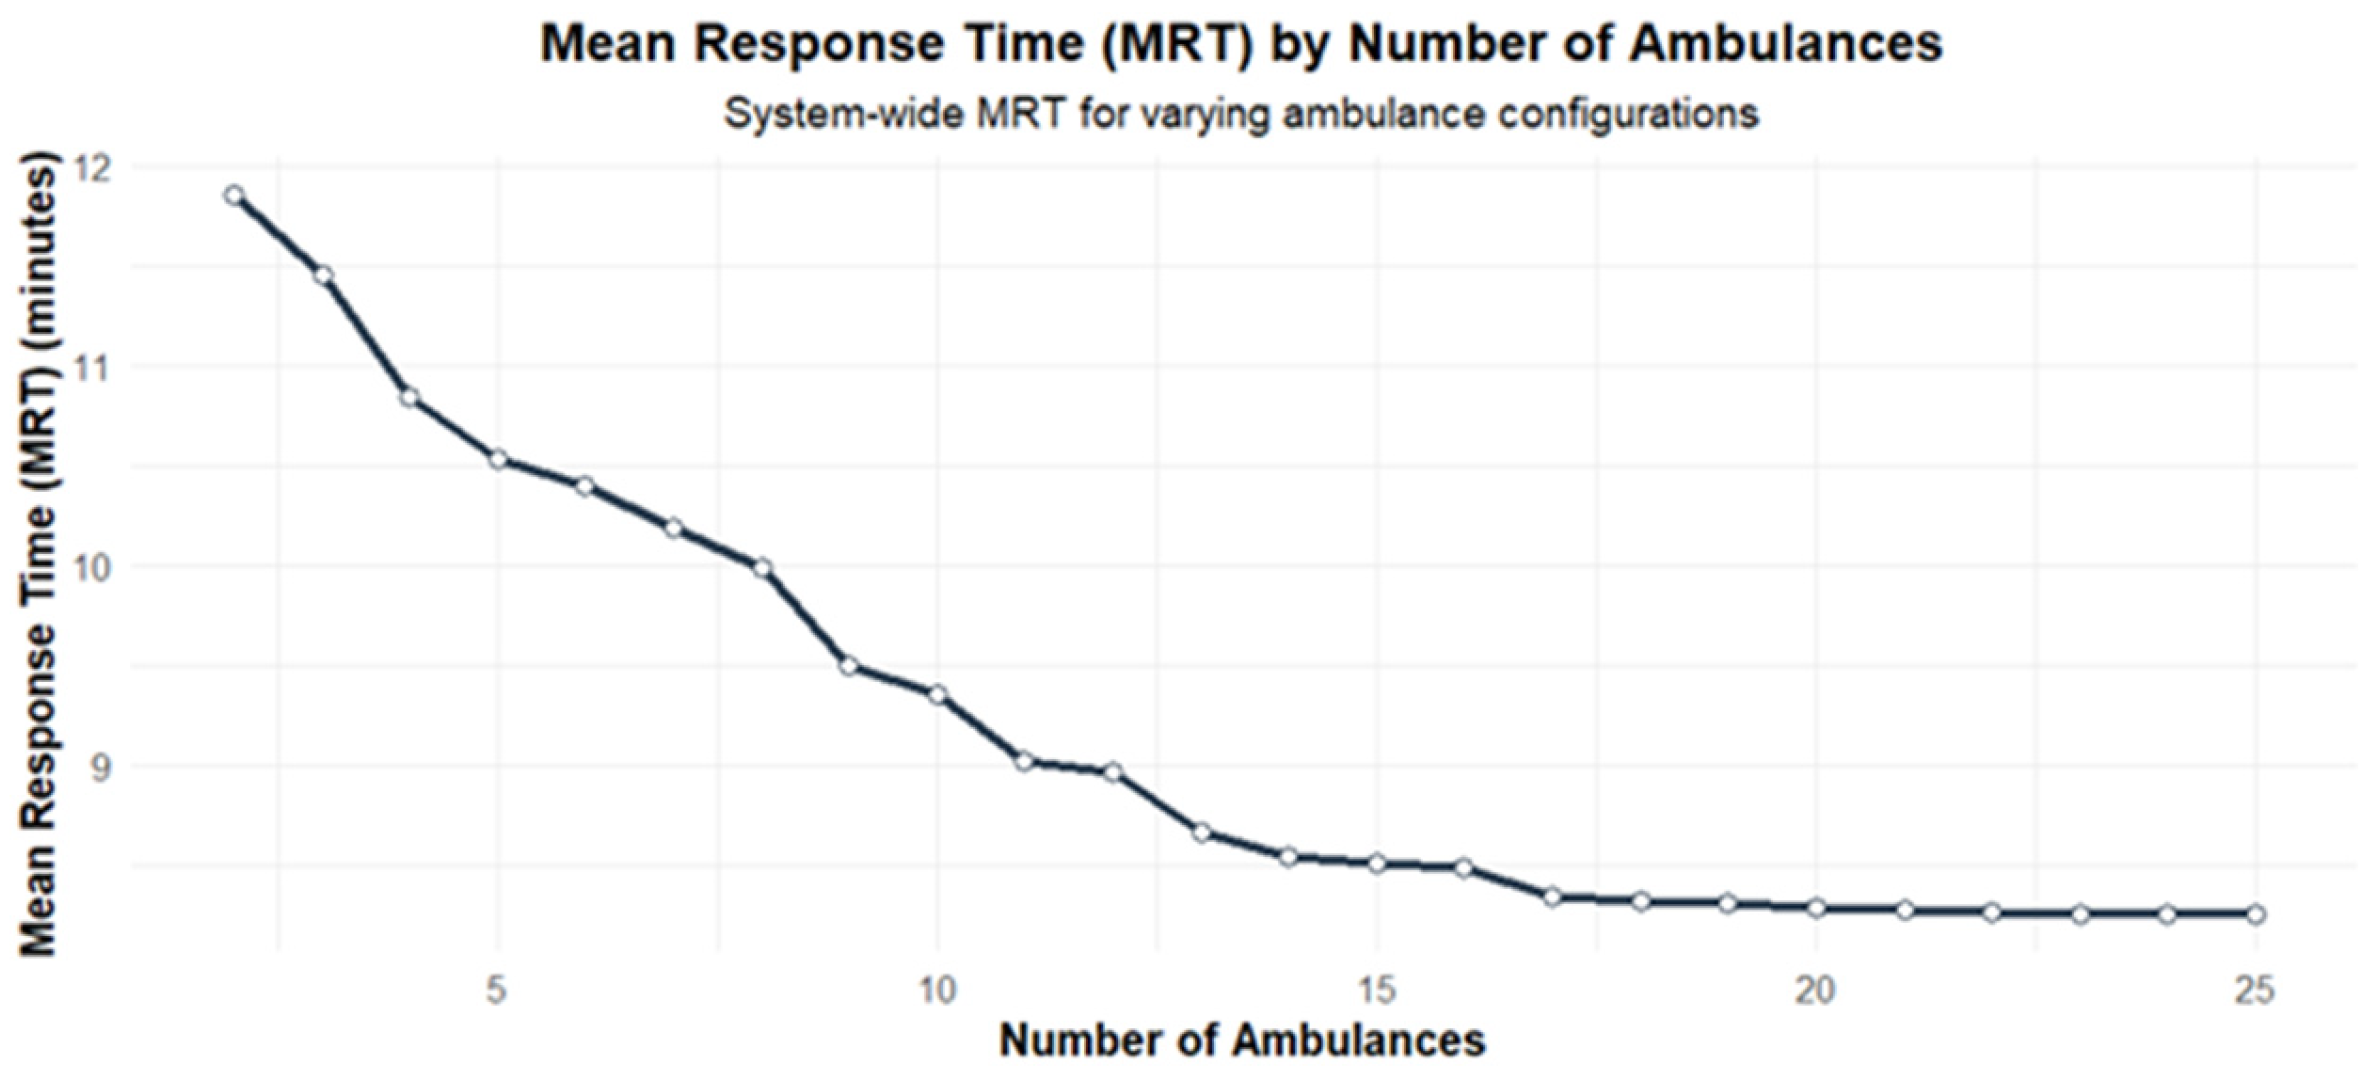
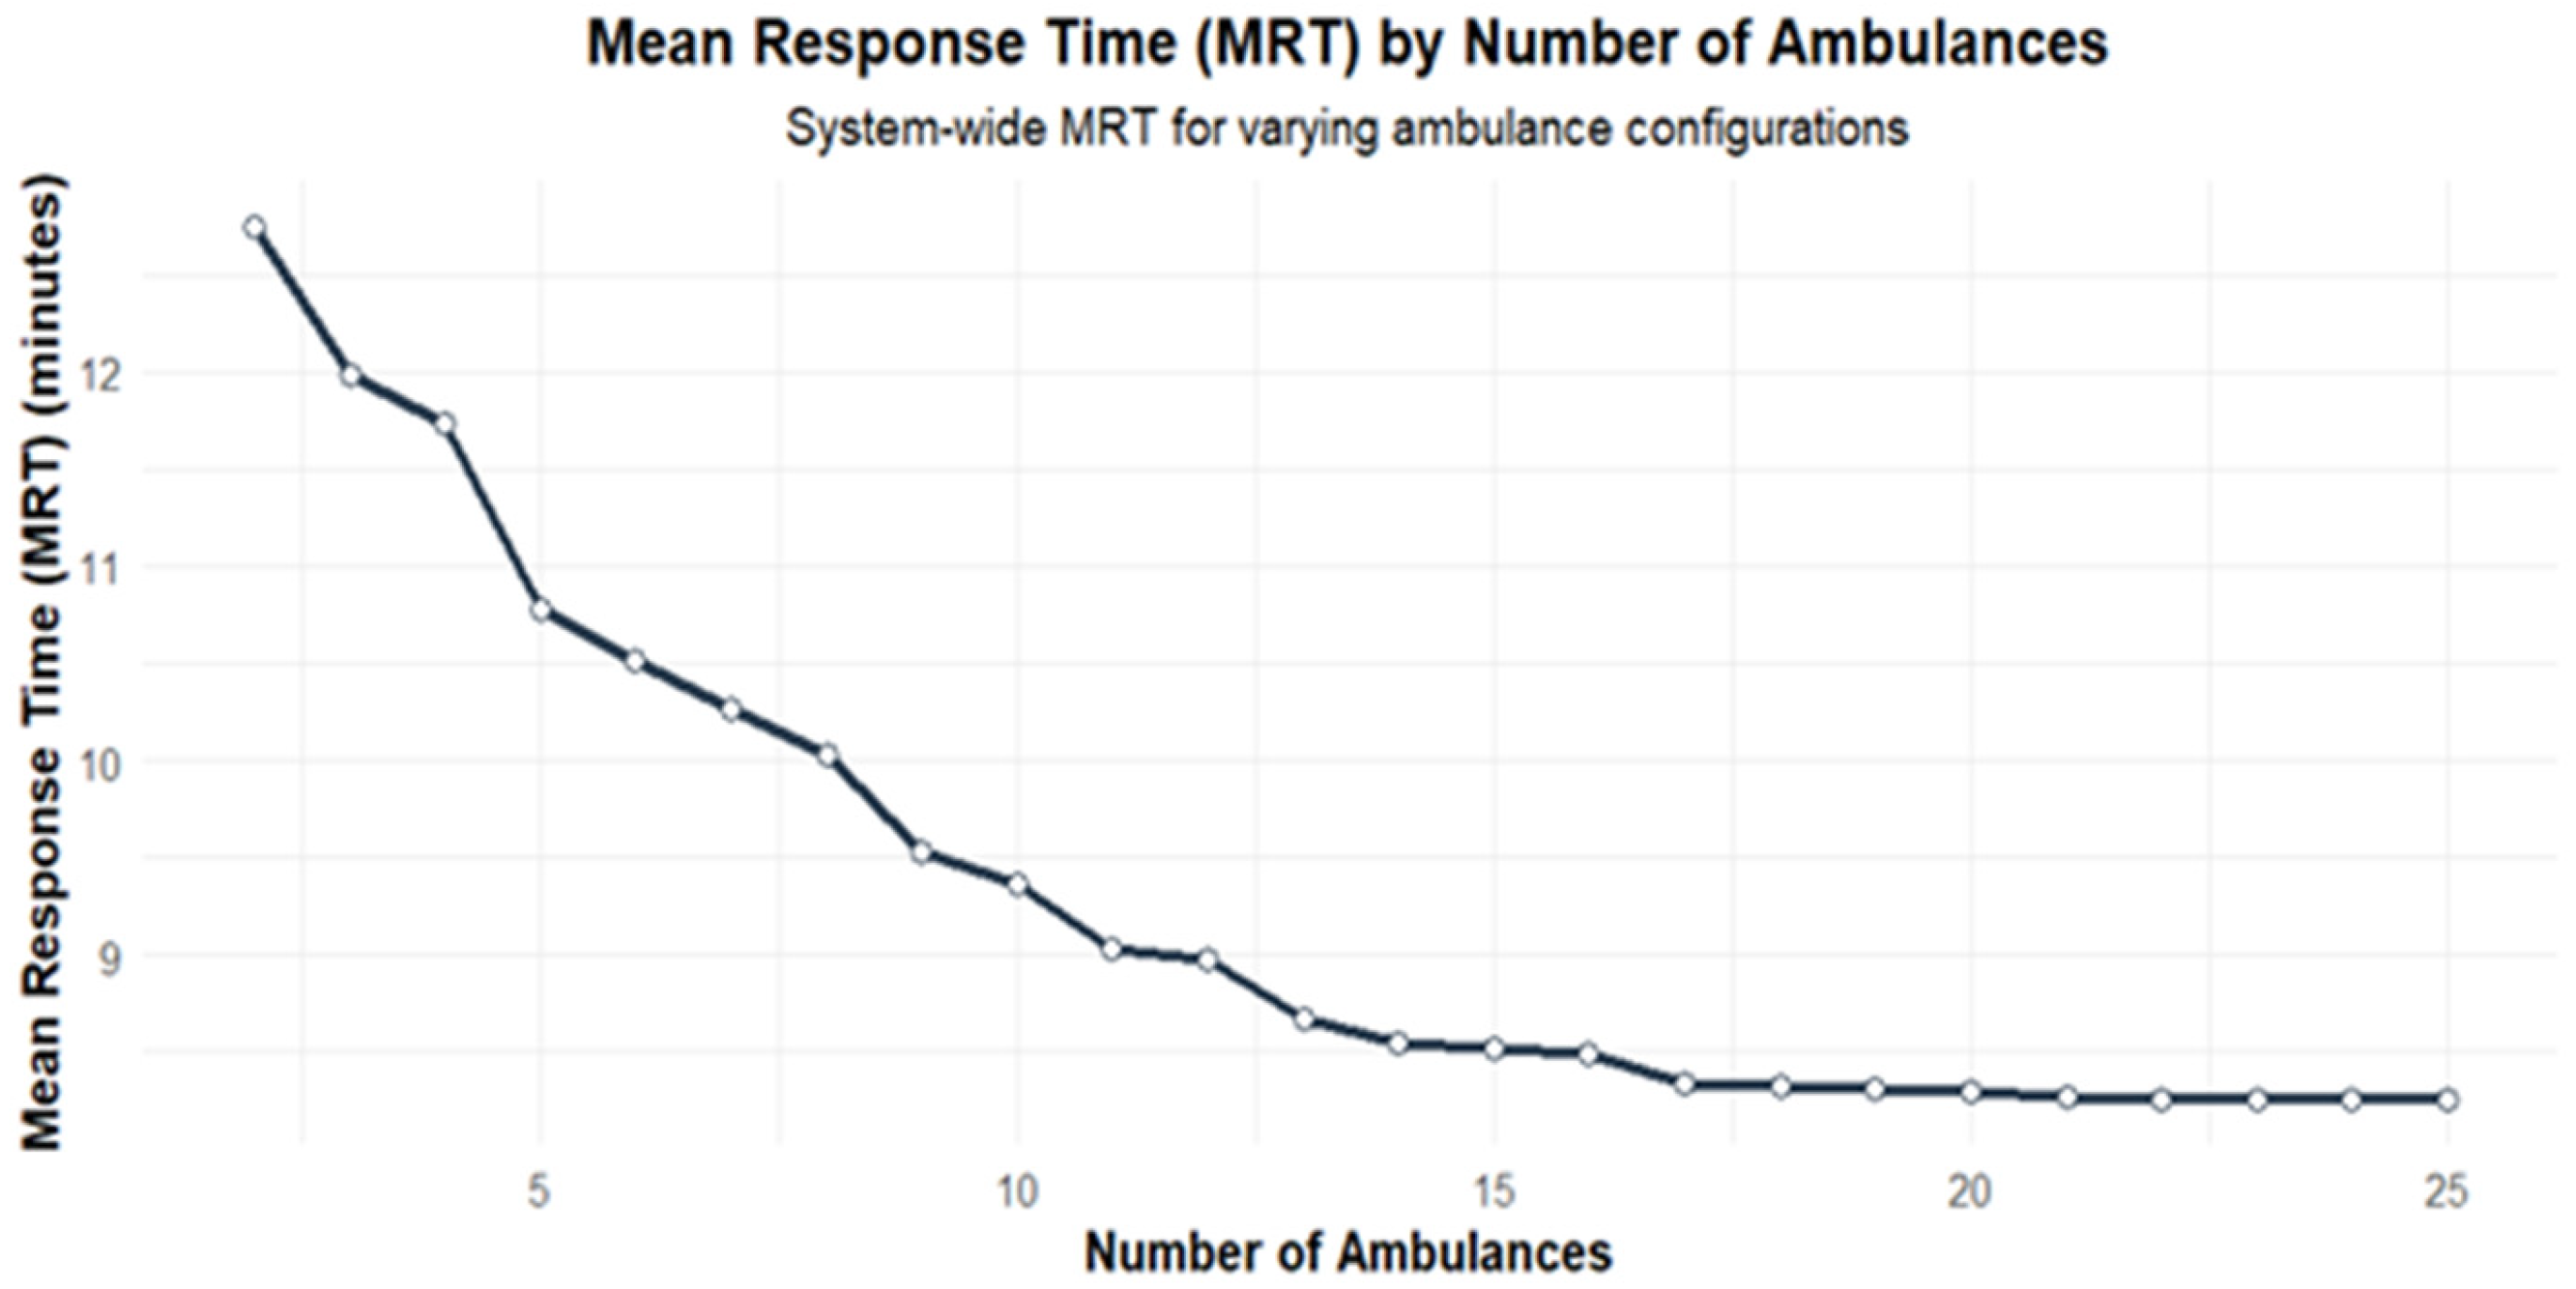
Figure 6). This is an expected outcome of the process. Nevertheless, in our case, this coverage is vital for social and financial outcomes because ambulance company income is a function of the number of services made, and income directly impacts EVA. Finally, response times are reduced when there are more ambulances, considering that it is more likely to have an idle ambulance close to the emergency call as shown in
Figure 7.
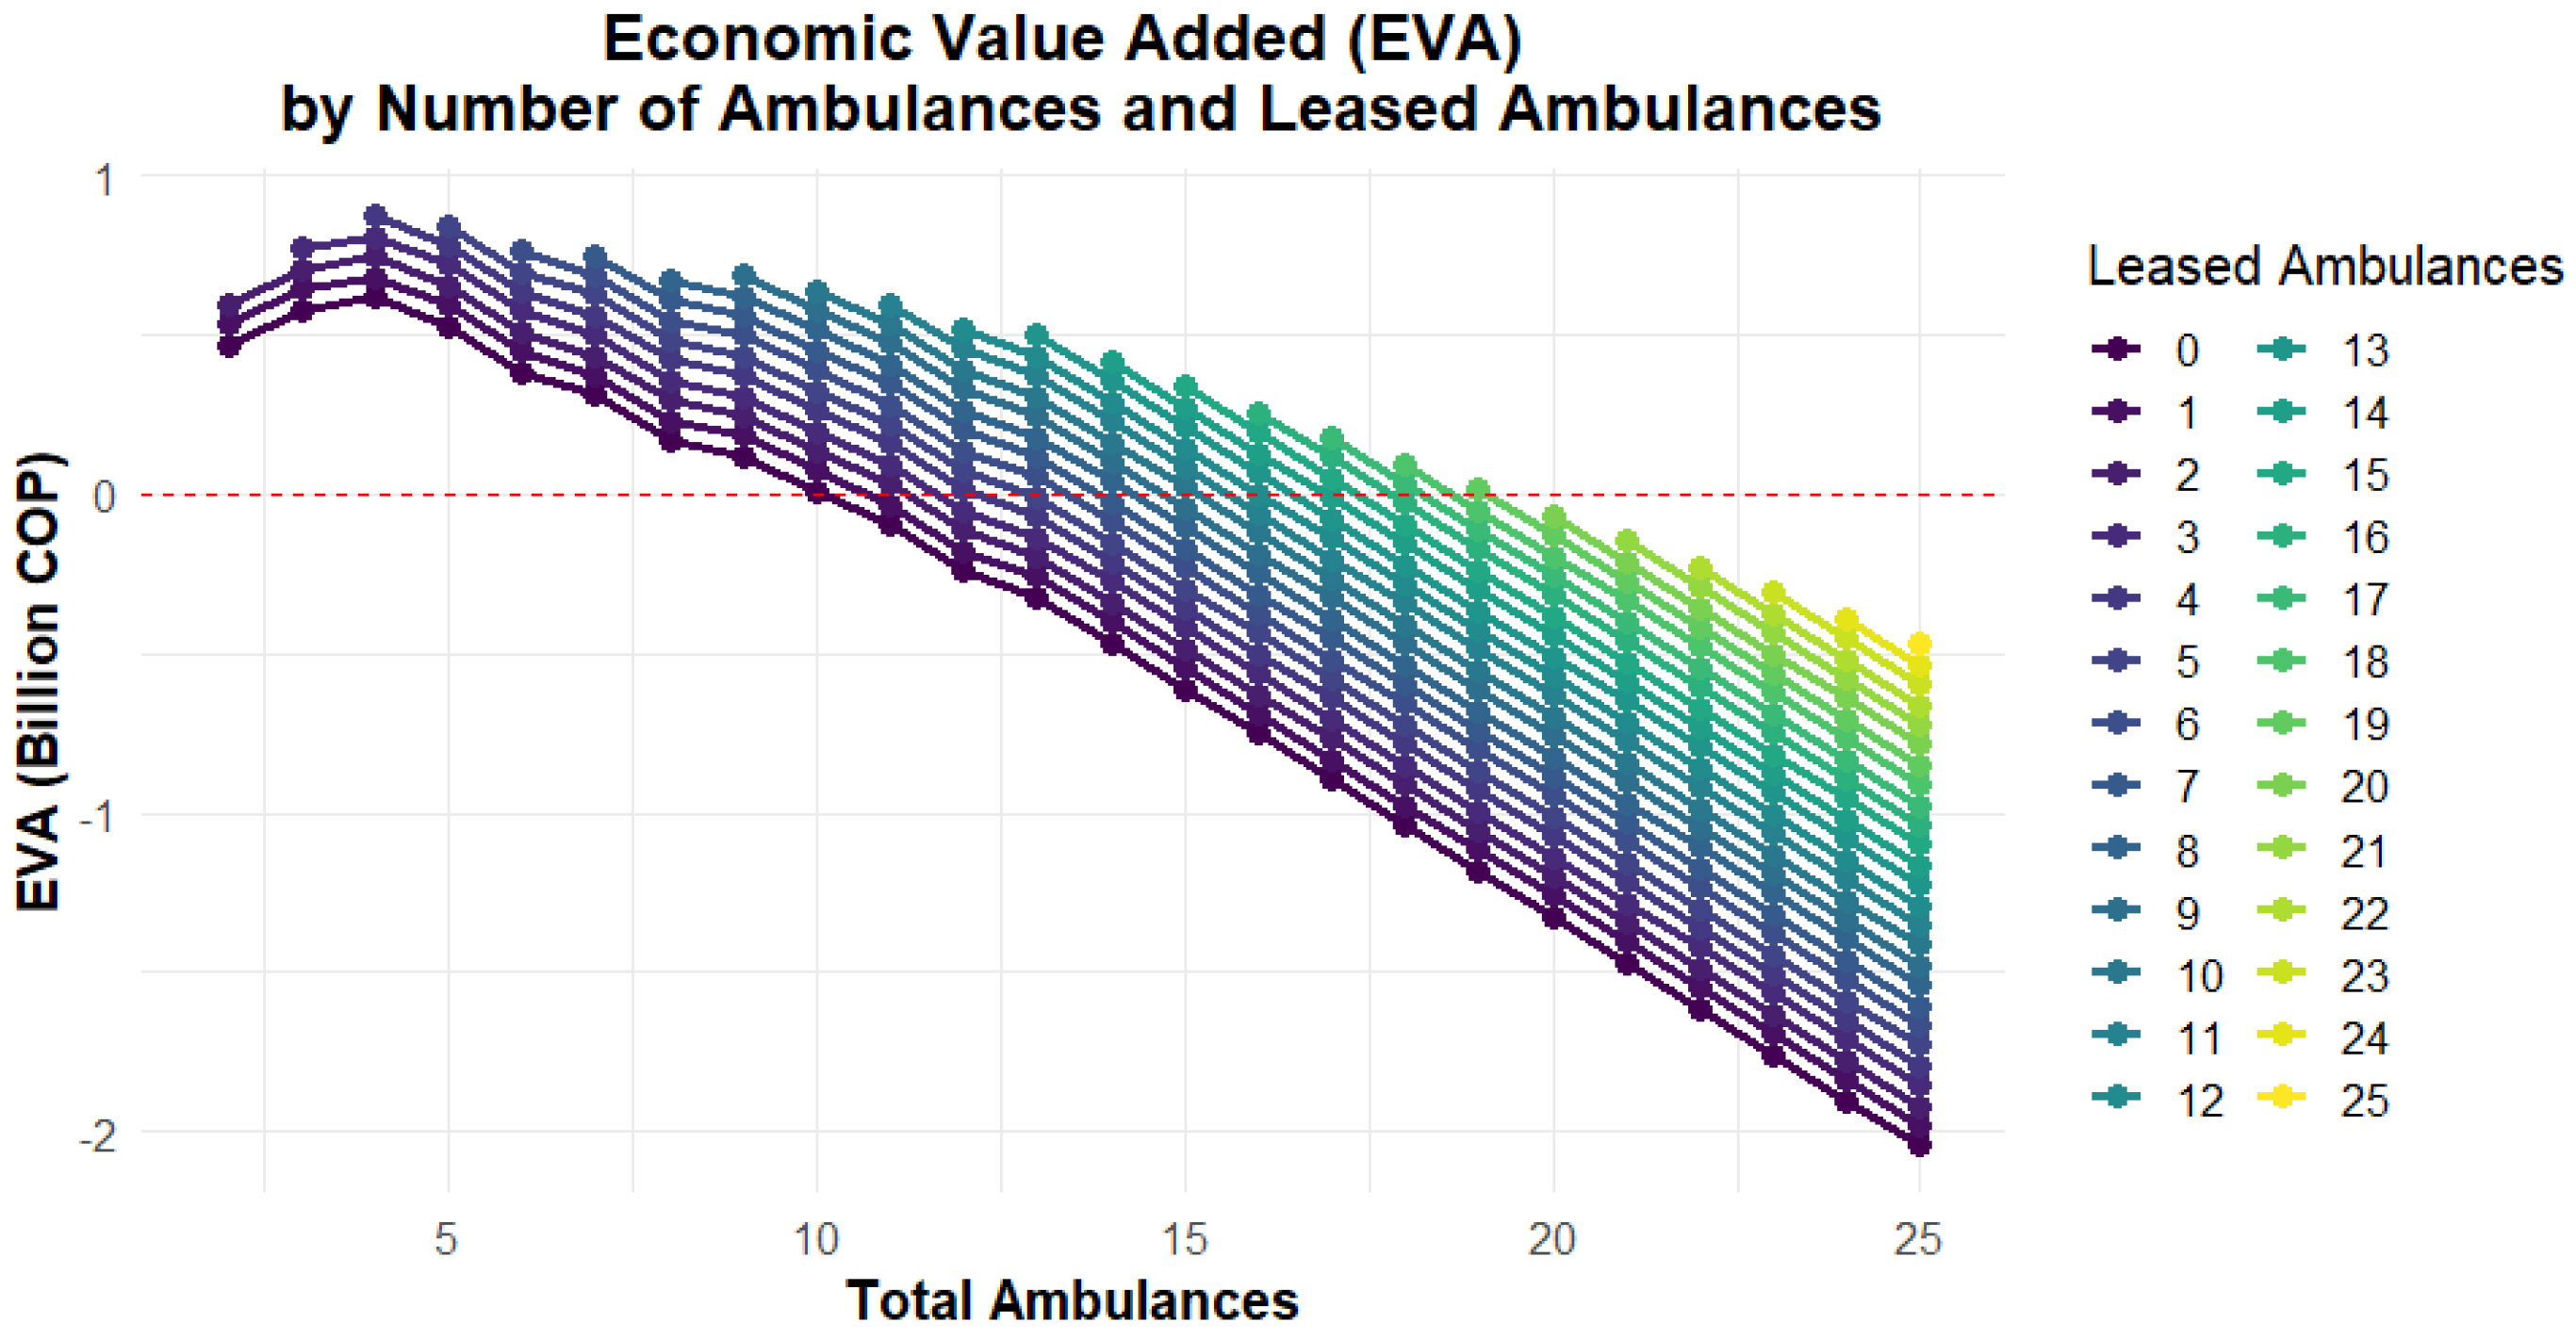
The values obtained for EVA can be observed in
Figure 8. This figure shows how the value of EVA increases to reach a maximum, and then it begins to drop progressively. It is essential to point out that this graph shows the zero EVA with a horizontal dotted red line. For the company and the PPP, EVA must be greater than zero. The graph shows EVA values greater than zero above this dotted line. Therefore, the viable scenarios are those above the dotted line. It can be observed that in these scenarios, there is a different number of leased ambulances. This is important for the long-term financial sustainability of the alliance. This financial sustainability will also impact the quality of service (response times, coverage, and GINI), considering that this financial welfare affects equipment maintenance, supplies inventories, and paramedic and doctor payments, among other factors that will affect the quality of service. In the case of our study case, the state needs to own these ambulances but assign their operation to a private company to guarantee better administration and asset preservation. Suppose the asset is maintained correctly once it finishes its service cycle. In that case, it can be assigned to a smaller town with less demand, which is unattractive for the private ally, so the state must fully operate the system in this new town but with lower investment. This could be possible if the ambulances are already amortized by the private ally in the first city with higher demand.
Our decision-making process is collaborative, weighing different criteria for the best solution. This process was facilitated by implementing a fuzzy AHP. We considered the perspectives of two ER physicians, one ambulance company manager, and a researcher in healthcare decision-making. The aggregation of their pairwise comparisons led to the following criteria weights (See
Table 6):
The previous weights were obtained with a consistency ratio of 1.54%. This value is well below the 10% threshold for the consistency ratio in the AHP [
65], indicating that the comparisons were made consistently and that the weights can be considered valid for decision-making. These weights will then be used in the CoCoSo technique to rank the different alternatives.
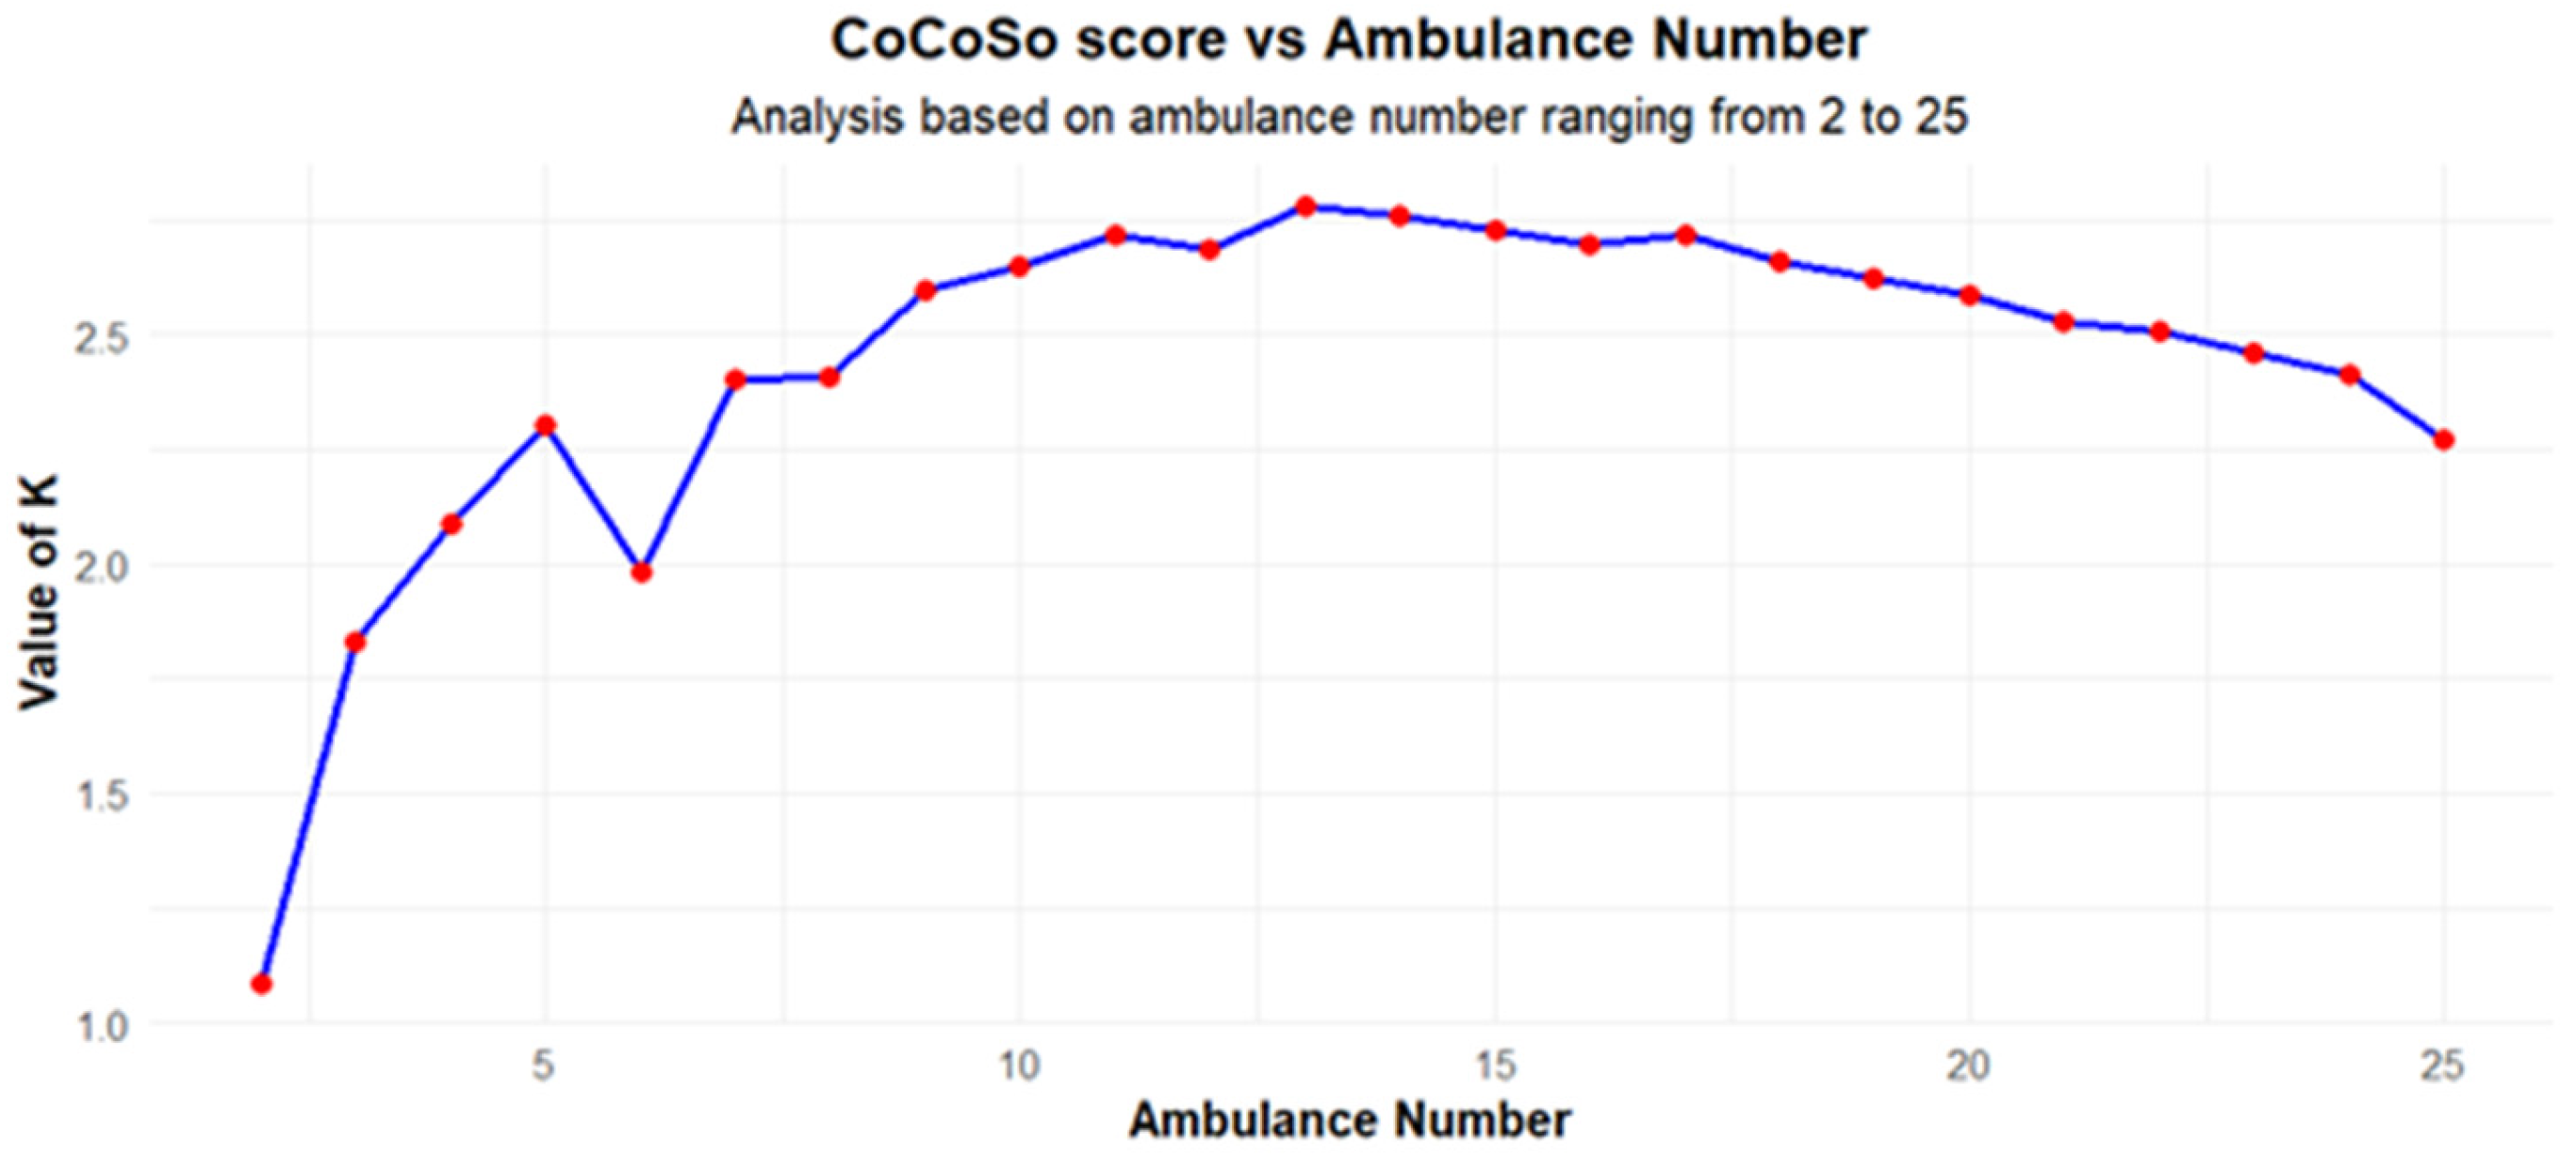
Figure 9 shows the CoCoSo curve considering different numbers of leased ambulances with current demand.
The EVA curve (
Figure 8) reaches its maximum value when there are four ambulances available and then starts to decrease progressively, reaching its minimum of 25 ambulances. Assuming an entire leased ambulance fleet, these scores were obtained to achieve the best EVA in each scenario and guarantee system sustainability. To make the best decision, it is necessary to account for the CoCoSo score and system performance requirements related to mean response time and coverage thresholds. These values were set as 15 min and 90% of calls. From
Figure 6, these values can be obtained with seven ambulances. The maximum CoCoSo score is reached with 13 ambulances. With this number, thresholds are met, and EVA has a good value that guarantees system sustainability. The number of ambulances could be increased even to 15, improving MRT and GINI, by decreasing EVA slightly. Additionally, it is essential to highlight that GINI is below 0.2 in all scenarios when having five or more ambulances. This value is a relevant performance considering that a GINI value below 0.2 is generally associated with high equity levels [
68]. However, the system will still have a good positive EVA to guarantee system sustainability. Nevertheless, it is relevant to highlight that positive EVA is reached with non-leased ambulances in scenarios of up to nine ambulances. If some of them are leased, the EVA will increase. This suggests that EMS planners in LMICs can strategically allocate limited resources while ensuring financial sustainability through a combination of leased and owned ambulances. This situation means that the best option is to work with 15 ambulances, all of them leased. Positive EVA will be reached in this scenario with eleven or more leased ambulances. This will help the system be more robust in case of an ambulance failure or a significant disaster.
To analyze the stability of the solution, a new set of scenarios with demand increased 2.5 times proportionally in each demand zone was generated. In this case, the primary outcomes of the process can be observed in
Figure 10,
Figure 11 and
Figure 12. It is essential to highlight that response time increases due to the waiting time in queue, considering that demand is 2.5 times higher compared to the first case. Now, response times are higher but still meet system requirements. Additionally, the higher demand helps to increase EVA. In this case, all scenarios have a positive EVA, regardless of the number of leased ambulances. In this case, the best CoCoSo value is obtained again with 13 ambulances. Nevertheless, considering that the CoCoSo profile curve changes, the decrease in the CoCoSo score is more moderate when the number of ambulances increases. In this case, it is relevant to highlight that the solution of 13 ambulances continues to be the best way to configure the system. This solution and the alternative solution of working with 15 ambulances are stable solutions that do not change despite the big difference in demand levels. While it is true that the CoCoSo curve changes, these changes are not so dramatic, and the curve maintains its profile. This makes it possible to consider more alternatives than just 13 or 15 ambulances, as in the first case. In this case, it is possible to work with all ambulances, considering that EVA would be positive with any ambulance number regardless of the number of leased ambulances.
Figure 12 and
Table 7 show that the CoCoSo score remains stable with a very low difference with 13 to 17 ambulances for increased demand. In this case, the gap between the best CoCoSo score and the alternative score is less than 5%. The best solution could be to work with 17 ambulances having 100% coverage, small GINI and response time values, and good EVA values. If the number of selected ambulances is 17, the mix between leased and owned ambulances could be adjusted to have a mix of 10 leased and seven owned ambulances by the ambulance provider. This solution results in a similar EVA value for 25 leased ambulances and, therefore, a similar CoCoSo score, considering that the MRT and coverage barely change when the ambulance number increases, and the weight of the GINI objective is small when compared to EVA, Coverage, and MRT weights.
On the other hand, according to
Table 7, CoCoSo scores are more stable around the optimum when working with current demand. Differences in CoCoSo scores range from 0 to 5% when 10 to 18 ambulances are in the system. Nevertheless, as mentioned before, the solution is stable despite the considerable increase in demand. The differences are slightly higher with increased demand (EVA increases) but still can be considered stable and have the same general behavior in the CoCoSo curve.
5. Conclusions
This study demonstrates the feasibility of adapting advanced methodologies, such as hypercube queuing models and Economic Value Added (EVA) analysis, to resource-constrained environments. By integrating financial sustainability with service quality metrics, the proposed framework serves as a robust decision-support tool for guiding public–private partnerships (PPPs) in low- and middle-income countries (LMICs) toward more efficient EMS deployment strategies. This research presents a comprehensive approach to designing and optimizing emergency medical service (EMS) systems, specifically tailored to address traffic accident emergencies in Barranquilla, Colombia. Leveraging Geographic Information Systems (GISs), hypercube queuing models, and multi-criteria decision-making (MCDM) techniques, this study enhances EMS efficiency, sustainability, and equity, offering a structured methodology for improving emergency response systems in similar urban settings. Through the following key findings, this paper provides valuable insights into the optimization of EMS systems, particularly in resource-constrained environments. This highlights the potential for EMS planners in LMICs to implement financially sustainable deployment strategies by leveraging a flexible mix of leased and owned ambulances, optimizing both service coverage and cost-effectiveness.
By applying hypercube queuing models, this study estimated the steady-state probabilities and busyness fractions of each ambulance under different system configurations. The results demonstrate that by carefully placing ambulances within demand zones and following a prioritized dispatch strategy, response times can be significantly reduced, ensuring that a majority of calls are served within the established 15 min threshold. Moreover, the progressive increase in ambulances improved overall system coverage, highlighting the relationship between the number of ambulances and enhanced service levels.
The inclusion of Economic Value Added (EVA) as a performance metric allowed for the evaluation of the financial sustainability of the EMS system when structured as a public–private partnership (PPP). This study showed that a combination of leased and owned ambulances maximized EVA, supporting long-term financial viability. The EVA profile revealed that scenarios with a mix of owned and leased ambulances, such as the configuration with 13 or 15 ambulances, provide a balance between financial sustainability and quality of service. This finding highlights the importance of PPPs in developing countries, where limited public resources may hinder the sustainability of fully state-operated EMS systems. In this sense, PPPs are vital for ensuring EMS sustainability. Incorporating financial leverage scenarios, such as leased ambulances, offers practical solutions for cities with constrained resources to maintain high-quality emergency services.
Using the GINI index allowed this study to measure equity in response times across different demand zones. The findings suggest that the system becomes more equitable as the number of ambulances increases, ensuring that all zones are served more evenly. This balance between equity and efficiency is crucial for EMS systems, particularly in urban settings where socioeconomic disparities may influence access to emergency services. This study’s equity consideration aligns with global efforts to reduce healthcare inequalities and ensure universal access to life-saving medical care. Nevertheless, in general, the results of the proposed approach yield a GINI coefficient value of 0.2 or less. This value is considered a good value and an indicator of equity in service. Additionally, this study highlights the inherent trade-offs between equity (GINI coefficient), efficiency (mean response time), and financial performance (EVA). These insights provide critical guidance for decision makers to balance competing objectives in EMS system configuration.
The integration of multi-criteria decision-making (MCDM) techniques, such as a fuzzy AHP and CoCoSo, proved to be effective in determining the best system configuration that balances response times, coverage, equity, and financial sustainability. By assigning weights to these criteria, this study provided a systematic way to rank different system configurations. The results suggest that the optimal number of ambulances for the Barranquilla case study is between 13 and 15 ambulances, depending on whether the demand increases. These results are adaptable to similar urban contexts, especially in developing countries facing challenges of limited EMS funding and infrastructure. Additionally, addressing the problem using a multi-criteria decision-making (MCDM) approach allows us to integrate all decision criteria and rank the available alternatives. This helps decision makers select the best overall option. If the top-ranked option does not meet the needs of all stakeholders in the public–private partnership (PPP), the ranking provides the opportunity to evaluate other alternatives in descending order until a solution that satisfies all PPP stakeholders is found. The process also gives the alternative to change the mix between leased and owned ambulances, considering its impact on EVA, required investment, and the CoCoSo score.
This study also explored increased demand scenarios, simulating up to 2.5 times higher demand than the baseline. Even under these conditions, the EMS system remained operationally efficient, although response times increased slightly. Notably, this study found that adding more ambulances could mitigate the effects of rising demand, with 17 ambulances providing an ideal balance between service quality and financial sustainability under higher demand. In this sense, it is also important to highlight that increased demand helps to increase partnership income and quality of service does not reduce at a critical level. The proposed approach also demonstrated scalability, considering that CoCoSo criteria were stable and valid for different demand values. The proposed decision-making framework also demonstrates adaptability, making it suitable for EMS system design in various urban contexts. Adjusting criteria weights and priorities allows tailoring to specific regional challenges, ensuring broader applicability.
This study offers practical recommendations for policymakers and EMS stakeholders to enhance the efficiency, equity, and sustainability of emergency medical services. Policymakers should leverage Geographic Information Systems (GISs) to strategically deploy ambulances in high-demand areas and regularly update demand maps to reflect changing population dynamics and traffic patterns. Adopting a hybrid model of leased and owned ambulances can provide financial flexibility and sustainability while maintaining operational efficiency. Equity considerations, such as prioritizing underserved areas and employing the GINI coefficient to monitor service disparities, should be integrated into EMS planning to ensure universal access to emergency care. Real-time data analytics should inform dynamic resource allocation, allowing ambulances to adjust locations based on current demand and traffic conditions. Preparedness for demand surges, such as during natural disasters or pandemics, can be achieved by maintaining reserve resources and scalable operations. Regular performance evaluations using tools like hypercube queuing models can help refine operational strategies, while periodic reviews of public–private partnerships ensure financial and service delivery goals are met. Community engagement initiatives and public education campaigns can further align EMSs with local needs and promote their efficient use. These recommendations highlight actionable strategies for developing effective EMS systems that balance operational efficiency, financial sustainability, and equity.
On the other hand, this study has different limitations that warrant consideration. The data used in the analysis influence the outcomes, particularly due to the operational characteristics of the system, the fee structures approved within it, and the observed demand patterns. While the Hypercube Queuing Model (HQM) is a robust tool, certain assumptions, such as homogeneous service times and fixed cost structures, may not fully capture the complexity of real-world EMS operations, potentially affecting the results. Additionally, the demand projections employed in this study rely on historical data and assumptions about future scenarios. Unforeseen changes in traffic patterns, population dynamics, or healthcare policies could render these forecasts less reliable. The financial viability of the public–private partnership (PPP) model assumes stable cost structures and consistent demand, which could be impacted by inflation, fluctuating operational costs, or policy shifts, thereby influencing the sustainability of such partnerships. Furthermore, the multi-criteria decision-making (MCDM) framework relies on predefined weights for criteria like response time, equity, and financial sustainability. These weights, derived based on stakeholder priorities, may vary across different scenarios and contexts, introducing a degree of subjectivity to the decision-making process.
Finally, this research contributes to the literature on EMS system design by integrating several advanced methodologies: hypercube queuing models, EVA calculations, GIS, and multi-criteria decision-making techniques. By evaluating different configurations of ambulance ownership and leasing, this paper provides a novel perspective on the financial sustainability of EMS systems in developing countries. Additionally, using equity measures such as the GINI index within the context of EMS systems adds a new dimension to the analysis of service quality, making this study relevant for policymakers aiming to optimize operational efficiency and fairness in healthcare access. Future lines of research include integration with stochastic demand, the uncertainty of weights in the AHP, dynamic strategies that adjust system parameters in real-time based on evolving demand patterns, traffic conditions, or disaster scenarios, and incorporation of additional fairness measures, such as the Theil index or the Atkinson index.


