1. Introduction
The rapid increase in urban population and resulting negative effects have demanded careful attention to the future of large urban centers, highlighting the need for new initiatives to address environmental and social challenges in cities [
1,
2]. In fact, concerns about degrading environmental conditions, social inequality, rising crime indices, long-term pollution, and urban mobility inefficiency, among others, have been recurrent in major urban areas worldwide [
3]. Moreover, with the intensive impacts of climate change in cities, these problems should be more stringent in coming years [
4,
5]. As a result, these challenges have fostered new perceptions of how urban services should be rethought and improved.
The aforementioned challenges have been central to the development of smart city initiatives, with recent efforts addressing various urban issues. Supported by an evolving technological landscape, smart cities are being promoted as a key resource for mitigating the negative impacts of urbanization and climate change, with green energy production and sustainable resource management gaining momentum [
1,
6]. While reducing greenhouse gas emissions and overall pollution remains crucial, urban mobility is also undergoing significant transformation driven by smart city initiatives, although many challenges persist in technological, governance, urban planning, and citizens acceptance domains [
7,
8,
9]. This transformation is paving the way for new advancements in urban transportation, with cycling receiving increased attention recently.
Sustainable transportation has been largely promoted as a way to alleviate some of the negative effects of urbanization, while also promoting better ways of living [
10,
11,
12]. In this scenario, cycling has being regarded as an environmentally sustainable and health-conscious mode of transportation, becoming increasingly popular among urban commuters [
13]. Despite these benefits, the safety of cyclists on city streets remains a critical concern, especially as accidents become more prevalent [
14,
15]. Actually, complex road networks and heavy traffic are some of the most common threats to cyclists, which have demanded more attention from the governments when planning and developing safer cycling infrastructure [
16,
17].
There are numerous risk factors associated with cycling accidents. Reckless behavior and failure to obey traffic signals can lead to accidents of varying severity, being then a common target of governments to improve safety [
18]. In parallel, the presence of proper cycling infrastructure, such as dedicated bike lanes, is also linked to enhanced safety [
19,
20]. Yet, accidents still occur, underscoring the necessity for efficient emergency response systems. Access to prompt medical treatment and rescue services is indeed crucial following cycling accidents.
When cyclists are moving in a city, a critical element is the choosing of the route to follow [
21,
22]. The route selection procedure can be performed in a more strict way, indicating a segment-by-segment path to follow from an origin to a destination, or it may highlight areas to avoid or approach with caution, identified as danger zones. Selecting of safer cycling routes concerning existing infrastructure is also possible [
23,
24], as well as the computation of an index of bikeability when suggesting proper routes [
25]. In all these cases, open data can be exploited to augment the general quality perception of a route. Some researchers have been studying and developing data-driven methods for such processing tasks, for different parameters, although most proposals have centered on data that are not publicly or easily available for every city, potentially constraining their practical adoption [
26,
27].
Therefore, considering the increasing availability of open geospatial data, we propose an innovative methodology that extracts valuable information from a previously computed dataset in order to guide safer cycling. Such a dataset defines a spatial urban risk perception according to the existing emergency response infrastructure in a city, which is computed by the CityZones tool [
28]. An emergency response infrastructure is any public service that will have some utility during an urban emergency, which may be a traffic accident, a gas explosion, the fall of a tree, flooding after heavy rains, or any critical event that negatively affects the inhabitants. The nature of each of these infrastructures, referred as a Point of Interest (PoI), will vary considerably among cities, but it is reasonable to expect that hospitals, police stations, fire departments, Emergency Medical Services (EMS) centers, emergency shelters, disaster response centers, and metro stations will be common types of PoIs in modern cities.
When concerning cycling accidents, which are a type of urban emergency [
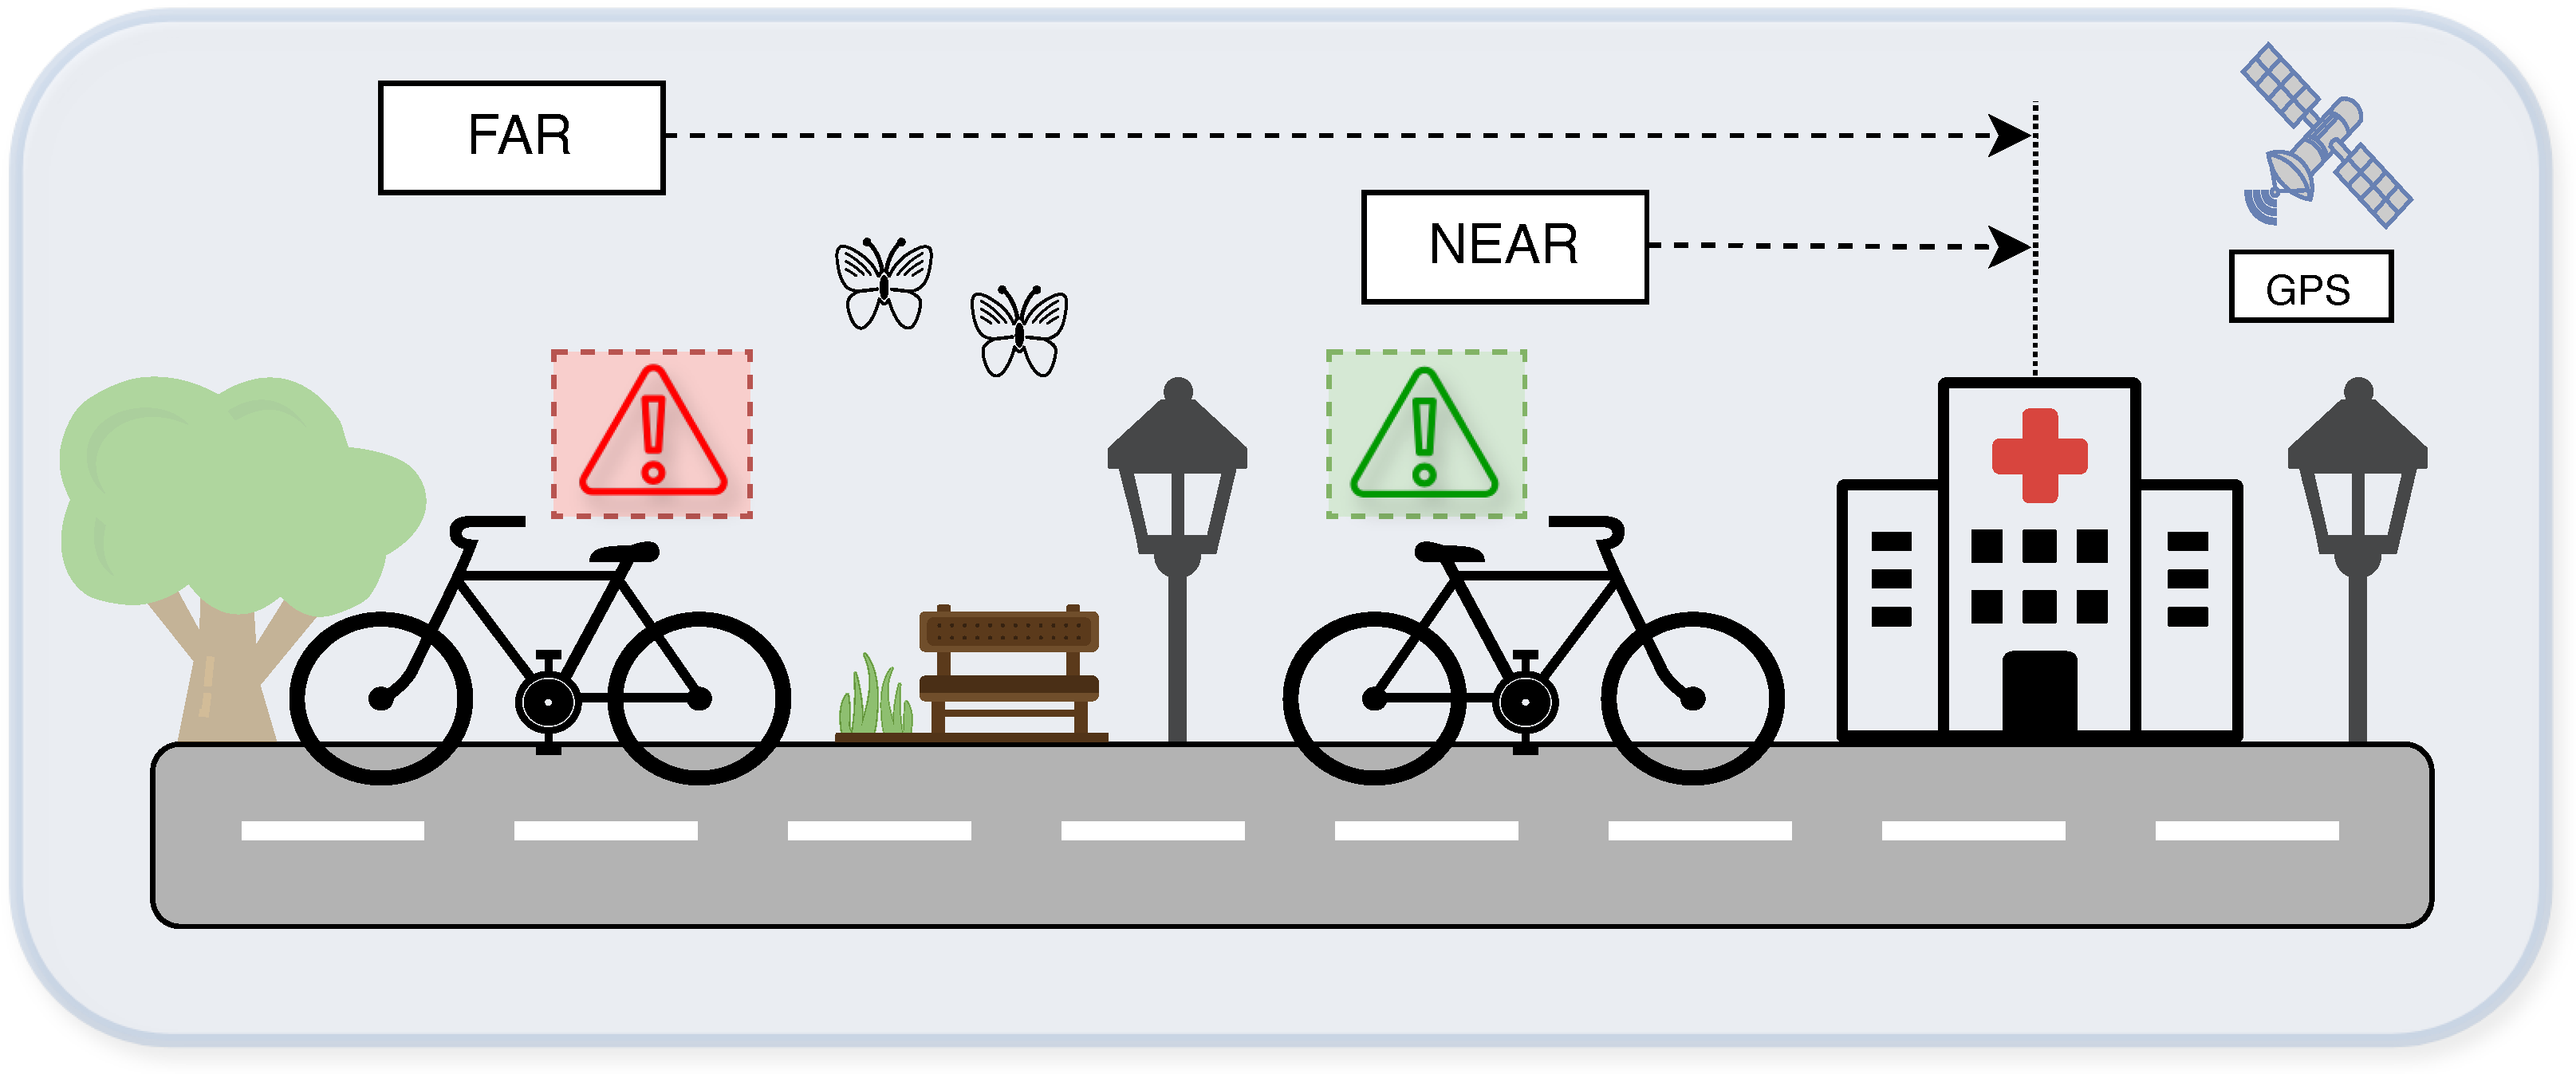
29], some PoIs may be more relevant when attending victims (cyclists, drivers, and pedestrians) and relieving indirect consequences resulted from increased traffic that could lead to a chain of accidents. Among them, hospitals, EMS centers, and transit agents stations will be PoIs with higher relevance. Taking these types of infrastructure into account, cyclists might be alerted when they are far from those PoIs, since it will take longer, on average, to be assisted after an accident. Doing so, we exploit a data-driven risk assessment approach to provide a particular perception of bikeability centered on how bad it would be if a cyclist suffers an accident. Actually, we are not concerned in avoiding an accident, but only in identifying regions that provide the worst average response when an accident already occurred, alerting a cyclist to be more careful when moving through such regions. Such a bikeability index in the form of a risk factor is dynamically computed on each bicycle by our proposed embedded system.
This article defines a new approach composed of two main blocks: an offline preprocessing algorithm designed to reformat an urban risk map exported by the CityZones tool [
28], referred as the Preprocessing module, and the SafeCycling embedded unit that dynamically processes GPS positions against that risk map to generate visual and audible warning signals. A prototype of this embedded unit was developed around the Raspberry Pi Zero board, along with auxiliary hardware components. Our solution computes risk levels locally as the cyclist moves, leveraging the proposed preprocessing algorithm that efficiently reorganizes geospatial data, then supporting the emission of quick alerts on short periods. A proper 3D-printed case was also developed to allow easy attachment of the SafeCycling unit onto a regular bicycle. All developed codes and models are provided at an open repository to support easy reproduction.
In summary, the contributions of this article are described as follows:
Multi-domain data exploitation for smart cycling: Most works in the literature that have proposed quality assessment solutions for cycling infrastructure are based on more direct parameters, usually associated with the existence of proper bike lanes [
16,
30,
31]. However, we believe that cycling quality assessment can also be performed by leveraging different smart city data. Our approach then presents a practical solution of cycling risk assessment based on data extracted from open datasets and then properly processed as geospatial risk indexes, reinforcing the importance of open datasets in smart cities;
Data formatting for large irregular maps: While data from multiple domains may be valuable when assessing cycling patterns, their structure may turn data searching into more time-consuming tasks. This is particularly true for large maps with geospatial metadata. Our approach proposes a flexible data indexing algorithm that allows reformatting of maps of any polygonal shape, particularly benefiting quick searching by resource-constrained hardware. This type of map-centered preprocessing based on the computation of efficient matrix-like indexes had not been approached before;
Implementing a low-cost system for cycling alert: The use of smartphones to convene useful information to cyclists is a common approach, but with some well-known practical limitations [
32,
33]. An alternative is embedding computational capabilities into low-cost systems that can be directly attached to bicycles. In this sense, although this embedding concept is not new, this article contributes to a practical implementation, which is openly accessible at
https://github.com/daniel-gcosta/SafeCycling (accessed on 1 June 2024), being easily reproducible.
Finally, to enable a more comprehensive validation of our approach, we conducted a case study in Porto, Portugal. This study demonstrates the practical implementation and effectiveness of our proposed solution, which is expected to be suitable for any city worldwide given a proper CityZones risk map.
The remainder of this article is organized as follows.
Section 2 presents some related works in the area of emergency management in smart cities. Fundamental definitions are present
Section 3.
Section 4 presents our proposed approach, while
Section 5 details the performed experiments and the achieved results. Then,
Section 6 presents our discussions and outlines research trends when exploiting our approach in real scenarios. Finally, conclusions and references are presented.
2. Related Works
When pursuing safer and more sustainable cycling in smart cities, different strategies might be adopted. With the advent of new technologies and data processing algorithms, new possibilities have emerged, opening up optimization opportunities in various fields. In recent years, approaches utilizing diverse software and hardware have shown varying levels of success, leading to the development of new smart cycling solutions relying on smartphones, smartwatches, embedded systems on bicycles, fixed sensor-based stations, drones, and more [
12,
13,
34]. All of these initiatives aim to promote cycling as a sustainable, eco-friendly, safe, and reliable mode of transportation, encouraging the adoption of bicycles as a regular mobility alternative in our cities.
Since cycling can be enhanced from various perspectives, recent works have focused on addressing specific challenges using a range of technological resources. Consequently, solutions based on embedded sensors, smartphone-based crowdsensing, geospatial urban planning, visual data processing by artificial intelligence, mobile communications, and smart city integration, among other trends, have emerged with promising outcomes [
35,
36]. However, despite the remarkable number, complexity, and results of these recent solutions, challenges related to affordability, communication requirements, and energy autonomy persist. In these scenarios, we have focused on works that address cycling safety through different approaches, considering both the safety of cyclists while moving and the risk conditions of routes and selected cycling lanes.
The first important aspect that has been considered is accident mapping, prevention, and mitigation. In a nutshell, a cycling accident can be perceived as a type of urban emergency, with several works addressing emergency detection, alerting, and mitigation [
29,
37]. Among them, mitigation is related to rescue and medical assistance after an emergency happens, with different complexities to be handled [
38].
An important factor of emergency mitigation is risk assessment. The idea is to assess the potential threats and vulnerabilities that cities face, while also taking some particularities provided by auxiliary systems like the Geographic Information System (GIS) [
39,
40,
41]. In this sense, risk can be associated with the potential of negative consequences during critical situations, or more specifically, to the average efficiency of mitigation actions after a cycling accident occurs. Actually, for more specialized risk assessment in any city, a lot of urban parameters may be taken into consideration [
28,
42].
Another recent development trend is the integration of computational capabilities into bicycles for sensing, communication, and alerting procedures. With the advancement of the Internet of Things (IoT) paradigm and the concept of data-driven smart cities, embedded hardware platforms are being used within urban environments to support sensing and controlled actions. This trend has been also seen in bicycles [
43,
44] and associated cycling infrastructure [
45,
46], enriching the overall cycling ecosystem with a myriad of computational resources.
Upon conducting an extensive review of literature in this broad field, it was possible to identify several relevant works that could support the development of our approach in various ways. In fact, a significant trend identified in recent years involves integrating sensors and cameras into diverse devices, which has supported advancements in smart mobility through embedded systems. However, despite the promising benefits when equipping bicycles with embedded capabilities, including traditional and e-bikes, there remains an underexplored area in the adoption of GIS-based electronic solutions specifically designed for bicycles. These solutions hold considerable potential benefits when enhancing cycling safety in urban areas. In this sense, our proposed approach aims to address this research gap by focusing on enhancing the integration of a GIS-based assessment approach into bicycles, in real time, thereby optimizing safety, efficiency, and usability across urban environments.
Table 1 summarizes recent works that aim to improve the cycling experience, mostly centered on cycling safety and route planning. Although the concept of cycling experience may comprise several parameters that are also related to comfort and cycling pleasure [
47], we are concerned with parameters that are more related with the proposed approach for comparison purposes. In this way, we have defined three comparison reference groups in this section: G1 for quality assessment of bike paths and cycling infrastructure, G2 for route planning and selection, and G3 for cycling safety.
Therefore, despite the availability of GIS databases and IoT-based embedded systems, it is reasonable to say that there are still improvements to make when leveraging these technologies for safer cycling, ranging from data acquisition challenges to actual processing on low-cost hardware platforms. For the proposed approach, a key contribution is the local knowledge of each city represented by an embedded risk map generated by the CityZones tool and processed by our preprocessing algorithm. In other words, while our solution is generic and suitable for any city, local knowledge of the target is the key element for risk assessment. This knowledge is a fine-tuned perspective of a city in terms of risk assessment and response to emergencies, which is a service not provided by previous works.
3. Materials and Methods
The growth of digital map databases that provide geospatial data on ground features has led to many new applications, especially in smart city projects [
57,
58]. One of these solutions is OpenStreetMap (OSM), a crowd-sourced geographic information resource. OSM offers free access to maps that can be viewed, queried, downloaded, and edited without copyright restrictions. Through spatial analysis capabilities, GIS databases enable the extraction of valuable information, aiding informed decision-making in urban planning, resource management, and infrastructure development. Overall, by providing a robust foundation for data management and analysis, GIS databases are essential in enhancing the efficiency and effectiveness of smart city initiatives in multiple ways, thus being the cornerstone of our approach.
Based on the OpenStreetMap, the CityZones tool [
28] was created focusing on the concept of Points of Interest (PoI), notably hospitals, police stations, and fire departments. Each PoI serves as an “emergency response center” in a city, and almost every city in the world has some of these PoIs. Since the resilience of an area within a city can be linked to the presence and distances to these response centers [
59], cycling safety can be associated with this indirect urban perception of risk.
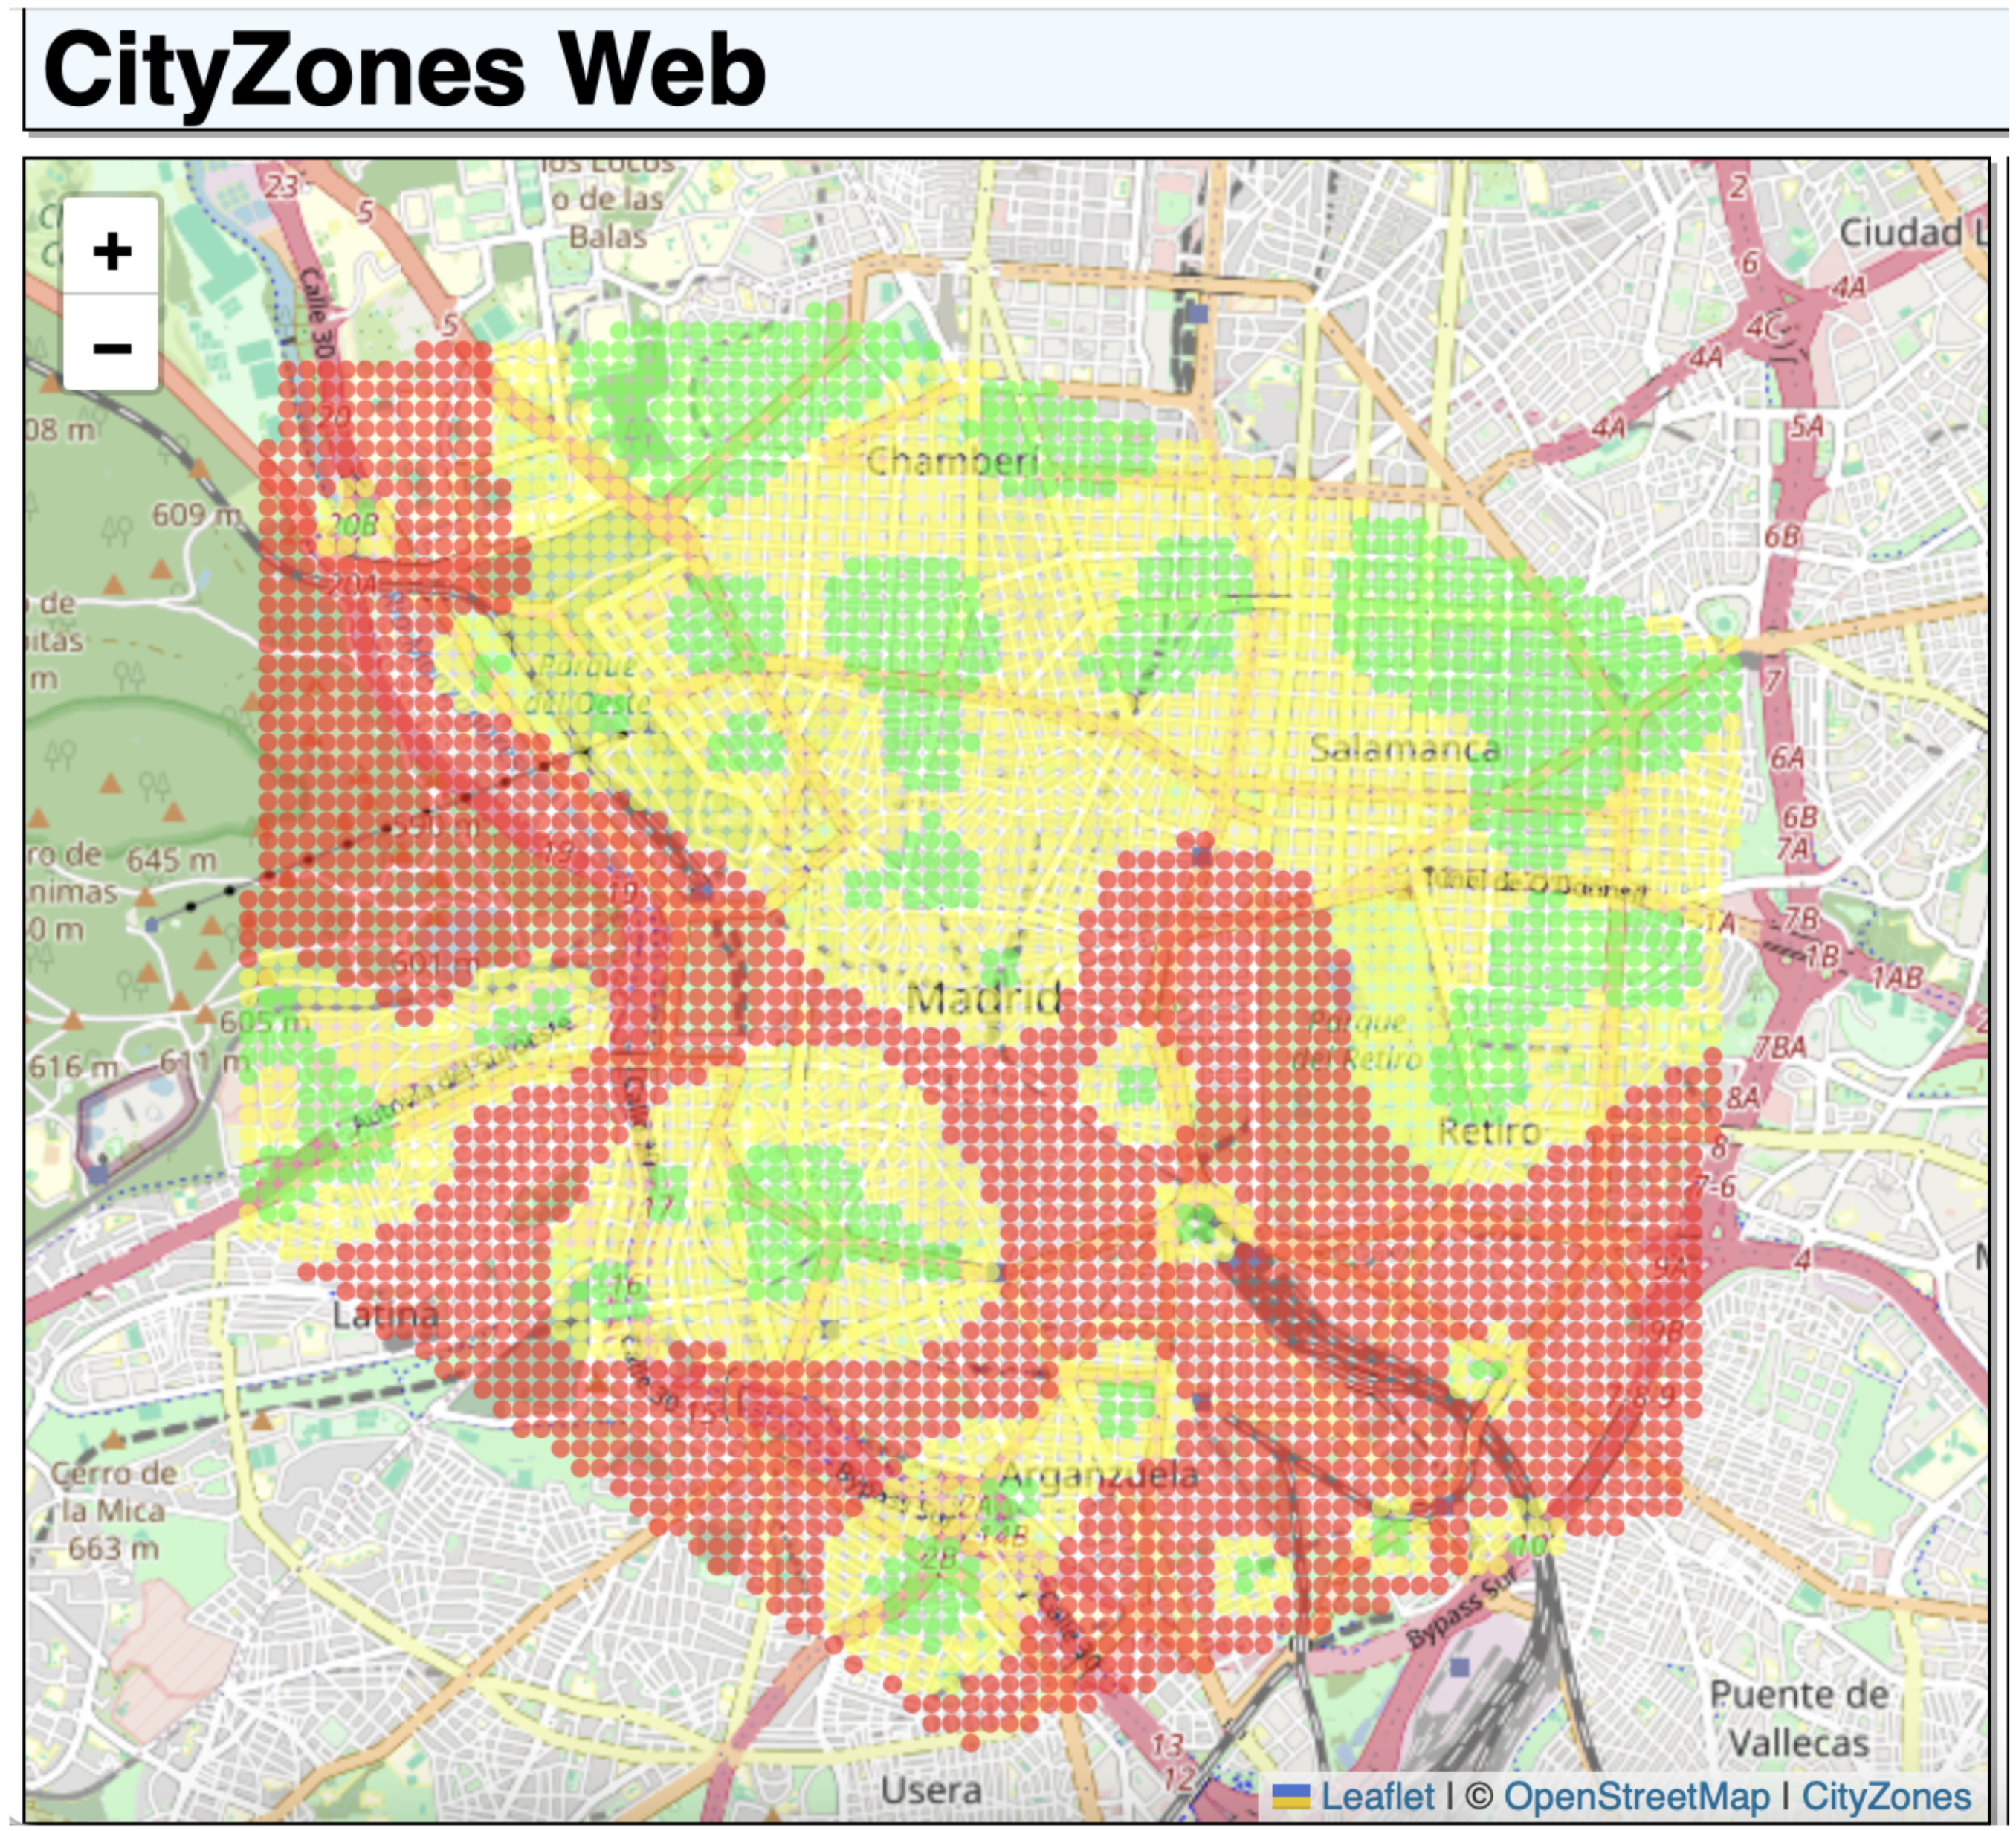
The CityZones tool divides a city into a grid of disjoint Mitigation Zones (MZ). A MZ is a square area with a known location and that is classified into one of three risk levels: low (green), medium (yellow), or high (red). To determine the risk level of each zone, all PoIs are considered. For each zone, the distance to all PoIs is calculated, and the risk level is determined using a balanced equation described in [
59]. The CityZones tool uses a natural logarithmic calculation based on the cumulative distance from each zone to all PoIs in a city, making it very useful for urban planning and risk assessment.
Figure 1 presents an example of the CityZones tool with a computed risk map for the city of Madrid, Spain.
A PoI is defined by its GPS position at for any given point of interest , where P is the set of PoIs, and is the number of PoIs within the defined urban area. In fact, in scenarios with multiple PoIs, a weight value can be assigned to each one of them to reflect their importance in the assessment process. For example, fire brigades might be deemed more crucial than hospitals in a mitigation context, and thus given a higher weight. It is reasonable to expect that stakeholders and specialists will assign specific weights as needed.
The concept of zones is very versatile when enhancing safer cycling. Using small, square-shaped zones typically less than 100 m in size, a regular city will have thousands of them, with reasonable precision at acceptable computational cost. This is even more relevant when searching GPS coordinates and identifying the current bicycle is zone, since it is inherently time-consuming.
Therefore, by integrating all these concepts, urban parameters from various perspectives can offer crucial data for assessing the risk level of each zone, which is highly significant in practical terms. By approaching this in a data-driven, geospatial manner, we create a versatile method that can be easily applied to any city worldwide, provided the necessary parameters are available.
4. Proposed Approach
This article brings an innovative solution to alert cyclists when they are on riskier areas. This is performed by visual and auditory alerting of the risk associated with the zone a cyclist is currently crossing, aiming to enhance cyclist awareness and safety on the roads. For that, our approach is structured into two main components, focusing on the visualization and processing of large volumes of geospatial data. The risk of a zone is identified by the CityZones tool according to the balanced proximity to emergency response centers [
28,
59], with the computed zones being exported by that tool and imported into our embedded system as a CSV file.
Figure 2 depicts a schematic scenario for the proposed approach.
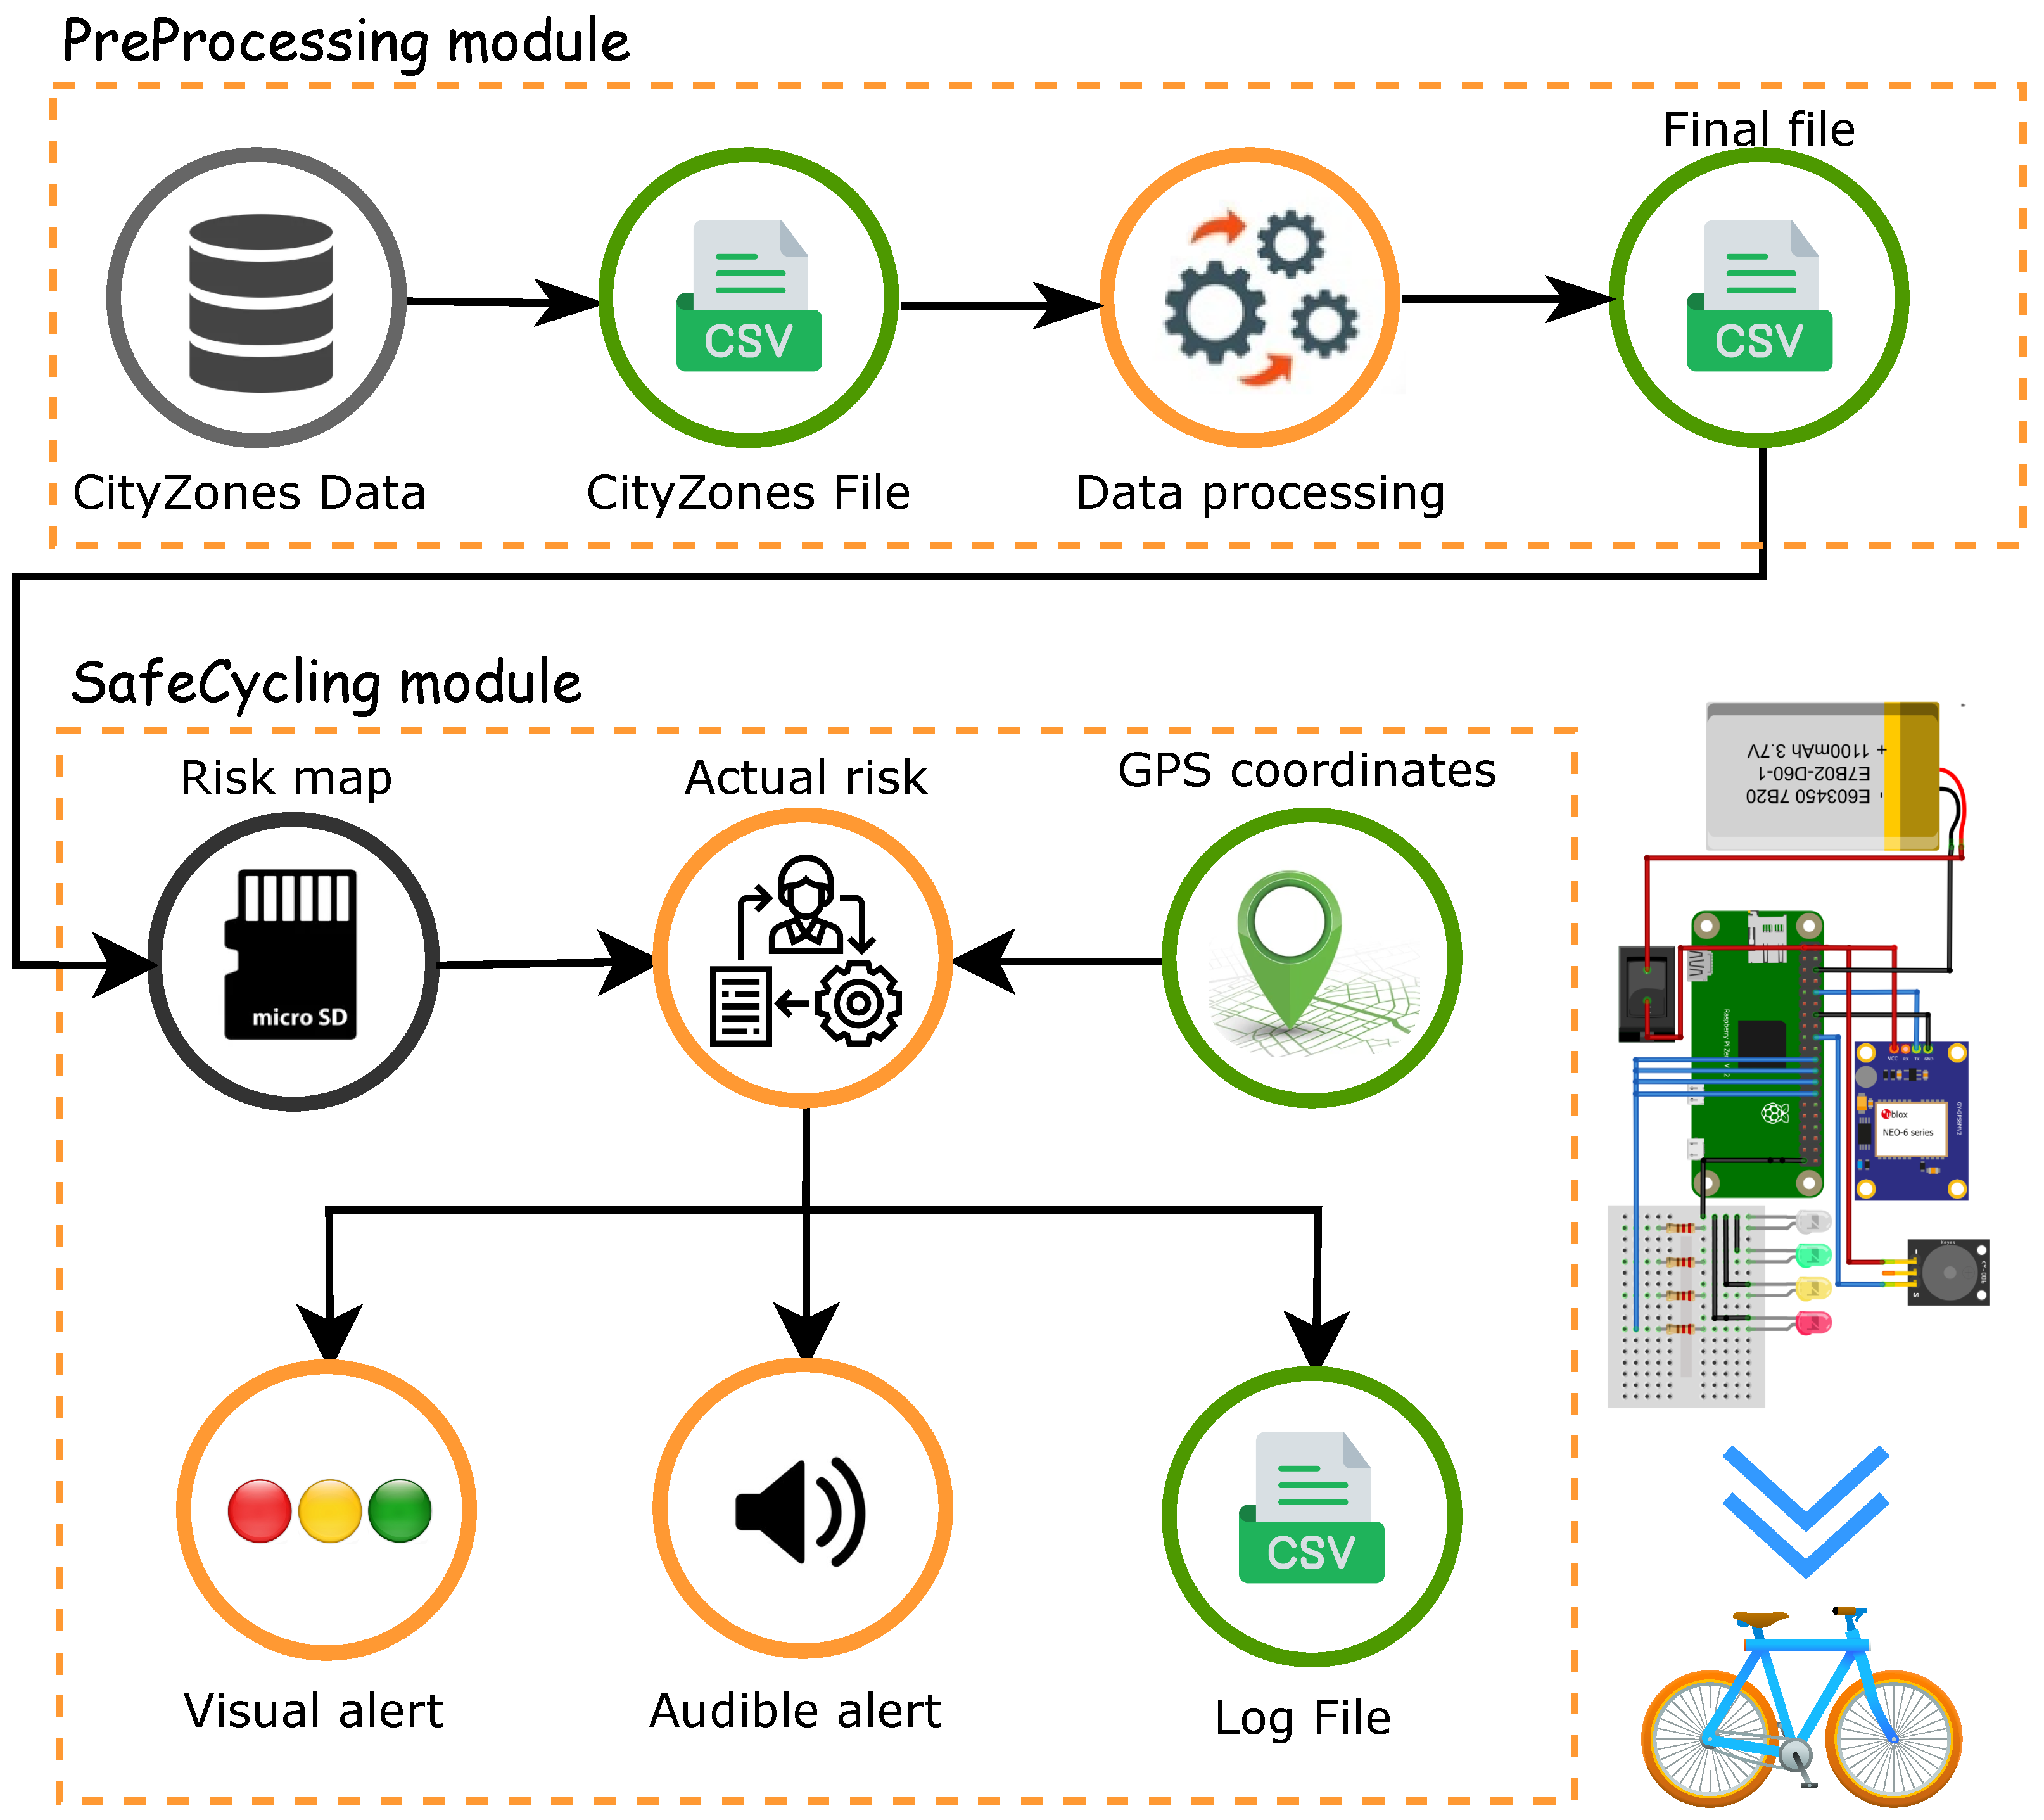
The two modules of our approach are named as PreProcessing and SafeCycling. The PreProcessing module handles the processing of large spatial datasets retrieved by the CityZones tool, enabling fast data retrieval. On the other hand, the SafeCycling module focuses on a quick search algorithm, identifying the current risk zone and alerting the cyclist properly.
The first module, PreProcessing, corresponds to the manipulation of data from the CityZones CSV file. For each geospatial coordinate found in the file, a unique identification index is assigned by that tool. This is the information that will be retrieved and processed by our embedded system. It is important to say that this module is executed previously, before initializing the embedded SafeCycling module.
The second module is responsible for capturing the cyclist’s current position. Doing so, it is possible to identify the city where the cyclist is located, conveying relevant information to the system and allowing the proper selection of the GIS dataset to be considered. In fact, multiple cities may be processed and stored into the embedded system, allowing a bicycle to be used in different cities without further configuration.
The SafeCycling module is composed of a series of hardware components: a GPS receiver, an LED bar, a buzzer, a battery, and a processing unit. Although we developed a prototype implementation of this module, any hardware configuration is possible since at least those components are present.
Figure 3 illustrates the operation flow of the proposed approach, highlighting the two proposed modules. As aforementioned, the first module executes on a regular computer and usually only once for any given risk map, while the second module will execute on every embedded system on a bicycle.
4.1. The PreProcessing Module
The PreProcessing module was designed to take a CSV file as input, provided by the CityZones tool, and convert it into a new processed CSV file. This new file aims to index each zone found in the CityZones original file to allow simpler and quicker linear search. This is necessary because risk maps may be modeled as irregular polygons in the form of a matrix, which necessitates some processing due to the linear format of the original file.
As depicted in
Figure 1, the computed risk map may have any format, potentially making it costly to find accurate positioning within short intervals. Moreover, managing large spatial datasets presents challenges in organization, processing speed, and maintaining data integrity for continuous analysis. To address all these challenges, our solution focuses on an indexing technique to support quicker decision-making.
The CityZones CSV file follows a format of
(lon,lat,r) for each computed zone, where
lon and
lat represent longitude and latitude of the center of a zone, respectively, while
r is the computed risk level of that zone (3 for high, 2 for medium, and 1 for low). The primary objective of our approach is to reorganize this CSV data, exploiting a geometry model that fits any geographical configuration. Given that we have the coordinates of the center point of each zone, we can determine the bearing angle,
, between different points using a specific Formulation (
1). This angle provides us with the direction in which a point is located relative to another, allowing us to compute a grid-like perception of a city. In that equation,
is the latitude of the first point found in the CityZones CSV file, and
is the longitude.
For initializing the grid creation, the first step is to divide the CityZones CSV file into four quadrants, with as the reference point. The quadrants are defined as follows:
First quadrant: ∈ [0, 90];
Second quadrant: ∈ (90, 180];
Third quadrant: ∈ (−180, −90);
Fourth quadrant: ∈ [−90, 0).
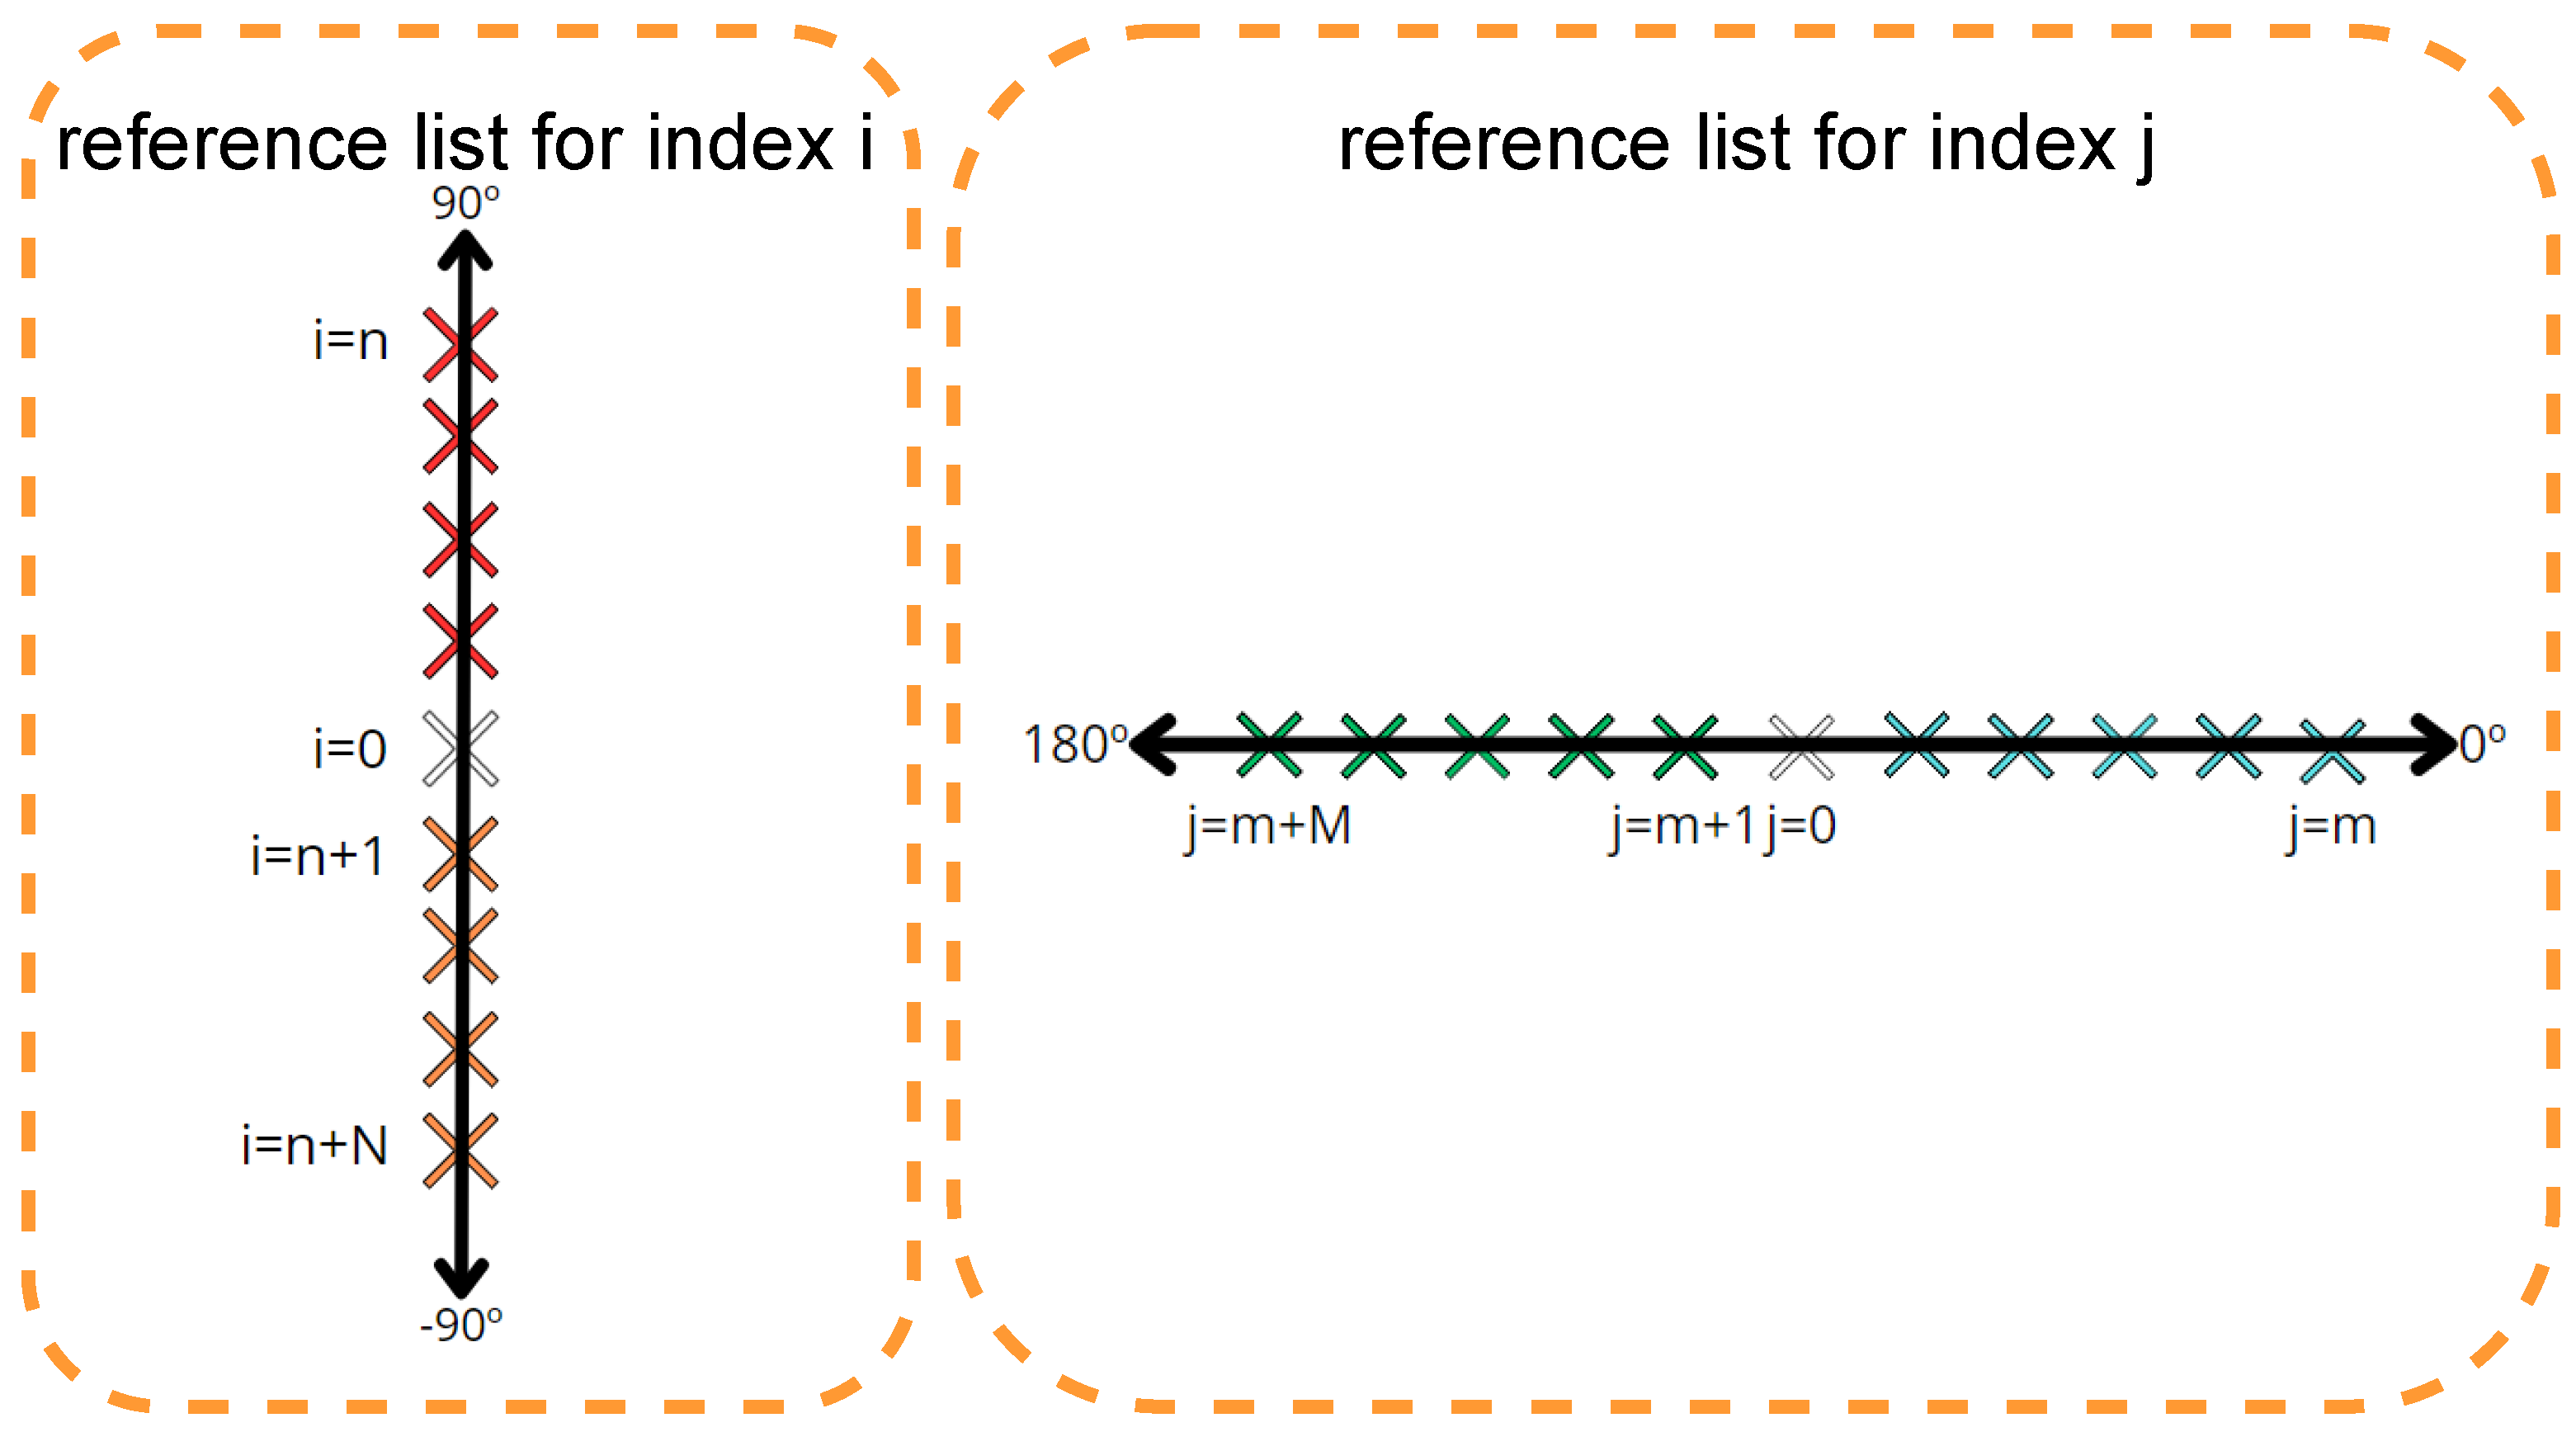
After determining the quadrants, it was necessary to devise a method to index each point of the grid. As there cannot be any repeated points, otherwise the search process may yield errors due to identical index values for different points, reference points were calculated with a bearing angle equal to = 0°, = 90°, = 180°, and = −90°, relative to , which, in this case, will be the center of the grid.
Figure 4 illustrates how the indexing scheme was performed, with index
i intersecting the x-axis and index
j intersecting the y-axis.
After determining the reference lists and quadrants, we can move further to assigning the indexes. For each reference list, points are examined, respectively, above, below, or to the side, depending on the quadrant.
Figure 5 depicts this process.
Taking the example of the first quadrant, depicted in
Figure 5, for each point on the reference list intersecting the x-axis, all points immediately above it (i.e., where
= 90°) are checked, and the index of the point belonging to the reference list is assigned. Similarly, for the reference list intersecting the y-axis, points where
= 0° are examined, and the index of the point belonging to the reference list is assigned. The final result for the first quadrant, considering a regular four-sided polygon, is illustrated in
Figure 5; this process is then repeated for all quadrants, proceeding sequentially counterclockwise until the entire grid is filled, as shown in
Figure 6.
In the previous case, the simplest scenario involving a regular 4-sided polygon was examined. However, the CityZones tool can generate various shapes, even irregular polygons. Therefore, relying solely on points with angles of 90°, −90°, 0°, and 180° relative to may lead to an insufficient number of points.
Consider, for instance, a shape depicted in
Figure 7, where the first point retrieved from the CSV file,
, is shown in white, and the corresponding reference lists are depicted in red and blue. Without proper processing, it is anticipated that points colored light green will not be included in the final CSV file.
In order to handle those situations, it is necessary to consider not only points with specific angles relative to
, but also those lacking angles on certain sides. For example, let us consider the scenario illustrated in
Figure 7, where reference lists are established, and all points with angles
= 90° or
= 0° are selected. For each selected point, we examine whether there are any points with a 180° angle. If not, the point is added to the appropriate reference list. Thus, in this scenario, and considering
Figure 8, points lacking angles on the left side will be added to the reference list for creating the
i indexes. Conversely, if no angles are detected below (
= −90°), the point will be added to the reference list for creating the
j indexes.
Finally, with the original CSV file from the CityZones tool mapped into a new CSV file that now also comprises i and j indexes to support easy creation of a more efficient data structure on the embedded system, we allow quicker searches with lower computational costs. This was performed by systematically analyzing the spatial relationships between points in the input dataset, saving resources when effectively executing our approach on the bicycle.
4.2. The SafeCycling Module
After processing the input CSV file as a new CSV file that better supports an optimized data structure, it is ready to be considered for an embedded system to be attached to a bicycle. The proposed hardware module includes a battery, an ON/OFF button, a LED bar, a buzzer, a GPS receiver, and a processing unit. Among these components, the most complex and costliest part is the processing unit, which may vary considerably ranging from low-cost Microcontrollers to powerful Single-Board Computers (SBC) [
60,
61]. Overall, selecting a hardware platform for smart city systems requires careful consideration of several criteria to ensure successful deployment, such as affordability, computational resources, and energy consumption.
Whatever is the hardware configuration, the SafeCycling module starts by fetching the current GPS coordinates and comparing it to the processed CSV file according to the defined algorithm. A new GPS position is gathered every 1 s, being immediately processed when a valid GPS position is achieved. In fact, 1 s is the interval for subsequent GPS readings and the entire processing (identifying the correct risk level and signaling it to the cyclist) is supposed to take less than 1 s (otherwise, the next GPS reading is skipped). Since the designed embedded solution was built to process risk and signal it in less than 1 s, this means that the unit will typically remain idle for some time until a new reading is performed. As an important comment, since GPS signal failures may happen, our algorithm pauses until a valid coordinate is gathered by the module because there is no need to proceed without a valid current GPS position.
Generally, the format of the coordinates retrieved by a GPS module will be in the National Marine Electronics Association (NMEA) format, corresponding to a series of comma-separated values, where each value represents a specific type of data. For retrieving GPS coordinates, the value typically returned by a GPS receiver module is a line that starts with the sentence identifier
GPGGA, as exemplified in
Figure 9.
The search and computation of the zone in which the cyclist is currently riding on requires determining the nearest center based on the cyclist’s coordinates and executing a swift search, typically accomplished within milliseconds. The calculation of distances between two points is performed using Haversine distance formula [
62].
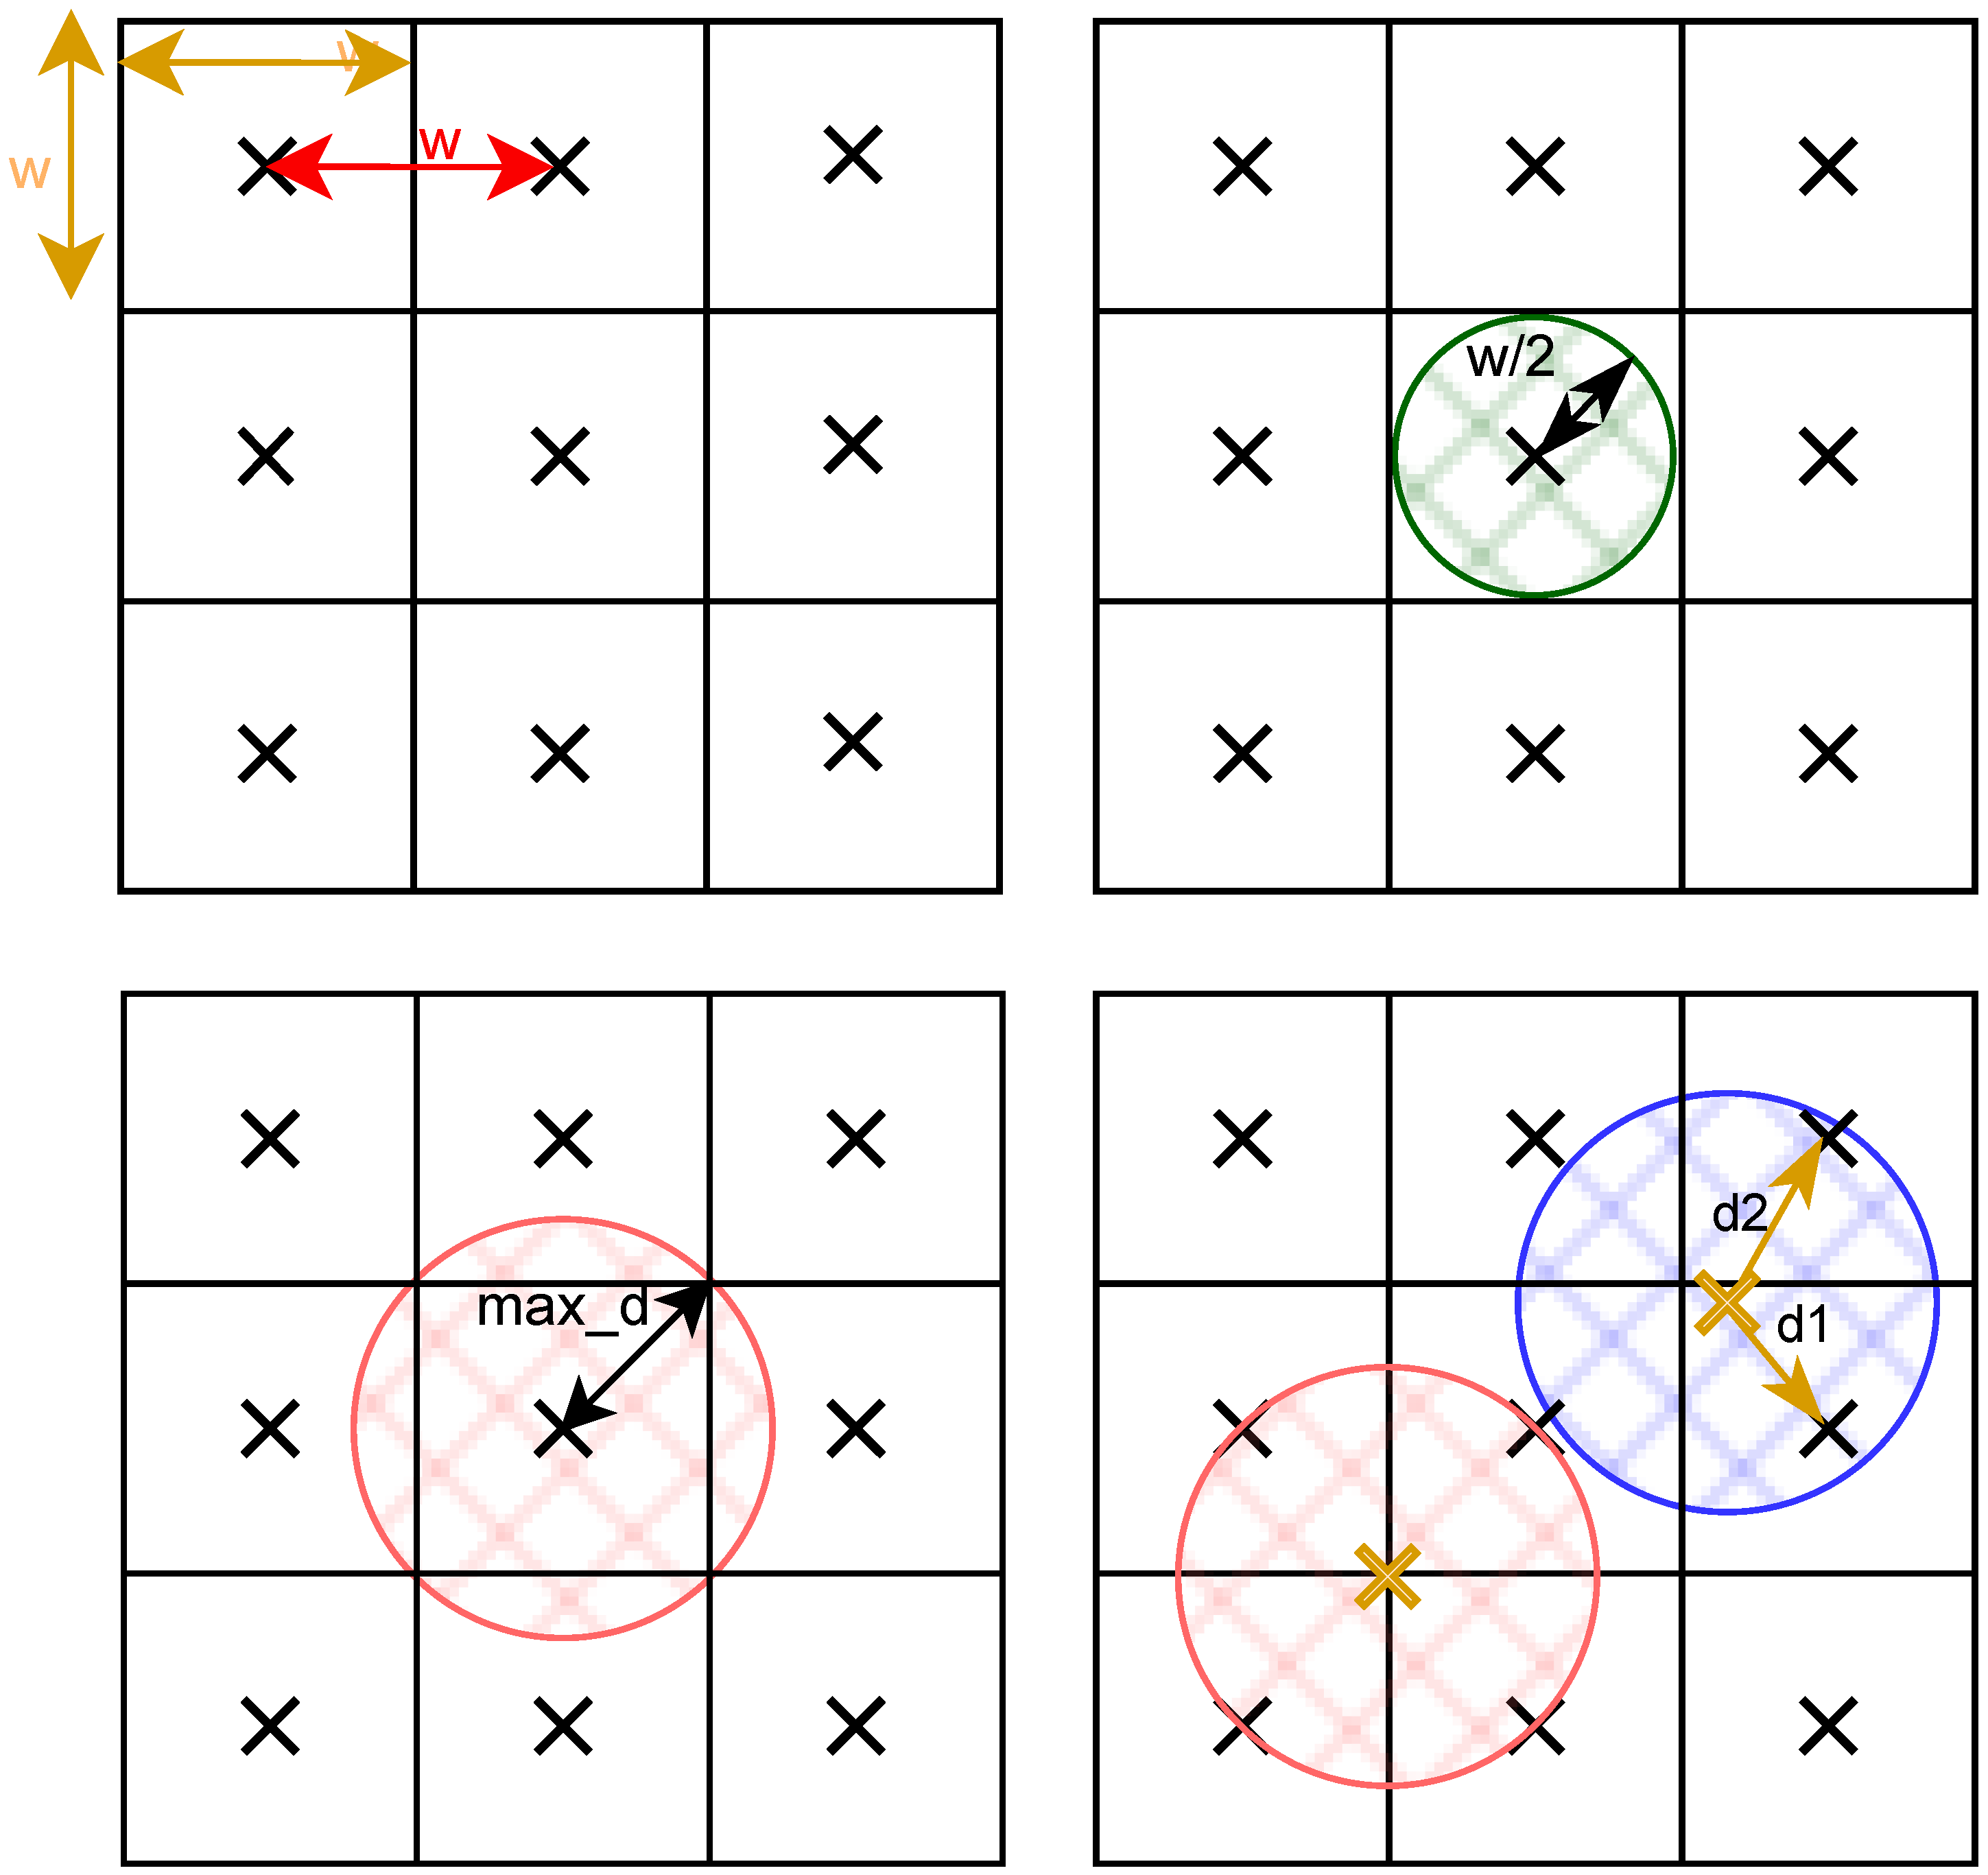
Figure 10 visually presents how actual distances are computed by the embedded system, for
w as the width/height of a squared-shape zone, and
max_d as the maximum distance from the center of the zone (the actual position exported by the CityZones tool) and the corner of the defined square.
While the risk map exported by the CityZones tool divides a city into equally distributed squares with the same side
w, where each square corresponds to a zone risk, the distances between neighboring centers is equal to the side length of the squares (
w). Thus, the easiest and quickest way to find the closest center, given an unknown GPS position of the cyclist, is by doing a circle approximation. However, using a circle approximation leads to uncertainty of results, because if the radius is equal to
, it will lead to a failure on the approximation once the square corners will be missed, as represent
Figure 10. This can result in a misclassification of GPS coordinates that fall within the corner regions of the square zones. To address this issue, adjusting the radius of the circle approximation was considered using the Pythagorean theorem. In fact,
Figure 10 shows two possible situations. In situations where four centers are found and all the distances are the same (red circle), it is simply chosen one of the centers with the highest risk level. However, situations with two or three centers may also be found (blue circle), leading our algorithm to choose the center with the smallest distance between the coordinate of the cyclist and the risk zone centers of the file. All this processing will be executed in the SafeCycling module.
Two distinct types of searches are performed. When the system is powered on, it lacks information about previous cycling activities, thus it is imperative to first retrieve the indexes from the closest center found. Then, having obtained the center indexes
in the initial iteration, a quick search is simply performed by expanding the search area around the initially found center. To achieve this, a list of indices is constructed, including not only the initial center but also the surrounding centers like a 3 × 3 matrix, as depicted in
Figure 10.
Given that, at time , the cyclist is expected to be in zone 1, and shortly thereafter at time , they would not have traveled a significant distance from their previous location. Hence, expanding the search area around the initial center provides an effective way of capturing the cyclist’s updated position within a short timeframe.
After computation, the identified risk is displayed on the LED bar according to the color pattern: red for high risk, yellow for medium risk, and green for low risk. Moreover, every time the current risk is increased, the buzzer sounds for 2 s, helping to suggest a more cautious cycling pattern for the cyclist.
Finally, every GPS measure and corresponding computation is registered on a log file. The log file is essentially an output generated after each risk assessment. It serves the purpose of facilitating future processing, particularly for analyzing the results obtained from the cycling sessions. The log file is formatted in the CSV format, with the structure depicted in
Figure 11.
5. Results
The primary objective of our proposed approach is to dynamically assess and display the risk level of the area where the cyclist is riding, providing warnings without disrupting the cycling activity. After the definition of our methodology, implementation of a real system and practical validation could be performed.
5.1. Developed Prototype
The developed embedded system was designed to have minimal impact on the bicycle and to be cost-effective in terms of both purchase and maintenance. To achieve these goals in the prototype, priority was given to selecting small and compact components.
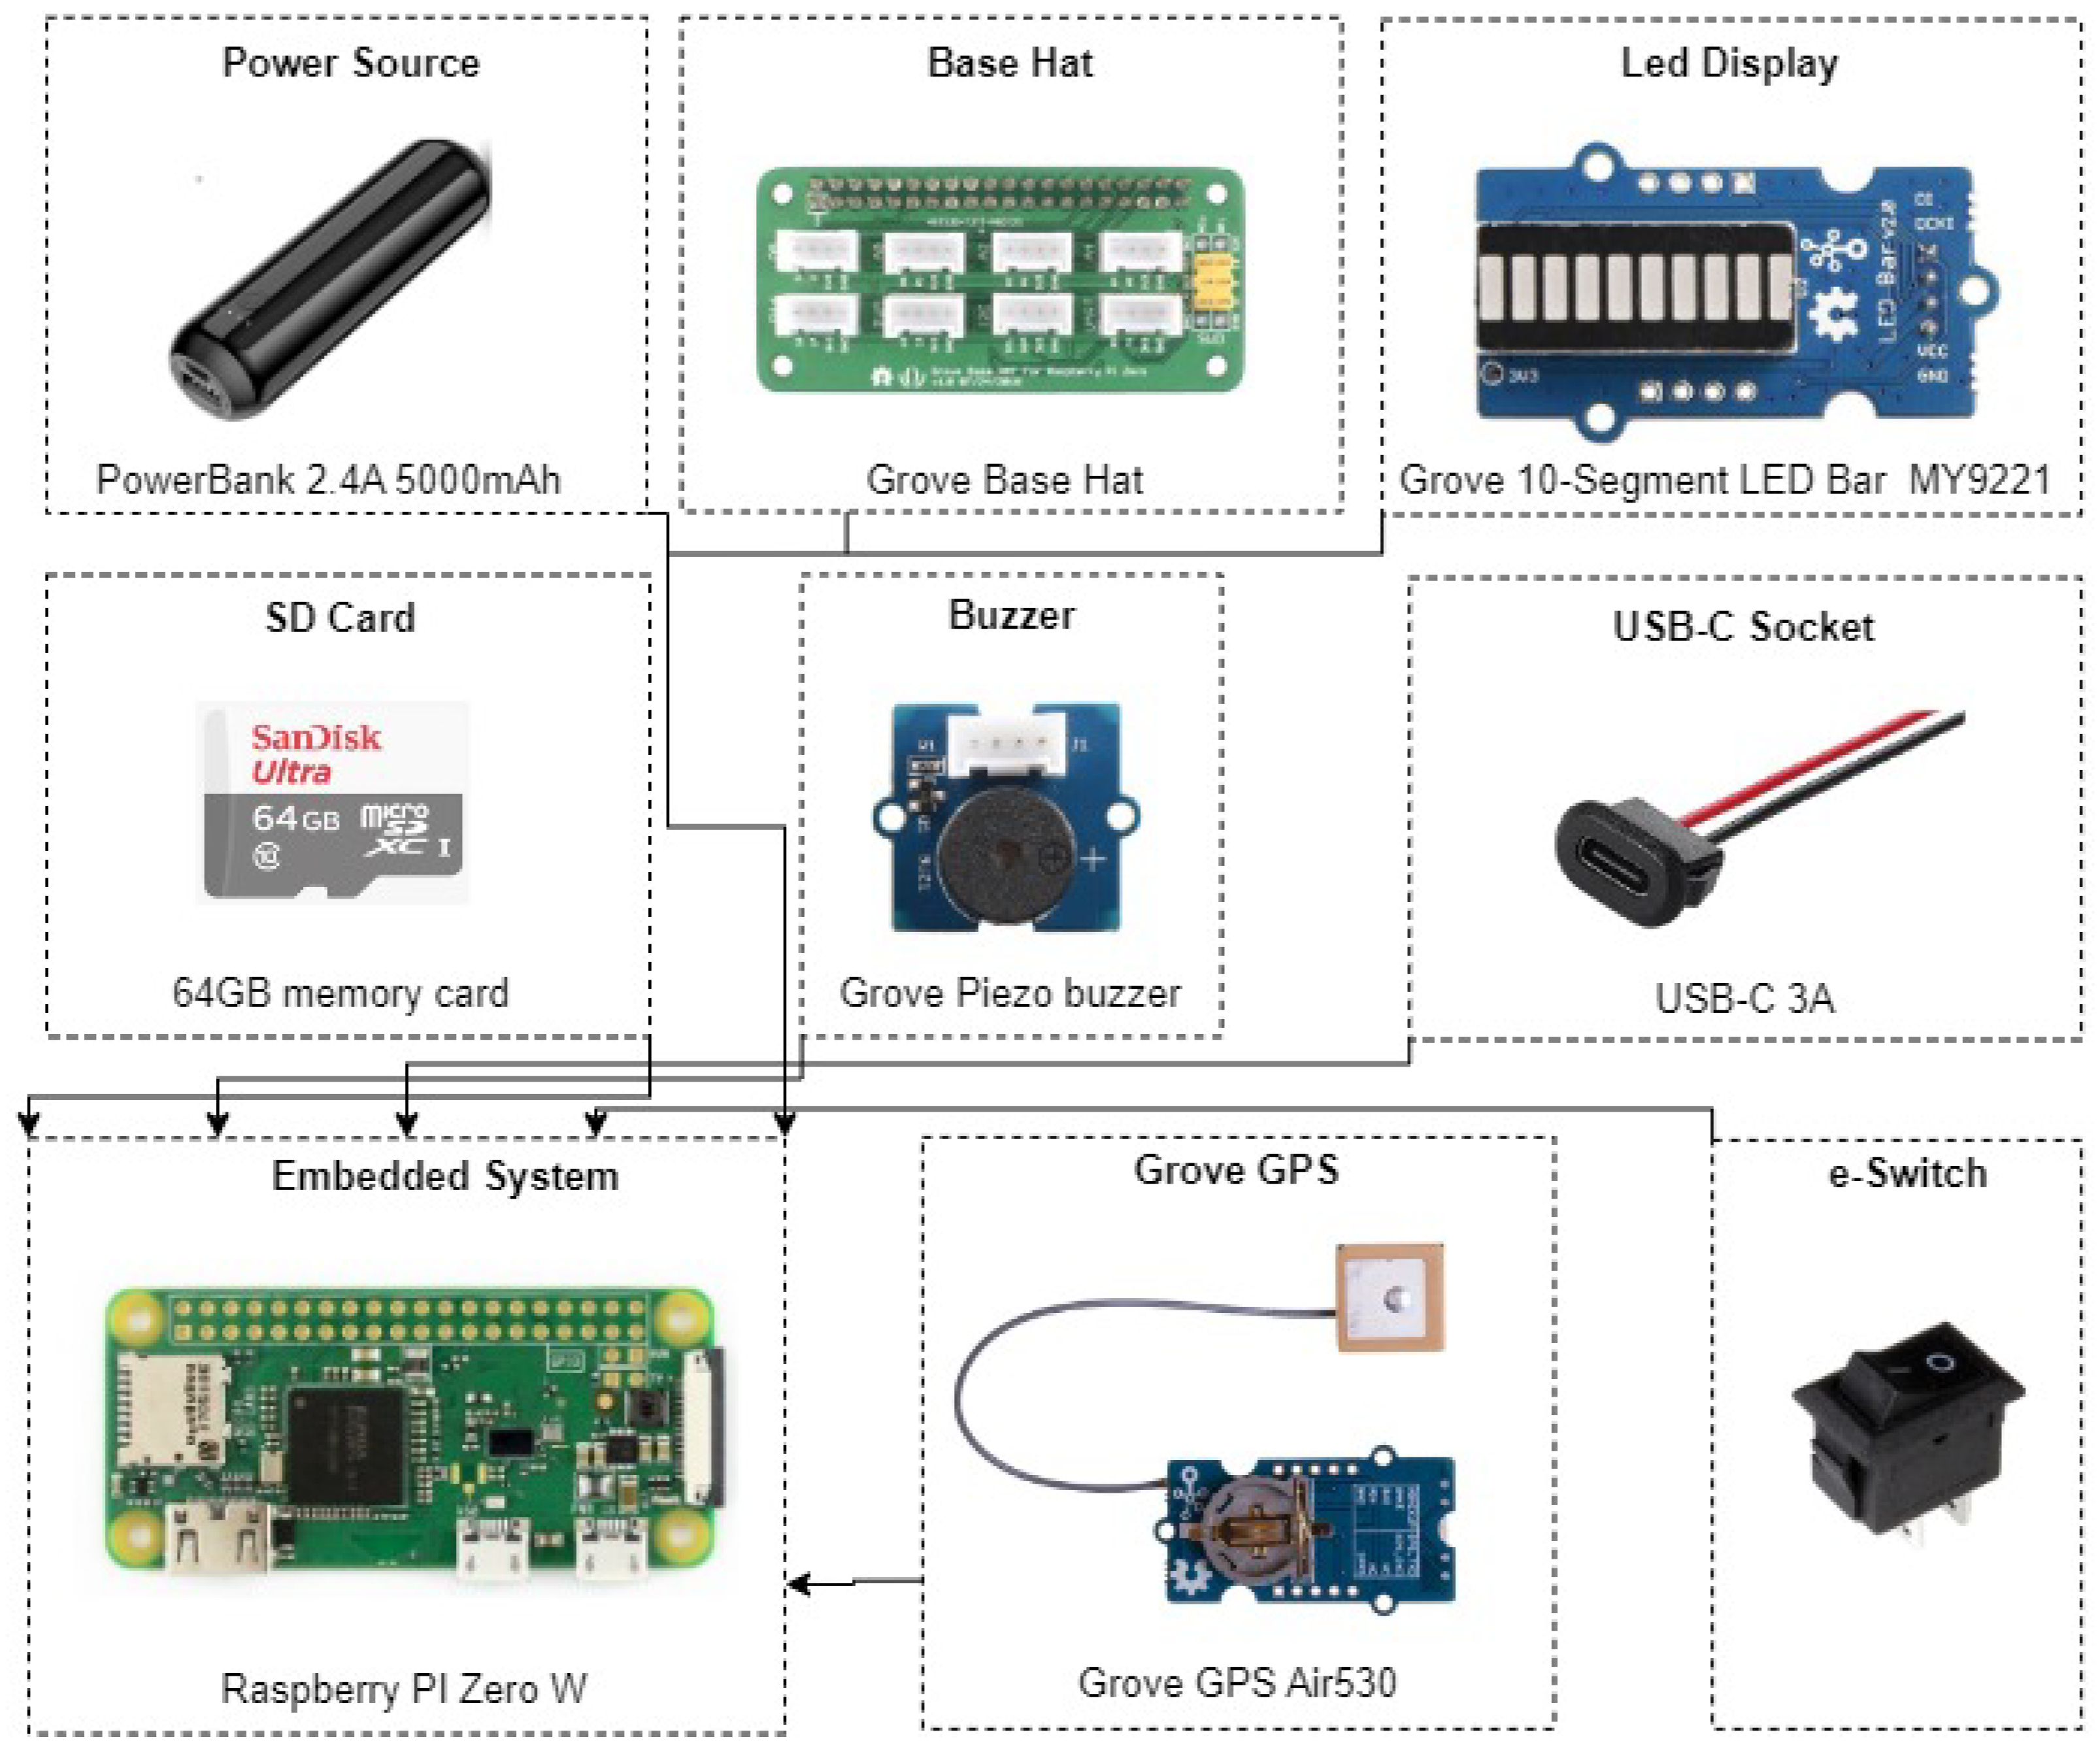
Figure 12 illustrates the proposed hardware components.
In this prototype, we chose a visualization display (LED bar), a buzzer, and a GPS receiver following the Grove standard [
63], making them easier to assemble. Moreover, this setting ensures low energy consumption and enhances safety by securing cables neatly within the Grove HAT, preventing any disruptions to the cycling experience caused by loose cables. The main processing unit is centered on a Raspberry Pi Zero W board, with a microSD card attached to it. This card will contain the Pi OS Lite system and the SafeCycling algorithms developed in Python, as well as a number of processed CSV files from the PreProcessing module (one for each target city). Finally, a 5 V power bank was used as battery.
Table 2 provides the list of hardware components and the acquisition cost, totaling approximately USD 70 in 2024. This selection ensures that the prototype unit remains affordable while also boasting low energy consumption and adaptability.
The Raspberry Pi Zero W board was chosen to allow easy access through a wireless connection, but it is not mandatory. For any chosen Raspberry Pi Zero model, the 40-pins headers must be already soldered to allow the attachment of the Grove HAT. Furthermore, it is important to highlight that a considerable portion of the prototype is cost is attributed to the Grove standard. This standard was initially chosen for its support in facilitating rapid prototyping. However, for future versions, cost efficiency can be enhanced by utilizing more economical components directly interfaced with the Raspberry Pi Zero board through I2C/SPI connections.
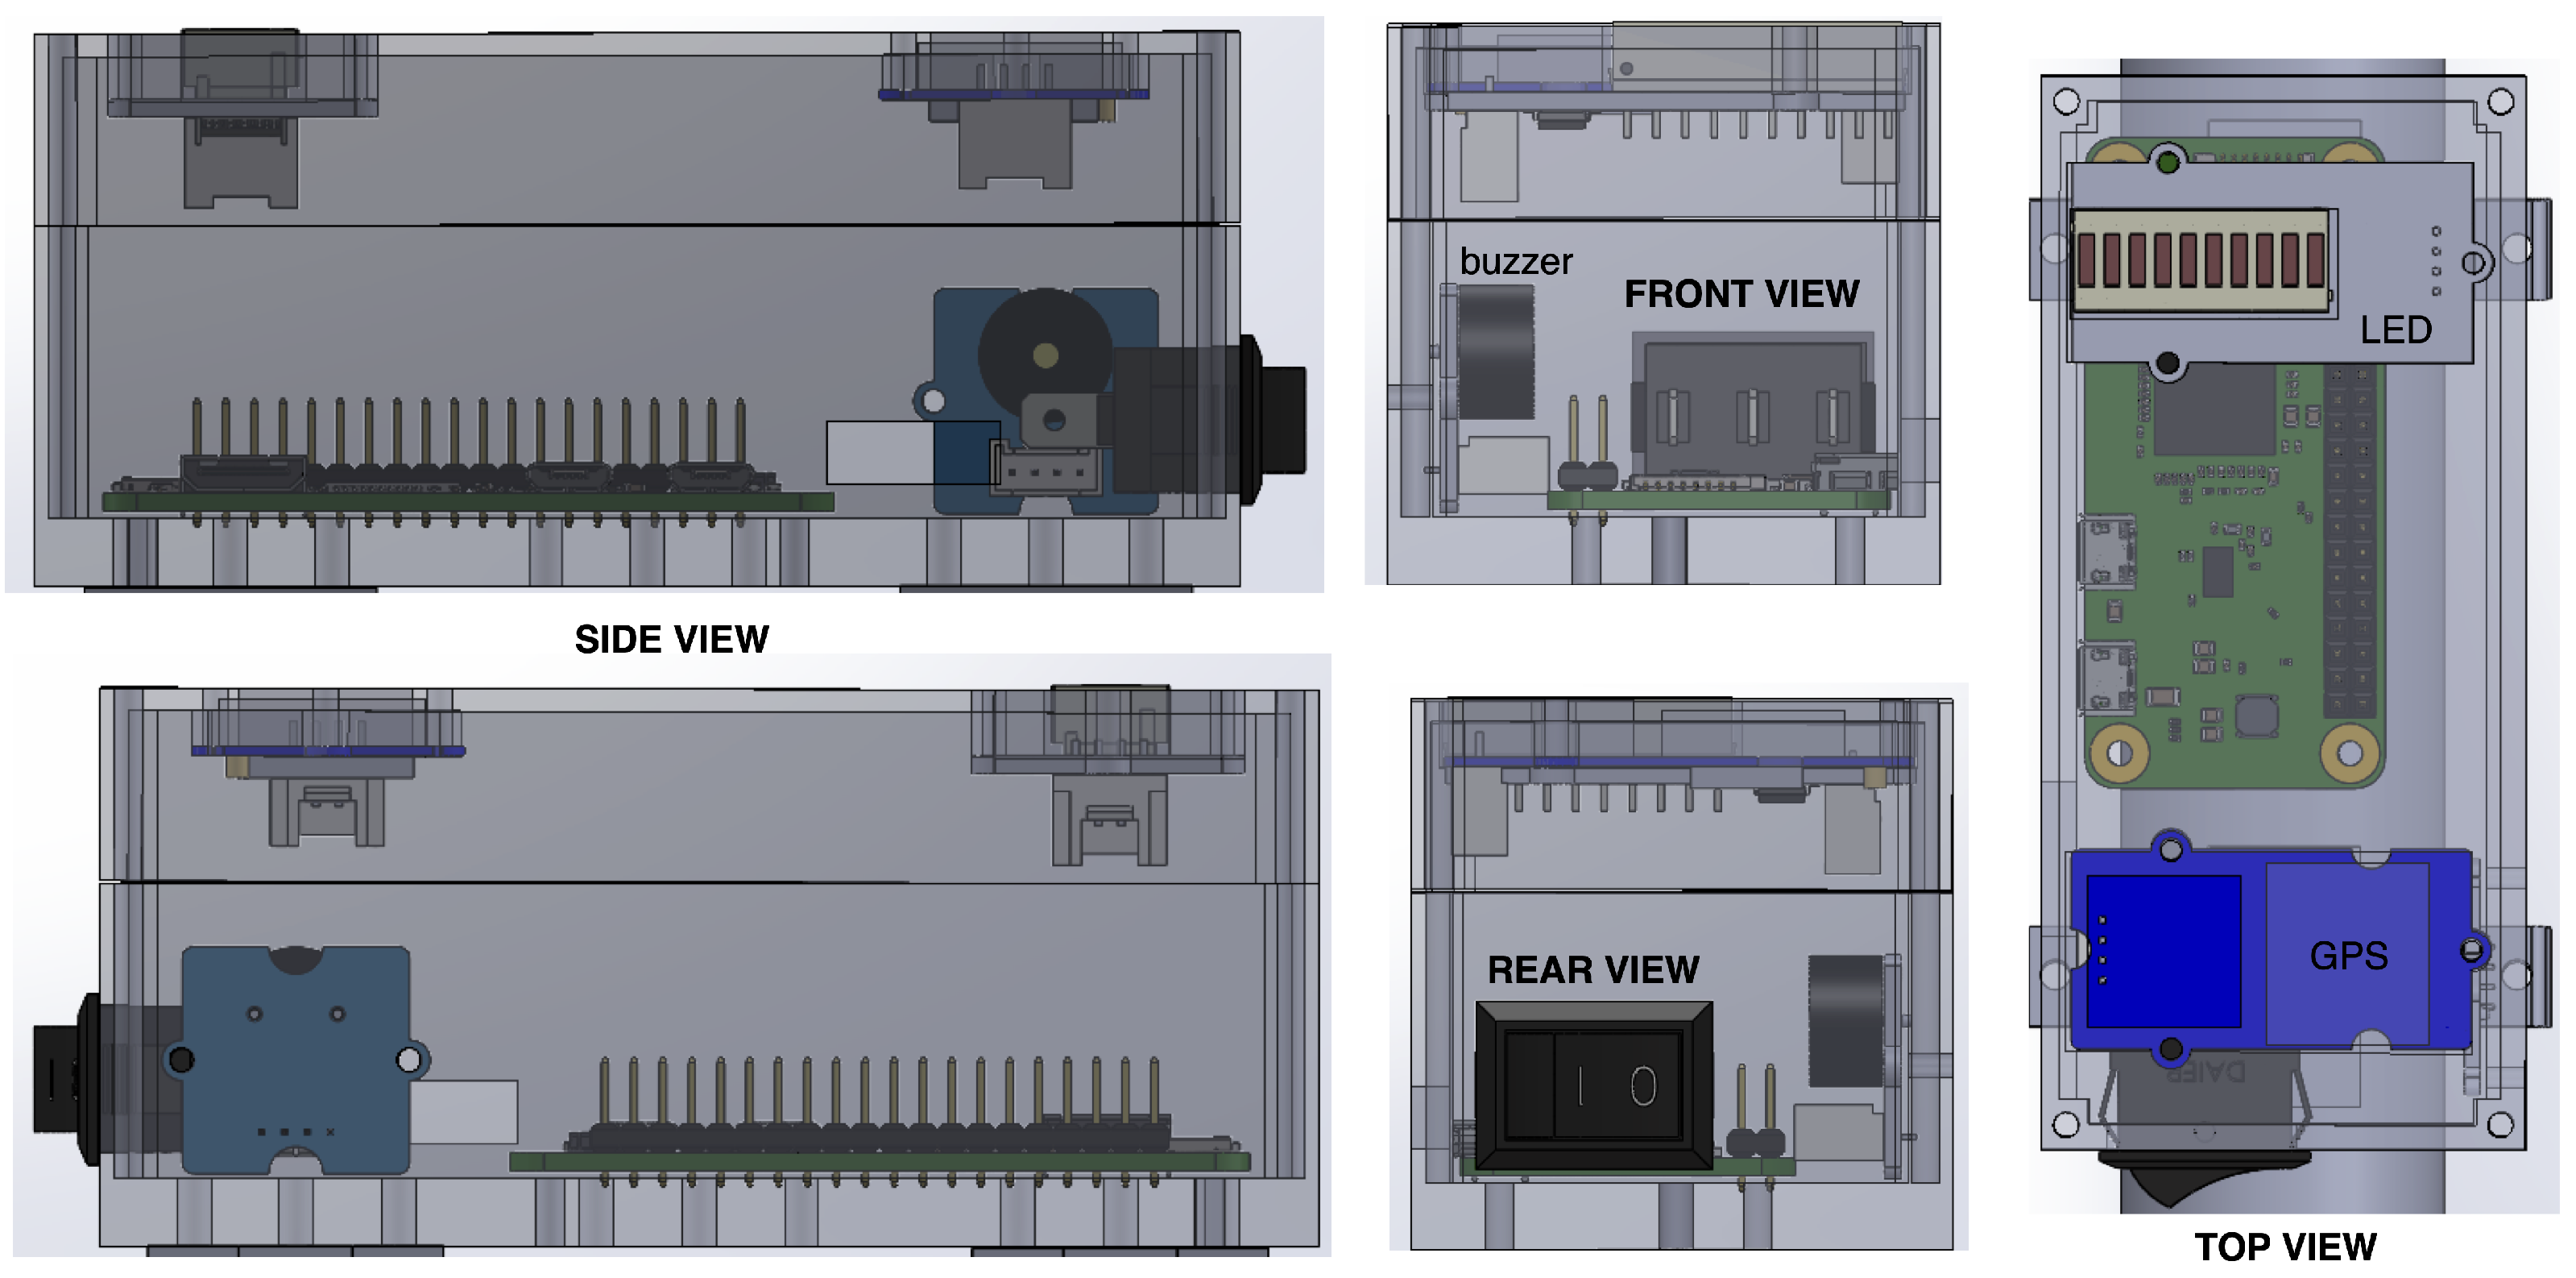
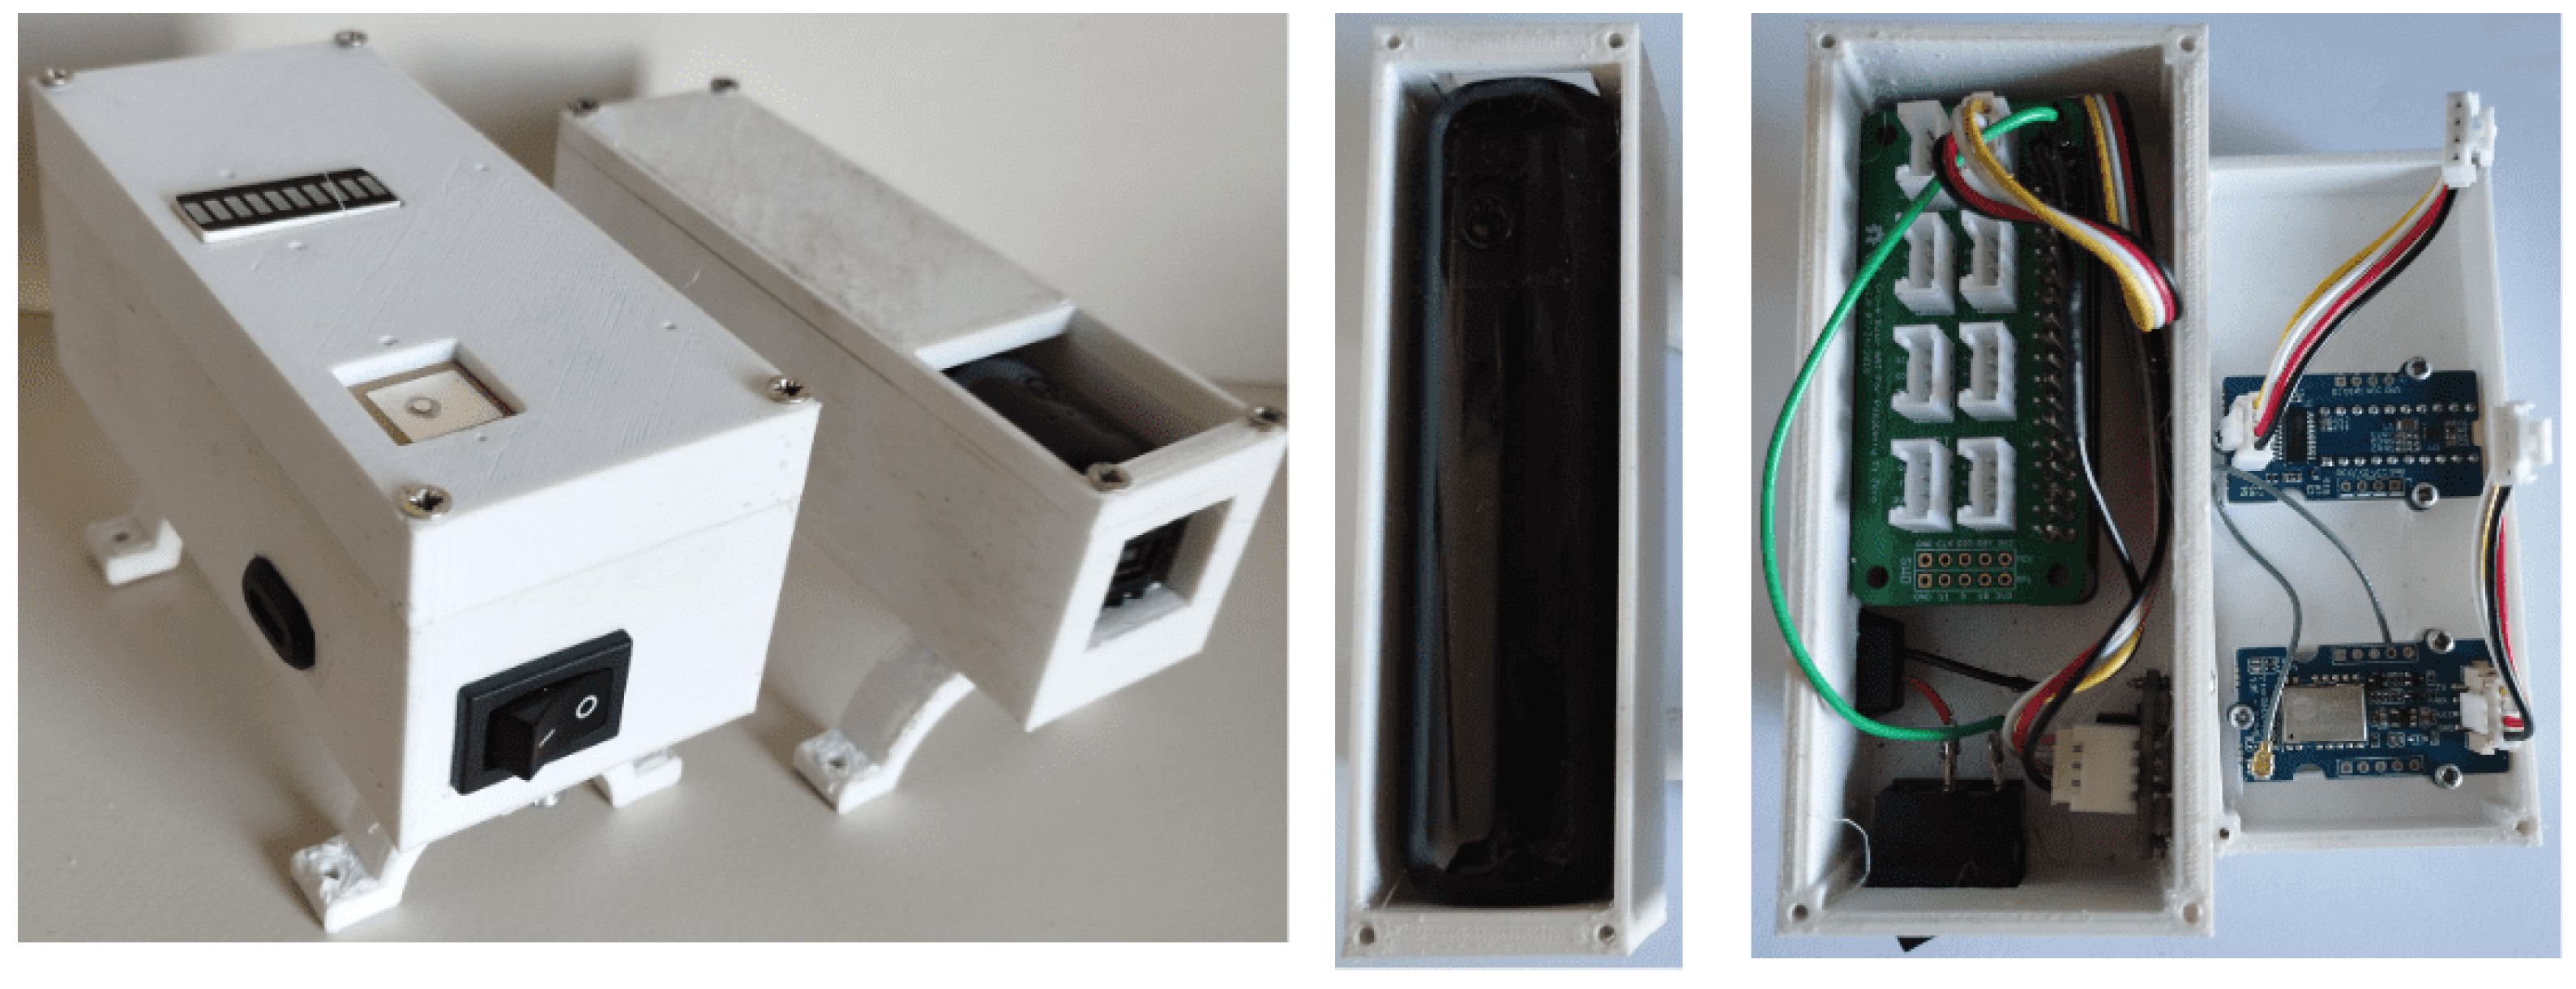
The assembled and programmed module was designed to be protected by a specific 3D-printed case, which also had the intention to allow easy attachment to a regular bicycle. In order to avoid conflicts with the power source, in case it needs to be replaced, two cases were created: one for all the hardware components of the SafeCycling unit, and another only for the power source. This way, the power source can be charged without having to remove the SafeCycling unit from the bicycle.
Figure 13 presents the designed case to be attached to a bicycle, while
Figure 14 presents the actual hardware assembling. In this initial version, water resistance was not considered and will be addressed in future implementations.
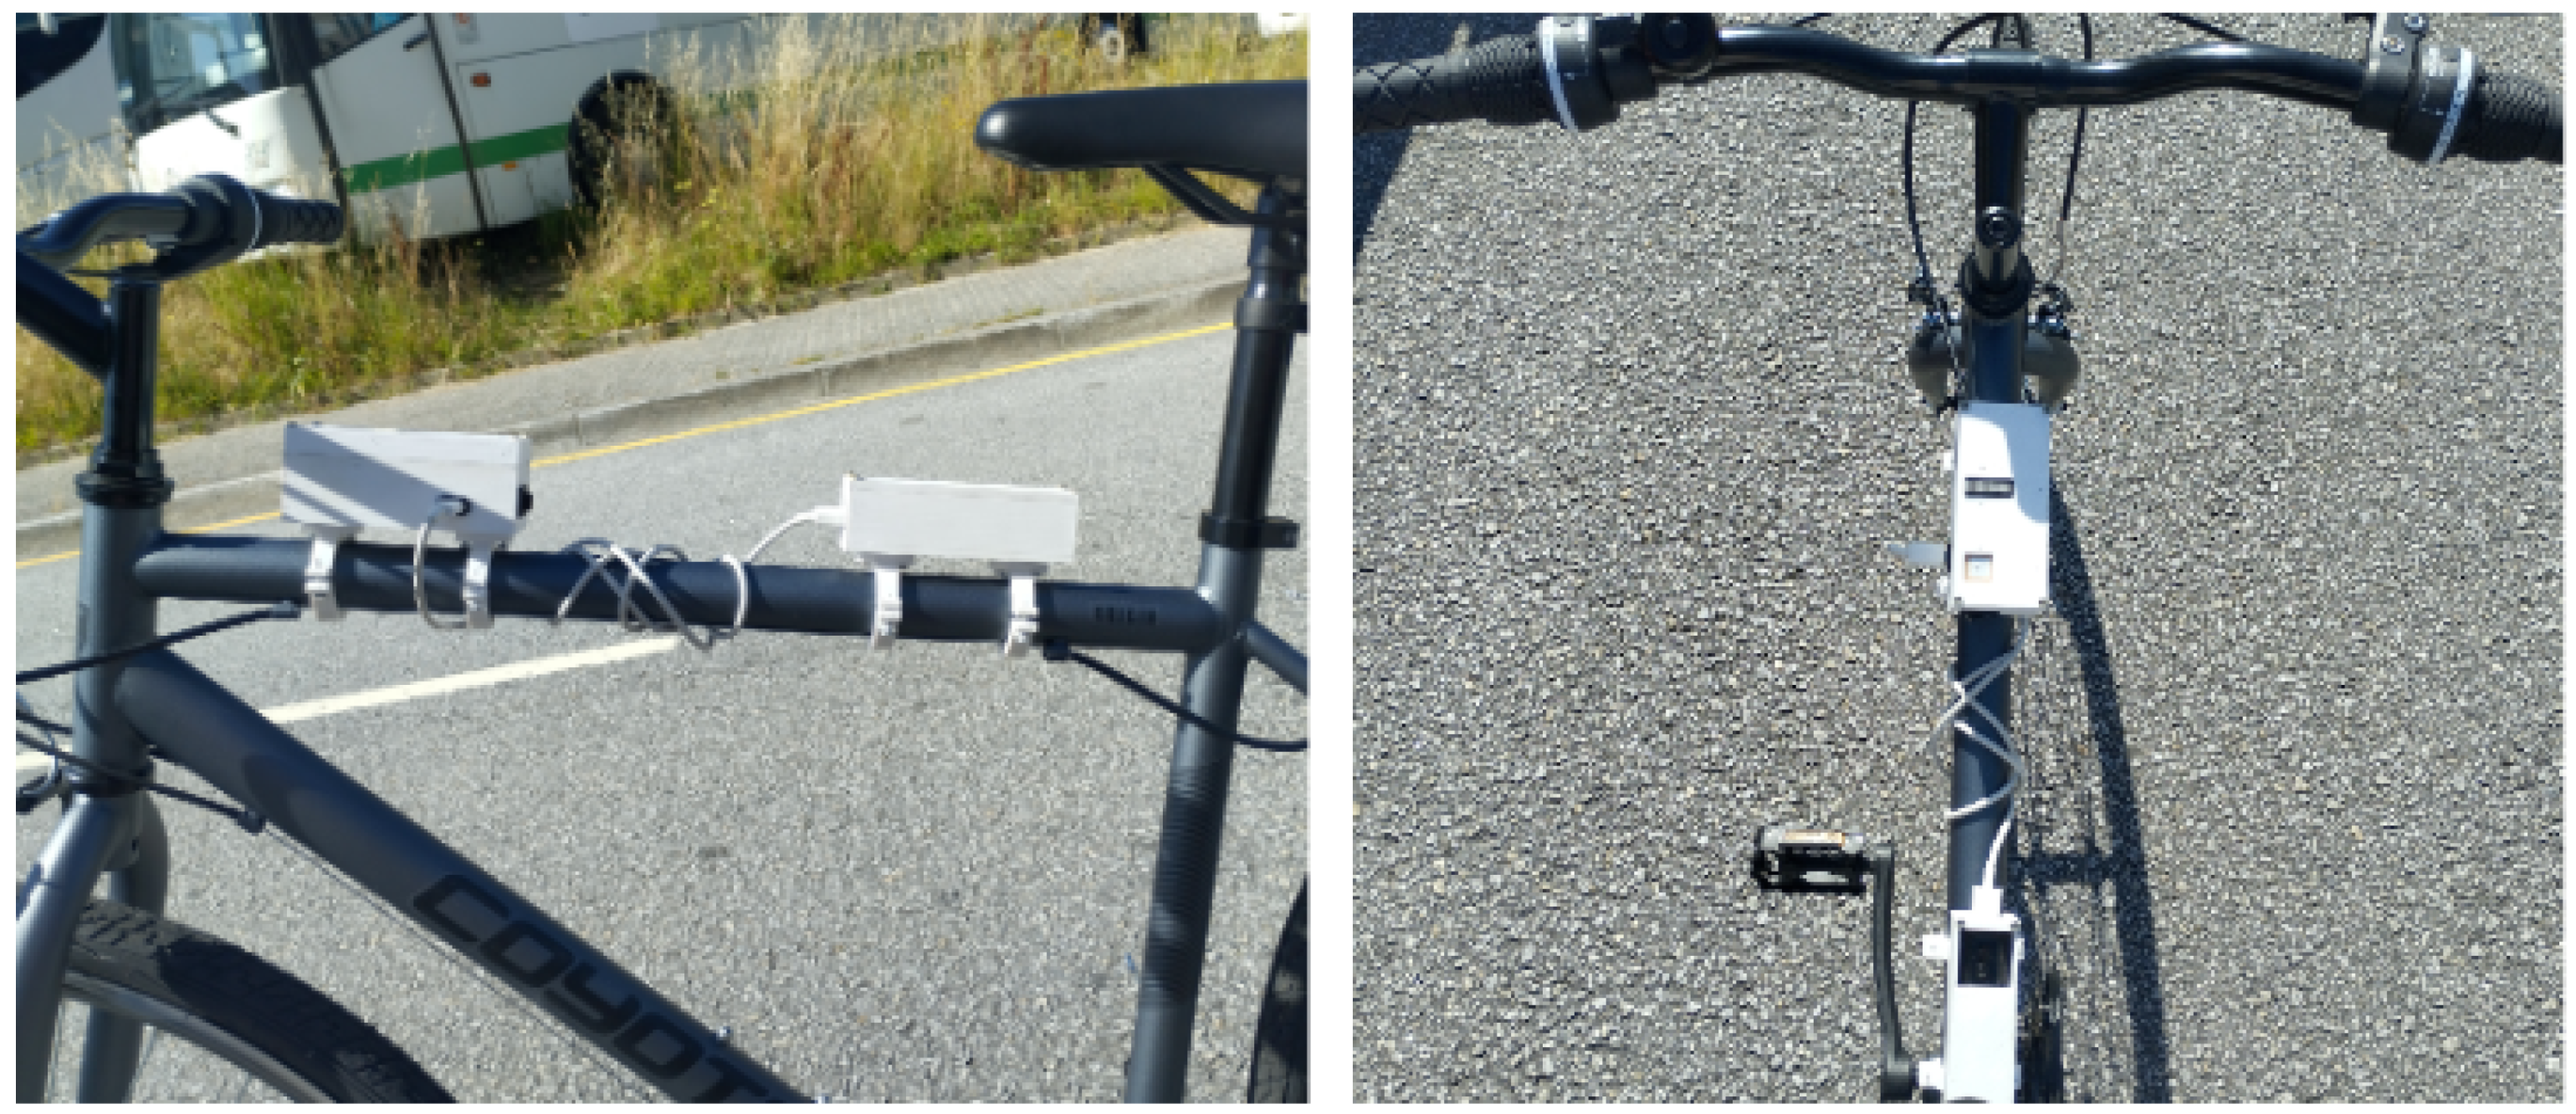
After assembling and proper programming, the SafeCycling module was ready to be attached to the bike.
Figure 15 depicts the achieved configuration.
5.2. A Case Study
After implementing a prototype and attaching it onto a bicycle, it was ready to be evaluated in a real scenario. For that, at least one target city had to be selected in order to allow the generation of a risk map by the CityZones tool. The selected city was Porto, Portugal, a historic city situated along the banks of the Douro River. It is the second-largest city in Portugal, renowned for its cultural heritage, vibrant atmosphere, and economic significance, but with recurrent challenges in cycling [
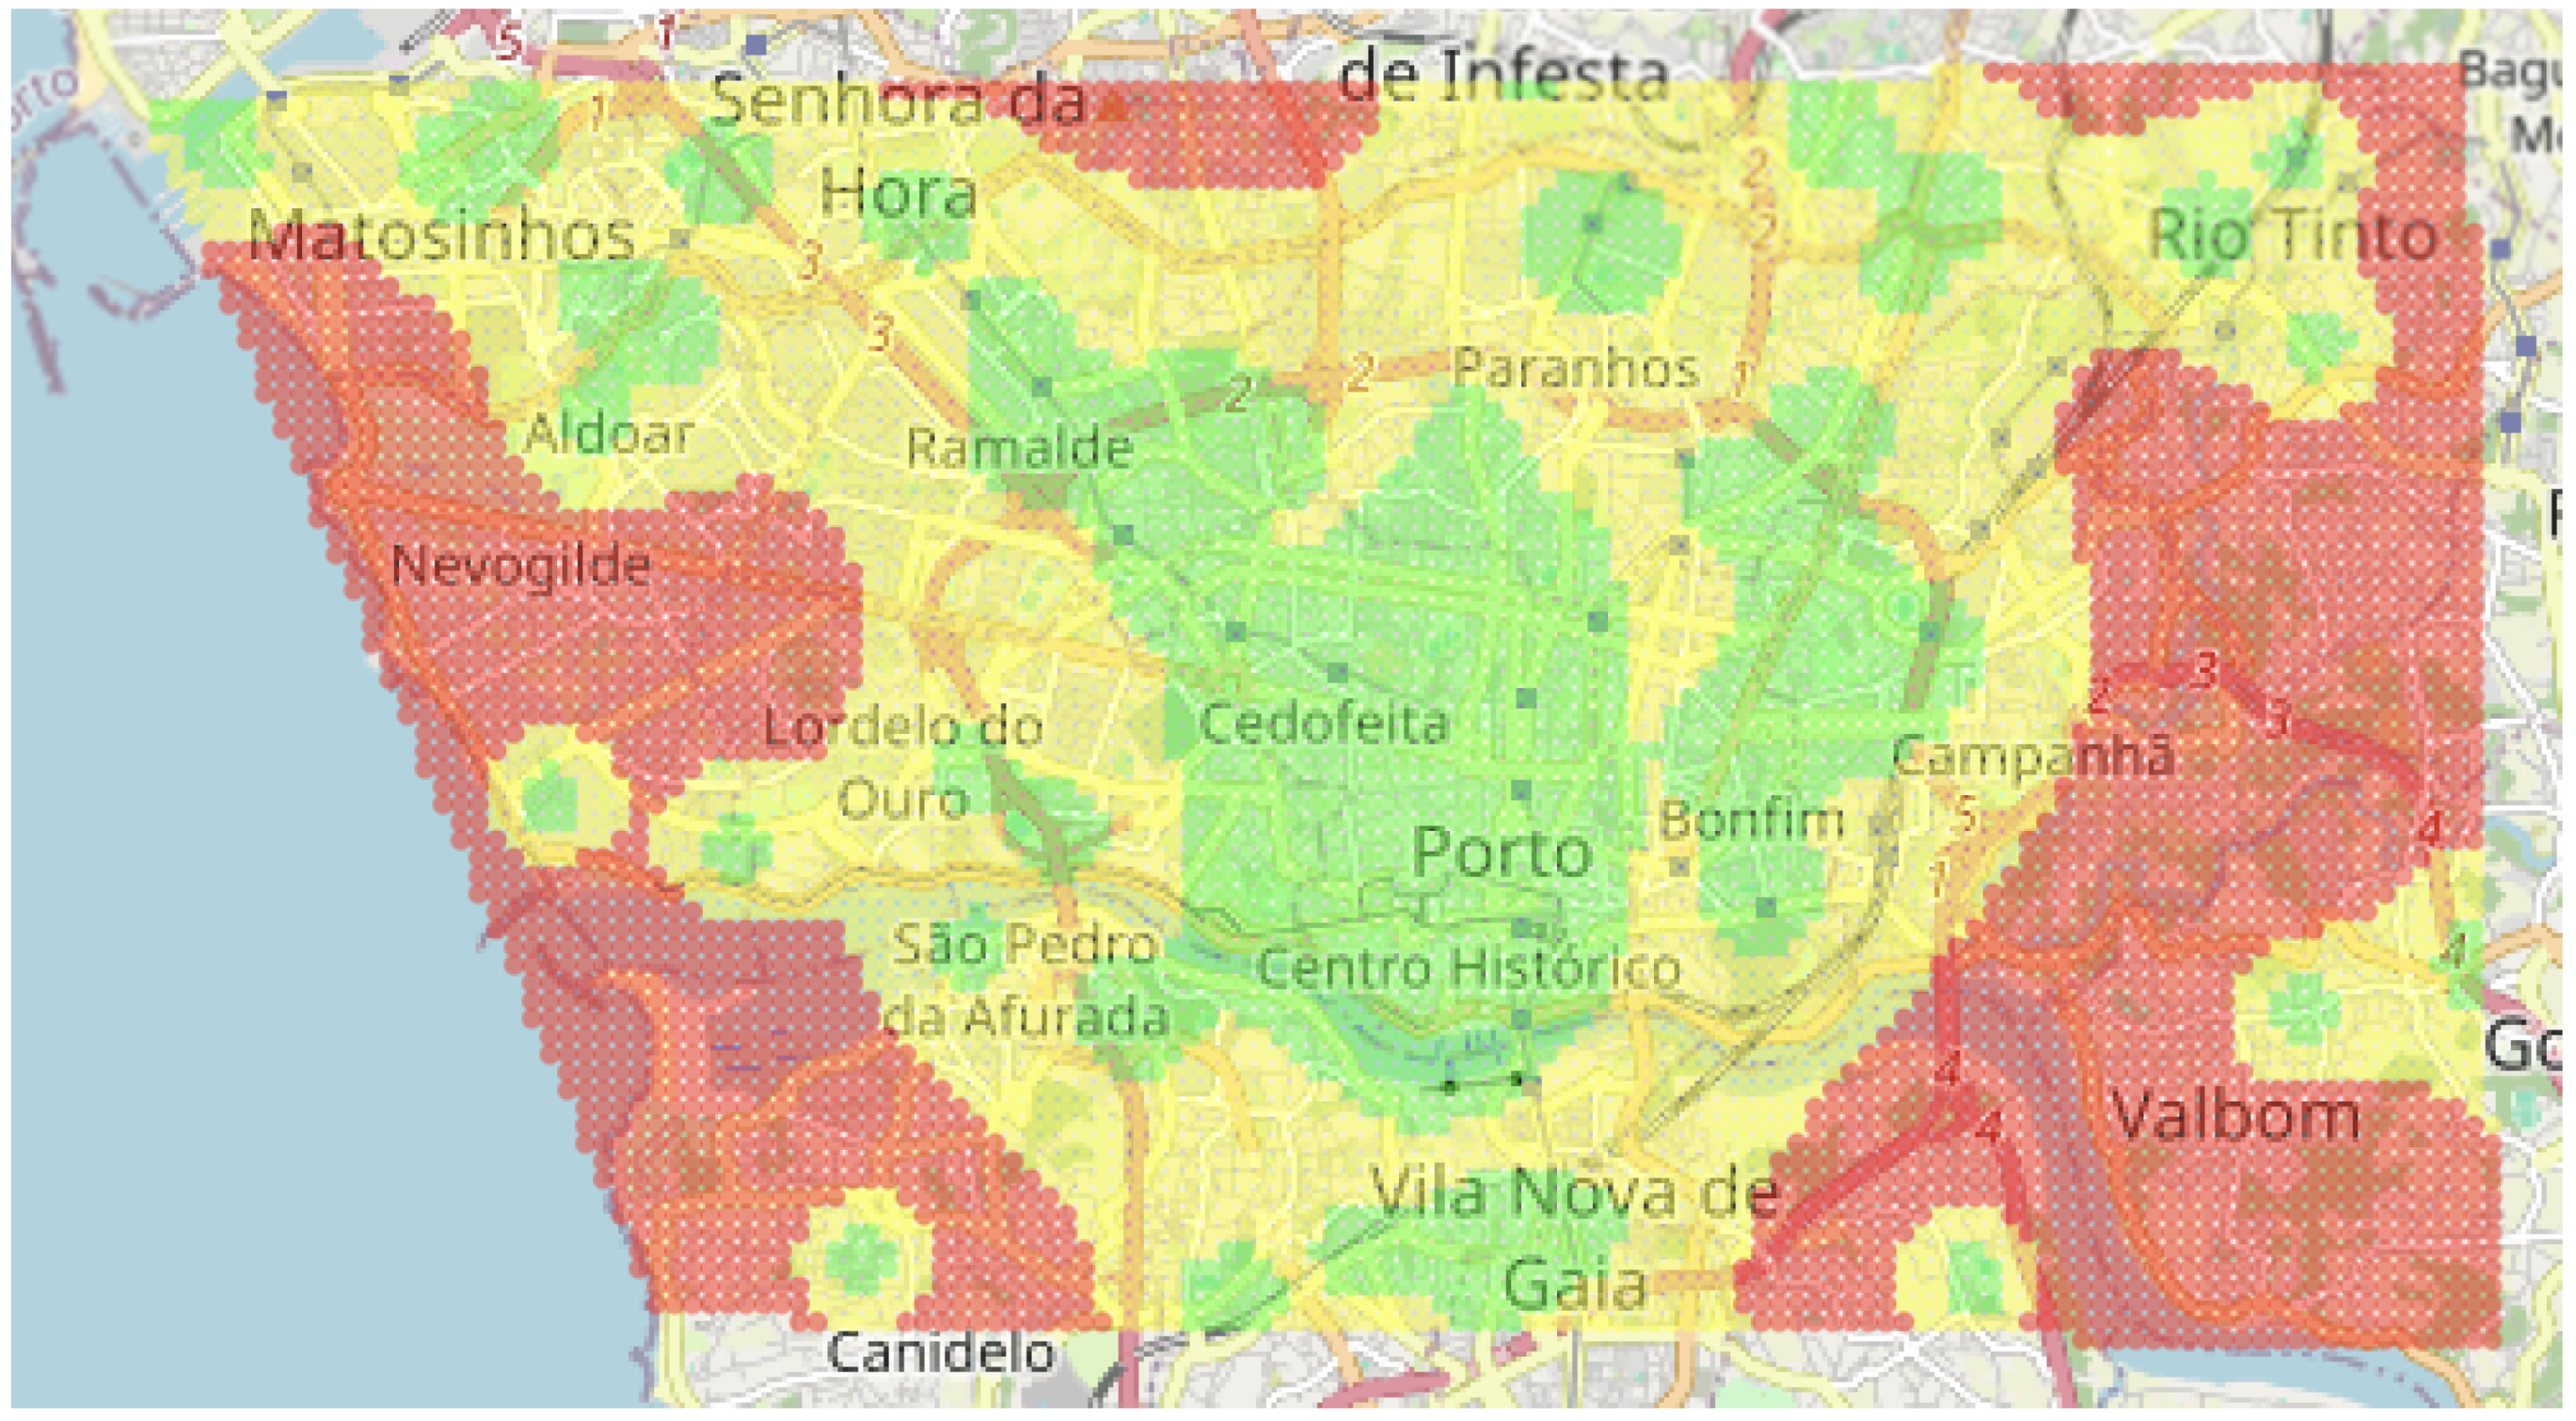
64].
Figure 16 presents the generated risk map for Porto and parts of surrounding cities, considering squared-shape zones with 100 m length and with hospitals being twice more relevant than other types of PoIs. This is due to the fact that hospitals can be assumed as more important during cycling accidents for the dispatching of EMS teams, but any other configuration of PoIs is possible.
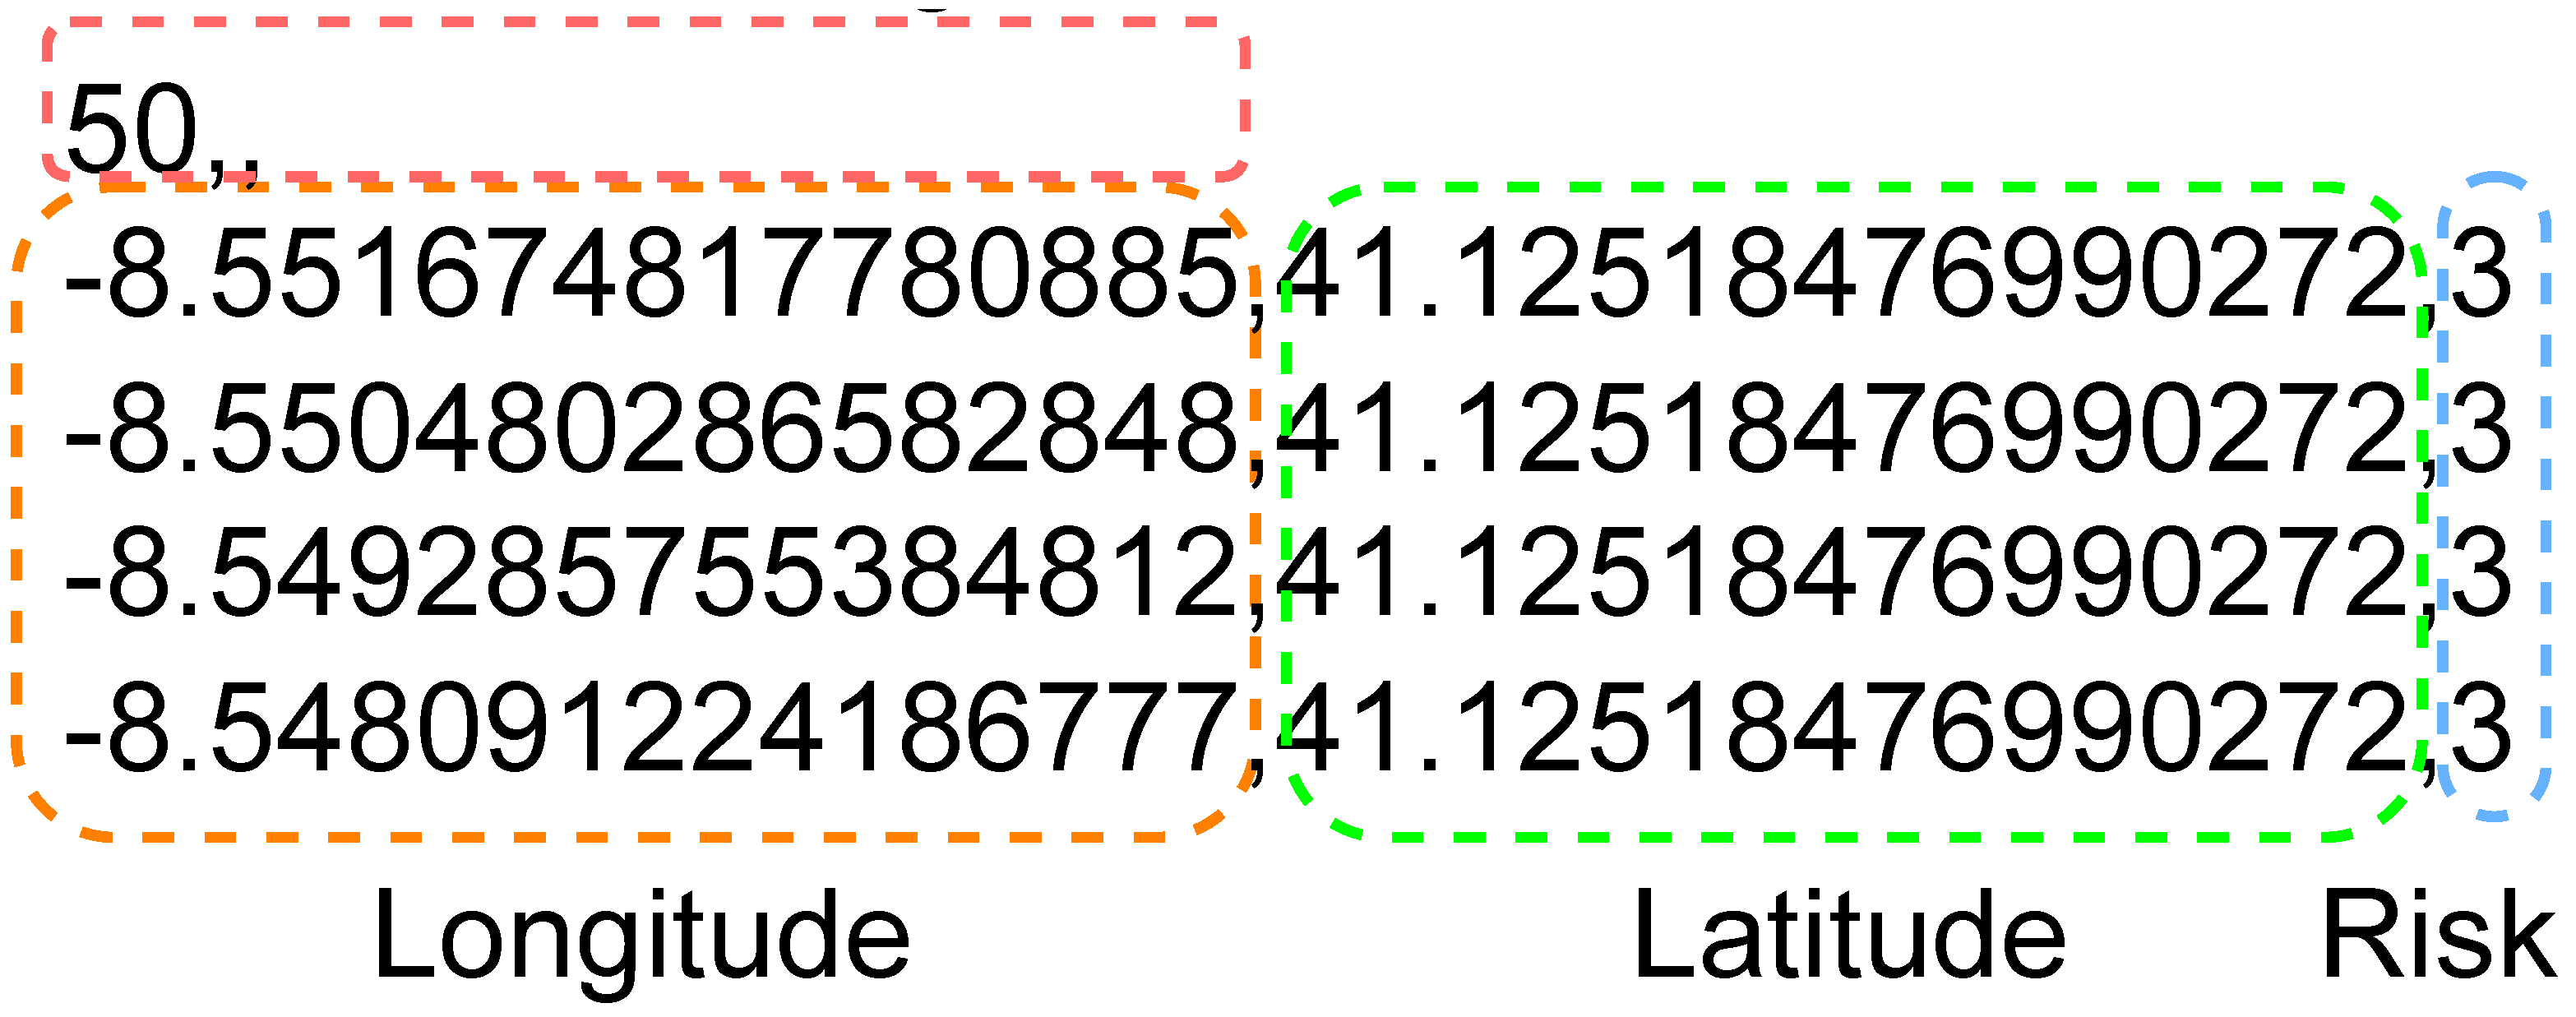
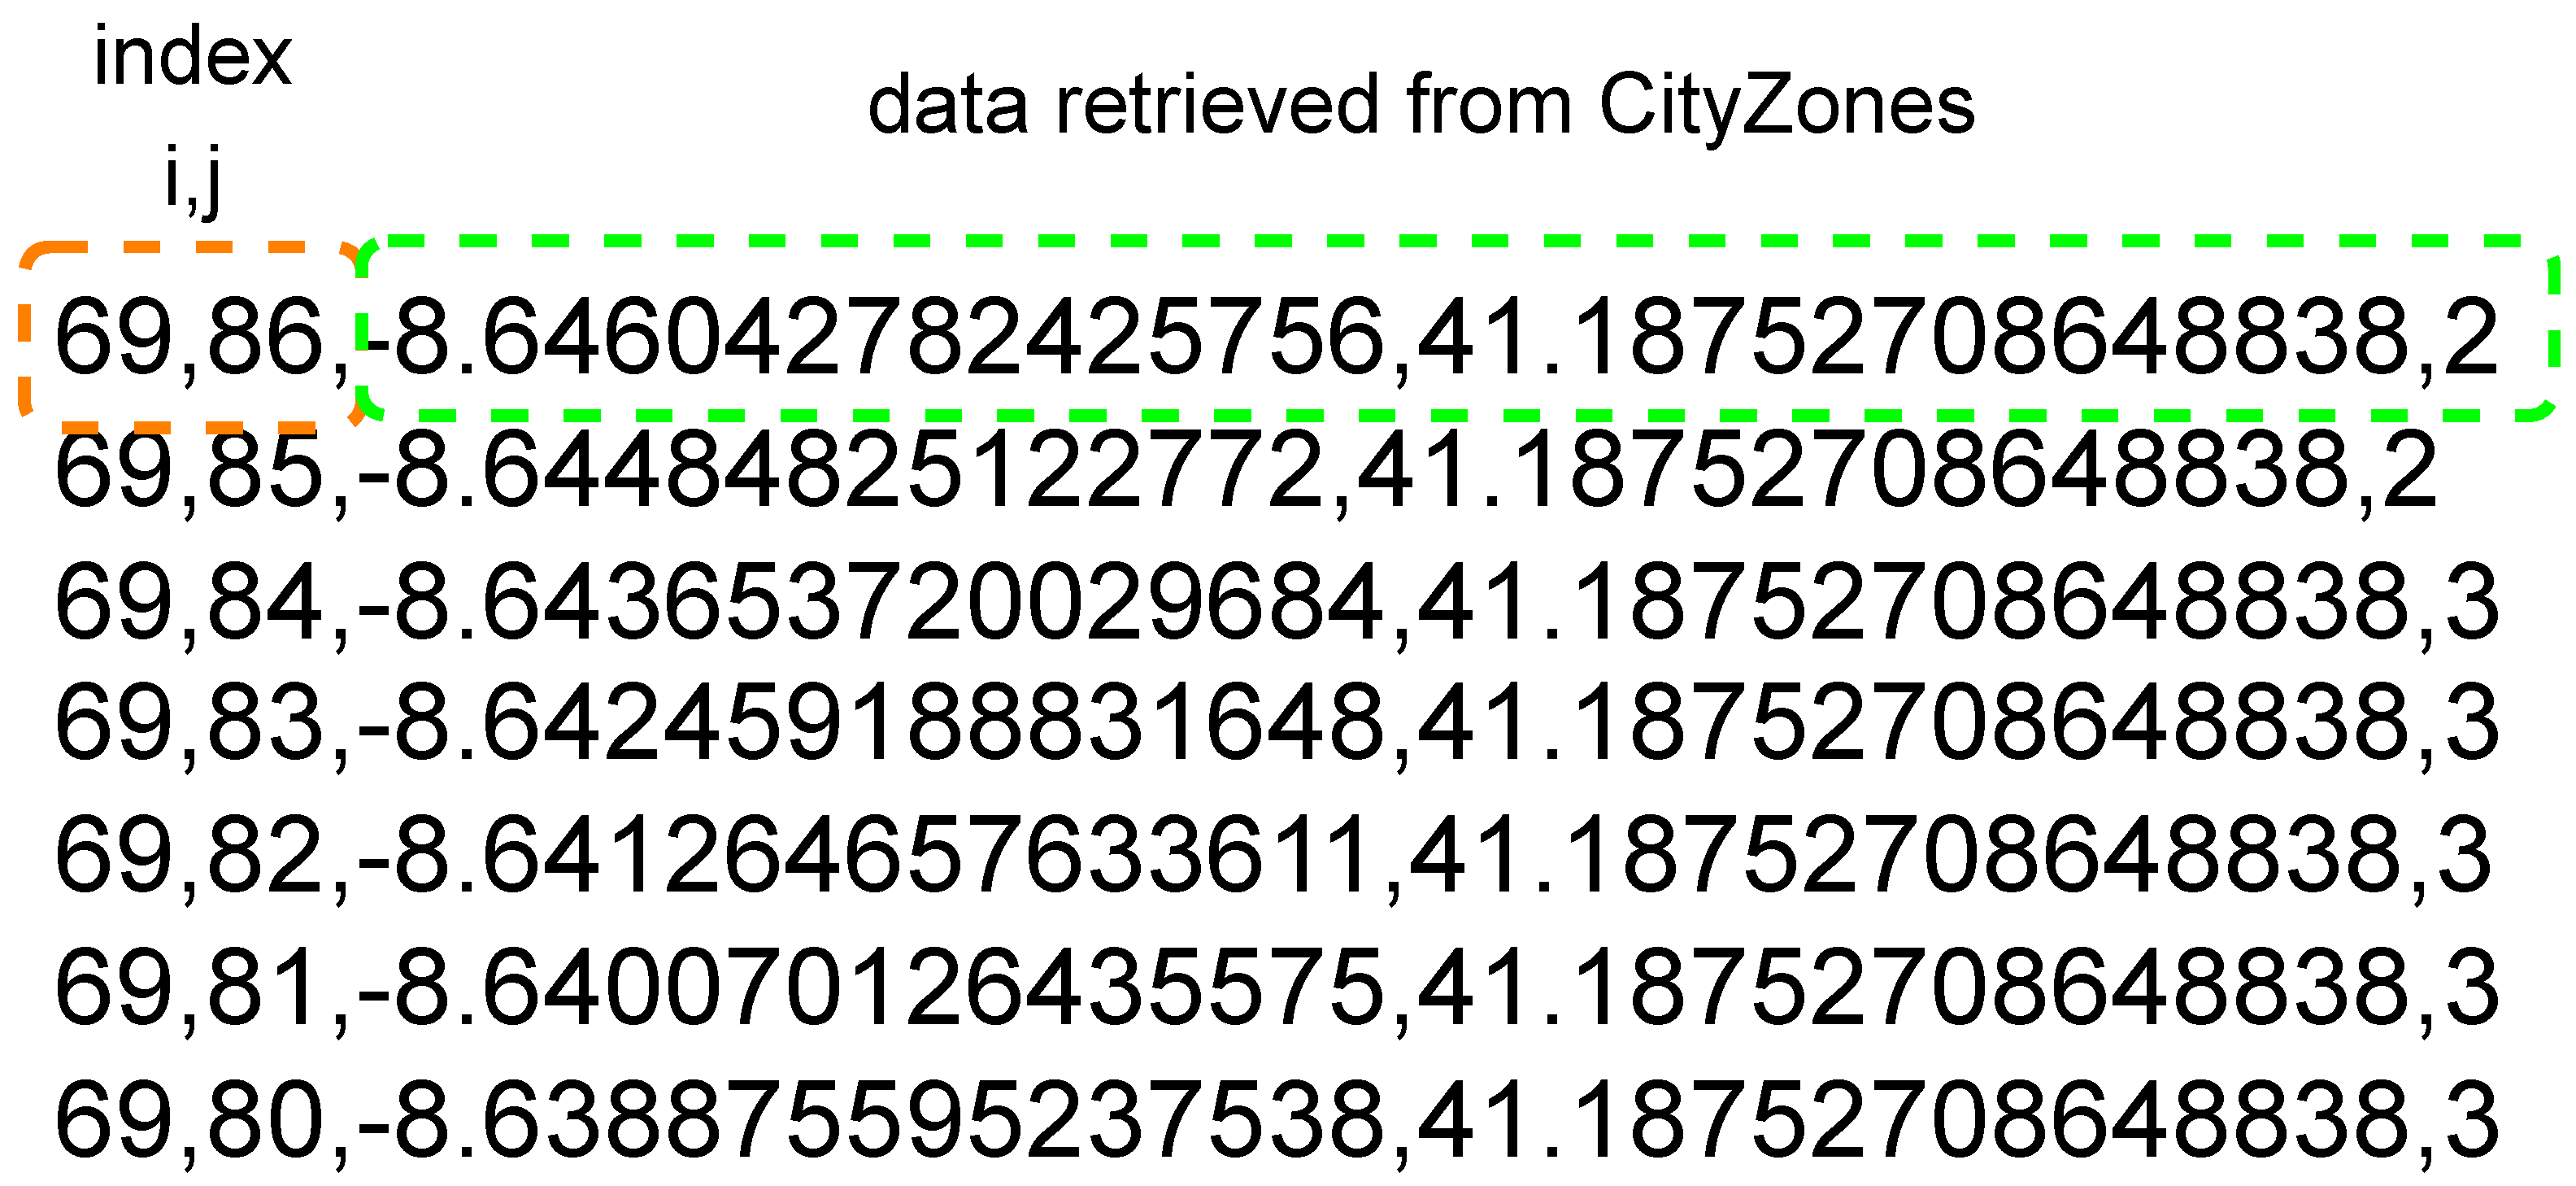
The CSV file returned by the CityZones tool was named “porto.csv”, having the format depicted in
Figure 17. The first line identifies the distance from the center to the side of the square, which was set at 50 m (zones with sides of 100 m).
The exported file contained 8208 computed risk zones and occupied approximately 322 KB. The next step after exportation was the manipulation of the file through the analysis of geospatial relationships between the various risk zones, following the proposed preprocessing algorithm.
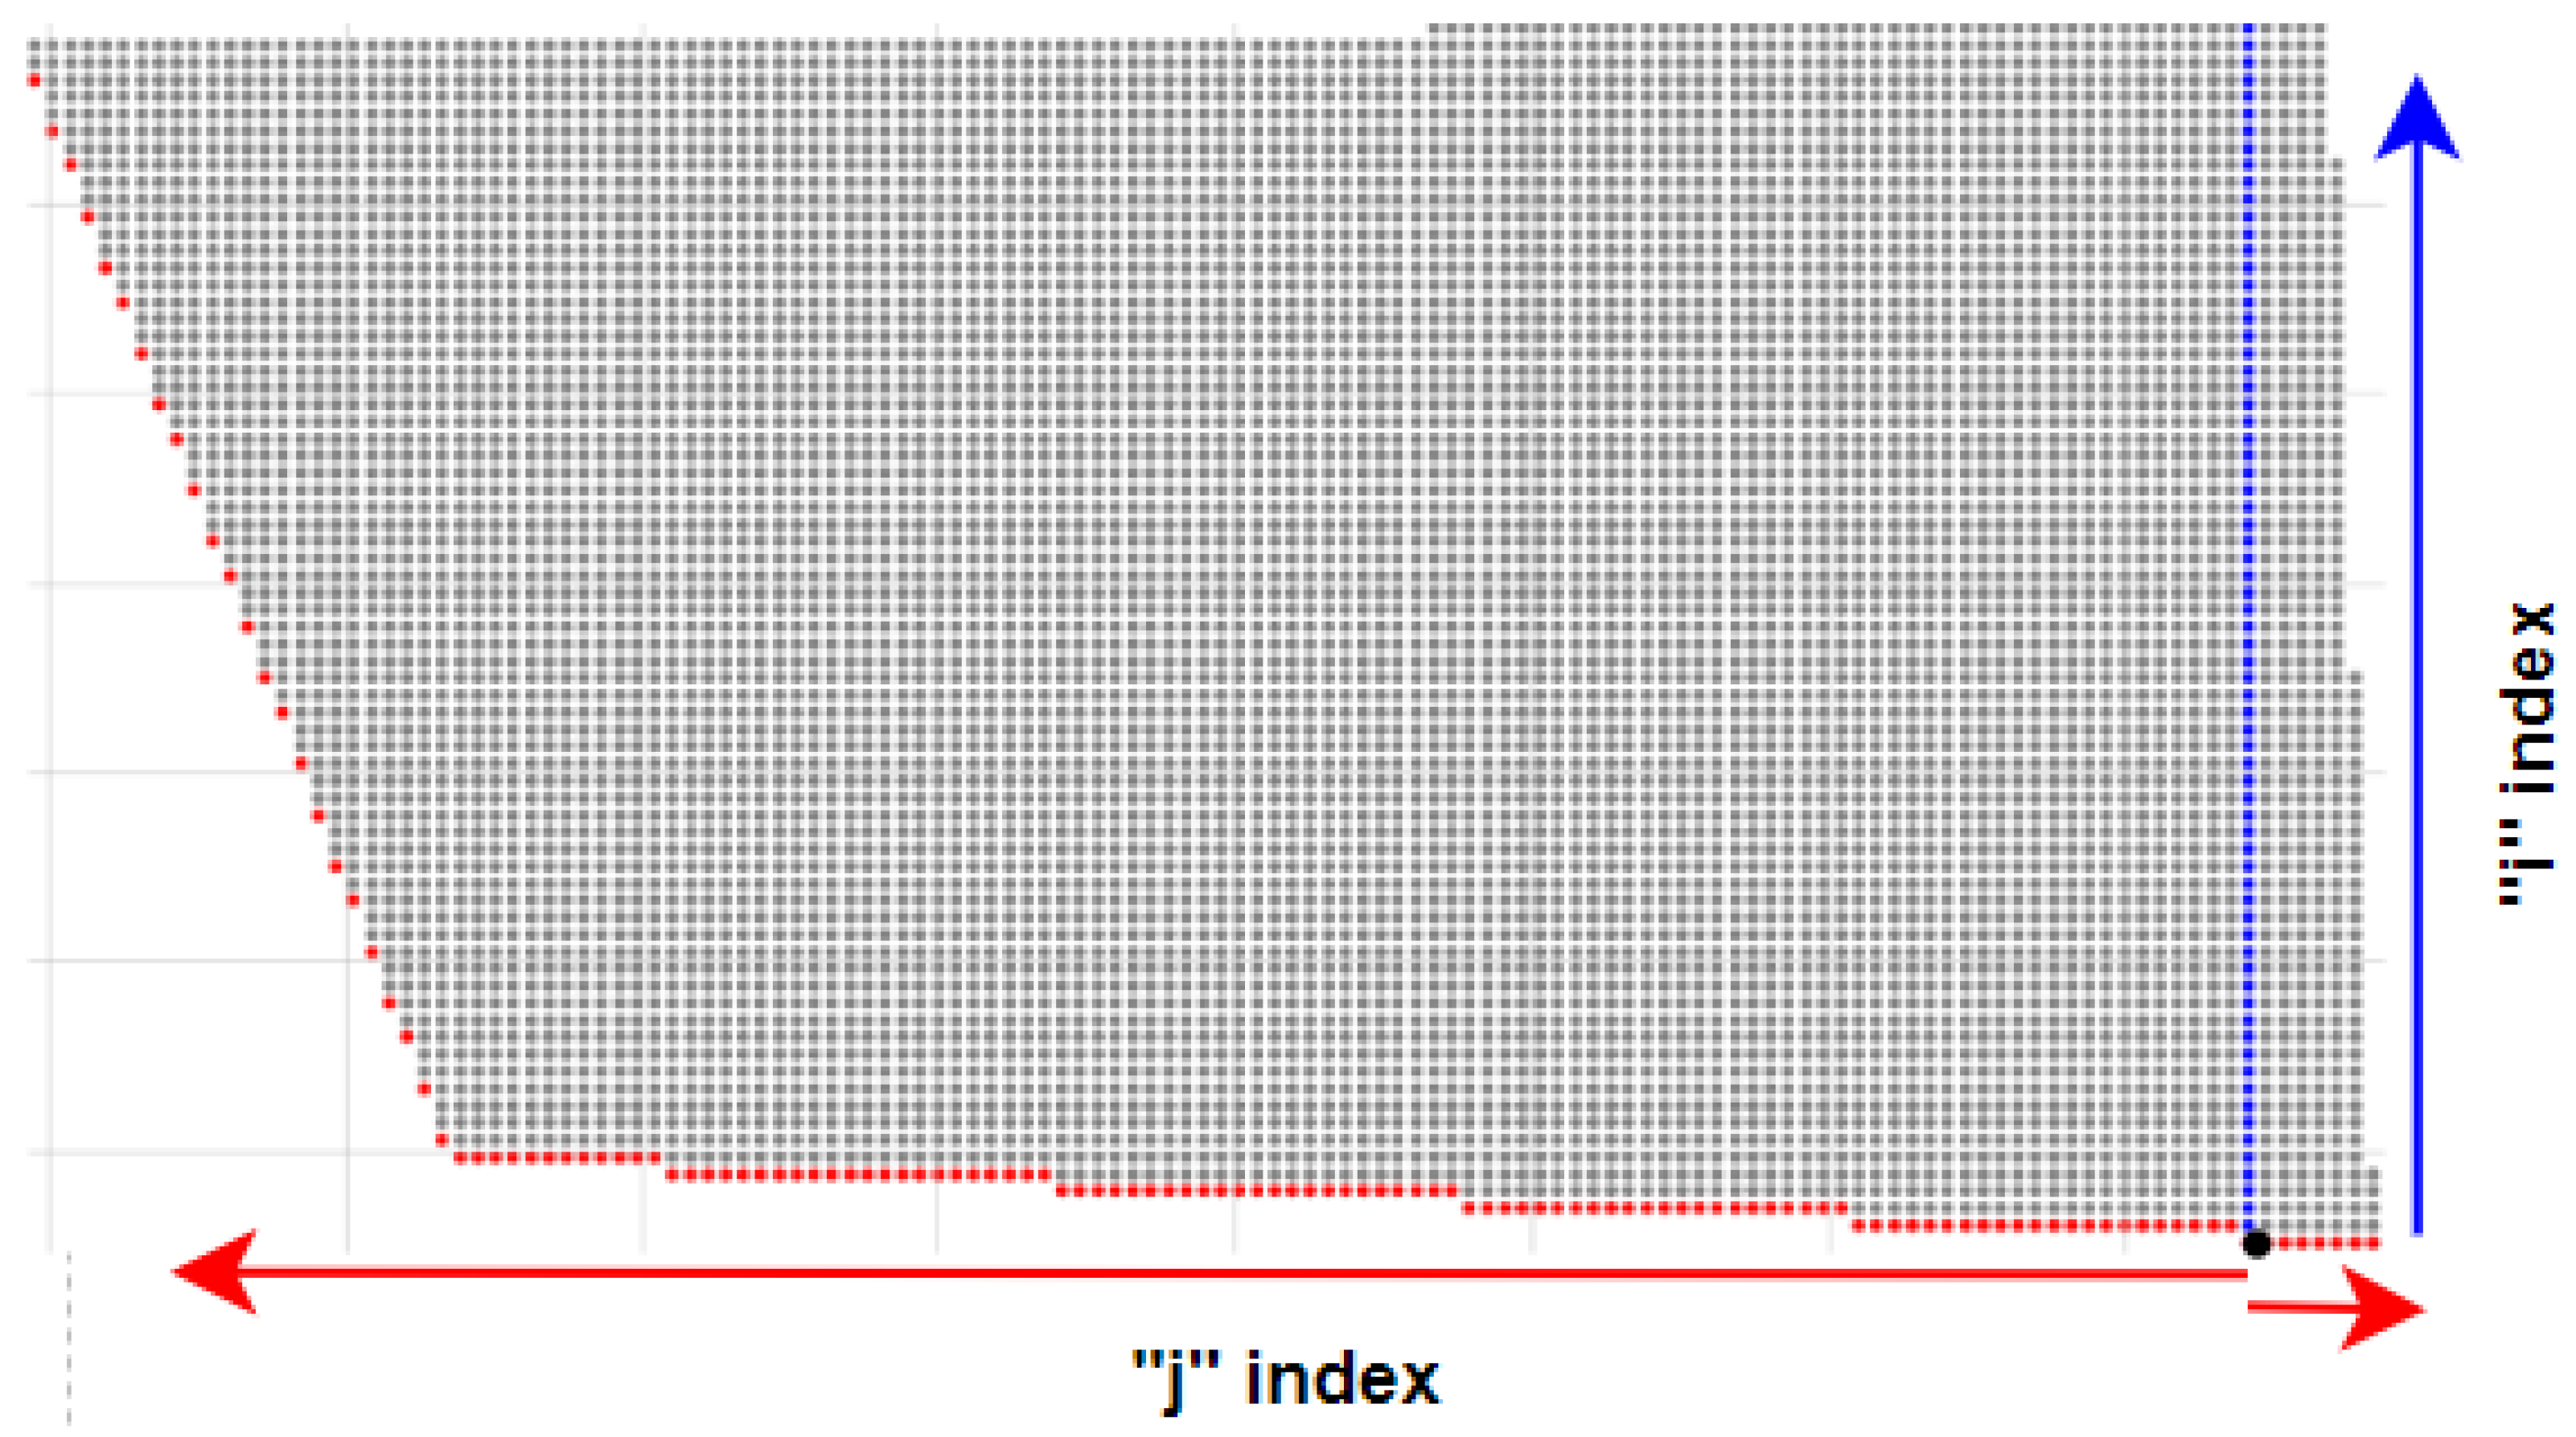
Using Equation (
1), it was possible to divide the quadrants and to identify the reference point lists for the creation of the matrix, as depicted in
Figure 18. The blue and red arrows indicate the orientation of the index increments, which increase as they move away from the origin (black point) and follow a sequential logic in a counterclockwise direction.
For the considered input map, 463 zone centers were found in the first quadrant, 7745 in the second quadrant, and 0 in the third and fourth quadrants. The indices for the reference list j range from [0, 7] for the first quadrant and [8, 122] for the second, thus the j index takes values between [0, 122]. The indices for the reference list i range from [0, 71].
The final preprocessing step involves assigning each index to each point in the reference list
j. The index value of that point is assigned to all points above it, while for the reference list
i, the index value is assigned to points with a
of 0° or 180° and subsequently intersected. The final result is also a CSV file with 8208 lines, following the format illustrated in
Figure 19.
After the preprocessing of the risk map present
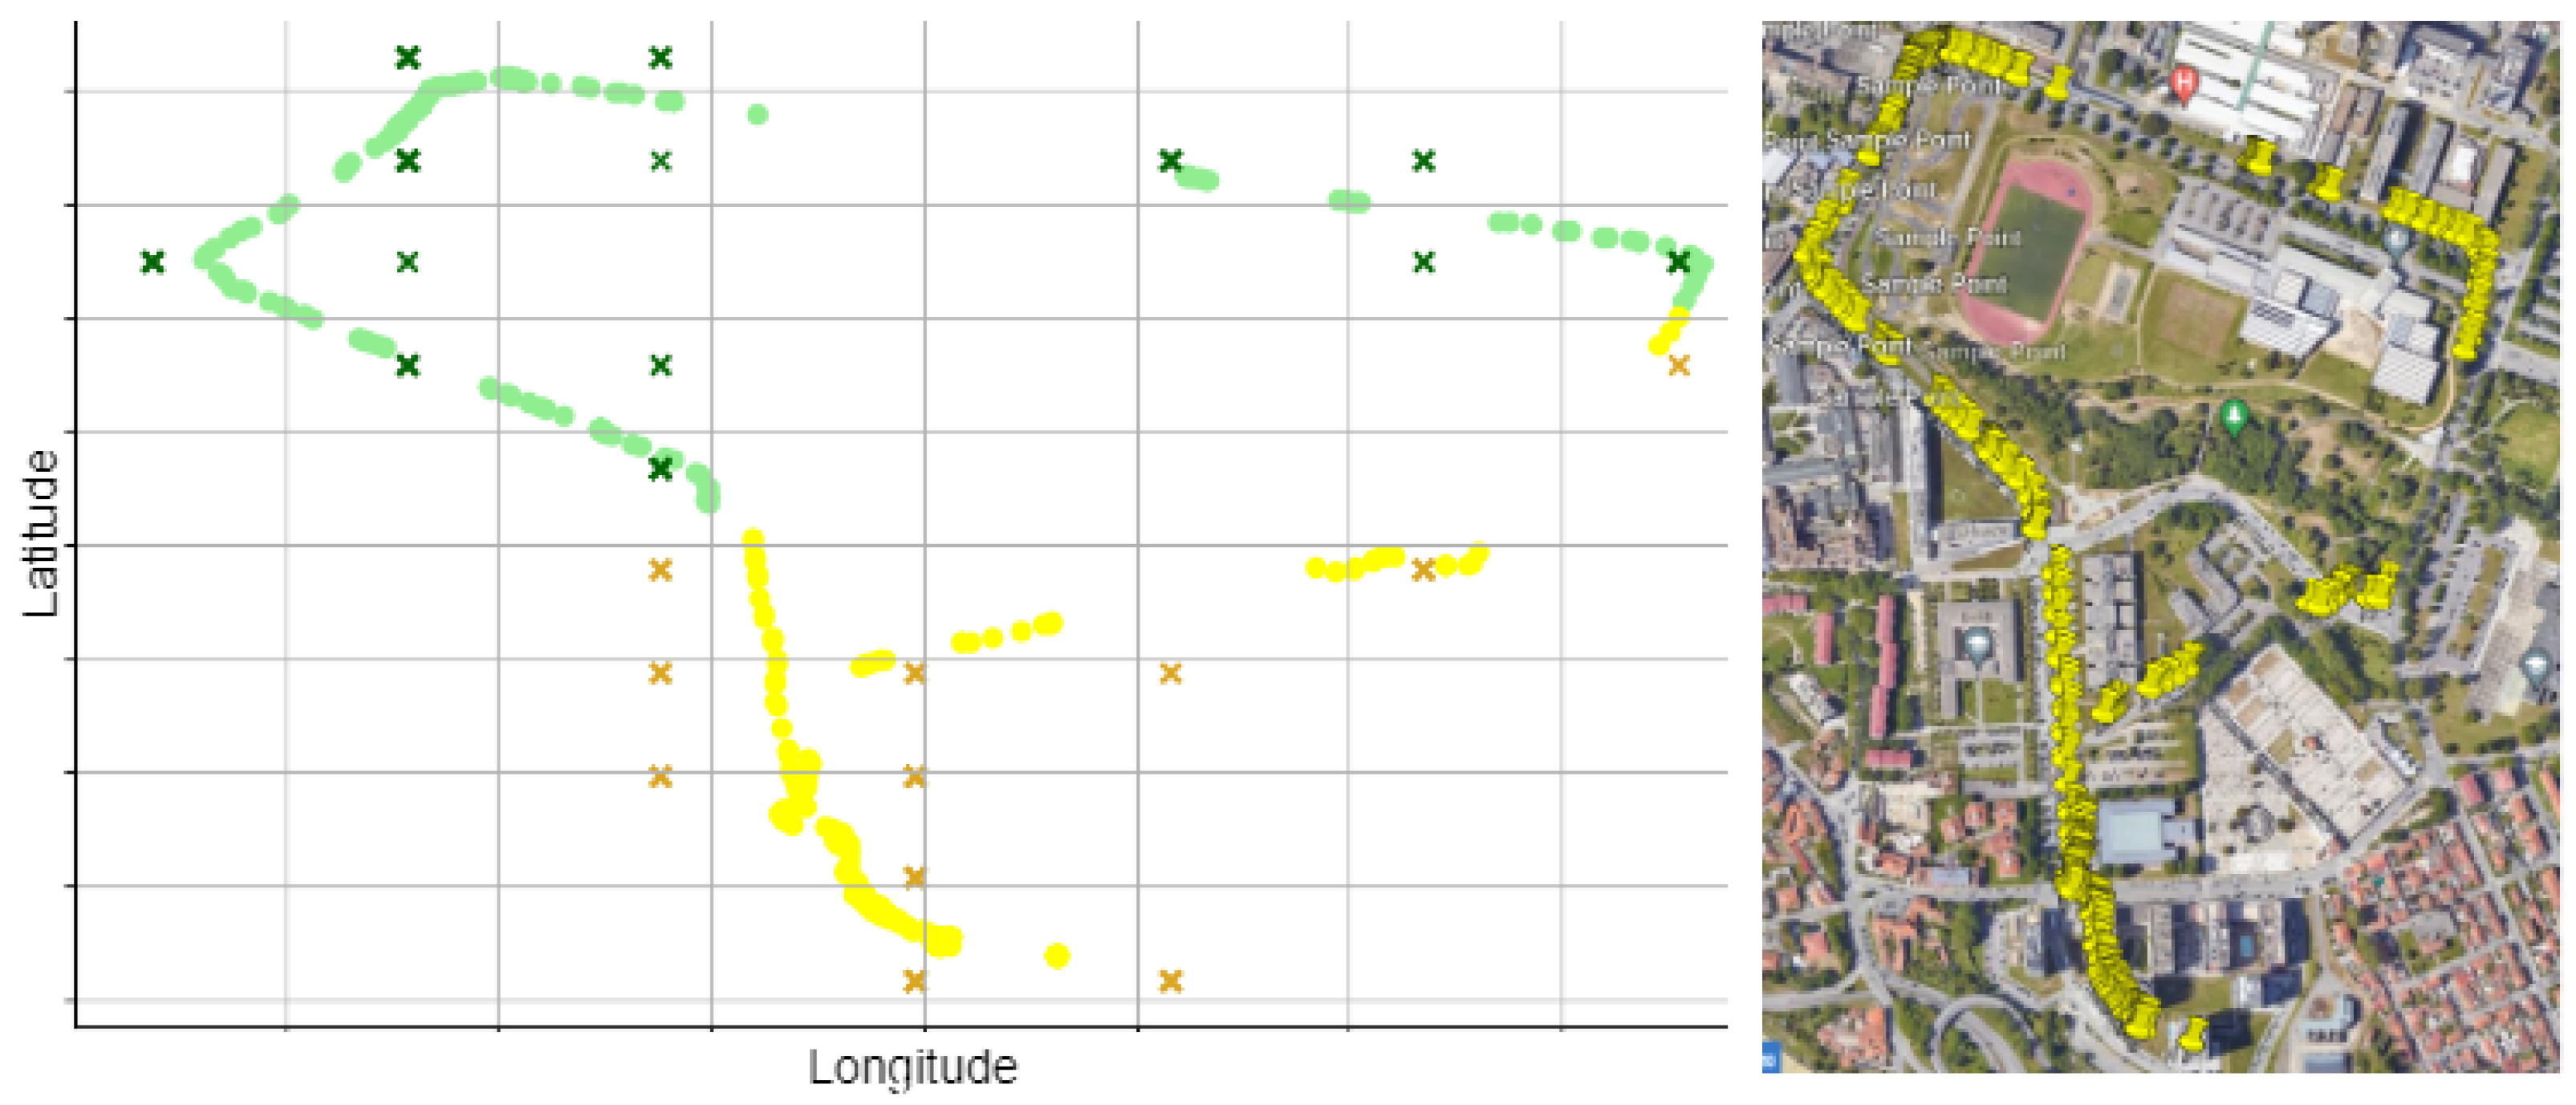
Figure 16, some routes could be taken to allow the evaluation of the SafeCycling module.
Figure 20 presents one of the results for an area around the Faculty of Engineering of the University of Porto, highlighting both the changes in risk levels (left) and the actual movement on a real map (right).
The missing data are resulted from loss of GPS signal. This factor was already anticipated by us, particularly due to the low-cost nature of the employed GPS hardware. Nevertheless, if a more efficient GPS receiver was adopted, this situation could be minimized.
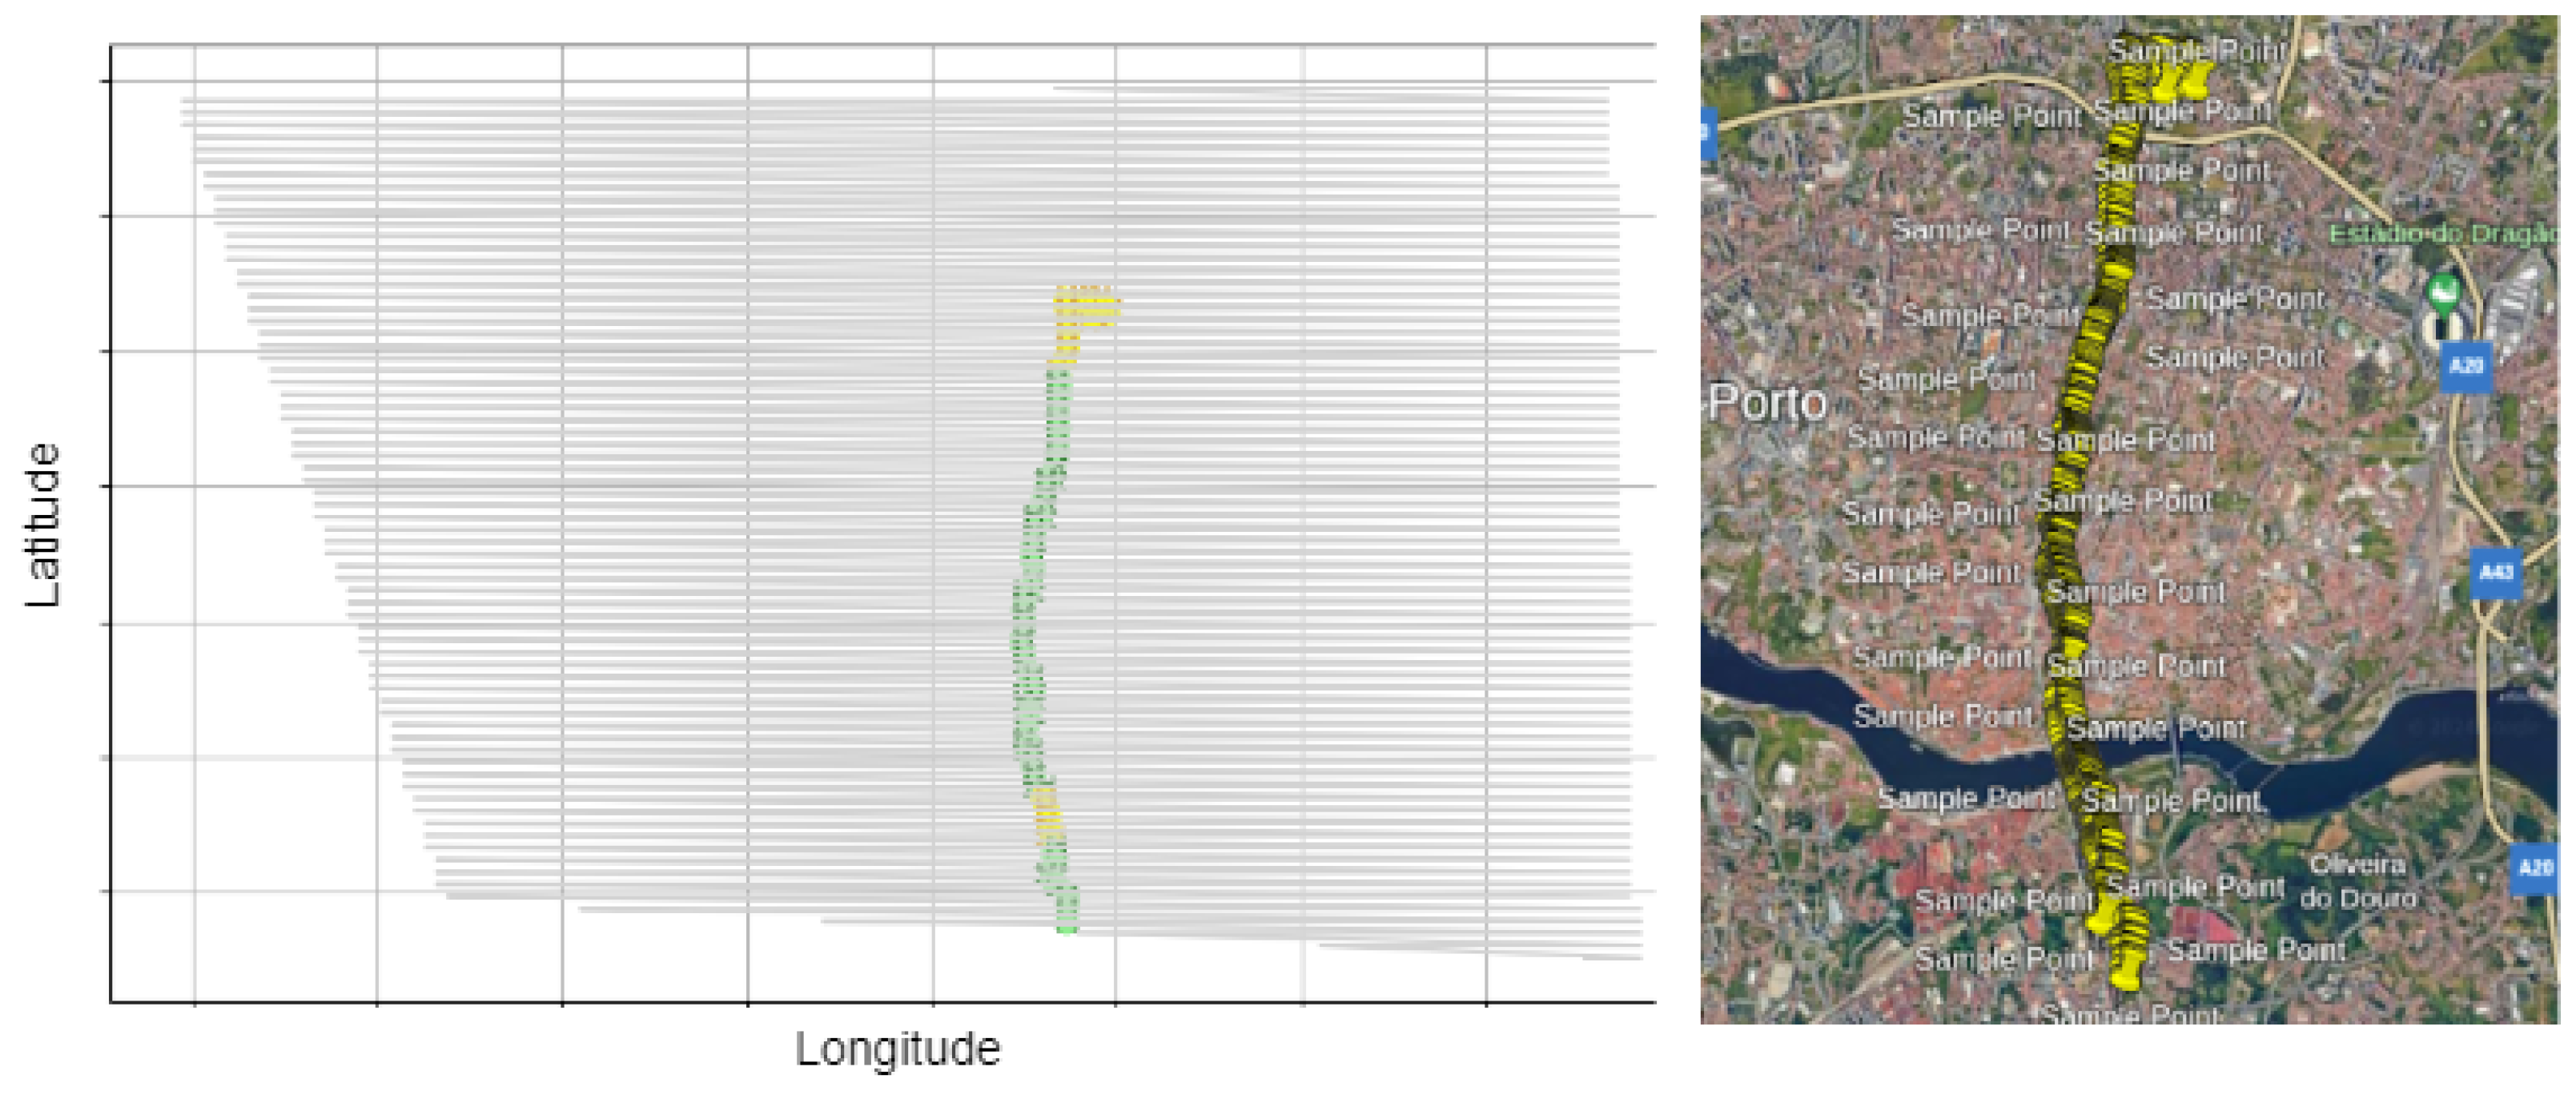
Another result can be seen in
Figure 21 for a longer route, this time highlighting the data structure of the processed risk map.
After experimentation, we could see that our approach performed as expected. The decision time after fetching a valid GPS coordinate was always below 300 ms, which we assumed as a very reasonable time. This allowed the SafeCycling unit to safely issue a new alert every second for the cyclist, which was our initial goal. Concerning the log file, every new line within a session file is 44 bytes, which imposes a very loose requirement for data storage. In fact, we recommend a microSD card for the Raspberry Pi Zero board sizing at least 16 GB, which is still very reasonable for the Pi OS Lite, eventual dependencies (defined in the GitHub repository), the SafeCycling code, the processed risk maps, and log files.
Regarding battery usage, all tests were conducted without constraints, but further assessment of energy consumption is still necessary. The prototype was designed with two independent 3D-printed cases, allowing for easy detachment of the 5 V power bank for recharging. By doing so, we favored a decoupled design of the SafeCycling module. Furthermore, while energy efficiency was not the primary focus of our approach, future investigations should also address this important aspect.
6. Discussions and Future Perspectives
The development of the SafeCycling system reflects several key trends in urban mobility and smart city initiatives, particularly the integration of Internet of Things (IoT) technologies. Utilizing geospatial data and real-time GPS tracking, embedded systems like SafeCycling offer dynamic risk assessments and alerts, enhancing safety and efficiency for urban cyclists. This trend highlights a growing emphasis on using IoT to create responsive, data-driven urban environments that adapt to the needs of residents in real time.
The selection of the Raspberry Pi Zero as the hardware base for SafeCycling underscores the trend towards creating cost-effective, scalable solutions for urban challenges. Low-cost hardware platforms enable the widespread deployment of safety-enhancing technologies, especially in budget-constrained municipalities. This democratization of technology ensures that innovative solutions can be widely adopted, promoting equitable access to safer urban infrastructure [
65,
66].
The use of open geospatial data are another significant trend. By leveraging publicly accessible datasets, similar projects might develop impacting solutions without relying on proprietary data sources. Such principle not only reduces costs, but also fosters collaboration and transparency in urban planning and development. Open data initiatives are becoming central to smart city strategies, enabling more informed decision-making and community engagement [
67].
Integrating emergency response capabilities into urban safety systems is a notable trend. SafeCycling’s focus on the proximity to emergency services as a risk factor highlights a shift towards holistic safety strategies that encompass both prevention and response. As urban areas continue to grow, ensuring rapid access to emergency services is becoming a priority, prompting the development of integrated solutions that mitigate risks and enhance overall urban resilience [
68].
In general, we can say that safe cycling is a comprehensive perception that involves multiple variables, directly or not associated with accidents. The proposed system aims to enhance cycling safety by enabling route selection based on the concept of emergency response infrastructures (risk zones). Doing so, cyclists could adjust their routes to avoid high-risk areas. While this is already implemented for a Raspberry Pi Zero board, the same algorithms could be executed in any hardware as a planning tool, and not necessarily as a real-time GPS-based solution. This flexibility enables cyclists to plan safer routes in advance using smartphones or smartwatches, leveraging the same underlying principles regardless of the device. This is an interesting trend that could leverage the algorithms developed in this work, since the principles would be the same.
Future research can explore more advanced data analytics and machine learning techniques to improve risk assessment accuracy. By analyzing larger datasets and incorporating additional variables like traffic patterns, weather conditions, and historical accident data, predictive models can be refined to offer more precise and context-aware risk alerts. Machine learning algorithms could continuously learn from new data, adapting and improving over time to provide increasingly reliable safety insights [
69].
Extensive user-centered design and usability studies will be necessary to ensure that systems like SafeCycling are intuitive and effective for cyclists. Understanding user behavior, preferences, and interaction patterns will be crucial in designing interfaces and alert mechanisms that are easy to use and do not distract cyclists. Future research could involve field trials and feedback loops to iteratively improve the system based on real-world user experiences.
Integrating cycling safety systems with broader urban mobility and smart city ecosystems is another promising research direction [
34]. This could include connections with public transportation networks, pedestrian safety systems, and vehicular traffic management. By creating a cohesive, interconnected urban mobility framework, cities can optimize overall transportation efficiency and safety, leveraging synergies between different modes of transport and infrastructure components.
Extending this discussion, applying the proposed solution in the context of shared bicycles could significantly enhance its practical usefulness and reach by providing real-time safety alerts to a broader user base. Shared bicycle systems are widely used in urban areas, and integrating the SafeCycling embedded unit into these bikes could offer immediate benefits to numerous cyclists, promoting safer travel routes and reducing accident risks. This implementation would allow users to receive dynamic visual and audible warnings about high-risk zones based on the city’s emergency response infrastructure, ensuring quicker access to help if needed. Moreover, as shared bicycles often attract tourists and casual riders unfamiliar with local routes, this technology could offer crucial guidance, making cycling in cities safer and more appealing. This approach might also leverage the extensive data from shared bicycle networks, potentially refining the system’s risk assessment algorithms further and enhancing urban mobility.
Future research should also focus on the scalability and adaptability of our approach across different urban contexts. Understanding how varying city layouts, infrastructure quality, and local regulations impact the system’s effectiveness will be important. Comparative studies across diverse urban environments can provide insights into necessary adjustments and enhancements, ensuring broad applicability [
35].
Finally, exploring the policy and governance implications of deploying such technologies in urban areas is crucial. This includes examining regulatory frameworks, data privacy concerns, and the role of government and private sector partnerships in sustaining and scaling these innovations [
26]. Understanding the interrelation between technology, policy, and urban governance will be critical in creating supportive environments for the widespread adoption of cycling safety systems and other smart city solutions. By addressing these future research directions, stakeholders can build on the initial successes of projects like ours, driving forward the vision of safer, smarter, and more sustainable urban mobility.
7. Conclusions
The integration of innovative technologies into urban environments represents a significant leap forward in addressing the safety challenges faced by cyclists in densely populated areas. By leveraging cost-effective hardware and open geospatial data, the system provides real-time risk assessments and alerts, thereby enhancing cyclist safety and promoting sustainable urban mobility. The preliminary success of the SafeCycling system in Porto, Portugal, underscores its practical applicability and the potential for widespread adoption in various urban settings.
Future research and development efforts must focus on refining our approach through advanced data analytics, machine learning, and user-centered design. By incorporating additional variables, we plan to enhance the efficiency of our systems when alerting about potential risks. Moreover, by understanding the interactions between technology, policy, and urban planning, we plan to develop potential guidelines for enhanced safety. We believe that our approach is an important initial step toward more sustainable cycling in smart cities, but new developments should improve its applicability.
