Article

Optimal Dispatch Strategy for Electric Vehicles in V2G Applications

by
Ali M. Eltamaly
1,2,3
1
Sustainable Energy Technologies Center, King Saud University, Riyadh 11421, Saudi Arabia
2
Saudi Electricity Company Chair in Power System Reliability and Security, King Saud University, Riyadh 11421, Saudi Arabia
3
Electrical Engineering Department, Mansoura University, Mansura 35516, Egypt
Smart Cities 2023, 6(6), 3161-3191; https://doi.org/10.3390/smartcities6060141
Submission received: 16 September 2023 / Revised: 30 October 2023 / Accepted: 6 November 2023 / Published: 20 November 2023

Abstract

:
The overutilization of electric vehicles (EVs) has the potential to result in significant challenges regarding the reliability, contingency, and standby capabilities of traditional power systems. The utilization of renewable energy distributed generator (REDG) presents a potential solution to address these issues. By incorporating REDG, the reliance of EV charging power on conventional energy sources can be diminished, resulting in significant reductions in transmission losses and enhanced capacity within the traditional power system. The effective management of the REDG necessitates intelligent coordination between the available generation capacity of the REDG and the charging and discharging power of EVs. Furthermore, the utilization of EVs as a means of energy storage is facilitated through the integration of vehicle-to-grid (V2G) technology. Despite the importance of the V2G technology for EV owners and electric utility, it still has a slow progress due to the distrust of the revenue model that can encourage the EV owners and the electric utility as well to participate in V2G programs. This study presents a new wear model that aims to precisely assess the wear cost of EV batteries, resulting from their involvement in V2G activities. The proposed model seeks to provide EV owners with a precise understanding of the potential revenue they might obtain from participating in V2G programs, hence encouraging their active engagement in such initiatives. Various EV battery wear models are employed and compared. Additionally, this study introduces a novel method for optimal charging scheduling, which aims to effectively manage the charging and discharging patterns of EVs by utilizing a day-ahead pricing technique. This study presents a novel approach, namely, the gradual reduction of swarm size with the grey wolf optimization (GRSS-GWO) algorithm, for determining the optimal hourly charging/discharging power with short convergence time and the highest accuracy based on maximizing the profit of EV owners.

1. Introduction

The exponential growth in the production and utilization of electric vehicles (EVs) has necessitated a comprehensive examination of their influence on conventional power networks, potentially giving rise to numerous challenges. The issues of reliability, contingency escalation, and rising transportation expenses are among the foremost concerns. One of the most effective strategies employed was the implementation of renewable energy distributed generator (REDG) within the distribution system. This approach aimed to diminish the reliance on conventional energy sources, enhance the power system’s capacity, mitigate transmission line losses, and minimize associated expenses, among other benefits.
The coordination between the generation from REDG sources and the charging/discharging time of EVs is essential due to the unpredictable nature of the REDG. This coordination can be effectively performed by implementing demand-side management (DSM) techniques. Furthermore, it is important to implement an energy storage system (ESS) that can potentially result in an elevated cost of the produced energy, owing to the substantial expenses associated with these systems. One of the most intelligent methods employed to address these challenges involves utilizing EV batteries as an ancillary service to establish an ESS through the implementation of vehicle-to-grid (V2G) technology. Since lithium-ion batteries are the most widely used kind in electric vehicles, particular attention should be paid to the SoC of these batteries [1,2,3].
The utilization of the stored energy in EV batteries can provide valuable support to the power system through many means, including frequency support, peak shaving, load balancing, and energy arbitrage. This technology has the potential to enhance the power system’s capacity and eliminate the necessity for centralized power plants or centralized ESS. Consequently, it can enhance the performance of the power system and lead to a reduction in energy costs. In the context of V2G operations, EVs can charge at low rates and afterward discharge the stored energy to the electric grid during high tariff periods. This bidirectional V2G arrangement enables the EVs to function as both energy consumers and suppliers [4,5].
The utilization of V2G technology will yield advantages for both EV owners and system suppliers. EV owners stand to gain advantages from the disparity in tariffs between peak and off-peak periods. In addition, energy suppliers stand to gain advantages by mitigating the substantial capital investments necessary for the installation of additional power plants to accommodate the rising load demand and the growing prevalence of EV charging stations. The primary concern associated with this technology pertains to the requirement for intricate communication systems and advanced control mechanisms for the bidirectional power electronics converter. Furthermore, the presence of imprecise wear models within EV batteries has impeded and discouraged the adoption of this technology among EV owners. Another technological solution that can enhance the power system’s performance involves the implementation of unidirectional regulated charging. This approach enables the rescheduling of EV charging periods to occur during low tariff periods, thereby mitigating peak demand and addressing any generation shortages from REDG units [6]. Moreover, this study is used to model the optimal scheduling of the charging/discharging of one battery EV as an example, and meanwhile, the same methodology can be used with other sizes or types of BEVs or PHEVs based on their battery capacities.
Numerous studies have been conducted to compare the bidirectional V2G and unidirectional charging grid-to-vehicle (G2V) systems of EVs [4,7]. The aforementioned studies have demonstrated that the utilization of the unidirectional G2V technology can result in a 25% decrease in energy costs, a level comparable to that attained by the bidirectional V2G technology [4,5]. Furthermore, the utilization of V2G technology has the potential to accept five times the quantity of EVs compared to the power system employing the unidirectional G2V technology [4,7]. According to a comprehensive analysis, a comparative examination of the advantages associated with the V2G and G2V approaches revealed that the V2G strategy can result in a reduction of 11% in the total running cost, while the G2V approach can achieve a reduction of 7% [4,5,8]. According to previous research, it has been determined that the implementation of V2G technology can result in a 15% decrease in the overall cost of charging [9]. Furthermore, it has been determined through several studies that the V2G technology exhibits a noteworthy 12.3% surge in annual revenue when compared to the delayed G2V technology where the EV owners pay the cost of EV power consumption [10]. Numerous studies have advocated for the adoption of the G2V configuration in EVs due to the intricate communication system, the control of the power electronics converter, and the relatively low confidence of EV owners in V2G models [11,12]. These studies highlight the G2V configuration’s limited yet valuable role in frequency regulation, peak shaving, and valley filling of the load curve [4,9,13,14]. Previous research has determined that the implementation of V2G technology has the potential to decrease peak energy consumption by 36% and relocate 54% of the peak energy period to the off-peak period, as evidenced by multiple studies [10,15]. A separate study has determined that the implementation of V2G technology has the potential to decrease peak energy demand and redistribute this energy to off-peak periods, resulting in a potential investment reduction ranging from 5% to 35% [16]. Additionally, it has been found that V2G technology can lead to a 40% reduction in energy losses compared to the uncontrolled charging strategy, also known as “dumb charging”, where EVs are charged immediately upon connection to the electric utility [10].

1.1. Dispatch Architectures of V2G Technology

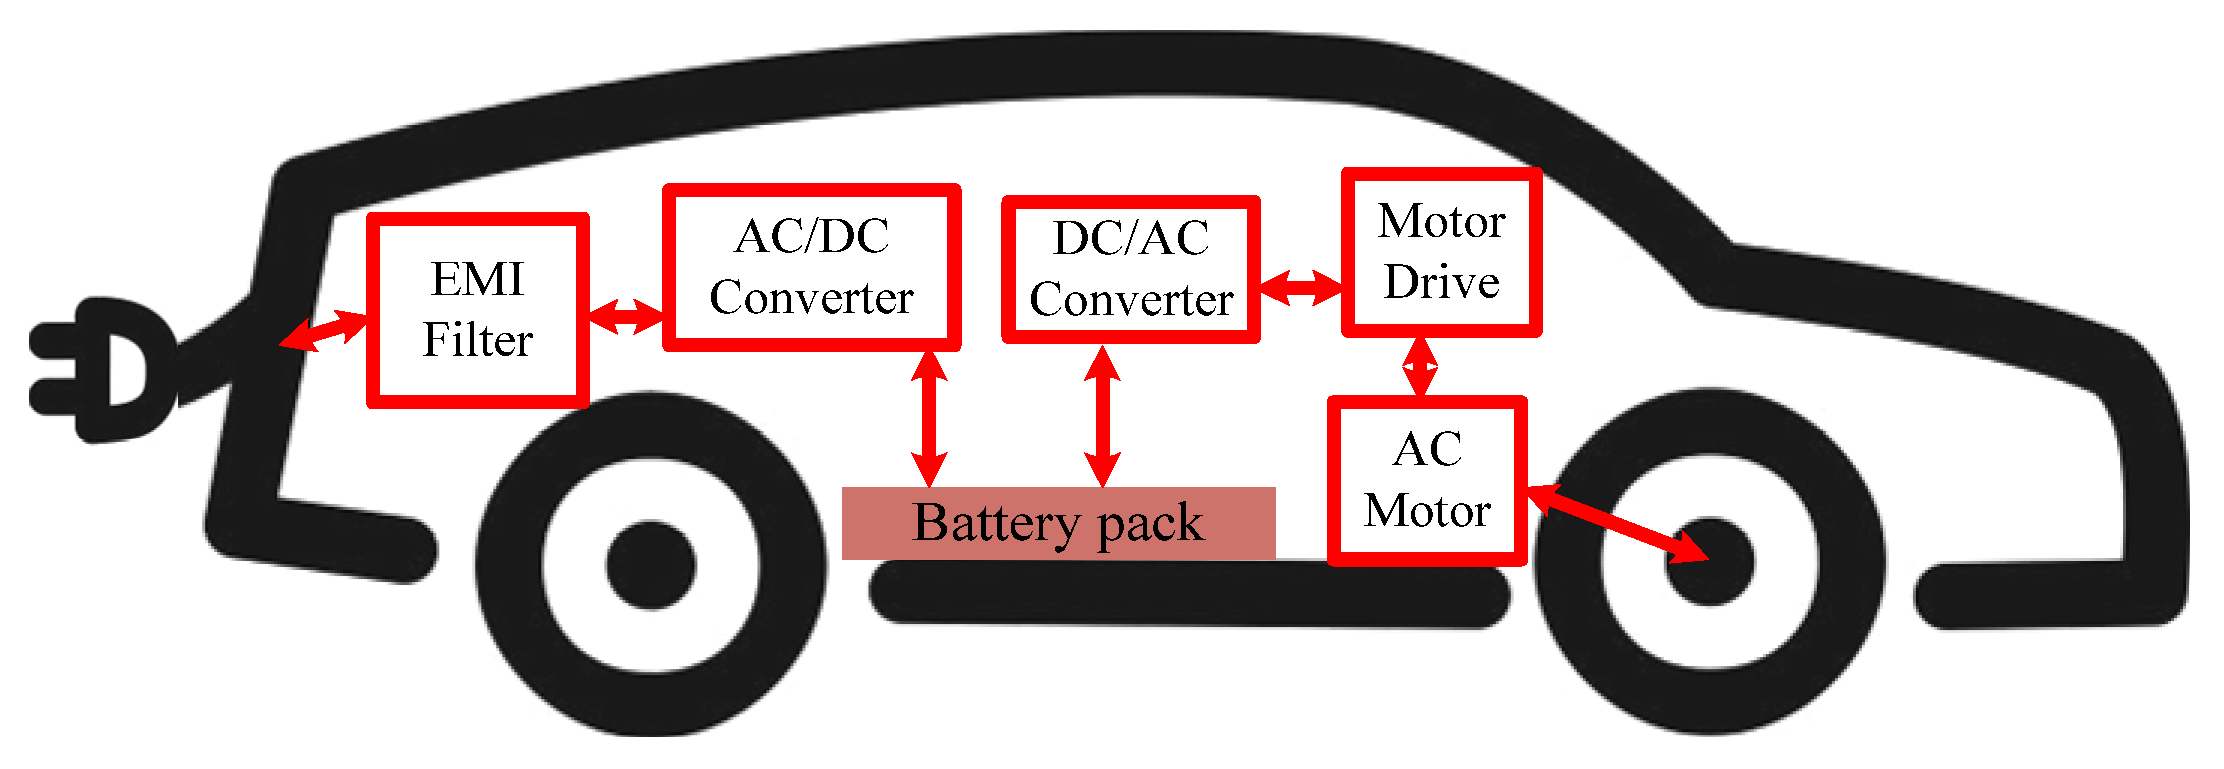
Two distinct dispatch architectures can be employed for the implementation of V2G technology. The first architectural design is referred to as the deterministic or centralized approach, as seen in Figure 1 [17]. The alternative strategy is referred to as the aggregative or decentralized method, as depicted in Figure 2 [18,19,20,21]. The charging and discharging performances of EVs under the centralized design are regulated through a central control system operated by the power system operator. The primary aggregator functions by treating EVs as a virtual power plant (VPP), enabling it to be managed in a manner that allows for the provision or absorption of real and reactive power from the power system [17]. This management is carried out by the specifications set by the system operator. The present control system can effectively regulate the charging and discharging activities of individual EVs. Furthermore, this system can arrange the involvement of each EV according to certain priority criteria, as exemplified in reference [19]. The implementation of an advanced optimization algorithm is necessary for determining the optimal contribution from each EV to maximize the revenue of both the EV owners and the electric utility. Simultaneously, the central aggregator can deliver the most efficient power for charging or discharging EVs without necessitating collaboration with the EV fleets. The implementation of this system necessitates the utilization of intricate communication and sensor technologies, which impose a substantial computing load, particularly when accommodating a considerable quantity of EVs integrated into the system. Additionally, this system infringes on the privacy of EV owners, as their activities will be accessible to the system operator. Furthermore, the implementation of this architectural design raises concerns regarding cyber-security, as any malicious cyber-attack targeting the operating system has the potential to compromise the charging infrastructure for all interconnected EVs. Due to this rationale, it shall not be employed in the present investigation. The alternative architecture is referred to as the aggregative or decentralized architecture for EV aggregation [20,21]. There is no control from the power system operator on the power dispatch from the EV aggregator in the decentralized model. The use of V2G in the decentralized model for sure is not the only ESS device that is connected to the smart grid systems. In case of abnormal operating conditions, the smart grid should have predetermined measures such as the use of support from other ESS devices or/and changing the TOU tariff that can convince the customers and EV aggregators to recalculate the optimal dispatch power to use the EV batteries whenever the tariff changes. The optimization algorithm for each EV is executed at the EV’s specific location, to maximize the revenue of the EV owner. The EV can utilize its outcomes to ascertain the most efficient charging or discharging contribution in the V2G or G2V technologies. The depicted architecture in Figure 3 [10] does not necessitate the utilization of a complex optimization algorithm capable of individually managing each EV nor does it require bidirectional communication channels between the EVs and the central system operator. Due to this rationale, a majority of EV manufacturers have opted to employ the SAE J1772 aggregator, which is capable of operating with both 120 V and 220 V power sources through the utilization of an aggregative design [4,22]. The charging and discharging performance of V2G and G2V technologies have been simulated using several approaches. These include day-ahead [23,24,25], week-ahead [26,27,28], time of use, and real-time tariffs [29,30]. A comprehensive analysis of the impact of various pricing schemes on the performance of V2G systems in EVs is presented in reference [31].

1.2. Motivation

Increasing reliance on EVs in the transportation sector poses new difficulties for existing power grids in terms of reliability and stability. High voltage drop and instability in the transmission cables may be significantly exacerbated by a lack of coordination between charging times. The V2G technology may be used to better plan the charging and discharging times, which is one solution to the issue. In addition, the V2G may convert the difficulty of accommodating a growing number of EVs into an advantage for both the grid and their owners. Inaccuracy in the wear model of EV batteries is the primary barrier for V2G technology adoption since it inhibits EV owners from taking part in V2G technology pilot projects. This study presents a precise hourly EV battery wear model that takes into account all of the variables (temperature, state of charge (SoC), and charging/discharging power) that might affect EV battery wear. This model may be extrapolated from the results of tests conducted on EV batteries or from the manufacturers’ recommendations for how well their products perform.
This paper is used to model the optimal scheduling of the charging/discharging of one Battery Electric Vehicle (BEV) as an example. The same methodology can be used with other sizes of BEVs or PHEVs based on their battery capacities.

1.3. Innovation and Contribution

Due to the distrust that EV owners have in the currently available EV battery wear models, the issue of erroneous EV battery wear models is slowing down the progression of the usage of V2G. In this work, an accurate hourly EV battery wear model is presented by making use of either the actual test results or the manufacturer-recommended specifications of EV batteries. In addition, an efficient optimization algorithm has been developed for optimal power dispatch between the EV batteries and the grid. The following points provide a concise summary of the many contributions and developments that were a part of this study:
  • A novel hourly EV battery wear model has been developed to precisely predict the hourly wear cost of EV batteries while considering all of the crucial aspects such as temperature, power level, and the SoC.
  • A modified GWO method that uses a contemporary technique known as gradual reduction of the swarm size for GWO (GRSS-GWO), to reduce the convergence time and improve the accuracy of the findings.
  • An accurate scheduling model for optimally charging and discharging the electricity of EVs utilizing V2G technology.
  • An accurate economic model that may be used to assess the money that EV owners can earn by participating in technological projects that use V2G.

1.4. Paper Outlines

This work aims to provide a comprehensive analysis of the wear models that have been presented in the field of EVs, as discussed in Section 2. Section 3 provides a comprehensive elucidation of the decentralized EV aggregator. Section 4 provides an introduction to the optimization algorithms suitable for achieving optimum scheduling of charging and discharging EV batteries. The GRSS-GWO method is described in depth within this part. Section 5 provides an introduction to the description and outcomes of the simulation. The last part serves the purpose of summarizing the conclusions and notable findings obtained from the suggested approach in comparison to the conventional charging manner.

2. Battery Wear Modelling

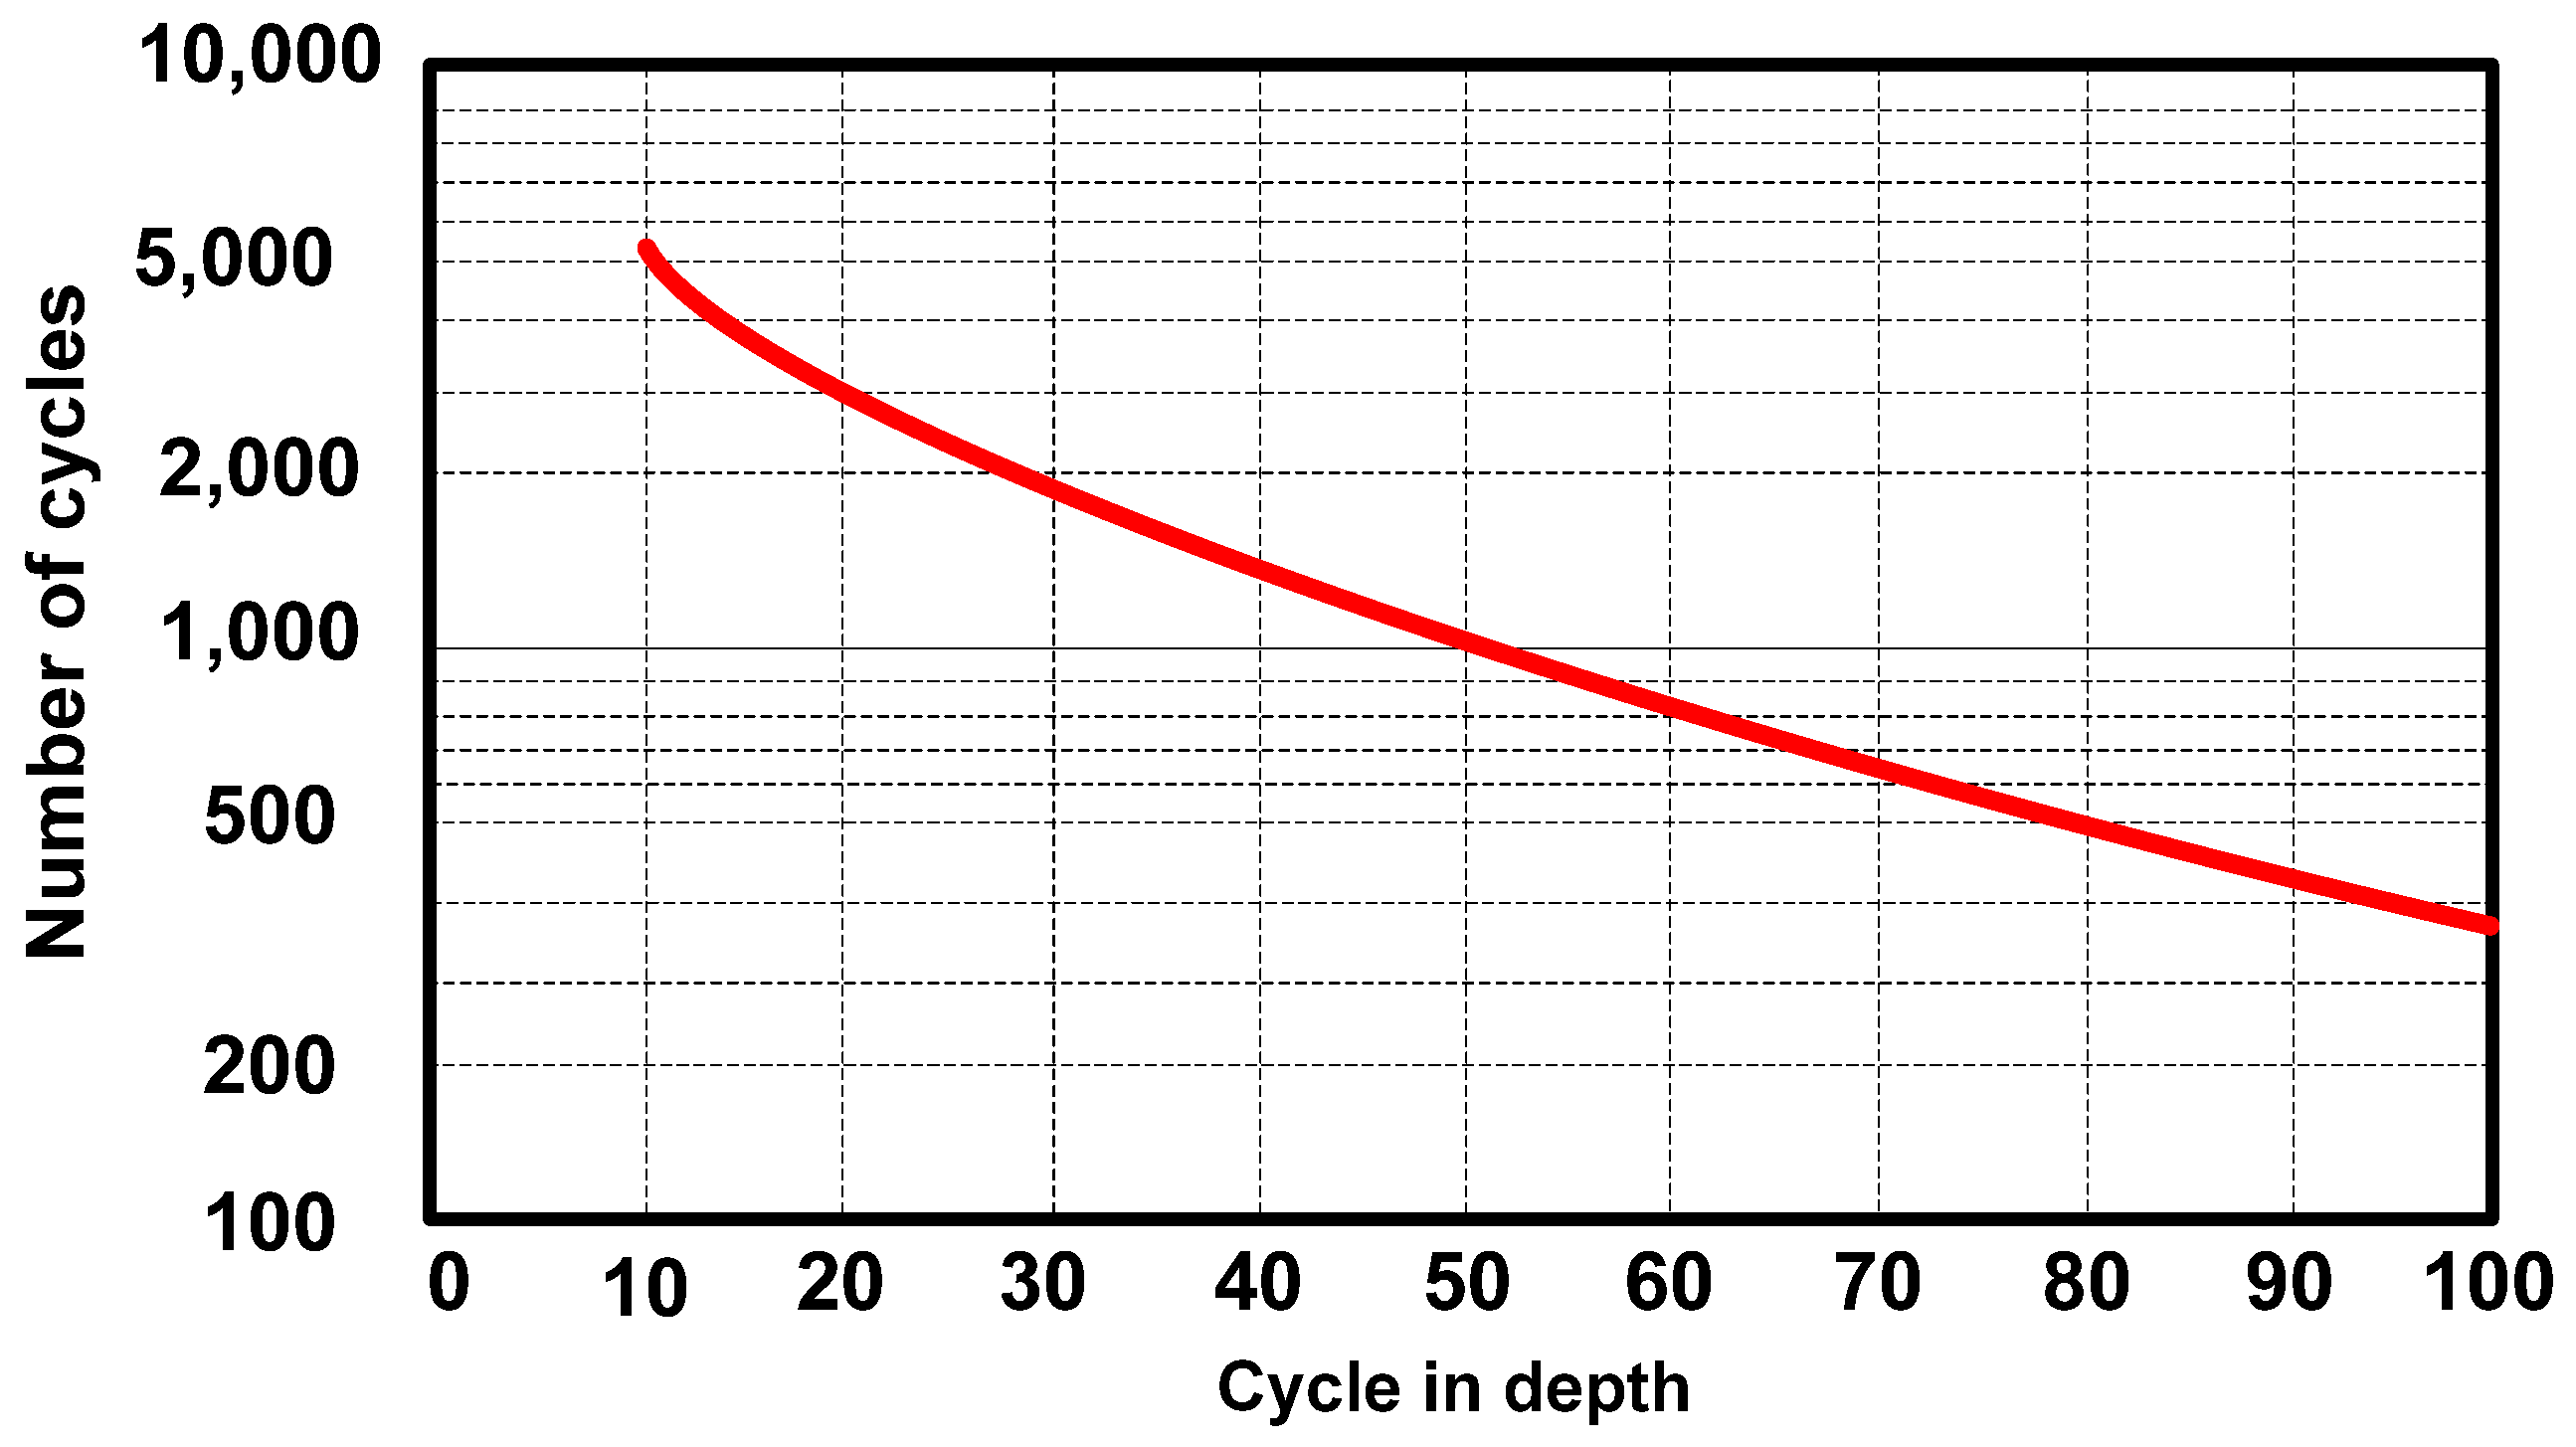
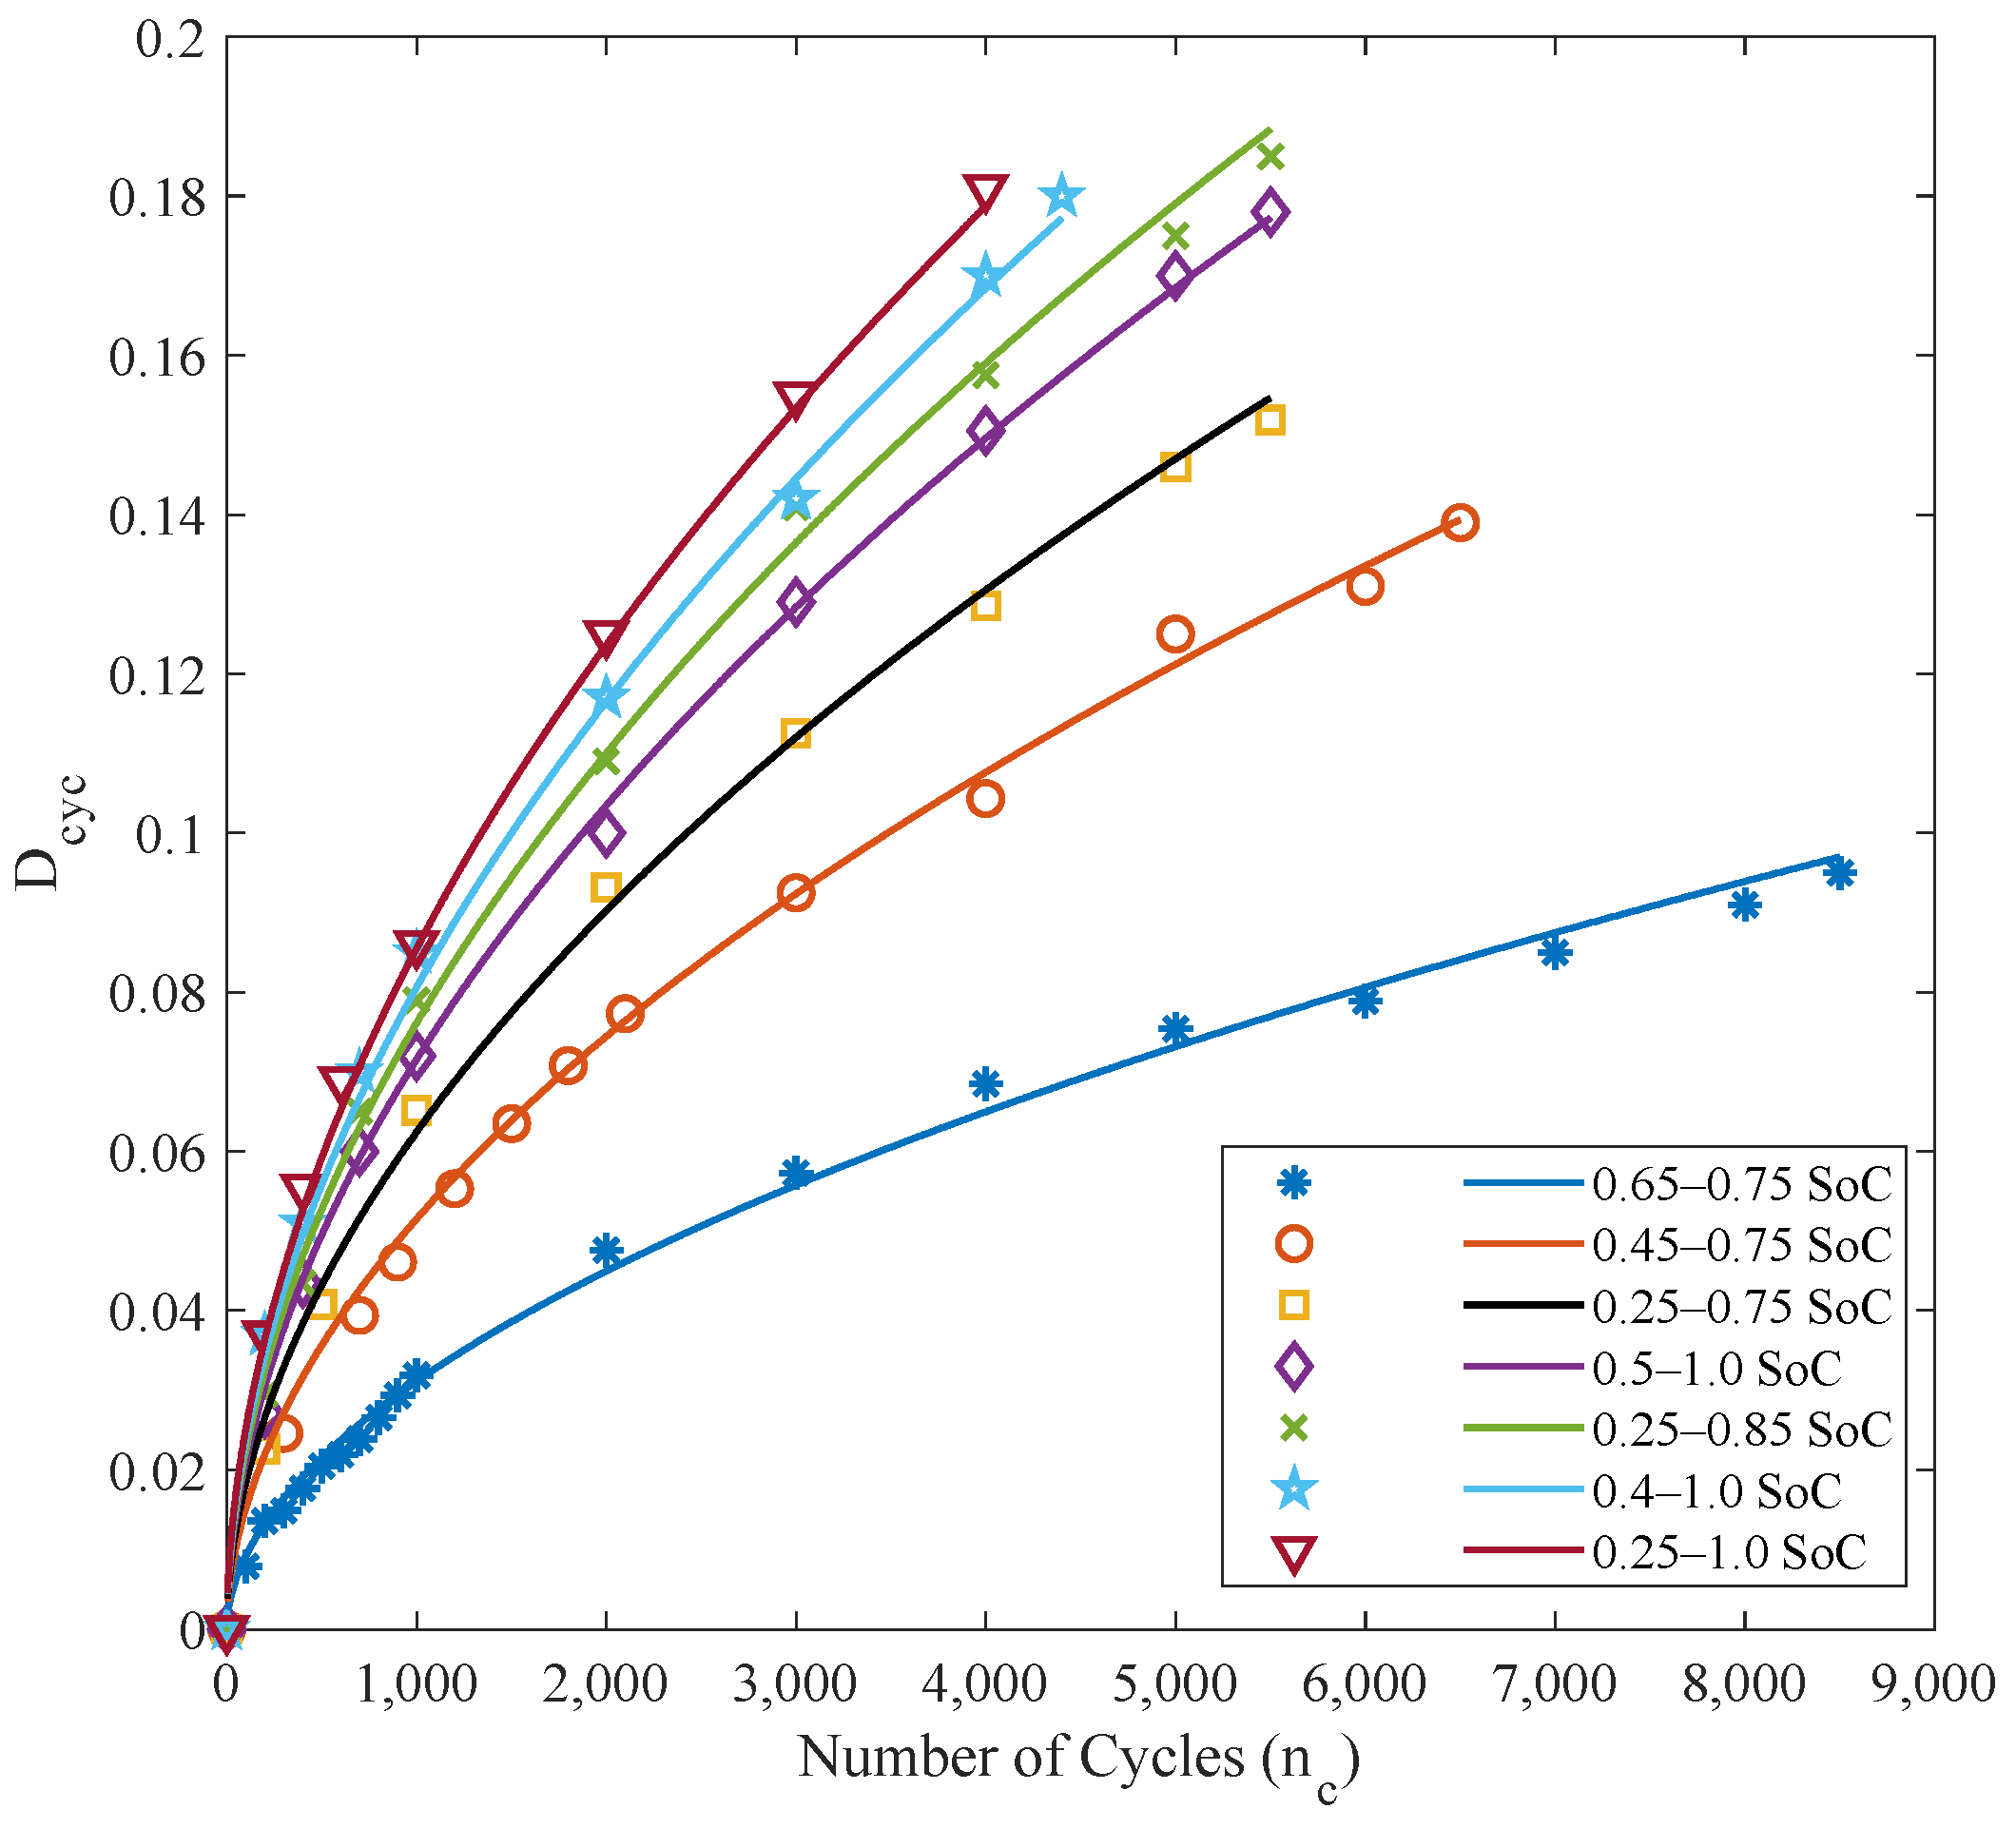
This work introduced a framework for determining the profit of a single EV battery operated with optimal dispatch strategy used with V2G technology. Several components were introduced in this study. The wear model of the LIB is introduced in the following subsections that contain the parameter estimation of the battery model and how it can be used to determine the hourly degradation in terms of operating conditions during this hour. One of the primary issues associated with the implementation of V2G applications pertains to the lack of accurate battery wear models. The presence of an imprecise battery wear model hinders the involvement of EV owners in V2G applications. The predominant kind of battery used in EV applications is the lithium-ion battery (LIB). Many aspects may influence the wear mechanism of LIBs, including the depth of discharge (DoD), the SoC, the current rate (Crate), and the operating temperature. The wear mechanism of LIBs is notably influenced by these elements, but to varying degrees contingent upon the chemical composition of the cathode and the specific manufacturer of the LIBs. Battery wear is often overlooked in the economic analysis of V2G systems for EVs in various studies. Additionally, some studies in the literature have developed models to estimate battery wear, but they fail to include several crucial elements [10,32,33]. Several studies have taken into account the DoD and the operating temperature as factors in assessing the cost of EV battery wear in V2G or G2V applications [34,35]. The analysis conducted in this study did not take into account other variables, such as the Crate and operating temperature, because of the limited availability of data necessary to assess their impact [35]. This work presents a comprehensive analysis of battery wear models for lead-acid, LIB, and nickel-metal hydride (NiMH) batteries, with a specific focus on their use in the United Kingdom (UK) and China [35]. Several other methodologies considered certain elements that might impact battery wear while disregarding other ones. The technique described by references [32,33] introduces a battery wear approach that takes into account the impact of the DoD on the achievable cycle count (ACC) life cycle. This method also extracts a wear-density function (WDF) that enables the determination of discrete wear for each time period. The suggested technique failed to consider the impact of Crate and the operational temperature of the battery. Several studies have used experimental data from singular operating settings to forecast the wear mechanism of LIBs. However, it is important to note that such an approach deviates significantly from the actual wear mechanism seen in practical scenarios [34,35,36,37,38]. Furthermore, the aforementioned investigations failed to account for the potential variations in wear mechanisms, resulting from differences in the chemicals used in the cathode or the manufacturers involved. The correlation between the DoD and the ACC for reducing LIB is shown in Figure 4 [32,39].

2.1. Wear Modeling Based on Achievable Cycle Count (ACC)

The model presented in this study is derived from the manufacturer-recommended relationship between the ACC and DoD, as seen in Figure 4. The wear model in question failed to take into account significant wear elements, like the Crate, operating temperature, and the SoC of the battery [32]. The wear cost incurred within a given time in this model is determined by the power used in the charging and discharging processes, as well as the variation in SoC. One notable benefit of this particular model is its straightforwardness in determining the cost of wear. However, it is important to note that this model lacks precision and fails to account for many wear-inducing elements, such as temperature and SoC.
The shown relationship between the ACC and DoD in Figure 4 may be mathematically expressed by Equation (1) as referenced in [32].
n c D = a D b
The variable D represents the DoD, whereas a and b are specification parameters that vary between different batteries. These parameters may be derived from the ACCDoD curve seen in Figure 4.
The average wear cost (AWC) is the cost of energy transfer per unit, and it may be computed by dividing the total cost of the battery by the total energy handled by the battery throughout the charging and discharging cycles, as seen in Equation (2) [32].
A W C D = C b n c ( D ) · 2 · D · E b r · η b 2
where η b is battery efficiency, Cb is the total battery cost, and Ebr is the rated capacity of the battery (kWh).
The aforementioned equation is deemed acceptable according to the DoD and originates from the initial SoC being equal to 1. However, it should be noted that this condition does not hold true in typical uses of batteries in V2G systems. In order to circumvent this constraint, a novel wear density function (WDF) is proposed in reference [32], as seen in Equation (3).
A W C D = 1 D 1 D 1 W S o C d S o C
where W(SoC) is the wear density function.
The W(SoC) can be represented in terms of the SoC instead of the DoD as shown in Equation (4) [32].
W S o C = C b · b 1 S o C b 1 2 · E b r · η b 2 · a
The total wear cost (TWC) during any time t can be obtained from Equation (5) [32].
T W C t = E b r t t + Δ t W s t d S o C t d t d t
where dSoC/dt can be determined from Equation (6)
d S o C t d t = P b t E b r
Substituting Equations (4) and (6) into Equation (5), the TWC during time Δt is shown in Equation (7).
T W C t = C b · b · P b t 2 · E b r · η 2 · a t t + Δ t 1 S o C t b 1 d t
Simplifying Equation (7), the final equation for the TWC can be obtained from Equation (8)
T W C t = C b · P b t 2 · E b r · η 2 · a 1 S o C t P b t · Δ t E b r b 1 S o C t b
The wear cost for any period with constant charging/discharging power may be calculated using the method shown in Equation (8). The calculation shown above lacks consideration for the operating temperature, which is a crucial factor in accurately determining the battery wear cost [40].

2.2. Novel Battery Wear Model (NBWM)

The battery wear cost value was not taken into account in the wear model proposed in reference [32], without considering the influence of temperature. Furthermore, the analysis failed to take into account the potential impact of battery wear on its overall capacity throughout its operation. The wear model provided in this work is constructed using the wear model established by Wang et al. [41]. The objective of this model is to ascertain the parameters of the battery model by using empirical data. Two distinct forms of wear manifest inside the battery, namely, calendar wear and cycle wear. The calendar wear is a natural process that occurs in all LIBs that is caused by the chemical reactions that take place inside the battery. The type of wear is affected by several factors, including the battery’s chemistry, temperature, and SoC. The Arrhenius equation, as shown in the first term of Equation (9), is used to describe this particular kind of wear [42]. The parameters for calendar wear (A1, B1, C1, and D1) may be derived either from the outcomes of calendar tests or by using the results of cycle tests. The model shown in reference [32] fails to account for this particular wear, which undoubtedly has the potential to provide imprecise outcomes.
D c a l = A 1 · e B 1 · S o C E a 0 + C 1 · S o C / R T t D 1
where R is the ideal gas constant (8.314 J mol K−1) [42], and the activation energy parameter has been taken as a constant between Ea = 30 kJ mol [43] and Ea = 31.7 kJ mol [44].
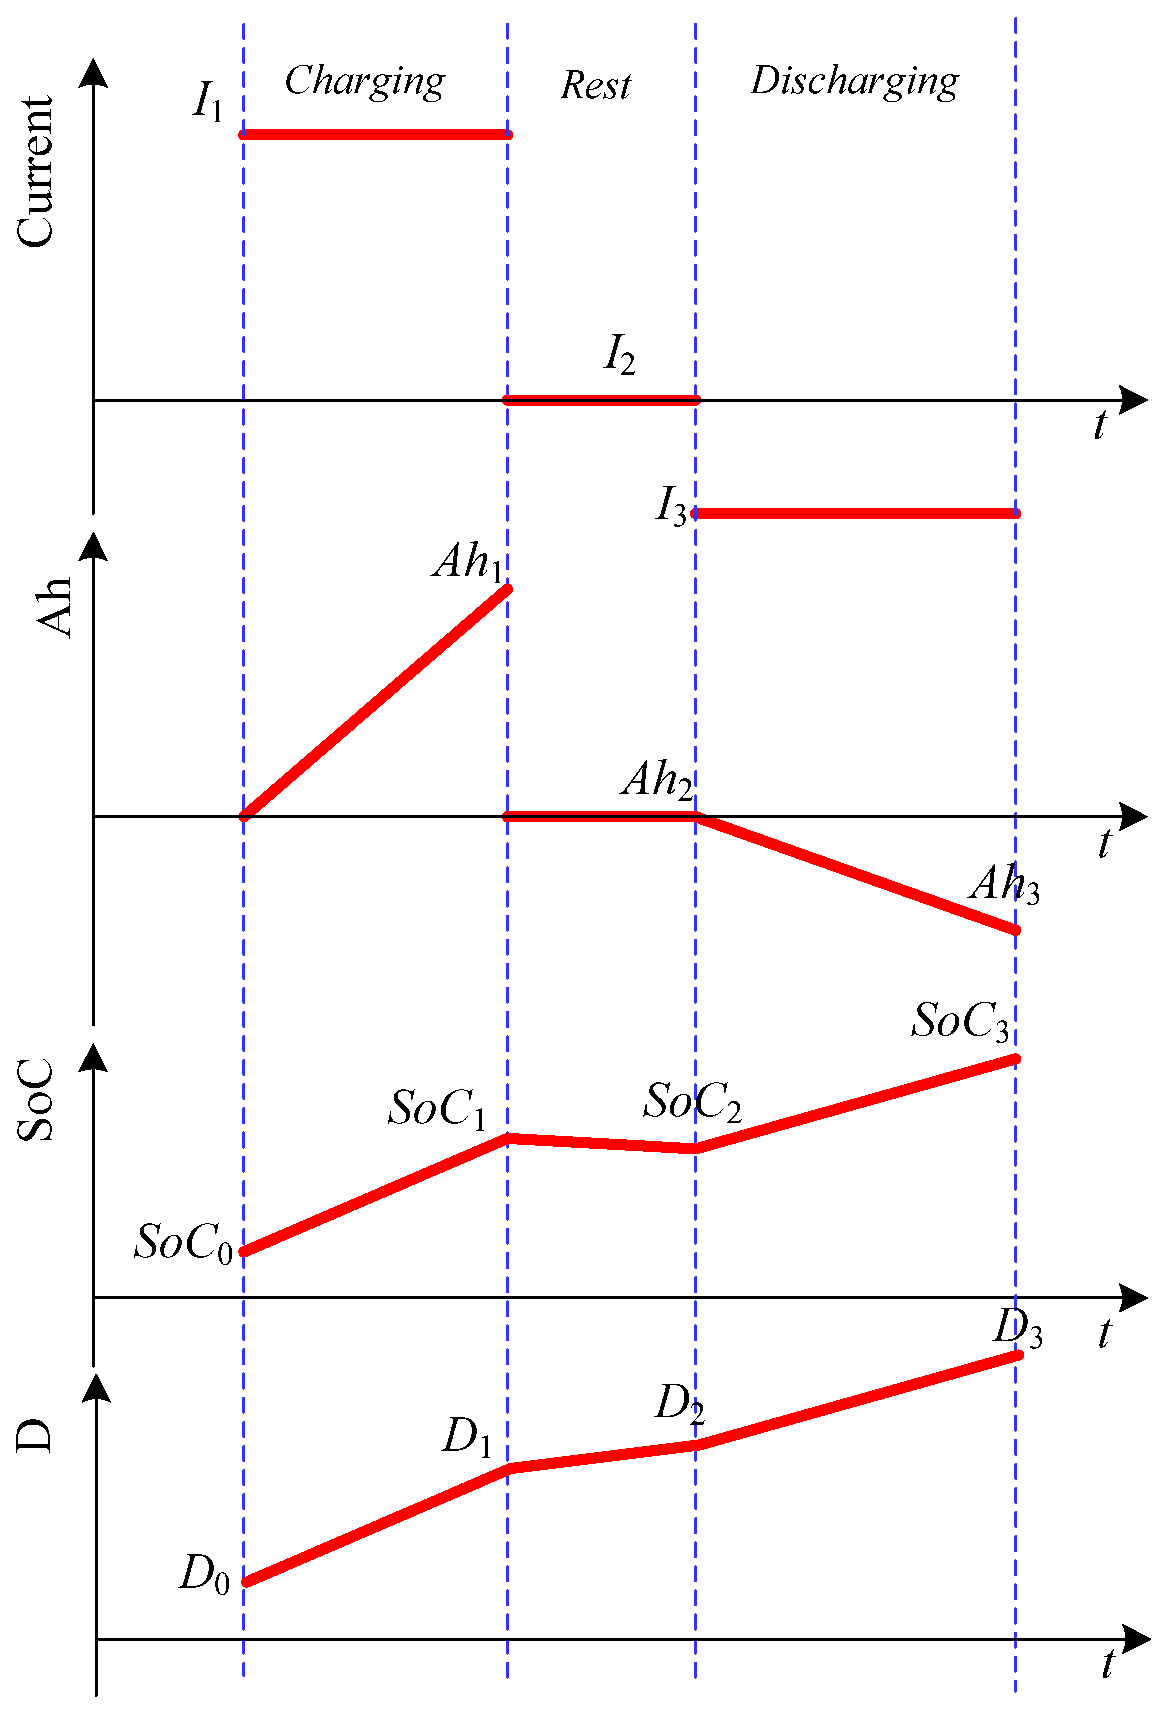
Cycling wear is seen throughout the battery’s regular use, including both charging and discharging processes. The relationship between cycle wear and operating temperature is directly proportional, whereas the relationship between cycling wear and SoC is inversely proportional. The cycle wear occurs at both the anode and cathode of the LIBs. The anode experiences many forms of wear, including anode lithium plating, intercalation gradients, and the growth of the solid electrolyte interphase (SEI) [42]. The cycle wear seen at the cathode may be attributed to many factors, including surface growth, phase perception, loss of active materials (LAM), and dissolution of species [42]. The cycle profile used in this investigation is shown in Figure 5 [39]. Equation (10) illustrates the extent of wear resulting from cycling.
W c y c = A 2 · e B 2 · C r a t e E a 0 + C 2 · S o C R T 2 n c · D o D D 2
where A2, B2, C2, and D2 are the cycling wear model parameters, nc is the number of cycles, and Crate is the current rate that can be obtained from Equation (11).
C r a t e = I t I 1 C = t u · P b t E b r = S o C max S o C min / t u
The total wear due to cycling and calendar wear can be obtained from Equation (12) by adding the calendar and cycling wear shown in Equations (9) and (10), respectively.
W = W c a l + W c y c
W = A 1 · e B 1 · S o C E a 0 + C 1 · S o C a R T · t u D 1 + A 2 · e B 2 · C r a t e E a 0 + C 2 · S o C a R T 2 n c · D o D D 2
where SoCa is the average SoC used during the cycling test, and the DoD can be obtained from Equation (14).
D o D = S o C max S o C min
The parameters of the wear model, as shown in Equation (13), may be ascertained by the process of reducing the root mean square error (RMSE) between the experimental test results and the estimated value derived from Equation (13). The RMSE may be calculated using Equation (15). The goal of minimizing the RMSE is inherently difficult due to the presence of eight factors (referred to as optimization variables) in Equation (13). In this research, a novel optimization technique is presented to achieve precise determination of these parameters. The details of this strategy will be elaborated upon in Section 4.
R M S E = 100 · 1 n m i = 1 n m W m i W c i 2 / 1 n m i = 1 n m W m i
where nm is the number of measurement points, W m i is the measurement value of wear for point number i, and W c i is the calculated value of aging obtained from Equation (13) for point number i.
The wear is shown in Equation (13) and is due to the nc number of cycles. The wear due to one ramp from SoCt−1 to SoCt can be determined by dividing the cycling aging by 2nc and replacing the DoD with the actual DoD, which can be determined by Equation (16). The new wear by ramp time tr which is shown in Figure 6, can be determined from Equation (17).
D o D = S o C t S o C t 1 = C r a t e t · t r
Submitting the above equation into Equation (13) yields the wear value in terms of Crate as shown in Equation (17).
W t = A 1 · e B 1 · S o C a t E a 0 + C 1 · S o C a t R T · t u D 1 + A 2 · e B 2 · C r a t e t E a 0 + C 2 · S o C a R T C r a t e t · t u D 2
where Ti is the temperature at ramp i, and the value of Crate can be obtained from Equation (11).
The above equation can be applied to determine the hourly wear value (tu = 1 h), and the average SoC, SoCai, can be determined from Equation (18).
S o C a i = ( S o C i + S o C i 1 ) / 2
W i 1 , i = A 1 · e B 1 · S o C a i E a 0 + C 1 · S o C a i R T i · t u D 1 + A 2 . e B 2 · C r a t e , i E a 0 + C 2 · S o C a i R T i C r a t e , i D 2

3. Decentralized EV Aggregator

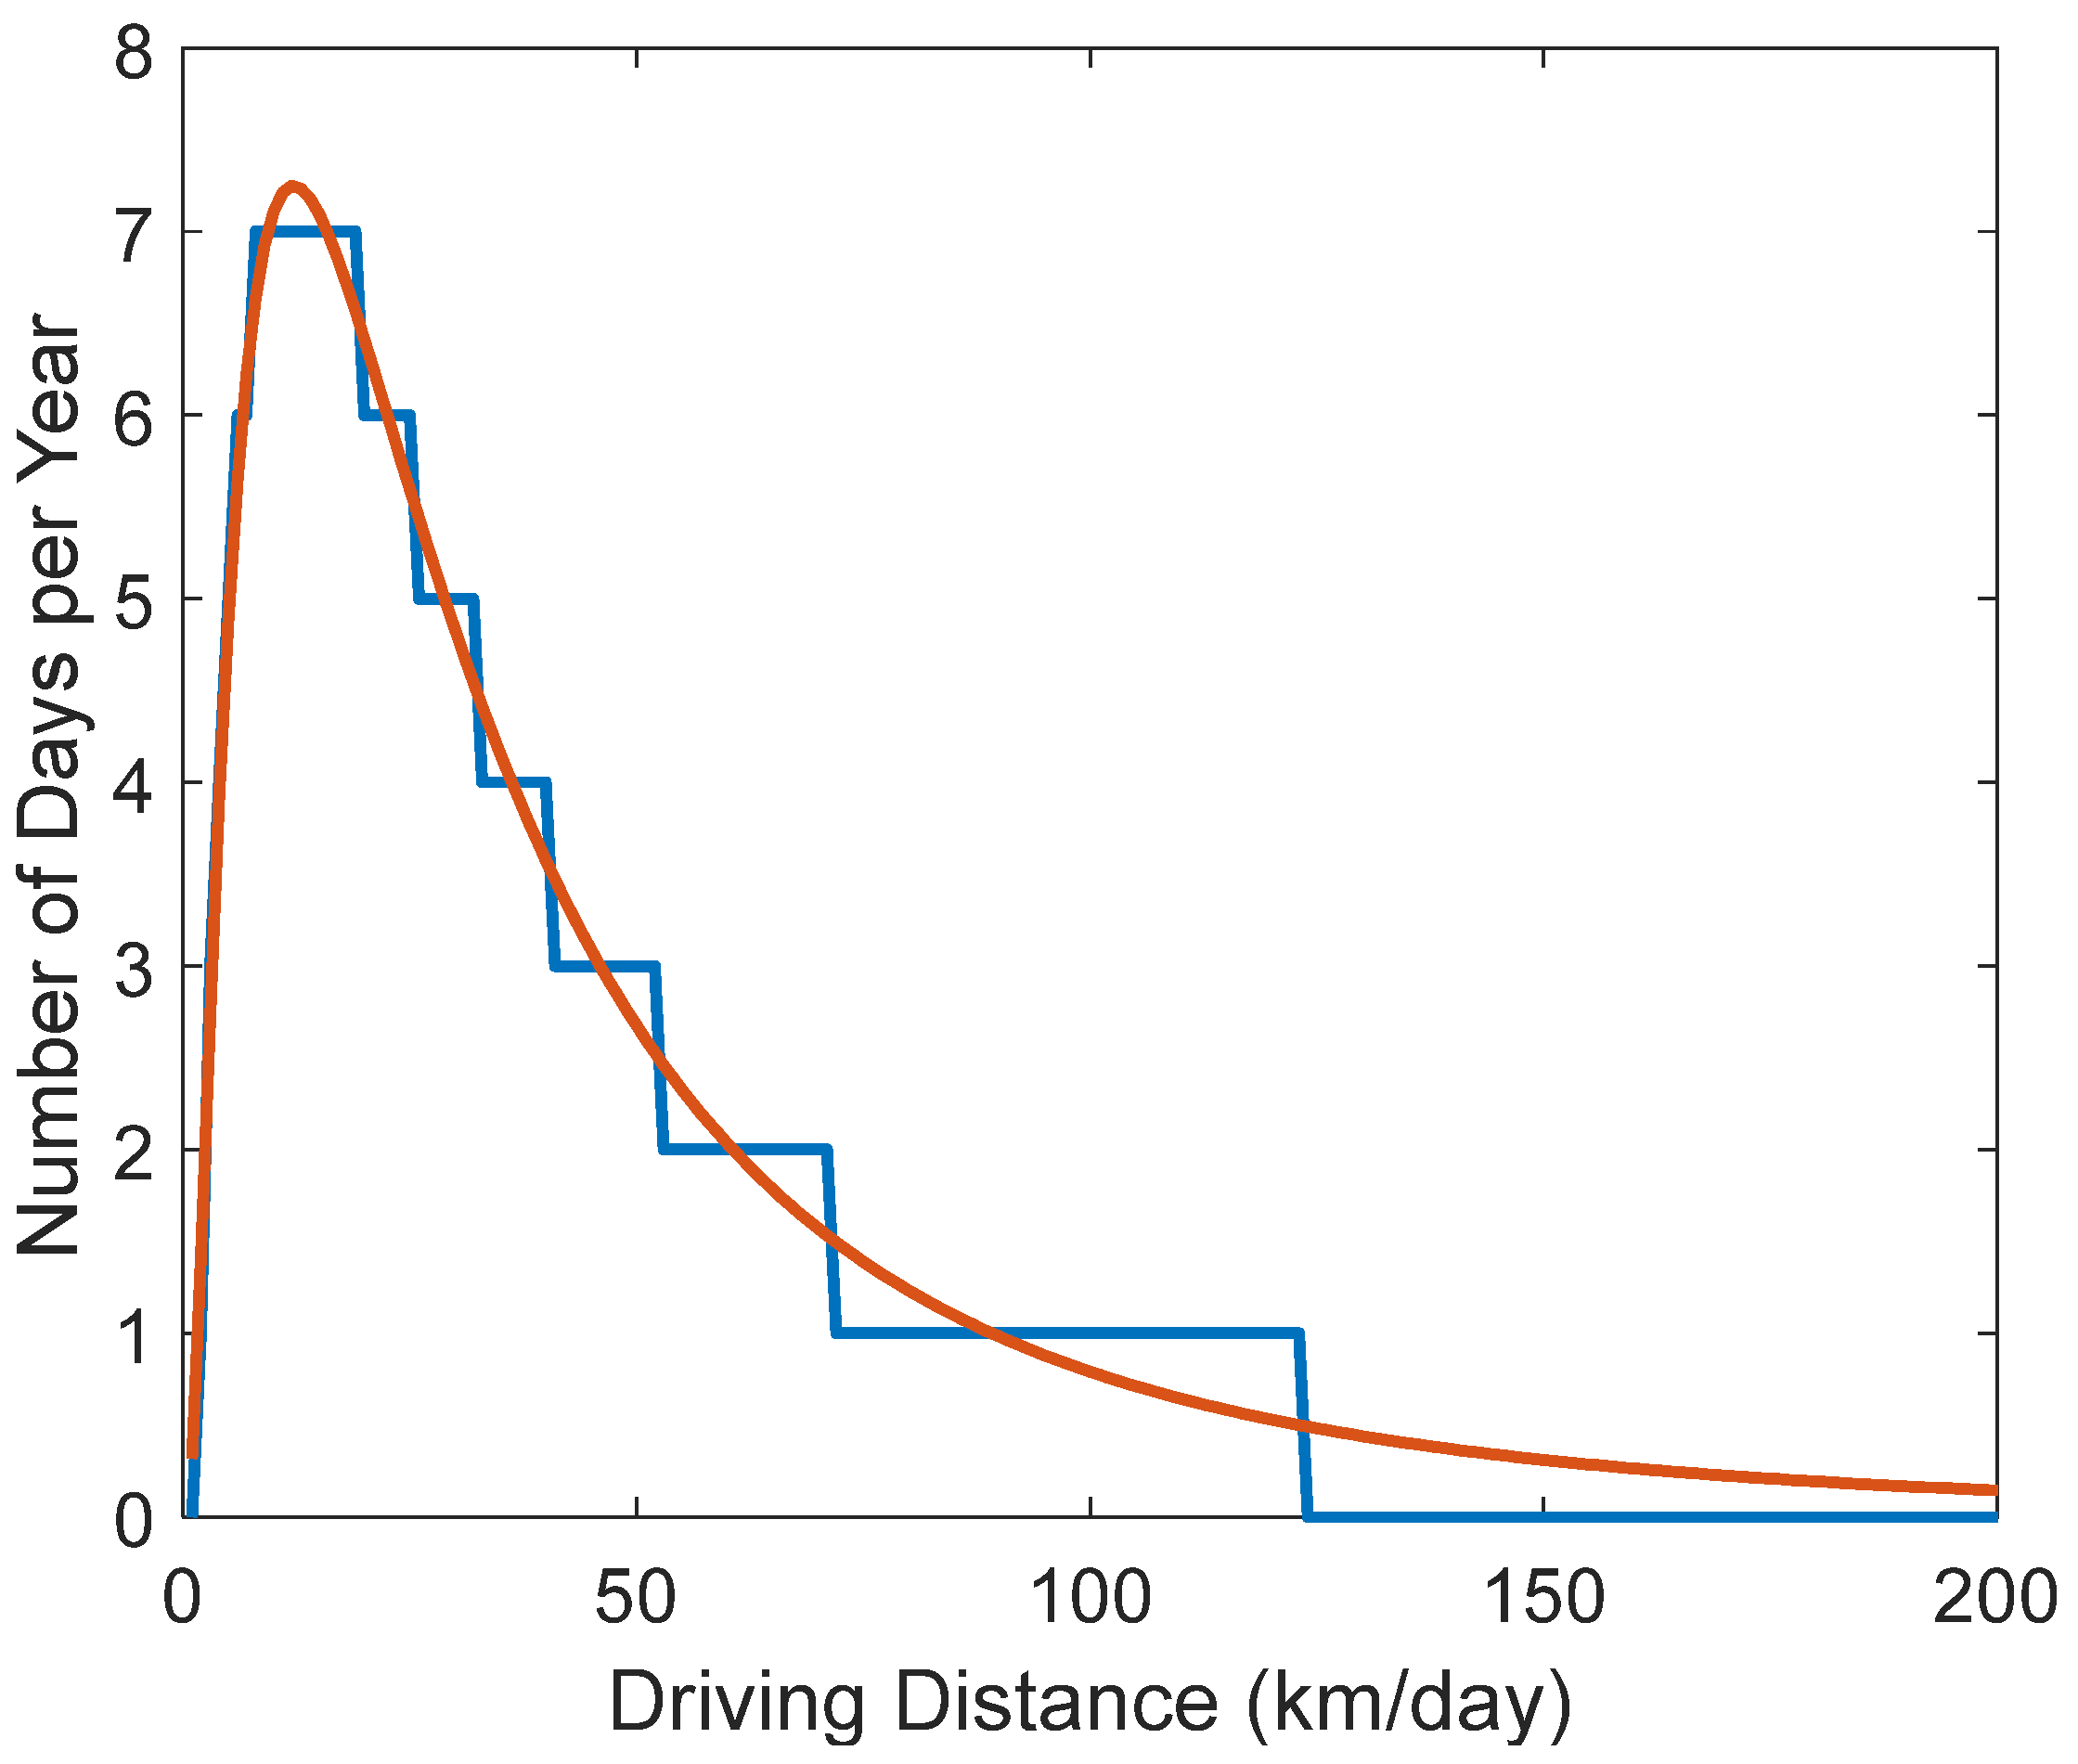
This section pertains to the use of a mathematical model to assess the operational efficiency of an EV over the course of a full calendar year. The objective is to employ this model to determine the potential financial gains associated with the implementation of V2G technology with a single EV. The determination of the EV fleet size may be ascertained via the use of stochastic analysis, which involves the examination of the probabilistic behavior of the number of EVs within this fleet. The daily driving distance of the EV may be determined by using a log-normal distribution function as shown in Equation (20) [45]. The curve shown in Figure 7 displays the distribution function of daily distance.
f d e s L E V = 1 L E V σ E V 2 π e ln μ E V 2 2 σ E V 2
where LEV is the daily driving distance, σEV is the average daily distance of EV, and μEV is the variance of the daily distance of EV.
The daily random driving distance can be obtained from the distribution function. The proposed strategy assumes that the EV performs only one daily trip. The consumed energy by each trip can be obtained by multiplying the daily distance by the specific power consumption (βEV) as shown in Equation (21).
E E V n = L E V n · β E V
The daily trip starts at departure time T d n and ends at arrival time T r n for the day, n. The daily departure time, T d n , is selected randomly from time 1:00 am to 24:00 as shown in Figure 8. The arrival time is selected based on the daily distance and the average speed per trip, as shown in Equation (22).
T r n = T d n + L E V n / u a v
where uav is the average speed of the EV.
The hourly consumed energy during the trip, P E V t , can be obtained from Equation (23).
P E V t = E E V D n / ( T d n T r n ) ( T d n t T r n )
The dispatch matrix is shown in Equation (24) and is used to indicate the condition of the EV operation during the day. The value of x equals 1 when the EV is plugged in and equals 0 when the EV is on the trip or not plugged-in as shown in Figure 8.
X n = x 1 n , x 2 n , x 3 n , , x 24 n
where x t = 0 T d t t T r t 1 O t h e r w i s e .
Based on the hourly power, the SoC of the battery can be calculated as shown in Equations (25) and (26) for charging and discharging hours, respectively. It is worth noting that Pb is chosen to be positive for charging and negative for discharging or during the driving mode.
S o C t + 1 = S o C t 1 σ 24 + P b t · η B C E b r t (during charging)
S o C t + 1 = S o C t 1 σ 24 + P b t E b r t · η B D (during discharging)
where σ is the daily self-discharge, and η B C and η B D are the charging and discharging efficiencies, respectively.
The hourly state of health (SoH) is calculated based on the hourly wear that occurs inside the battery as shown in Equation (27) by subtracting the hourly wear (W) from the previous value of the SoH. The hourly wear value can be determined from the battery wear model as shown in Equation (19).
S o H t + 1 = S o H t W t
The daily cost due to battery wear can be obtained from Equation (28). The 0.2 value shown in Equation (28) is due to the end of life (EoL) of the battery when the SoH reaches 80% [46,47].
C w n = t = 1 24 W t · C b C 2 n d / 0.2
where Cb is the price of the new battery, and C2nd is the price of the second-life battery.
The battery wear due to the participation in V2G can be obtained from the wear due to discharging time into the electric utility multiplied by 2 to consider the wear due to charging and discharging for V2G as shown in Equation (29).
C w V 2 G n = 2 · t = V 2 G W t · C b C 2 n d / 0.2
where t = V 2 G W t is the summation of wear due to discharging of the EV into the grid in V2G mode.
The wear cost due to driving period, C w _ D r n , can be obtained from Equation (30). The factor 2 shown in Equation (30) is used to count the wear due to charging for the driving and the wear due to the driving period itself.
C w _ D r n = 2 · t = T d T r W t · C b C 2 n d / 0.2
There is a wear cost during the calendar wear when the EV is plugged in without charging and discharging and can be obtained from Equation (19) by setting the value of Crate = 0 or it can be obtained by subtracting all battery wear costs shown in Equations (29) and (30) from the total battery wear cost shown in Equation (28) as shown in Equation (31).
C i d l e n = C w n C w V 2 G n C w _ D r n
The total charging cost can be determined from Equation (32). This charging cost includes the charging cost for the driving period, the V2G discharging energy, and the cost to compensate for the calendar leakage energy. The charging cost that can be used to participate in the V2G can be obtained by determining the total energy discharged in the V2G mode and dividing it by the charging time to obtain the average charging power used to participate in the V2G mode and multiplying this power by the tariff during charging time as shown in Equation (33).
C C n = t = C h a r g i n g λ t · P E V t
where λ t is the hourly tariff ($/kWh).
C C V 2 G n = t = C h a r g i n g t = V 2 G P E V t η B C · T c h · λ t
The daily revenue due to V2G application can be determined by subtracting the charging cost for the same amount of energy discharged into electricity and the wear cost due to discharging in V2G operation from the total income that is shown in Equation (34).
R V 2 G n = t = V 2 G λ t · P E V t C C V 2 G n C w V 2 G n
where Tch is the total charging time.
The optimization algorithm should maximize the daily revenue shown in Equation (34), and at the same time, it should maintain the required SoC of the battery at the beginning of the trip ( S o C T d n ) equal to the predefined value from the EV owner to start his trip ( S o C 0 n ). Thus, the objective function should maximize the revenue and minimize the difference between S o C T d n and S o C 0 n as shown in Equation (35).
F = R V 2 G n w 1 · S o C T d n S o C 0 n
where w1 is the weight value that should be used to provide the weight to the starting trip SoC ( S o C T d n ).
The optimization should be performed daily to determine the optimal charging/discharging power for maximizing the revenue and maintaining the SoC at the beginning of the trip as a predefined value by the owner S o C 0 n . The yearly revenue can be determined by the summation of the daily revenue during the year.

4. Optimization Algorithm

The optimal scheduling of the V2G applications of the EV is an extremely complex problem where the optimization algorithm should suggest 24 variables (hourly charging/discharging power) for each day to determine the maximum revenue from the V2G application. Moreover, the run of the optimization algorithm should be performed daily, which means that it should run 365 times to determine the yearly revenue and the yearly optimal charging/discharging schedule. For this reason, the optimization algorithm should be fast enough without compromising the accuracy of the results. Several optimization algorithms showed fast convergence, and they have been used to optimize this problem such as particle swarm optimization (PSO) [48], grey wolf optimization (GWO) [49], and cuckoo search algorithm (CSA) [50], musical chairs algorithm (MCA) [51], bat algorithm (BA) [52], waterfilling optimization algorithm [53], etc. Unfortunately, using these optimization algorithms with such complex optimization problems showed a long convergence time and low accuracy. Several efforts have been made with these algorithms to improve their performance such as tuning their control parameters and selecting the best swarm size [54]. The main problem observed in this study is when the swarm size is increased to obtain more accurate results, the convergence time is increased substantially, and when the swarm size is reduced to reduce the convergence time, the accuracy of the results is sharply reduced or maybe it is converged to a local peak. For this reason, it is important to compromise between the convergence time and failure rate. Also, for this reason, the GWO is selected as one of the fastest metaheuristic optimization algorithms to be used in this application. Moreover, a novel modification strategy has been introduced in this study to solve this problem. This novel strategy is called the gradual reduction of swarm size (GRSS) in which the optimization algorithm starts with a high swarm size to enhance exploration, and the swarm size is gradually reduced in each iteration by removing the worst search agent. This idea is applied to the GWO algorithm and compared to the classic optimization algorithms such as the classic GWO, PSO, and BA. The results showed an improved performance where the fitness function accuracy and the convergence time are substantially improved as shown in the results section.

4.1. Standard Grey Wolf Optimization Algorithm

The grey wolf optimization (GWO) method is a metaheuristic optimization algorithm that draws inspiration from nature. It was introduced by Mirjalili et al. in 2014 [49]. The program draws inspiration from the social order and hunting behavior shown by grey wolves in their natural environment. The grey wolf optimization (GWO) method is a computational technique that emulates the hunting behavior of grey wolves to address optimization issues. The hunting behavior of grey wolves is a complex and well-coordinated process. The wolves work together to track, surround, and attack their prey. Their hunting behavior can be divided into the following phases:
Tracking: The wolves use their keen sense of smell to track their prey. They can track prey for many miles, even in difficult terrain.
Surrounding: Once the wolves have located their prey, they surround it to prevent it from escaping. They may use their bodies to block the prey’s escape routes, or they may bark and howl to confuse and disorient it.
Attacking: The wolves attack the prey from all sides, biting and clawing it until it is subdued. They typically focus on attacking the prey’s throat and legs.
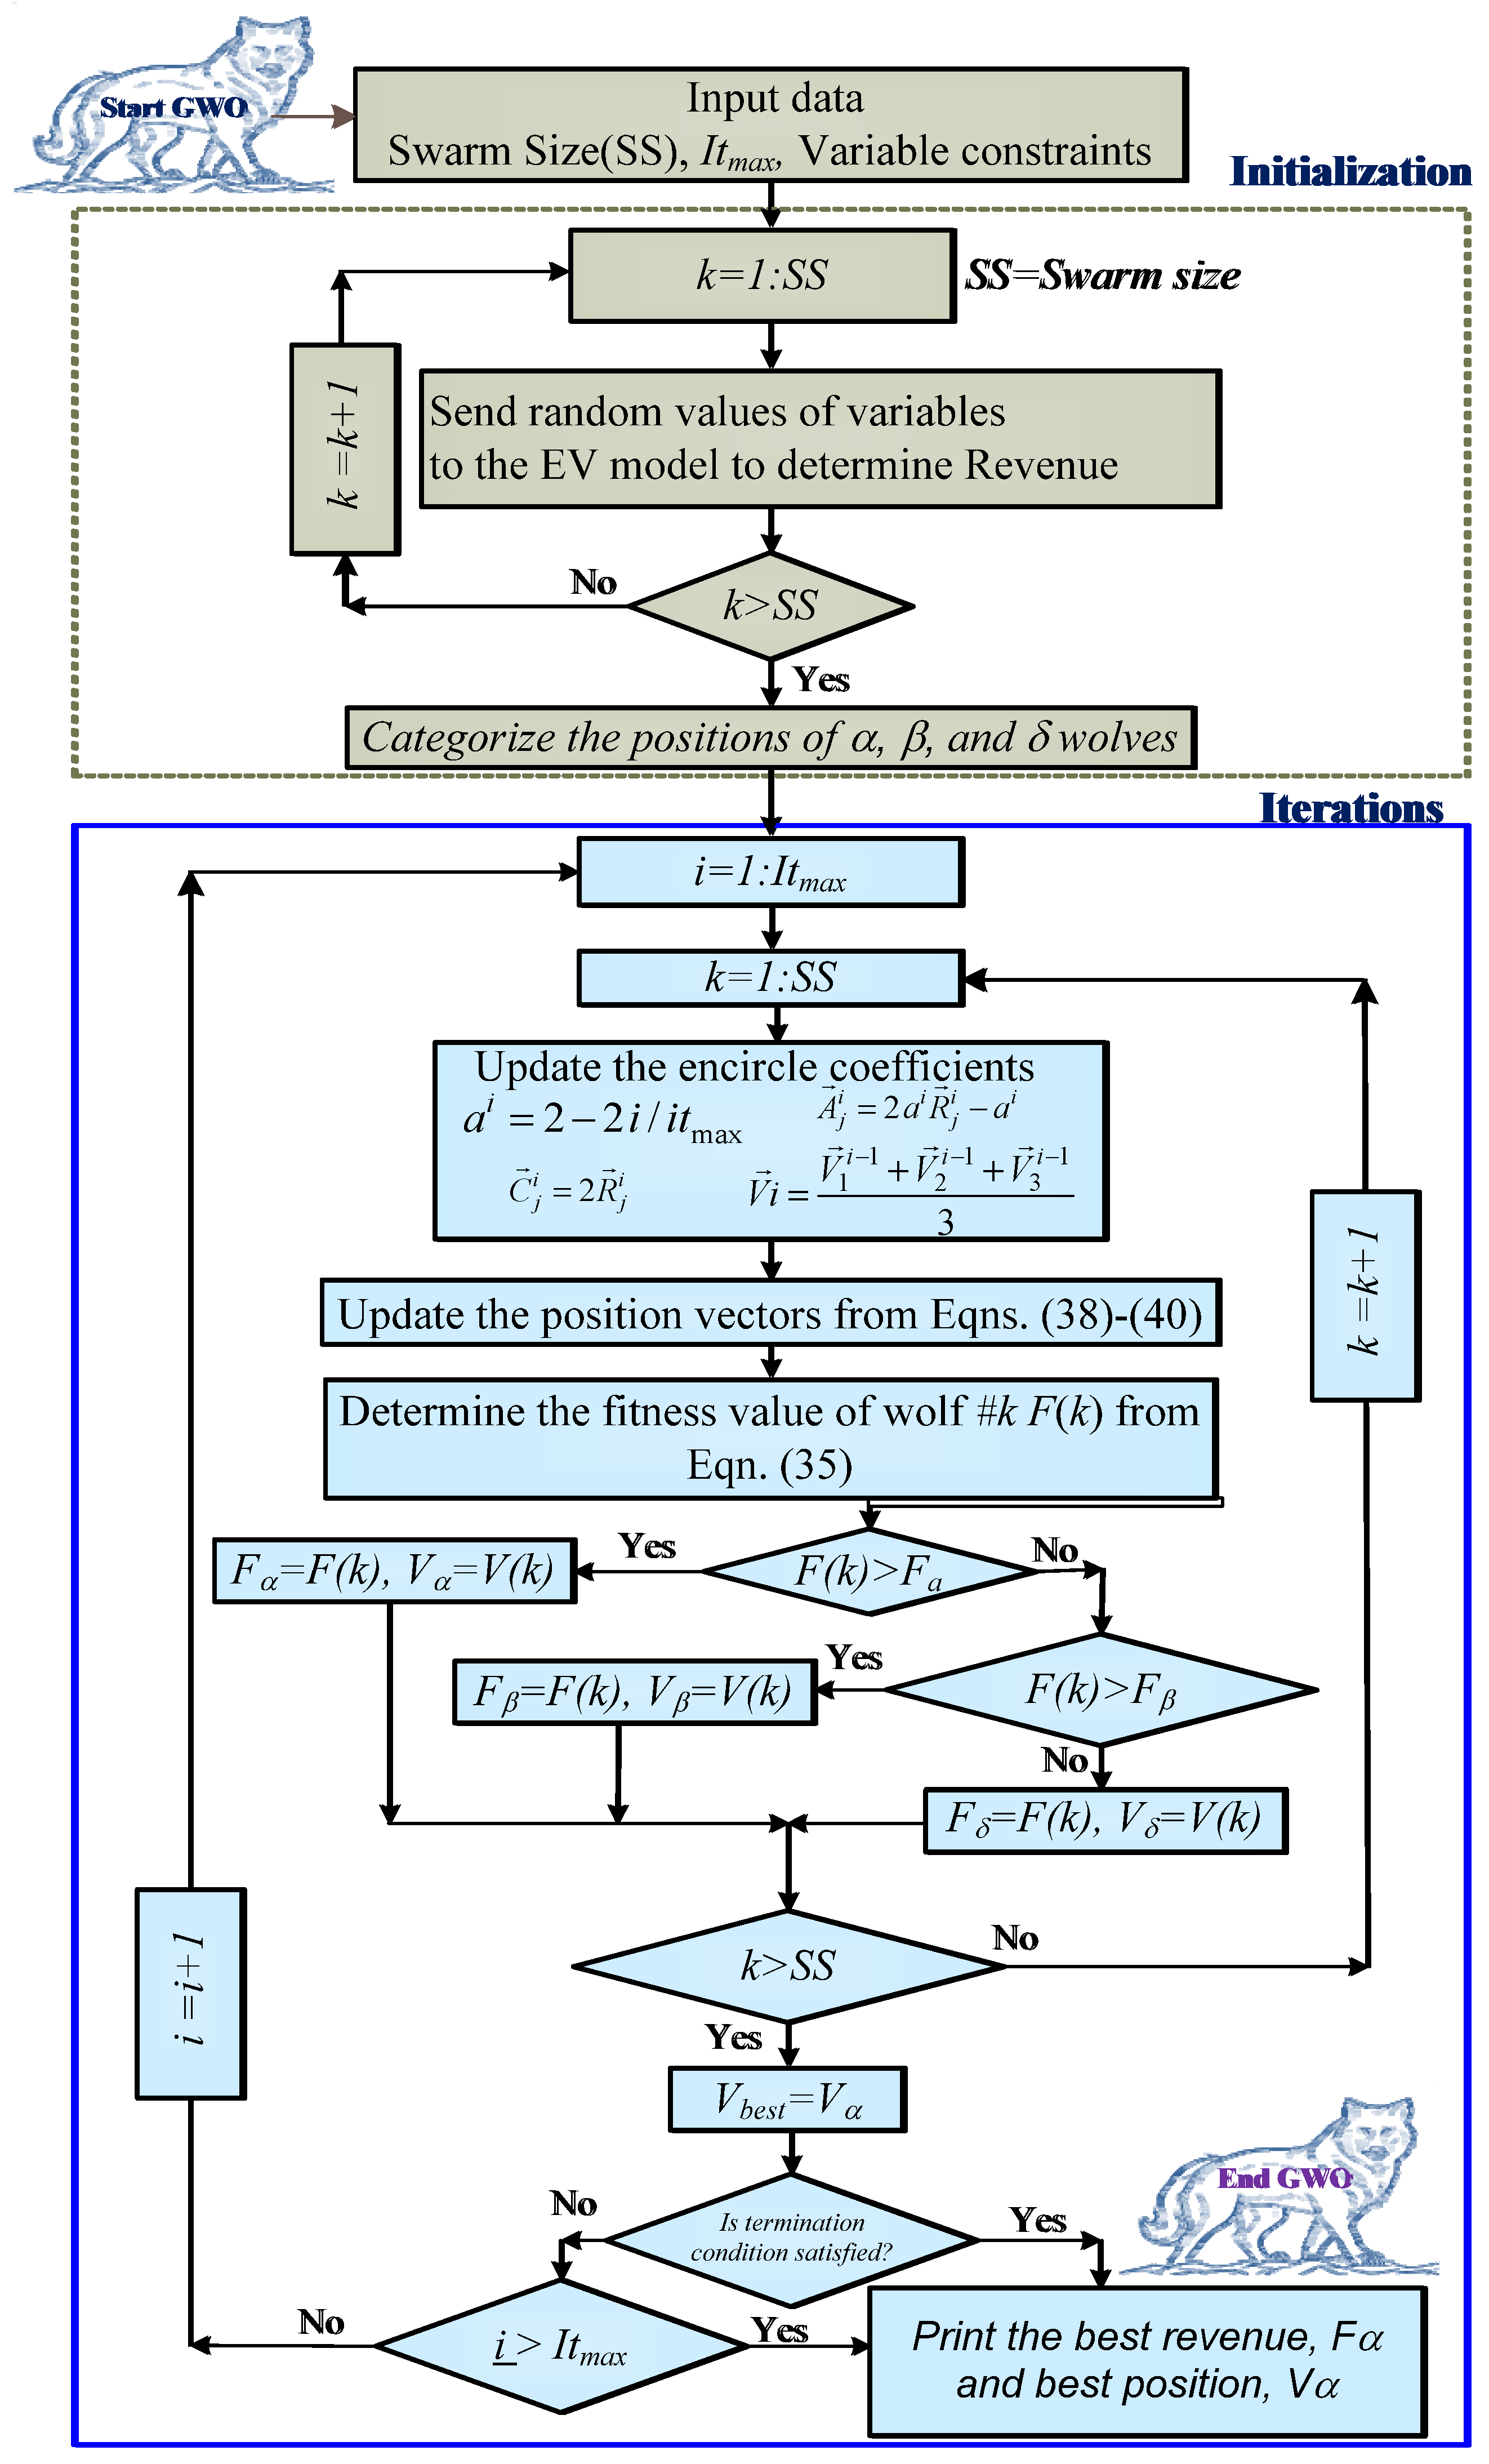
The proposed approach involves an iterative enhancement of the population of potential solutions by simulating the social interactions and hunting behaviors seen in wolf populations. The algorithm is founded around the concept that grey wolves exhibit a hierarchical organization within their social groups, whereby alpha, beta, delta, and omega wolves symbolize the wolves occupying the highest to lowest positions in the ranking system. The GWO method has been used in a wide range of optimization applications, including mathematical functions, engineering design, feature selection, and neural network training. The findings have shown encouraging outcomes in relation to the rate of convergence and the quality of solutions. Figure 9 depicts the flowchart that illustrates the use of the standard grey wolf optimizer (GWO) in the optimum charging and discharging schedule of the EV inside the V2G application. The following procedures are used to demonstrate the optimization procedures of the GWO when applied to the task of scheduling the charging and discharging power of EVs in V2G applications.
  • Initialization: A population of wolves is randomly initialized inside the search space, taking into account the zero value for the trip time. Each wolf symbolizes the cyclic process of charging and discharging energy over 24 h.
  • Assessment of fitness: The fitness of each wolf within the population must be evaluated using the objective function as shown in Equation (35). The fitness value corresponds to the total income generated during 24 h.
  • Provide a current update on the spatial distribution of wolves: The objective of this analysis is to ascertain the spatial distribution of the alpha, beta, delta, and omega wolves following their respective fitness values. The optimal solution is denoted by the symbol alpha, which is thereafter followed by beta, delta, and omega, as shown by the given equations.
The quantity of variable (d) is 24, with each variable denoting the power input/output to/from the EV’s battery while charging or discharging. Equation (36) is used to obtain the revised location vector for each wolf [49].
V i = V 1 i 1 + V 2 i 1 + V 3 i 1 3
where V 1 i , V 2 i , and V 3 i are the position vectors of α, β, and δ at iteration i, respectively. These position vectors can be obtained using Equations (37)–(39) [49].
V 1 i = V α i A 1 i · C 1 i · V α i V i
V 2 i = V β i A 2 i · C 2 i · V β i V i
V 3 i = V δ i A 3 i · C 3 i · V δ i V i
where A 1 i , A 2 i , A 3 i and C 1 i , C 2 i , and C 3 i are vectors that can be determined from Equations (40) and (41), respectively.
A j i = 2 · a i · R j i a i ,   j = 1 ,   2 ,   3
C j i = 2 · R j i ,   j = 1 ,   2 ,   3
where R j i is a random vector R j i [ 0 , 1 ] , a is the control parameter that updates the value of A j i and causes the omega wolves to escape the other higher-order wolves to enhance the global search performance. The value of a is reduced linearly from 2 to 0 as shown in Equation (42) [49].
a i = 2 2 i / i t max
where itmax is the maximum number of iterations.
  • Apply boundary constraints: several boundary conditions such as the zero charging/discharging power during the driving trip, the charge/discharge power, and the SoC are within the specified limits.
  • Update the fitness values: the new position is applied to the objective function, and the fitness values for each wolf is obtained.
  • Update the best solution: the alpha wolf position is updated, if a better solution is found than the previous one.
  • Repeat steps 2–5: the steps are repeated until a termination criterion is met (e.g., the maximum number of iterations or reaching a satisfactory solution).

4.2. Novel Gradual Reduction of Swarm Size of GWO (GRSS-GWO)

Several academics have suggested several enhancements to the original GWO algorithm [55,56]. In the present work, a significant difficulty arises from the large number of variables (24 variables during a one-hour sampling period), necessitating the reduction of convergence time and the improvement of the accuracy of the resulting optimum solution. The complexity of the issue increases as the sample interval decreases to less than one hour, since this results in an increase in the number of variables exceeding 24. One potential approach for decreasing convergence time is to decrease the quantity of search agents. However, this strategy may result in a decrease in the exploration capabilities of the optimization algorithm, perhaps leading to premature convergence. In contrast, an increased quantity of search agents has been shown to improve exploration capabilities, but at the cost of a lengthened convergence time. Due to this rationale, the concept of augmenting the number of search agents, referred to as “wolves”, at the start of the optimization process, serves to improve the efficacy of exploration while afterward progressively diminishing their count. This approach aims to minimize the time required for convergence and concurrently raise the effectiveness of exploitation. In this particular approach, the wolf with the lowest performance will be systematically destroyed throughout each repetition. The process of reducing the swarm size will be consistently implemented as long as the wolf population remains above three individuals. Once the population of wolves reaches a count of three, the recommended method will refrain from eliminating any further wolves until the completion of all optimization rounds. The findings derived from the implementation of this approach demonstrated a significant decrease in the time required for convergence and an improvement in the precision of the solution when compared to both the conventional GWO method and other optimization algorithms examined in the research. Figure 10 illustrates the flowchart of the GRSS-GWO in conjunction with V2G applications.
An additional enhancement is achieved by the substitution of the linear reduction control parameter (a) as shown in Equation (42) with a second-order reduction as illustrated in Equation (43) [55]. This enhancement resulted in an improved exploration performance during the first stages of the optimization process and accelerated convergence in the advancement of the optimization algorithm, hence significantly reducing the time required for convergence.
A further enhancement implemented in this approach involves assigning a greater significance to the position vectors of α, followed by β, and then δ, as seen in Equation (44) [56]. This modification replaces the equal weighting scheme used in the conventional GWO method, as depicted in Equation (36) [49].
a = 2 1 i i t max 2
V i + 1 = ψ 1 V 1 i + ψ 2 V 2 i + ψ 3 V 3 i
where ψ 1 > ψ 2 > ψ 3 and ψ 1 + ψ 2 + ψ 3 = 1 .

5. Simulation Work

5.1. Simulation Software

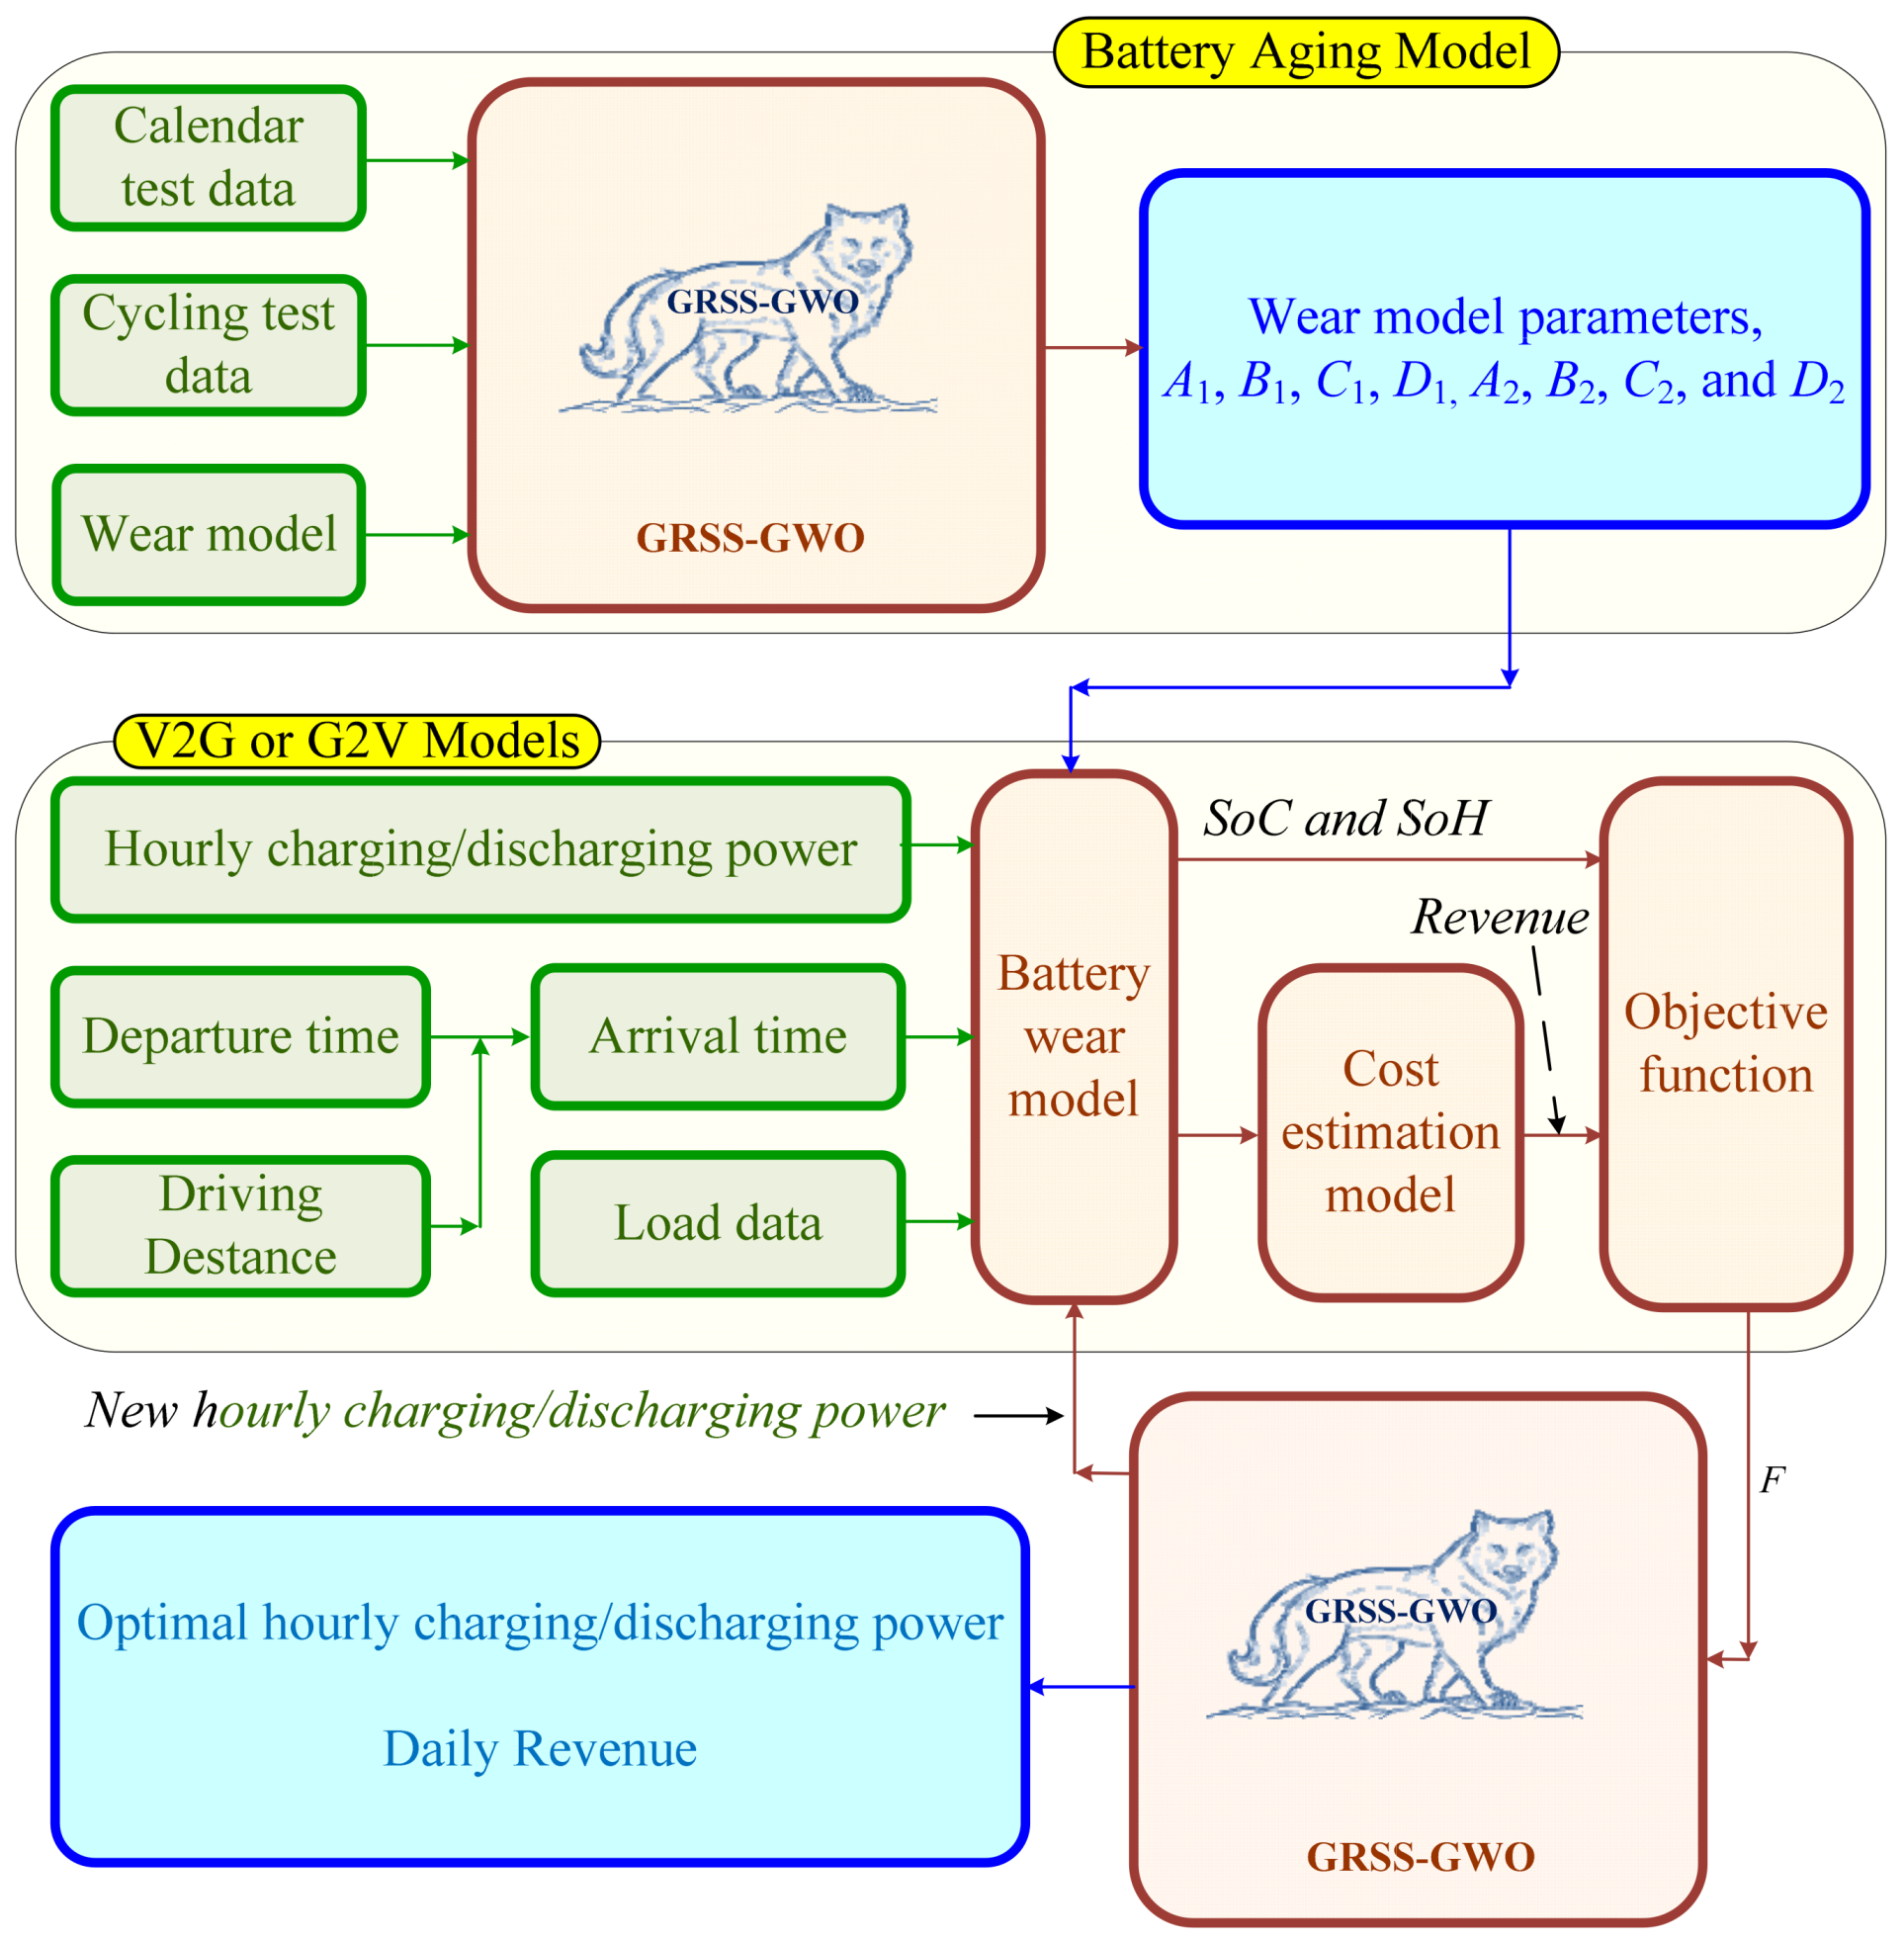
The execution of the technique described in this research was conducted using Matlab software, following a series of procedures shown in Figure 11. The first phase involves the execution of procedures aimed at ascertaining the wear characteristics of the battery. The wear model presented in Section 2 is used to ascertain the parameters utilized in calculating the hourly battery wear, as shown in Equation (8) for the traditional wear model [32] or Equation (19) for the newly suggested wear strategy. The approach used in this study utilizes the experimental findings from the battery acceleration test as documented in reference [57]. Optimization methods are then applied to identify the parameters by minimizing the RMSE between the experimental and calculated results, as shown in Equation (15).
An additional module is used to ascertain the distribution of the EV’s daily driving distance for a full year, using Equation (20) and shown in Figure 7. This module is used to ascertain the daily driving distance, as well as the departure and arrival times. Figure 11 illustrates a basic configuration of this module.
The primary module is used to assess the operational efficiency of the EV for a full year. This module aims to ascertain the daily and annual income generated via the implementation of V2G principles. The outcomes derived from this module have been contrasted with the unintelligent charging approach. The stages of the primary module are shown in Figure 11 and may be succinctly stated as follows:
Step-1: Randomly initialize the charging/discharging power during the EV plugin period.
Step-2: Determine the hourly wear based on the hourly operating condition using Equations (8) and (19) for comparison.
Step-3: Determine the hourly and daily revenue from Equation (34).
Step-4: Determine the fitness values of the objective function shown in Equation (35) for all search agents.
Step-5: Remove the worst search agent for GWO-GRSS.
Step-6: Determine the updated value of search agents’ positions (charging/discharging power during the EV plugin period) using Equation (37) to Equation (39), respectively.
Step-7: Check the stopping criteria if it is valid go to the next step otherwise go to step-3.
Step-8: Accumulate the daily revenue.
Step-9: Check if the iteration is lower than or equal to 365 then go to step-1, otherwise, print the results and stop.

5.2. Simulation Results

As previously mentioned in the preceding section, many modules are used to conduct the simulation tasks. The preceding sections have addressed the simulation modules. The simulation was started by using cycle and calendar tests to ascertain the parameters of the wear as described in Equation (19). The GRSS-GWO optimization method, which was presented in Section 4, was used for this purpose. The results obtained were then compared with those obtained using the classic GWO, PSO, and BA algorithms.
The trip duration, departure, and arrival timings are determined using a random scheduling process. The last simulation research involves determining the ideal daily charging, discharging, and driving powers of the EV, depending on the day-ahead tariff. The following sections include a comprehensive analysis of the outcomes obtained from the simulation experiments.

5.3. Battery Wear Parameters Estimation

The battery exemplified in reference [57] serves as a representative instance of an EV battery. The comprehensive depiction of this battery is shown in Table 1. The wear test results for the calendar and acceleration experiments are shown in Figure 12 and Figure 13, respectively [39,57]. The aforementioned data has been used to determine the wear parameters A1 to D2, as shown in Equation (13), by comparison with the values obtained from this equation and the subsequent minimization of the RMSE, as demonstrated in Equation (15). The findings of this investigation demonstrate a notable level of accuracy in the model when considering the input data points shown in Figure 12 and Figure 13. Table 2 displays the parameters acquired by the use of the GRSS-GWO and other optimization techniques.
The wear modeling presented in Section 2 is used in this context for comparison. Figure 4 displays the ACC–DOD, whereby the relationship between the DoD is determined by calculating the difference between each pair of SoC values shown in the figure.

5.4. Scheduling the Random Trip Length and Departure and Arrival Times

Several assumptions are used in the simulation listed in the following points:
  • The EV takes only one trip each day.
  • The energy consumption per hour is constant during the trip.
  • The minimum SoC during the discharging is 0.3.
  • The average speed during the trip is selected as constant, equal to 15 km/h.
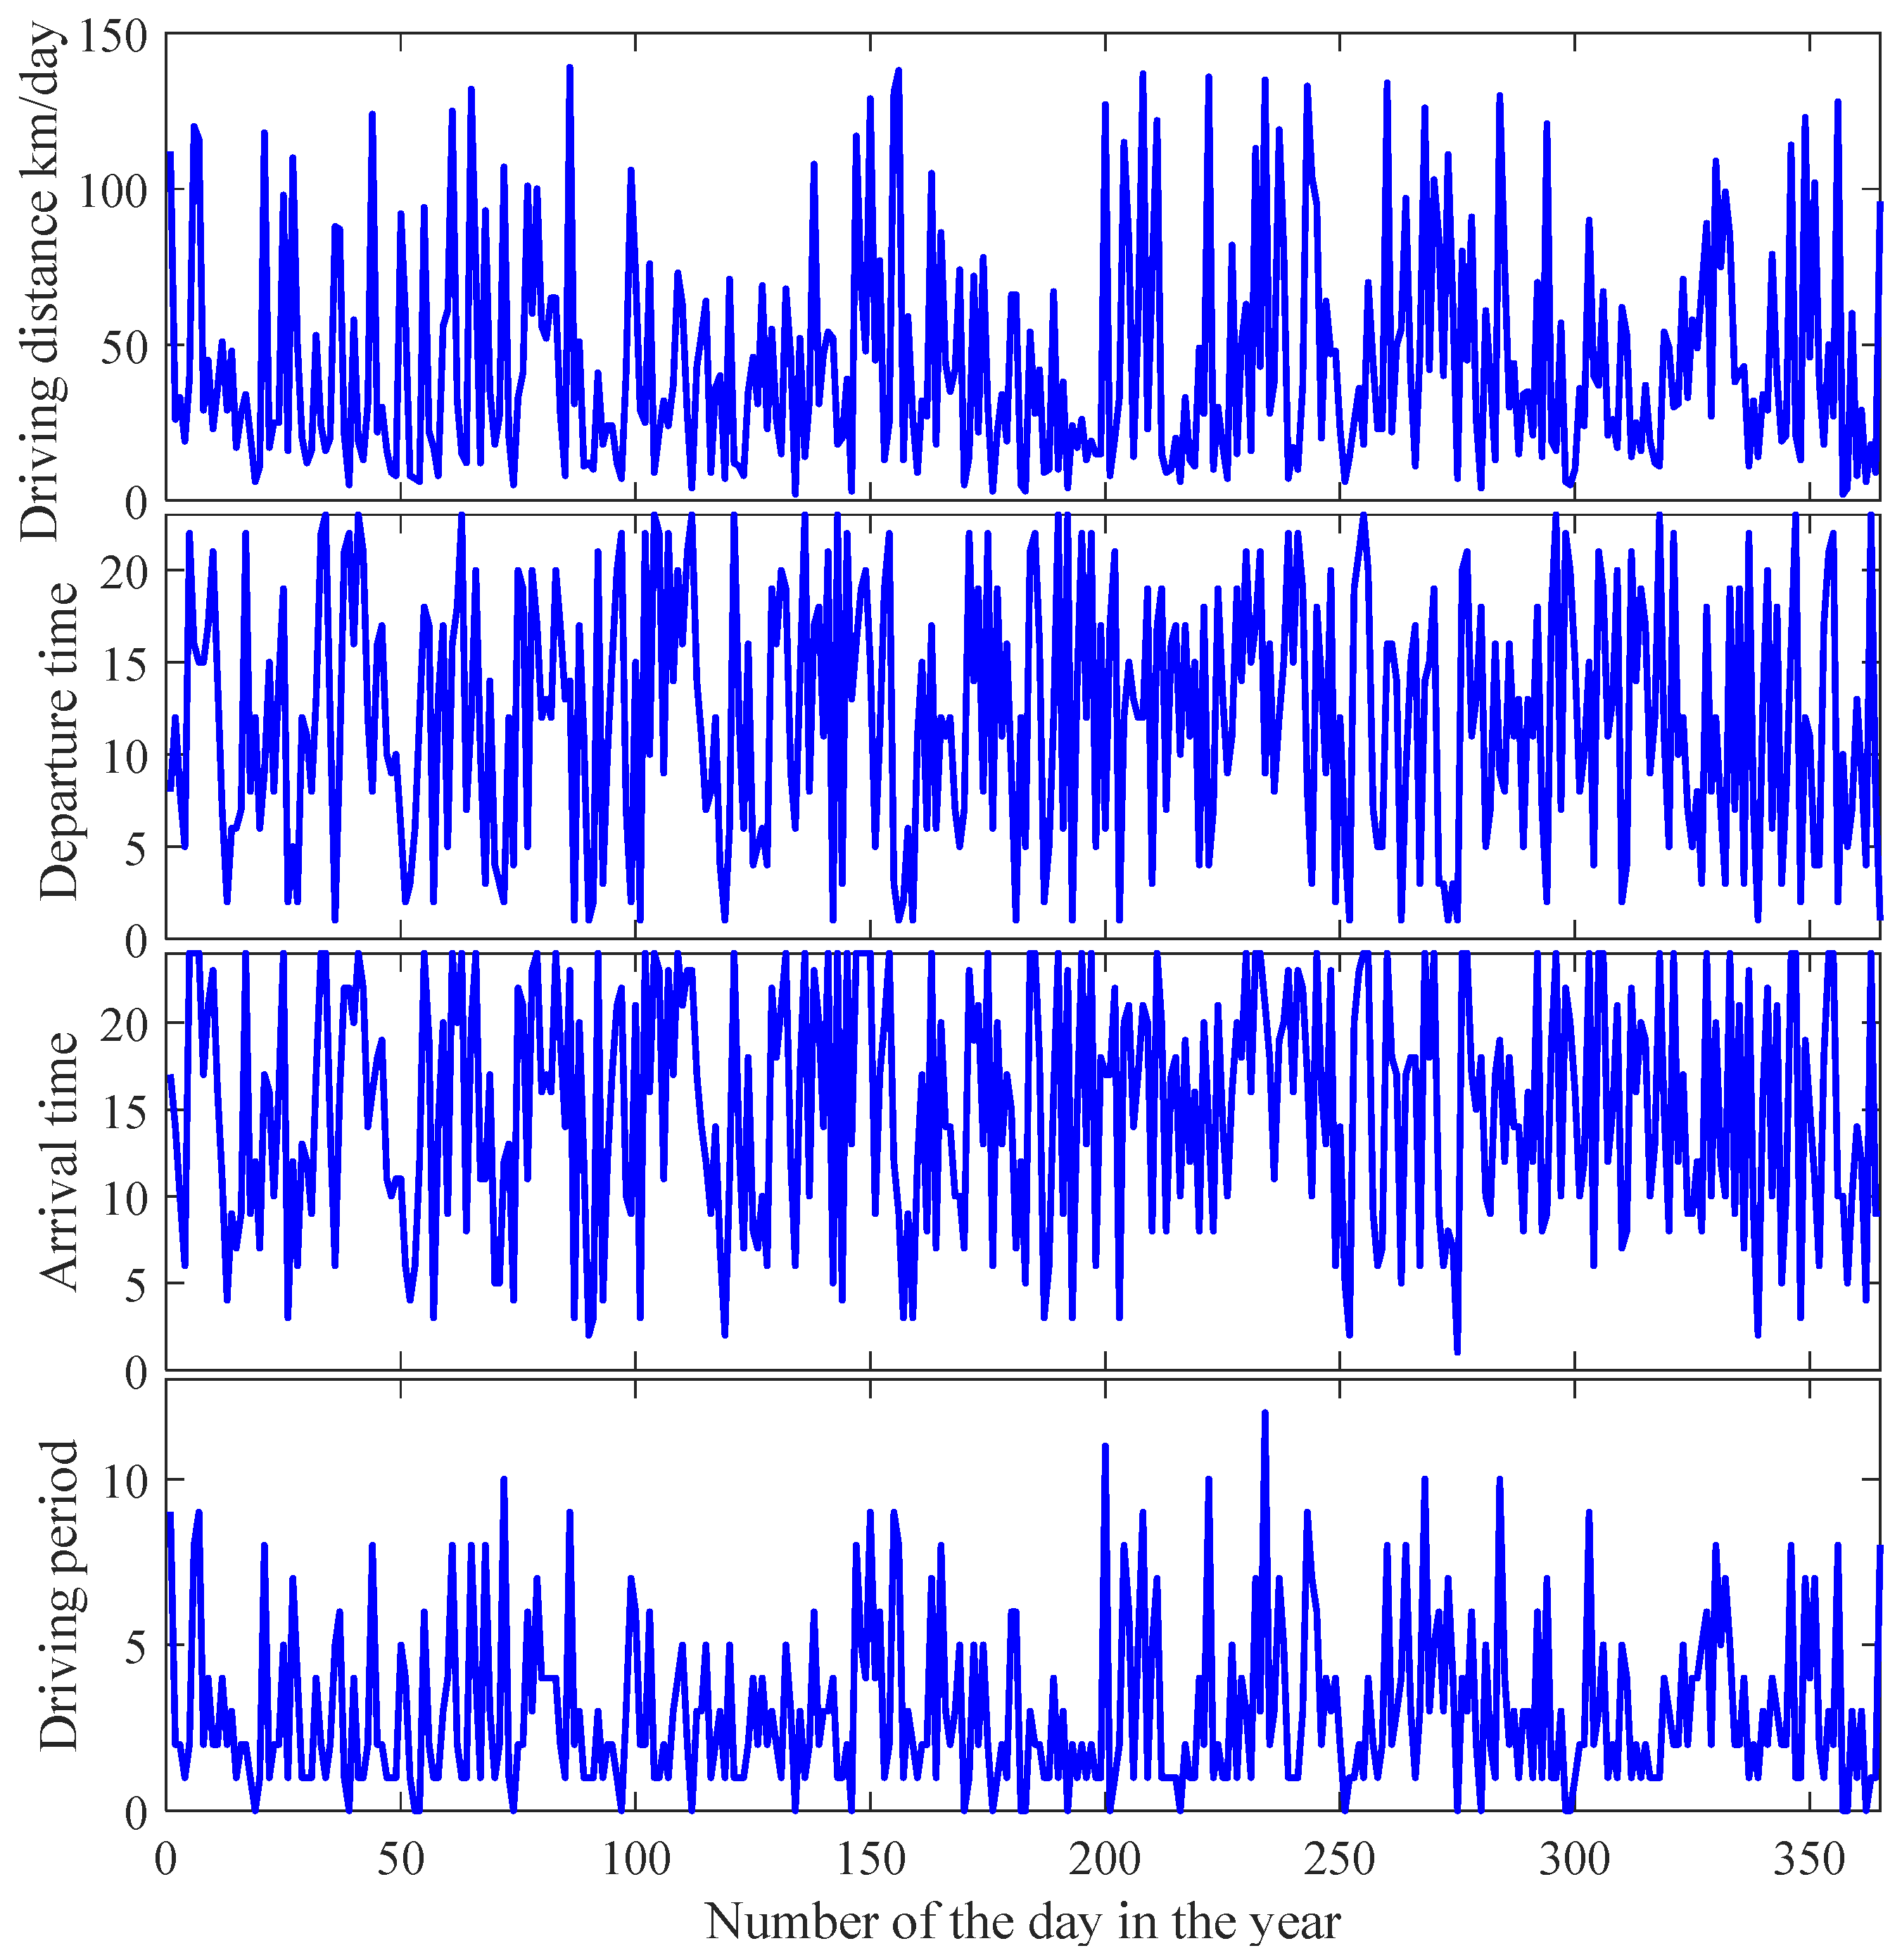
The daily distance, as derived from Equation (20) as shown in Figure 7, is used to calculate the departure and arrival times, as well as the daily energy consumption throughout the year, as depicted in Figure 14. The top track of Figure 14 displays the random daily distance. The departure time is determined using a random selection process, while the arrival time is determined based on the daily distance, taking into account an average speed of 15 km/h. The length of a driving trip is calculated by calculating the time difference between the arrival and departure times, as seen in the lowermost trace in Figure 14.

5.5. Results of Optimal Schedule of EV Aggregator

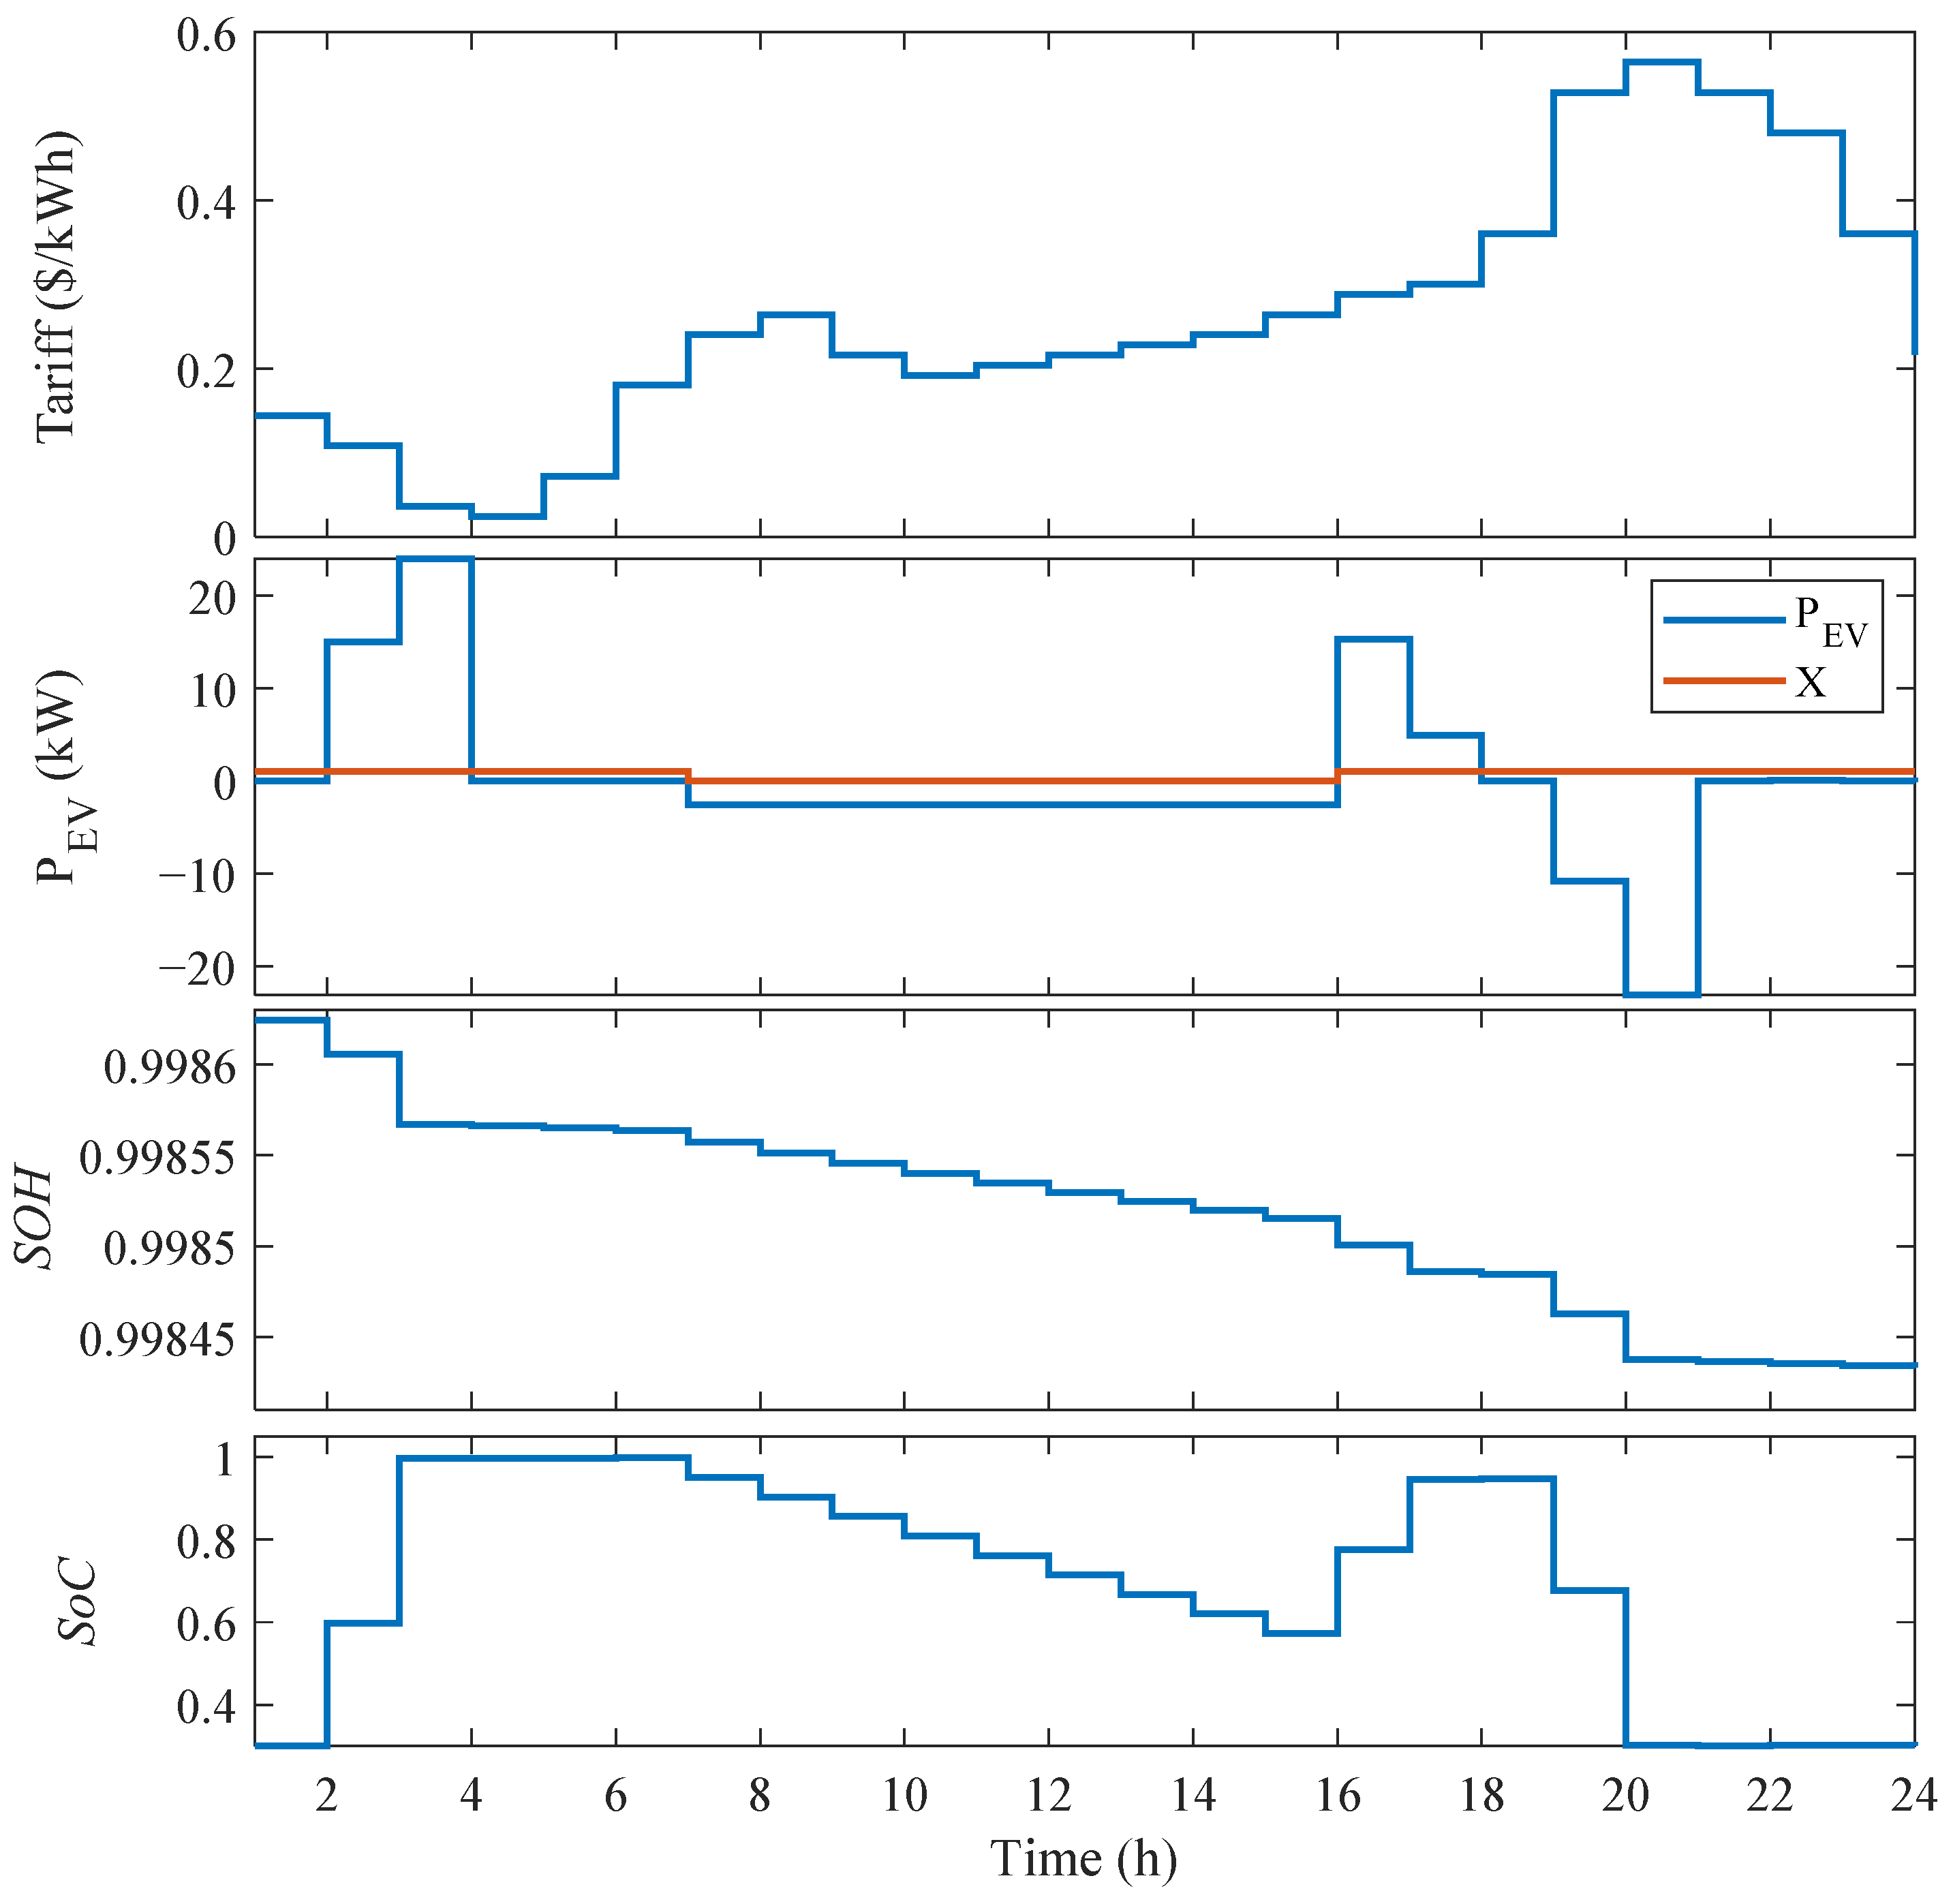
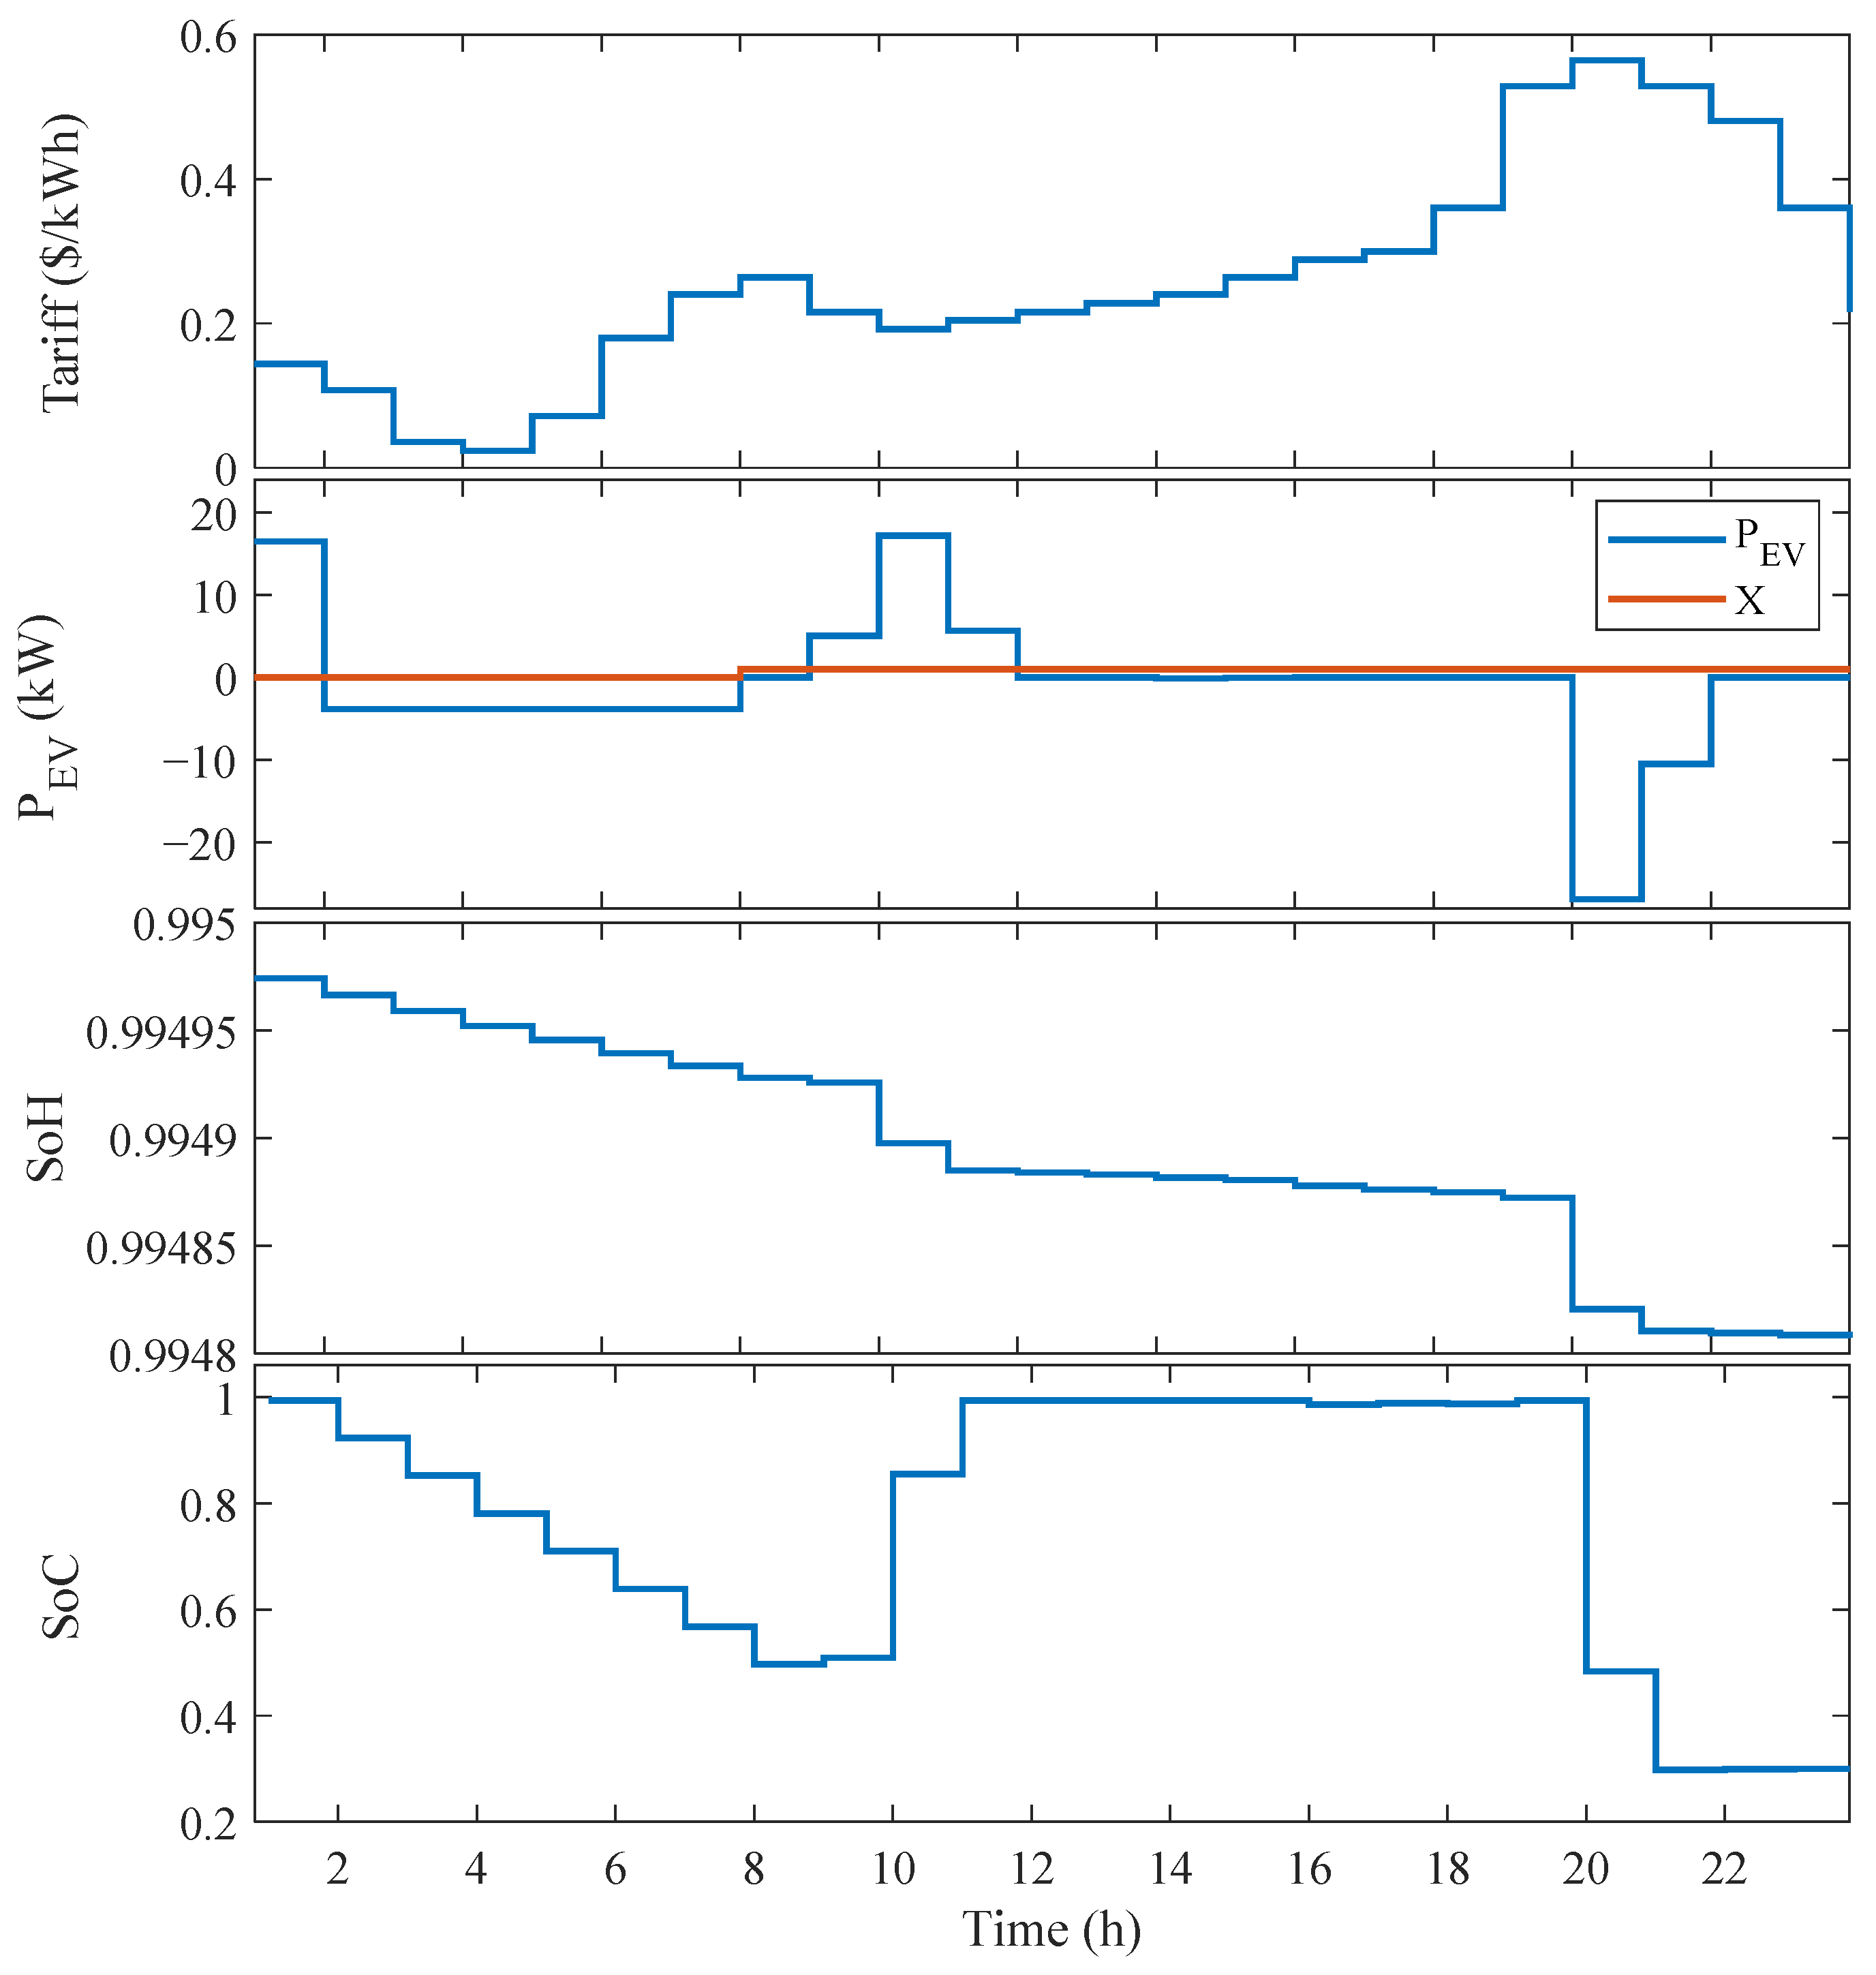
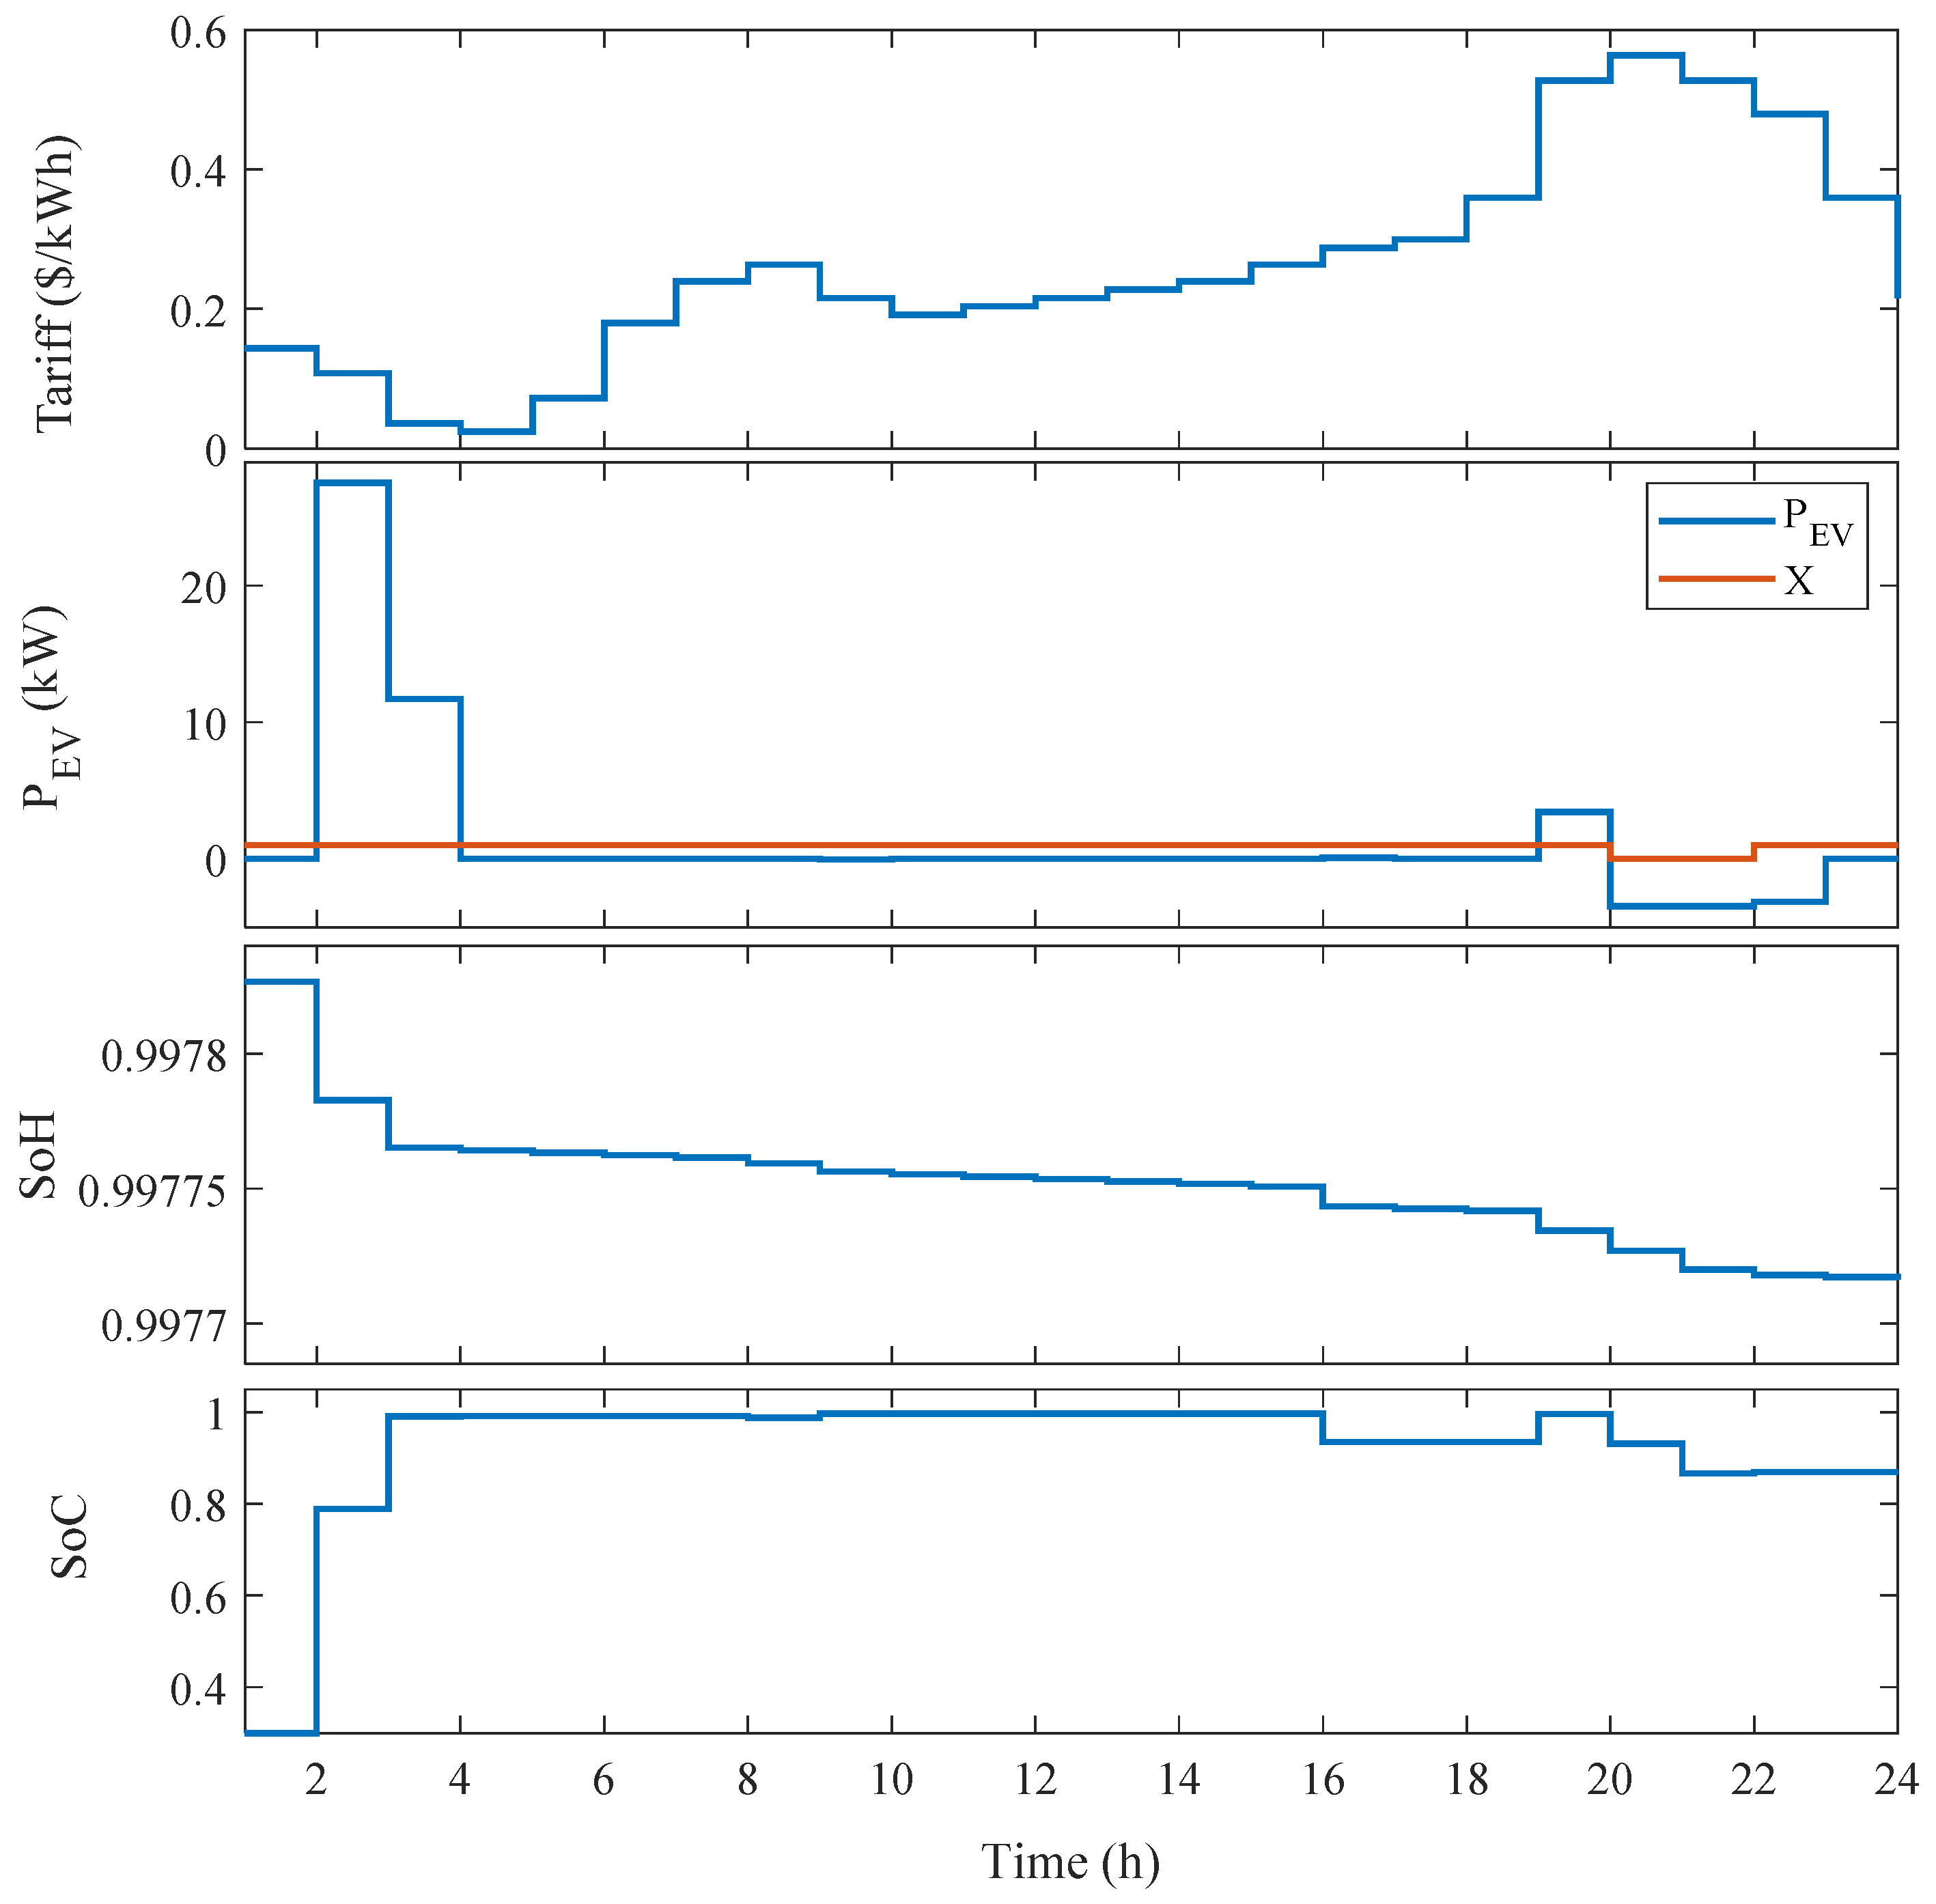
The performance of the EV throughout the day is simulated based on factors such as the daily distance, the duration of the driving excursion, and the departure and arrival timings. The optimization process is conducted daily throughout the whole year. The figures, namely, Figure 15, Figure 16 and Figure 17, depict the performance of the EV battery over 24 h under various driving conditions, namely, during off-peak, low-tariff, and high-tariff periods. The data presented in these figures indicate that scheduling the trip during low tariff periods in the morning would allow the EV to charge at a lower tariff. Conversely, scheduling the trip during high tariff periods at night would not provide the opportunity for the EV to be discharged at a higher tariff. Therefore, it can be concluded that scheduling the trip during the afternoon periods would be the most optimal choice. Furthermore, it is evident from Figure 15, Figure 16 and Figure 17 that the system undergoes charging during the low tariff period until the SoC achieves its highest value. Subsequently, it discharges during the high tariff period until the SoC reaches its lowest value, namely, at SoC = 0.3. In addition, the battery is precharged with an energy level that is equivalent to or more than the energy needed for each EV’s trip. The detailed discussion of the three situations, shown in Figure 15, Figure 16 and Figure 17, is presented in the following points.
Case-1 (driving during the off-peak period): The depicted scenario, as seen in Figure 15, demonstrates the effective use of an aggregator system. This system ensures that the EV battery is charged during low tariff times and discharged during high tariff periods, therefore enabling the stored energy to be efficiently contributed to the grid for V2G purposes. As seen in Figure 15, the battery undergoes charging in the first hours of the day to reach the predetermined SoC required for commencing the trip. The SoC remains constant until the time reaches Td (7:00), at which point the battery begins to deplete for the duration of the driving trip until the arrival time at t = 16:00. After the driving time, the SoC diminishes to a low level of 60%, indicating an insufficient amount of energy available for use during the high tariff period for discharging into the grid. Consequently, the battery undergoes a recharging process, reaching a SoC of 100%, during the time interval of t = 16:00 and t = 18:00. This ensures that the battery is adequately prepared for discharging during the high tariff period, which occurs from t = 19:00 to t = 21:00. Once the SoC of the battery reaches its minimum allowable value (SoCmin = 0.3), the battery ceases its discharge to the grid to mitigate the potential for significant battery wear. The analysis of Figure 15 demonstrates that driving during off-peak hours in the daytime presents an advantageous chance for EVs to be charged at lower tariff rates and then discharged during high tariff times. This use of V2G ideas with EVs significantly enhances the potential income generated. The daily income generated by the operation of the EV, shown in Figure 15, amounts to USD 12.52. The revenue generated by selling energy to the grid is USD 21.92, whereas the cost of charging electricity for usage during the V2G period may be determined using Equation (33) and amounts to USD 6.21. The cost of wear resulting from V2G operations, as calculated using Equation (29), is USD 3.19. The fake charging algorithm presents an opportunity for additional money by charging the EV during low tariff times, as opposed to the expense of charging the battery after the trip. The calculation of the charging cost for both the driving duration and the self-discharge period in V2G, as seen in Figure 15, involves reducing the charging cost attributed to V2G (as defined in Equation (33)) from the overall charging cost derived from Equation (33), resulting in a value of USD 3.16. This value might be likened to the act of recharging the battery after the preceding day’s trip, amounting to a sum of USD 12.67. The observed decrease in charging expenses for the trip time of the V2G system, in comparison to the dummy charging scenario, amounts to USD 9.51. By summing the two incomes, it can be inferred that the use of V2G technology on the specific day, shown in Figure 15, would provide a total revenue of USD 22.03 for the EV owner. The substantial financial gains resulting from the implementation of V2G technologies, in contrast to the usage of fake charging, underscore its better performance and advantages for both EV owners and the grid system.
Case-2 (driving during the low tariff period): The scenario, shown in Figure 16, illustrates a situation where the aggregator is unable to take advantage of the low tariff times to charge the EV battery. However, it can use the high tariff period to discharge the stored energy into the grid and engage in V2G activities. If the opportunity to charge the battery during the low tariff time is missed, the aggregator will be compelled to charge at a higher tariff after the trip. This might result in increased charging costs and reduced income compared to driving during the off-peak period, as seen in case-1. As seen in Figure 16, the EV operated in driving mode from 1:00 to 8:00, resulting in a low SoC of 0.47 after the driving time. Hence, the aggregator needs to prioritize the search for the most cost-effective tariff during low tariff times to maximize the battery’s charging capacity, enabling it to supply the grid during peak hours from 18:00 to 23:00. The aggregator determined the optimal time frame for charging the EV battery to be from 9:00 to 11:00, as seen in Figure 16. Subsequently, the SoC reached its peak level and will remain at this level until 20:00, and at this point, it will begin discharging its energy into the grid during the period with the highest tariff. Once the SoC of the battery hits its minimal threshold, it is advisable to cease the discharge of the EV battery to mitigate the potential for significant wear in the LIB. This particular incident of LIB wear was observed at 22:00. Once the battery’s SoC hits its minimum allowable value (SoCmin = 0.3), the battery ceases its discharge to the grid to mitigate the potential for significant battery wear. The analysis of Figure 16 indicates that driving the EV during the low tariff period does not enable the charging of the EV at reduced tariff rates. However, it does provide a chance to discharge the EV during high tariff times. The daily income generated by the operation of the EV in case-2, as seen in Figure 16, amounts to USD 10.54, in contrast to the USD 12.52 revenue observed in case-1. The price for selling energy to the grid is USD 22.15, whereas the cost of charging electricity for usage during the V2G period may be determined by referring to Equation (33) and is USD 8.19. The cost of wear resulting from V2G operations, as calculated using Equation (29), amounts to USD 3.42. The percentage decrease in income from case-1 to case-2 is calculated as (12.52–10.54)/10.54, resulting in a drop of 18.8%. This implies that failing to charge the EV battery during a time of low tariff rates might result in a decrease in income from V2G operations by 18.8%. Due to this rationale, it is advisable to arrange the travel to prevent the possibility of losing out on the time of reduced tariffs designated for charging the EV battery.
Case-3 (driving during the high tariff period): The scenario, shown in Figure 17, demonstrates that the aggregator will refrain from using the high tariff times to discharge the EV battery to the grid. However, it will ensure that the low tariff period is used for charging the battery. Failure to take advantage of the high tariff period for battery discharge would compel the aggregator to empty the battery during off-peak tariff periods after the trip. This might result in a decrease in the income generated from V2G operations compared to the scenario in case-1, when the EV was driven during the off-peak period. As seen in Figure 17, the EV underwent charging from 2:00 to 4:00, resulting in the SoC reaching a value of 1. The battery remained connected to the SoC until the commencement of the driving excursion at 20:00. The driving time concludes at 23:00, including all high tariff periods. Consequently, the EV will not engage in V2G activities since it lacks a high tariff period. The revenue from the third scenario shown in Figure 17 is almost negligible, indicating that it is not advisable to undertake the trip during peak hours.
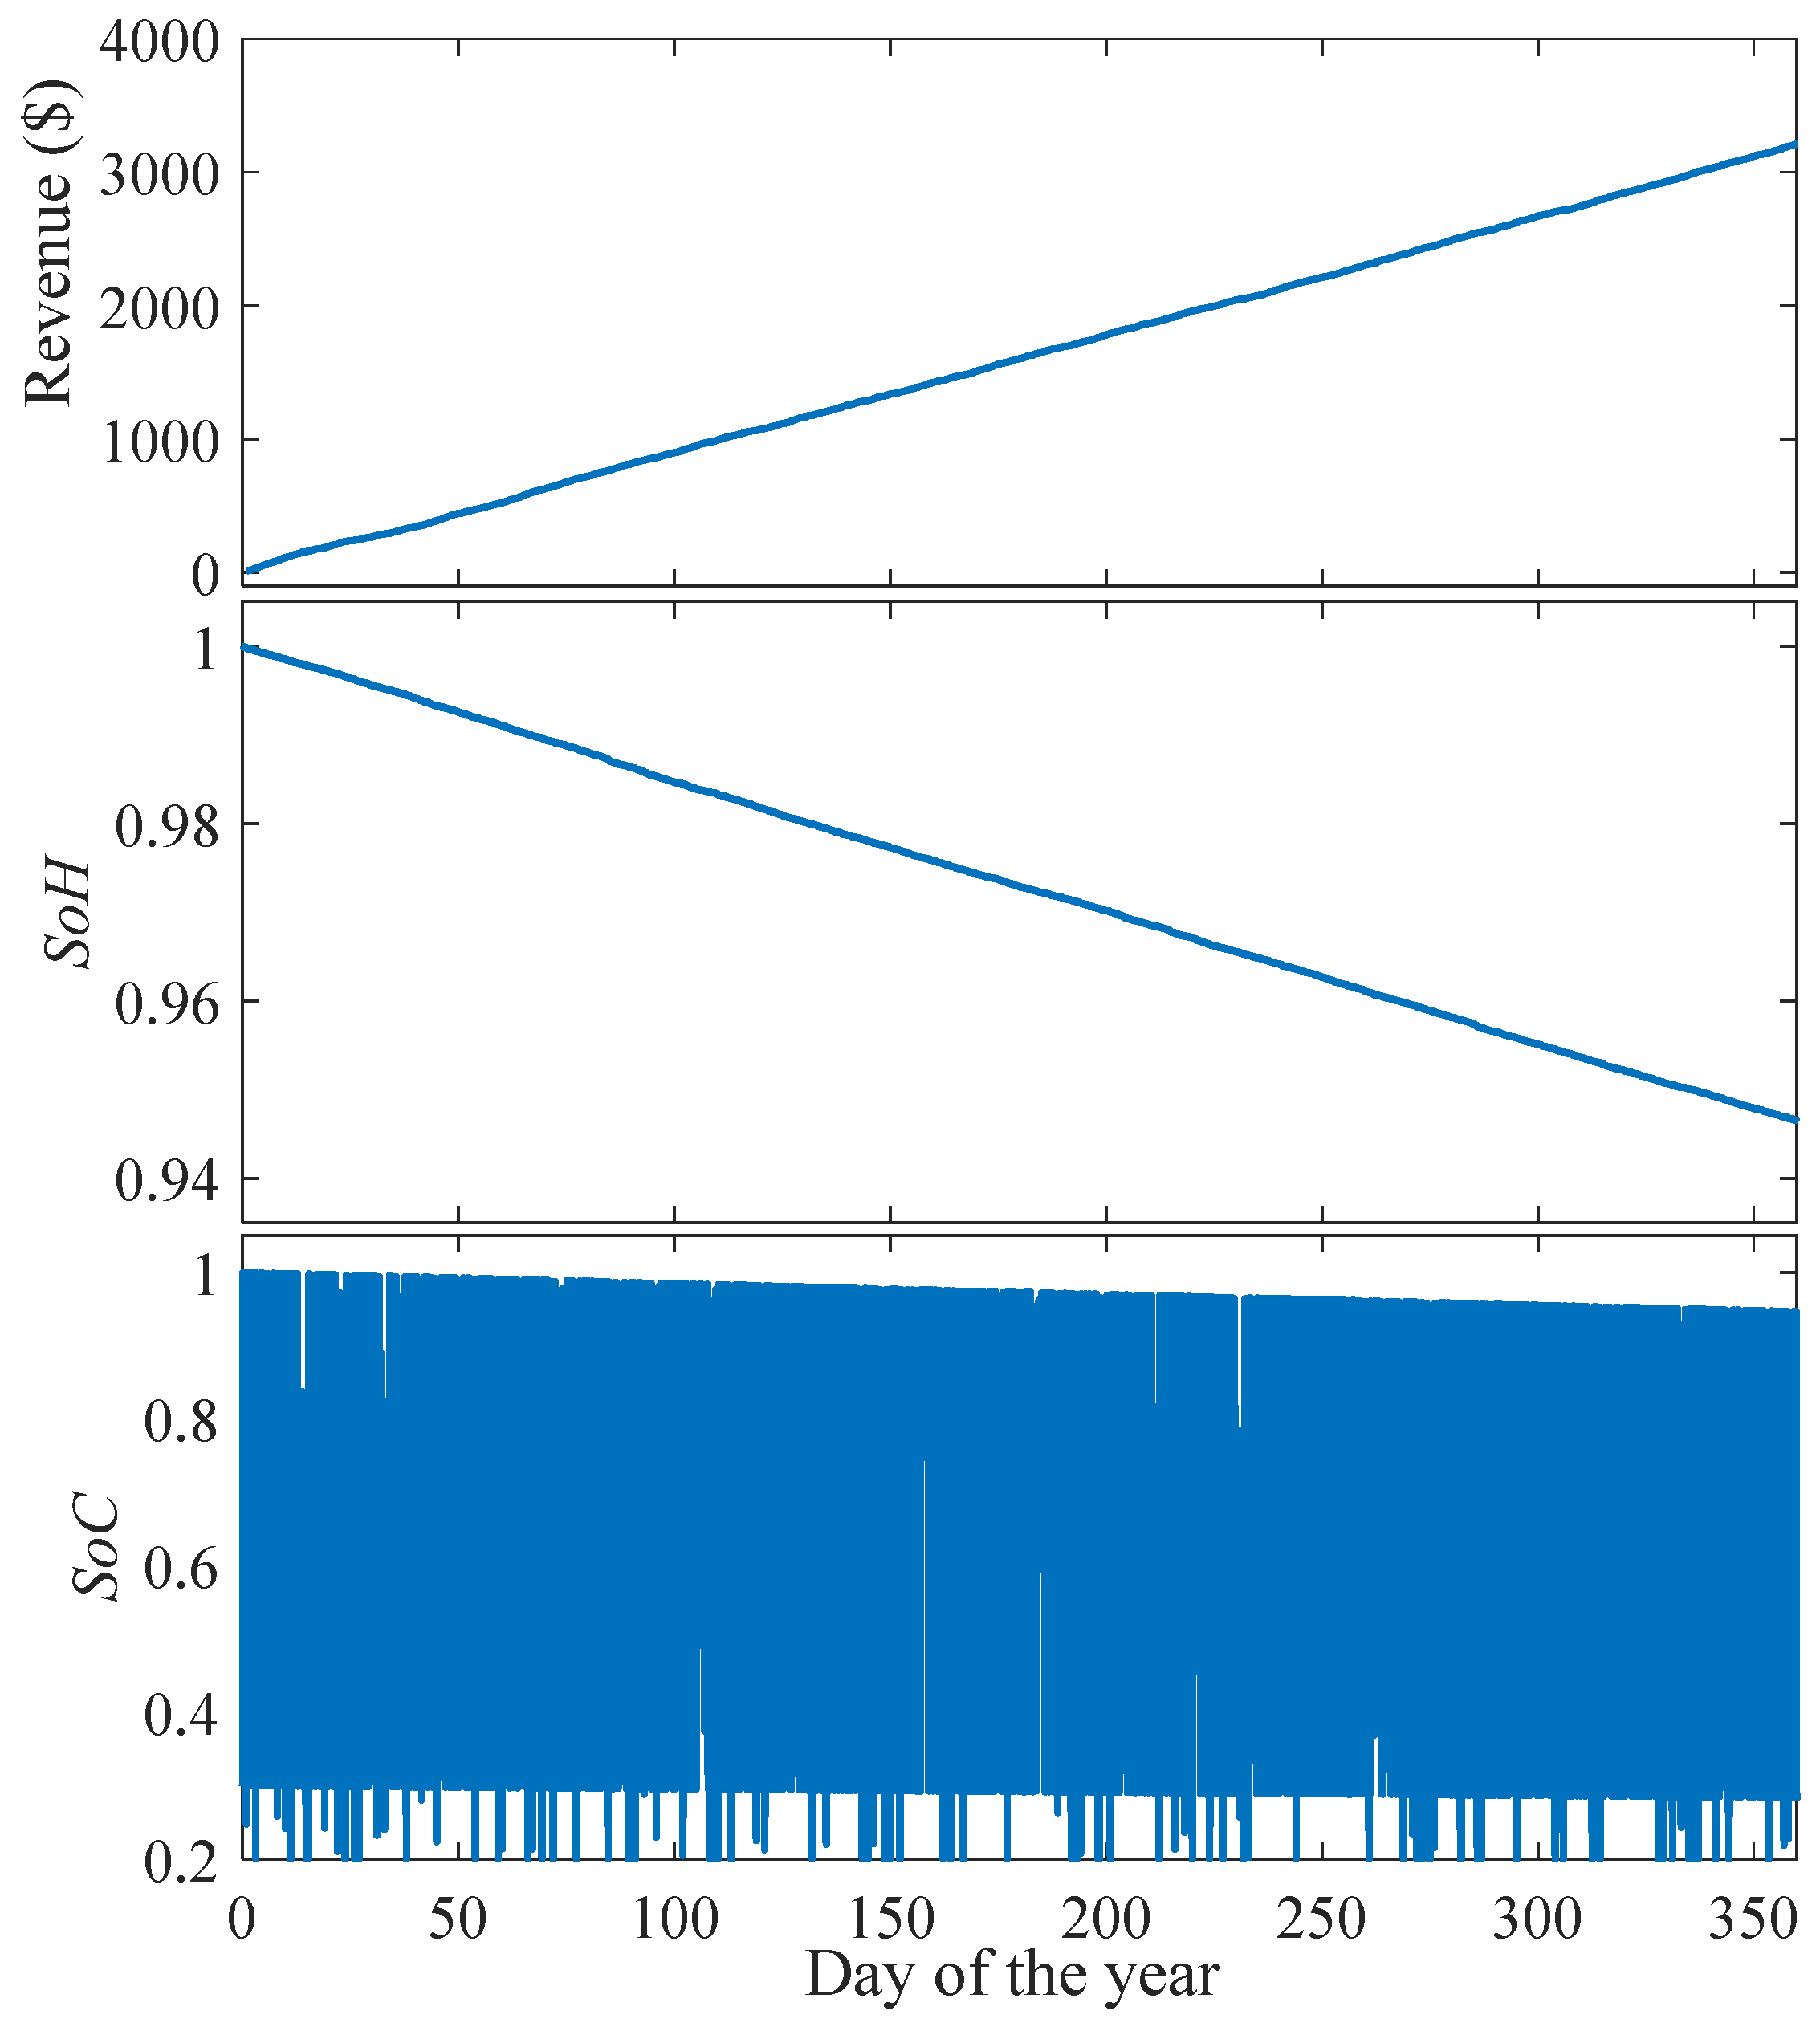
Figure 18 depicts the annual representation of the daily income and the temporal fluctuation of the SoH and SoC. This figure demonstrates a clear positive linear relationship between revenue and time, indicating a consistent increase in income over time. Simultaneously, the SoH exhibits a progressive decline as time progresses. Furthermore, the annual income amounts to USD 3245. Additionally, the SoH has decreased from 1 to 0.9466, indicating a yearly wear rate of 5.34%. If the battery is changed when its SoH reaches 80%, the estimated duration of the battery’s lifespan will be around four years.
When the V2G concept (dummy charging) is not used, the annual SoH experiences a decrease from 1 to 0.9745, indicating a yearly wear rate of 2.55%. If the battery is to be changed when its SoH reaches 80%, the estimated duration of the battery’s lifespan would be around 7.8431 years.
Table 3 presents a comprehensive comparison between the best use of V2G technology and the conventional method of dumb charging. The data shown in the table indicates that the annual charging cost amounts to USD 904.6 when using the conventional charging method, which involves charging the EV directly after each trip period, irrespective of the tariff value. In contrast, the implementation of an optimum V2G strategy results in a lower charging cost of USD 765.4. Demonstrating the charging cost of an EV battery necessitates accounting for both the energy used when driving and the energy expended when discharging power back to the grid. The reduced charging expenses associated with V2G technology, in contrast to conventional charging methods, may be attributed to the strategic selection of the most cost-effective tariff periods for battery charging purposes.
The annual cost of battery wear for the V2G system is more than that of the conventional dumb charging mode. This is due to the additional demand placed on the battery, as it must not only provide energy for driving purposes but also provide power to the grid during peak hours. The results shown in Table 3 demonstrates that the battery wear cost of the V2G system is more than double the value seen in the dumb charging mode. In contrast, the annual expenses associated with charging and wear amount to USD 1492.1 for the conventional charging method and USD 1995.7 for the V2G running mode. The annual revenue generated from the implementation of V2G technology amounts to USD 5240.7. The annual revenue generated through the implementation of V2G technology, calculated as the difference between annual revenues and annual costs, amounts to USD 3245. The annual income surpasses 70% of the entire annual battery replacement cost, which is calculated as (140 − 60) × 24 × 2.4 = USD 4608. This implies that the payback time of the EV battery is shorter than 1.5 years when using the V2G mode, without considering the expenses associated with battery wear caused by driving. The favorable outcomes stemming from the V2G operating mode serve as a motivating factor for EV owners to actively engage in this technological advancement.

6. Conclusions

The increasing usage of EVs in modern transportation networks may pose several issues to the present power infrastructure due to insufficient coordination at the time of their charging sessions. The installation of a charging schedule and the usage of EV batteries to help the power system during peak hours may enhance the stability of the present power system and bring large financial advantages to EV owners. The purpose of this study is to determine the importance of employing the vehicle-to-grid (V2G) mode while charging and discharging EV batteries. The V2G mode optimizes charging during low-tariff seasons and discharging during high-tariff seasons. As described in this study, the deployment of an accurate wear model for EV batteries acts as an incentive for EV owners to interact with the technology. This paper proposes a novel technique for evaluating hourly wear costs, taking into account a variety of factors such as temperature, operating power, and SoC. The use of V2G technology in the management of charging and discharging activities has been studied using a modified grey wolf optimization approach. The gradually reduced swarm size grey wolf optimization (GRSS-GWO) method was used for this aim. The modified strategy resulted in a reduction in convergence time and an increase in accuracy. The findings of the algorithm used in this research show that, despite the projected lifetime of an EV has fallen from about 7 years to 4 years, EV owners may still expect to earn USD 3245. Furthermore, when utilized in combination with the V2G operating mode, the EV has a payback period of 1.5 years. The excellent results obtained via the adoption of the V2G operating mode serve as a strong incentive for EV owners to actively participate in V2G activities, therefore reinforcing the overall stability of modern power systems.
The experimental validation of the simulated proposal could be approached in further research studies.

Funding

This research was funded by King Abdullah City for Atomic and Renewable Energy (K.A.CARE), Saudi Arabia.

Data Availability Statement

No new data were created or analyzed in this study. Data sharing is not applicable to this article.

Conflicts of Interest

The author declares no conflict of interest.

List of Symbols and Abbreviations

SymbolDefinitionsSymbolDefinitions
V2Gvehicle-to-gridTddeparture time
G2Vgrid-to-vehicleTrarrival time
EVelectric vehicleuavaverage EV speed
SoC, sstate of chargePEVthe power of the battery
SoHstate of healthEEVDenergy of the driving period
DoD, Ddepth of dischargeXdispatch matrix
ESSenergy storage system η B C battery charging efficiency
DSMdemand side management η B D battery discharging efficiency
REDGrenewable energy distributed generatorσdaily self-discharge
GWOgrey wolf optimizationEoLend of life
GRSSgradual reduction of swarm sizeCwdaily cost due to battery wear
LIBlithium-ion batteryCbprice of the new battery
Cratecurrent rateC2ndprice of the second-life battery
ACCachievable cycle count C w V 2 G n daily V2G battery wear cost
WDFwear density function C w _ D r n daily driving battery wear cost
Ncnumber of cycles C w _ C h n daily battery wear charging cost
a and bbattery specification parameters C i d l e n daily calendar battery wear cost
AWCaverage wear costCCdaily total charging cost
η b battery efficiency λ t hourly tariff (USD/kWh)
Cbtotal battery price C C V 2 G n charging cost for V2G
Ebrbattery rated capacityTchcharging time
TWCtotal wear cost R V 2 G n daily revenue due to V2G
Pbbattery power S o C T d n battery SoC at the beginning of the trip
Rideal gas constant S o C 0 n required SoC at the beginning of the trip
Eaactivation energy parameterw1weight value
LAMloss of active materialsPSOparticle swarm optimization
SEIsolid electrolyte interphaseCSAcuckoo Search Algorithm
turise time BAbat algorithm
Wbattery wear dnumber of variables
Wcalcalendar battery wear V j i position of ariable j at iteration i
Wcyccycling battery wear R j i random vector R j i [ 0 , 1 ]
TtemperatureaGWO control parameter
SoCminminimum SoCitmaxmaximum number of iterations
SoCmaxmaximum SoCFobjective function
SoCaaverage SoCVbestthe position of the best wolf
RMSEroot mean square error Fbestfitness value of the best wolf
Wmmeasured battery wear Vworstthe position of the worst wolf
Wccalculated battery wearFbestfitness value of the worst wolf
nmnumber of test pointsSSswarm size
fdesdistribution functionOMCoperating and maintenance cost
LEVdaily driving distanceμEVvariance of the daily distance of EV
σEVaverage daily distanceβEVspecific power consumption
EEVEV trip consumed energy

References

  1. Ali, M.U.; Zafar, A.; Nengroo, S.H.; Hussain, S.; Junaid Alvi, M.; Kim, H.J. Towards a smarter battery management system for electric vehicle applications: A critical review of lithium-ion battery state of charge estimation. Energies 2019, 12, 446. [Google Scholar] [CrossRef]
  2. Gonzalez, I.; Calderón, A.J.; Folgado, F.J. IoT real time system for monitoring lithium-ion battery long-term operation in microgrids. J. Energy Storage 2022, 51, 104596. [Google Scholar] [CrossRef]
  3. Moulik, B.; Söffker, D. Battery Management System for Future Electric Vehicles. Appl. Sci. 2020, 10, 5095. [Google Scholar] [CrossRef]
  4. Damiano, A.; Gatto, G.; Marongiu, I.; Porru, M.; Serpi, A. Vehicle-to-grid technology—State-of-the-art and future scenarios. J. Energy Power Eng. 2014, 8, 152–165. [Google Scholar]
  5. Sortomme, E.; El-Sharkawi, M.A. Optimal combined bidding of vehicle-to-grid ancillary services. IEEE Trans. Smart Grid 2011, 3, 70–79. [Google Scholar] [CrossRef]
  6. Alotaibi, M.A.; Eltamaly, A.M. Upgrading conventional power system for accommodating electric vehicle through demand side management and V2G concepts. Energies 2022, 15, 6541. [Google Scholar] [CrossRef]
  7. Lopes, J.A.P.; Soares, F.J.; Almeida, P.M.R. Integration of electric vehicles in the electric power system. Proc. IEEE 2010, 99, 168–183. [Google Scholar] [CrossRef]
  8. Kempton, W.; Tomić, J. Vehicle-to-grid power fundamentals: Calculating capacity and net revenue. J. Power Sources 2005, 144, 268–279. [Google Scholar] [CrossRef]
  9. Fasugba, M.A.; Krein, P.T. Cost benefits and vehicle-to-grid regulation services of unidirectional charging of electric vehicles. In Proceedings of the 2011 IEEE Energy Conversion Congress and Exposition, Phoenix, AZ, USA, 17 September 2011; pp. 827–834. [Google Scholar]
  10. Mwasilu, F.; Justo, J.J.; Kim, E.K.; Do, T.D.; Jung, J.W. Electric vehicles and smart grid interaction—A review on vehicle to grid and renewable energy sources integration. Renew. Sust. Energy Rev. 2014, 34, 501–516. [Google Scholar] [CrossRef]
  11. Mignoni, N.; Carli, R.; Dotoli, M. Distributed Noncooperative MPC for Energy Scheduling of Charging and Trading Electric Vehicles in Energy Communities. IEEE Trans. Control Syst. Technol. 2023, 31, 2159–2172. [Google Scholar] [CrossRef]
  12. Tushar, M.H.K.; Zeineddine, A.W.; Assi, C. Demand-side management by regulating charging and discharging of the EV, ESS, and utilizing renewable energy. IEEE Trans. Ind. Inform. 2017, 14, 117–126. [Google Scholar] [CrossRef]
  13. Sortomme, E.; El-Sharkawi, M.A. Optimal charging strategies for unidirectional vehicle-to-grid. IEEE Trans. Smart Grid 2010, 2, 131–138. [Google Scholar] [CrossRef]
  14. De Los Ríos, A.; Goentzel, J.; Nordstrom, K.E.; Siegert, C.W. Economic analysis of vehicle-to-grid (V2G)-enabled fleets participating in the regulation service market. In Proceedings of the 2012 IEEE PES Innovative Smart Grid Technologies (ISGT), Washington, DC, USA, 16–20 January 2012; pp. 1–8. [Google Scholar]
  15. Weiller, C. Plug-in hybrid electric vehicle impacts on hourly electricity demand in the united states. Energy Policy 2011, 39, 3766–3778. [Google Scholar] [CrossRef]
  16. Fernandez, L.P.; San Román, T.G.; Cossent, R.; Domingo, C.M.; Frias, P. Assessment of the impact of plug-in electric vehicles on distribution networks. IEEE Trans. Power Syst. 2010, 26, 206–213. [Google Scholar] [CrossRef]
  17. Vasirani, M.; Kota, R.; Cavalcante, R.L.G.; Ossowski, S.; Jennings, N.R. An agent-based approach to virtual power plants of wind power generators and electric vehicles. IEEE Trans. Smart Grid 2013, 4, 1314–1322. [Google Scholar] [CrossRef]
  18. Ma, Z.; Callaway, D.S.; Hiskens, I.A. Decentralized charging control of large populations of plug-in electric vehicles. IEEE Trans. Control Syst. Technol. 2011, 21, 67–78. [Google Scholar] [CrossRef]
  19. Kumar, K.N.; Sivaneasan, B.; Cheah, P.H.; So, P.L.; Wang, D.Z. V2G capacity estimation using dynamic EV scheduling. IEEE Trans. Smart Grid 2013, 5, 1051–1060. [Google Scholar] [CrossRef]
  20. Madzharov, D.; Delarue, E.; D’haeseleer, W. Integrating electric vehicles as flexible load in unit commitment modeling. Energy 2014, 65, 285–294. [Google Scholar] [CrossRef]
  21. Safdarian, F.; Ciftci, O.; Kargarian, A. A Time Decomposition and Coordination Strategy for Power System Multi-Interval Operation. In Proceedings of the 2018 IEEE Power & Energy Society General Meeting (PESGM), Portland, OR, USA, 5–10 August 2018; pp. 1–5. [Google Scholar]
  22. Tuttle, D.P.; Baldick, R. The evolution of plug-in electric vehicle-grid interactions. IEEE Trans. Smart Grid 2012, 3, 500–505. [Google Scholar] [CrossRef]
  23. Soares, J.; Morais, H.; Sousa, T.; Vale, Z.; Faria, P. Day-ahead scheduling including demand response for electric vehicles. IEEE Trans. Smart Grid 2013, 4, 596–605. [Google Scholar] [CrossRef]
  24. Kandpal, B.; Pareek, P.; Verma, A. A robust day-ahead scheduling strategy for EV charging stations in unbalanced distribution grid. Energy 2022, 249, 123737. [Google Scholar] [CrossRef]
  25. Eltamaly, A.M.; Alotaibi, M.A. Novel fuzzy-swarm optimization for sizing of hybrid energy systems applying smart grid concepts. IEEE Access 2021, 9, 93629–93650. [Google Scholar] [CrossRef]
  26. Safdarian, F.; Lamonte, L.; Kargarian, A.; Farasat, M. Distributed optimization-based hourly coordination for V2G and G2V. In Proceedings of the 2019 IEEE Texas Power and Energy Conference (TPEC), College Station, TX, USA, 7–8 February 2019; pp. 1–6. [Google Scholar]
  27. Faria, A.S.B. A Chance-constrained Approach for Electric Vehicle Aggregator Participation in the Reserve Market. Doctoral Dissertation, Universidade do Porto, Porto, Portugal, 2019. [Google Scholar]
  28. Soman, S.S.; Zareipour, H.; Malik, O.; Mandal, P. A review of wind power and wind speed forecasting methods with different time horizons. In Proceedings of the North American Power Symposium (NAPS), Arlington, TX, USA, 26–28 September 2010; pp. 1–8. [Google Scholar]
  29. Shao, S.; Zhang, T.; Pipattanasomporn, M.; Rahman, S. Impact of TOU rates on distribution load shapes in a smart grid with PHEV penetration. In Proceedings of the IEEE PES T&D 2010, New Orleans, LA, USA, 19–22 April 2010; pp. 1–6. [Google Scholar]
  30. Cao, Y.; Tang, S.; Li, C.; Zhang, P.; Tan, Y.; Zhang, Z.; Li, J. An optimized EV charging model considering TOU price and SOC curve. IEEE Trans Smart Grid 2012, 3, 388–393. [Google Scholar] [CrossRef]
  31. Darabi, Z.; Ferdowsi, M. Aggregated impact of plug-in hybrid electric vehicles on electricity demand profile. Smart Power Grids 2012, 2011, 319–349. [Google Scholar] [CrossRef]
  32. Han, S.; Han, S.; Aki, H. A practical battery wear model for electric vehicle charging applications. Appl. Energy 2014, 113, 1100–1108. [Google Scholar] [CrossRef]
  33. Peterson, S.B.; Apt, J.; Whitacre, J.F. Lithium-ion battery cell degradation resulting from realistic vehicle and vehicle-to-grid utilization. J. Power Sources 2010, 195, 2385–2392. [Google Scholar] [CrossRef]
  34. Peterson, S.B.; Whitacre, J.F.; Apt, J. The economics of using plug-in hybrid electric vehicle battery packs for grid storage. J. Power Sources 2010, 195, 2377–2384. [Google Scholar] [CrossRef]
  35. Zhou, C.; Qian, K.; Allan, M.; Zhou, W. Modeling of the cost of EV battery wear due to V2G application in power systems. IEEE Trans. Energy Convers 2011, 26, 1041–1050. [Google Scholar] [CrossRef]
  36. Lödl, M.; Witzmann, R. Operation strategies of hybrid energy storages in low voltage distribution grids with a high degree of decentralized. In Proceedings of the 3rd IEEE PES Innovative Smart Grid Technologies Europe (ISGT Europe), Berlin, Germany, 14–17 October 2012; pp. 1–7. [Google Scholar]
  37. Bashash, S.; Moura, S.J.; Forman, J.C.; Fathy, H.K. Plug-in hybrid electric vehicle charge pattern optimization for energy cost and battery longevity. J. Power Sources 2011, 196, 541–549. [Google Scholar] [CrossRef]
  38. Hoke, A.; Brissette, A.; Maksimović, D.; Pratt, A.; Smith, K. Electric vehicle charge optimization including effects of lithium-ion battery degradation. In Proceedings of the 2011 IEEE Vehicle Power and Propulsion Conference, Chicago, IL, USA, 6–9 September 2011; pp. 1–8. [Google Scholar]
  39. Eltamaly, A. A novel energy storage and demand side management for entire green smart grid system for NEOM city in Saudi Arabia. Energy Storage 2023, e515. [Google Scholar] [CrossRef]
  40. Almutairi, Z.A.; Eltamaly, A.M.; El Khereiji, A.; Al Nassar, A.; Al Rished, A.; Al Saheel, N.; Al Marqabi, A.; Al Hamad, S.; Al Harbi, M.; Sherif, R.; et al. Modeling and Experimental Determination of Lithium-Ion Battery Degradation in Hot Environment. In Proceedings of the 23rd International Middle East Power Systems Conference (MEPCON), Cairo, Egypt, 13–15 December 2022; pp. 1–8. [Google Scholar]
  41. Wang, J.; Purewal, J.; Liu, P.; Hicks-Garner, J.; Soukazian, S.; Sherman, E.; Sorenson, A.; Vu, L.; Tataria, H.; Verbrugge, M.W. Degradation of lithium ion batteries employing graphite negatives and nickel–cobalt–manganese oxide+ spinel manganese oxide positives: Part 1, aging mechanisms and life estimation. J. Power Sources 2014, 269, 937–948. [Google Scholar] [CrossRef]
  42. Thompson, A. Economic implications of lithium ion battery degradation for Vehicle-to-Grid (V2X) services. J. Power Sources 2018, 396, 691–709. [Google Scholar] [CrossRef]
  43. Franke-Lang, R.; Kowal, J. Electrochemical Model-Based Investigation of Thick LiFePO4 Electrode Design Parameters. Modelling 2021, 2, 259–287. [Google Scholar] [CrossRef]
  44. Wang, J.; Liu, P.; Hicks-Garner, J.; Sherman, E.; Soukiazian, S.; Verbrugge, M.; Tataria, H.; Musser, J.; Finamore, P. Cycle-life model for graphite-LiFePO4 cells. J. Power Sources 2011, 196, 3942–3948. [Google Scholar] [CrossRef]
  45. Zhu, L.; He, J.; He, L.; Huang, W.; Wang, Y.; Liu, Z. Optimal Operation Strategy of PV-Charging-Hydrogenation Composite Energy Station Considering Demand Response. Energies 2022, 15, 5915. [Google Scholar] [CrossRef]
  46. Venkatapathy, K.; Tazelaar, E.; Veenhuizen, B. A systematic identification of first to second life shift-point of lithium-ion batteries. In Proceedings of the 2015 IEEE Vehicle Power and Propulsion Conference (VPPC), Montreal, QC, Canada, 19–22 October 2015; pp. 1–4. [Google Scholar]
  47. Rohr, S.; Wagner, S.; Baumann, M.; Müller, S.; Lienkamp, M. A techno-economic analysis of end of life value chains for lithium-ion batteries from electric vehicles. In Proceedings of the 2017 Twelfth International Conference on Ecological Vehicles and Renewable Energies (EVER), Monte Carlo, Monaco, 11–13 April 2017; pp. 1–14. [Google Scholar]
  48. Eltamaly, A.M.; Farh, H.M.; Abokhalil, A.G. A novel PSO strategy for improving dynamic change partial shading photovoltaic maximum power point tracker. Energy Sources Part A Recovery Util. Environ. Eff. 2020, 1–15. [Google Scholar] [CrossRef]
  49. Mirjalili, S.; Mirjalili, S.M.; Lewis, A. Grey wolf optimizer0. Adv. Eng. Softw. 2014, 69, 46–61. [Google Scholar] [CrossRef]
  50. Eltamaly, A.M. An improved cuckoo search algorithm for maximum power point tracking of photovoltaic systems under partial shading conditions. Energies 2021, 14, 953. [Google Scholar] [CrossRef]
  51. Eltamaly, A.M. Musical chairs algorithm for parameters estimation of PV cells. Sol. Energy 2022, 241, 601–620. [Google Scholar] [CrossRef]
  52. Eltamaly, A.M.; Al-Saud, M.S.; Abokhalil, A.G. A novel scanning bat algorithm strategy for maximum power point tracker of partially shaded photovoltaic energy systems. Ain Shams Eng. J. 2020, 11, 1093–1103. [Google Scholar] [CrossRef]
  53. Carli, R.; Dotoli, M. A distributed control algorithm for waterfilling of networked control systems via consensus. IEEE Control Syst. Lett. 2017, 1, 334–339. [Google Scholar] [CrossRef]
  54. Rabie, A.H.; Eltamaly, A.M. A new NEST-IGWO strategy for determining optimal IGWO control parameters. Neural Comput. Appl. 2023, 35, 15143–15165. [Google Scholar] [CrossRef]
  55. Wen, L. Grey Wolf Optimizer based on Nonlinear Adjustment Control Parameter. In Proceedings of the 4th International Conference on Sensors, Mechatronics and Automation (ICSMA 2016), Zhuhai, China, 12–13 November 2016; Volume 136, pp. 643–648. [Google Scholar]
  56. Gao, Z.; Zhao, J. An Improved Grey Wolf Optimization Algorithm with Variable Weights. Comput. Intell. Neurosci. 2019, 2019, 2981282. [Google Scholar] [CrossRef] [PubMed]
  57. Xu, B.; Oudalov, A.; Ulbig, A.; Andersson, G.; Kirschen, D.S. Modeling of lithium-ion battery degradation for cell life assessment. IEEE Trans. Smart Grid 2018, 9, 1131–1140. [Google Scholar] [CrossRef]
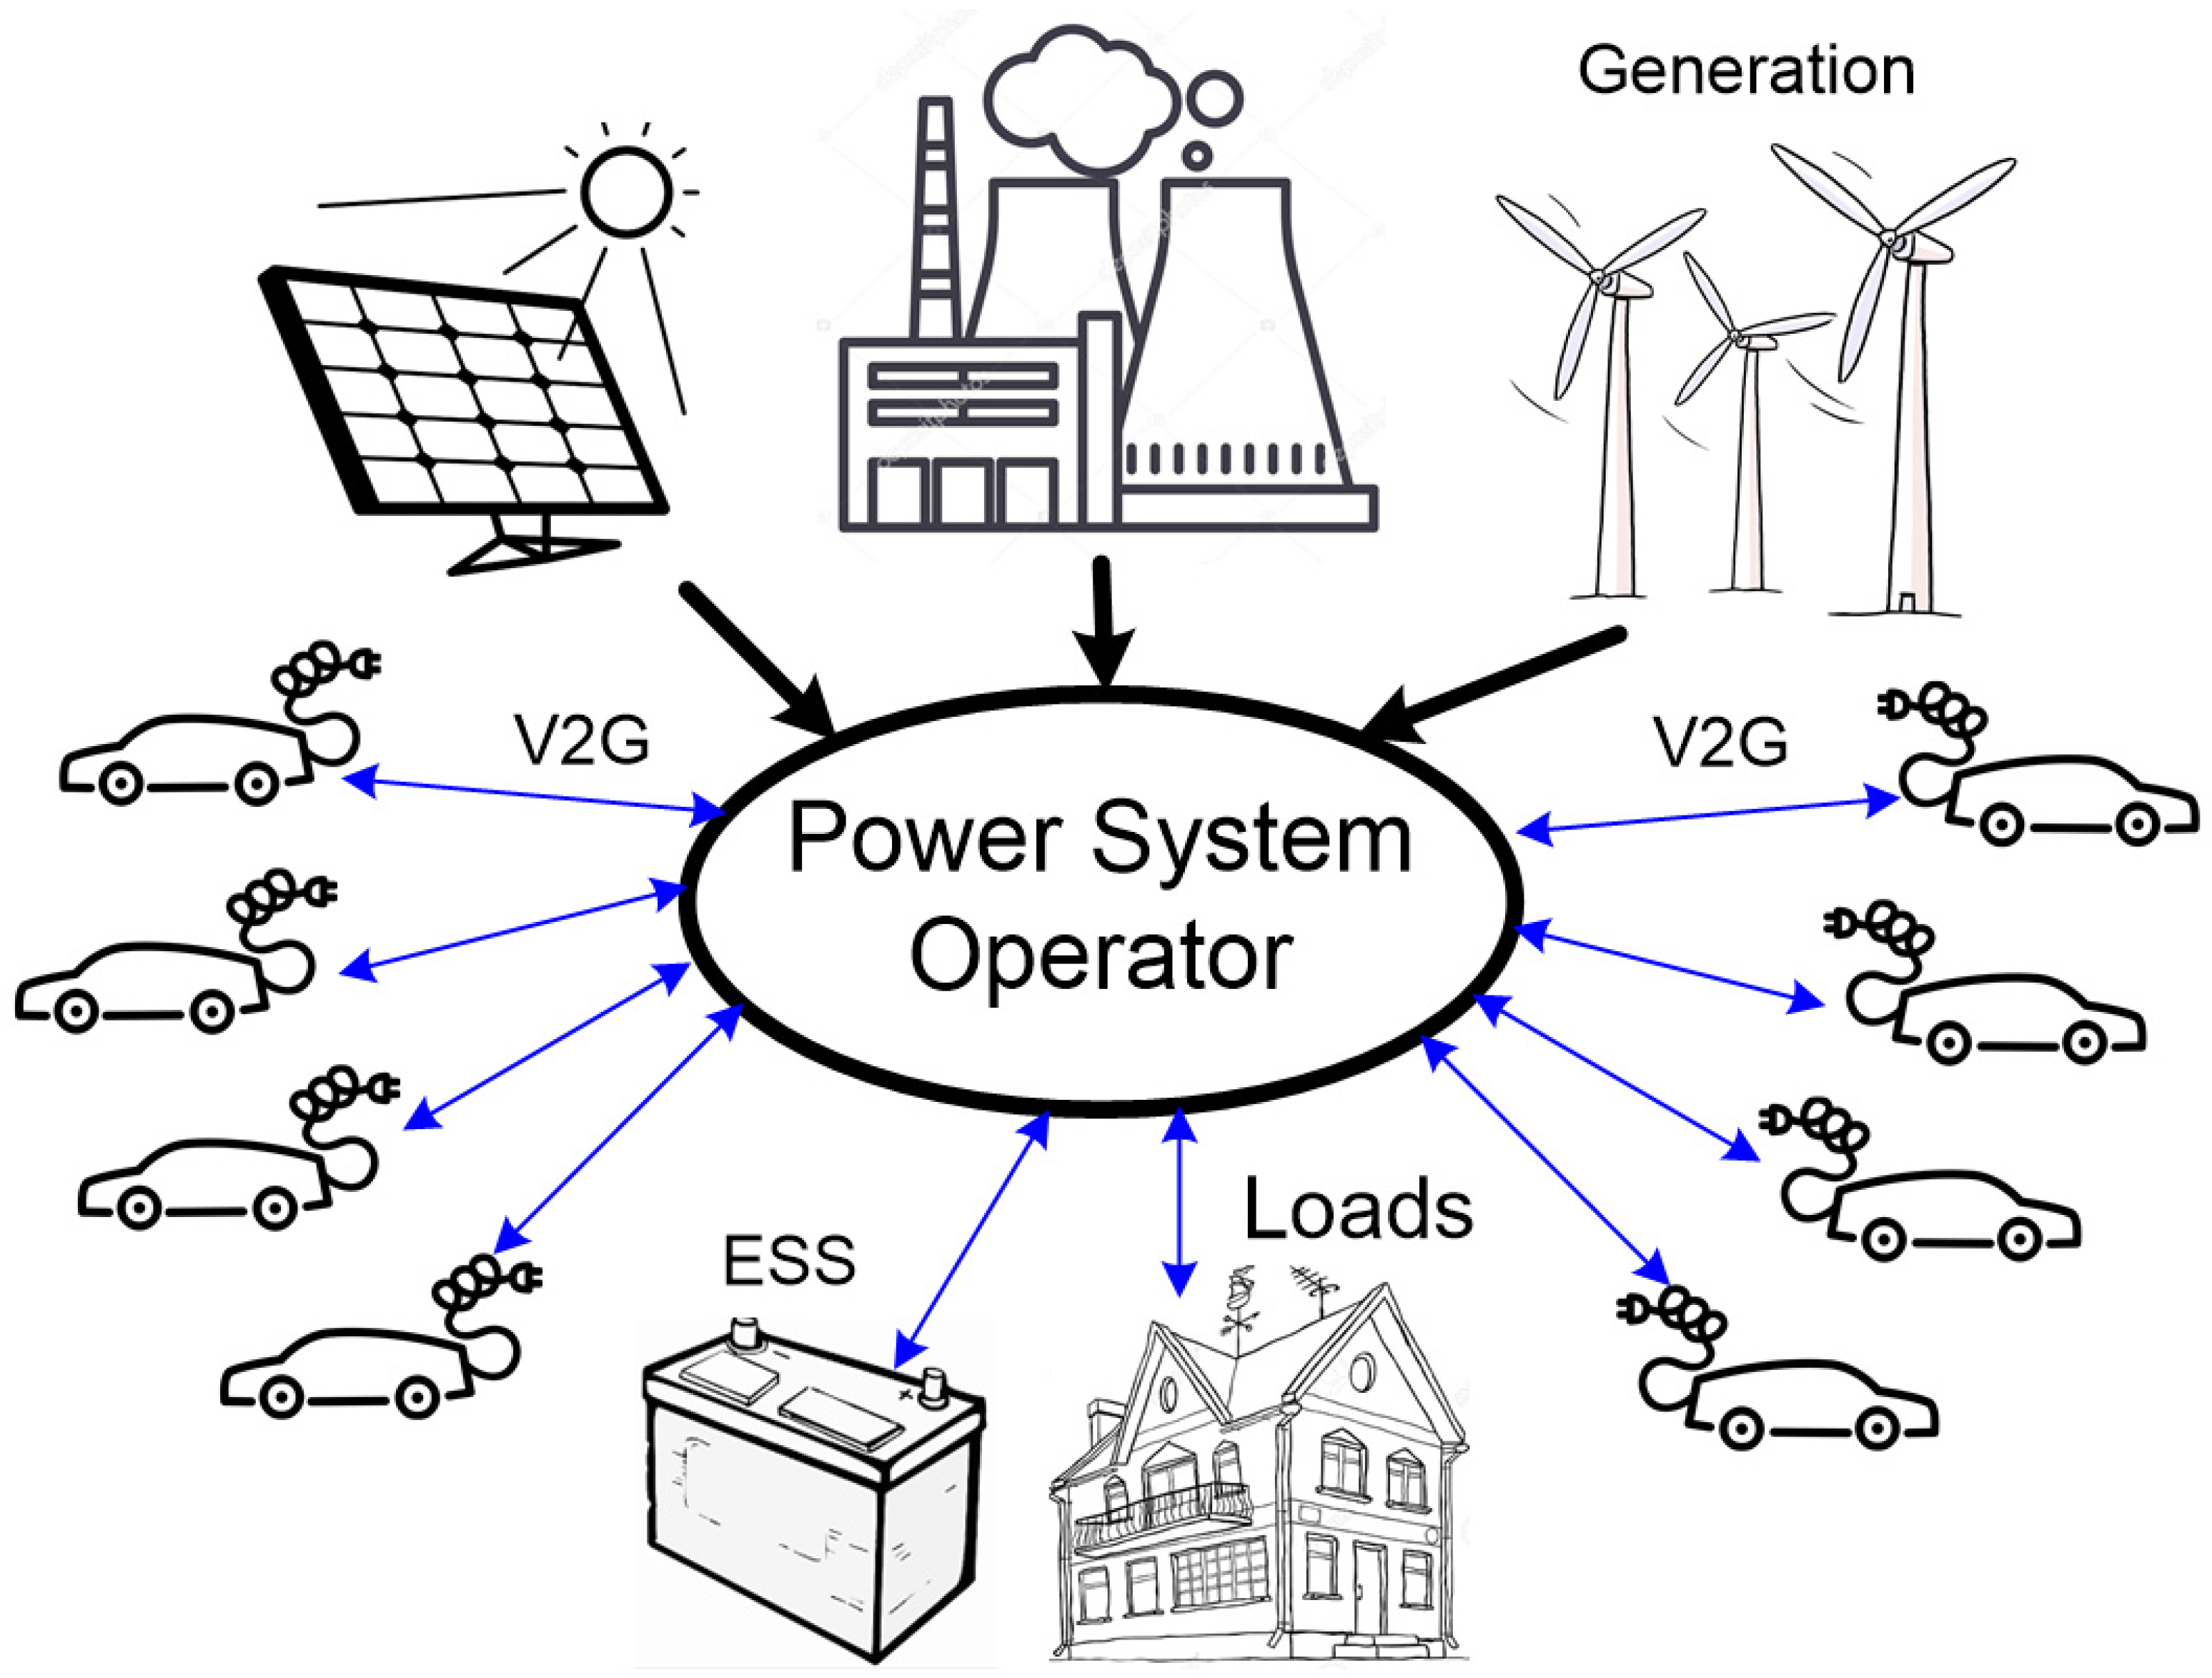
Figure 1. The centralized EV aggregator.
Smartcities 06 00141 g001
Figure 2. Decentralized EV aggregator.
Smartcities 06 00141 g002
Figure 3. The architecture of the decentralized V2G aggregator [10].
Smartcities 06 00141 g003
Figure 4. The achievable cycle count (ACC) against the DoD for lithium-ion batteries [39].
Smartcities 06 00141 g004
Figure 5. The cycling profile of the cycling test.
Smartcities 06 00141 g005
Figure 6. The variation in the current, Ah, and wear along with time.
Smartcities 06 00141 g006
Figure 7. The distribution of daily driving distance for the EV under study for a complete year.
Smartcities 06 00141 g007
Figure 8. The dispatch matrix.
Smartcities 06 00141 g008
Figure 9. The use of standard GWO in optimal V2G scheduling.
Smartcities 06 00141 g009
Figure 10. The use of the GRSS-GWO in optimal V2G scheduling.
Smartcities 06 00141 g010
Figure 11. The workflow of the simulation studies.
Smartcities 06 00141 g011
Figure 12. The variation in the measured and calculated battery wear in capacity for different calendar aging at different temperatures and SoCs.
Smartcities 06 00141 g012
Figure 13. The variation in the measured and calculated battery wear for cycling tests at different operating conditions.
Smartcities 06 00141 g013
Figure 14. The daily driving distance, departure and arrival times, and the driving periods during the year.
Smartcities 06 00141 g014
Figure 15. The performance of EV with driving during daytime period.
Smartcities 06 00141 g015
Figure 16. The performance of EV with driving during low tariff period.
Smartcities 06 00141 g016
Figure 17. The performance of EV with driving during a high tariff period.
Smartcities 06 00141 g017
Figure 18. The yearly performance during the first year of use with the V2G operating mode.
Smartcities 06 00141 g018
Table 1. The specification of the EV battery used in the simulation.
ItemValue
No. of modules24
Module capacity2.4 kWh
Battery price Cb$140/kWh
2nd life battery price$60/kWh
OMC$0.1/kWh/year
η B C = η B D 0.95
σ0.01%
Table 2. The calendar modeling parameters for different optimization algorithms under study.
ItemsGRSS-GWOGWOPSOBA
Convergence time (s)0.213 441 1170.821 158 4560.978 254 1511.149 123 715
RMSE (%)0.001 951 0350.002 113 6580.002 121 7560.002 243 674
A1472.701 163 681470.414 149 675470.405 579 729470.398 767 233
B1−2.069 836 312−2.060 865 899−2.058 069 457−2.057 654 982
C1−6316.876 455 349−6269.356 878 725−6270.556 534 254−6270.129 739 985
D10.576 031 7650.576 901 6530.576 713 8980.576 797 138
A226.055 099 43126.163 873 35225.993 877 91026.106 763 973
B22.688 801 9142.690 645 6312.687 945 9182.691 875 219
C2−2102.375 825 405−2101.912 746 436−2102.534 674 362−2102.439 726 652
D20.520 987 1580.521 812 0280.521 736 8320.521 052 637
Table 3. The comparison between the dumb and V2G charging mode.
ItemsDumb ChargeV2G
Yearly wear (%)2.555.34
Battery life time (year)7.84313.7453
Yearly charging cost ($)904.6765.4
Yearly wear cost ($)587.51230.3
Total yearly cost ($)1492.11995.7
Income due to V2G ($)-5240.7
Yearly revenue ($)-3245
Disclaimer/Publisher’s Note: The statements, opinions and data contained in all publications are solely those of the individual author(s) and contributor(s) and not of MDPI and/or the editor(s). MDPI and/or the editor(s) disclaim responsibility for any injury to people or property resulting from any ideas, methods, instructions or products referred to in the content.