


System Dynamics Model of Decentralized Household Electricity Storage Implementation: Case Study of Latvia


Abstract
:1. Introduction
2. Materials and Methods
- Material and information delays;
- Non-linear relationships;
- Causation not correlation;
- Feedback in the system.
2.1. Model Contextualization
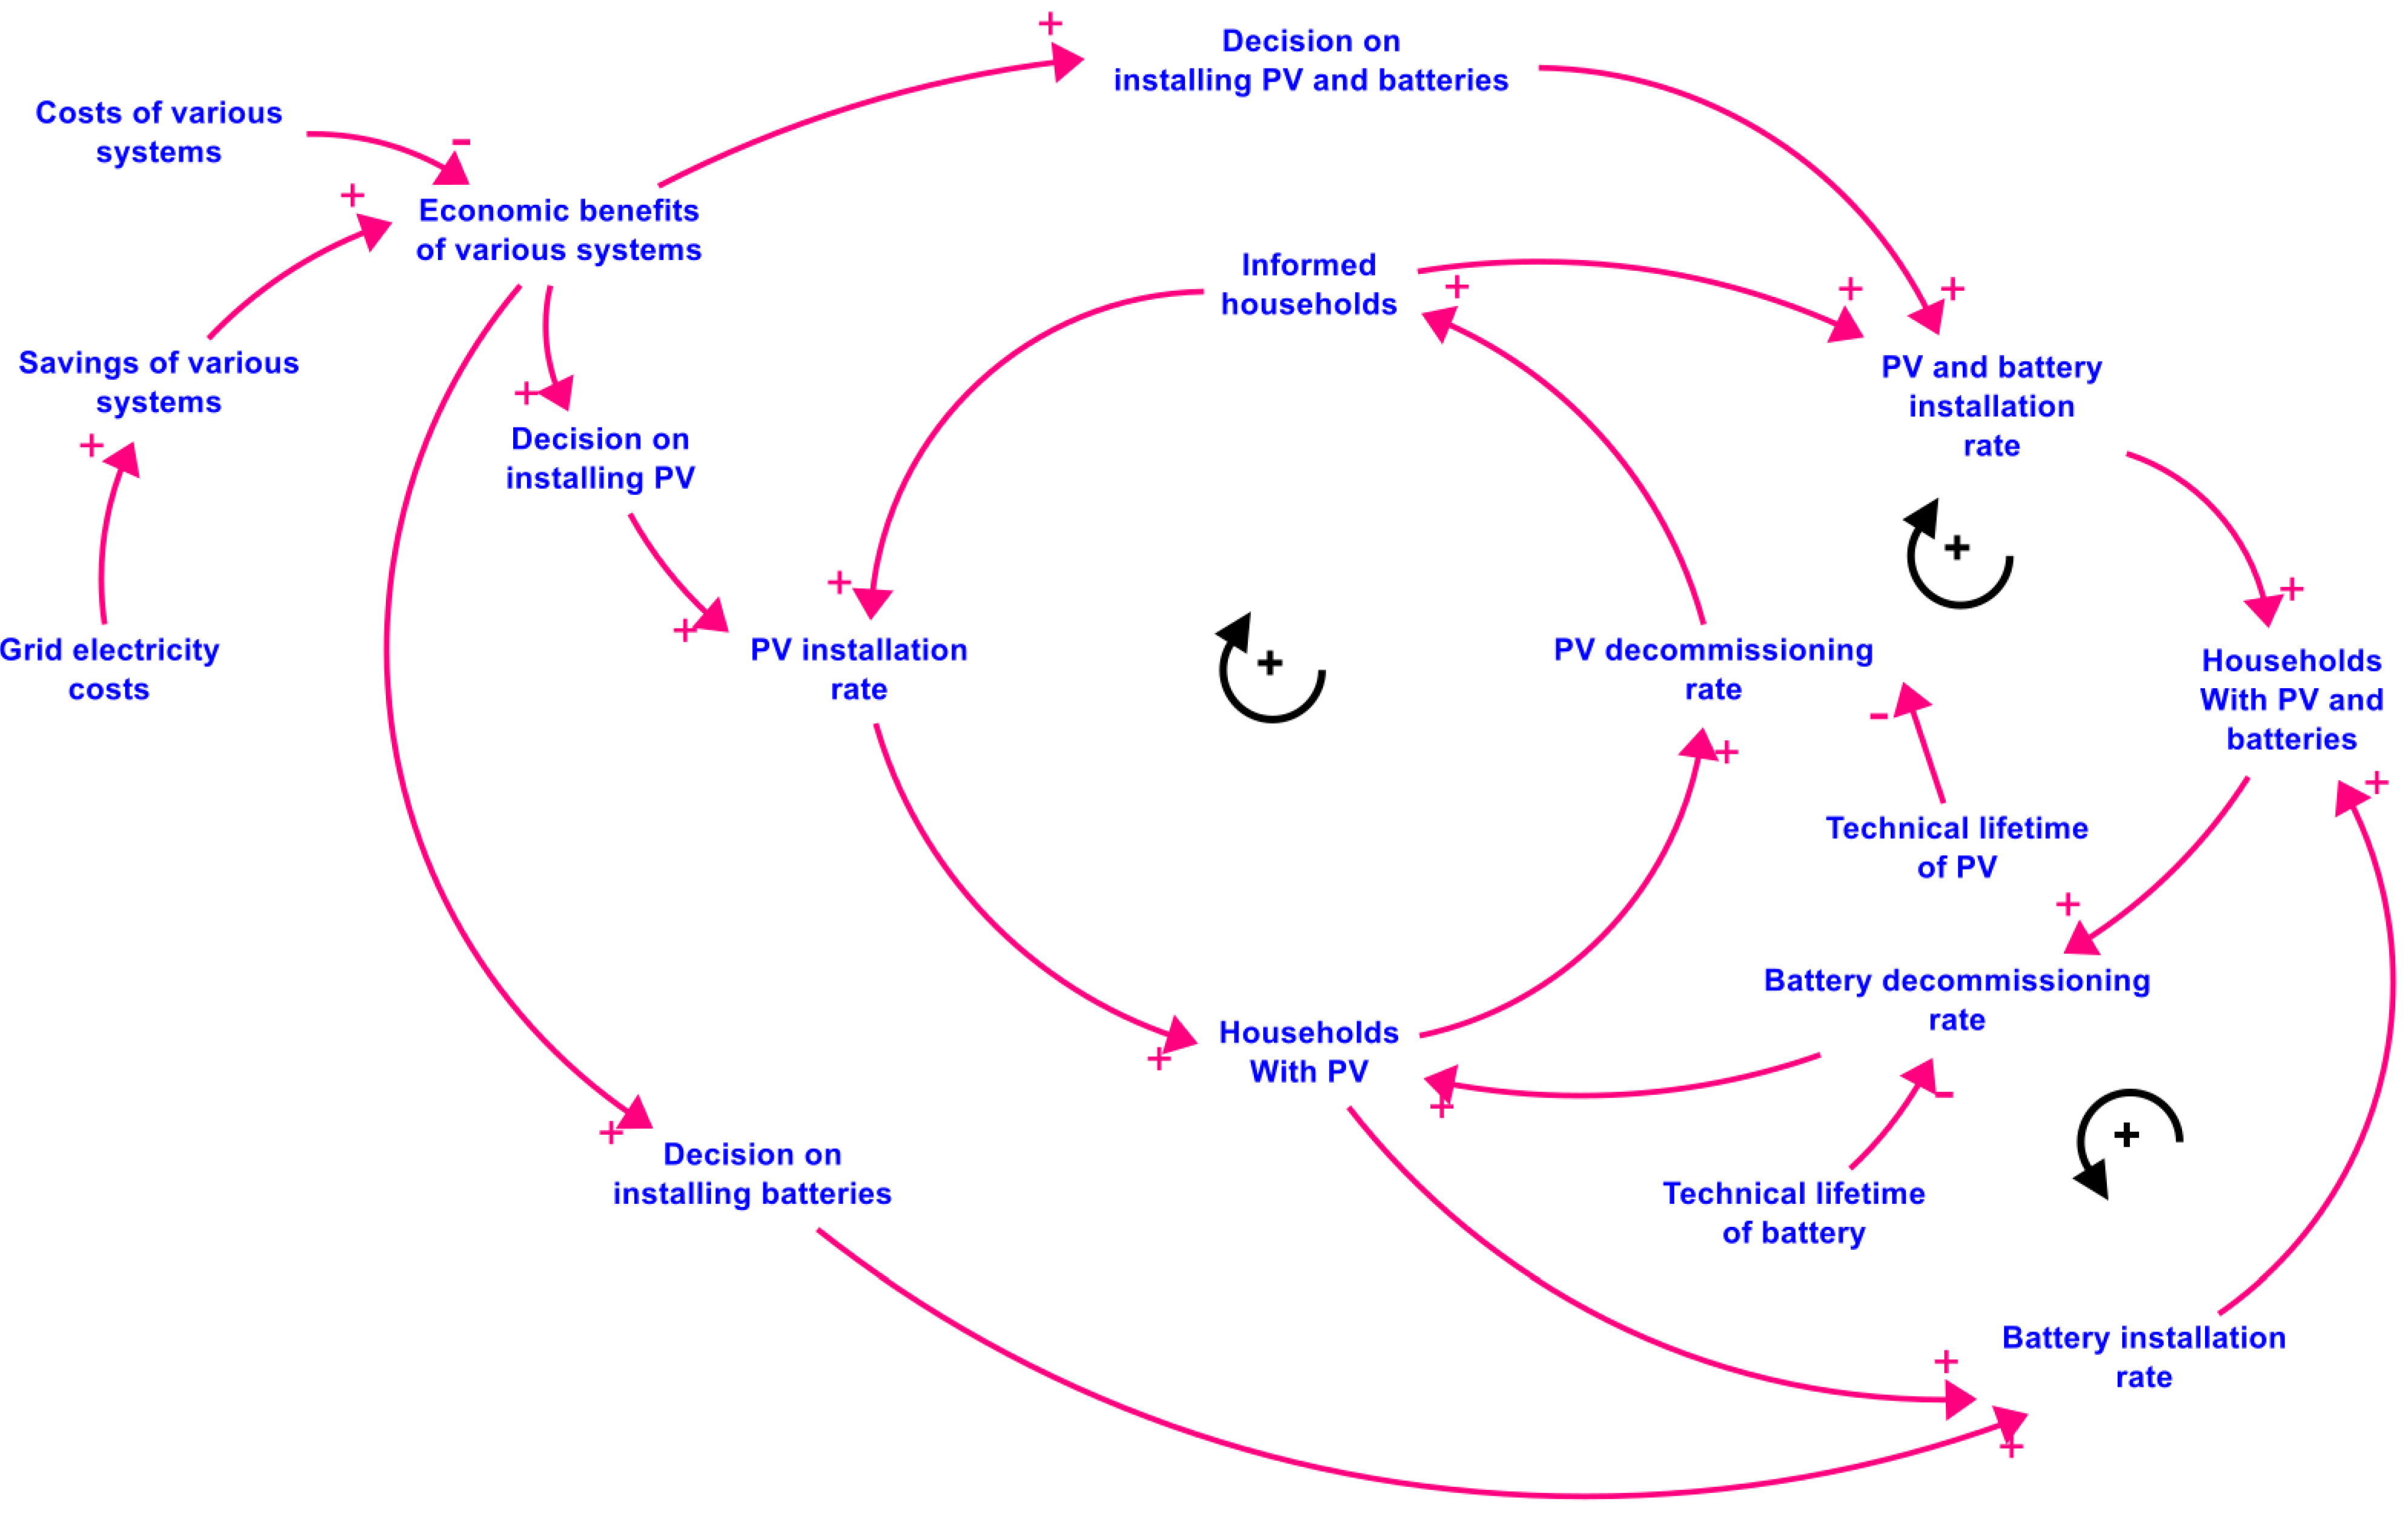
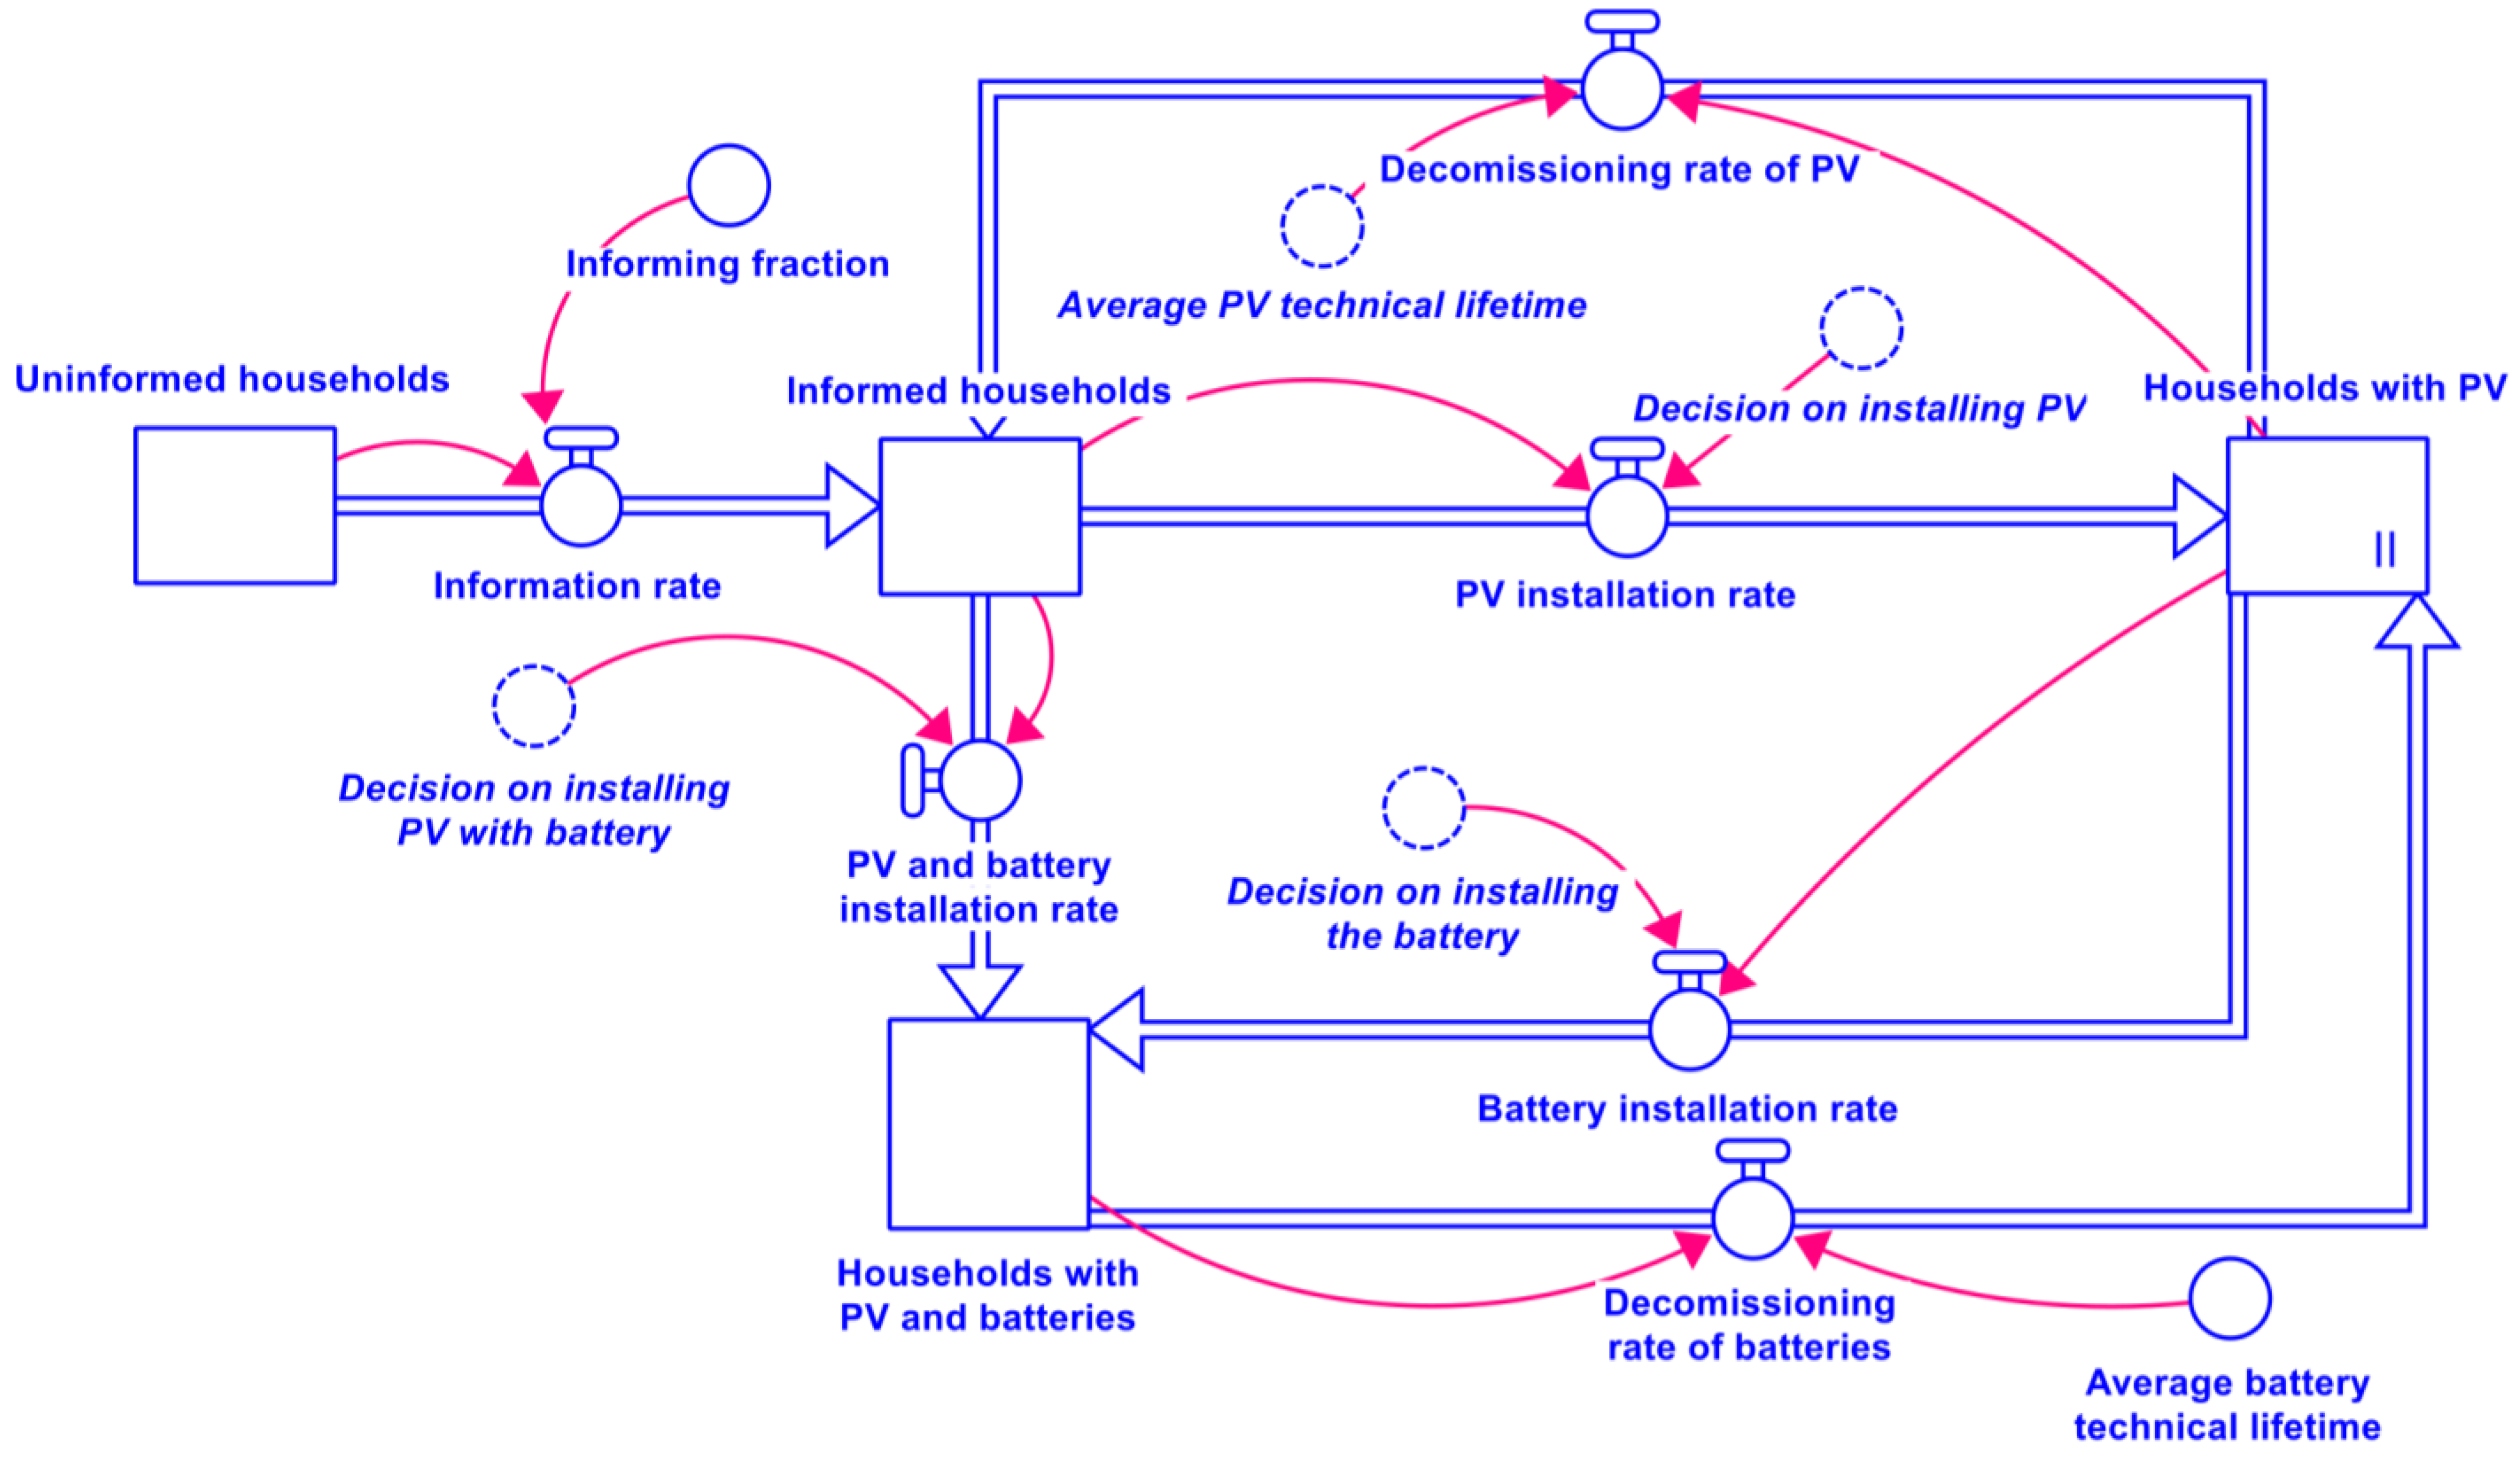
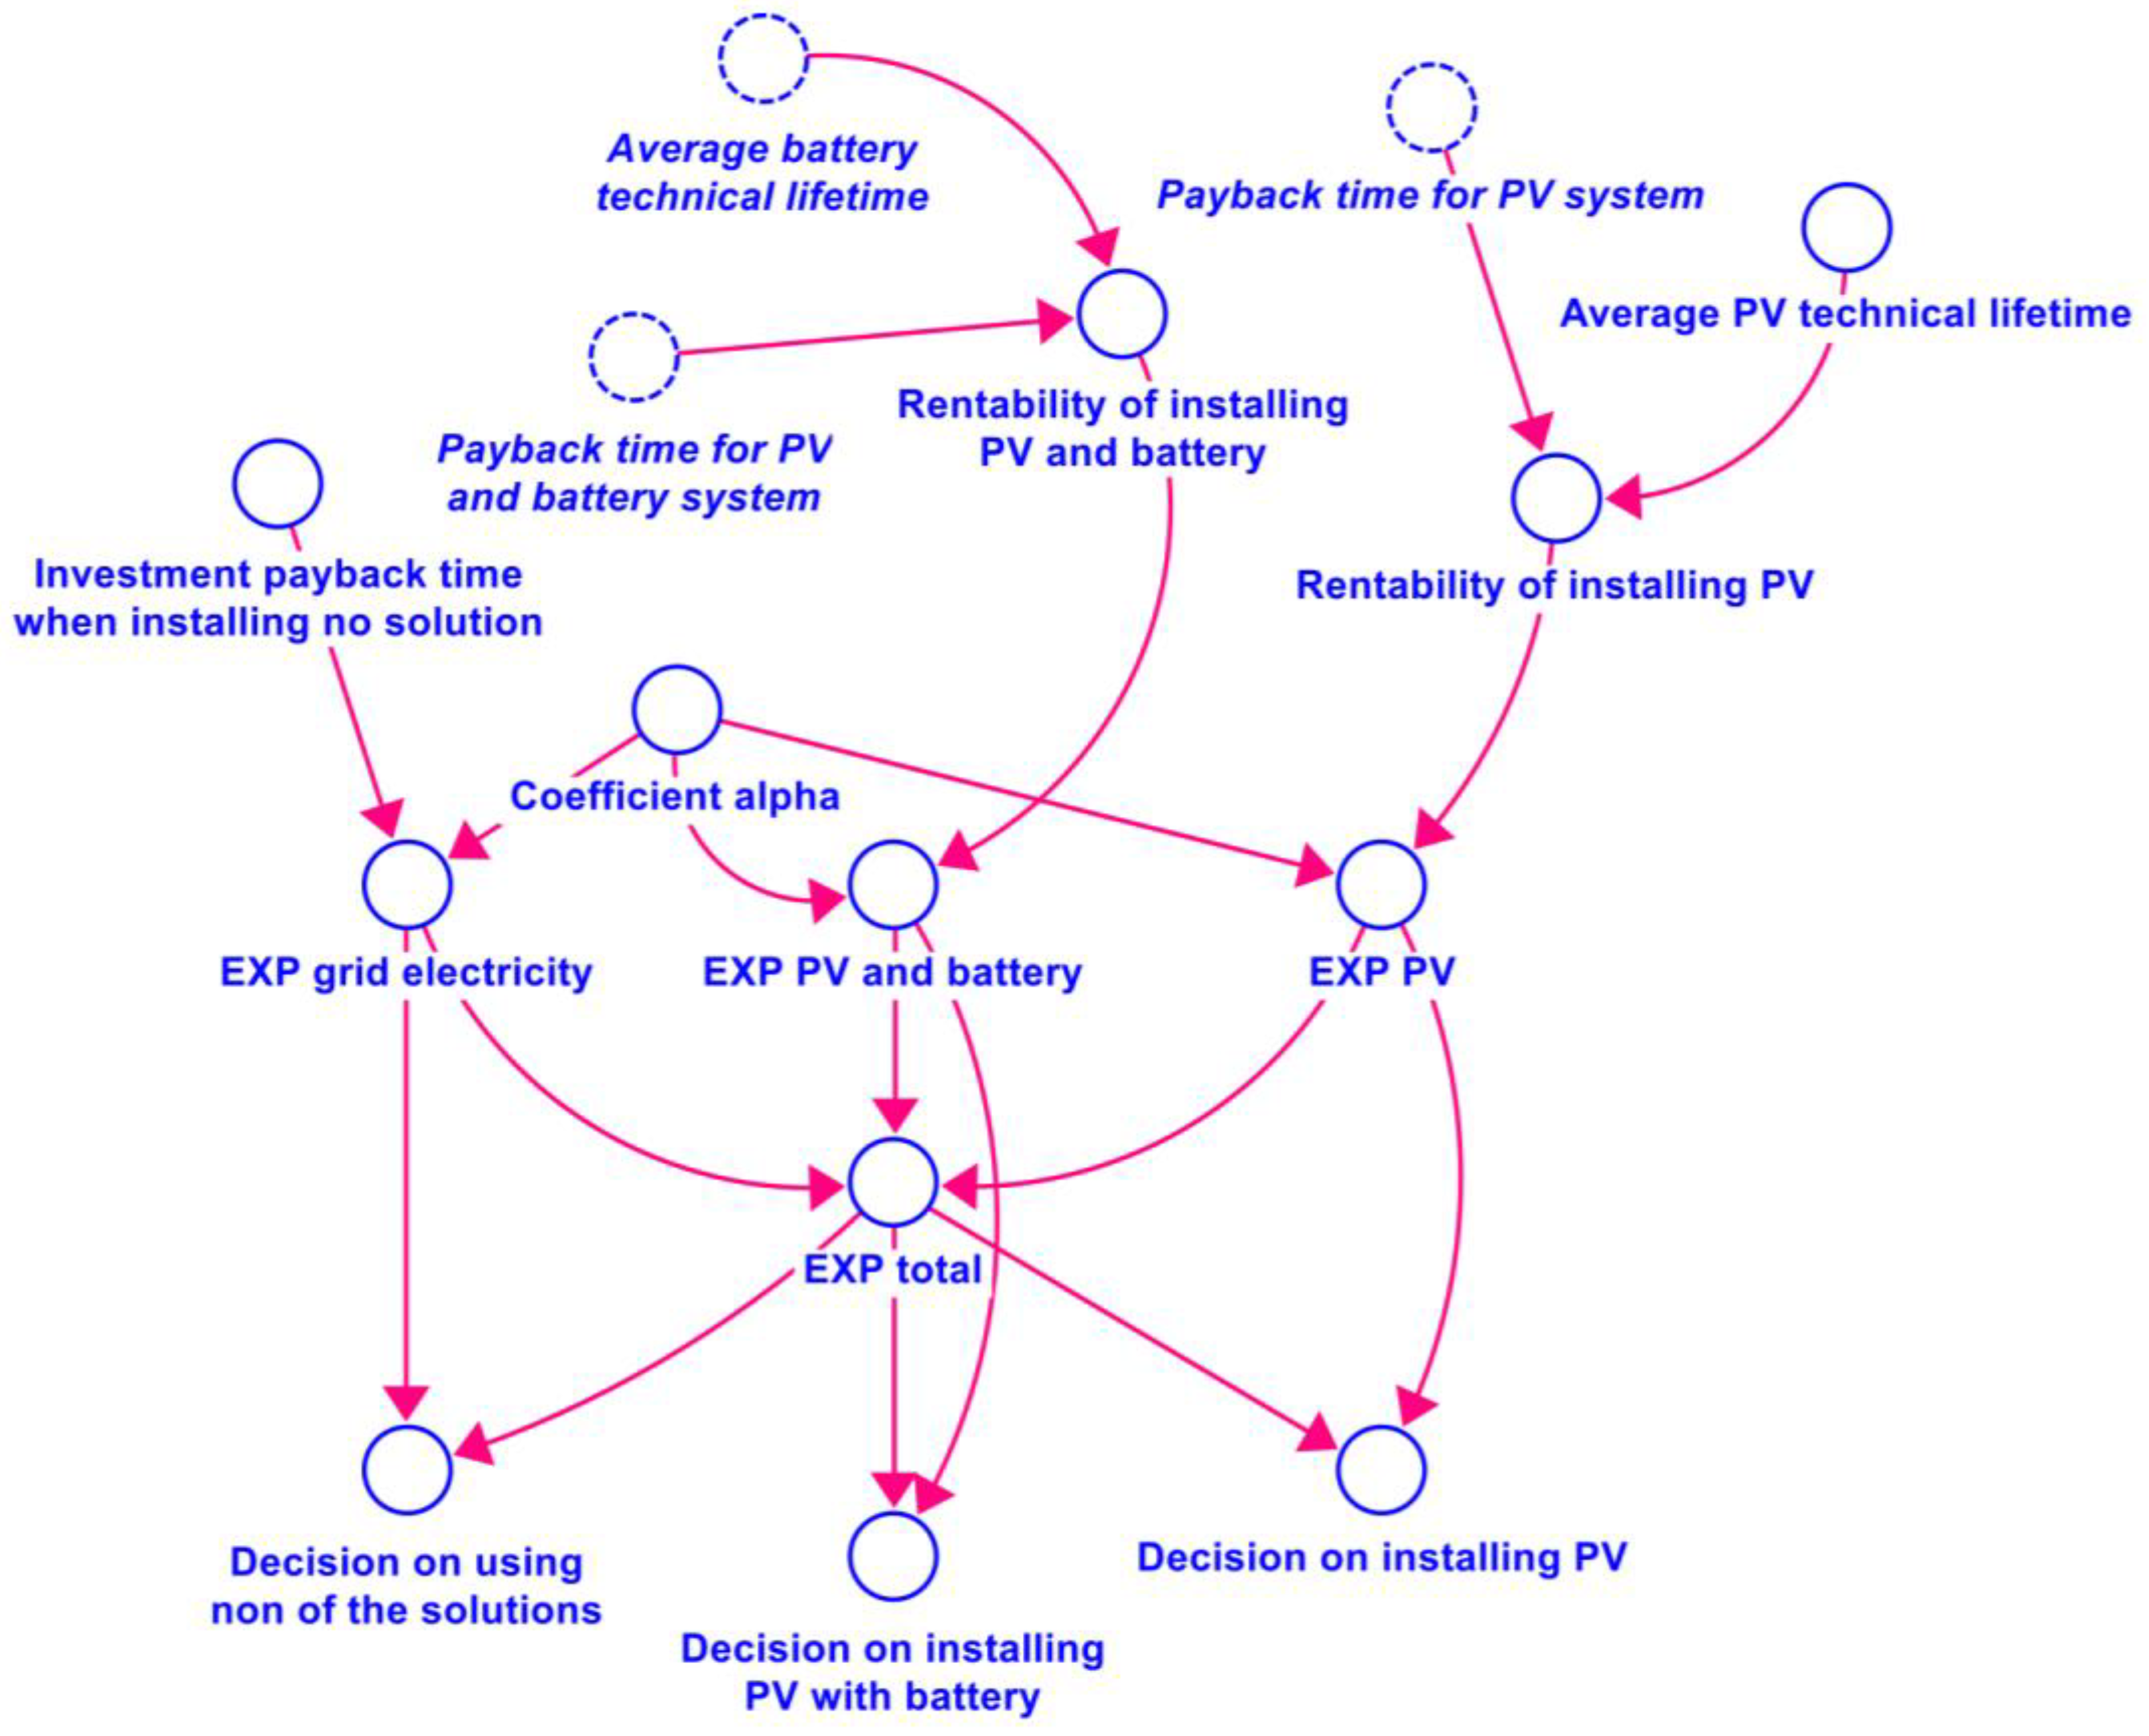
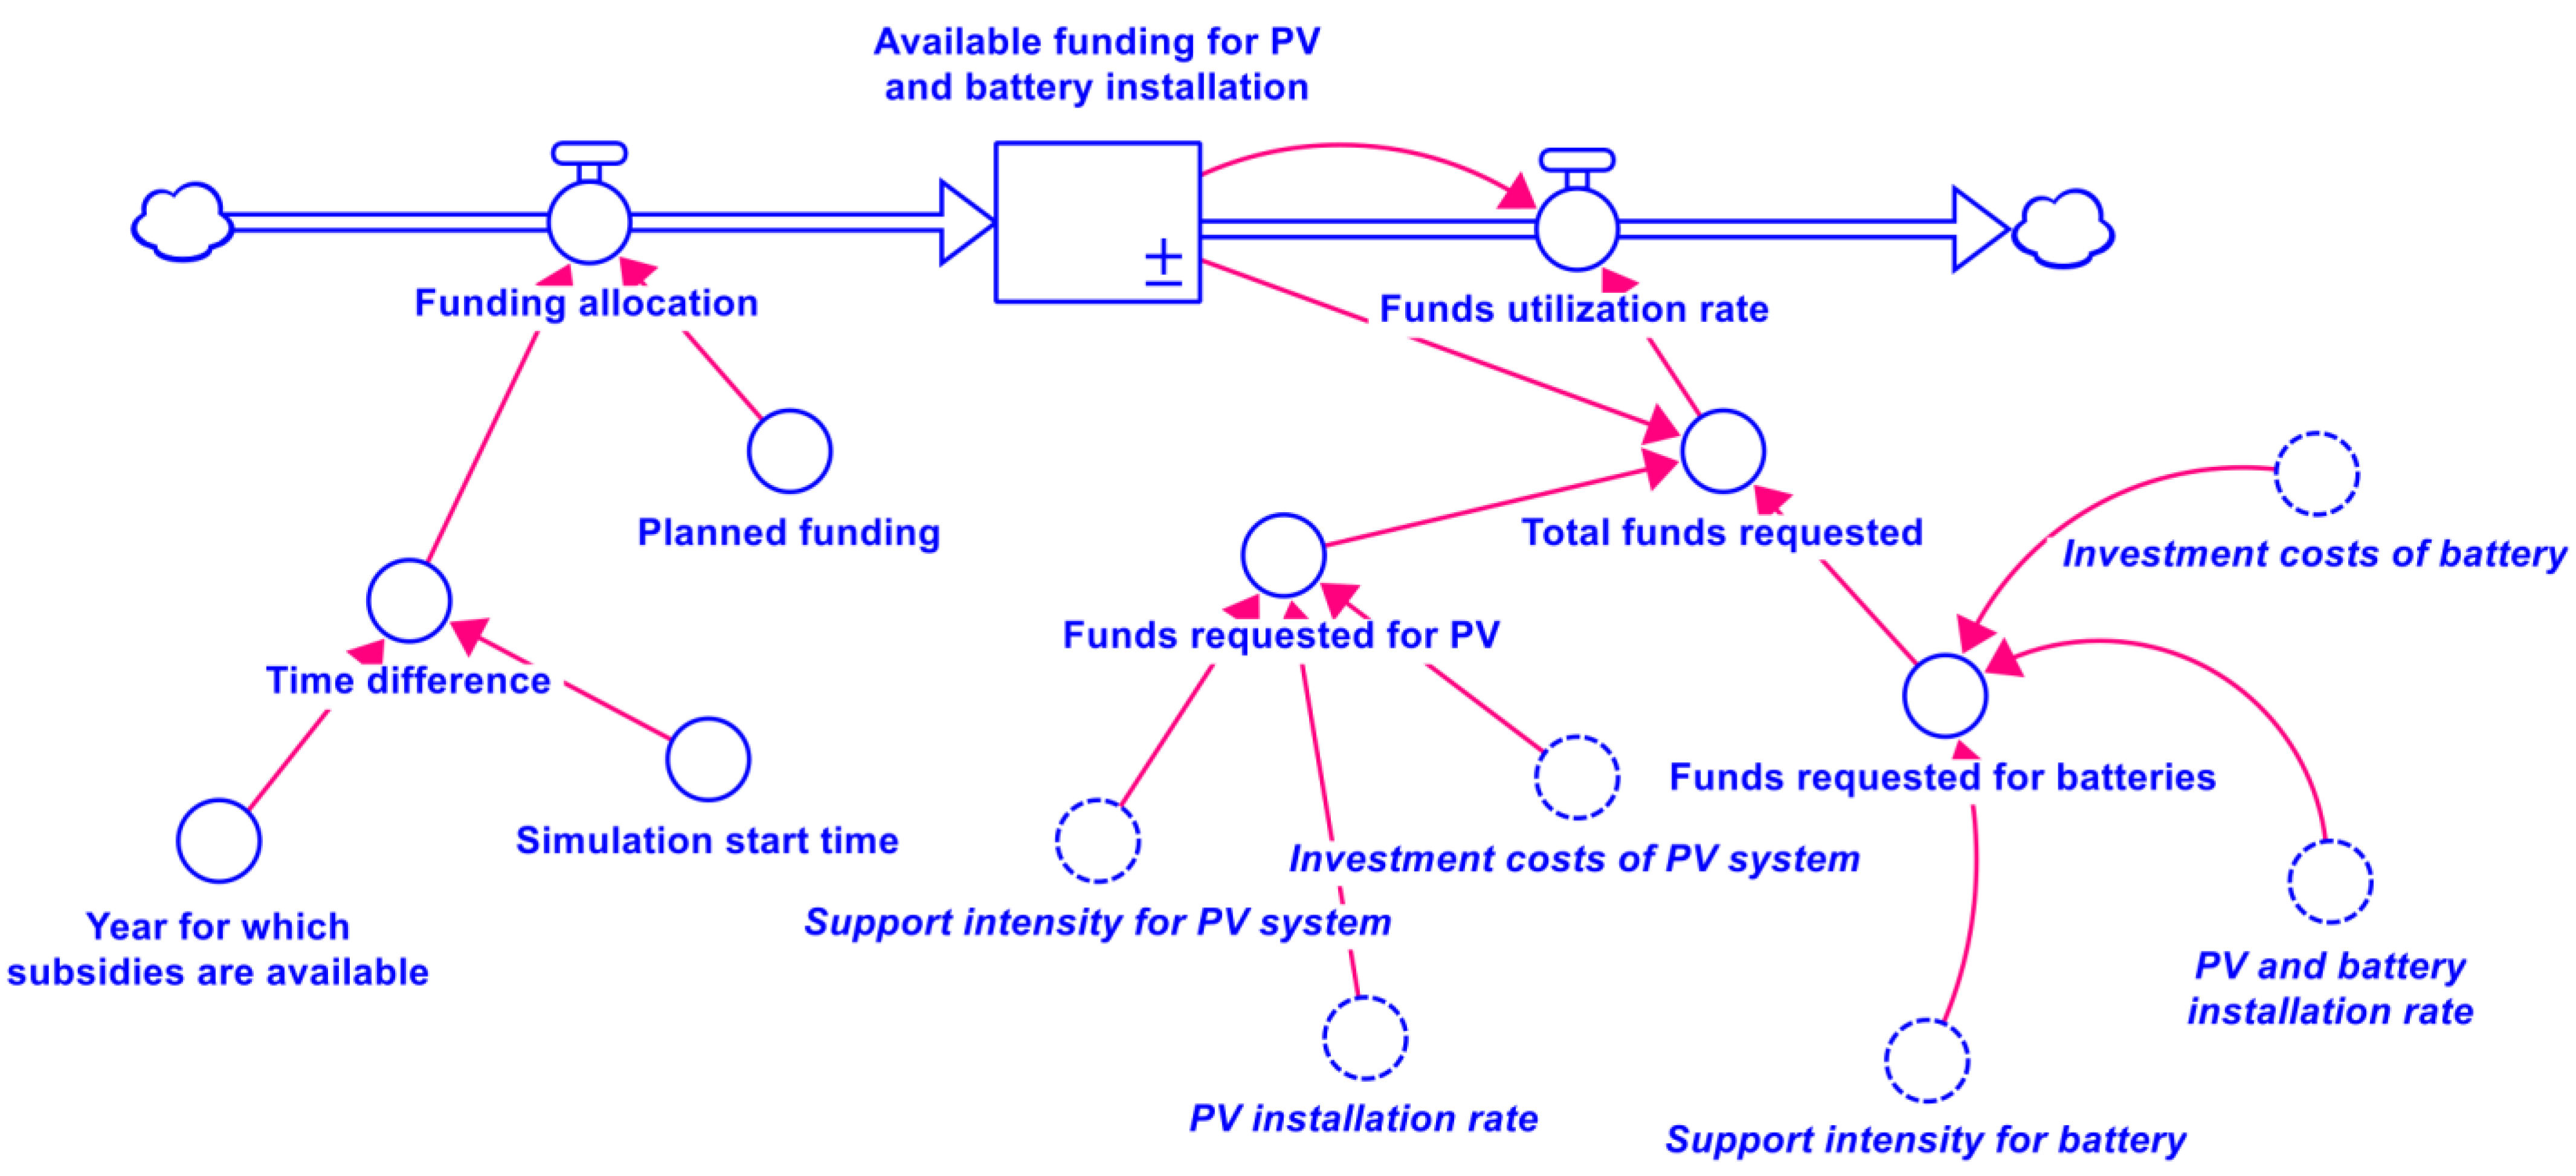
2.2. Model Structure
2.3. Input Data and Assumptions
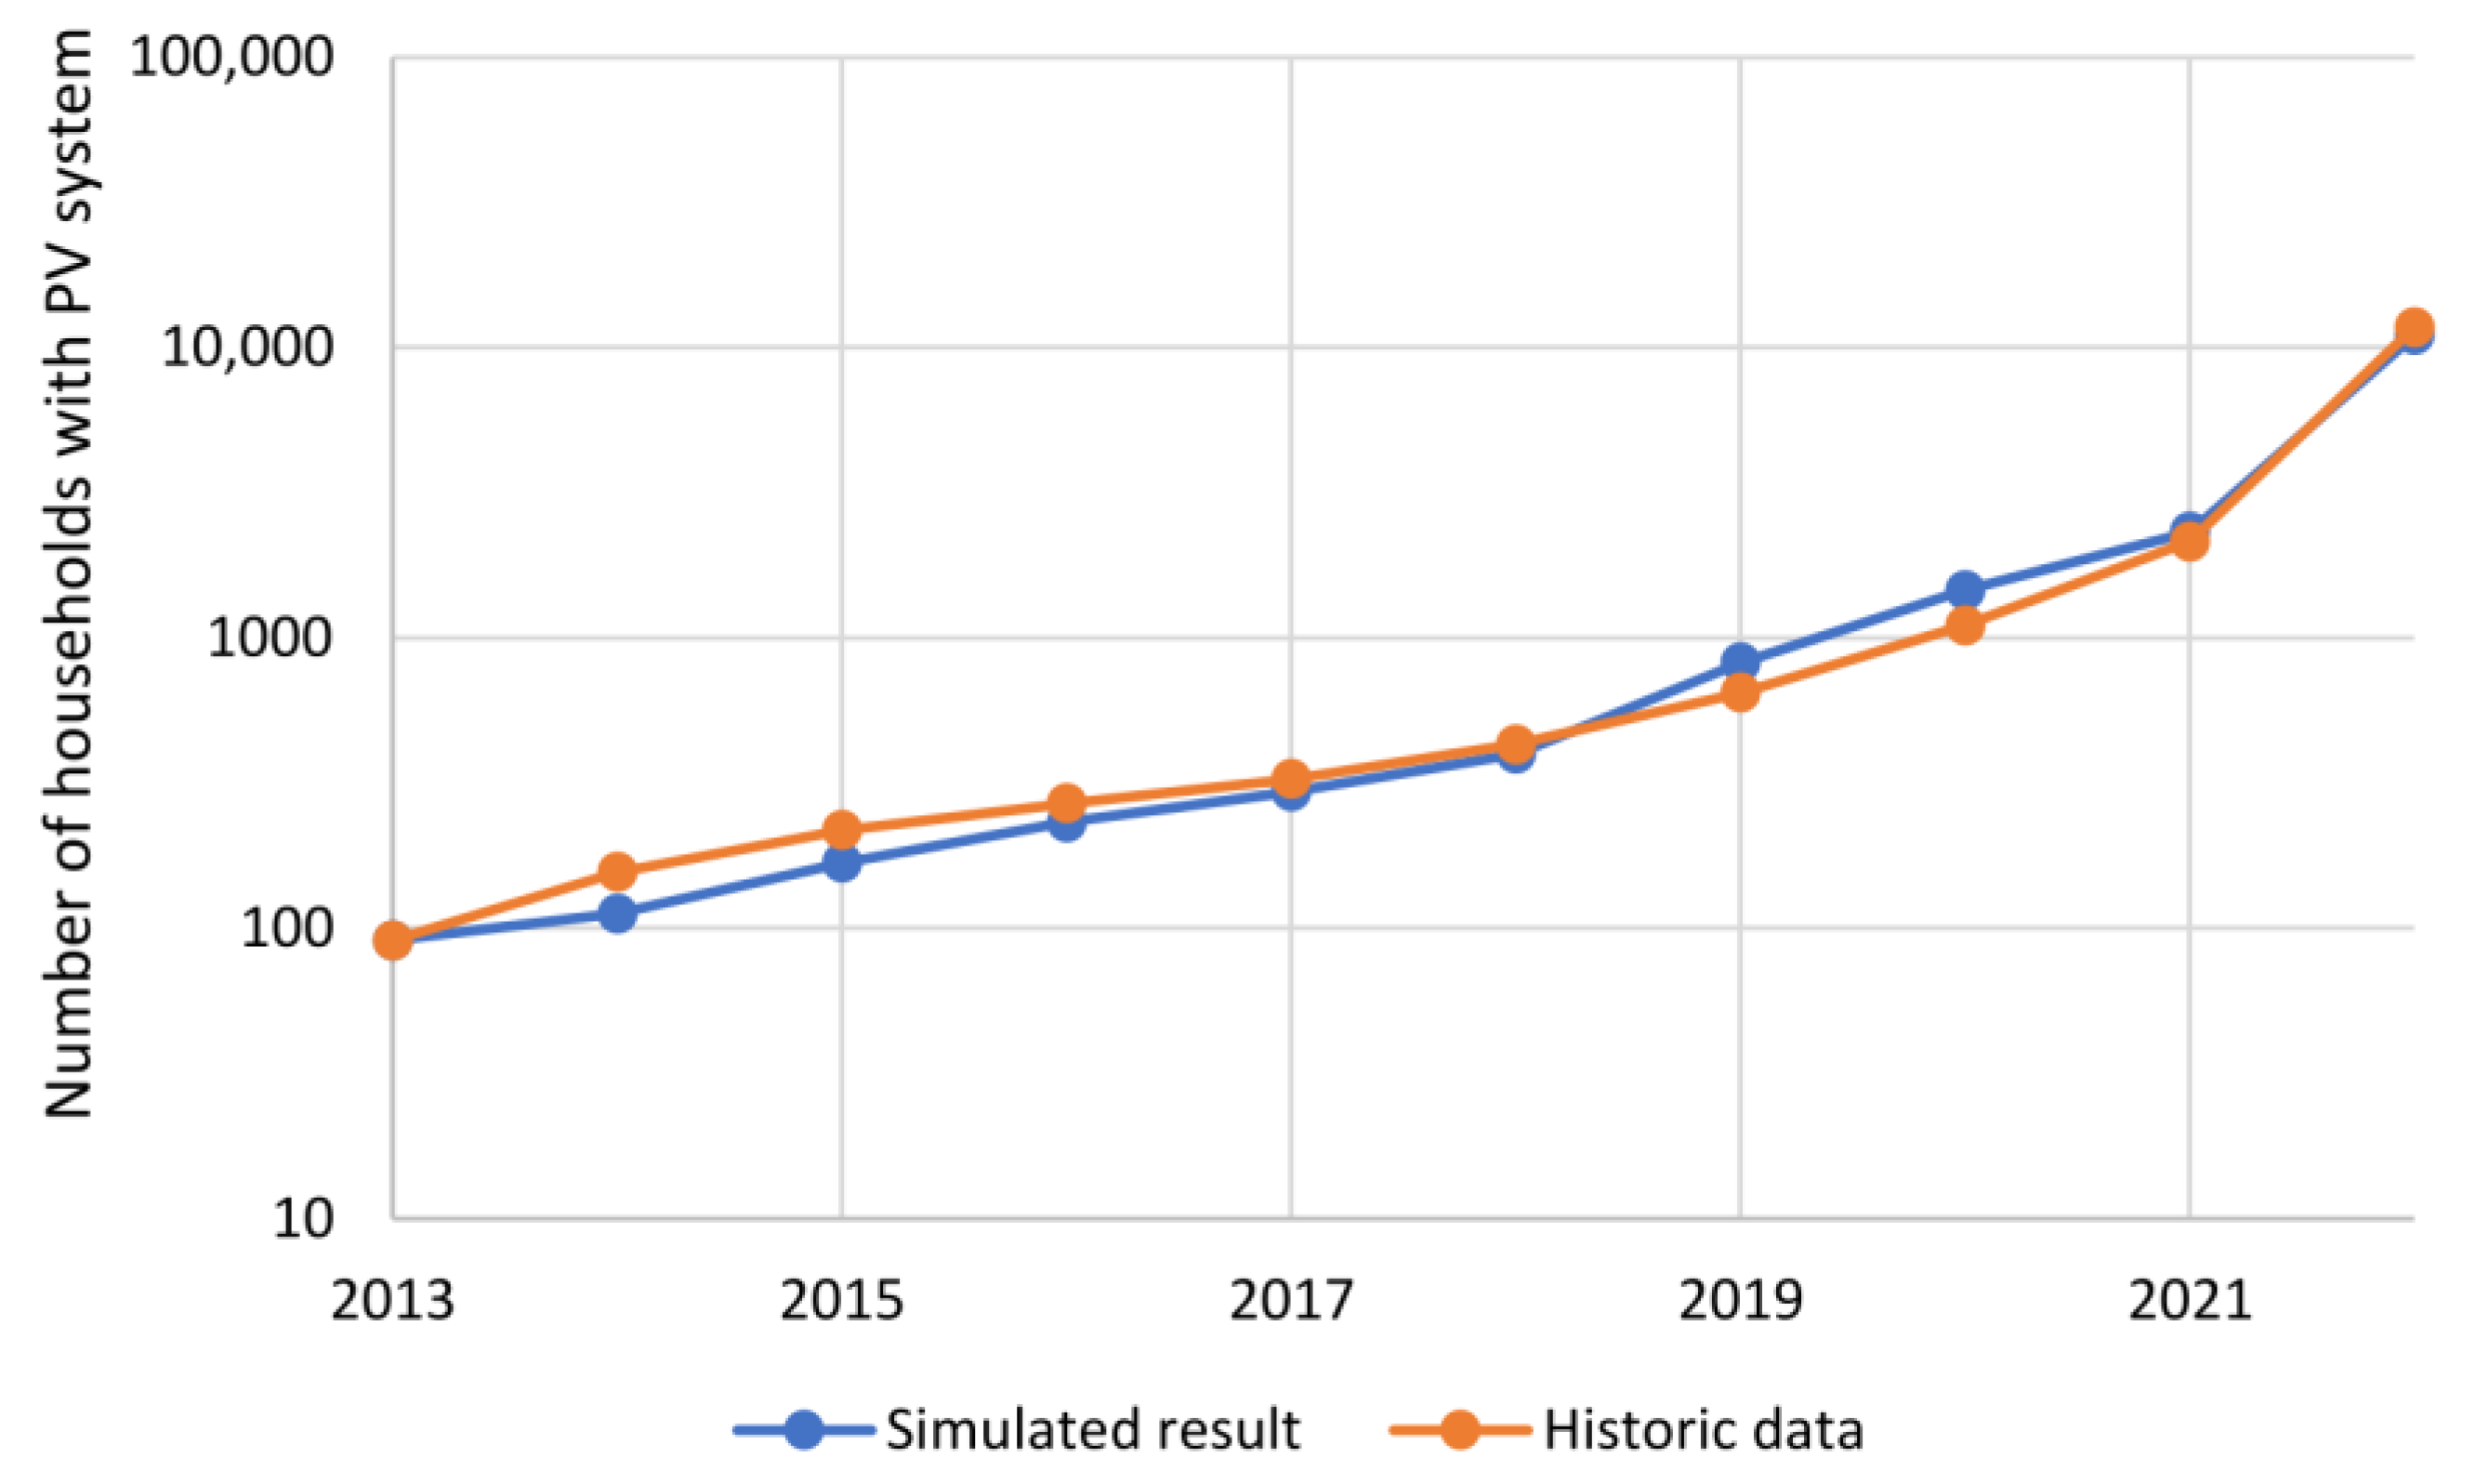
2.4. Model Validation
2.5. Defining Scenarios
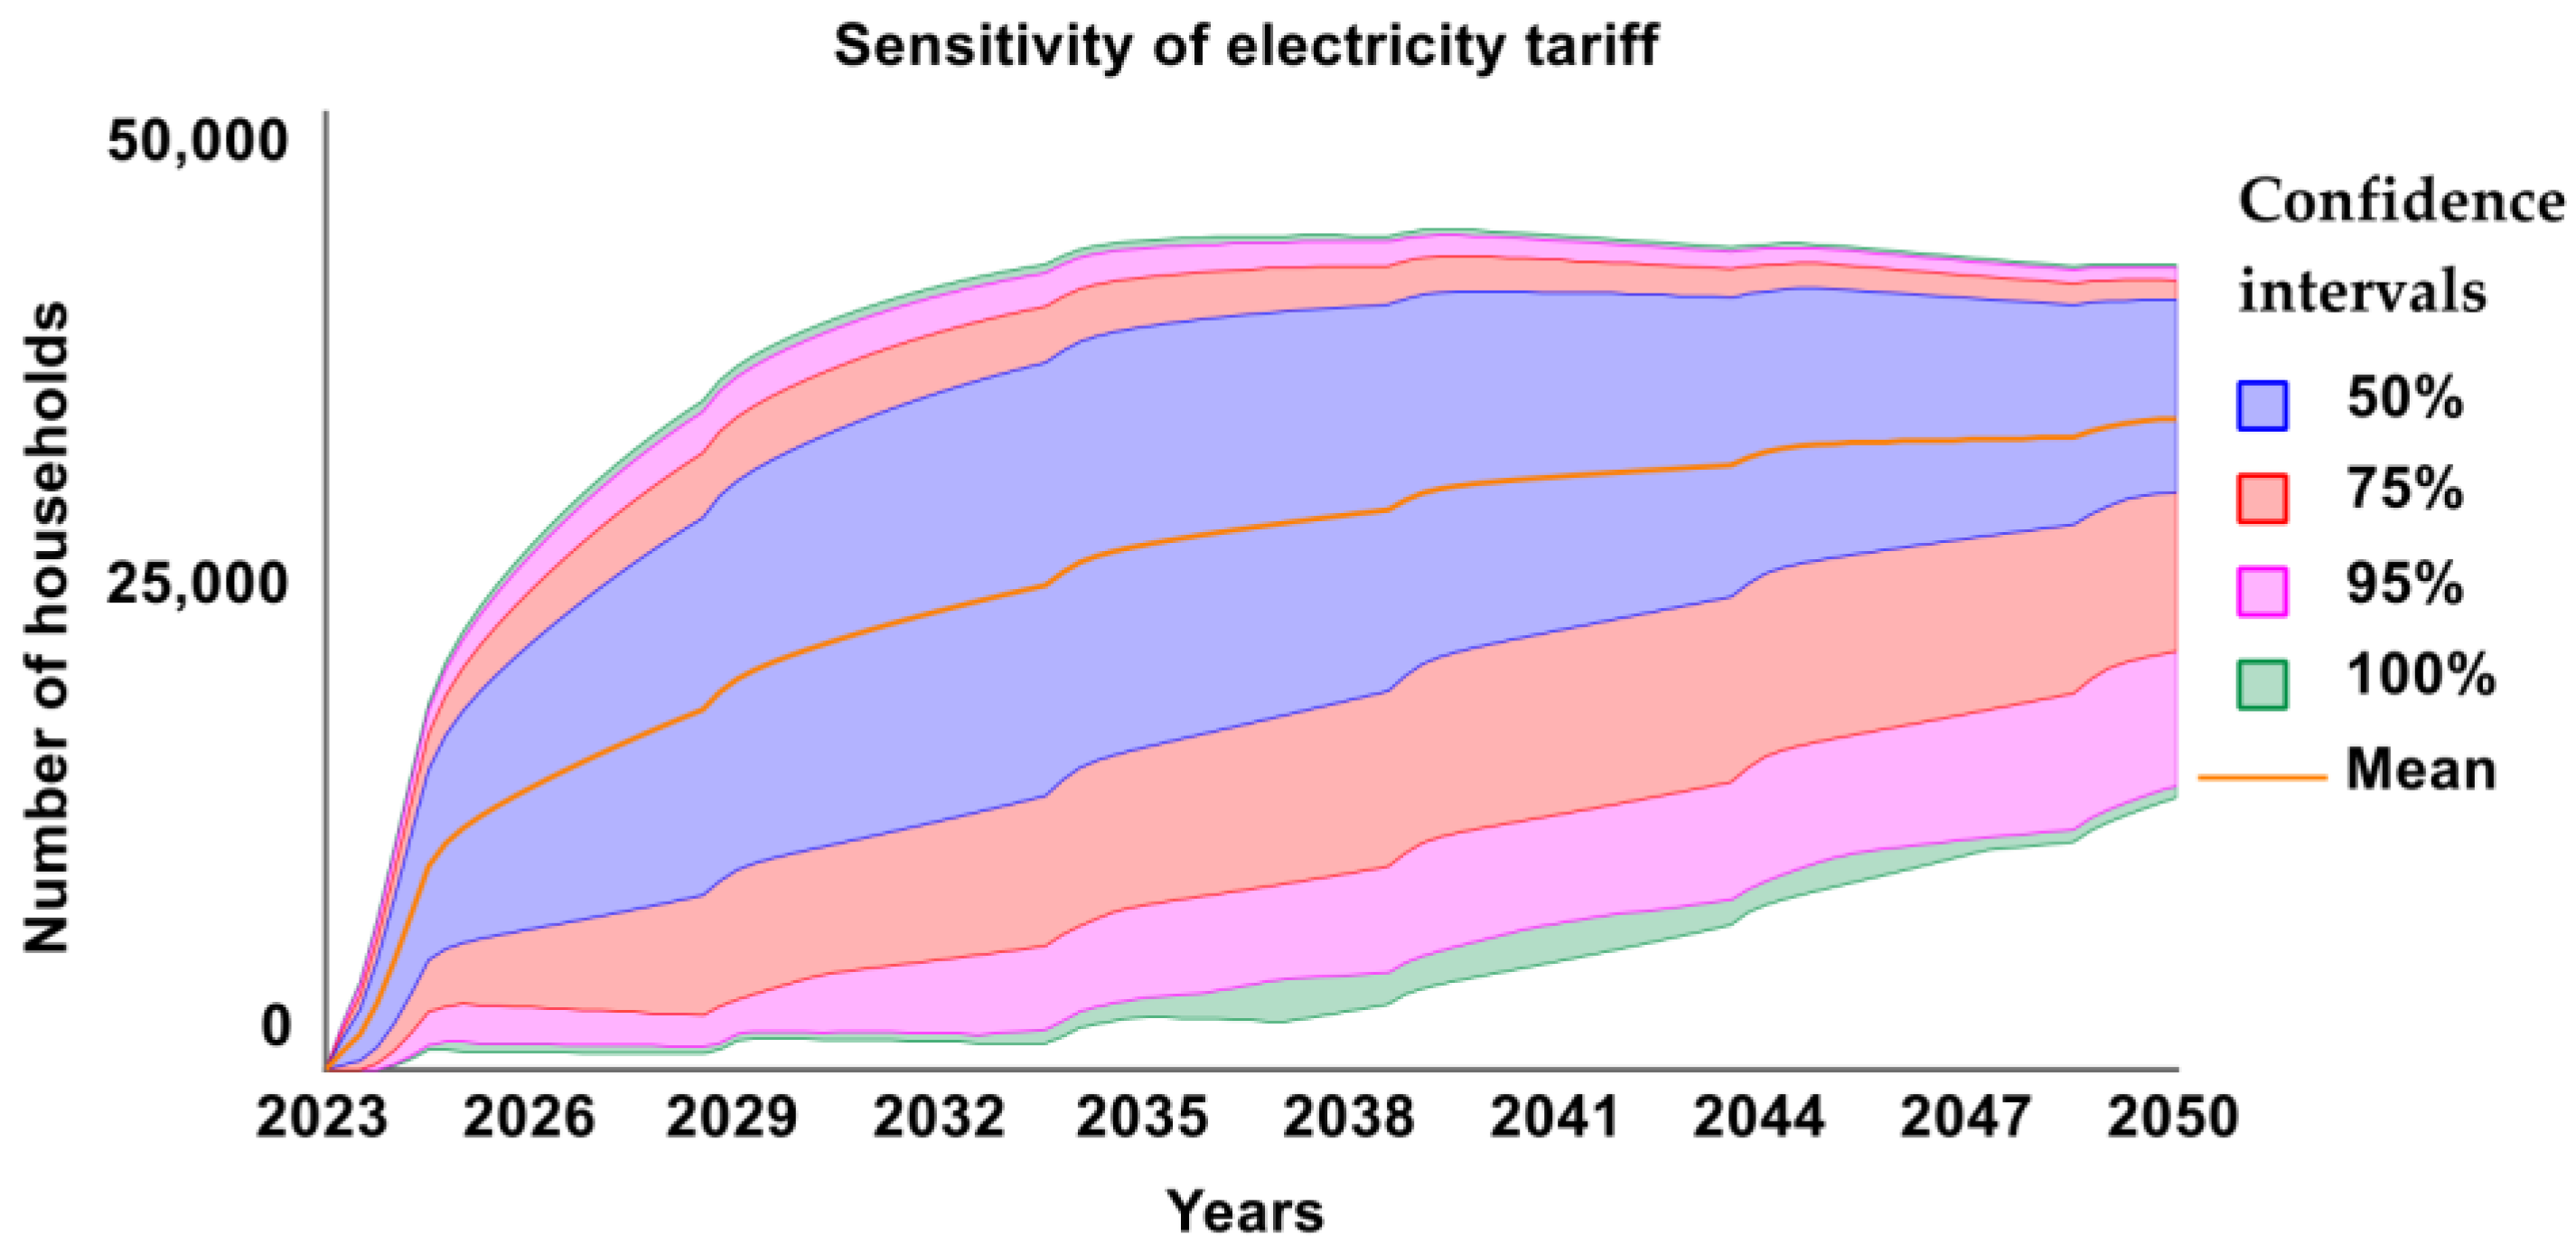
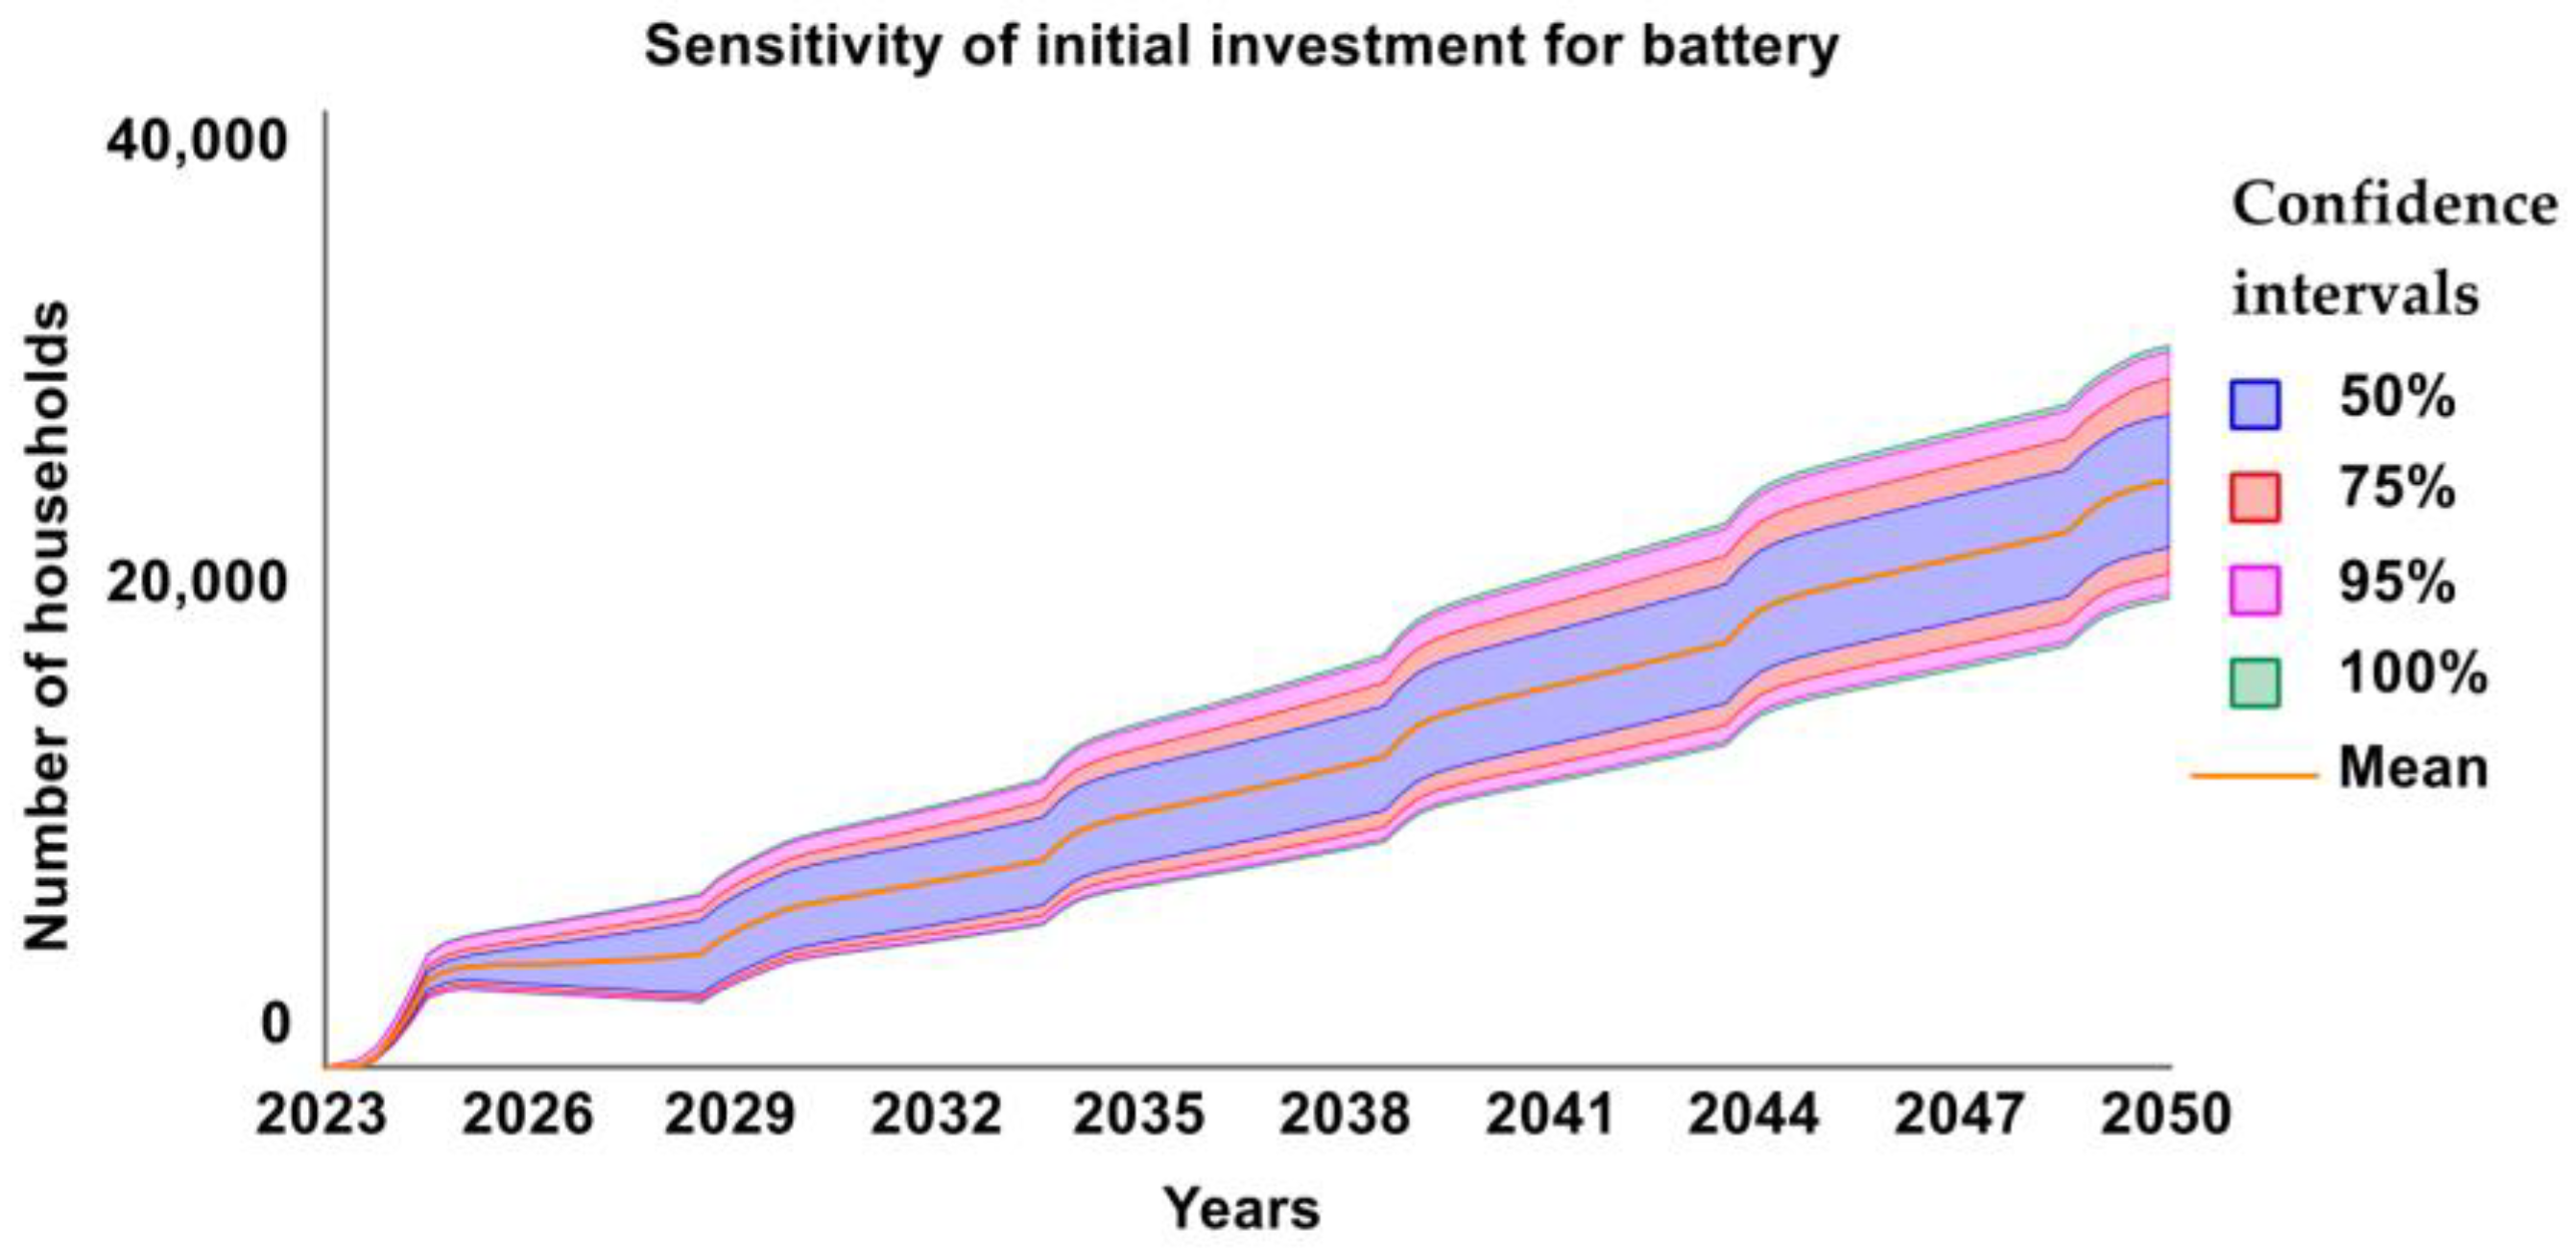
2.6. Sensitivity Analysis
3. Results
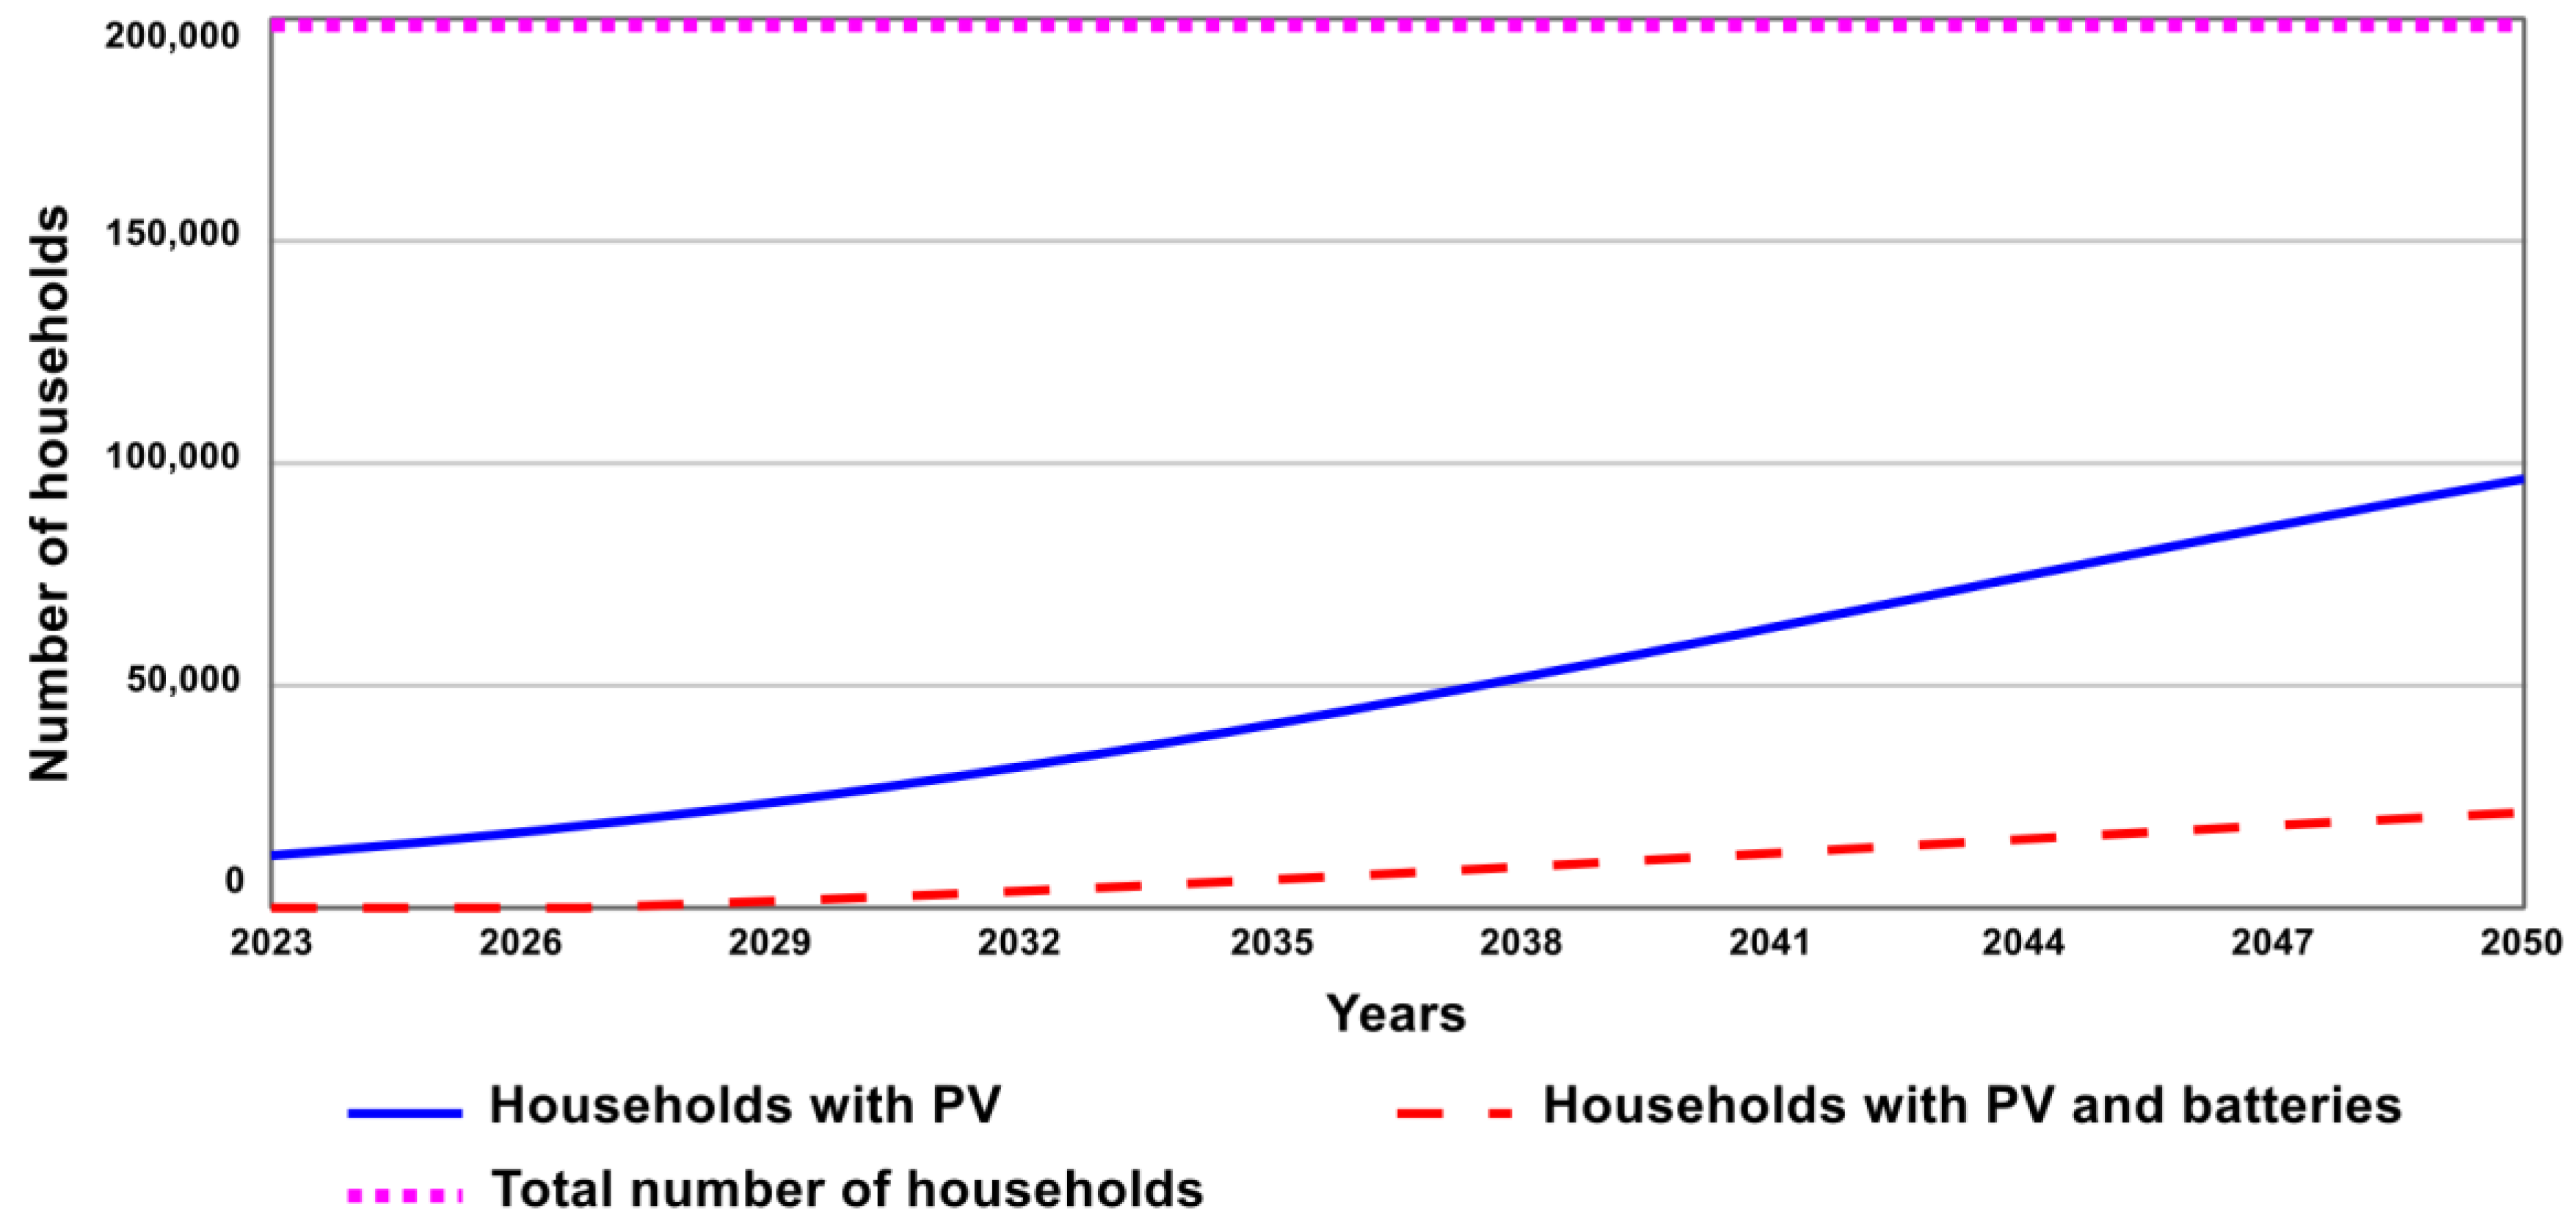
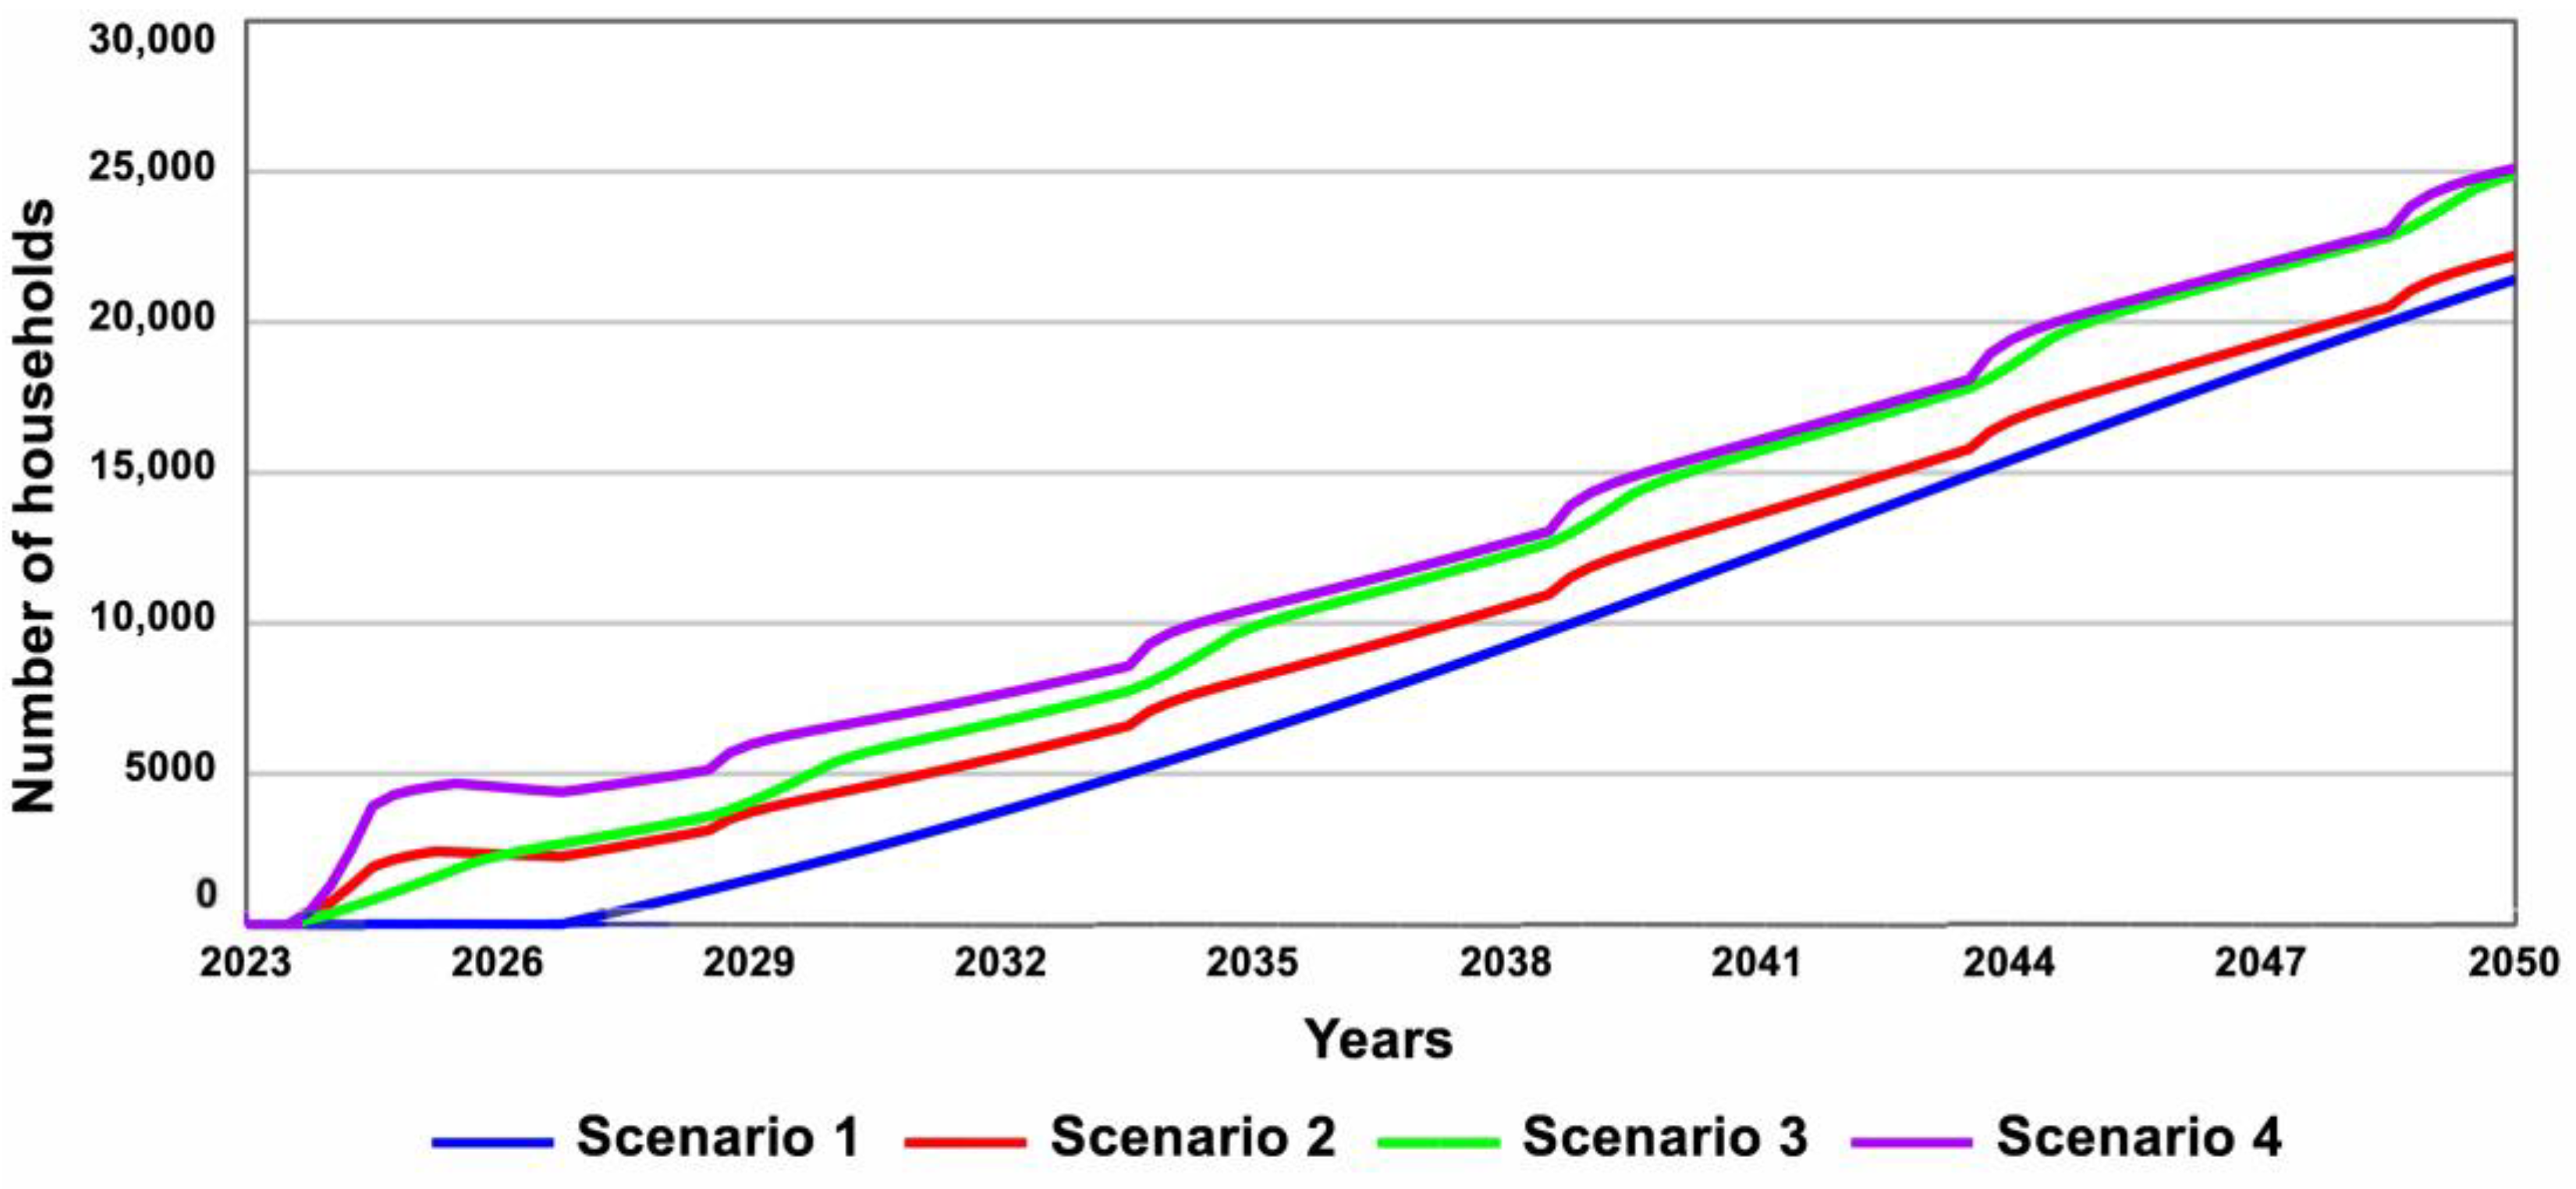
3.1. Model Results
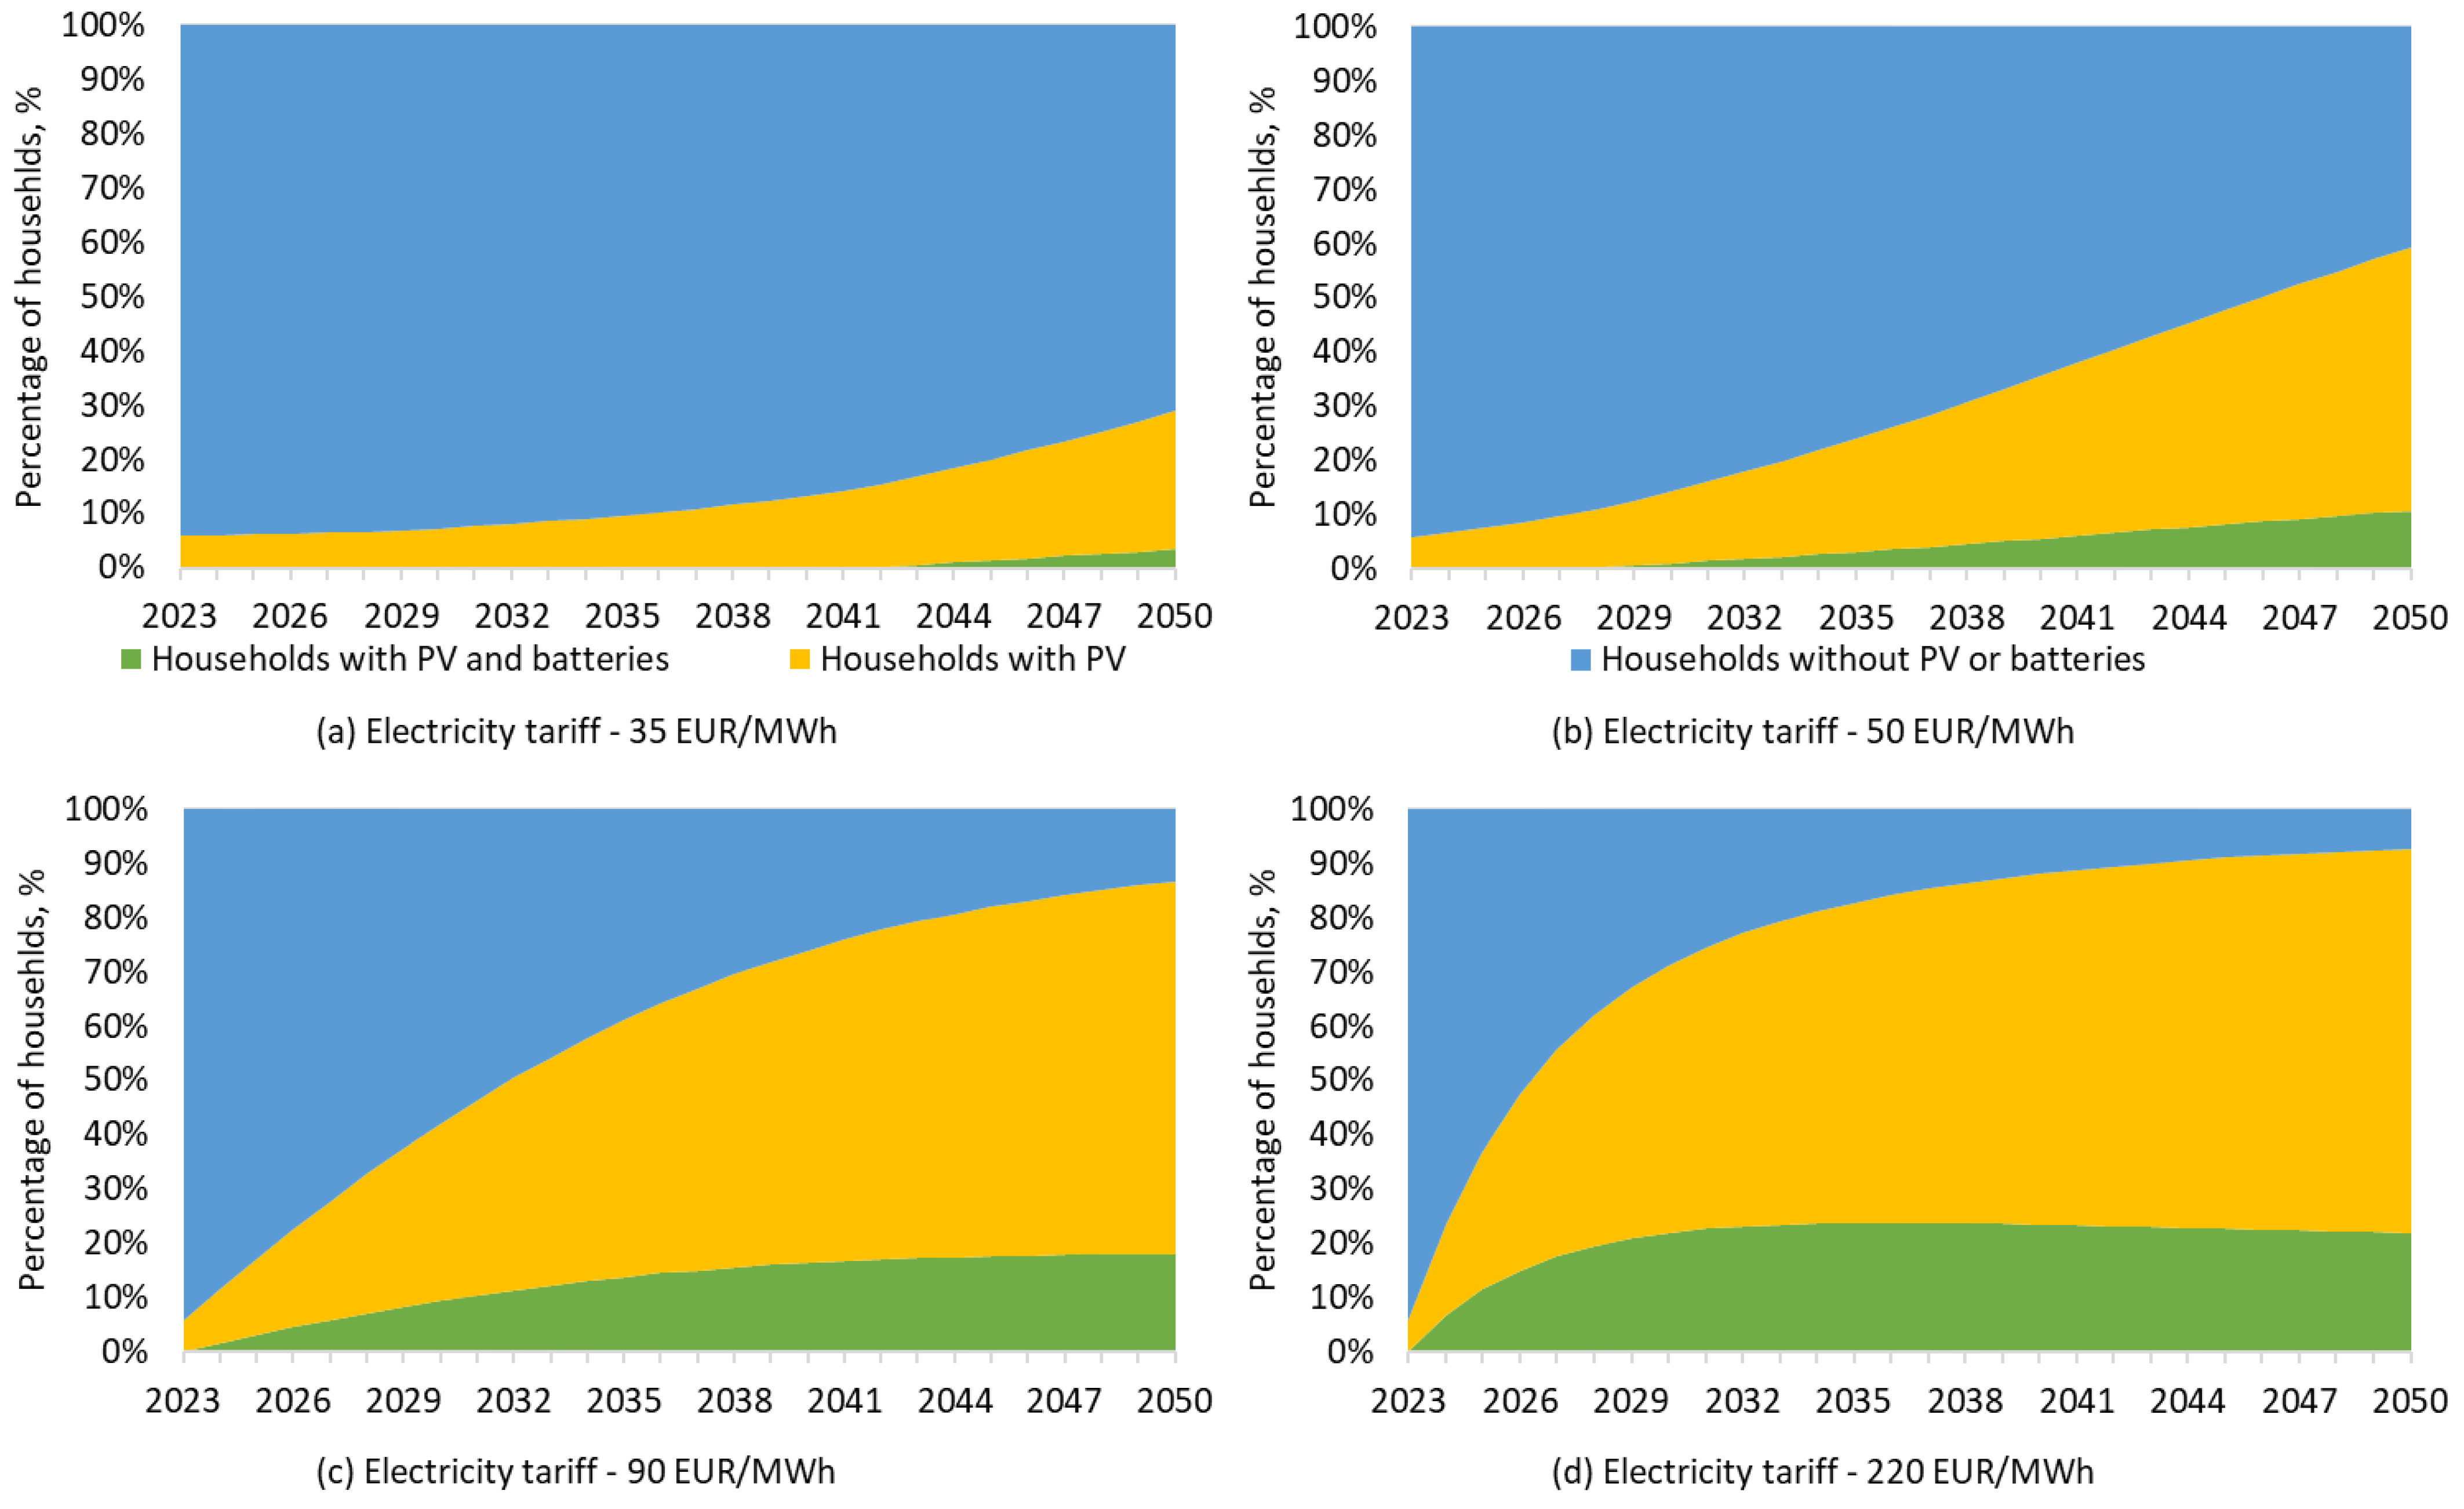
3.2. Results of Sensitivity Analysis
4. Discussion and Conclusions
Author Contributions
Funding
Data Availability Statement
Acknowledgments
Conflicts of Interest
References
- European Parliament. Directive (EU) 2018/2001 of the European Parliament and of the Council of 11 December 2018 on the Promotion of the Use of Energy from Renewable Sources (Recast). Off. J. Eur. Union 2018, 82–209. [Google Scholar]
- European Commission. Proposal for a Regulation of the European Parliament and of the Council establishing the Framework for Achieving Climate Neutrality and Amending Regulation (EU) 2018/1999 (European Climate Law). 4 March 2020; pp. 1–46. Available online: https://eur-lex.europa.eu/legal-content/EN/TXT/?uri=CELEX%3A52020PC0080 (accessed on 15 September 2023).
- European Commission. Amended Proposal for a Regulation of the European Parliament and of the Council on Establishing the Framework for Achieving Climate Neutrality and Amending Regulation (EU) 2018/1999 (European Climate Law). 17 September 2020; pp. 1–6. Available online: https://eur-lex.europa.eu/legal-content/EN/TXT/?uri=CELEX%3A52020PC0563 (accessed on 15 September 2023).
- Scarlat, N.; Prussi, M.; Padella, M. Quantification of the carbon intensity of electricity produced and used in Europe. Appl. Energy 2022, 305, 117901. [Google Scholar] [CrossRef]
- Oreski, G.; Stein, J.S.; Eder, G.C.; Berger, K.; Bruckman, L.; French, R.; Vedde, J.; Weiß, A.K. Motivation, benefits, and challenges for new photovoltaic material & module developments. Prog. Energy 2022, 4, 032003. [Google Scholar] [CrossRef]
- Gielen, D.; Boshell, F.; Saygin, D.; Bazilian, M.D.; Wagner, N.; Gorini, R. The role of renewable energy in the global energy transformation. Energy Strategy Rev. 2019, 24, 38–50. [Google Scholar] [CrossRef]
- Wang, W.; Kang, K.; Sun, G.; Xiao, L. Configuration optimization of energy storage and economic improvement for household photovoltaic system considering multiple scenarios. J. Energy Storage 2022, 67, 107631. [Google Scholar] [CrossRef]
- Elmorshedy, M.F.; Elkadeem, M.; Kotb, K.M.; Taha, I.B.; Mazzeo, D. Optimal design and energy management of an isolated fully renewable energy system integrating batteries and supercapacitors. Energy Convers. Manag. 2021, 245, 114584. [Google Scholar] [CrossRef]
- Landl, S.; Kirchsteiger, H. Mitigating Overvoltage in Power Grids with Photovoltaic Systems by Energy Storage. Environ. Clim. Technol. 2022, 26, 470–483. [Google Scholar] [CrossRef]
- Sridhar, S.; Salkuti, S.R. Development and Future Scope of Renewable Energy and Energy Storage Systems. Smart Cities 2022, 5, 668–699. [Google Scholar] [CrossRef]
- Hyvönen, J.; Santasalo-Aarnio, A.; Syri, S.; Lehtonen, M. Feasibility study of energy storage options for photovoltaic electricity generation in detached houses in Nordic climates. J. Energy Storage 2022, 54, 105330. [Google Scholar] [CrossRef]
- Montoya-Duque, L.; Arango-Aramburo, S.; Arias-Gaviria, J. Simulating the effect of the Pay-as-you-go scheme for solar energy diffusion in Colombian off-grid regions. Energy 2022, 244, 123197. [Google Scholar] [CrossRef]
- Matera, N.; Mazzeo, D.; Baglivo, C.; Congedo, P.M. Energy Independence of a Small Office Community Powered by Photovoltaic-Wind Hybrid Systems in Widely Different Climates. Energies 2023, 16, 3974. [Google Scholar] [CrossRef]
- Ortega, A.; Milano, F. Generalized Model of VSC-Based Energy Storage Systems for Transient Stability Analysis. IEEE Trans. Power Syst. 2016, 31, 3369–3380. [Google Scholar] [CrossRef]
- Mazzeo, D.; Herdem, M.S.; Matera, N.; Bonini, M.; Wen, J.Z.; Nathwani, J.; Oliveti, G. Artificial intelligence application for the performance prediction of a clean energy community. Energy 2021, 232, 120999. [Google Scholar] [CrossRef]
- Cirone, D.; Bruno, R.; Bevilacqua, P.; Perrella, S.; Arcuri, N. Techno-Economic Analysis of an Energy Community Based on PV and Electric Storage Systems in a Small Mountain Locality of South Italy: A Case Study. Sustainability 2022, 14, 13877. [Google Scholar] [CrossRef]
- Monroe, J.G.; Hansen, P.; Sorell, M.; Berglund, E.Z. Agent-Based Model of a Blockchain Enabled Peer-to-Peer Energy Market: Application for a Neighborhood Trial in Perth, Australia. Smart Cities 2020, 3, 1072–1099. [Google Scholar] [CrossRef]
- Mazzeo, D.; Matera, N.; De Luca, P.; Baglivo, C.; Congedo, P.M.; Oliveti, G. A literature review and statistical analysis of photovoltaic-wind hybrid renewable system research by considering the most relevant 550 articles: An upgradable matrix literature database. J. Clean. Prod. 2021, 295, 126070. [Google Scholar] [CrossRef]
- Mascherbauer, P.; Kranzl, L.; Yu, S.; Haupt, T. Investigating the impact of smart energy management system on the residential electricity consumption in Austria. Energy 2022, 249, 123665. [Google Scholar] [CrossRef]
- Miletić, M.; Gržanić, M.; Pavić, I.; Pandžić, H.; Capuder, T. The effects of household automation and dynamic electricity pricing on consumers and suppliers. Sustain. Energy Grids Netw. 2022, 32, 100931. [Google Scholar] [CrossRef]
- Bakić, V.; Pezo, M.; Stevanović, Ž.; Živković, M.; Grubor, B. Dynamical simulation of PV/Wind hybrid energy conversion system. Energy 2012, 45, 324–328. [Google Scholar] [CrossRef]
- Barisa, A.; Kirsanovs, V.; Safronova, A. Future transport policy designs for biomethane promotion: A system Dynamics model. J. Environ. Manag. 2020, 269, 110842. [Google Scholar] [CrossRef]
- Kubli, M.; Ulli-Beer, S. Decentralisation dynamics in energy systems: A generic simulation of network effects. Energy Res. Soc. Sci. 2016, 13, 71–83. [Google Scholar] [CrossRef]
- Valdmanis, G.; Rieksta, M.; Luksta, I.; Bazbauers, G. Solar Energy Based Charging for Electric Vehicles at Fuel Stations. Environ. Clim. Technol. 2022, 26, 1169–1181. [Google Scholar] [CrossRef]
- Zapata Riveros, J.; Kubli, M.; Ulli-Beer, S. Prosumer communities as strategic allies for electric utilities: Exploring future decentralization trends in Switzerland. Energy Res. Soc. Sci. 2019, 57, 101219. [Google Scholar] [CrossRef]
- Jimenez, M.; Franco, C.J.; Dyner, I. Diffusion of renewable energy technologies: The need for policy in Colombia. Energy 2016, 111, 818–829. [Google Scholar] [CrossRef]
- Castaneda, M.; Franco, C.J.; Dyner, I. Evaluating the effect of technology transformation on the electricity utility industry. Renew. Sustain. Energy Rev. 2017, 80, 341–351. [Google Scholar] [CrossRef]
- Castaneda, M.; Zapata, S.; Cherni, J.; Aristizabal, A.J.; Dyner, I. The long-term effects of cautious feed-in tariff reductions on photovoltaic generation in the UK residential sector. Renew. Energy 2020, 155, 1432–1443. [Google Scholar] [CrossRef]
- Aslani, A.; Helo, P.; Naaranoja, M. Role of renewable energy policies in energy dependency in Finland: System dynamics approach. Appl. Energy 2014, 113, 758–765. [Google Scholar] [CrossRef]
- Currie, D.J.; Smith, C.; Jagals, P. The application of system dynamics modelling to environmental health decision-making and policy—A scoping review. BMC Public Health 2018, 18, 1–11. [Google Scholar] [CrossRef]
- Qudrat-Ullah, H. Modelling and Simulation in Service of Energy Policy. Energy Procedia 2015, 75, 2819–2825. [Google Scholar] [CrossRef]
- Bolwig, S.; Bazbauers, G.; Klitkou, A.; Lund, P.D.; Blumberga, A.; Gravelsins, A.; Blumberga, D. Review of modelling energy transitions pathways with application to energy system flexibility. Renew. Sustain. Energy Rev. 2018, 101, 440–452. [Google Scholar] [CrossRef]
- Sterman, J. Business Dynamics: Systems Thinking and Modeling for a Complex World; Irwin/McGraw-Hill: Irvine, CA, USA, 2000. [Google Scholar]
- Ziemele, J.; Gravelsins, A.; Blumberga, A.; Vigants, G.; Blumberga, D. System dynamics model analysis of pathway to 4th generation district heating in Latvia. Energy 2016, 110, 85–94. [Google Scholar] [CrossRef]
- Atvare, E.; Gravelsins, A.; Kudurs, E.; Rozakis, S.; Blumberga, D. When household becomes environmentally friendly—Dynamic simulation of hybrid energy system’s feasibility. Environments 2023, 10, 164. [Google Scholar] [CrossRef]
- Comparison of Support Programs for Citizens. Available online: https://ekii.lv/index.php?page=programmu-salidzinajums (accessed on 23 August 2023). (In Latvian).
- The Danish Energy Agency. Catalogues of Technology Data by Danish Energy Agency. Available online: https://ens.dk/en/our-services/projections-and-models/technology-data (accessed on 15 September 2023).
- Ramasamy, V.; Feldman, D.; Desai, J.; Margolis, R.U.S. Solar Photovoltaic System and Energy Storage Cost Benchmarks: Q1 2021. 2021. Available online: www.nrel.gov/publications (accessed on 15 September 2023).
- Distribution System Operator. Electrical Supply Review. 2023. Available online: https://sadalestikls.lv/lv/elektroapgades-apskats (accessed on 23 August 2023).
- Mulleriyawage, U.G.K.; Shen, W.X. Optimally sizing of battery energy storage capacity by operational optimization of residential PV-Battery systems: An Australian household case study. Renew. Energy 2020, 160, 852–864. [Google Scholar] [CrossRef]
- Central Statistics Bureau.Traditional Dwellings and the Persons Living in Them by Building Type and Time of Construction in Regions, Republican Cities, Counties and Neighborhoods 2011–2021. Available online: https://data.stat.gov.lv/pxweb/en/OSP_PUB/START__POP__MA__MAS/MAS070/ (accessed on 15 September 2023). (In Latvian)
- NordPool Market Data. Available online: https://www.nordpoolgroup.com/ (accessed on 23 August 2023).
- Forrester, J.W.; Senge, P.M. Tests for building confidence in system dynamics models. TIMS Stud. Manag. Sci. 1980, 14, 209–228. [Google Scholar]
- Barlas, Y.; Erdem, A. Output Behavior Validation in System Dynamics Simulation. In Proceedings of the European Simulation Symposium, Istanbul, Turkey, 9–12 October 1994; Volume 1, pp. 1–4. [Google Scholar]
- Green Energy Markets. Final 2021 Projections for Distributed Energy Resources—Solar Pv and Stationary Energy Battery Systems; Report for AEMO; Green Energy Markets Pty Ltd.: Hawthorn, Australia, 2021; pp. 1–93. [Google Scholar]


| Parameter | Value | Unit | Reference |
|---|---|---|---|
| PV investment cost (with installation) | 1100 | EUR/kW | [37] |
| Inverter investment cost | 100 | EUR/kW | [37] |
| Battery investment cost | 800 | EUR/kWh | [38] |
| Average installed household PV capacity | 8 | kW | [39] |
| Average installed household battery capacity | 5 | kWh | [40] |
| Average PV technical lifetime | 35 | years | [37] |
| Average battery technical lifetime | 20 | years | [37] |
| Number of one-family households | 198,541 | number | [41] |
| Number of households with PV | 11,764 | number | [39] |
| 2013 | 2014 | 2015 | 2016 | 2017 | 2018 | 2019 | 2020 | 2021 | 2022 | |
|---|---|---|---|---|---|---|---|---|---|---|
| Average electricity price | 48.40 | 50.12 | 41.85 | 36.10 | 34.68 | 49.90 | 46.28 | 34.07 | 88.77 | 226.92 |
| Technology Receiving the Subsidies | ||||
|---|---|---|---|---|
| Scenario | PV | Batteries | Financing, MEUR | Support Intensity, % |
| Scenario 1 | 0 | 0 | ||
| Scenario 2 | X | 20 | 50 | |
| Scenario 3 | X | 20 | 50 | |
| Scenario 4 | X | X | 2 × 20 | 50 |
| Parameter | Unit of Measurement | Lowest Value | Highest Value |
|---|---|---|---|
| Electricity tariff | EUR/MWh | 30 | 150 |
| Technical lifetime of battery | Years | 10 | 30 |
| Initial investment of battery | EUR/kWh | 600 | 1000 |
| Battery investment decrease fraction | %/year | 0.5 | 3 |
Disclaimer/Publisher’s Note: The statements, opinions and data contained in all publications are solely those of the individual author(s) and contributor(s) and not of MDPI and/or the editor(s). MDPI and/or the editor(s) disclaim responsibility for any injury to people or property resulting from any ideas, methods, instructions or products referred to in the content. |
© 2023 by the authors. Licensee MDPI, Basel, Switzerland. This article is an open access article distributed under the terms and conditions of the Creative Commons Attribution (CC BY) license (https://creativecommons.org/licenses/by/4.0/).
Share and Cite
Gravelsins, A.; Atvare, E.; Kudurs, E.; Kubule, A.; Blumberga, D. System Dynamics Model of Decentralized Household Electricity Storage Implementation: Case Study of Latvia. Smart Cities 2023, 6, 2553-2573. https://doi.org/10.3390/smartcities6050115
Gravelsins A, Atvare E, Kudurs E, Kubule A, Blumberga D. System Dynamics Model of Decentralized Household Electricity Storage Implementation: Case Study of Latvia. Smart Cities. 2023; 6(5):2553-2573. https://doi.org/10.3390/smartcities6050115
Chicago/Turabian StyleGravelsins, Armands, Erlanda Atvare, Edgars Kudurs, Anna Kubule, and Dagnija Blumberga. 2023. "System Dynamics Model of Decentralized Household Electricity Storage Implementation: Case Study of Latvia" Smart Cities 6, no. 5: 2553-2573. https://doi.org/10.3390/smartcities6050115
APA StyleGravelsins, A., Atvare, E., Kudurs, E., Kubule, A., & Blumberga, D. (2023). System Dynamics Model of Decentralized Household Electricity Storage Implementation: Case Study of Latvia. Smart Cities, 6(5), 2553-2573. https://doi.org/10.3390/smartcities6050115